Microclimate of Urban Canopy Layer and Outdoor Thermal Comfort: A Case Study in Pavlou Mela, Thessaloniki


Department of Planning, Design and Technology of Architecture, La Sapienza University, 00196 Rome, Italy
*
Author to whom correspondence should be addressed.
Urban Sci. 2019, 3(3), 84; https://0-doi-org.brum.beds.ac.uk/10.3390/urbansci3030084
Submission received: 21 May 2019
/
Revised: 22 July 2019
/
Accepted: 26 July 2019
/
Published: 30 July 2019
Abstract
:The present study is based on the assumption that the urban heat island (UHI) mitigation appears compelling and urgent in dense cities. To the above thematic area, recent redevelopmental interventions of open space for the microclimatic improvement and thermal comfort have been made through national and international programs at neighborhood scale (local area). One of these recovery processes is the case study of Pavlou Mela in the Greek context, which in the present discussion, focuses on the microspecific investigation through quantitative analysis of the eleven points distributed in the area of the intervention, extrapolating comparative considerations of different configurative factors post-operam. The results of this analysis tend: (i) To identify the degree of accuracy of the two most applied software packages in the scientific community (ENVImet Pro and Rayman Pro) through microclimatic parameters, namely air temperature (Ta) and surface temperature (Ts) comparing them with in-situ measurements; (ii) to evaluate the thermal sensation of man correlated with the mean radiant temperature (Tmrt) by verifying the actual improvement of thermal comfort outdoor with the index, physiologically equivalent temperature (PET).
1. Introduction
In light of the current global environmental and climate issues [1] which today represent topics of broad international debate [2], it is necessary to make changes to both the local and global level. In this framework, the attention of the European community [3] is directed towards mitigation strategies, with particular attention to the phenomenon of the urban heat island [4] with the aim of developing sustainable and increasingly resilient cities [5]. In this regard, the phenomenon of the urban heat island (UHI), which is so far the most documented among the climatic phenomena related to the urban environment, instigates a strong impact on the quality of life in the city. This is particularly felt in the Mediterranean area which is primarily characterized by dense cities (historical-consolidated), a fact which leads to a broader consideration of the value of public space. This aligns with the observation of the population growth which keeps urging the majority of the world’s population to reside within the city [6,7].
The effects of the UHI can be classified into two main categories: The effects on people and the effects on the microclimate [8]. In particular, an example of the former effect is the deterioration of physical well-being within a city, witnessed by damage to the thermoregulatory system induced by heat stress and manifested in the form of cardiovascular problems, for example, heat stroke, etc. [9,10]. These are the basis of harmful effects to city dwellers who in order to counter balance the physical discomfort have adopted indoor practices, such as the use of air conditioners, which in turn exacerbate the outdoor microclimatic conditions [11,12]. On the other hand, high air temperatures have a negative effect on the urban microclimate compared to the rural microclimate [13]. This is caused through the formation of ozone particles at the ground level, the alteration of the local microclimate and macroclimate, such as the modification of trends in winds, changes in humidity, the increase in precipitation and flooding, changes in local ecosystems and finally, the increase in global warming due to the increasing demand for cooling energy [14].
In this regard, the present discussion tends to emphasize the importance of changing perspectives due to the increasing awareness of the approach between urban design and urban climatology, incorporating multiple disciplines (urban design, environmental technical physics, psychology environmental, climatology and technological design). All these areas cooperate through metabolic processes that move in quantitative logic from top to bottom and at the local scale of the neighborhood. The perception that the open space is seen as a reservoir characterized by surfaces, materials and elements that dynamically participate not only as visual and tactile artifacts, and no longer as delimiters and space configuration, but also as elements that exchange energy and participate in the energy balance of the city [15,16,17] and of the individual.
Towards this view of immediate integration between environmental performance and spatial configuration, recent interventions have been made within the framework of a Greek national level plan for urban areas redevelopment known as ‘The Bioclimatic Improvement Program for Public Open Space’ [18]. These interventions demonstrate the renewed interest on the part of the public administration that puts into evidence the interconnection between morphology, microclimates, thermal comfort and urban elements, starting in different climatic zones and reaching the specific objectives (ob.s) on the basis of the synthetically compared numerical analysis with excellent results [19,20].
One example of these current interventions is the chosen case study, which is particularly interesting because the predetermined ob.s are relatively high in the surveys focused on the numerical comparison of the main factors that characterize the microclimate and urban thermo-hygrometric comfort. For example, the average maximum temperature of the air (Ta), the average maximum surface temperature (Ts), the sum of the basic hour degrees per day 26 °C associated with the average air temperature (CDH), and finally the predicted mean vote (PMV) index via simulation results of ENVImet 3.5 before (ante-operam) and after the intervention (post-operam). Following the analysis, a considerable reduction in the parameters is evident (Table 1) except for the PMV (1) comfort index which is less efficient than the program requests, expressed as a percentage (%). In particular, this value records a delta reduction of −37.4% (ΔOperam), which corresponds to a situation of slight heat equal to +1.5 compared to +2.4 in the initial state of higher heat. However, it is necessary to state that PMV is calibrated for internal conditions in buildings equipped with heating, ventilation, and air conditioning (HVAC) systems [21,22].
On the basis of this consideration, the actual improvement in outdoor thermal comfort (2) will be verified later on, through the physiologically equivalent temperature (PET) index [23,24,25]. This index is based on a consolidated scientific literature of research, experimentation and verification for the degree of the approximate thermal human comfort characterized by the degree of detail and flexibility due to the proximity of defining parameters of metabolic rate and clothing insulation within the software used (BioMet, ENVImet Pro v. 4.1), and finally for the numerical choice in °C for easy consultation and understanding [26,27].
2. Case Study
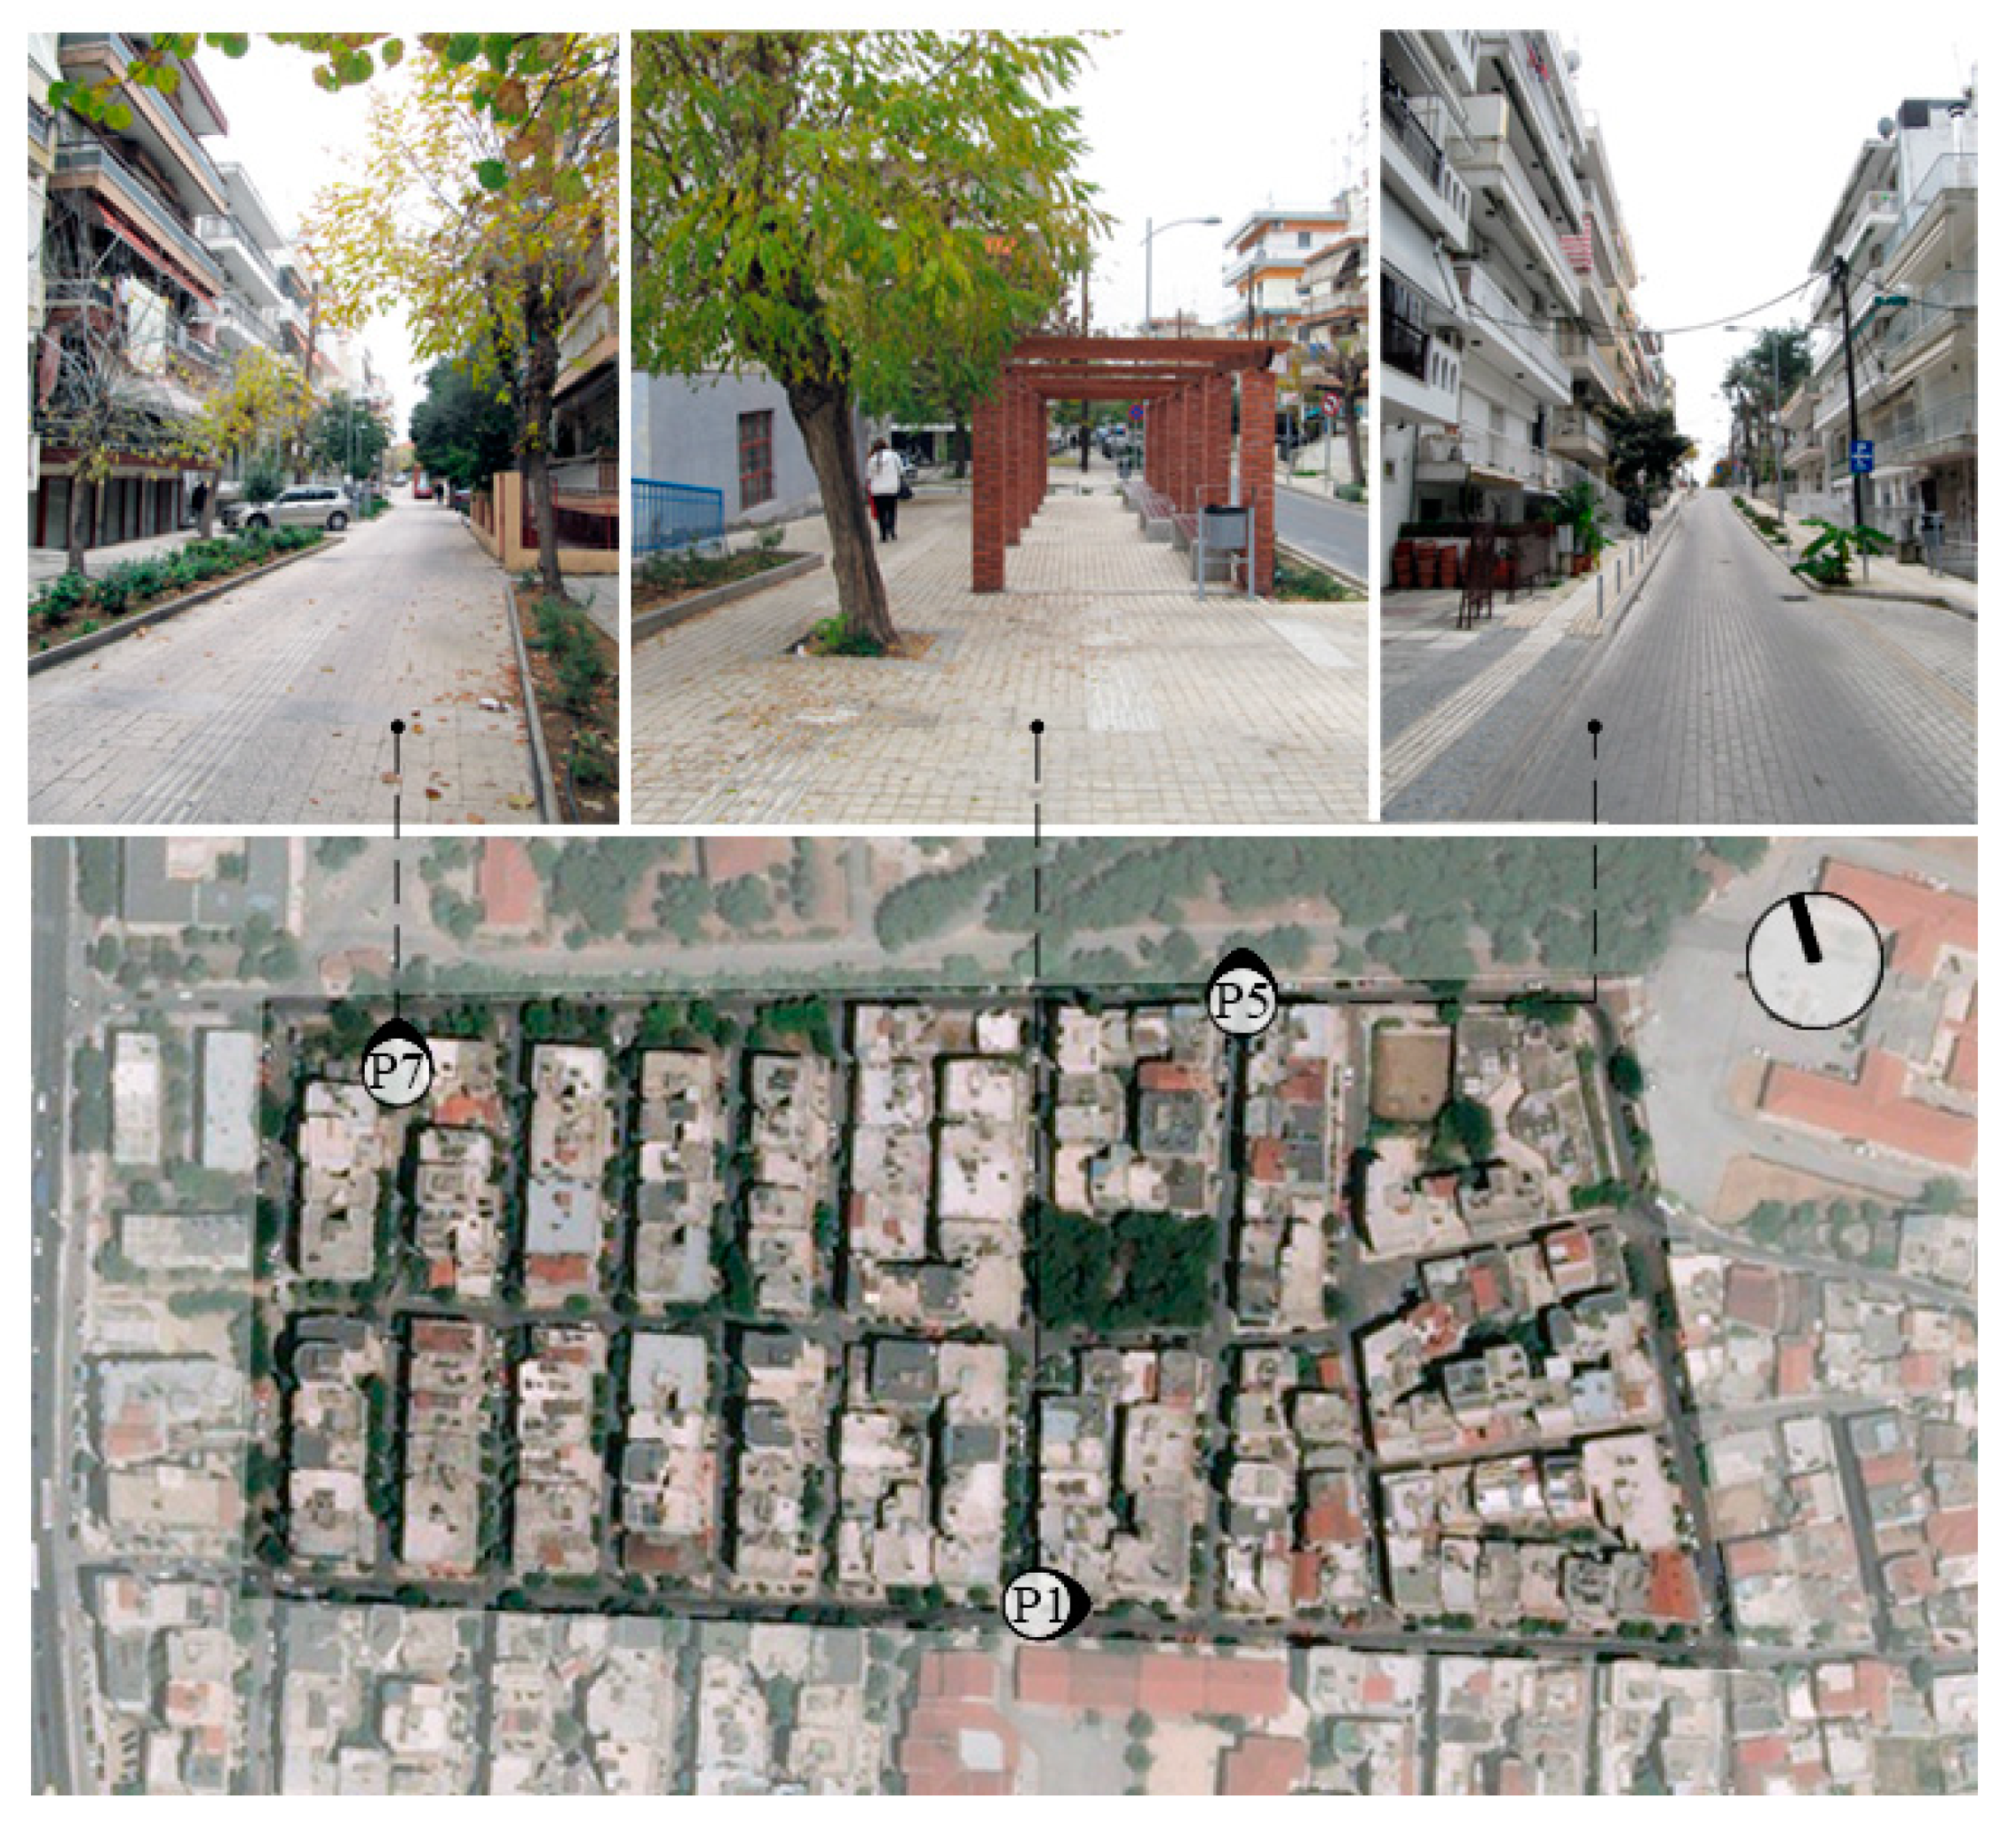
The Pavlou Mela municipality is located on the western side (climatic zone III) of Thessaloniki’s residential complex (longitude 22°56′17″, latitude 40°39′53″), at an altitude of 57 m. The bioclimatic urban redevelopment concerning the Neoktista neighborhood in Figure 1 is characterized by a dense, high construction urban form (12–18 m) of 3.200 inhabitants. The entire district was built in the 1970s and 1980s as an expansion of a residential nucleus that existed since 1912 for the reception of refugees. The area of the intervention (60.000 m2) is located between two green areas bordering to the North with the psychiatric hospital and to the South with a former military camp. It was selected because of some critical issues related to socio-economic discomfort, the intense accessibility of the local citizens and the high variation of climatic data mainly during the summer.
2.1. Main Strategies of Microclimatic Mitigation and Thermal Comfort
The project aimed to enhance pedestrian usage, through the expansion of sidewalks by utilizing a new paving design and the reorganization of traffic. Moreover, the quality of vegetation (with linear distribution) increased compared to the existing one according to the biodiversity of the soil. This constitutes a live system that favors shading the thermal state especially in the areas mostly exposed to the sun intercepting the radiation in summer.
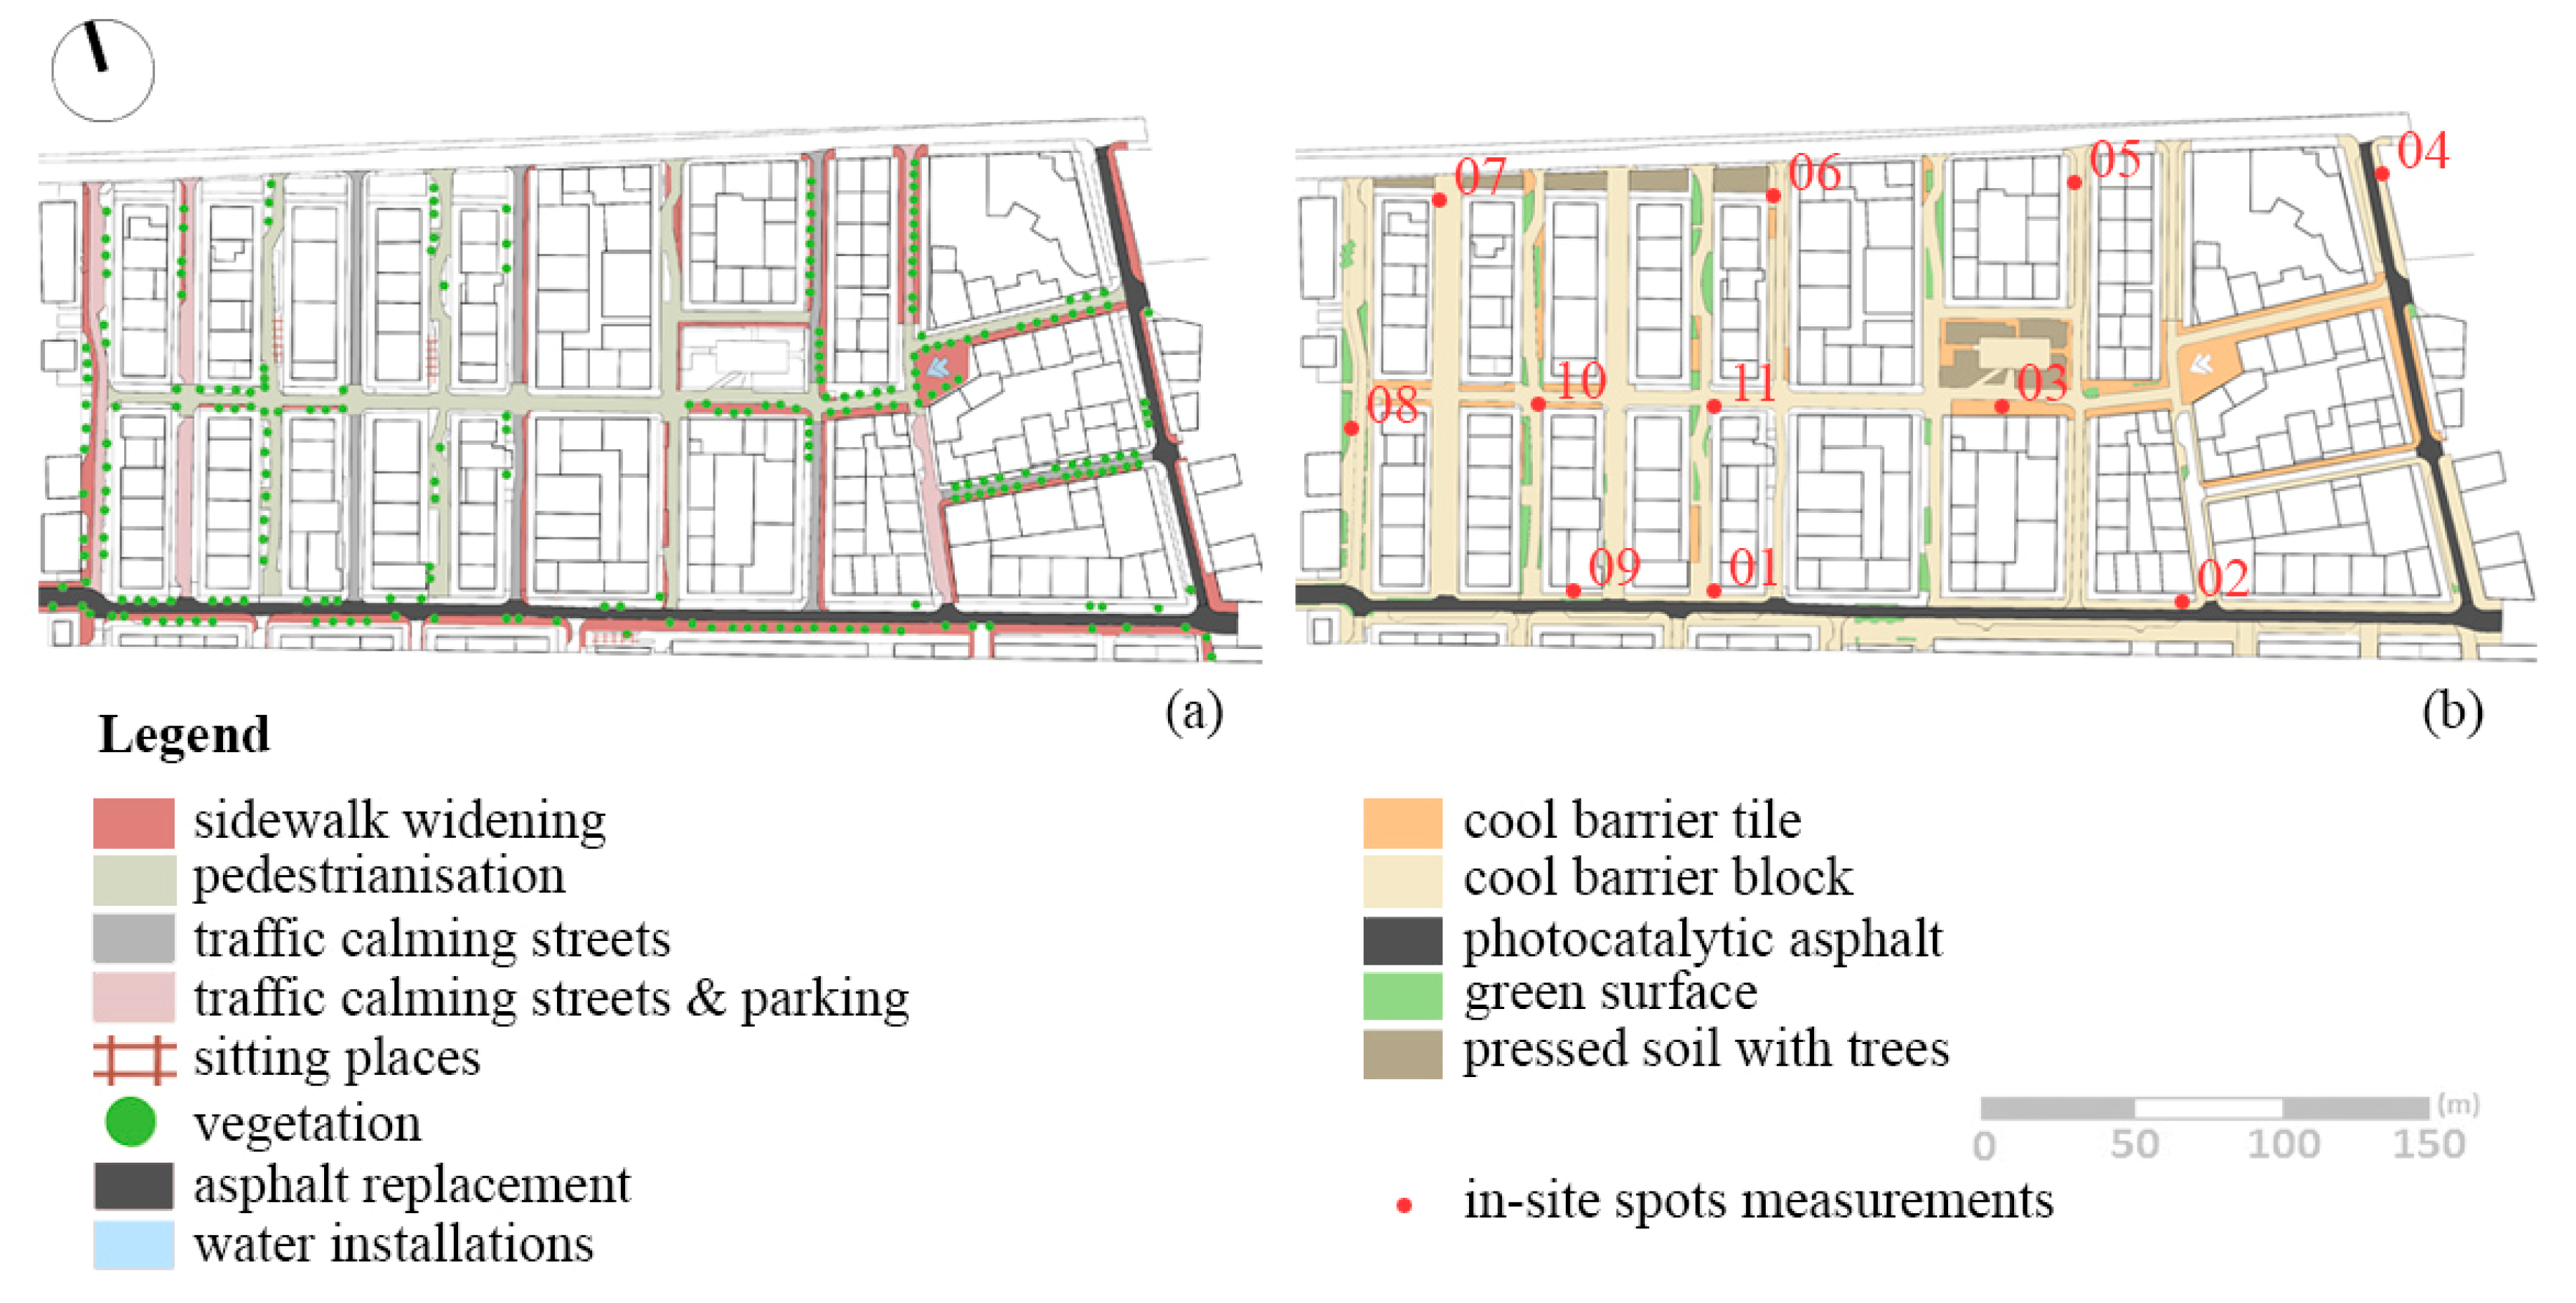
The above system is integrated with the artificial one, represented by pergolas that define and protect the sitting places inside the district as appropriate. The water element of the fountain offers an important thermal mass and contributes greatly to the improvement of comfort conditions, both from a strictly physical and psychological point of view. Finally, the flooring presents the use of cool materials used on the road-sidewalks and the photocatalytic replacement of the main road for lowering the surface temperature and heat exchanges with the air following an in-depth analysis of the main strategies [28] in Figure 2:
2.1.1. Cool Pavement Materials
Cool pavements (c.p) refers to the optical thermal characteristics, i.e., the albedo (α) and the emissivity (ε) (3) of the materials. The aforementioned elements make the pavements and their physical properties, such as their low permeability index, suitable for conventional materials used for urban paving. Mainly cement and asphalt tend to absorb large amounts of solar radiation during the day. To re-launch this radiation in the form of heat accumulated in the surrounding environment, the known phenomenon is determined to the heat urban island of the night. Moreover, their poor water permeability reduces the evapotranspiration potential of the soil surface which potentially contributes to the reduction of environmental temperatures. In addition, it is possible to benefit from additional related factors, such as the improvement of thermal comfort conditions during the summer. Finally, there are several studies [29] on thermal performance and energy impacts with regard to the applications of c.p. Among the most interesting are Marousi and Flisvos [30,31] of the cities of Athens with positive results. The most used techniques for cool asphalt consist of light and white aggregates, such as gravel and pigments in the asphalt mixture, while for covering (roads and trampling) materials with special high reflection pigments, near infrared (light colors) that are not very wrinkled, porous and permeable can be considered. Regarding the application in the case study, the c.p used are detailed in Table 2.
2.1.2. Urban Green
Vegetation planning within urban areas plays a pivotal role as a regulator of urban climate. Several studies [32] have established a correlation between an increase in green areas and a reduction in local temperature. This is an effective measure to maximize cooling in the summer and act as a shield in winter. In general, it can be said that the greatest influence of vegetation on the microclimate and on the outdoor comfort is attributed to the shading factors related to the geometric characteristics of the plant (height, tree crown, density, width, tree crown, etc.) which contribute to the cooling of the surface temperature, and through evaporation, it modifies the humidity of the air [33,34].
Moreover, it should be noted that vegetation unlike other materials with the same albedo uses a large part of solar radiation for evapotranspiration keeping the surface temperature low, and consequently vegetation behaves as if it was a clear material with regard to the surface temperature. However, it has the advantages of dark materials to reflect little radiation towards urban areas.
It should be emphasized that in addition to its actions modifying the air temperature (due to the process of evaporation and shading), the solar radiation (especially in the high temperature hours of the day) and the wind speed, are important as they improve the air quality and mask noise. Regarding the project, the increase in vegetation consists of a minimum percentage of 1.59% of the whole area.
2.1.3. Water Surface
The impact of the water surface on the microclimate [35] is based on the fact that the temperature and humidity of the air are influenced by evaporation. In addition, the water is characterized by high thermal capacity and low solar reflectance, which is translated into the ability to absorb most of the solar radiation by subtracting the evaporative latent air and modifying the relative humidity. In this process, the water temperature is kept stable, which means that there is no increase in the long-wave radiant component, thus contributing to the lowering of the air temperatures with positive results on the in-outdoor thermal comfort, especially during the summer. Finally, it must be stated that the performance of this passive system [36] is determined by the geometric and physical characteristics of the water. As for the intervention, the water element in the fountain concerns only the 0.06% of the whole area.
2.2. Description of the Microclimate Specifically of Urban Canyon
As the urban canyon criteria have been mentioned, they vary from point to point and create a different profile that contributes to diversifying the wellbeing of users and the specific microclimate. In this vision, the intervention experimented investigates the following synergistic factors that interact below the roofs in space and between buildings [37] in Table 3:
- (i)
- Sky view factor (SVF) (4): The first element taken into consideration represents the radiant exchange with the celestial vault, and consequently, the temperatures (Ta, Ts, etc) are linked to the urban context according to the amount of radiation present on the entire road surface. The SVF [38] of the site in question corresponds to a relatively low value on average 0.30–0.40.
- (ii)
- Orientation: Describes the direction of the canyon.
- (iii)
- Height-to-width (H/W ratio): Describes the proportion of the average building height to the width of the street. This fact is particularly important because its value affects the radiation and the modification of the direction and intensity of the winds in urban canyons. In this study, the H/W ratio is characterized by an average of 0.80–1.20; while the surface of the building façades has an albedo of 0.30 (concrete) with continuous fronts.
- (iv)
- Green-trees: Trees according to the size, type and distribution are able to intercept solar radiation (shading), and also decrease the air temperature (evapotranspiration). The present case study consists of a percentage of approximately 63% of deciduous types for an average size <12–18m with a predominantly linear distribution.
- (v)
- Innovative cool pavement materials: According to the radiant properties of the materials, the reflectance (α) and emissivity (ε) of solar radiation are shown in Table 2.
3. Methodology
3.1. In-Site Spots Measurements
Eleven spots distributed throughout the intervention area after the redevelopment were monitored. They are the most representative of determining the microclimatic conditions in a satisfying way. The registrations were made daily for three days, including 28, 29 and 30 July, 2016, with a 20 min step starting from 8:00 a.m. to 20:00 p.m. For each point, three measurement cycles were performed (morning, noon and afternoon), where the following parameters were reported: air temperature (°C), relative humidity (%), wind speed (m/s) and direction (°) were measured at 1.80 m above ground level as well as the surface temperature (°C) and the temperature of a sphere (°C).
Below, the data of 11 measured points are compared with the two meteorological stations that are fixed in the area for greater reliability, and the results are further reported as an input (Table 4) to the models of calculations. This compares the experimental and simulated results to understand the accuracy of the models for the entire area of intervention that are performed through the two software programs. In the present discussion, only the numerical analysis of the hottest day (30 July) is reported based on the climate data of the Department of Meteorology and Climatology of School Geology Aristotle University of Thessaloniki because it constitutes a significant date used in the initial and final evaluation of the intervention, so as to extrapolate the consideration of the parameters concerning the air temperature (Ta) and the surface temperature (Ts).
3.2. Microclimate and Microspecific Simulations
The study was conducted based on the following steps: (i) Modeling of the intervention; (ii) the simulation of microclimatic calculations; (iii) the analysis of the results and comparison. In particular, the post-operam analysis is detected through the parameters that influence the microclimate (Ta, Ts & Tmrt) and the thermal comfort index (PET). With regard to PET, the standard human parameters outdoors were (35-years-old male, 1.75 m tall, weight 75 kg) with a clothing insulation of 0.6 clo (corresponding to a light summer cloths) and activity (metabolism rate of 80 W) are taken into consideration.
In the specific case the ENVImet Pro software consists of the size of the model area of 230 × 113 × 20 cells, with a resolution of 2 × 2 × 2.5 m (real area of 460 × 223 × 40 m). Furthermore, 5 nesting grids were added (10 m) around the study area in order to mitigate the interactions of the boundaries with the study area. The urban environment was designed on the basis of a three-dimensional geometry (with the following trees mainly present: Acer pseudoplatanus, Citrus aurantium and Pinus pinea, etc.). Similarly, the thermophysical properties of urban materials were defined (Table 2) following the configuration of the Technical Guide 20701–2 of the Technical Chamber of Greece [39]. Finally, the simulations were performed from 6:00 a.m. at 6:00 a.m. (42 h) to stabilize the calculations that compromise the greater accuracy of the results. In addition, Tmrt & PET output have been calculated with BioMet within the software used.
Regarding the Rayman Pro, the model of the study was set on the basis of a rectangular grid of coordinates (X = 400 m, Y = 400 m), drawing the buildings and trees (estimated in approximation between: Deciduous & Coniferous tree), while the cool paving materials were only calculated based on the albedo coefficient (Table 2).
3.3. Potential and Limitations of the Software Used: ENVImet Pro & RayMan Pro
ENVImet Pro V4.1 [40] is a valid computation fluid dynamic (CFD) microclimatic calculation software, which deals with the question of the analysis of buildings, open spaces, etc. through a holistic approach able to evaluate ventilation, latent and sensitive heat exchanges, direct and indirect solar radiation, etc. It is also necessary to underline the presence of a high number of basic materials included in the database which, however, in some cases should be checked for their physical and thermal data, such as the emissivity value (ε).
Moreover, among the limitations of the software is the fact that its results have long calculation times, and another disadvantage is that it does not allow communication (through import and export) with other architectural modeling software. Finally, there is a scale limitation in the degree of detail, represented by the fact that the entire modeling space is divided into cells whose maximum resolution is 1 m × 1 m. As a result, it is difficult to simulate hybrid technologies or materials that present more solutions inside the cell itself.
Rayman Pro [41,42] is a static numerical model of bioclimatic estimation, which analyzes the space in a selective manner of the parameters (PMV, PET, UTCI, SET*, etc.) for a wide period of time. Among the main features of the software’s potential are the meteorological data to be supplied as only the basic ones are inputted. Furthermore, it supports the simulations without the amount of the model from the other software (ex: ENVImet, Fluent, etc.), and end performs quick analysis calculations.
The above limitations create concern about the approximate representation of vegetation, where the specific physiological behavior of evapotranspiration and photosynthesis is neglected. Likewise, the omission of the thermal capacity of the materials leads to overestimating the daily radiant contributions and to underestimating the nocturnal ones.
4. Results and Comparison
4.1. Comparison of the Simulated Results of the Average Ta and Ts Values with the Measurements in the Field at Each Spots
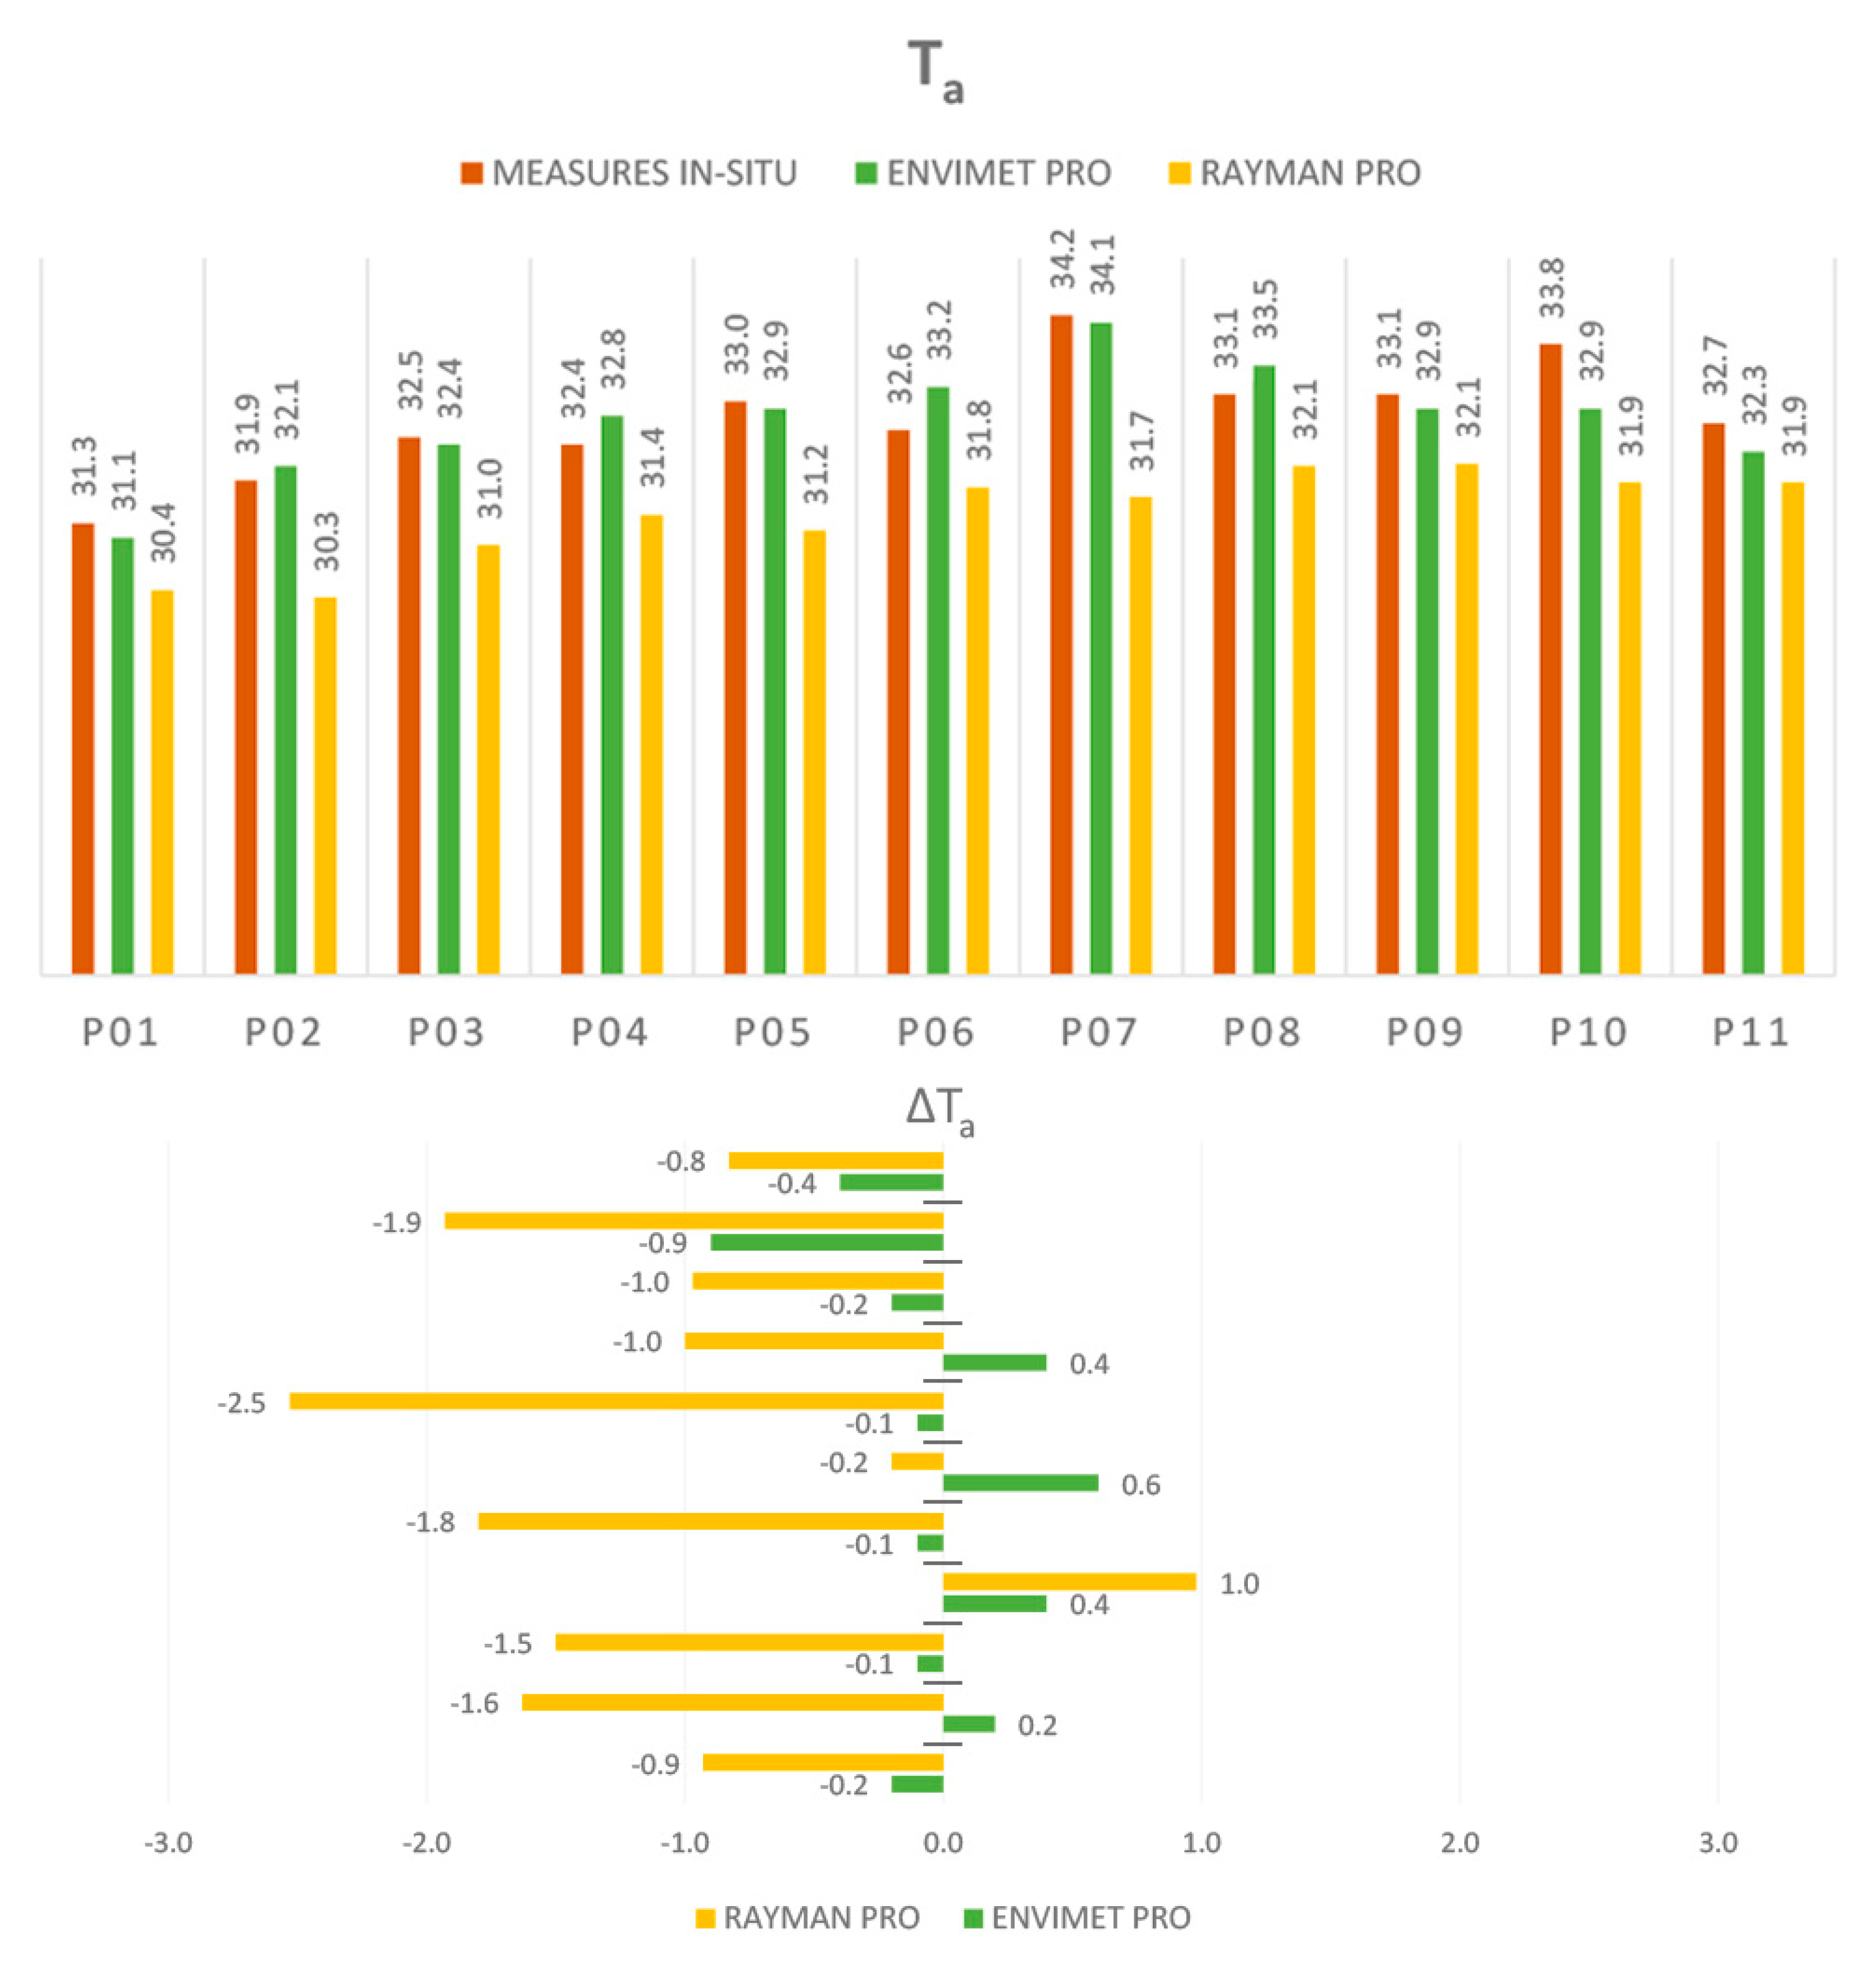
The first surveys are recorded from 08:00 a.m. to 08:00 p.m. to understand the variations of the microclimatic factors of Ta and Ts (Figure 3 and Figure 4).
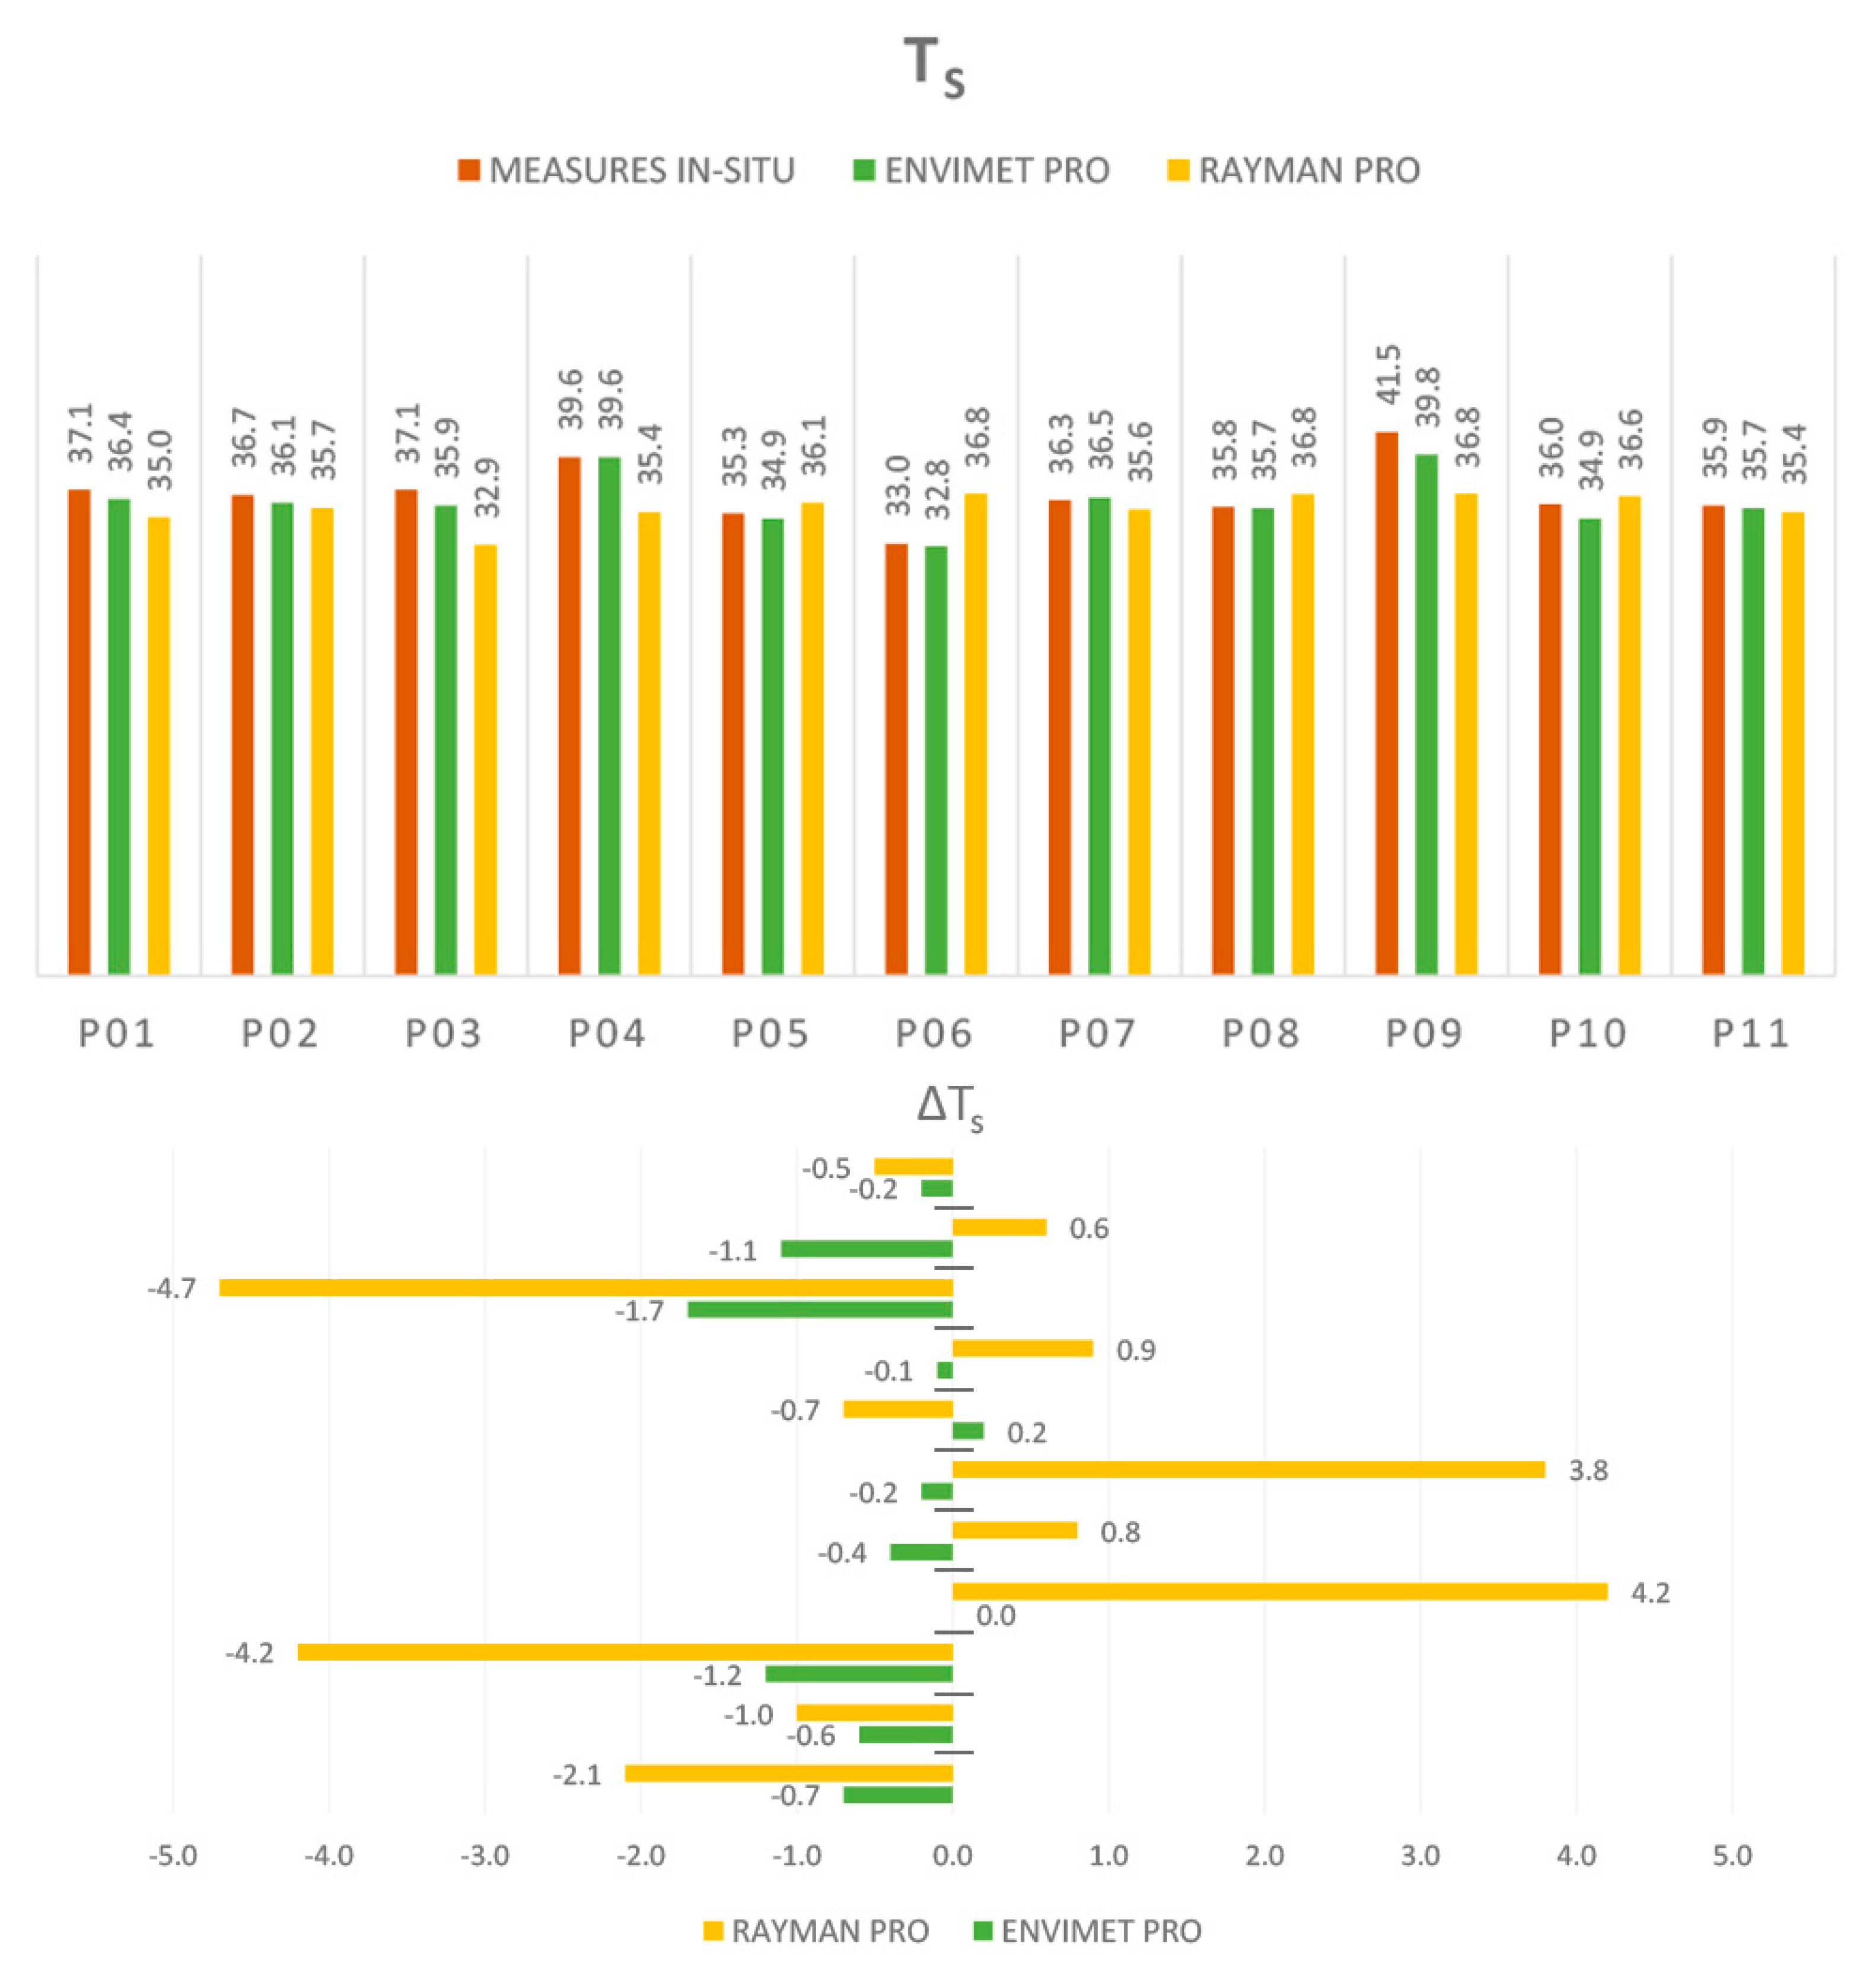
Regarding the air temperature, it is interesting to observe the trend of the field measurements that guarantee greater reliability. They oscillate in the range of 31.3 °C min (spot 01)–34.2 °C max (spot 07). The maximum values are recognizable in the North-West and South-West part. As for the Ts factor, it is concentrated between the values of 33.0 °C min (point 06)–41.5 °C max (point 09). The intermediate values of approximately 36.0 °C are traceable by 90% of the points, while the highest values are present in the points most exposed to direct solar radiation during the day, particularly in the North-East and South-West area.
Within this framework, it is possible to extract results to understand the precision of the simulation software. Subsequently, the calculations carried out by ENVImet Pro consist of the Ta values ranging between a minimum range of 31.1 °C (point 01) and a maximum of 34.1 °C (point 07), with a delta between −0.2 °C and −0.1 °C with respect the in-situ measurements. Regarding the temperature of the surfaces within the district, they recorded a range between 32.8 °C (spot 06) and 39.8 °C (spot 09) with a delta of −1.7 °C minimum and −0.2 °C maximum compared to the surveys on campus. In both cases, they follow a rather similar trend without particular differences between the direct and indirect values that is more evident for the surface temperature.
Regarding the investigations obtained from the use of Rayman Pro, they are configured lower in most cases and especially in the calculations of Ts where the most solemn differences occur with the positive deltas near the relatively high SVF. Subsequently, a trend of the values for the Ta included between 30.3 °C (point 02) of the minimum and of the 32.1 °C (point 09) of the maximum, with a delta compared to in-situ observations followed by −1.6 °C to −1.0 °C. As far as the surface temperature is concerned, a range of 32.9 °C min (spot 03) to 36.8 °C max (spots 06, 08 & 09), with a delta compliance with the measurements were carried out on the field between −4.7 °C min to −4.2 °C max.
In conclusion, in most cases, the simulations show lower values than the field measurements, due to the possible influence of external parameters that alternate and modify the in-situ measurements. Among the most frequent parameters, some may be: The characteristics and diversification of soil conditions throughout the study area such as soil moisture; the possible external effects that can be identified in a punctual way influencing the measurement instruments, e.g., for example solar radiation and vehicles; the variation of meteorological conditions during the day, for example, wind direction and speed, etc. Consequently, the data of the 11 monitoring points that were compared with the results of the simulations (ENVImet Pro and Rayman Pro) found a good agreement for the ambient and surface temperatures and the mean daily differences up to ±1.0 °C for most cases.
4.2. Verification and Evaluation of Tmrt and PET Values, Comparing the Different Points Examined
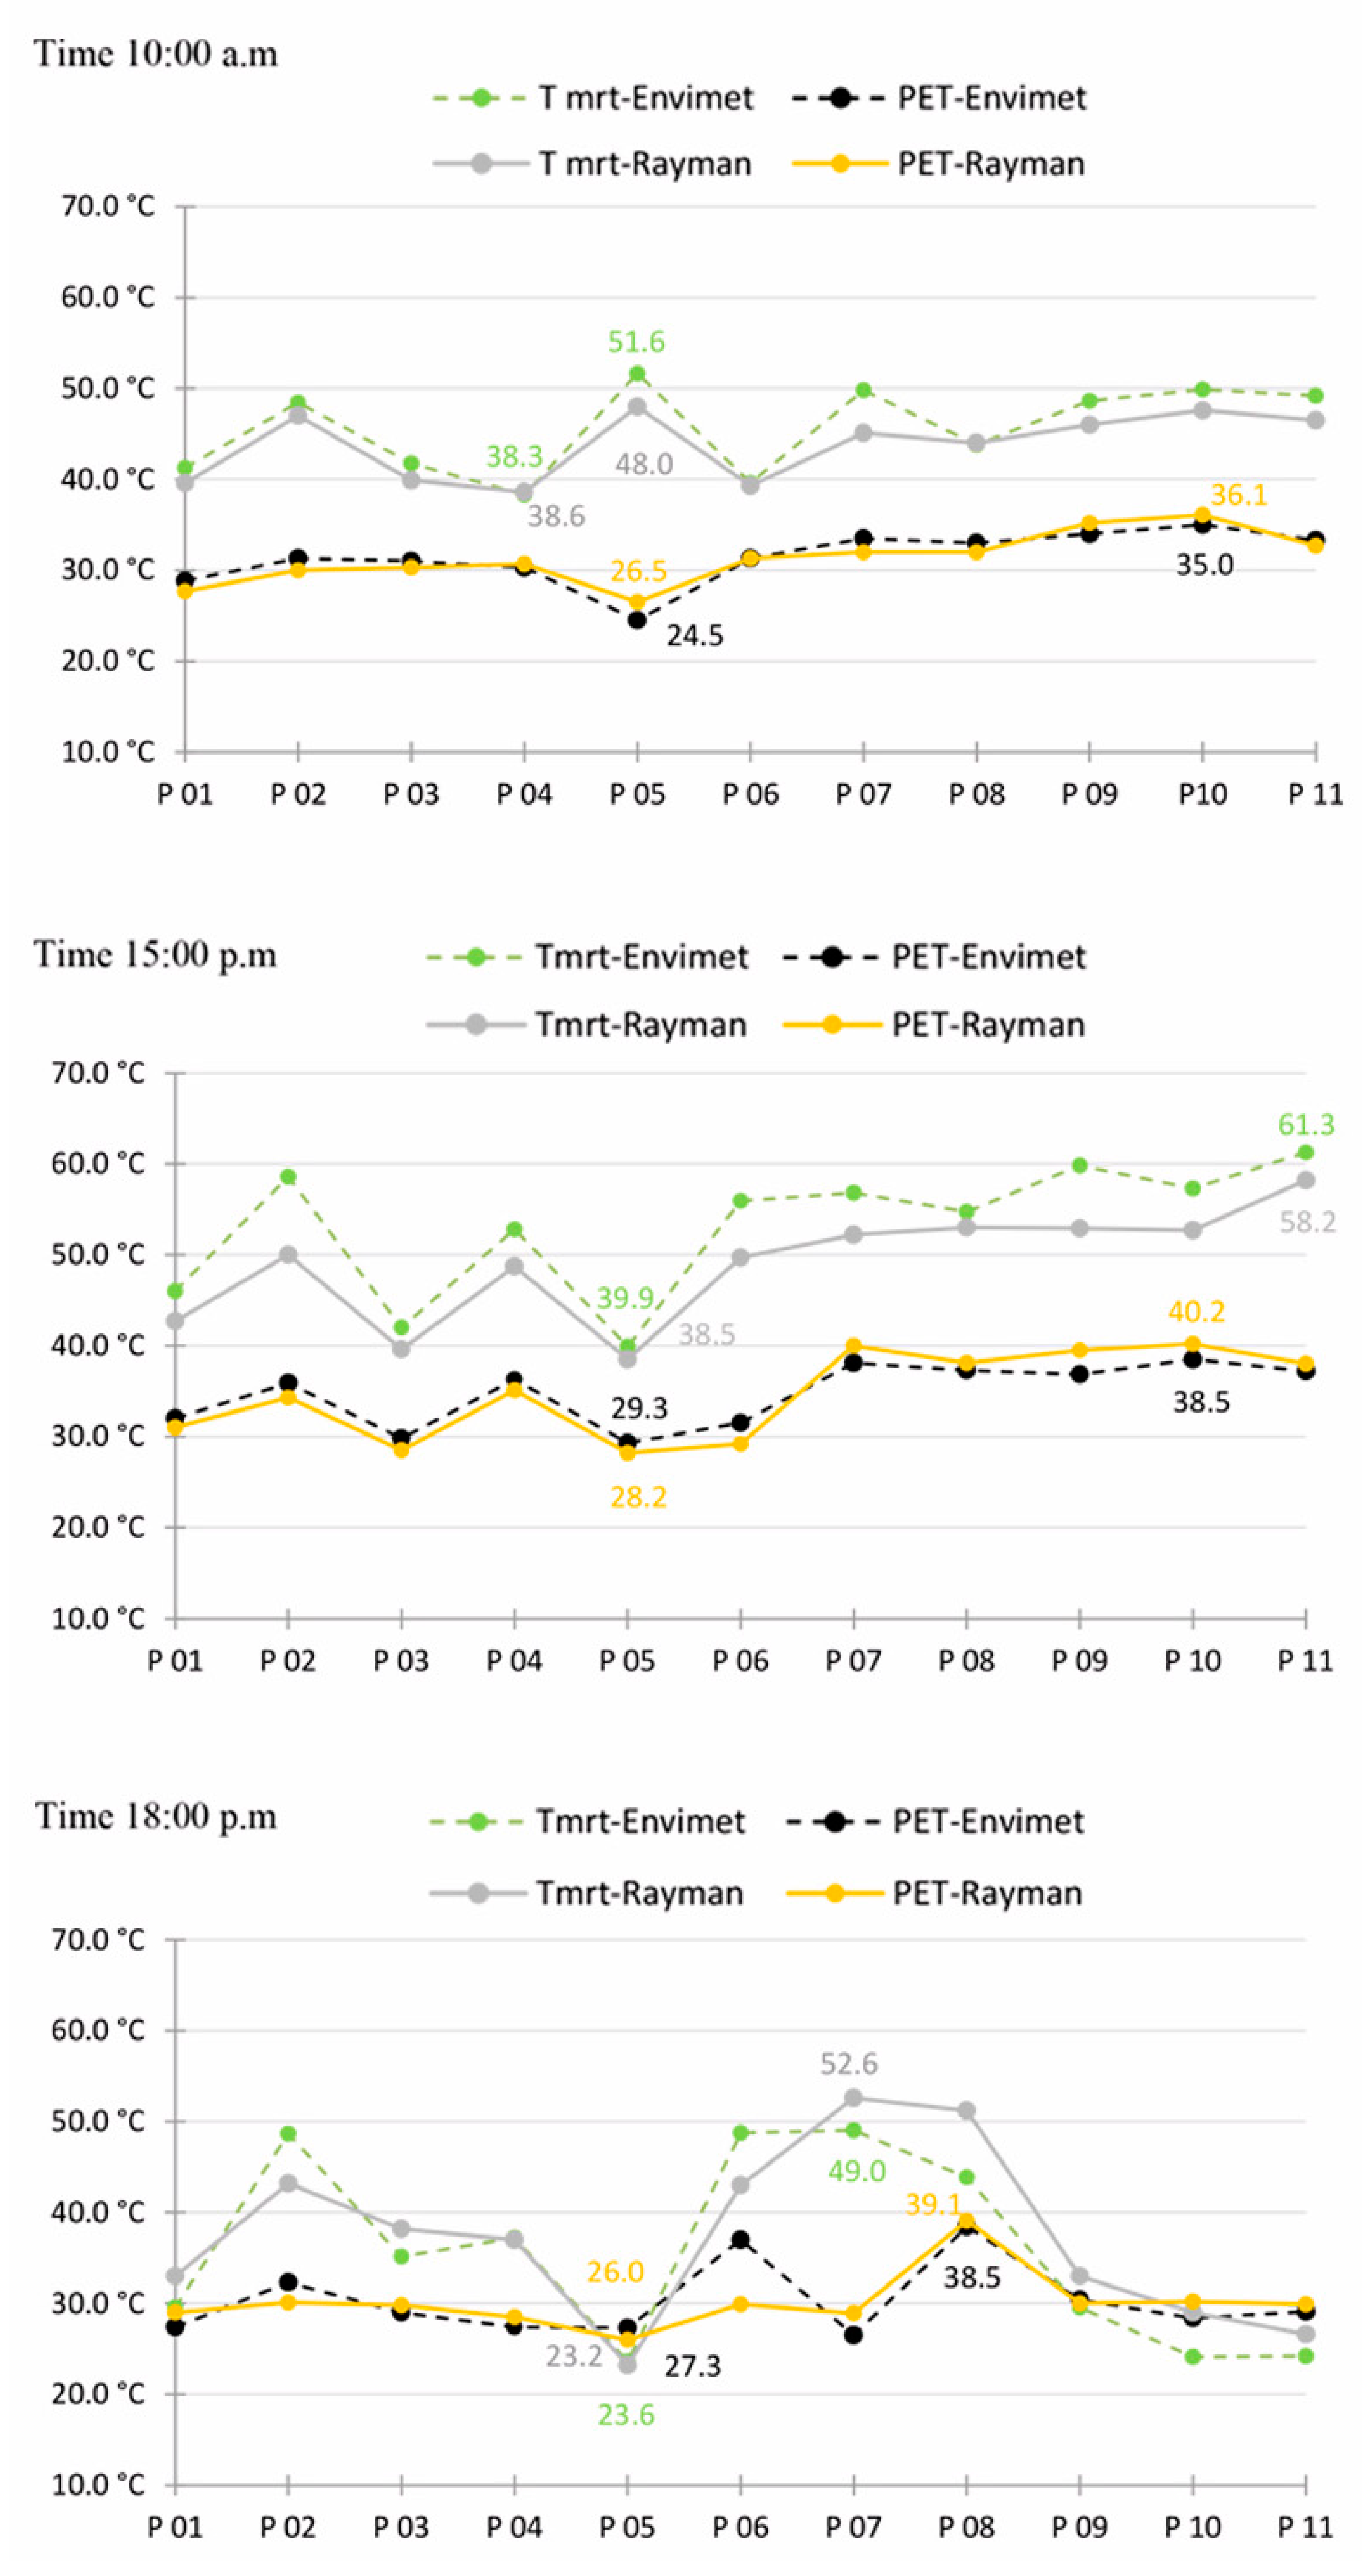
Once the reliability of the software is verified, the second investigation concerns the comparison of the Tmrt and PET parameters estimated by the two software used at the main time slots of the pedestrian-level analysis (hours of increased solar irradiation: 10:00 a.m., 15:00 p.m. and 18:00 p.m.). This extrapolates considerations concerning the thermal characteristics of the materials and spatial configuration (Table 3 and Figure 5).
In particular, at 10:00 the mean radiant temperature fluctuates between the minimum point 4 (38.3–38.6 °C) and the maximum point 5 (48.0–51.6 °C), and the rest of the district gives intermediate values (43.1–45.1 °C). The lowest recording is concentrated on the beneficial effect of c.p materials most exposed to solar radiation near the open canyon. However, the highest values are distributed in the paved area of c.p affected by the shading of buildings and therefore not exposed to direct sunlight in this time slot.
As far as the outdoor thermal comfort index is concerned, there is a range between the minimum spot 5 (24.5–26.5 °C) and the maximum spot 10 (35.0–36.1 °C), whereas the intermediate values (29.8–31.3 °C) are found at most surfaces. The minimum values are traceable ~–9.5/–10.5 °C in street canyons SE and NE compared to the highest values that are in paved areas with c.p to NW, where they do not trigger any change due to the shadow factor of buildings and the limited influence of trees, creating discomfort.
The Tmrt of the hours 15:00 oscillates between point 5 (38.5–39.9 °C) of the minimum and the point 11 (58.2–61.3 °C) of the maximum, with an average of approximately the 48.4–50.6 °C. The district is affected by the medium-high values of the range of approximately 85%, mainly in the North and West sector with a delta compared to 10:00 equal to +0.2–+1.3 °C min and +10.2–+9.7 °C max. The highest values are traceable in the urban canyon NW of the district covered by c.p barrier blocks in beige, and also with the presence of a decreased SVF factor and trees, while the performative values are recorded in the sector NE.
Moreover, as regards PET, it follows a rather similar trend at 10:00 with the minimum value in spot 5 (28.2–29.3 °C) and spot 10 (38.5–40.2 °C) maximum. Finally, the intermediate values oscillate between 33.4–34.8 °C with a delta compared to the previous hours between +3.7–+2.8 °C min and +3.5–+4.1 °C max.
The mean radiant temperature at 18:00 presents the relative values of point 5 (23.2–23.6 °C) of the minimum and point 7 (49.0–52.6 °C) of the rough with an intermediate between 36.1–38.1 °C, which involves 75–80% of the points investigated. In this case, the delta ranges between −15.3/−16.3 °C min and −9.2/−8.7 °C max compared to the values recorded at 15.00. The distribution presents the high values attributed with a higher SVF not involved in shading and also by the albedo factor (equal to 0.58) which characterizes the c.p of the beige colored barrier blocks to NW in this time band. Finally, the minimum values are recorded more towards the exposure to SW-NW.
The PET at 18:00 presents minimum values in spot 5 (26.0–27.3 °C) and maximum at the spot 8 (38.5–39.1 °C) with the average that oscillates between 32.3–33.2 °C. The lower values are traceable in most of the district in the urban canyons in the NW and NE, with a delta compared to 15:00 equal to −2.2/−2.0 °C min and 0.0/−1.1 °C max. The minimum values are concentrated near the shadow factor of the buildings in the NE, while the maximums concern the combined behavior of the thermal characteristics of c.p (gray and beige permeable barrier blocks) most exposed to solar radiation in this afternoon time slot and therefore with a relatively high SVF.
Following the analysis, the redevelopment at 18:00 pm is better performing in this regard. The outdoor thermal comfort (PET) in correlation with the remarkable changes of the Tmrt between the different points investigated are traceable in the shaded canyons of the urban roads, compared to 10:00 a.m. and 15:00 p.m. In particular, it must be stated that the PET index concerns warm thermal perception with rather moderate heat stress levels [43] in the main time slots of interest.
5. Conclusions
This paper study draws attention on the progress made by local public administrations led by a national program to implement real urban redevelopment interventions on the built structures characterizing dense cities. This current debate envisages a series of effective actions based on the criteria for microclimate improvement and the perceived thermal comfort of users in the summer period. In particular, through monitoring (simulative and in-situ) the Pavlou Mela case study, it is possible to reflect in more detail on the positive results obtained, extrapolating specific considerations between the main mitigation strategies (vegetation as shading canopies, water surfaces and c.p). These relate to the orientation, SVF and H/W ratio that characterize the urban open space, based on the improvement of the parameters Ta and Ts. This quantitative analysis makes it possible to observe that the c.p are less performing than those shown in NW and SW.
Furthermore, this study aims at individual processes supporting designers and decision-making processes. The first contributes to the methodological procedure proposed in the final phase of the process itself for greater precision of the results. The methodological approach uses different monitoring tools reporting the field data (direct) set on the calculation software (indirect) as input, through the modeling and virtual calculations of ENVImet Pro and Rayman Pro for the hottest day of the year, 30 July. Therefore, the procedure implements an adaptive methodology as a transferable process in homogeneous cases in the Mediterranean area. While the second consists of the verification of the mitigation conditions, highlighting that the specific solutions refer to the reliable effects on the thermal comfort perceived by the pedestrian during the day (26.9–30.4 °C ≤ PET ≥ 37.3–38.5 °C) with a significant improvement in the afternoon hours regarding the Tmrt with following changes on the effectiveness of the PET.
Finally, further future developments connected to the present study could be the analysis of night-time surveys to better understand the state of influences on the microclimate and on the comfort thermal application of the solutions within the urban environment.
6. Notes
(1) The heat scale of the PMV index gives a rating between −3 to +3 where 0 corresponds to the optimal situation which is divided into five areas: The comfort area (from −1 to +1); the hot area light (from +1 to +2); the area of light cold (from −1 to −2); the area of warm (greater than +2) and the area of cold (lower −2).
(2) Among the most significant indexes of evaluation of thermo-hygrometric comfort there are: The predicted mean vote (PMV); the physiological equivalent temperature (PET); the standard effective temperature (SET*) or the outdoor standard effective temperature (OUT_SET*) and the urban thermal comfort index (UTCI). Each has different characteristics in relation to the different focus of the analysis, however, it represents different combinations of the same set of relevant meteorological and thermo-physiological parameters. The PMV and the SET* have a solid basis for indoor calculations while the PET, OUT_SET * and UTCI have been formulated for external environments.
The PET is defined with the air temperature at which in a typical internal environment (Ta = Tmrt, v = 1.1 m/s and water vapor pressure = 12 hPa) the thermal load of the human body is balanced with the same temperature as the inside of the skin subjected to complex external conditions. This means that PET allows a person to compare the perception outdoors with their own indoor perception, and together with the OUT_SET* they consider short-wave and long-wave radiation on the human body. Regarding the UTCI (http://www.utci.org/), it was developed under the direction of the International Society of Biometeorology in 2011 (ISB commission 6, http://www.biometeorology.org) and within the European Cooperation in Science and Technology Action 730 (COST) program under the umbrella of the WHO commission on Climatology. Therefore, the UTCI represents the same thermal stress as the thermal environment considering: The average mean radiant temperature equals the air temperature (Tmrt = Τa); the equal wind speed at 0.5 m/s at 10 m height (approximately: 0.3 m/s at 1.1 m height), and the relative humidity at 50% (Ta ˂ 29 °C) and water vapor pressure at 20 hPa (Ta > 29 °C), through the activity of a person walking at a speed of 4 km/h peri at a metabolic rate of 2.3 MET (135W/m2). Following this, it was developed on the basic logic of an equivalent temperature, fitting into the groove of the modeling of indexes such as PET. Finally, several studies have compared the PET and the UTCI to detect the main differences, limits and potential because in both of them, they are lowered in the family scale of °C. Among the most interesting results are the following: For high levels of calculus, UTCI is higher than PET; for base temperatures PET is lower. Moreover, UTCI proves to be accurate for high humidity levels as regards to warm temperate climates, and both PET and UTCI are adequate.
(3) The c.p are characterized by high solar radiation (albedo, α) which makes it possible to limit the increase in the surface temperature when subjected to solar loads and the high emissivity (ε) determines the most favorable thermal relaunch in the nocturnal phase of the heat stored during the daylight hours.
(4) The sky view factor (SVF) consists simply of the three-dimensional measurements of the solid angles of the sky view from an urban space. It determines the exchange of the radiant heat between the city and the sky. If the SVF is 1, it means that the vision of the sky is total e.g., open. While, if the SVF is 0, it means that the vision of the sky is totally obstructed and with the following temperatures are strongly linked to the urban.
(5) Solar diagrams at 12:00 through the Rayman Pro software.
Author Contributions
The study was designed by I.S. and A.B. and adheres to the post-operam verification process. I.S. designed and performed the microclimate and comfort thermal simulations. I.S. supervised and controlled the ENVImet Pro and Rayman Pro modelling phase. The results were then analyzed by I.S., A.B. supervised the discussion. I.S. wrote and reviewed the paper.
Funding
This research received no external funding.
Acknowledgments
The authors are also grateful for the technical office of the planning and implementation department of Pavlou Mela, in particular the F. Alexiou and A. Papadopoulos for all the material provided and the technical reports of the in-situ measurements and the simulation calculations of ante and post-operam to the ESPA program.
Conflicts of Interest
The authors declare no conflict of interest.
References
- Intergovernmental Panel for Climate Change. Climate Change: Synthesis Report 2014. Contribution of Working Group I, II and III to the Fifth Assessment Report of the Intergovernmental Panel for Climate Change; IPCC: Geneva, Switzerland, 2014.
- United Nations Framework Convention on Climate Change. In Proceedings of the Parties at its twenty-first session (COP 21) and the Parties serving as the meeting of the Parties to the Kyoto Protocol at its eleventh session (CMP 11), Paris Agreement, COP 21 or CMP 11, Pairs, France, 30 November–11 December 2015.
- European Climate Adaptation Platform. Climate—ADAPT-Sharing Adaptation Information across Europe. Available online: http://climate-adapt.eea.europa.eu/ (accessed on 2 March 2018).
- European Commission. Community Research and Development Information Service. Horizon 2020 Call ReCO2ST; Publication Office: Luxembourg, 2017.
- Coaffee, J.; Lee, P. Urban Resilience: Planning for Risk, Crises and Uncertainty; Planning-Environment-Cities; Publication Office: London, UK, 2016; ISBN-10: 1137288833. [Google Scholar]
- Mirzaei, P.; Haghighat, F. Approaches to study urban heat island—Abilities and limitations. Build. Environ. 2010, 45, 2192–2201. [Google Scholar] [CrossRef]
- WHO Specialized Agency of the United Nation. Homepage. Available online: http://www.who.int/gho/urban_health/situation_trends/urban_population_growth_text/en/ (accessed on 11 November 2018).
- EPA. Reducing Urban Heat Islands: Compendium of Strategies, Urban Heat Island Basics; United States Environmental Protection Agency: Washington, DC, USA, 2008. Available online: https://www.epa.gov/sites/production/files/2014-06/documents/basicscompendium.pdf (accessed on 27 July 2019).
- Hayhoe, K.; Sheridan, S.; Kalkstein, L.; Greene, S. Climate change, heat waves, and mortality projections for Chicago. J. Great Lakes Res. 2010, 36, 65–73. [Google Scholar] [CrossRef]
- Hassid, S.; Santamouris, M.; Papanikolaou, N.; Linardi, A.; Klitsikas, N.; Georgakis, C.; Assimakopoulos, D.N. The effect of the Athens heat island on air conditioning load. Energy Build. 2000, 32, 131–141. [Google Scholar] [CrossRef]
- Shahmohamadi, P.; Che-Ani, A.I.; Maulud, K.N.A.; Tawil, N.M.; Abdullah, N.A.G. The Impact of Anthropogenic Heat on Formation of Urban Heat Island and Energy Consumption Balance. Urban Stud. Res. 2011, 9. [Google Scholar] [CrossRef]
- Smith, C.; Levermore, G. Designing urban spaces and buildings to improve sustainability and quality of life in a warmer world. Energy Policy 2008, 36, 4558–4562. [Google Scholar] [CrossRef]
- Erell, E.; Pearlmutter, D.; Boneh, D.; Kutiet, P.B. Effect of high-albedo materials on pedestrian heat stress in urban street canyon. Urban Clim. 2014, 10, 367–386. [Google Scholar] [CrossRef]
- Behringer, W. A Cultural History of Climate, 1st ed.; Polity: Cambridge, UK, 2009; ISBN 9780745645292. [Google Scholar]
- Chrysoulakis, N.; Vogt, R.; Young, D.; Grimmond, C.S.B.; Spano, D.; Marras, S. ICT for Urban Metabolism: The case of BRIDGE. Environ. Inform. Ind. Environ. Prot. 2009, 2, 183–193. [Google Scholar]
- Nikolopoulou, M. Designing Open Spaces in the Urban Environment: A Bioclimatic Approach: RUROS—Rediscovering the Urban Realm and Open Spaces; Center for Renewable Energy Sources: Attiki, Greece, 2004. [Google Scholar]
- Nikolopoulou, M. Outdoor thermal comfort. Front. Biosci. 2011, 3, 1552–1568. [Google Scholar] [CrossRef]
- Program National E.P. PERAA (ESPA 2007–2013). Bioclimatic Improvement Program for Public Open Spaces. Available online: http://www.cres.gr/epperaa/bioclimat_anavathm.html (accessed on 11 November 2018).
- Chatzidimitriou, A.; Kanouras, S.; Topli, L.; Bruse, M. Evaluation of a sustainable urban redevelopment project in terms of microclimate improvements. In Proceedings of the (PLEA 2017)—Sustainable Architecture for a Renewable Future, Edinburgh, UK, 3–5 July 2017; Available online: https://www.researchgate.net/publication/318404396 (accessed on 27 July 2019).
- Karakounos, I.; Dimoudi, A.; Zoras, S. The influence of bioclimatic urban redevelopment on outdoor thermal comfort. Energy Build. 2018, 158, 1266–1274. [Google Scholar] [CrossRef]
- Fanger, P.O. Thermal Comfort: Analysis and Application in Environmental Engineering; Mc-Graw-Hill: New York, NY, USA, 1972. [Google Scholar]
- D’Ambrosio Alfano, F.R.; Igor Palella, B.; Riccio, G.; Toftum, J. Fifty years of Fanger’s equation: Is there anything to discover yet? Int. J. Ind. Ergon. 2018, 66, 157–160. [Google Scholar] [CrossRef]
- Höppe, P. The physiological equivalent temperature—A universal index for the biometeorological assessment of the thermal environment. Int. J. Biometeorol. 1999, 43, 71–75. [Google Scholar] [CrossRef] [PubMed]
- Matzarakis, A.; Rutz, F. Application of the Rayman Model in Urban Environments Freiburg; Meteorological Institute, University of Freiburg: Freiburg, Germany, 2010; Available online: https://ams.confex.com/ams/19Ag19BLT9Urban/techprogram/paper_169963.htm (accessed on 27 July 2019).
- Martinelli, L.; Matzarakis, A. Influence of height/width proportions on the thermal comfort of courtyard typology for Italian climate zones. Sustain. Cities Soc. 2017, 29, 97–106. [Google Scholar] [CrossRef]
- Bröde, P.; Fiala, D.; Blazejczyk, K.; Holmér, I.; Jendritzky, G.; Kampmann, B.; Tinz, B.; Havenith, G. Deriving the operational procedure for the Universal Thermal Climate Index (UTCI). Int. J. Biometeorol. 2012, 56, 481–494. [Google Scholar] [CrossRef]
- D’Ambrosio Alfano, F.R.; Olesen, B.W.; Palella, B.I. Povl Ole Fanger’s impact ten years later. Energy Build. 2017, 152, 243–249. [Google Scholar] [CrossRef]
- Santamouris, M.; Kolokotsa, D. Urban Climate Mitigation Techniques; Routledge: New York, NY, USA, 2016; ISBN 978-0-415-71213-2. [Google Scholar]
- Santamouris, M. Using cool pavements as a mitigation strategy to fight urban heat island a review of the actual developments. Renew. Sustain. Energy Rev. 2013, 26, 224–240. [Google Scholar] [CrossRef]
- Santamouris, M.; Xirafi, F.; Gaitani, N.; Spanou, A.; Saliari, M.; Vassilakopoulou, K. Improving the Microclimate in a Dense Urban Area Using Experimental and Theoretical Techniques—The Case of Marousi, Athens. Int. J. Vent. 2012, 11, 1–16. [Google Scholar] [CrossRef]
- Santamouris, M.; Gaitani, N.; Spanou, A.; Saliari, M.; Giannopoulou, K.; Vasilakopoulou, K.; Kardomateas, T. Using cool paving materials to improve microclimate of urban areas—Design realization and results of the flisvos project. Build. Environ. 2012, 53, 128–136. [Google Scholar] [CrossRef]
- Zulia, E.; Santamouris, M.; Dimoudi, A. Monitoring the effect of urban green areas on the heat island in Athens. Environ. Monit. Assess. 2009, 156, 275–292. [Google Scholar] [CrossRef]
- Dimoudi, A.; Nikolopoulou, M. Vegetation in the urban environment: Microclimatic analysis and benefits. Energy Build. 2003, 35, 69–76. [Google Scholar] [CrossRef]
- Scudo, G. Thermal comfort in green spaces. In Green Structures and Urban Planning; Sistemi Editoriali: Milan, Italy, 2002. [Google Scholar]
- Ken-ichi, N.; Kohno, T.; Misaka, I. Experimental Study on Evaporative Cooling of Fine Water Mist for Outdoor Comfort in the Urban Environment. In Proceedings of the Third International Conference on Countermeasures to Urban Heat Island, Venice, Italy, 13–15 October 2014; pp. 1288–1298. [Google Scholar]
- Santamouris, M.; Ding, L.; Fiorito, F.; Oldfield, P.; Osmond, P.; Paolini, R.; Prasad, D.; Synnefa, A. Passive and active cooling for the outdoor build environment—Analysis and assessment of the cooling potential of mitigation technologies using performance data from 220 large scale projects. J. Sol. Energy 2017, 154, 14–33. [Google Scholar] [CrossRef]
- Rosso, F.; Golasi, I.; Castaldo, V.L.; Piselli, C.; Pisello, A.L.; Salata, F.; Ferrero, M.; Cotana, F.; Vollaro, A. On the impact of Innovation materials on outdoor thermal comfort of pedestrians in historical urban canyons. Renew. Energy 2018, 118, 825–839. [Google Scholar] [CrossRef]
- Drach, P.; Barbosa, G.; Corbella, O. Densification Process of Copacabana Neighborhood over 1930, 1950 and 2010 Decades: Comfort indexes. In Proceedings of the Third International Conference on Countermeasures to Urban Heat Island, Venice, Italy, 13–15 October 2014; pp. 1348–1361. [Google Scholar]
- TOTEE, Technical Guideline 20701-2. Thermophysical Properties of Structural Materials and Testing of Insulating Adequacy of Buildings; Technical Chamber of Greece: Athens, Greece, 2010.
- Huttner, S.; Bruse, M. Numerical modeling of the urban climate—A preview on envi-met 4.0. In Proceedings of the 7th International Conference on Urban Climate (ICUC-7), Yokohama, Japan, 29 June–3 July 2009. [Google Scholar]
- Matzarakis, A.; Rutz, F.; Mayer, H. Modelling radiation fluxes in simple and complex environments—Application of the RayMan model. Int. J. Biometeorol. 2007, 51, 323–334. [Google Scholar] [CrossRef]
- Chatzidimitriou, A.; Liveris, P.; Bruse, M.; Topli, L. Urban Redevelopment and Microclimate Improvement: A Design Project in Thessaloniki, Greece. In Proceedings of the (PLEA2013)—29th Conference, Sustainable Architecture for a Renewable Future, Munich, Germany, 10–12 September 2013. [Google Scholar]
- Matzarakis, A.; Mayer, H. Another kind of environmental stress: Thermal stress. WHO Collaborating Centre for Air Quality Management and Air Pollution Control. Newsletter 1996, 18, 7–10. [Google Scholar]
Figure 1.
The study area in Pavlou Mela, Thessaloniki of Greece Streets Views: P7_Varnali, P1_G. Lampraki, P5_Papanaastasiou.
Figure 1.
The study area in Pavlou Mela, Thessaloniki of Greece Streets Views: P7_Varnali, P1_G. Lampraki, P5_Papanaastasiou.

Figure 2.
Urban redevelopment of the neighborhood Pavlou Mela: (a) Interventions, and (b) materials.
Figure 2.
Urban redevelopment of the neighborhood Pavlou Mela: (a) Interventions, and (b) materials.

Figure 3.
A comparison of the temperature value between the simulation results and the in-situ measurements, z = 1.80 m.
Figure 3.
A comparison of the temperature value between the simulation results and the in-situ measurements, z = 1.80 m.

Figure 4.
A comparison of the surface temperature value between the simulation results and the in-situ measurements, z = 0 m.
Figure 4.
A comparison of the surface temperature value between the simulation results and the in-situ measurements, z = 0 m.

Figure 5.
The verification evaluation and comparison of microspecific points between the thermal sensation Tmrt and the thermal comfort index PET, z = 1.80 m.
Figure 5.
The verification evaluation and comparison of microspecific points between the thermal sensation Tmrt and the thermal comfort index PET, z = 1.80 m.


Table 1.
The validation and verification of ante and post-operam comparison of the simulation results to the specific objectives of the ESPA program (data in-output of a typical warm summer day 21 June and the hottest day of the year 30 July).
Table 1.
The validation and verification of ante and post-operam comparison of the simulation results to the specific objectives of the ESPA program (data in-output of a typical warm summer day 21 June and the hottest day of the year 30 July).
| Specific Objectives of the Program E.P.PERAA [ESPA 2007–2013) | Validation Ante-Operam 2011 | Verification Post-Operam 2016 | ΔOperam [2011–2016] °C | ΔOperam [2011–2016] % |
|---|---|---|---|---|
| Ob 01: average air temperature Ta = −5.8 (°C), z = 1.80 m—30 July | +33.9 | +28.1 | −5.8 | −17.0 |
| Ob 02: average surface temperature Ts = −7.9 (°C), z = 0.00 m—30 July | +37.9 | +30.0 | −7.9 | −13.3 |
| Ob 03: the sum of the base grades 26 °C, CDH = −85.8%, z = 1.80 m—21 June | +62.2 | + 8.8 | −53.4 | −85.8 |
| Ob04: comfort index PMV = −47.3%, z = 1.80 m—21 June | +2.4 | +1.5 | −0.9 | −37.4 |
Table 2.
The surface properties of cool pavement innovative materials on certificates from the University of Athens Kapodistrian authorized laboratory.
Table 2.
The surface properties of cool pavement innovative materials on certificates from the University of Athens Kapodistrian authorized laboratory.
| Material | Albedo (α) | Emissions (ε) | Percentage of the Total Area of the Intervention (%) |
|---|---|---|---|
| photocatalytic asphalt | ~0.50 | - | 8.15 |
| cool barrier tile white | 0.81 | 0.92 | 2.25 |
| cool barrier tile beige | 0.72 | 0.90 | 5.50 |
| cool barrier block grey | 0.47–0.56 | 0.88 | 19.54 |
| cool barrier block beige | 0.58 | 0.89 | 47.58 |
Table 3.
Spatial configuration of the urban canopy of the eleven spots.
| Spots | SVF(5) | Orientation | Description | |
|---|---|---|---|---|
| H/W& Green-Trees | Innovative Materials c.p | |||
| 01 |  | South-West | The first point in question is located at the intersection of the streets Grigoriou Lampraki & Othonos, in a main road surrounded on three sides by medium buildings (9–18 m), exposed to solar radiation mainly in the afternoon hours, while regarding incidence of the shadow factor shows the remarkable effectiveness of existing trees of height 6–7 m with perennial leaves. | The combination of the main materials used for the flooring presents: photocatalytic coating for the street (via Gr. Lampraki), gray ‘cool’ barrier blocks (via Othonos), walkway covered by barrier blocks ‘cool’ color beige, sensory journey for the visually impaired with tactile concrete slabs of white color. |
| 02 |  | South-East | The second highlight is located on one of the main local roads of particular frequency, in Grigoriou Lampraki street, characterized by the average continuity of the building front (12–21 m). In particular, the area is surrounded by rows of deciduous trees and perennials of height ˂5–6 m, exposed both East and West to shield the driveway. | The flooring materials applied to the walkway are composed of beige ‘cool’ barrier blocks, while the road presents the photocatalytic treatment combined with gray ‘cool’ barrier blocks that delimit the parking areas. |
| 03 |  | South-East | The third point in question falls in an area completely dedicated to pedestrians inside the neighborhood in Geog. Seferi road, located in front of an urban square covered with trees of 3–15 m height, which generate shade. The point is presented in a path delimited by flowerbeds in different tiers and surrounded by buildings of medium height, between 12–15 m. | The flooring materials are covered with: beige ‘cool’ barrier tiles and beige ‘cool’ barrier blocks. |
| 04 |  | North-East | The fourth significant point was made on the Koustali route in a morphologically open area, surrounded by low buildings (6–9 m) with greater openness SVF, while the organization of the trees of height ˂4–5 m with perennial leaves are placed in a linear form along the road axis on both the West and East sides. | The flooring materials are covered with: beige ‘cool’ barrier tiles and beige ‘cool’ barrier blocks. |
| 05 |  | North-East | The fifth point is executed in Papanastasiou road, it has continuous building fronts (12–15 m), while the green system does not play any role because it is almost non-existent in the surrounding range. | The street is covered with gray ‘cool’ barrier blocks, while the walkway contains beige ‘cool’ barrier blocks. |
| 06 |  | North | The sixth specific point was observed on Othonos street, surrounded by continuous front buildings of medium height (12–15 m) and by the widening of the 7 m road (i.e., the ratio H/W to about 0.60–0.40); furthermore, there are stretches of deciduous trees of 2–3 m in the West, which generate in case of an accident the shading effect at the moment of detection, because they do not yet possess sufficient growth. | Application materials associated with paving are made of beige ‘cool’ barrier blocks on the street, while the pedestrian path is redesigned with beige ‘cool’ barrier tiles. |
| 07 |  | North-West | The seventh survey was carried out at the intersection of the streets Thivon & Varnali, in front of an area of public car parks pertaining to the entrance of the psychiatric hospital (with different daily and weekly frequencies). The spatial configuration presents different heights of buildings (3–21 m) and is surrounded by trees of size between 3–8 m deciduous on the West side. | The flooring is covered with beige ‘cool’ barrier blocks. |
| 08 |  | West | The eighth specific point is taken from the survey on the site, at different times of the day, in a vehicular transit area (with moderate traffic) and pedestrian area, located in P. Tsandali street. The spatial configuration is partially open on the SW side with different heights of the buildings (9–12 m), while the SE side has continuity of the fronts of 4–7 floors. The green system of <12–18 m, integrated with the flowerbeds, arranged in rows of deciduous and perennial trees near the road. | The main materials used for the flooring were: the gray ‘cool’ barrier blocks for the street and the parking area, while the surfaces on the walkway are covered with beige ‘cool’ barrier blocks. |
| 09 |  | South-West | The ninth important step on the field is located on the main street of Grigoriou Lampraki excessively busy; the site is characterized by buildings of medium height (9–18 m), while the impact of the green system is produced by trees of size <3–6 m deciduous and perennial, which are placed in rows along the road. | The combination of the flooring, with the thermophysical properties related to the individual materials, consists of: photocatalytic asphalt, gray ‘cool’ barrier blocks present in the parking area and beige ‘cool’ barrier blocks used for the construction of sidewalks. |
| 10 |  | North-West | The tenth experiment point is located at the pedestrian crossing with limited traffic between the streets Aggelou Sikelianou & Geog. Seferi, which has a H/W ratio of 0.72, between the pedestrianized width of 13 m and the height of the buildings of 15 m. The green shading elements are between 3–4 m long deciduous and perennial. | The materials configured in flooring are made of beige ‘cool’ barrier blocks of different sizes and ‘cool’ beige barrier tiles. |
| 11 |  | West | The eleventh point of detection is carried out on Manou Katraki street, surrounded by buildings of different heights (from 6 to 15 m), while the organization of deciduous and perennial trees of size between 6–9 m has two sides on the sides integrated with the flowerbeds, which delimit the completely pedestrianized area. | The main flooring materials consist of beige ‘cool’ barrier blocks of different sizes. |
Table 4.
Simulation inputs detected in situ for the hottest day of 2016 (30 July).
| Input Parameters | Average Value |
|---|---|
| air temperature | 33.0 °C, 306.15 K |
| relative humidity | 37.4% |
| wind speed | 0.7 m/s |
| wind direction | 181.7° |
| barometric pressure | 1004.9 hPa |
| sky conditions: cloud cover (cc) | 0 (clear) |
© 2019 by the authors. Licensee MDPI, Basel, Switzerland. This article is an open access article distributed under the terms and conditions of the Creative Commons Attribution (CC BY) license (http://creativecommons.org/licenses/by/4.0/).
Share and Cite
MDPI and ACS Style
Skoufali, I.; Battisti, A. Microclimate of Urban Canopy Layer and Outdoor Thermal Comfort: A Case Study in Pavlou Mela, Thessaloniki. Urban Sci. 2019, 3, 84. https://0-doi-org.brum.beds.ac.uk/10.3390/urbansci3030084
AMA Style
Skoufali I, Battisti A. Microclimate of Urban Canopy Layer and Outdoor Thermal Comfort: A Case Study in Pavlou Mela, Thessaloniki. Urban Science. 2019; 3(3):84. https://0-doi-org.brum.beds.ac.uk/10.3390/urbansci3030084
Chicago/Turabian StyleSkoufali, Ioanna, and Alessandra Battisti. 2019. "Microclimate of Urban Canopy Layer and Outdoor Thermal Comfort: A Case Study in Pavlou Mela, Thessaloniki" Urban Science 3, no. 3: 84. https://0-doi-org.brum.beds.ac.uk/10.3390/urbansci3030084