1. Introduction
Temperature studies in growing arid cities are increasingly important because of the number of people who suffer from urban heat island (UHI) effects. This phenomenon results from land cover consisting of materials that absorb significant amounts of solar radiation, such as concrete, asphalt, etc., and radiate heat at night [
1]. These materials are often darker (e.g., asphalt) and typically drier because of their impermeability, which increases surface and air temperatures. In contrast, areas where the soil contains more moisture and vegetation [
2] and lighter colors are used [
3] absorb and radiate less heat. The UHI effect is amplified by human actions, especially in dense urban areas. These areas generate more heat and pollution because of vehicle traffic and heating or air conditioning [
1]. For desert cities such as Phoenix and its periphery, where temperatures can reach more than 43 °C, UHI mitigation is essential.
In Arizona, about 2000 people per year visit medical centers to treat heat-related problems [
4]. From 2006 to 2016, there were 1193 heat-related deaths attributable to the intense heat [
4]. Extreme heat also increases energy consumption as air conditioning demands increase to maintain human comfort [
5]. Additionally, water consumption increases, sometimes as much as 290 gallons per 0.6 °C increase in temperature for a single-family home [
6]. For the Southwestern United States, this trend exacerbates the drought experienced over the last decade.
Shade from trees reduces temperatures by preventing solar radiation from reaching the soil, consequently decreasing land surface temperatures. Trees also reduce temperatures through evapotranspiration, a combination of evaporation and transpiration. During evaporation, moisture gets released from the soil under and near the tree. During transpiration, water vapor gets released through the leaves [
1]. Therefore, urban forests offer urban cooling effects [
7]. Observations in Phoenix show that areas shaded by trees create microclimates with temperatures 11 °C lower than areas around them [
8]. This study demonstrates the importance of trees for lowering the temperature of arid places. As a result, tree-planting programs are growing in popularity in Phoenix and similar desert metropolitan regions.
Urban design and planning also use parks and open spaces for heat island mitigation. These land uses serve as recreation areas while creating a park cool island (PCI) effect of lowering temperatures by 0.7–3.6 °C, especially in arid places [
9]. This effect varies according to the amount and type of coverage. For example, grass and xeric (a blend of grass and desert) zones are coolest with the best PCI results, while pavement and concrete are the warmest, negatively impacting PCI [
9]. One Phoenix study found that more extensive grass cover areas cool the microclimate between 0.41 °C and 0.82 °C per hour between 8:00 p.m. and midnight [
6]. The same study also indicated that this type of coverage could lead to excessive water consumption, an issue for desert cities.
Water-related mitigation strategies, the basis for this study, tend to cool more than others. For example, in one study in Beijing, China, water surfaces had an average temperature of 28.33 °C, green surfaces an average of 28.43 °C, and built surfaces an average of 31.82 °C [
10]. Water surfaces can cool land surface temperatures by 0.54 °C/hectometers (hm) and over water by 1.76 °C/hm [
11]. There is also a correlation between water mass and temperature; more water mass results in lower temperatures [
11]. However, small water bodies distributed throughout the city produce the best urban cooling effects [
11]. Interestingly, a survey of sustainability literature reveals that neighborhood-scale sustainability initiatives that would verify this last finding receive relatively little attention compared to regional- or metropolitan-scale efforts, despite the neighborhood-level scale being where most people interact, work, and live [
12].
Yu et al. [
13] provide a critical review of the literature on the cooling effects of combining urban water and green landscape, or “blue–green spaces.” The research finds that water use in dry or arid areas provides cooling effects but that the amount of cooling is difficult to ascertain due to issues of the size, shape, and distance (threshold) from the water body. Yu et al. [
13] also make the point that water-based infrastructure “puts tremendous pressure on water resources, which requires further investigation” [
13] (p. 8). This paper provides a neighborhood-scale case study for green infrastructure as artificial (constructed) wetlands to reduce UHI and treat urban wastewater.
In desert cities, green infrastructure benefits can be significant, especially if related to water. In the Phoenix metropolitan area, the City of Avondale uses 21 filtration-engineered cells or ponds, distributed over more than 300 acres in its Crystal Gardens neighborhood, as a wastewater treatment facility. Recycled wastewater is pumped into the ponds, consisting of wetland vegetation, soils, sedimentation, and microbial assemblages. These mechanisms treat the wastewater before transferring it to recharge basins, where it eventually filters into the groundwater aquifer. This nature-based system offers an array of ecosystem services (environmental benefits for human populations [
14]) at reduced costs compared to conventional treatment facilities.
In addition to wastewater treatment, the Avondale system provides recreation, air filtration, noise reduction, and micro-climate regulation [
15]. For example, grassy areas and cement walkways surrounding the treatment ponds provide recreational options to Crystal Gardens and neighboring residents. The wetlands also offer residential community development opportunities that contribute to the tax base. Recent economic literature using Hedonic modeling shows that water features in urban desert areas can increase home values [
16]. Over 900 houses currently sit around the Crystal Garden ponds. These homes have higher selling prices than equivalent-sized constructed homes in nearby communities that do not have water features [
16].
2. Materials and Methods
Using Avondale and the Crystal Gardens neighborhood as a case study, this paper explores if and how constructed water-based landscape features impact temperature and reduce UHI impacts in an urban desert city. If they do, what is the magnitude of the temperature change, and does it make these areas more comfortable to live in and enhance well-being and livability. The study compares remotely sensed surface temperature readings in the Crystal Gardens neighborhood to two nearby neighborhoods without water features. We then look at other microclimate studies of the area that have demonstrated relationships been surface temperatures and human comfort to show the range of cooling effects from these constructed wetlands. This study’s primary objective is to address whether this type of green infrastructure has a cooling impact in desert climates and determine the magnitude of the effects.
The study also explores ecosystem service impacts, especially water treatment, groundwater recharge, recreation, and aesthetics. If desert cities move toward sustainable green infrastructure, such as this wetlands project, it will be critical to know the impacts of these projects. It will also be essential to understand how homeowner recognition of wetland ecosystem services and benefits affect living preferences.
2.1. Study Area
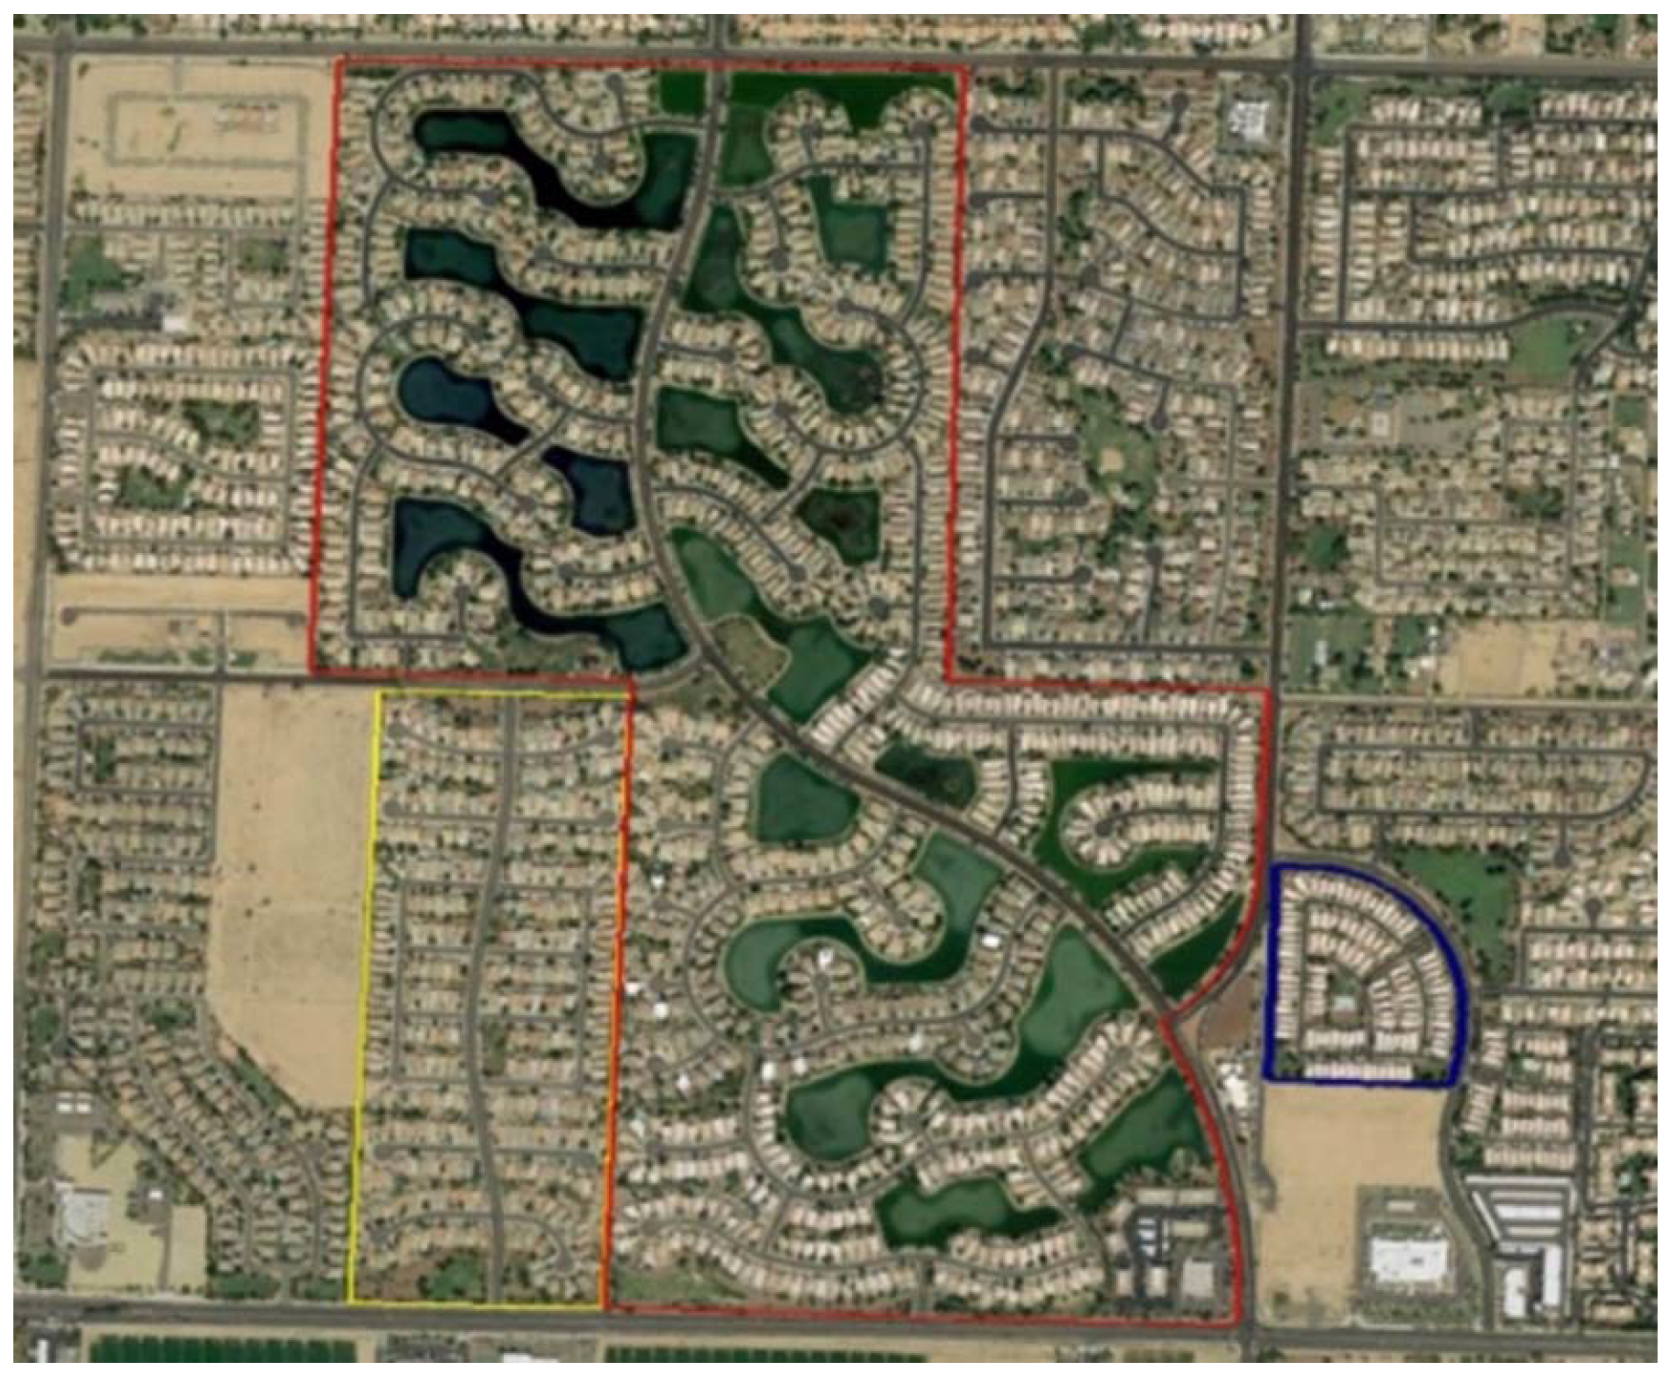
The study compares the temperature differences in Crystal Gardens, Crystal Point, and Sunrise at Harbor Shore (
Figure 1). Crystal Gardens covers 331 acres, with 72 acres of constructed wetlands segmented into 21 cells of various shapes distributed throughout the community [
17]. These cells are part of a project built more than twenty years ago as an innovative wastewater filtration treatment system that augments the area’s groundwater aquifers [
17]. Gravel, grass, and trees cover the soil around the water cells and in the yards of the community’s 900 homes. The development of this green infrastructure project began in 1997. It integrates water treatment, recreation, home development, aesthetics, and groundwater augmentation through the neighborhood’s recharge basins. For the study, we divided Crystal Gardens into north and south as it covers more area than the other two study communities.
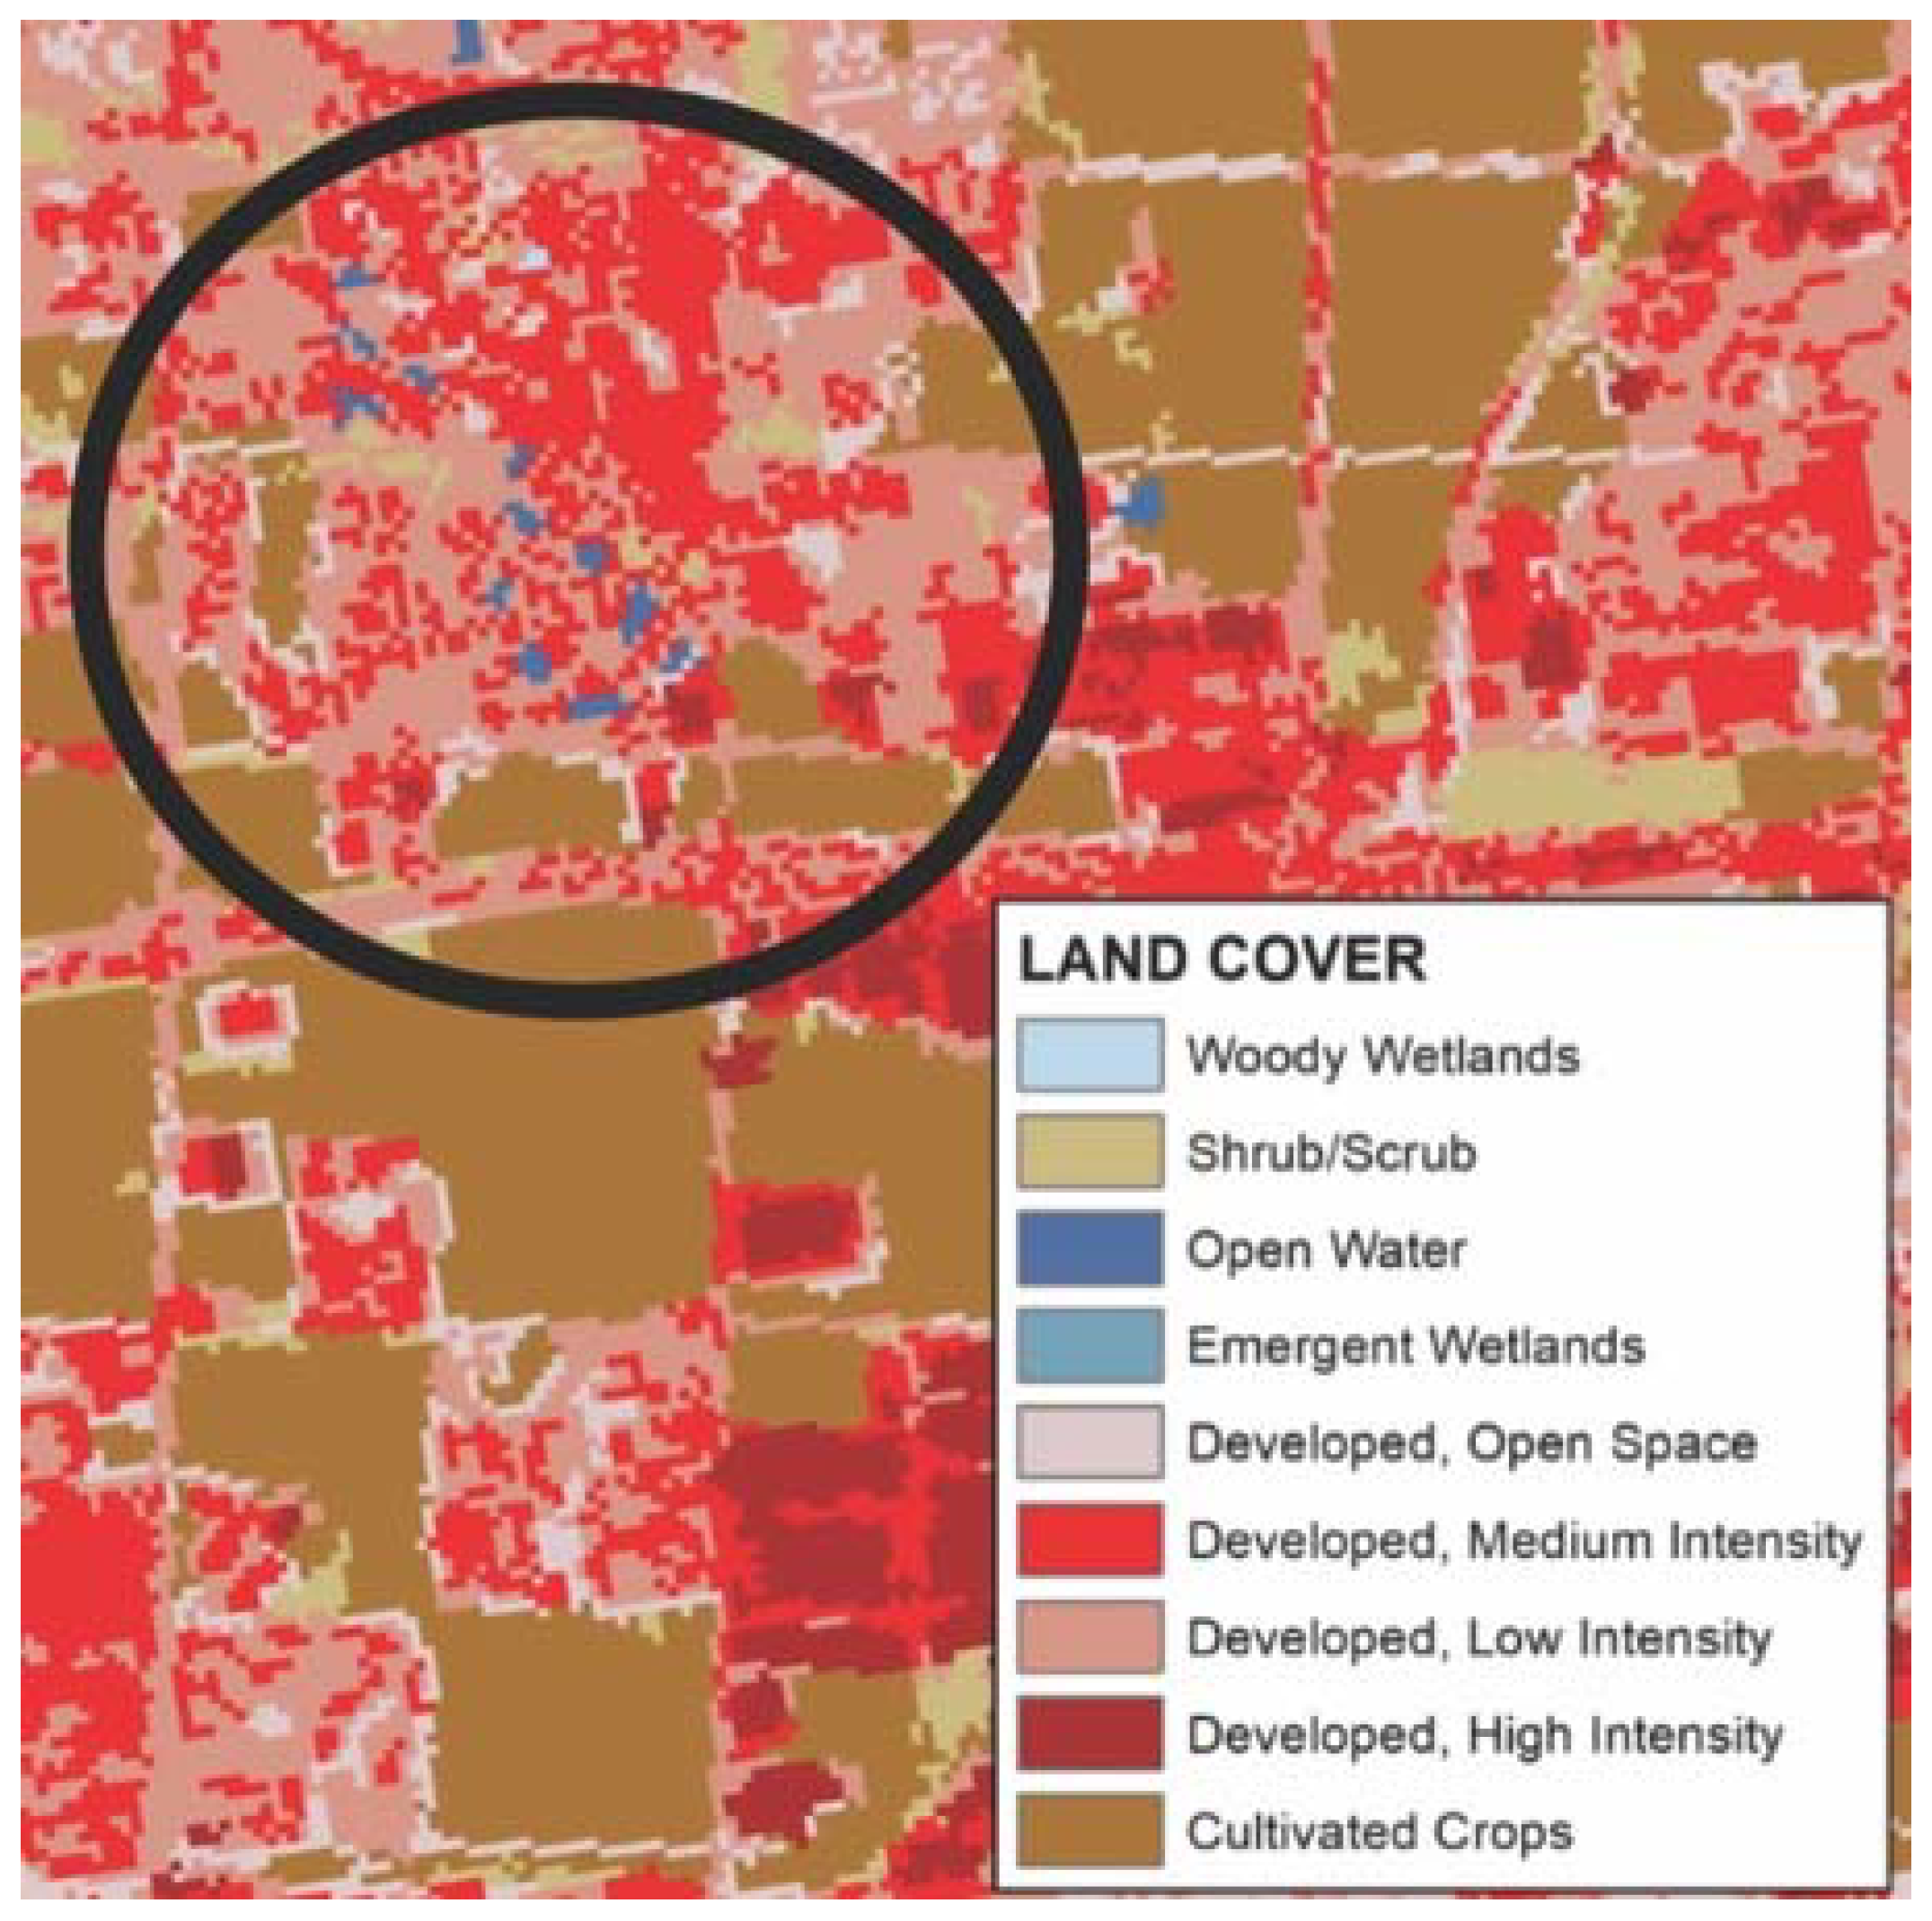
Crystal Point is located southwest of Crystal Gardens and covers 59.9 acres with an exposed land area of 23 acres to the west. It is a dense housing development area without a centralized water feature. However, houses on the northeast boundary of the community can see the Crystal Gardens water features. Satellite images of the site and land classification (
Figure 2) show that the primary surface materials are houses, concrete, and asphalt.
Sunrise at Harbor Shore sits on approximately 14 acres southeast of Crystal Gardens. Like Crystal Point, Sunrise does not have any water features. It is adjacent to 11.9 acres of exposed land area to the south and 4.1 acres of desert open space that functions as a water basin with trees around the periphery to the northeast. The site has two grass areas in the southwest and southeast corners, plus a line of trees along the east and northeast boundaries that act as a privacy barrier for the houses along a road at the back of the community. The trees also serve as a buffer against increased temperatures from the road’s asphalt.
2.2. Satellite Imagery
Researchers obtained surface temperature satellite images over the study area for two clear days in May. The 10:30 a.m. imagery was taken in May 2014, the 10:30 p.m. imagery in May 2015. Reading times are due to satellite pass over times and account for late morning and nighttime UHI effects. These effects are consistent at 10:30 p.m. in hot desert climates as UHI does not begin to subside until well past midnight [
18]. The availability of satellite imagery in May and the fact that it is not subject to the region’s summer monsoon winds and rain made it ideal for this study. Also, humidity in May in Phoenix is very low and is not as much of a factor as the temperature is. This situation is not the case for all climates. Therefore, researchers will need to account for humidity when replicating this research in non-desert cities.
Surface temperature refers to the heat retention of various materials and their capacity to reflect it back into the atmosphere [
19]. Each surface absorbs heat differently: drier, darker surfaces absorb more solar energy making them warmer; clear, wet surfaces absorb less solar energy and are cooler [
6]. This study takes the minimum and maximum surface temperatures for each community rather than the surface temperature of each of the materials (concrete, asphalt, green areas, water, bare ground, etc.) contained within the communities.
Figure 2 shows land-cover classifications for the study area.
3. Results
3.1. Study Area Temperatures at 10:30 a.m.
Satellite imagery comes from the Advanced Very High-Resolution Radiometer (AVHRR) database. AVHRR is a four- and five-channel broadband scanner that senses visible, near-infrared, and thermal infrared portions of the electromagnetic spectrum [
20]. Surface temperature resolution is 1.1 km in degrees C. These images do not display pixel temperature output from remote sensing.
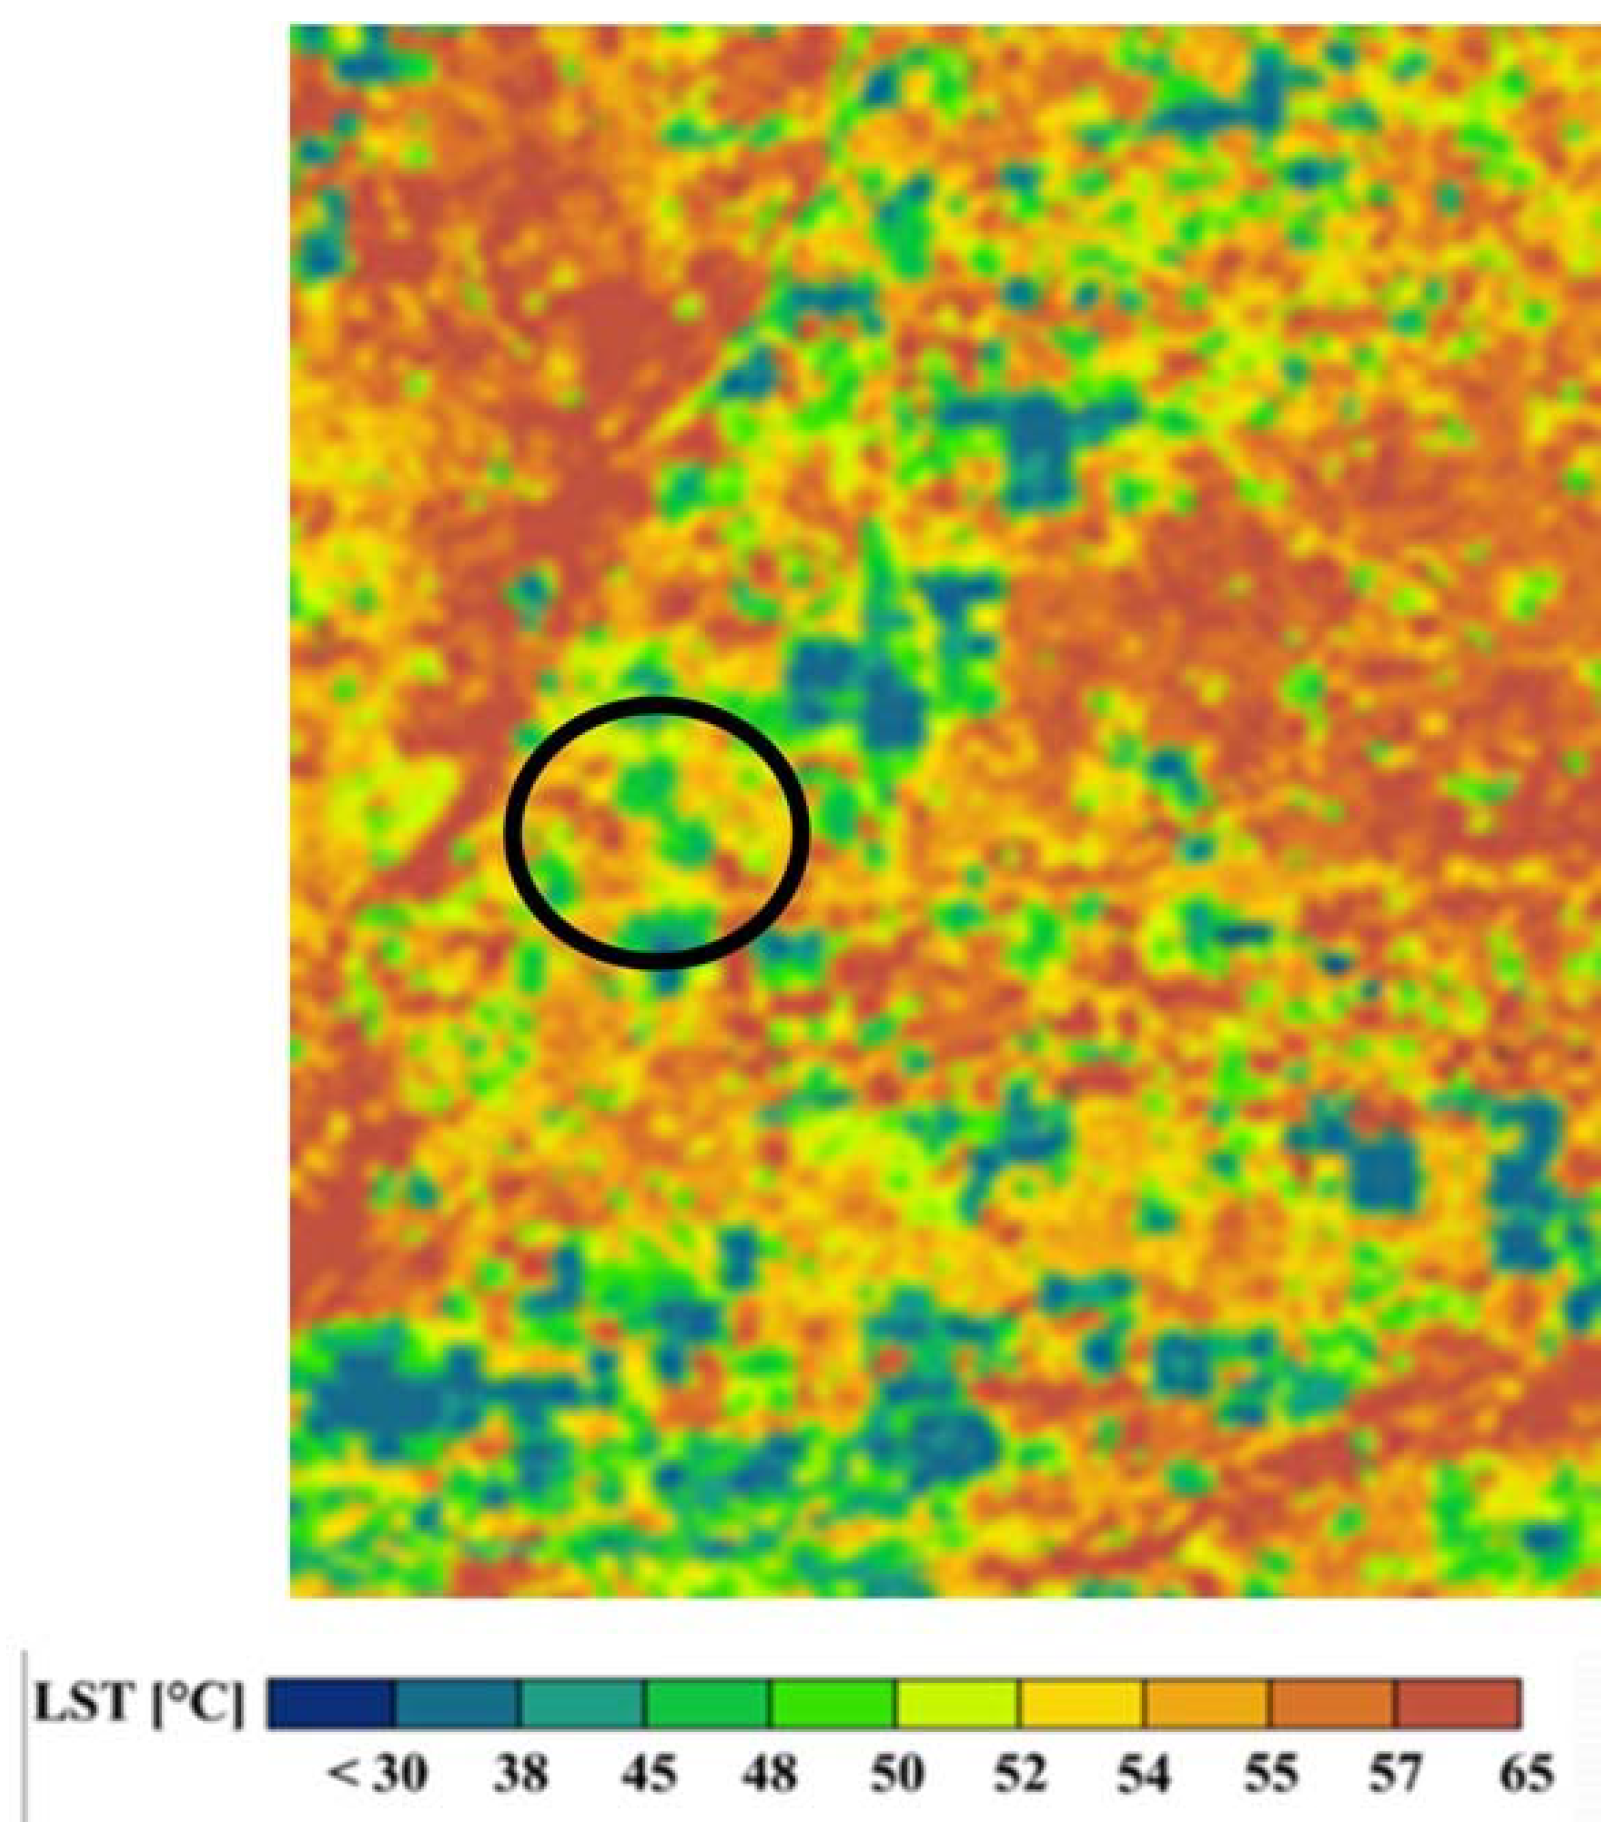
As seen in the daytime satellite image (
Figure 3), Crystal Gardens shows a minimum temperature of 38 °C. The highest temperatures measure 48 °C in the north and 50 °C in the south, with maximum temperatures occurring in the center of the two areas. This variation may be due to the presence of darker, more absorbent materials such as concrete and asphalt in the central regions. The plot of land located in the southwest with surface temperatures of 55–65 °C could also influence the high temperatures in that part of the community.
When we look at the Crystal Point community, temperatures range between 50–57 °C. The coolest places were found closest to Crystal Gardens in the northeastern part of the site, implying an indirect impact from the wetlands. The warmest areas of this site are to the west, near an empty lot with bare ground. Here temperatures reached between 57–65 °C.
Temperatures in Sunrise at Harbor Shore range from 52–57 °C, with high temperatures predominating. The nearby bare lot with temperature readings between 57–65 °C directly influences the community’s temperatures. The northeast area is mostly covered in grass and has the lowest surface temperatures, with temperatures ranging from 48–52 °C. There is a sharp distinction between the temperatures of this community and Crystal Gardens (
Table 1).
The maximum surface temperature of Crystal Gardens (50 °C) is 7 °C cooler than the maximum temperatures in the two non-wetland communities. The minimum temperature (38 °C) is 17 °C cooler than Crystal Point and 14 °C cooler than Sunrise at Harbor Shores. These differences of between 7 °C and 14 °C cooler are significant for Phoenix, which has, on average, around 110 days a year when temperatures are above 37.8 °C [
21].
To evaluate how much of a temperature difference artificial wetlands make on residential areas in desert cities, comparing Crystal Gardens and Sunrise is the best scenario as Sunrise represents a typical Phoenix metropolitan neighborhood. Most Phoenix neighborhoods have a mixture of grass, desert, xeric landscaping, scattered tree cover, and community park/water catchment areas. In the case of Crystal Gardens, the water feature is the major contributor to its cooler temperatures.
3.2. Study Area Temperatures at 10:30 p.m.
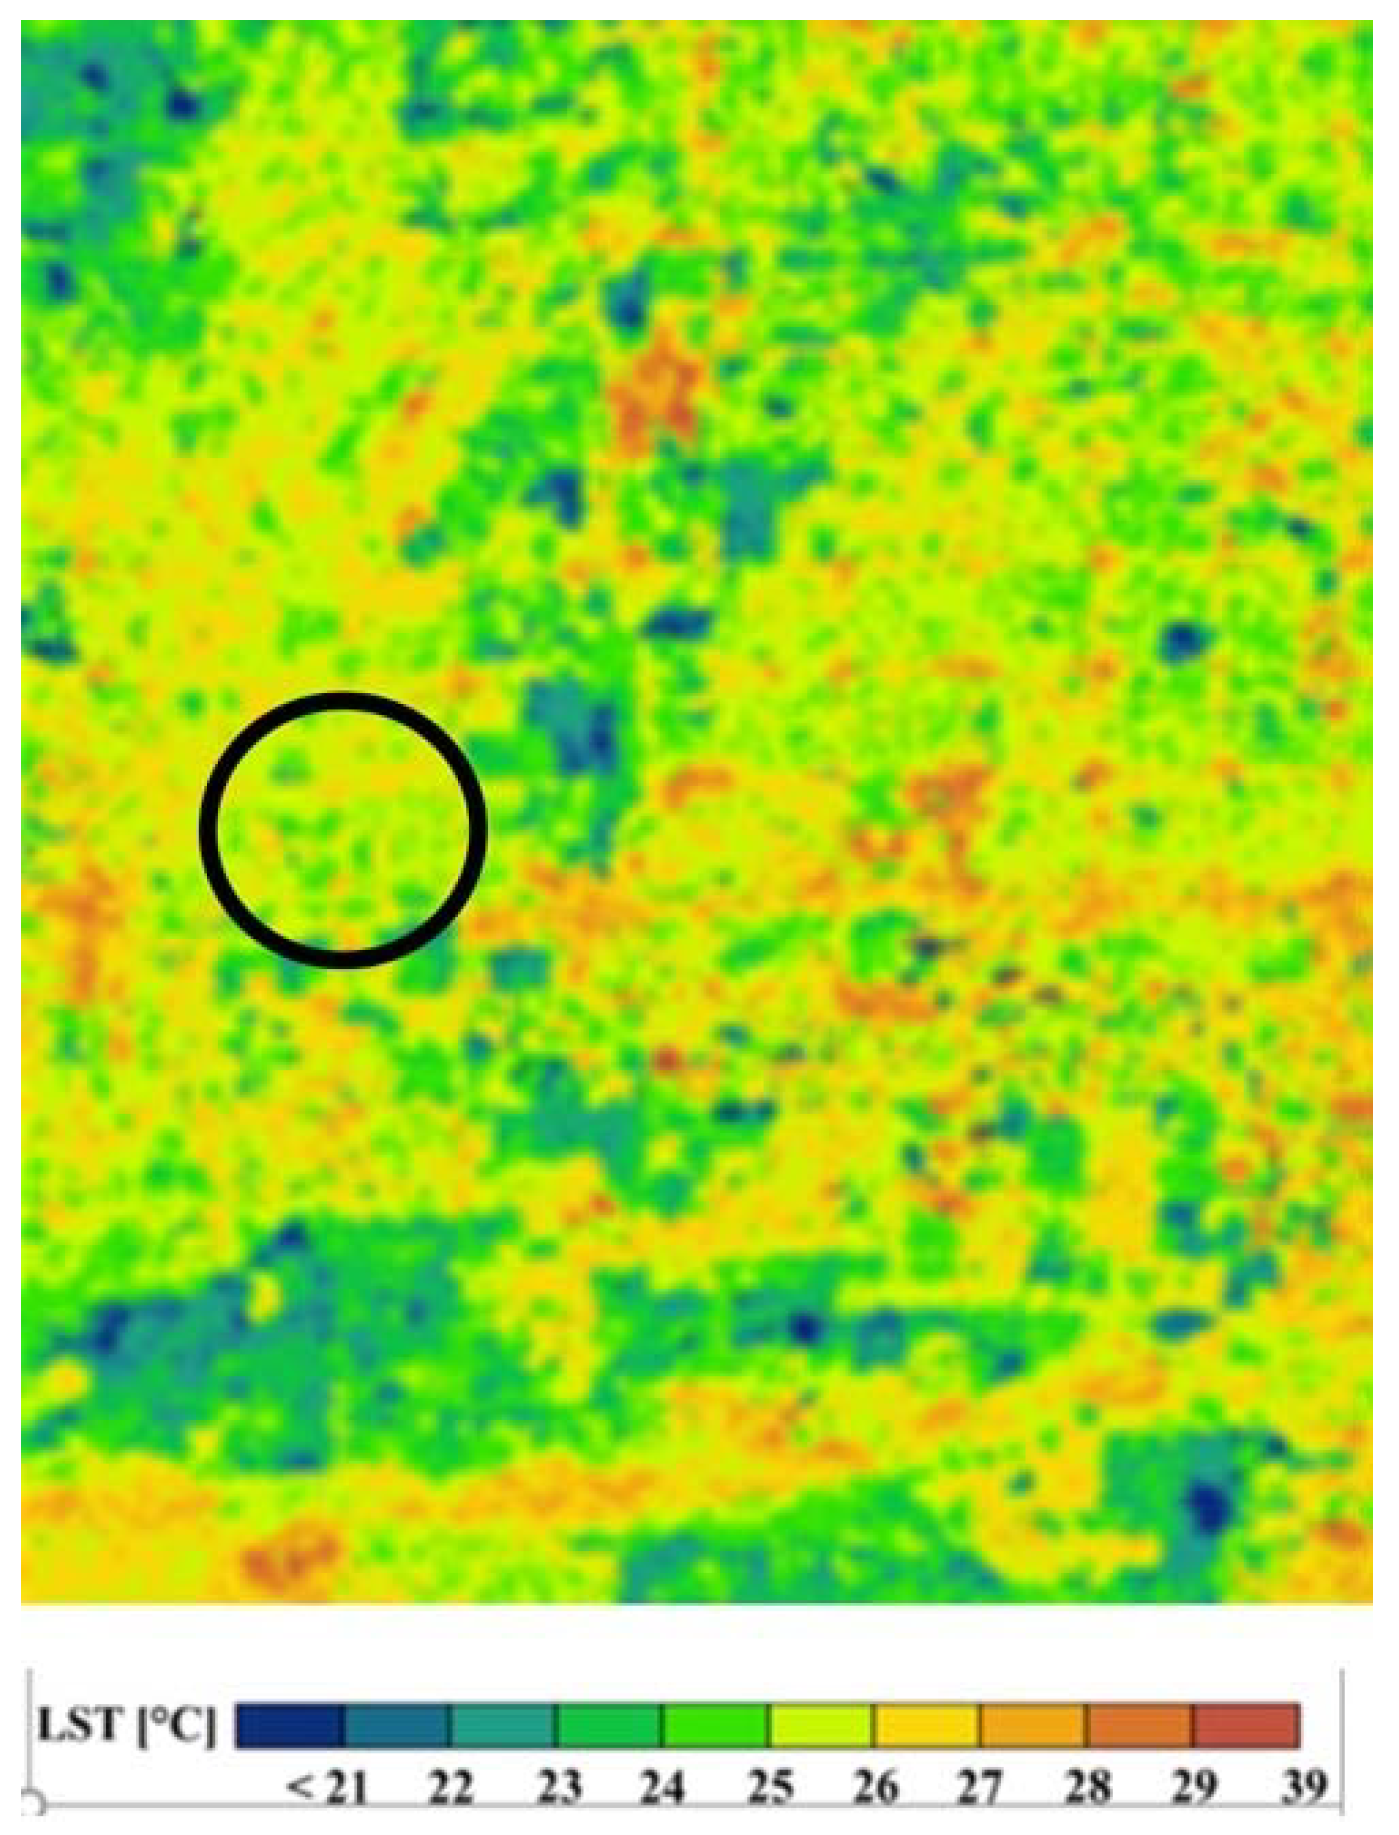
The nighttime satellite image shows a more balanced, smaller range of temperatures in all zones of the study area (
Figure 4). Crystal Gardens has larger patches with lower temperatures between 22–26 °C (
Table 2). These maximum and minimum temperatures are similar in both the north and south sections of the site. However, the nighttime image does not delineate the water distribution or community’s shape to the extent that the daytime image does.
Crystal Point has temperatures that range from 25–28 °C. The exposed lot to the west of this community has temperatures ranging from 25–27 °C. There is no apparent influence from Crystal Gardens or the exposed surface lot in the nighttime image. In Sunrise at Harbor Shores, temperatures range from 24–26 °C. The exposed surface lot to the south of this site has temperatures from 23–25 °C. Nighttime cooling differences of 30 °C (minimum) and 29 °C (maximum) in Crystal Point may be due to the materials absorbing solar radiation during the day and subsequently releasing more heat during the night. This nightly decrease likely affects air as well as surface temperature, impacting human comfort. This dynamic is also occurring at Sunrise at Harbor Shores, which has a nighttime surface temperature cooling difference of between 28–31 °C.
Despite not having the most abrupt cooling among the study sites, Crystal Gardens’ temperatures are generally lower than both of the non-wetland communities. The decreased daytime and nighttime temperatures throughout Crystal Gardens correspond to the water cells’ design and location. Thus, the data support a substantial cooling effect directly resulting from the constructed wetlands. Results suggest that this cooling effect may extend beyond the wetlands’ immediate vicinity, but not to any significant distance.
This analysis only used satellite temperature maps. Surface temperatures for water, asphalt, concrete, and green spaces, among others, were not included. Further research should obtain temperatures for different surfaces in the study communities and assess each material’s potential impacts. It is also essential to consider temperatures at the height of 4–5 feet, which is the height that most impacts human comfort levels. Therefore, the study evaluated temperature differences at these levels by looking at the surface to human comfort temperature levels in neighboring sites in previous years. Comparative data from earlier studies confirm our findings of significant cooling effects at both surface and human comfort levels due to the constructed wetlands. Cooling at the human comfort level is a significant finding. The next section discusses these results in more depth.
4. Discussion
The Crystal Gardens urban design project has been ongoing since 1997. Sustainable aspects include integrating constructed wetlands for wastewater treatment, wetland vegetation, recharge basins for groundwater augmentation, and recreational trails around filtration ponds. Ecosystem benefits include the treatment of water from surrounding lakes and canals to tertiary levels, groundwater recharge that allows additional development rights for the City of Avondale via equivalent external water resources, and tax revenues from the 900+ homes located in the community. Beyond the original project’s objectives of removing nitrates and other toxins and improving groundwater, the area has also become a viable, highly livable neighborhood.
The cooler microclimate provided by the wetlands in the surrounding neighborhood enables residents to enjoy recreational opportunities that are not feasible in extreme heat [
22,
23]. Recreational spaces support mental and physical health and increase general well-being for residents [
24]. The combination of water views, cooler microclimate, and recreational opportunities make a neighborhood more desirable.
Hagen et al. [
25] show that property values have increased in percentage at a faster rate in Crystal Gardens than in most of the Phoenix Metropolitan area. They have also remained higher, even in times of economic downturn. Several factors can explain these positive attributes. This paper focuses on constructed wetlands’ impacts.
To demonstrate how much of a cooling factor the wetlands contributed, we compared Crystal Gardens’ remotely sensed daytime and nighttime surface temperature readings with those from the nearby Crystal Point and Sunrise at Harbor Shores communities. Crystal Gardens’ daytime temperatures were 7 °C lower. Nighttime temperatures were 17 °C lower than Crystal Point and 14 °C lower than Sunrise at Harbor Shores. Based on past comparative data from nearby areas, Crystal Gardens’ air temperatures at 1.5 m from the surface (human comfort height) further drop by between 5 and 12 °C. Thus, the overall cooling effect for Crystal Gardens is significant.
Preliminary data from a survey of Crystal Gardens households [
25] indicate that 35.9 percent of households found the neighborhood “significantly” to “somewhat” cooler. Another question asked residents to rate the area’s comfort around the lakes during the summer months; 42.3 percent answered, “very comfortable” or “comfortable,” with another 41 percent taking a neutral position. Few respondents indicated discomfort.
The results presented here have implications for remote sensing of atmospheric temperatures. During the daytime, surface temperatures are higher than canopy-level air temperatures (1.5 m above the ground). Unfortunately, no historical air temperature measurements are available in the immediate study neighborhoods to determine the constructed wetlands’ effects on air temperature. However, in a 1989 experiment in Phoenix over irrigated grass, asphalt, and concrete surfaces from June through October, Stoll & Brazel [
26] showed the importance of distinguishing surface temperatures from air temperatures.
Around 10:30 a.m., the same time as this study, surface temperatures from the Stoll & Brazel experiment [
26] showed 5–12 °C warmer surface temperatures than air temperatures. Midday surface temperatures were well over 20 °C warmer over dry surfaces and 6 °C over heavily irrigated turf. At 10:30 p.m., differences were only 1–2 °C as winds are typically lighter at night, and the air near the ground takes on the surface temperature characteristics. These results indicate that nighttime surface temperatures approximate canopy-level air temperatures. Therefore, they are used to approximate air temperature effects for the current study.
Findings from the current study indicate that Crystal Gardens’ surface temperatures are 10–12 °C cooler than the two non-wetland sites seen by remote-sensing platforms. The nighttime values indicate only a 1–2.5 °C cooling at Crystal Gardens compared to the others. In the absence of actual observed air temperatures at our sites, we refer to an earlier study that provides insight on possible water and lake effects.
In 1993, Brazel, Verville, and Lougeay [
18] analyzed three weather sites in the Sun City community, located just north of our study sites. These sites included a desert landscape neighborhood, housing immediately abutting an irrigated golf course, and housing on the shore of a lake similar in size to that in our study area. Air temperatures were monitored at canopy-level height (1.5 m) in a weather shelter from September 1987 to August 1988. These data provided insights into expected contrasts among our study sites.
The mean daily air temperatures in late spring and summer (April, May, June, July, and August) between the desert landscape neighborhood and lake exposure housing were 2.3 °C, 1.5 °C, 5.0 °C, 3.0 °C, and 3.1 °C, respectively. The summer cooling range near the lake was 1.5 °C to 5.0 °C. Lake evaporation and effects are at a maximum at this time of year. In fall, winter, and early spring, these differences become less than 2 °C and even reverse where the water retains heat while the land cools.
Regional and local temperatures have substantially changed in the Phoenix metropolitan area since the Avondale project was developed (1997). There are historical weather sites near the study area with long-term data in neighborhoods similar to Crystal Point and Sunrise (e.g., Youngstown and Litchfield Park). Mean temperature changes at these sites from April to August since 1990 are 2.2 °C, 1.7 °C, 2.2 °C, 1.4 °C, and 1.8 °C for Youngstown, and 1.3 °C, 1.4 °C, 1.7 °C, 1.0 °C, and 1.1 °C for Litchfield Park. These changes demonstrate that these neighborhoods have experienced significant warming since 1990. Since lakes do not impact these sites, Crystal Point and Sunrise at Harbor Shores should have similar warming increases.
Based on the Sun City study results, Crystal Gardens’ lakes diminished the significant 28-year warming impacts experienced by the drier communities of nearby Litchfield Park and Youngtown, and Crystal Point and Sunrise at Harbor Shores. This protection points to the considerable mitigative importance and benefits of lakes to the thermal environment in extreme climates such as Phoenix.
5. Conclusions
This study’s findings illustrate that cooling effects and human comfort enhancement are ecosystem service benefits of desert wetlands. Taken together, previous research, survey responses, and study findings suggest that the constructed wetlands lower surface and air temperatures. Of importance for other desert areas considering UHI mitigation strategies, preliminary survey data demonstrates that residents recognize cooling effects and increased comfort levels during summer months. Additional research is needed to understand the impacts of different materials on surface temperatures, current temperatures at 4–5 feet, and human comfort effects.
The study validated Yu et al. [
13] that showed that the presence of water in urban areas results in cooling effects. Data demonstrated significant cooling effects for both morning and nighttime temperatures in the Crystal Gardens neighborhood. These findings support the existing literature. This cooling was not evident around the two study sites without water features, one of which is adjacent to Crystal Gardens and the other is within two miles. The highly concentrated cooling effects near the water feature demonstrate low “threshold” values. This finding needs further investigation.
The importance of this study is that it supports sustainable ecosystem services and socio-ecosystem green infrastructure projects in desert cities. Yu et al. [
13] expressed concern that investments in water and irrigation to reduce heat will put “tremendous pressure on water resources” [
13] (p. 8). Using a constructed wetlands (green infrastructure) approach offered significant ecosystem service benefits in addition to the cooling effects. The study also used earlier temperature data to show human comfort temperatures resulting from the constructed wetlands.


