Article

Effects of Urbanization on Ecosystem Services in the Shandong Peninsula Urban Agglomeration, in China: The Case of Weifang City

1
College of Biological and Agricultural Engineering, Weifang University, Weifang 261061, China
2
Northwest Plateau Institute of Biology, Chinese Academy of Sciences, Xining 810008, China
3
Weifang Agricultural and Rural Technology Promotion Center, Weifang 261061, China
*
Author to whom correspondence should be addressed.
Submission received: 10 May 2021 / Revised: 13 July 2021 / Accepted: 15 July 2021 / Published: 19 July 2021

Abstract

:
Ecosystem services are the material basis of economic and social development, and play essential roles in the sustainable development of ecosystems. Urbanization can remarkably alter the provision of ecosystem services. Most studies in this area have focused on densely populated metropolises with poor ecological environments, while comparatively few studies have focused on cities with low ecological pressures. Therefore, to avoid continuing to engage in the repetitive pattern of destroying first and rehabilitating later, quantitative analyses of urbanization and ecosystem services should be carried out in representative cities. In this study, based on partial least squares-discriminant analysis, kernel density estimation, and correlation analysis, we quantitatively evaluated the impact of urbanization on ecosystem services in Weifang city. The Data Center for Resources and Environmental Sciences at the Chinese Academy of Sciences and the Institute of Geographic Sciences and Natural Resources Research provided remote sensing data on land use, the gross domestic production (GDP), population data, and ecosystem services. The results were as follows: (1) The variation in population, GDP, and built-up areas consistently increased throughout the study period, whereas the ecosystem service values (ESVs) decreased; (2) food production, raw material production, nutrient cycle maintenance, and soil conservation were decisive ecosystem services that led to vast reductions in ESVs during the process of urbanization; and (3) the negative correlation coefficient between built-up areas and ecosystem services was greater than that between the population or GDP and ecosystem services, which indicated that the impacts of population and economic urbanization on ecosystem services lagged behind the impact of land urbanization. This study provides references for fully recognizing the ecological effects of urbanization, and make suggestions regarding the application of ecosystem services in sustainable development.

1. Introduction

Urbanization is a natural historical process for the development of human civilization [1]. It was the second wave to sweep the world after industrialization and has become the direct driving force of global economic transformation and environmental change since the 18th century [2]. A higher degree of urbanization has a significant effect on promoting socioeconomic development [3]. Urbanization is closely related to ecosystem services [4]. By changing land use and land cover, urbanization affects the flows of materials, energy and information, and changes regional ecosystem services for human beings [5,6,7]. Ecosystem services refer to the benefits that human beings obtain from ecosystem functions, which are vital to human life and survival [8], and are the material basis of sustainable economic and social development [9]. The Millennium Ecosystem Assessment reported that 15 of 24 ecosystem services worldwide showed a tendency toward degradation in the last half century [10,11]. Owing to human interference, the provision of ecosystem services decreased by 60% over this time period [12]. Ecosystem services mainly include provision services, regulation services, support services, and culture services. Ecosystem services constrain the urbanized population and economic and social development (i.e., through provision services, regulation services, support services, and culture services).
With their high concentrations of urban population and economic industries, as well as rapid expansions of urban land use, cities have a tremendous impact on the surrounding natural ecosystems [13]. Rapid urbanization, driven by economic development and population explosions, has led to many global ecological problems [5]. Urbanization has a significant impact on the structure, function and spatial evolution of regional ecosystems, and seriously affects the ecosystem services [1]. The major problems associated with urbanization include the unregulated growth of cities [4], the occupation of a large amount of cultivated lands [3], and the triggering of issues such as urban greenhouse gas emission, energy shortages, and heat island effects [9]. Bai et al. (2018) used the principal component analysis method to estimate the comprehensive urbanization level of 281 prefecture-level cities [14]. He et al. (2017) used the entropy method to evaluate the comprehensive urbanization level of Shanghai from 1980 to 2013 [15]. When evaluating the urbanization level of Beijing-Tianjin-Hebei, Wang et al. (2014) weighted and averaged the evaluation results of principal component analysis, the entropy method, and the decision analytical method [16]. An effective method for clarifying the ecological effects of urbanization is to quantify the relationships between ecosystem services and urbanization [17].
Since its reform and opening up, China, which has achieved world-renowned success in urban development, has experienced the largest and fastest urbanization in history, with the ratio rising from 17.9% in 1978 to 56.10% in 2015 [18]. However, while driving economic growth and improving the well-being of humans, urbanization also causes “urban problems”, such as biodiversity loss and heat island effects [19,20]. Rational urbanization will improve ecosystem services, while the opposite will reduce ecosystem services [17]. Cities optimize their ecological environments and enhance their ecosystem services by means of these methods, such as optimizing industrial structures and improving urban management practices. Researchers who have studied natural and human impacts on ecosystem services have reported that most human activities in the Guantian Economic Zone of China are having negative effects on ecosystem services [19]. However, in a study of geographic variations in ecosystem service intensity, the results showed that ecosystem service intensity decreased with the expansion of built-up areas, but population density and urban development had no significant impact on ecosystem service intensity in Fuzhou city, China [21]. Cultivated land is the main provider and maintainer of regional ecosystem services. The expansion of urban construction land and the relative reduction of cultivated areas will inevitably and directly lead to a decline in ecosystem services. The impacts of the industrial outcome and population growth on ecosystem services lag behind those of built-up area expansion. Therefore, the industrial outcome and population growth lead to a decrease in ecosystem service values (ESVs), but due to the lag of their effect on urbanization, population growth and industrial outcome have no statistically significant impacts on ecosystem service intensity. When the spatially non-stationary response of ESVs changes to urbanization was studied, the results showed that increases in the population and economy led to a reduction in ecosystem services; in particular, the impact was stronger in districts close to Shanghai’s city center than in districts far from the city center [20]. A sustainable city is a city that can provide a sustainable welfare to its residents under certain social and economic conditions, based on the premise that the urban ecosystem services do not decrease. Therefore, guided by urban ecological theory, researchers in the field of ecology and related disciplines have focused on analyzing urban ecosystem services and functions, as well as their regulatory mechanisms.
Weifang city, located in the middle of Shandong Peninsula, is the regional center of the Shandong Peninsula city cluster [22]. With a good foundation of ecological protections, it was successively awarded the “National Garden City”, “National Environmental Protection Model City”, and “National Sanitary City” titles. Situated at the crucial intersection of two major national strategic economic zones (i.e., the Yellow River Delta Efficient Ecological Economic Zone and Shandong Peninsula Blue Economic Zone), Weifang is an emerging economic city in China, with investment potential and development vitality [23,24]. Most of the current studies have focused on densely populated metropolises with poor ecological environments [17,20], but cities under less ecological pressure should be given much more attention to avoid continually engaging in the repetitive pattern of destroying first and rehabilitating later [1,5,12]. To date, there has been no holistic research on Weifang to clarify the local ecosystem services, or their spatial patterns or responses to urbanization.
Therefore, the main purposes of this study were to (1) quantitatively analyze the spatial distribution of ecosystem services; (2) assess the distribution characteristics of ecosystem services and urbanization indicators; and (3) evaluate the relationships between ecosystem services and urbanization indicators. In this study, there were two research problems to be solved: What is the impact of urbanization on ecosystem services in Weifang? Which ecosystem services play a decisive role in the process of urbanization?

2. Materials and Methods
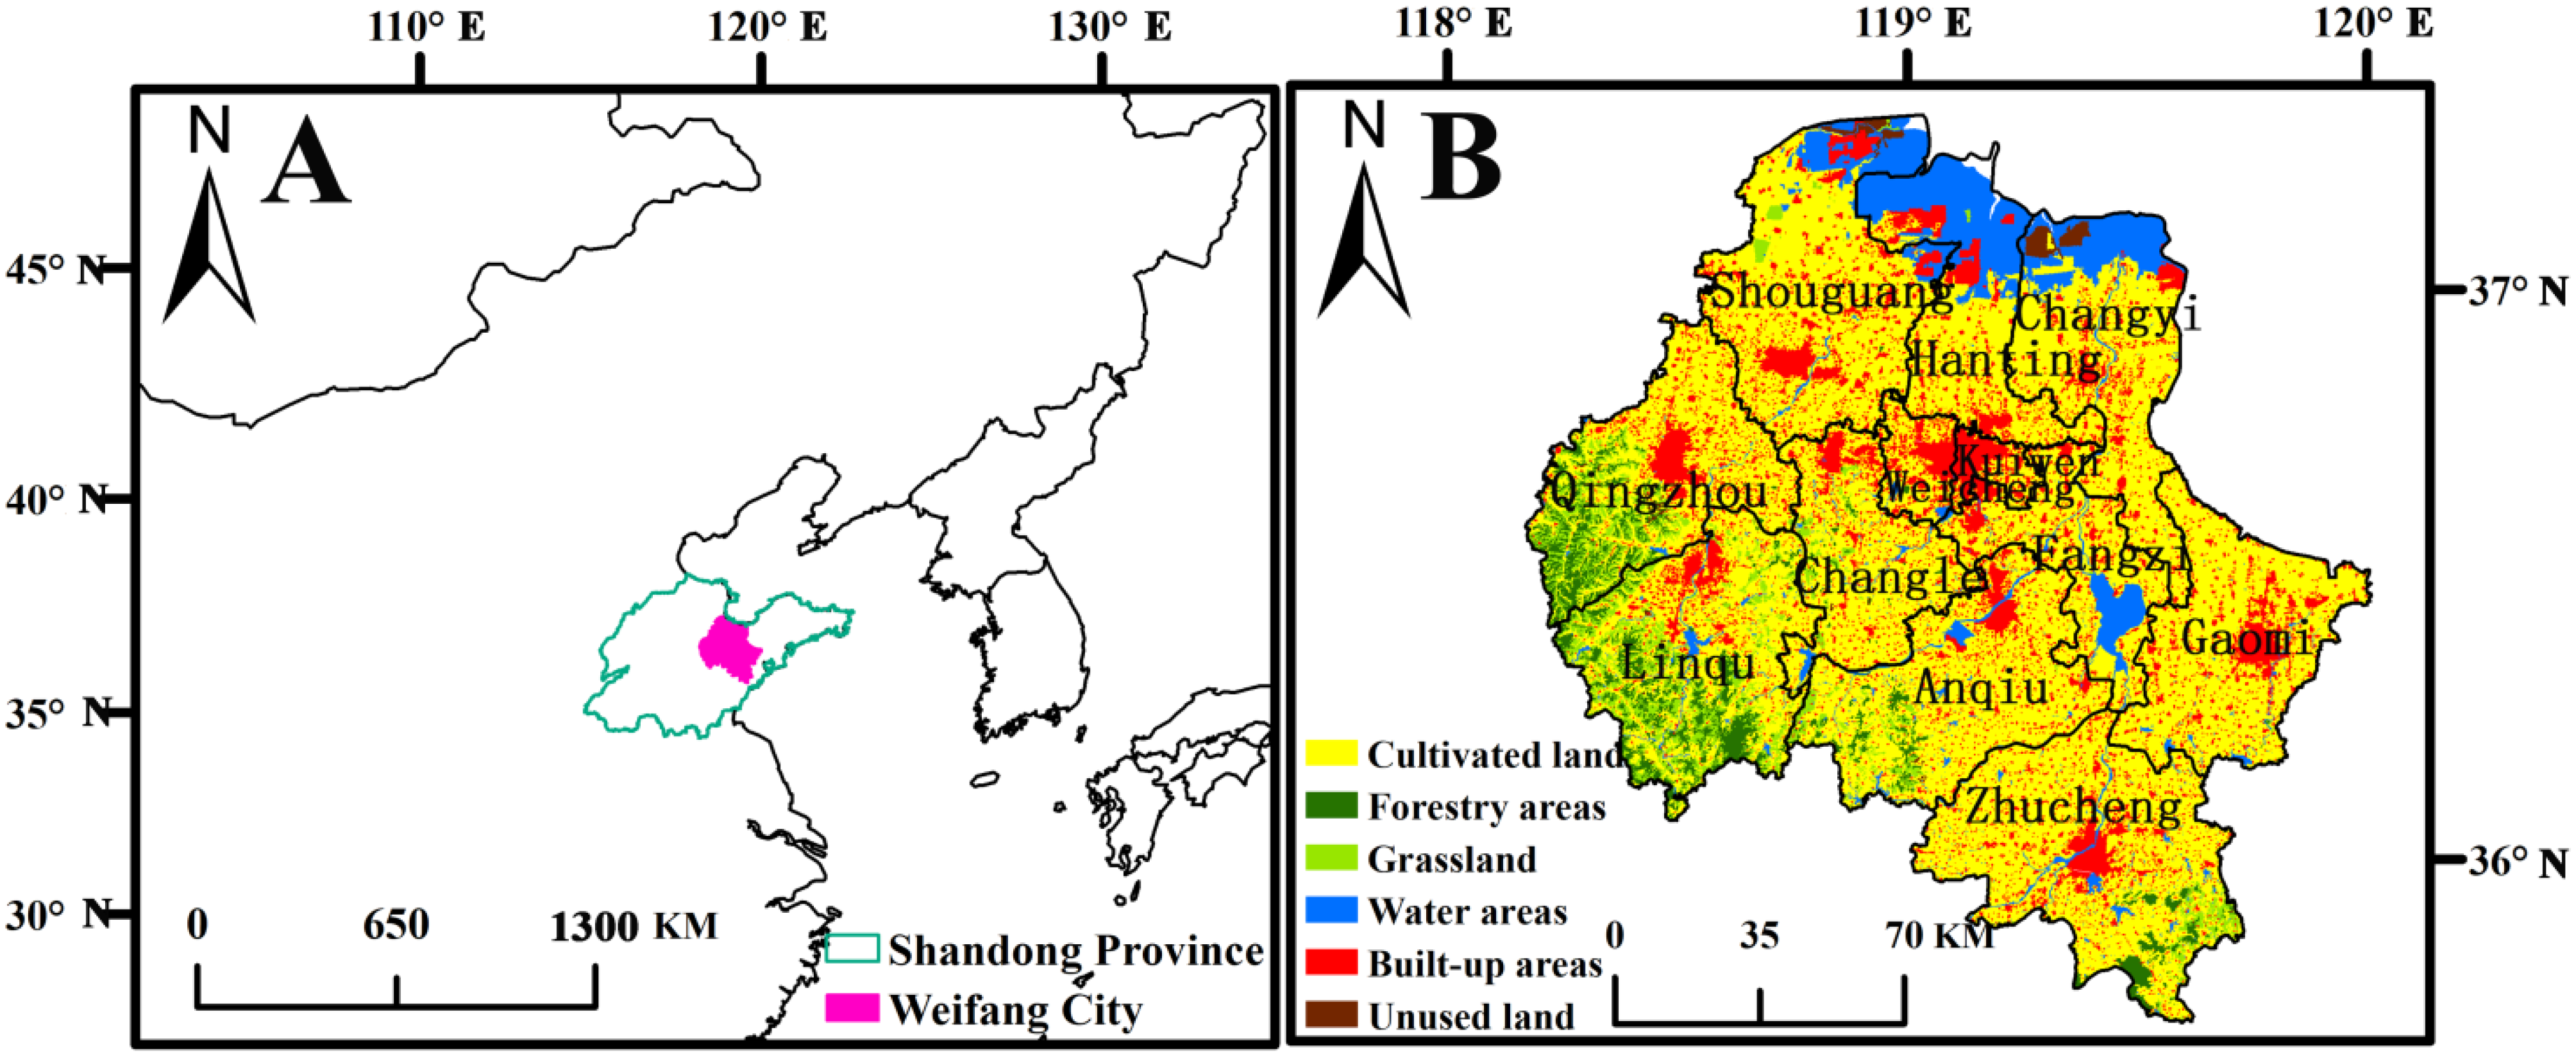
2.1. Study Area

Our study area was in Weifang city, Shandong Province (Figure 1A). Weifang city has a warm temperate monsoon sub-humid climate, an annual average precipitation of 600 mm, an annual average temperature of 13 °C, and approximately 180–200 days in each year are frost-free [25]. Weifang city has a total area of 15,859 km2, including six cities (Anqiu, Changyi, Gaomi, Qingzhou, Shouguang, and Zhucheng), four districts (Fangzi, Hanting, Kuiwen, and Weicheng), and two counties (Changle and Linqu) (Figure 1B). Cultivated land and built-up areas are the main land use types (Figure 1B), accounting for 66.77% and 15.56% of the total area, respectively, in 2015.

2.2. Data Sources

We used remote sensing data on land use with a 30-m spatial resolution in 2015 (The data of 2020 were unfinished at the time of writing this manuscript). The Resource and Environment Science and Data Center at the Chinese Academy of Sciences provided these land use status data. This dataset is the most accurate remote sensing monitoring data product comprising land use in China, and has played an important role in national land resource surveys, as well as hydrological and ecological research [26,27]. The land use information, which is from Landsat TM/ETM data, was extracted by using manual visual interpretations, and the images were geometrically corrected and georeferenced. After this, the average location errors were less than 50 m [28]. The field survey and random sample check confirmed that the average interpretation accuracy for land use/land cover exceeded 90% [29,30,31]. Based on the land resources and their utilization attributes, the first-level classifications of land use type were separated into cultivated land, forestry areas, grassland, water areas, built-up areas, and unused land [28].
The Institute of Geographic Sciences and Natural Resources Research provided the gross domestic production (GDP) and population data of 1-km grids. In these datasets, many factors closely related to GDP and population, such as land use type, light intensity values at night, and densities of residential areas, were comprehensively considered [10,31].
In this study, the ecosystem service data of Weifang were obtained from the Dataset on the Spatial Distributions of Terrestrial Ecosystem Services [32], which was provided by the Institute of Geographic Sciences and Natural Resources Research, Chinese Academy of Sciences. Based on the net primary productivity, precipitation, and soil conservation spatial distribution data, the equivalent factor value of ecosystem services was adjusted [12]. The details of the method are provided in Appendix A and Table S1. Based on the remote sensing classification of terrestrial ecosystem types in China, the dataset calculates the values of 11 ecosystem services, including food production, raw material production, water supply, gas regulation, climate regulation, environment purification, hydrology regulation, soil conservation, nutrient cycle maintenance, biodiversity maintenance, and aesthetic landscape provision (Table S2). The data unit of the ESVs is yuan/km2.
Measuring regional ecosystem services using monetary value is an important tool for managing and developing land resources [33]. The Dataset on the Spatial Distributions of Terrestrial Ecosystem Services was used in this study, and it referred to the method of Costanza et al. (1997) and Xie et al. (2008) [8,34]. It is undeniable that the method proposed by Costanza et al. (1997) and the modification proposed by Xie et al. (2008) have proven to be reliable in many studies [33]. The monetary method provides sufficient information for both the government and stakeholders. More importantly, it provides a useful perspective for understanding the interactions of human–environmental systems [12,35].

2.3. Statistical Analysis

Urbanization can be embodied by the population, economy, construction land, and living standards [17,36]. Economic development is the basis of urbanization, and population growth and built-up area expansion are its concrete embodiments. The improvement of living standards is the ultimate goal or result of urbanization, and can be represented by population growth, economic development, and built-up area expansion [36,37]. Therefore, the urbanization indexes selected in this study included three aspects: population size, to represent population urbanization; the economic development level, to reflect economic urbanization; and the area of built-up areas, to describe land urbanization. In addition, if the variation in a unit size was quantified by gross quantity indicators, this would affect the comparison of the urbanization levels. To remove this effect, the urbanization indicator was processed to obtain a density value [6,38,39]. Herein, the population density (person/km2), GDP density (104 yuan/km2), and built-up area proportion (%) were selected to quantify population urbanization, economic urbanization, and land urbanization, respectively.
Partial least squares-discriminant analysis is a combination of partial least squares regression and the discrimination analysis for classification tasks [31,40]. By reducing the influence of multicollinearity among indices, partial least squares-discriminant analysis makes the analysis of the relationship between independent and dependent variables more reasonable [41]. More importantly, the variable importance in the projection (VIP) score indicates the influence of independent variables on dependent variables [10,42], and the equation is
V I P j = p h = 1 m R d ( Y ; t h ) ω 2 h j R d ( Y ; t 1 , , t m )
where V I P j represents the V I P j value of the j-th index, p is the number of selected index variables, m is the extracted principal component number, R d ( Y ; t h ) represents the explanatory power of axis t h on Y , ω 2 h j is the j-th weight of axis ω h , and R d ( Y ; t 1 , , t m ) represents the cumulative explanatory power of axis t 1 , , t m on Y . Based on partial least squares regression, the V I P value is a variable selection method [43]. If each independent variable has the same explanatory effect on the dependent variable, the V I P value of all independent variables is equal to 1. If the V I P of an independent variable is smaller (i.e., V I P < 1 ), it indicates that the variable contributes little to the model. If the V I P is relatively larger (i.e., V I P > 1 ), the contribution of the independent variable to the dependent variable is especially significant [31,44]. In this study, partial least squares-discriminant analysis was applied to differentiate the ecosystem services of Weifang at a spatial scale.
Kernel density estimation, as a nonparametric estimation method, has the advantages of the arbitrary setting of a function form and fewer restrictions on the data distributions of the dependent variables and independent variables compared with parametric estimation [45]. The algorithm is as follows:
Assuming that X 1 , X 2 , , X n obeys the same distribution, the empirical distribution function of the sample is
F n ( x ) = 1 n { T h e n u m b e r o f X 1 , X 2 , , X n t h a t i s l e s s t h a n x }
If the function is a uniform kernel, then
K ( x ) = { 1 2 1 x 1 0 O t h e r w i s e
Therefore, the kernel density function estimation formula is as follows:
f ^ n ( x ) = [ F n ( x + h n ) F n ( x h n ) ] 2 h = x h n x + h n 1 h n K ( t x h n ) d F n ( t ) = 1 n h n i = 1 n K ( x x i h n )
where n is the number of samples and h is the bandwidth. The bandwidth is mainly used to control the smoothness of the kernel density estimation and is selected to minimize the mean square error.
In general, the kernel function is required to satisfy the following conditions:
{ K ( x ) 0 , + K ( x ) d x = 1 sup K ( x ) < + , + K 2 ( x ) d x < + lim x K ( x ) x = 0
The kernel density estimation makes full use of the information contained in the data and avoids subjective prior knowledge to achieve the maximum approximation of the sample data [46]. In this study, the distribution characteristics of the ESVs, population, GDP, and built-up areas in the towns of Weifang were intuitively studied through kernel density estimations. Because of the size of the raw values, the logarithms of ESVs, population density, and GDP density were used for kernel density estimations and relationship analysis [47].

3. Results

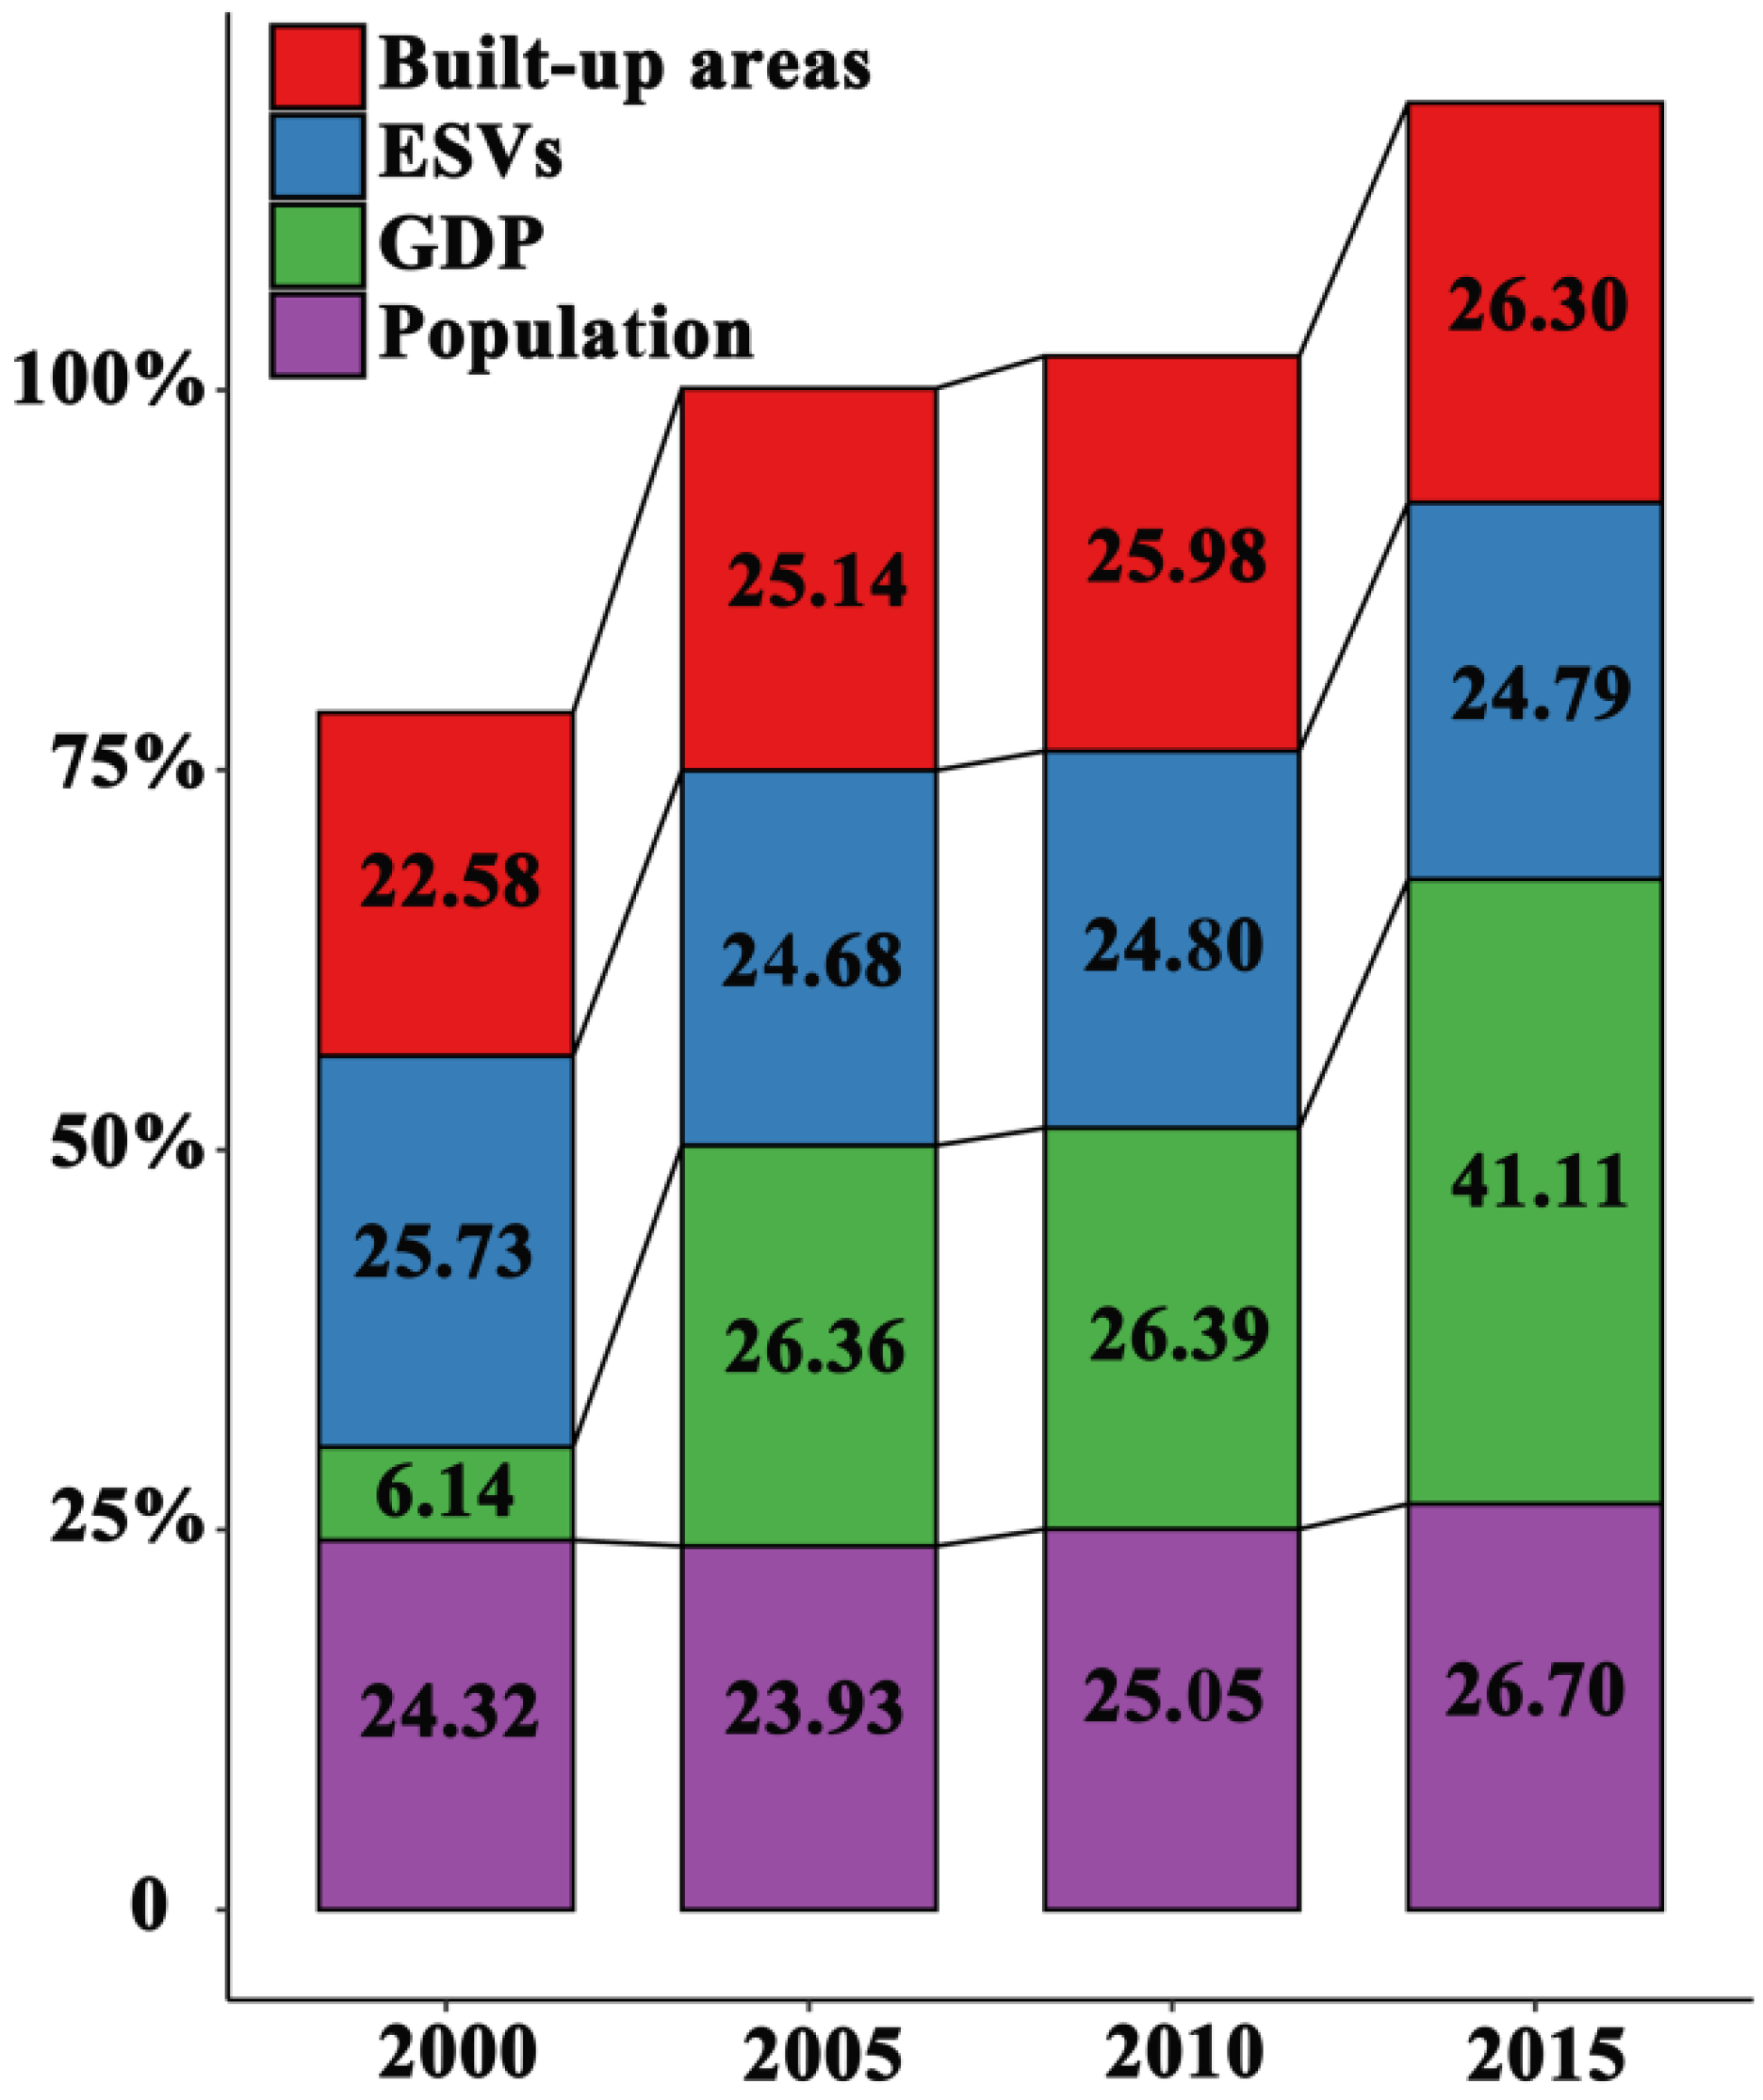
3.1. Trends of ESVs, Population, GDP, and Built-Up Areas in 2000–2015

From 2000 to 2015, the variations in population, GDP, and built-up areas continuously increased (Figure 2). The changes in GDP were the most dramatic, accounting for 6.14%, 26.36%, 26.39%, and 41.11% in 2000, 2005, 2010, and 2015, respectively. Compared with its value in 2000, the GDP had increased by 34.97% in 2015. The built-up areas accounted for 22.58%, 25.14%, 25.98%, and 26.30% in 2000, 2005, 2010, and 2015, respectively. The population accounted for 24.32%, 23.93%, 25.05%, and 26.70% in 2000, 2005, 2010, and 2015, respectively. Compared with their 2000 values, the built-up areas and population had increased by 3.72% and 2.38%, respectively, in 2015. However, the variation in ESVs consistently decreased from 2000 to 2015. The ESVs accounted for 25.73%, 24.68%, 24.80%, and 24.79% in 2000, 2005, 2010, and 2015, respectively. In 2015, the ESVs were 0.94% lower than in 2000.

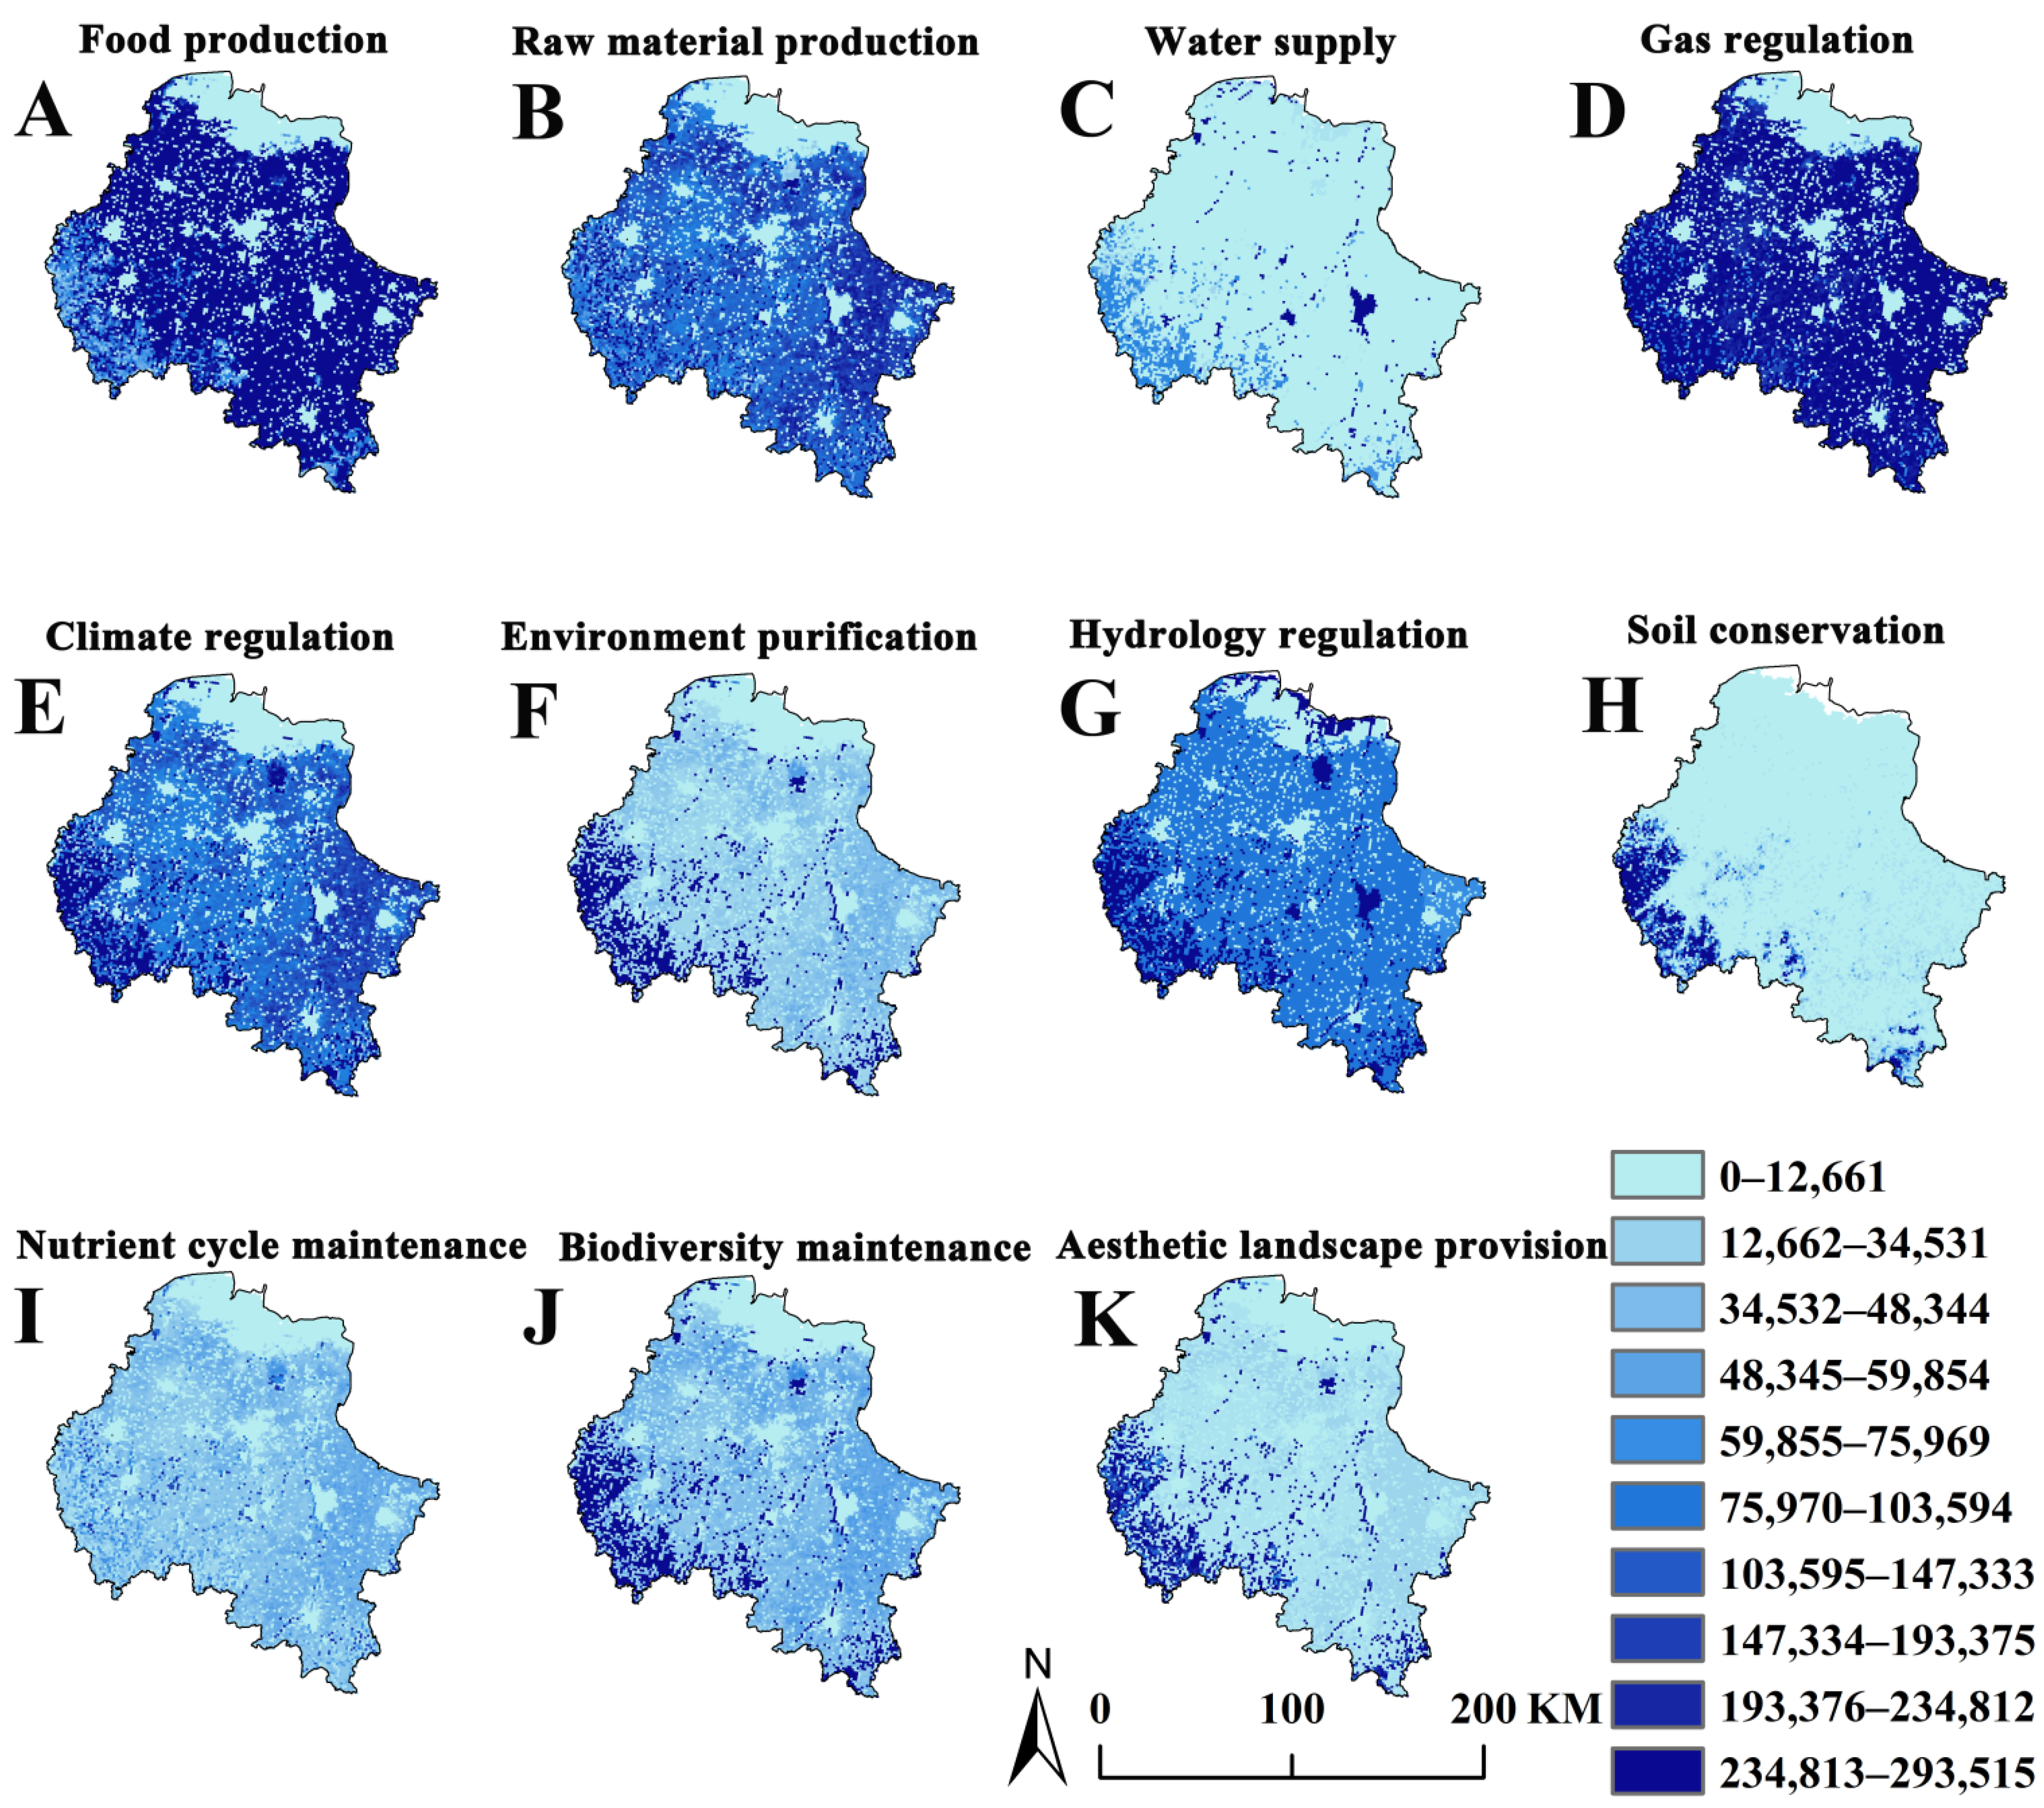
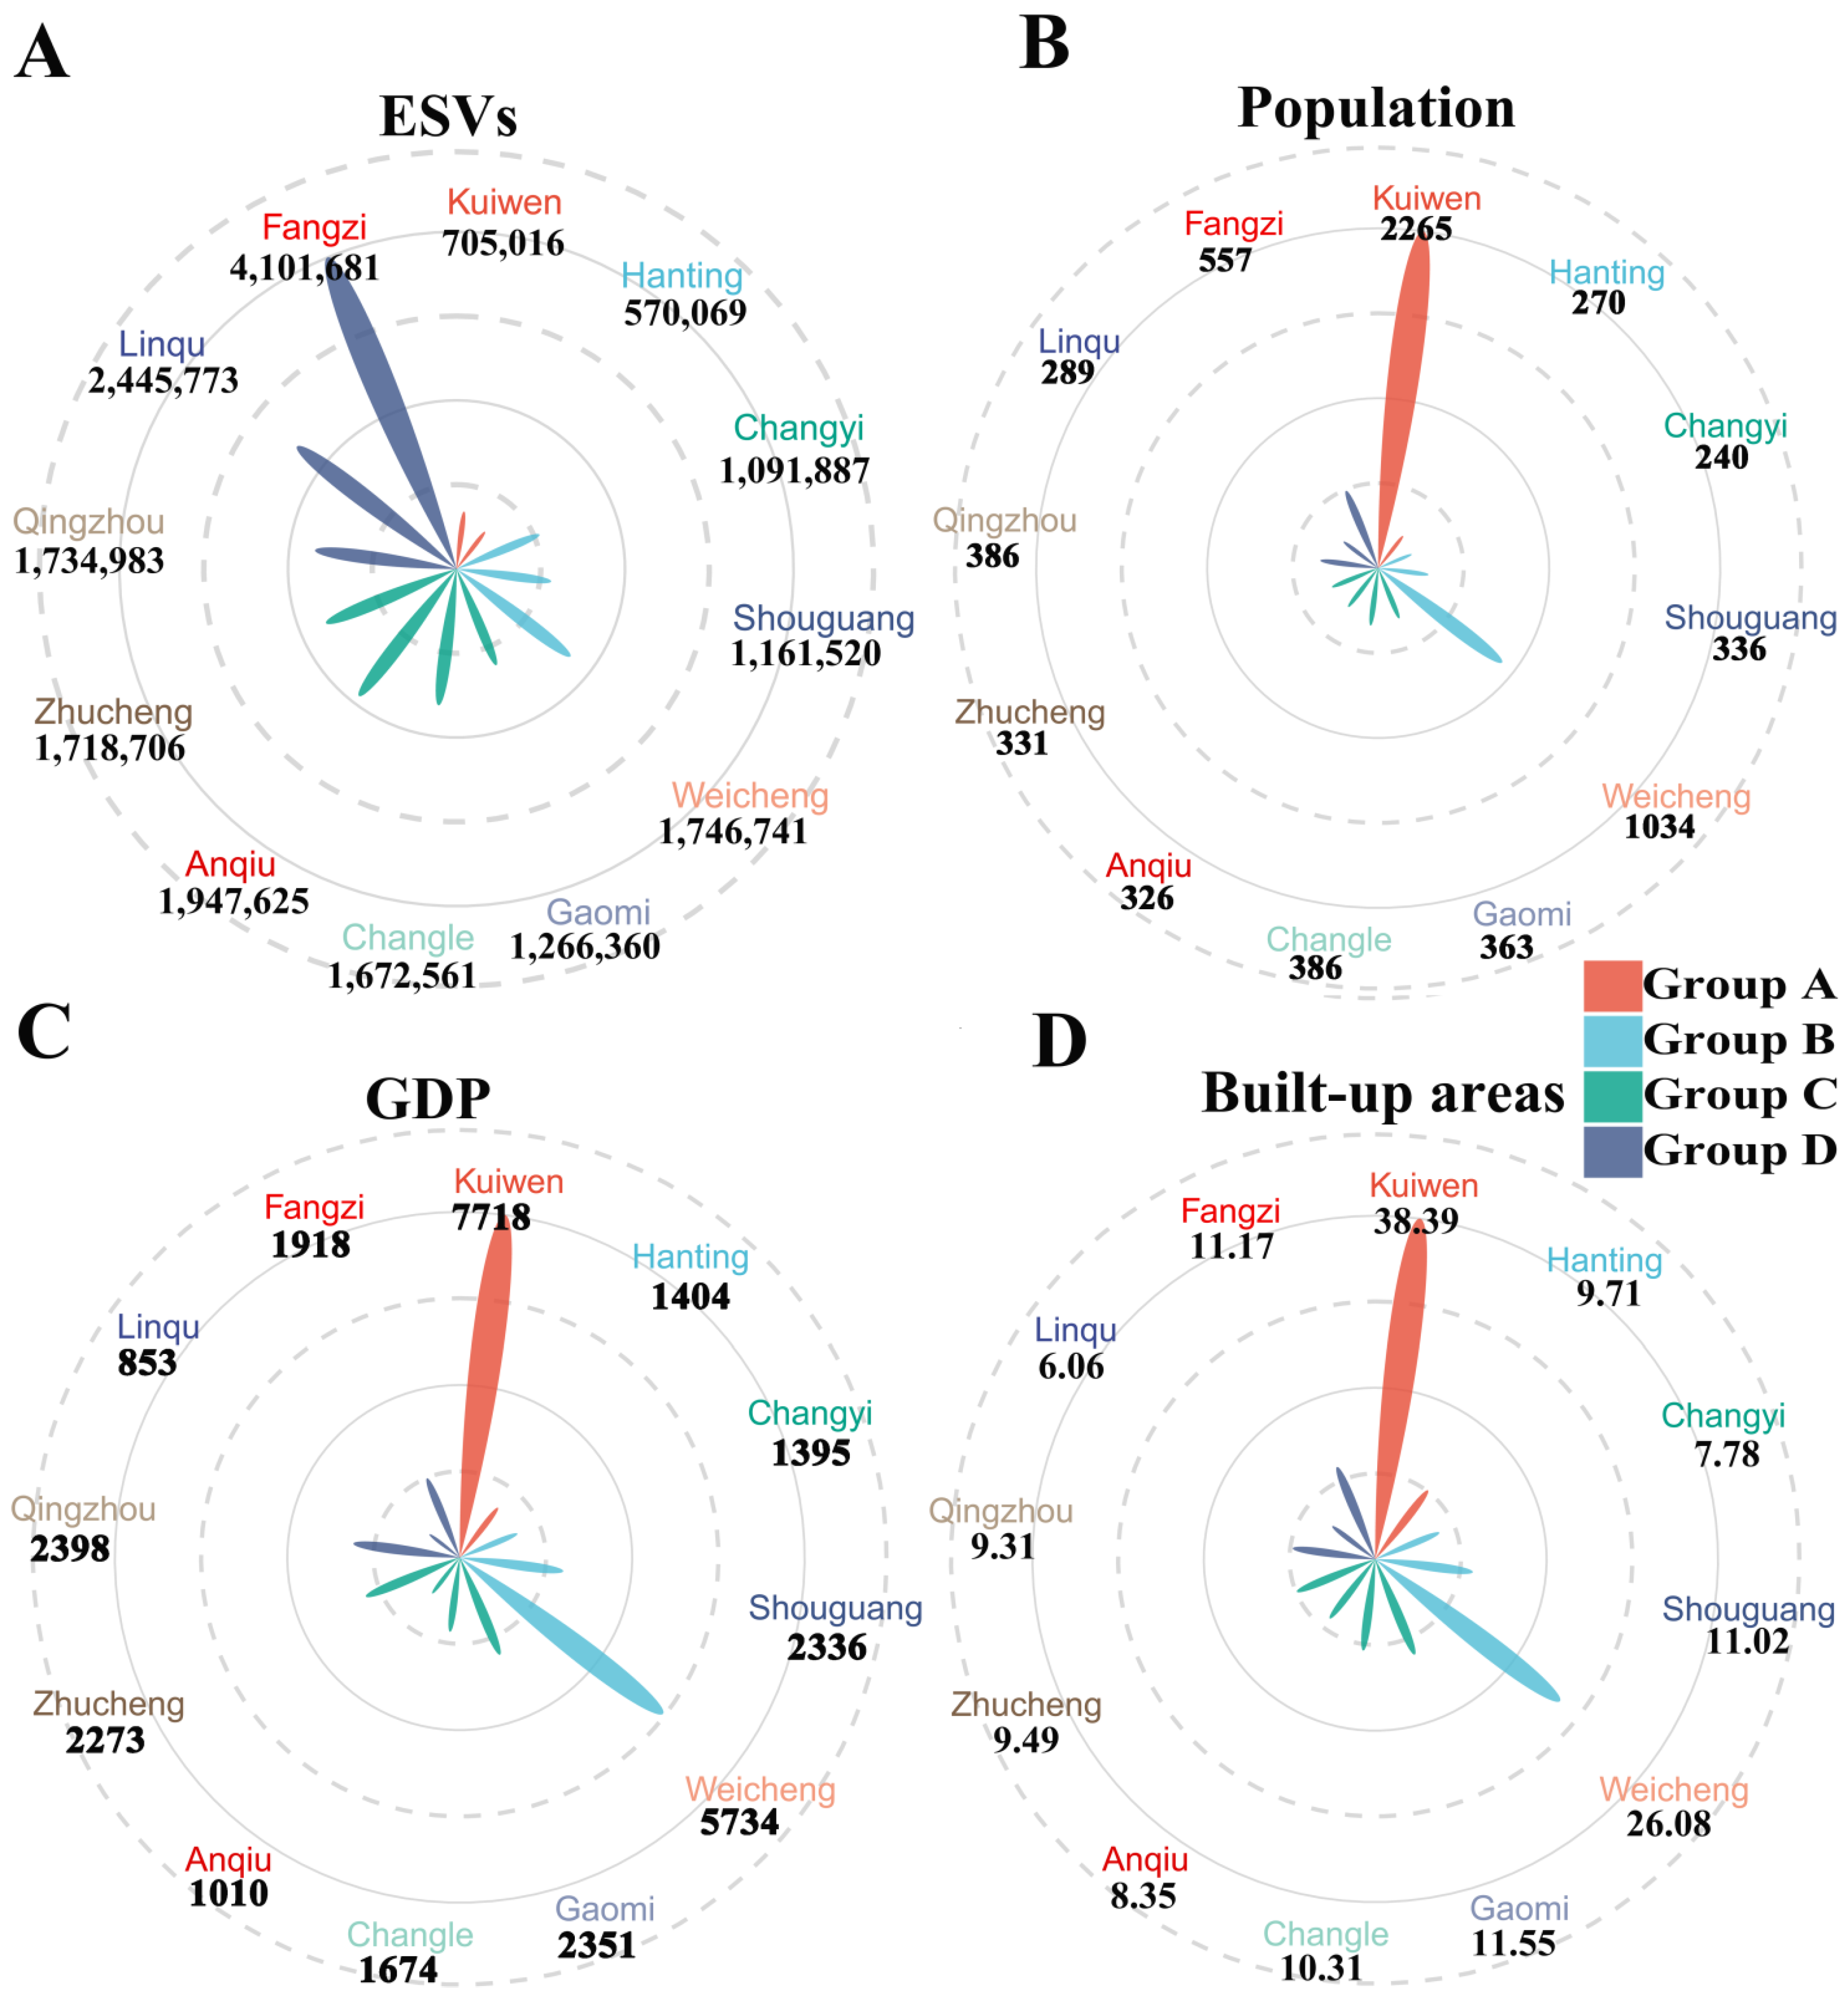
3.2. Spatial-Scale Analysis of Ecosystem Service Subtypes

The ecosystem service subtypes showed significant spatial trends, from 0 yuan/km2 to 293,515 yuan/km2 (Figure 3). In terms of the ecosystem service subtypes, food production, raw material production, gas regulation, climate regulation, and hydrology regulation showed significant spatial variations (Figure 3A,B,D,E,G), while environmental purification, soil conservation, biodiversity maintenance, and the aesthetic landscape provision showed fewer spatial changes (Figure 3F,H,J,K). The water supply and nutrient cycle maintenance showed almost no clear differences in 2015 (Figure 3C,I).
Based on the score scatter plot (Figure 4A), the goodness of fit (i.e., R2 = 0.76) indicated a high discriminative ability of the partial least squares-discriminant analysis. The 12 regions were clearly separated into four groups: Group A, including Hanting and Kuiwen; Group B, including Changyi, Shouguang, and Weicheng; Group C, including Anqiu, Changle, Gaomi, and Zhucheng; and Group D, including Fangzi, Linqu, and Qingzhou. The loading scatter plot of the partial least squares-discriminant analysis (Figure 4B) shows the relationship between the independent and dependent variables. Herein, the independent variable were the 11 ecosystem service subtypes, and the dependent variable were the 12 regions of Weifang. The closer the distance between the dependent variable and the independent variable, the closer the relationship between the dependent variable and the independent variable, that is, the more value of ecosystem service the dependent variable possesses. As shown in Figure 4B, Group D was closer to more ecosystem service subtypes than the other groups, whereas Group A, Group B, and Group C were farther away from these subtypes. That is, Group D had the most ESVs, and Group A, Group B, and Group C had fewer ESVs. It is worth noting that an important discriminative variable usually has a VIP score greater than 1. The VIP values of FP (food production), RMP (raw material production), NCM (nutrient cycle maintenance), and SC (soil conservation) were greater than 1 (Figure 4C), and their scores were 1.37, 1.19, 1.16, and 1.12, respectively, which indicated that the classifications of these 12 regions were different from each other on the spatial scale.

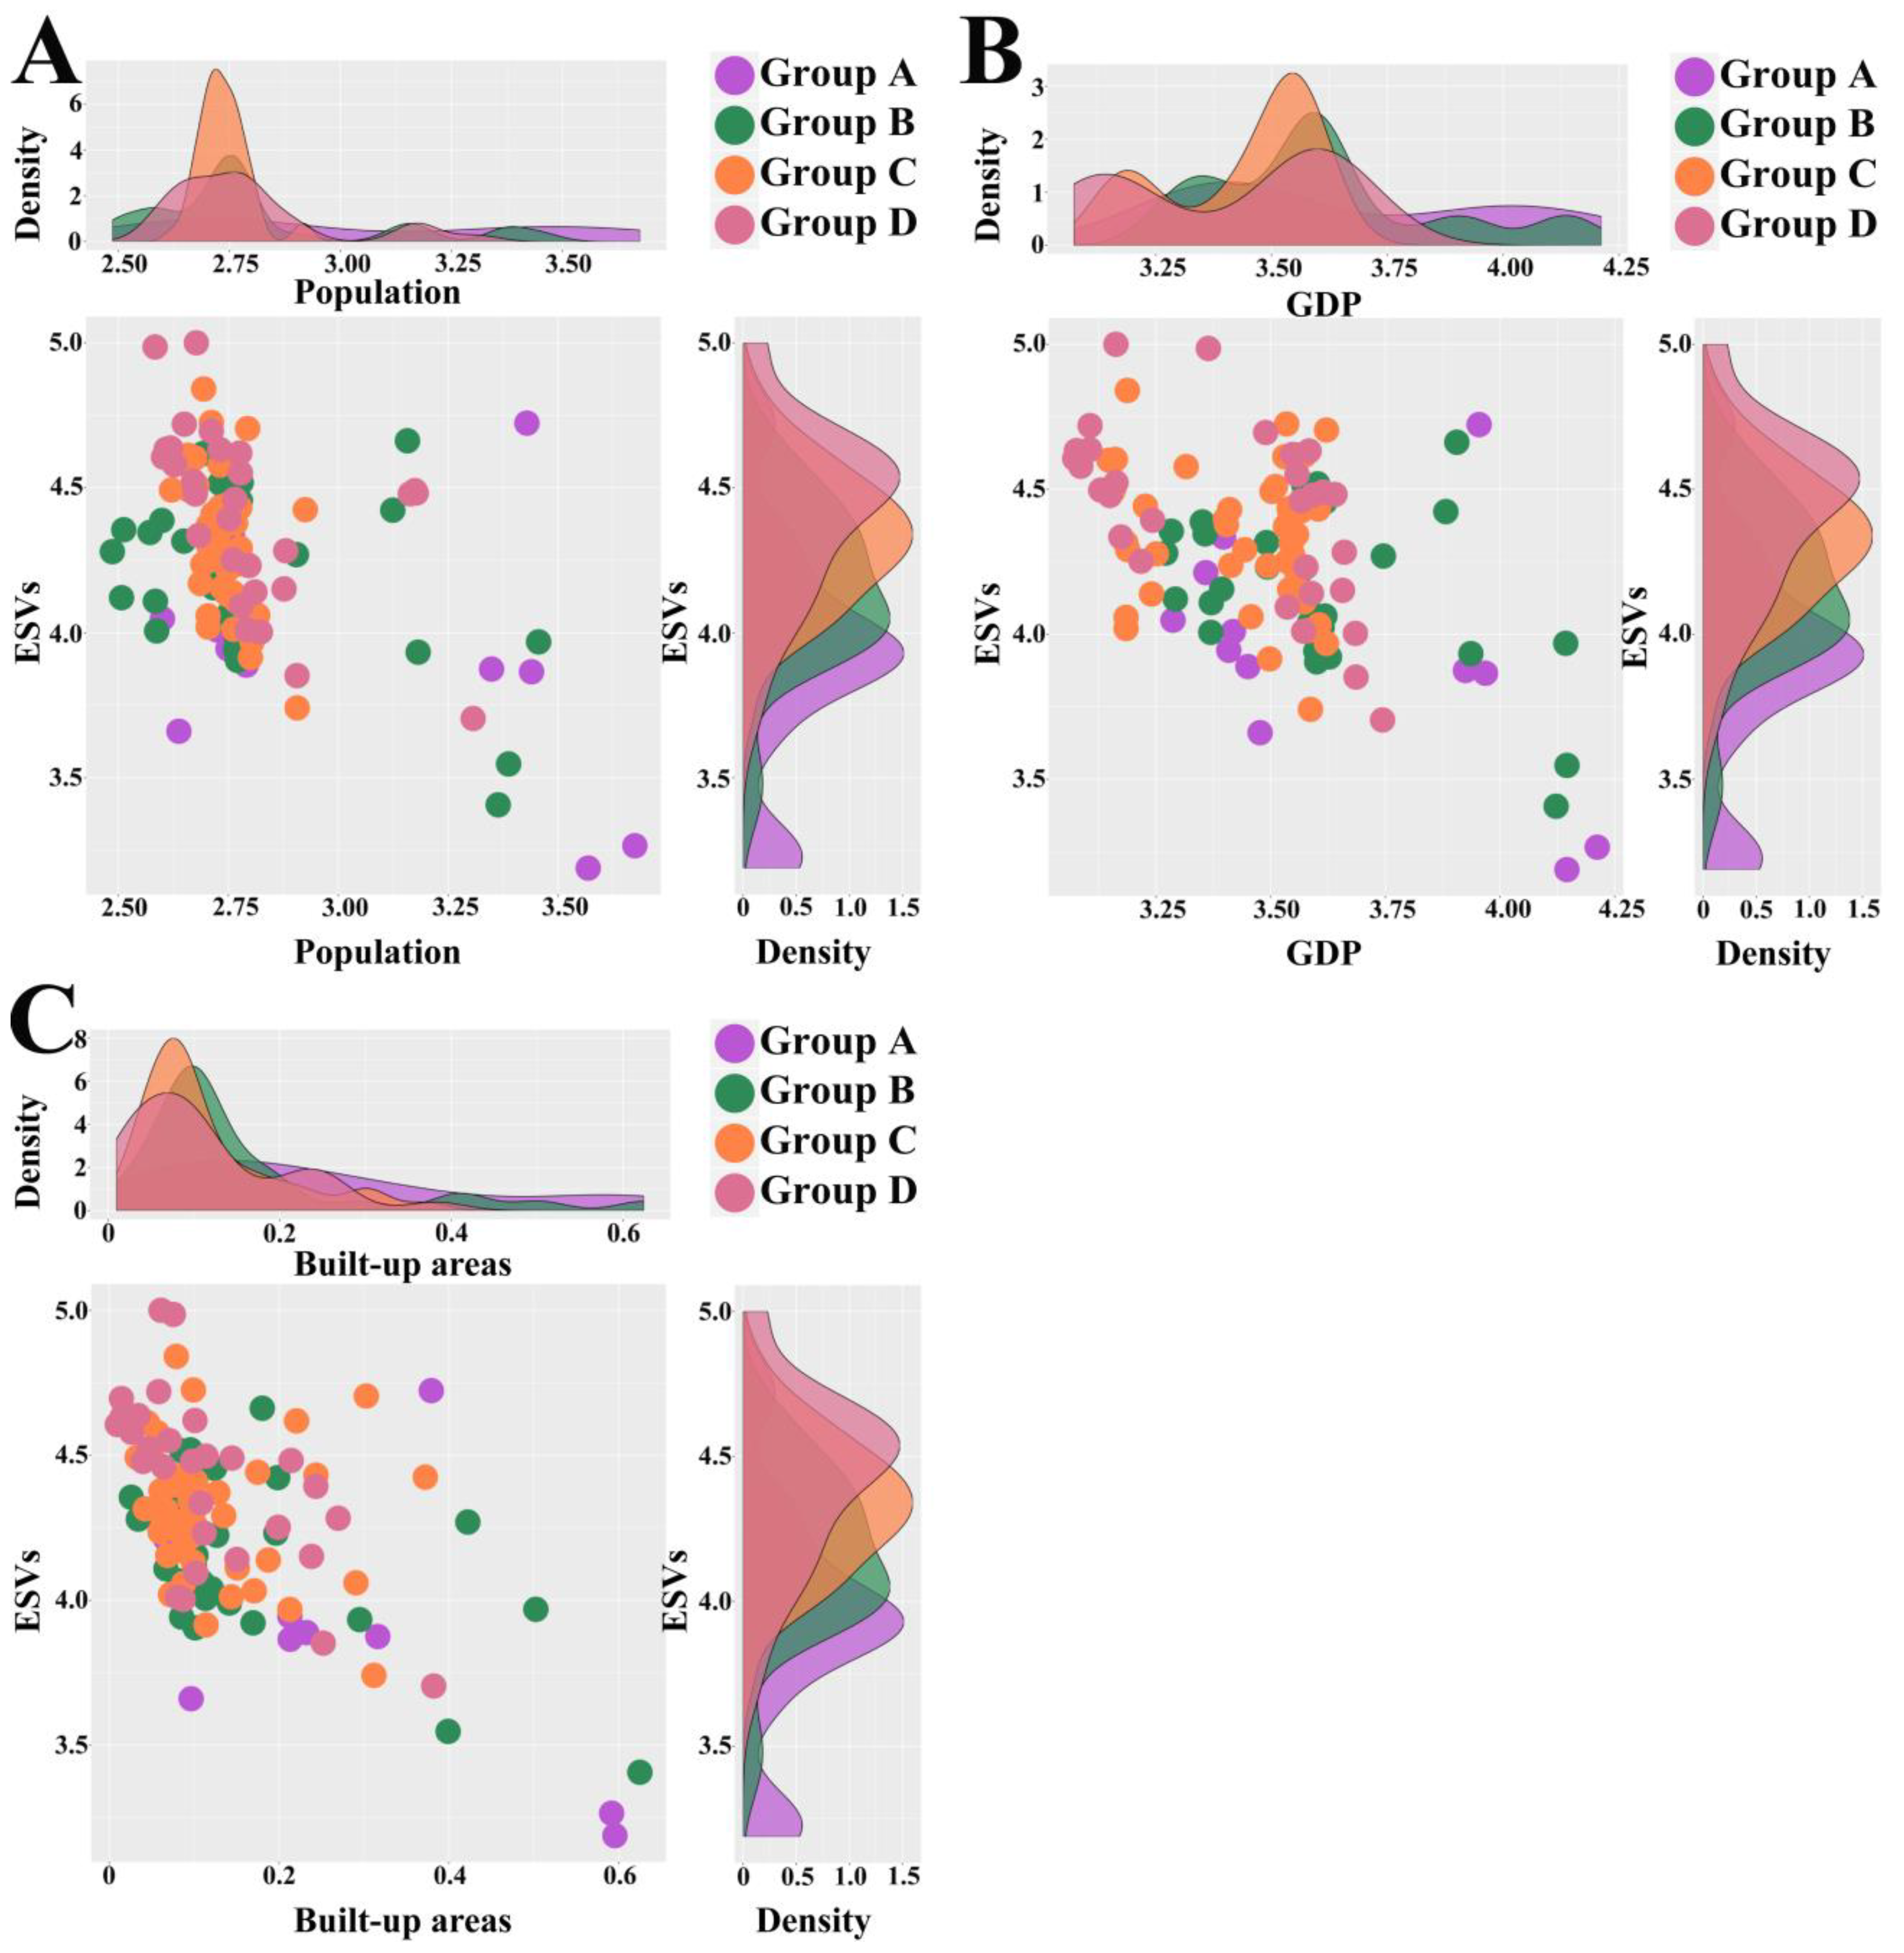
3.3. The Distribution Characteristics of ESVs, Population, GDP, and Built-Up Areas

In terms of ESVs (Figure 5A), compared with the other regions, Fangzi of Group D had the highest value, 4,101,681 yuan/km2; the second-highest was Linqu of Group D, whose value was 2,445,773 yuan/km2, whereas Hanting of Group A had the lowest value, at 570,069 yuan/km2. For population (Figure 5B), Kuiwen of Group A had the highest value, 2265 person/km2; then Weicheng in Group B had the second-highest value, at 1034 person/km2; while Changyi of Group B had the lowest population, with a value of 240 person/km2. In terms of GDP and built-up areas (Figure 5C,D), compared with the other regions, Kuiwen of Group A had the highest values, at 7718 × 104 yuan/km2 and 38.39%, respectively; the second-highest was Weicheng in Group B, with values of 5734 × 104 yuan/km2 and 26.08%, respectively; and Linqu of Group D had the lowest values, of 853 × 104 yuan/km2 and 6.06%, respectively.
For a given set of data, a kernel density map is a visualization of the “degree of density” on the coordinate axis, which is displayed by using a fitted smooth curve. The higher the “peak”, the more “dense” the data. In the towns of Weifang, the distribution characteristics of the ESVs, population, GDP, and built-up areas were intuitively studied through kernel density estimations (Figure 6). The ESVs had distinct “peaks” in the four groups; the peaks of Groups A, B, C, and D were mainly in the vicinities of 3.85, 4.06, 4.41, and 4.63, respectively, and the density was noted in the following order: Group C > Group A > Group D > Group B.
As shown in Figure 6A, the population peaks of Groups B, C, and D were mainly in the vicinities of 2.76, 2.70, and 2.71, respectively, whereas there was no obvious “peak” in Group A; Group C had the highest population density, followed by Groups B and D. In Figure 6B, the GDP peaks of Groups B, C, and D were mainly in the vicinities of 3.56, 3.51, and 3.59, respectively, whereas Group A had no obvious “peak”; Group C had the highest GDP density, followed by Groups B and D. Additionally, Figure 6C showed that the built-up area peaks of Groups B, C, and D were mainly in the vicinities of 0.10, 0.07, and 0.05, respectively, whereas there was no obvious “peak” in Group A; Group C had the highest built-up area density, followed by Groups B and D.

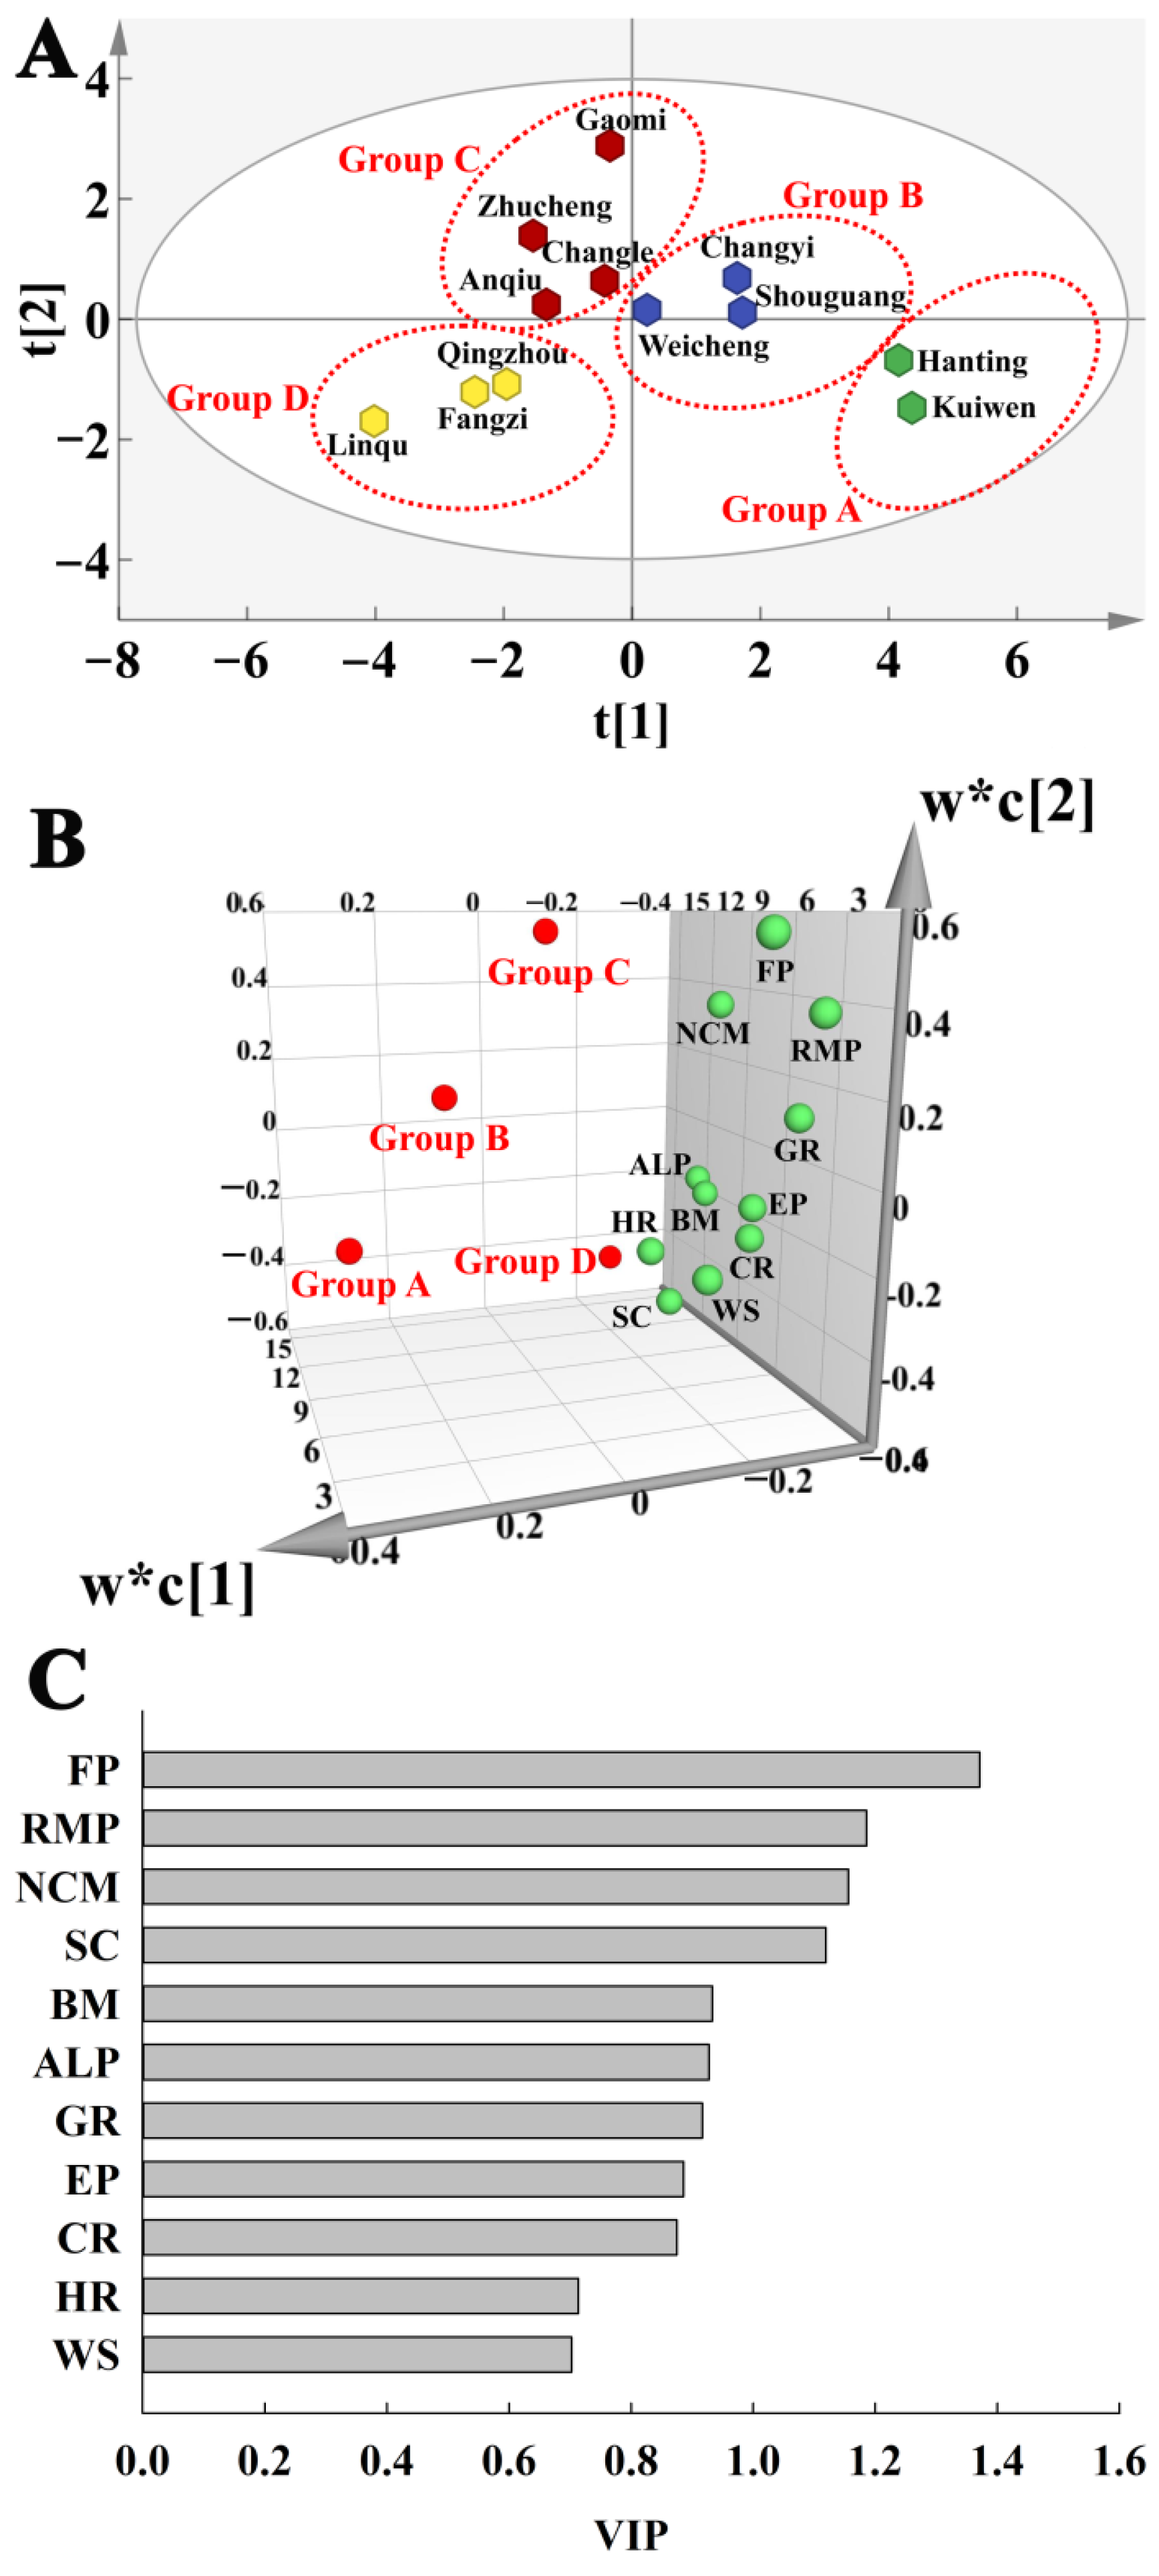
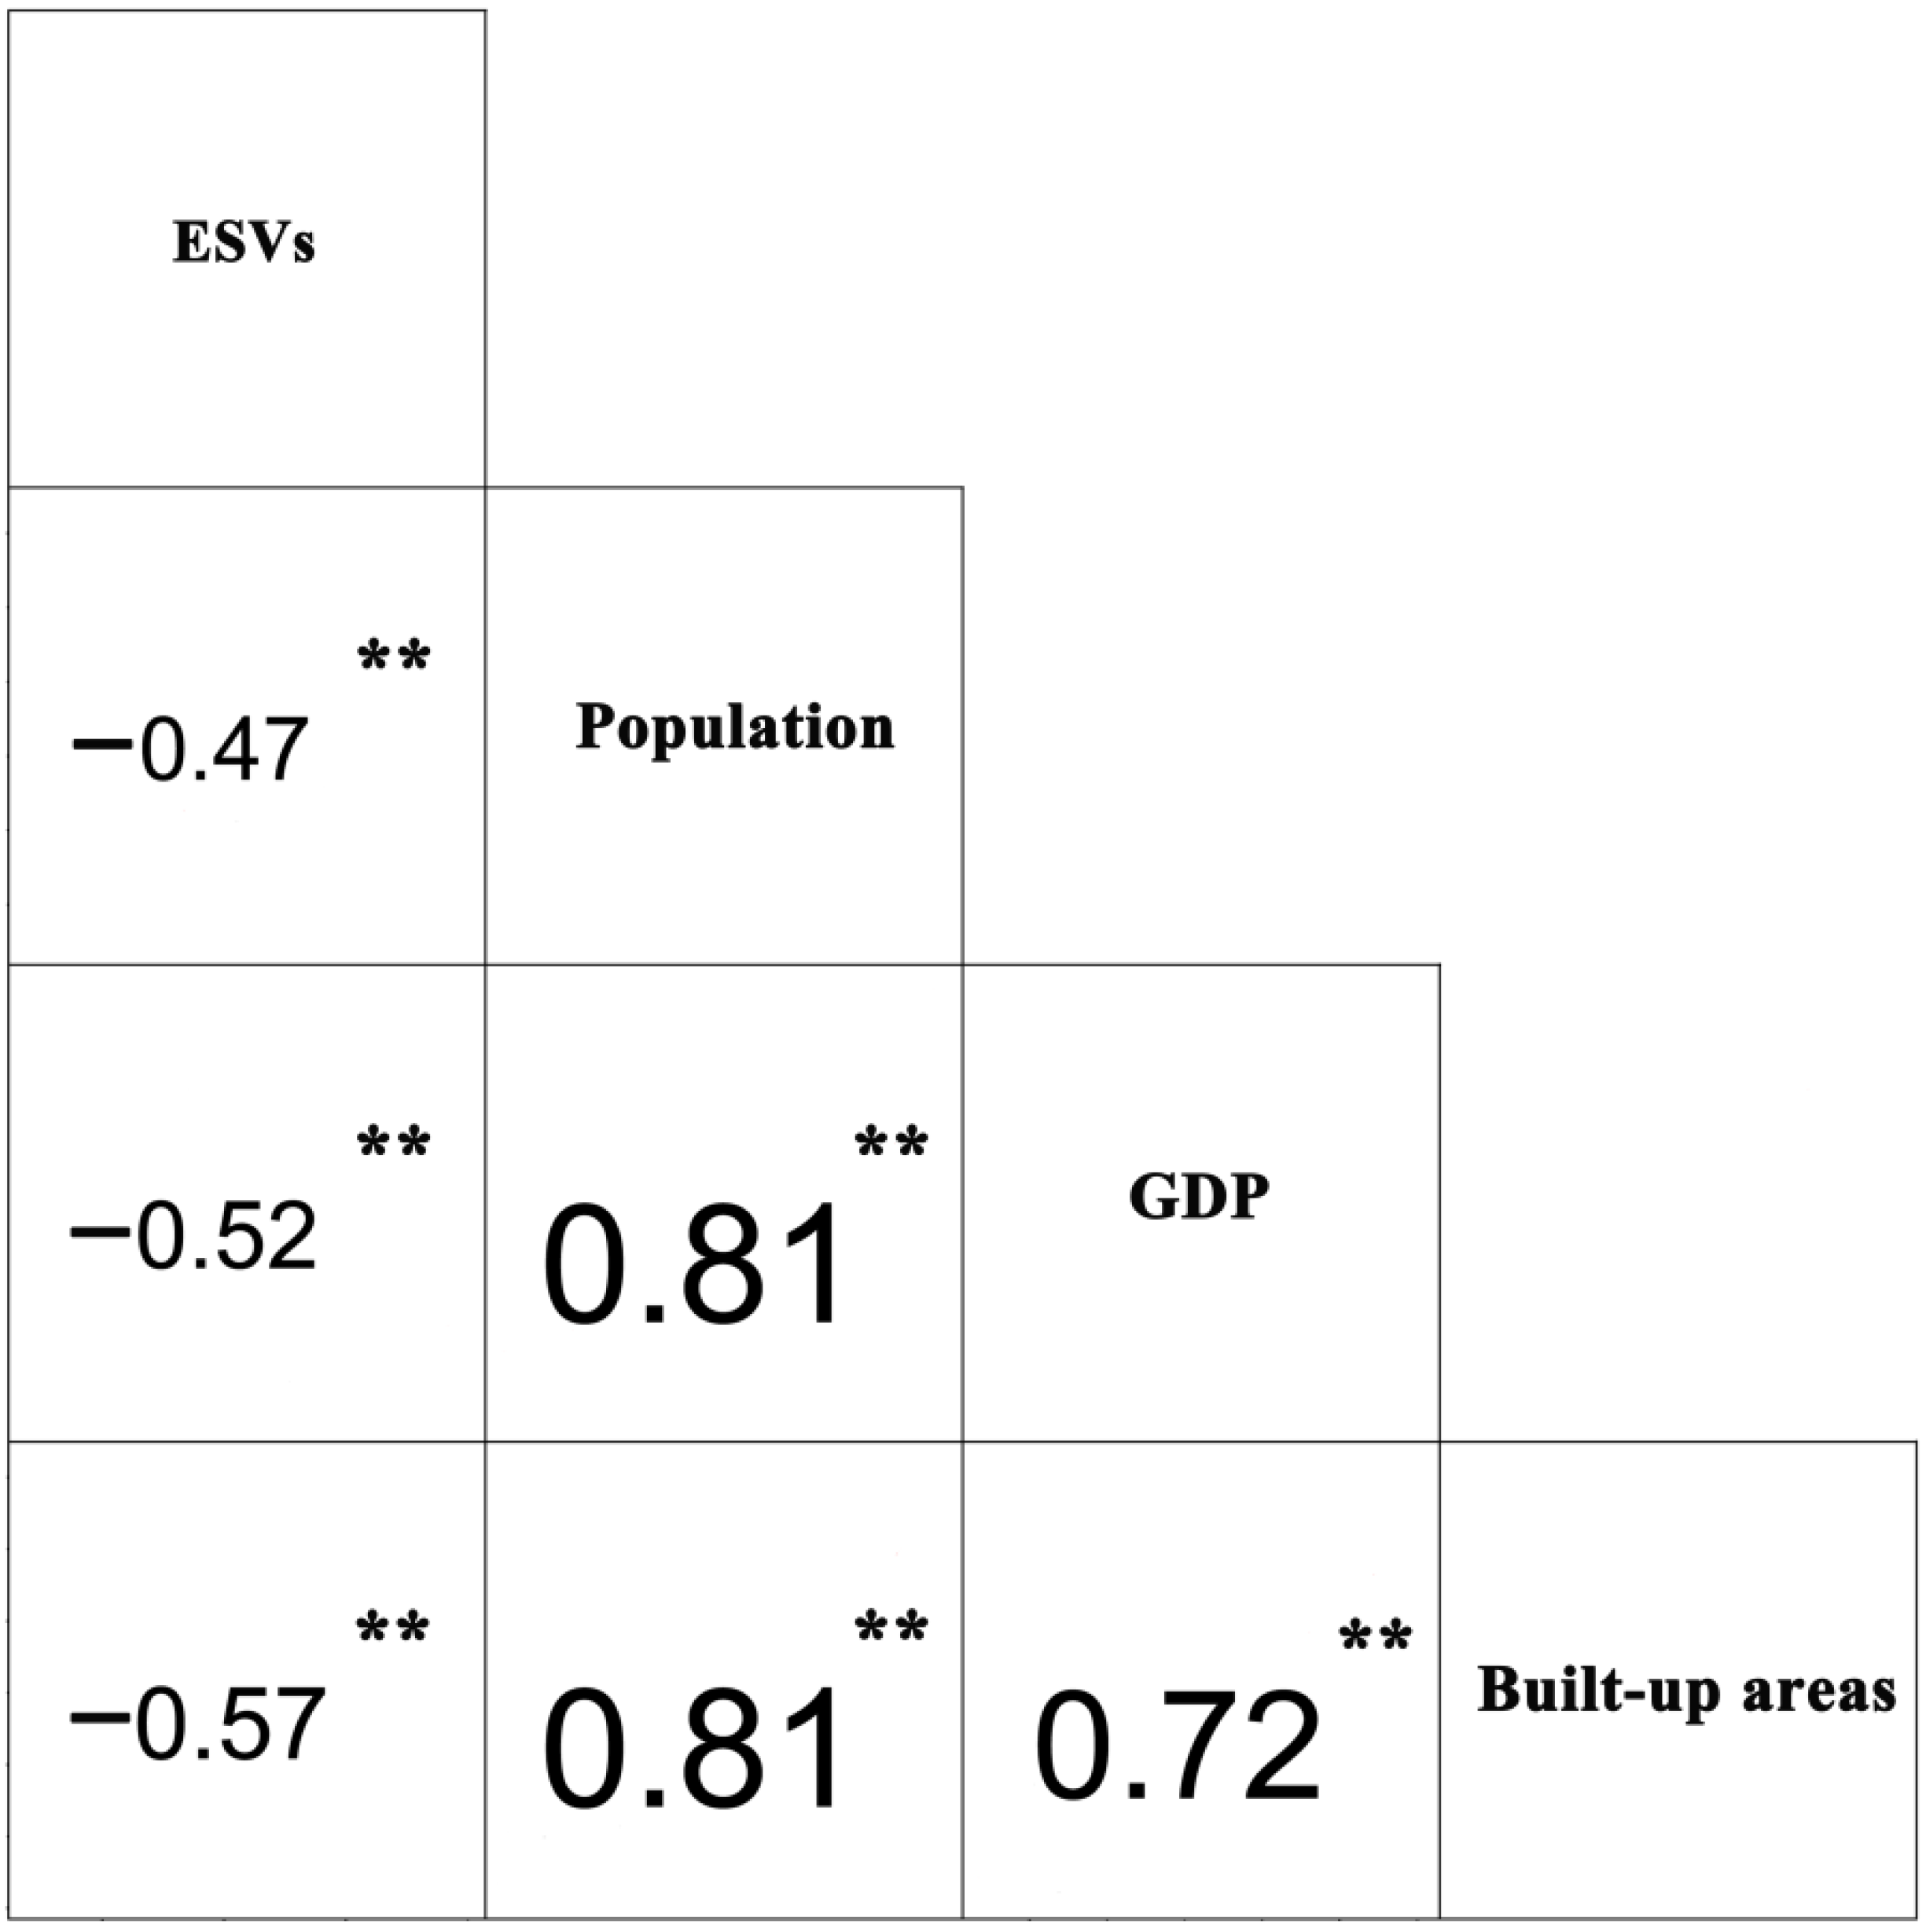
3.4. The Relationships among the ESVs, Population, GDP, and Built-Up Areas

The basic unit for the analysis of the relationships among the ESVs, population, GDP, and built-up areas was the town level (a total number of 124 towns) of Weifang (Figure 7). The ESVs were negatively related to the population, GDP, and built-up areas, with statistically significant correlation coefficients of −0.47, −0.52, and −0.57, respectively (p < 0.05). The relationships between the population and GDP and between the population and built-up areas were significantly positive (p < 0.05), with correlation coefficients of 0.81. In addition, the GDP was strongly positively related to the built-up areas, with a correlation coefficient of 0.72.

4. Discussion

4.1. Ecosystem Services and Subtypes

Ecosystem services include the continuous provisions of food, fiber, raw materials, and other products for human beings. More importantly, ecosystem services include the provision of public products that cannot be delivered by the market, such as gas regulation, environment purification, and nutrient cycle maintenance, all of which bring substantial welfare to humans [5,8,48]. As shown in Table S2, there are four main types of ecosystem services, namely provision services, regulation services, support services, and culture services. These four ecosystem services play an important role in urbanization. The necessities of daily life are provided by provision services, and their decrements will increase the costs of living for urban residents, which may greatly reduce the quality of life for those residents [49]. Urban pollution and soil erosion can be prevented by regulation services, whose degradation will seriously threaten urban security [12]. Additionally, support services are the basis and source of the other three ecosystem service types [10,50].
As shown in Table S2, food production and raw material production belong to the provision services, nutrient cycle maintenance belongs to the support services, and soil conservation belongs to the regulation services. Notably, through the quantitative analysis that included a partial least squares-discriminant analysis in this study, we have shown that these subtypes (food production, raw material production, nutrient cycle maintenance, and soil conservation) are decisive ecosystem services, and there have been vast reductions of these ESVs during the process of urbanization. Owing to the reductions of ESVs in Weifang, we hope that the government will increase the corresponding sustainable management policies.

4.2. The Response of Ecosystem Services to Urbanization

Population urbanization is an internal driver of changes to ecosystem services; land urbanization plays a more direct role in affecting ecosystem services by changing the regional land use structure, while economic urbanization affects the structure of ecosystem services [51,52]. With the rapid development of the national economy, the urbanization process has been accelerated in China. Due to the rapid expansion of urban lands and economic agglomeration, the ecological system has been impacted, which may be an inevitable problem in the process of urbanization [1]. In this study, the population, GDP, and built-up areas consistently increased from 2000 to 2015, whereas the ESVs decreased.
Our results showed that Kuiwen had the highest population, GDP, and built-up areas among all the studied cities; however, the ESVs of Kuiwen were lower than those of the other cities. That is, compared to other cities, Kuiwen had the highest level of urbanization but the lower ESVs. The results of the kernel density estimation also supported this result. Based on the kernel density estimation of the ESVs distribution characteristics, Group A, where Kuiwen was located, had an obvious peak value at 3.85, which was the lowest among the four groups. In the process of urbanization, massive amounts of natural resources are consumed, which affects the ecosystem services [53]. With the increase of population, GDP, and built-up areas, forestry areas, cultivated land, and grassland are occupied, which will inevitably affect ecosystem services [17,54].
It should be noted that the negative correlation coefficient between the built-up areas and ecosystem services (−0.57) was greater than that between the population or GDP and ecosystem services (−0.47 and −0.52, respectively) in this study. This finding was consistent with the analyses for Beijing conducted by Peng et al. (2017), in which the results indicated that the impacts of population and economic urbanization on ecosystem services lagged behind those of land urbanization [17]. Due to the differences among different urbanization development pathways, climate and land utilization status, and other aspects, the responses of ecosystem services to urbanization are not consistent across different cities. Because of the urban expansion and population mobility, Li et al. (2016) believed that ecosystem services were spatially heterogeneous during the process of urban development [19]. In a study of the responses of ecosystem services to land utilization change in semi-urbanized areas, the results showed that the total number of ecosystem services fluctuated with increasing land use intensity, while a significant negative correlation existed between the regulation and support services [55]. In a study of the coupling relationship between urbanization and ecosystem services in Kunshan city, the results indicated that ecosystem services did not have a tendency to simply decline, but instead showed an irregular U-shaped coupling state with increasing levels of urbanization [56]. Regional sustainability may be achieved by controlling the amount and spatial distribution of urban built-up areas, without drastically diminishing the levels of population urbanization and economic urbanization.

4.3. Limitations of This Study

Notably, ESVs are only a proxy to measure changes in ecosystem services, rather than an accurate estimation of the monetary value of ecosystem services. Owing to the difficulty of assessing nonmarket components, the existing socioeconomic systems cannot entirely explain ESVs [8,12]. More micro-level mechanisms were not included in this study because of the lack of reliable methods and relevant data [44]. An obvious hurdle for most studies evaluating ESVs is the lack of relevant data, which results in rough assessments [57,58]. At present, there is still no set of unified, complete, and scientific evaluation methods for ESVs. Martínez-Harms and Balvanera (2012) found that remote sensing data and socioeconomic data were more frequently used than data originating from field surveys and experimental observations [59]. In view of the substantial uncertainties involved, we may never be able to accurately assess ecosystem services [12,31].
In studies of ecology and geography, the problem of modifiable areal units refers to the fact that the results of spatial correlations vary with unit size (i.e., grid cell and grain size) [17]. Herein, in the spatial-scale analysis of the ecosystem service subtypes, county-level cities were used as the statistical unit; in the analysis of the ESVs, population, GDP, and built-up area distribution characteristics, county-level cities and towns were taken as the statistical units; and in the analysis of the relationships among ESVs, population, GDP, and built-up areas, towns were used as the statistical unit. Undoubtedly, there is a modifiable areal unit problem in this study. It is worth mentioning that the methods used in this paper were designed according to the county and to the town. In future, random points and various grid cells should be selected and used to analyze the differences in the relationships between ecosystem services and urbanization using various spatial scales or statistical units.

5. Conclusions

Ecosystem services are key indicators of ecosystem health. Studying the relationships between ecosystem services and urbanization provides a new comprehensive approach for quantifying the ecological effects of urbanization. Taking Weifang, a typical representative city, as the study area, we performed a quantitative analysis of the impacts of urbanization on ecosystem services. It should be noted that food production, raw material production, nutrient cycle maintenance, and soil conservation were decisive ecosystem service subtypes that led to vast reductions in ESVs in the process of urbanization. The negative correlation coefficient obtained between built-up areas and ecosystem services was greater than those between the population, GDP, and ecosystem services. We believe that the impacts of population and economic urbanization on ecosystem services lag behind the impact of land urbanization. By controlling the quantity and distribution of urban built-up areas, it is possible to achieve sustainable urban ecological development, without greatly reducing the levels of population urbanization and economic urbanization. It needs to promote the transformation of urban land use patterns from extensive to intensive, formulate urban development planning, and improve the efficiency of urban land use. Therefore, the process of land urbanization requires a more sustained attention. This study provides some preliminary findings to scientifically guide the sustainable development of cities, and suggestions for the coordinated development of the urbanization and ecological environment in the Shandong Peninsula urban agglomeration. It also promotes the healthy development of the urban agglomeration and the high-quality development of the regional economy. Since the research area of this study is Weifang, it has not been compared with other cities in the Shandong peninsula urban agglomeration. The follow-up study needs to improve the framework of theoretical analysis and judgment, and strengthen the comparative study with other cities. Due to the complexity of sustainable development management, these results may just be a starting point, and there is still a lot of research that needs to be done in the future.

Supplementary Materials

The following are available online at https://0-www-mdpi-com.brum.beds.ac.uk/article/10.3390/urbansci5030054/s1, Table S1: Ecosystem service equivalent value per unit area. Table S2: Classification of ecosystem services.

Author Contributions

Conceptualization, Y.Y., H.Z. and X.Z.; methodology, Y.Y. and H.C.; software, Y.Y., A.W. and E.Z.; data curation, X.Z.; writing—original draft preparation, Y.Y. and H.Z.; writing—review and editing, H.C. and Z.C. All authors have read and agreed to the published version of the manuscript.

Funding

This research received no external funding.

Conflicts of Interest

The authors declare no conflict of interest.

Appendix A. Dynamic ESVs Assessment Method

By modifying and developing the method of Costanza et al. (1997) of equivalence factor per unit area, Xie et al. (2017) initiated a dynamic assessment method for ESVs. This method defines the spatiotemporal dynamic equivalence factors using net primary productivity, precipitation, and soil conservation per unit area, as in Equations (A1)–(A4):
{ F n i j = P i j * F n 1 o r F n i j = R i j * F n 2 o r F n i j = S i j * F n 3
P i j = B i j B ¯
R i j = W i j W ¯
S i j = E i j E ¯
where F n i j is the dynamic equivalence factor per unit area for ecosystem service n of an ecosystem in region i in month j ; P i j is the spatiotemporal regulation factor of net primary productivity in region i in month j ; R i j is the spatiotemporal regulation factor of precipitation in region i in month j ; S i j is the spatiotemporal regulation factor of soil conservation in region i in month j ; F n 1 is the equivalence coefficient for the services from food production, raw materials supply, gas regulation, climate regulation, waste regulation, biodiversity maintenance, and aesthetic landscape provision; F n 2 is the equivalence coefficient for the service from hydrology regulation; F n 3 is the equivalence coefficient for the service from soil conservation; B i j is the net primary productivity of the ecosystem in region i in month j ; B ¯ is the national annual net primary productivity of the ecosystem; W i j is the average precipitation per unit area in region i in month j ; W ¯ is the annual average precipitation per unit area; E i j is the quantity of soil conservation of the ecosystem in region i in month j ; and E ¯ is the average annual quantity of soil conservation per unit area.

References

  1. Grimm, N.B.; Faeth, S.H.; Golubiewski, N.E.; Redman, C.L.; Wu, J.G.; Bai, X.M.; Briggs, J.M. Global change and the ecology of cities. Science 2008, 319, 756–760. [Google Scholar] [CrossRef] [PubMed] [Green Version]
  2. Folke, C.; Jansson, A.; Larsson, J.; Costanza, R. Ecosystem by cities appropriation. Ambio 1997, 26, 167–172. [Google Scholar]
  3. Li, W.B.; Wang, D.Y.; Liu, S.H.; Zhu, Y.L.; Yan, Z.R. Reclamation of cultivated land reserves in northeast China: Indigenous ecological insecurity underlying national food security. Int. J. Environ. Res. Public Health 2020, 17, 1211. [Google Scholar] [CrossRef] [Green Version]
  4. Cao, L.D.; Li, J.L.; Ye, M.Y.; Pu, R.L.; Liu, Y.C.; Guo, Q.D.; Feng, B.X.; Song, X.Y. Changes of ecosystem service value in a coastal zone of Zhejiang province, China, during rapid urbanization. Int. J. Environ. Res. Public Health 2018, 15, 1301. [Google Scholar] [CrossRef] [PubMed] [Green Version]
  5. Costanza, R.; de Groot, R.; Sutton, P.; der Ploeg, S.; Anderson, S.J.; Kubiszewski, I.; Farber, S.; Turner, R.K. Changes in the global value of ecosystem services. Glob. Environ. Chang. 2014, 26, 152–158. [Google Scholar] [CrossRef]
  6. Su, S.L.; Xiao, R.; Jiang, Z.L.; Zhang, Y. Characterizing landscape pattern and ecosystem service value changes for urbanization impacts at an eco-regional scale. Appl. Geogr. 2012, 34, 295–305. [Google Scholar] [CrossRef]
  7. Moroni, S.; Tricarico, L. Distributed energy production in a polycentric scenario: Policy reforms and community management. J. Environ. Plan. Manag. 2018, 61, 1973–1993. [Google Scholar] [CrossRef] [Green Version]
  8. Costanza, R.; d’Arge, R.; de Groot, R.; Farber, S.; Grasso, M.; Hannon, B.; Limburg, K.; Naeem, S.; ONeill, R.V.; Paruelo, J.; et al. The value of the world’s ecosystem services and natural capital. Nature 1997, 387, 253–260. [Google Scholar] [CrossRef]
  9. Hu, S.; Chen, L.Q.; Li, L.; Wang, B.Y.; Yuan, L.N.; Cheng, L.; Yu, Z.Q.; Zhang, T. Spatiotemporal dynamics of ecosystem service value determined by land-use changes in the urbanization of Anhui province, China. Int. J. Environ. Res. Public Health 2019, 16, 5104. [Google Scholar] [CrossRef] [Green Version]
  10. Yang, Y.J.; Wang, K.; Liu, D.; Zhao, X.Q.; Fan, J.W.; Li, J.S.; Zhai, X.J.; Zhang, C.; Zhan, R.Y. Spatiotemporal variation characteristics of ecosystem service losses in the agro-pastoral ecotone of Northern China. Int. J. Environ. Res. Public Health 2019, 16, 1199. [Google Scholar] [CrossRef] [Green Version]
  11. Jew, E.K.K.; Burdekin, O.J.; Dougill, A.J.; Sallu, S.M. Rapid land use change threatens provisioning ecosystem services in miombo woodlands. Nat. Resour. Forum 2019, 43, 56–70. [Google Scholar] [CrossRef] [Green Version]
  12. Xie, G.D.; Zhang, C.X.; Zhen, L.; Zhang, L.M. Dynamic changes in the value of China’s ecosystem services. Ecosyst. Serv. 2017, 26, 146–154. [Google Scholar] [CrossRef]
  13. Chen, Q.; Mei, K.; Dahlgren, R.A.; Wang, T.; Gong, J.; Zhang, M.H. Impacts of land use and population density on seasonal surface water quality using a modified geographically weighted regression. Sci. Total Environ. 2016, 572, 450–466. [Google Scholar] [CrossRef] [PubMed] [Green Version]
  14. Bai, Y.P.; Deng, X.Z.; Jiang, S.J.; Zhang, Q.; Wang, Z. Exploring the relationship between urbanization and urban eco-efficiency: Evidence from prefecture-level cities in China. J. Clean. Prod. 2018, 195, 1487–1496. [Google Scholar] [CrossRef]
  15. He, J.Q.; Wang, S.J.; Liu, Y.Y.; Ma, H.T.; Liu, Q.Q. Examining the relationship between urbanization and the eco-environment using a coupling analysis: Case study of Shanghai, China. Ecol. Indic. 2017, 77, 185–193. [Google Scholar] [CrossRef]
  16. Wang, W.J.; Guo, H.C.; Chuai, X.W.; Dai, C.; Lai, L.; Zhang, M. The impact of land use change on the temporospatial variations of ecosystems services value in China and an optimized land use solution. Environ. Sci. Policy 2014, 44, 62–72. [Google Scholar] [CrossRef]
  17. Peng, J.; Tian, L.; Liu, Y.X.; Zhao, M.Y.; Hu, Y.N.; Wu, J.S. Ecosystem services response to urbanization in metropolitan areas: Thresholds identification. Sci. Total Environ. 2017, 607, 706–714. [Google Scholar] [CrossRef]
  18. Wu, J.G. Making the case for landscape ecology: An effective approach to urban sustainability. Landsc. J. 2008, 27, 41–50. [Google Scholar] [CrossRef] [Green Version]
  19. Li, J.; Zhou, Z.X. Natural and human impacts on ecosystem services in Guanzhong–Tianshui economic region of China. Environ. Sci. Pollut. Res. 2016, 23, 6803–6815. [Google Scholar] [CrossRef]
  20. Su, S.L.; Li, D.L.; Hu, Y.N.; Xiao, R.; Zhang, Y. Spatially non-stationary response of ecosystem service value changes to urbanization in Shanghai, China. Ecol. Indic. 2014, 45, 332–339. [Google Scholar] [CrossRef]
  21. Hu, X.S.; Hong, W.; Qiu, R.Z.; Hong, T.; Chen, C.; Wu, C.Z. Geographic variations of ecosystem service intensity in Fuzhou city. Sci. Total Environ. 2015, 512, 215–226. [Google Scholar] [CrossRef]
  22. Wang, F.X. Study on the quality measurement and coordinated development of population-land urbanization in Shandong Peninsula Urban Agglomeration. Sci. Geogr. Sin. 2020, 40, 1345–1354. (In Chinese) [Google Scholar]
  23. Gao, X.M.; Wang, L.J.; Wang, S.J.; Han, X.; Wang, W.B.; Qiu, G.; Ma, S.Q. Temporal-spatial distributions of hail disaster from 1952 to 2012 in Weifang of Shandong province. J. Meteorol. Environ. 2016, 32, 77–82. (In Chinese) [Google Scholar]
  24. Yang, H.Y.; Sun, X.B.; Cheng, X.W.; Zhou, G.Y.; Sun, G.D. Comprehensive evaluation of water resources carrying capacity in Weifang based on the VIKOR method. Acta Sci. Circumstantiae 2020, 40, 716–723. (In Chinese) [Google Scholar]
  25. Su, L.L.; Li, Y.Y.; Wang, X.L.; Zhang, Q.; Gao, X.M.; Yuan, J. Analysis on the characteristics of precipitation in Weifang city in recent 56 years. J. Anhui Agric. Sci. 2018, 46, 157–159. (In Chinese) [Google Scholar]
  26. Liu, Z.F.; He, C.Y.; Zhang, Q.F.; Huang, Q.X.; Yang, Y. Extracting the dynamics of urban expansion in China using DMSP-OLS nighttime light data from 1992 to 2008. Landsc. Urban Plan. 2012, 106, 62–72. [Google Scholar] [CrossRef]
  27. Han, D.R.; Yang, X.H.; Cai, H.Y.; Xu, X.L.; Qiao, Z.; Cheng, C.Z.; Dong, N.; Huang, D.; Liu, A. Modelling spatial distribution of fine-scale populations based on residential properties. Int. J. Remote Sens. 2019, 40, 5287–5300. [Google Scholar] [CrossRef]
  28. Liu, J.Y.; Liu, M.L.; Zhuang, D.F.; Zhang, Z.X.; Deng, X.Z. Study on spatial pattern of land-use change in China during 1995–2000. Sci. China Ser. D Earth Sci. 2003, 46, 373–384. [Google Scholar]
  29. Liu, J.Y.; Zhang, Z.X.; Xu, X.L.; Kuang, W.H.; Zhou, W.C.; Zhang, S.W.; Li, R.D.; Yan, C.Z.; Yu, D.S.; Wu, S.X. Spatial patterns and driving forces of land use change in China during the early 21st century. J. Geogr. Sci. 2010, 20, 483–494. [Google Scholar] [CrossRef]
  30. Liu, J.Y.; Kuang, W.H.; Zhang, Z.X.; Xu, X.L.; Qin, Y.W.; Ning, J.; Zhou, W.C.; Zhang, S.W.; Li, R.D.; Yan, C.Z.; et al. Spatiotemporal characteristics, patterns, and causes of land-use changes in China since the late 1980s. J. Geogr. Sci. 2014, 24, 195–210. [Google Scholar] [CrossRef]
  31. Yang, Y.J.; Wang, K.; Liu, D.; Zhao, X.Q.; Fan, J.W. Effects of land-use conversions on the ecosystem services in the agro-pastoral ecotone of Northern China. J. Clean. Prod. 2020, 249, 1–16. [Google Scholar] [CrossRef]
  32. Xu, X.L. A Dataset of the Spatial Distributions of Terrestrial Ecosystem Services in China; Institute of Geographic Sciences and Natural Resources Research: Beijing, China, 2018; Available online: http://www.resdc.cn/DOI (accessed on 9 November 2020).
  33. Wu, K.Y.; Ye, X.Y.; Qi, Z.F.; Zhang, H. Impacts of land use/land cover change and socioeconomic development on regional ecosystem services: The case of fast-growing Hangzhou metropolitan area, China. Cities 2013, 31, 276–284. [Google Scholar] [CrossRef]
  34. Xie, G.D.; Zhen, L.; Lu, C.X.; Xiao, Y.; Chen, C. Expert knowledge based valuation method of ecosystem services in China. J. Nat. Resour. 2008, 23, 911–919. (In Chinese) [Google Scholar]
  35. Song, W.; Deng, X.Z. Land-use/land-cover change and ecosystem service provision in China. Sci. Total Environ. 2017, 576, 705–719. [Google Scholar] [CrossRef]
  36. Bai, X.M.; Shi, P.J.; Liu, Y.S. Realizing China’s urban dream. Nature 2014, 509, 158–160. [Google Scholar] [CrossRef] [Green Version]
  37. Peng, J.; Shen, H.; Wu, W.H.; Liu, Y.X.; Wang, Y.L. Net primary productivity (NPP) dynamics and associated urbanization driving forces in metropolitan areas: A case study in Beijing city, China. Landsc. Ecol. 2016, 31, 1077–1092. [Google Scholar] [CrossRef]
  38. Wu, J.S.; Ma, L.; Li, W.F.; Peng, J.; Liu, H. Dynamics of urban density in China: Estimations based on DMSP/OLS nighttime light data. IEEE J. Sel. Top. Appl. Earth Obs. Remote Sens. 2014, 7, 4266–4275. [Google Scholar] [CrossRef]
  39. Wan, L.L.; Ye, X.Y.; Lee, J.; Lu, X.Q.; Zheng, L.; Wu, K.Y. Effects of urbanization on ecosystem service values in a mineral resource-based city. Habitat Int. 2015, 46, 54–63. [Google Scholar] [CrossRef]
  40. Brereton, R.G. Consequences of sample size, variable selection, and model validation and optimisation, for predicting classification ability from analytical data. TrAC Trends Anal. Chem. 2006, 25, 1103–1111. [Google Scholar] [CrossRef]
  41. Brereton, R.G.; Lloyd, G.R. Partial least squares discriminant analysis: Taking the magic away. J. Chemom. 2014, 28, 213–225. [Google Scholar] [CrossRef]
  42. Bassbasi, M.; De Luca, M.; Ioele, G.; Oussama, A.; Ragno, G. Prediction of the geographical origin of butters by partial least square discriminant analysis (PLS-DA) applied to infrared spectroscopy (FTIR) data. J. Food Compos. Anal. 2014, 33, 210–215. [Google Scholar] [CrossRef]
  43. Bai, P.L.; Wang, J.; Yin, H.C.; Tian, Y.B.; Yao, W.M.; Gao, J. Discrimination of human and nonhuman blood by raman spectroscopy and partial least squares discriminant analysis. Anal. Lett. 2016, 50, 379–388. [Google Scholar] [CrossRef]
  44. Yang, Y.J.; Wang, K. The effects of different land use patterns on the microclimate and ecosystem services in the agro-pastoral ecotone of Northern China. Ecol. Indic. 2019, 106, 1–11. [Google Scholar] [CrossRef]
  45. Jenkins, S.P.; Kerm, P.V. Accounting for income distribution trends: A density function decomposition approach. J. Econ. Inequal. 2005, 3, 43–61. [Google Scholar] [CrossRef] [Green Version]
  46. Zhao, S.P.; Ge, M. Analysis of industrial characteristics and dynamic evolution of export added-value rates of China. J. Chongqing Technol. Bus. Univ. (Soc. Sci. Edit.) 2017, 34, 45–53. (In Chinese) [Google Scholar]
  47. Du, Y.; Xie, Z.Q.; Zeng, Y.; Shi, Y.F.; Wu, J.G. Impact of urban expansion on regional temperature change in the Yangtze River Delta. J. Geogr. Sci. 2007, 17, 387–398. [Google Scholar] [CrossRef]
  48. Fei, L.; Zhang, S.W.; Yang, J.C.; Chang, L.P.; Yang, H.J.; Bu, K. Effects of land use change on ecosystem services value in west Jilin since the reform and opening of China. Ecosyst. Serv. 2018, 31, 12–20. [Google Scholar] [CrossRef]
  49. Kang, H.; Seely, B.; Wang, G.; Innes, J.; Zheng, D.; Chen, P.; Wang, T.; Li, Q. Evaluating management tradeoffs between economic fiber production and other ecosystem services in a Chinese-fir dominated forest plantation in Fujian province. Sci. Total Environ. 2016, 557–558, 80–90. [Google Scholar] [CrossRef] [PubMed]
  50. Mao, Q.Z.; Huang, G.L.; Wu, J.G. Urban ecosystem services: A review. Chin. J. Appl. Ecol. 2015, 26, 1023–1033. (In Chinese) [Google Scholar]
  51. Estoque, R.C.; Muraya, Y. Quantifying landscape pattern and ecosystem service value changes in four rapidly urbanizing hill stations of southeast Asia. Landsc. Ecol. 2016, 31, 1–27. [Google Scholar] [CrossRef]
  52. Meng, Y. Effects of urbanization on ecosystem services value in Ningbo city. Areal Res. Dev. 2016, 35, 81–86. (In Chinese) [Google Scholar]
  53. Bloom, D.E.; Canning, D.; Fink, G. Urbanization and the wealth of nations. Science 2008, 319, 772–775. [Google Scholar] [CrossRef] [PubMed] [Green Version]
  54. Mach, M.E.; Martone, R.G.; Chan, K.M.A. Human impacts and ecosystem services: Insufficient research for trade-off evaluation. Ecosyst. Serv. 2015, 16, 112–120. [Google Scholar] [CrossRef]
  55. Huang, Y.F.; Cui, S.H.; Shi, L.Y. Response of ecosystem services to land use/cover change in peri-urban area: A case study of Jimei district, Xiamen. Prog. Geogr. 2012, 31, 551–560. (In Chinese) [Google Scholar] [CrossRef]
  56. Cai, B.C.; Zhou, H.P. Quantitative research on the relationship between urbanization and ecosystem services of Kunshan city. Environ. Prot. Sci. 2010, 36, 40–42. (In Chinese) [Google Scholar] [CrossRef]
  57. Naidoo, R.; Balmford, A.; Costanza, R.; Fisher, B.; Green, R.E.; Lehner, B.; Malcolm, T.R.; Ricketts, T.H. Global mapping of ecosystem services and conservation priorities. Proc. Natl. Acad. Sci. USA 2008, 105, 9495–9500. [Google Scholar] [CrossRef] [Green Version]
  58. Eigenbrod, F.; Armsworth, P.R.; Anderson, B.J.; Heinemeyer, A.; Gillings, S.; Roy, D.B.; Thomas, C.D.; Gaston, K.J. The impact of proxy-based methods on mapping the distribution of ecosystem services. J. Appl. Ecol. 2010, 47, 377–385. [Google Scholar] [CrossRef]
  59. Martínez-Harms, M.J.; Balvanera, P. Methods for mapping ecosystem service supply: A review. Int. J. Biodivers. Sci. Ecosyst. Serv. Manag. 2012, 8, 17–25. [Google Scholar] [CrossRef]
Figure 1. Geographical location of Weifang city (A) and the distribution of its land use types in 2015 (B).
Urbansci 05 00054 g001
Figure 2. Variations in ESVs, population, GDP, and built-up areas from 2000 to 2015. Note: for comparability, each indicator was considered as a whole; from 2000 to 2015, the sum of each indicator was 100%, that is, in 2000, 2005, 2010, and 2015, the trend of each indicator can be estimated by comparing the proportion value.
Urbansci 05 00054 g002
Figure 3. Spatial variations in ecosystem service subtypes (yuan/km2).
Urbansci 05 00054 g003
Figure 4. Score scatter plot (A), loading scatter plot (B), and the value of variable importance in projection (VIP) (C). Note: t[1] indicates the score of the first principal component; t[2] indicates the score of the second principal component; w*c[1] indicates the first loading coefficient; w*c[2] indicates the second loading coefficient; FP indicates food production; RMP indicates raw material production; NCM indicates nutrient cycle maintenance; SC indicates soil conservation; BM indicates biodiversity maintenance; ALP indicates aesthetic landscape provision; GR indicates gas regulation; EP indicates environment purification; CR indicates climate regulation; HR indicates hydrology regulation; and WS indicates water supply.
Urbansci 05 00054 g004
Figure 5. ESVs (A, yuan/km2), population density (B, person/km2), GDP density (C, 104 yuan/km2), and built-up areas (D, %) in Weifang in 2015. Note: Group A includes Hanting and Kuiwen; Group B includes Changyi, Shouguang, and Weicheng; Group C includes Anqiu, Changle, Gaomi, and Zhucheng; and Group D includes Fangzi, Linqu, and Qingzhou. The same symbols are used below.
Urbansci 05 00054 g005
Figure 6. Kernel density estimations between the ESVs and population (A), GDP (B) and built-up areas (C). Note: each dot represents the distribution characteristics of the independent variables and dependent variables of each town in Weifang; the 124 towns were studied, so there were 124 dots in each figure.
Urbansci 05 00054 g006
Figure 7. Analysis of the relationships among the ESVs, population, GDP, and built-up areas in the towns of Weifang. Note: ** indicates significance (p < 0.05).
Urbansci 05 00054 g007
Publisher’s Note: MDPI stays neutral with regard to jurisdictional claims in published maps and institutional affiliations.

