1. Introduction
Afghanistan is dealing with one of the most dramatic trends of urban movement in its history. Cities and towns are expanding in size and number. Kabul, the capital of Afghanistan with a population of around 4.8 million in 2012 [
1], is one of the fast-growing cities in Asia since the interim administration took place. As the world continues to urbanize, sustainable development challenges will be increasingly concentrated in cities, particularly in the lower-middle-income countries where the pace of urbanization is fastest [
2]. The rapid urbanization in Kabul has resulted in the highest rates of informal housing. The city, however, has been unable to keep up with such fast-paced urbanization and seems incapable of providing jobs and services to sustain all its newcomers [
3]. Therefore, in 2006, Afghanistan National Development Strategy proposed to establish a new city adjacent to Kabul’s existing city to loosen the burden and fulfill the people’s needs (
Figure 1). In 2008 the master plan for Kabul New City (KNC) was prepared with the cooperation of the Japan International Cooperation Agency (JICA) and endorsed by the cabinet of Afghanistan in 2009 [
4]. Planners faced lots of obstacles while planning the new city as there were already 54 villages that existed on the land, and more importantly, 140,000 people were residing there (
Table 1) [
5]. Considering the socio-economic importance of these villages and their crucial role in urban–rural integration, the experts came up with the concept of village preservation and development in correlation and harmony with the new city project.
Obviously, preservation needs careful development and certain planning at the policy and management levels. Apparently, without creating a proper urban–rural integration plan, the problem cannot be solved from the root. To define a sustainable model for the development of the villages, essentially, there is a need for characterization and categorization of the villages and afterward defining development proposals for each category.
Experiences have shown that there is no one size fits all method or model for developing all settlement types. Most of the developmental methods have failed in different places of Afghanistan due to the mismatch of the method/model with the socio-economic and cultural condition of the area.
Various interventions from physical upgrading to urban renewal have been undertaken by the government and international organizations, but very few of them have succeeded in solving the problem; some projects rather than solving the issue compounded them to a worse condition, and in some cases, it engendered to social violence and people’s resistance [
6]. Consequently, to solve the issue, a comprehensive study on the status of all villages under the boundary of KNC is required to categorize them into several types. By having the result from the above analysis, we will be able to sort and rank them based on certain factors considering their characteristics, quality, and development potentials. Afterward, for the next step, different upgrading strategies and scenarios can be defined to develop each individual type.
Categorization of settlements based on their characteristics is one of the interesting topics nowadays in urban planning, especially in the era that Geographical Information System (GIS) and digital–urban technologies develop rapidly and provide precious resources on spatial issues; it has always been a heated debate. A study in China shows that villages have been divided into different categories using ArcGIS tools based on principle factors like location, economic condition, morphological rate of change of constructions, size of urban villages, level of crowding, level of surrounding industries, and transport connectivity [
7]. Furthermore, another paper in Serbia discussed the categorization of the village settlements in the city of Nis territory. Factors such as typology by size, genesis, morphological structure, and functions have been taken into consideration [
8]. Obviously, choosing parameters for categorization depends directly on the main objective of the project. Data deficit has been a significant obstacle for planners in Afghanistan. Restrictions in data can fiercely affect the factors in classifying and ranking the settlements. In general, there is a lack of reliable and up-to-date information on the economic, social, and environmental dimensions of urban areas in Afghanistan.
Therefore, efforts have been placed to consider the most important major factors which are available and have the highest impact from the urban planning point of view. However, Dehsabz City Development Authority (DCDA), with the cooperation of JICA, had conducted some technical and socio-economic surveys all over the villages under the boundary of KNC, but some landowners were unwilling to cooperate during the survey due to the privacy of houses, security, and since these settlements suffer from tenure insecurity, so people thought that the government would expropriate their lands, therefore the engineers could not succeed in conducting the survey with all landowners.
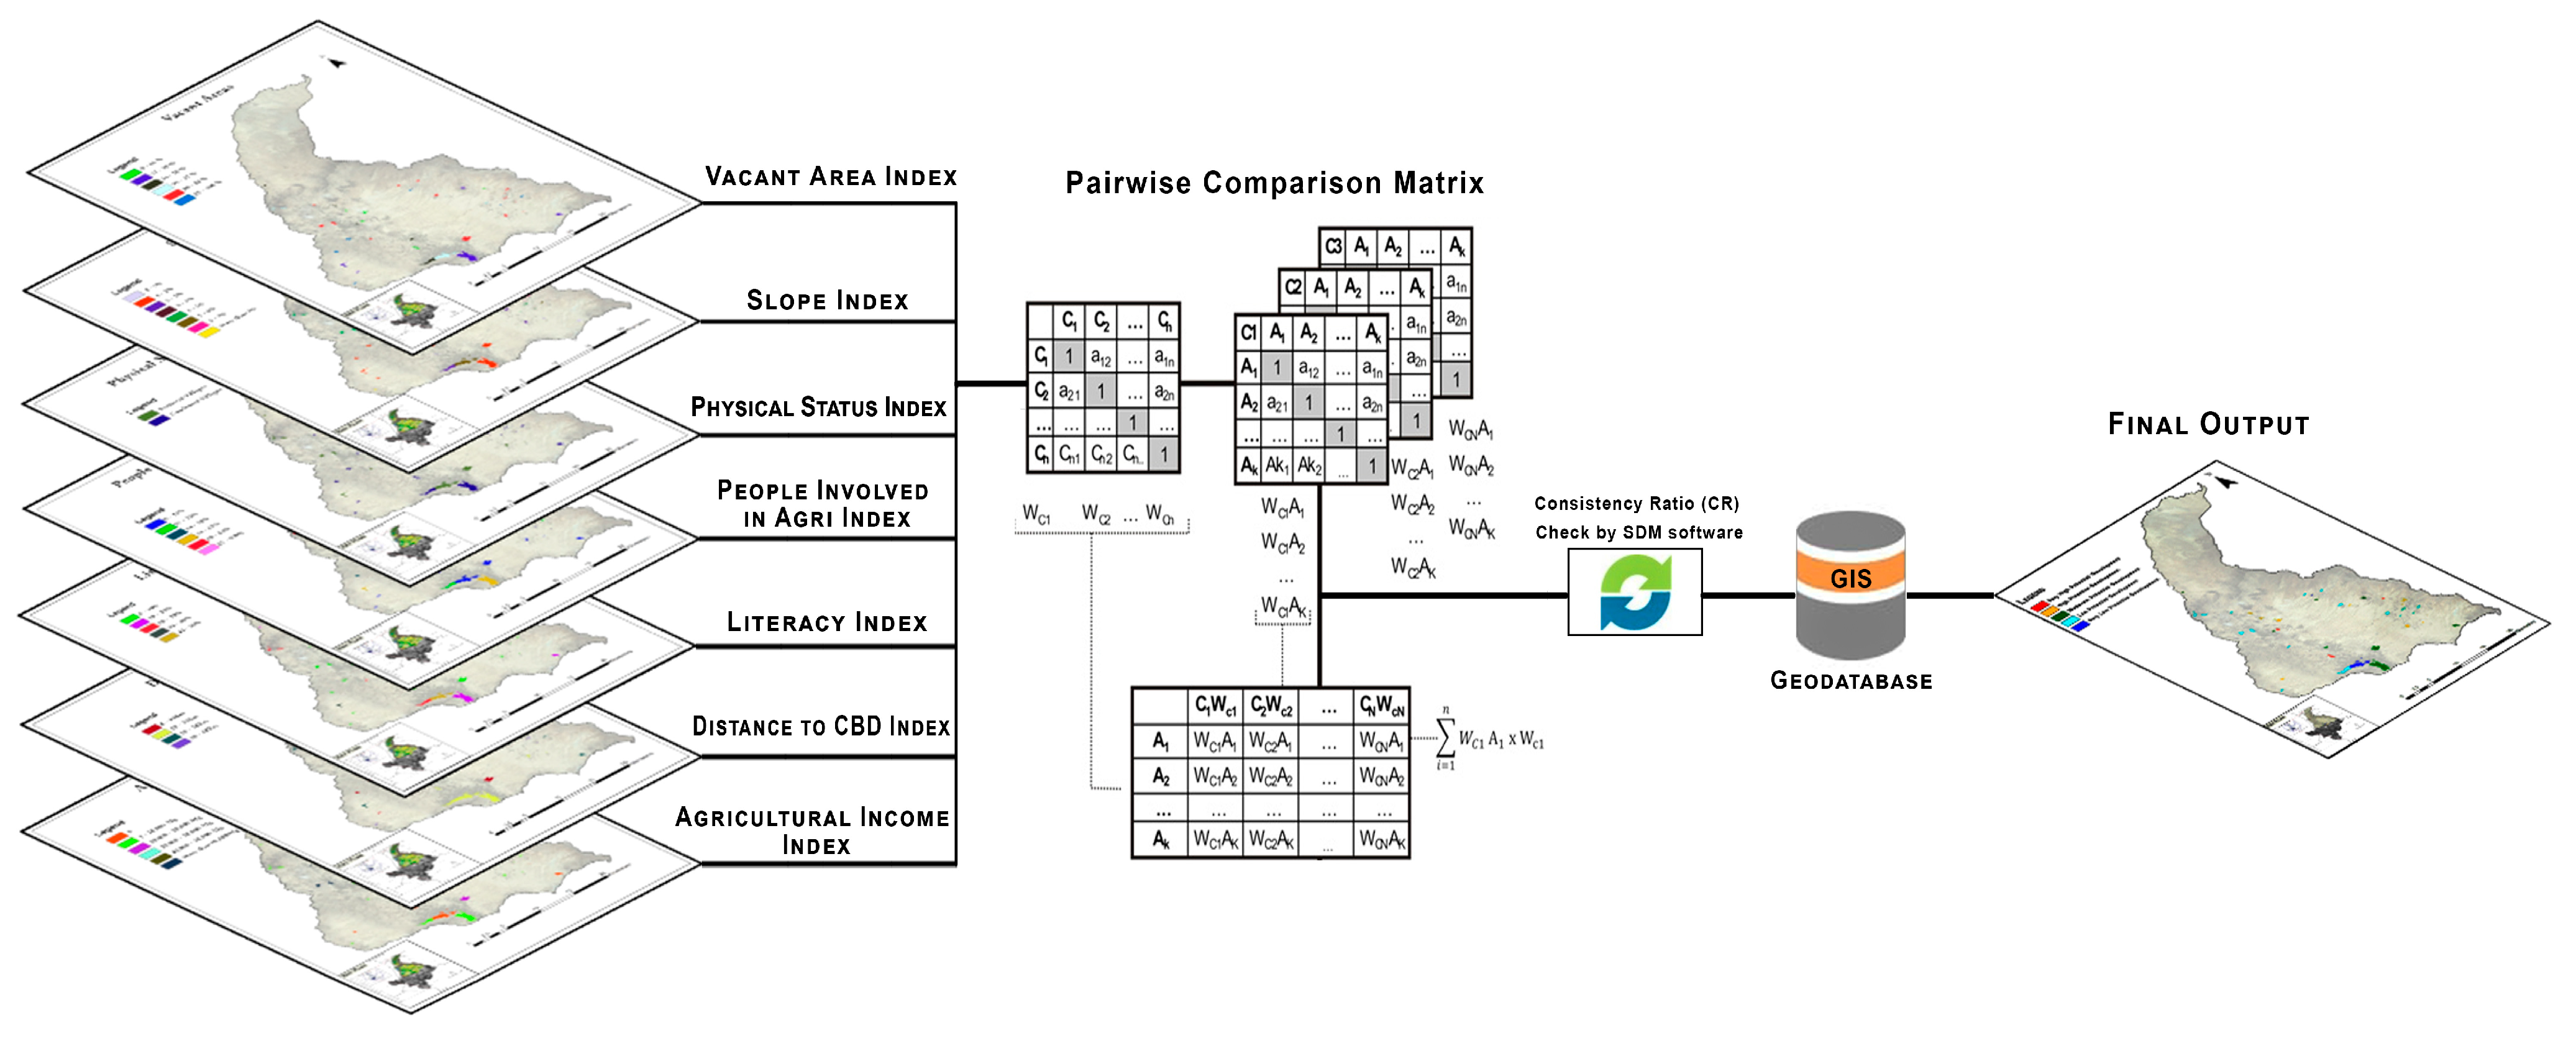
In this research, efforts have been made to consider all those important available parameters which can help in the categorization of the villages. Seven effective criteria have been selected and weighted based on the experts’ responses after considering the urban planning logic and principles and the availability of data. Each index was scored and processed in Super Decision Making (SDM) software for the proper reliability of the weights and then inserted into GIS for further analysis. For a detailed elaboration of the method, it is better to provide some information about MCDA, AHP and, GIS application in categorization.
1.1. Application of GIS-Based MCDA in Categorization
GIS is a computerized tool and framework for capturing, storing, retrieving, updating, manipulating, displaying, mapping, and analyzing the spatial relationship between mapped geographical aspects on the earth’s surface [
9]. Spatial dataset analyses in GIS can be applied in planning and managing natural and socio-economic environments [
10]. It can also enable the policymakers to link unrelated sources of information, analyses, visualize trend, and organize long-term planning objectives for better decision making [
11]. Furthermore, it provides spatial database operations such as geostatistical operation, query functions, analysis, and modeling. This technology is widely used due to its capability in spatial problem-solving, including landfill sites selection, groundwater exploration, mineral exploration, drought monitoring, flooding mapping, foretelling spatial challenges, and providing an alternative solution to spatial challenges. Hence, it is a supportive tool in spatial decision-making [
12]. For suitability analysis, GIS is mostly applied in the preparation of various datasets, including slopes, drainage density, elevations, and used for computation of proximity distances, overlaying the datasets, and analyzing the results [
9].
Along with the GIS, multi-criteria decision analysis (MCDA) is an assessment technique that enables the ranking of numerous likely options by locating various evaluation criteria with conflicting goals [
10]. The approach has the following components: decision-makers, assessment criteria, options, and decision output [
11]. MCDA involves a series of approaches, including a weighted sum that enables a range of contributing criteria related to any spatial challenge to be scored, evaluated, weighted, and ranked based on their contributing suitability [
13]. The MCDA methods are widely employed to combine socio-economic, environmental, and technical criteria for efficient decision-making involving any particular spatial problem on the earth’s surface [
14]. MCDA consists of various methods of evaluating spatial challenges; however, AHP and weighted linear combination (WLC) techniques are widely used in various suitability studies. In this research, the AHP method has been chosen for spatial analysis.
1.2. AHP
Analytic Hierarchy Process (AHP) is amongst the popular used MCDA methods which rely on the expert’s knowledge in assigning weights and enables the reflection of objective and subjective criteria in the ranking of the alternatives [
15]. It is a scientific technique that analyzes complex spatial problems with multiple involving criteria [
16]. This technique enables the decision-makers to decompose the criteria and alternative solutions of the spatial problem into a hierarchical structure [
17].
AHP is a flexible and powerful tool for producing factor weights according to the built pairwise comparison matrix of the criteria [
10]. Thus, the higher the weight, the more important is the criteria [
13]. The AHP technique follows the following three steps: (1) decomposing a problem into a hierarchy structure, (2) comparing the decision elements in which a pairwise comparison matrix is built, (3) computing normalized eigenvector, which determines the criteria’s weights and computation of the consistency ratio of the involved elements [
12].
Furthermore, in this research, Super Decision Making (SDM) software has been used for the better reliability of the AHP data. SDM is a decision support software that works based on the Analytic Hierarchy Process (AHP) and Analytic Network Process (ANP) methods [
15]. The software was developed for the analysis, synthesis, and justification of complex decisions [
18]. It consists of clusters of elements (or nodes), which are connected by arrows [
19].
Super Decision Making became extremely useful by allowing the user to work with a large number of criteria and alternatives while hiding the complexity of the AHP calculations. It is particularly useful in adjusting consistency. The calculation of the consistency ratio (CR) will be done automatically and displays as inconsistency in the right pane of the pairwise comparison table [
18].
2. Objective
The villages under the boundary of Kabul New City (KNC) have their own challenges and characteristics which need careful development and planning at the policy and management levels. As the environmental, physical, economic, genesis, size, and morphological structure of each village are different, therefore all types cannot be addressed by a single development approach. Consequently, to solve the problem, there is a crucial need for categorization of the villages based on important major parameters. Therefore, this research mainly aimed at investigating the existing status of the villages and defining parameters by the collaboration of experts to categorize them into several types based on major important factors like vacant spots, slopes, income, occupation, literacy rate, morphology, and closeness to Central Business District (CBD).
The outcome will assist the government and urban planners in saving time and resources on creating a proper platform for developing each individual category of the villages in a sustainable and more applicable way.
3. Study Area
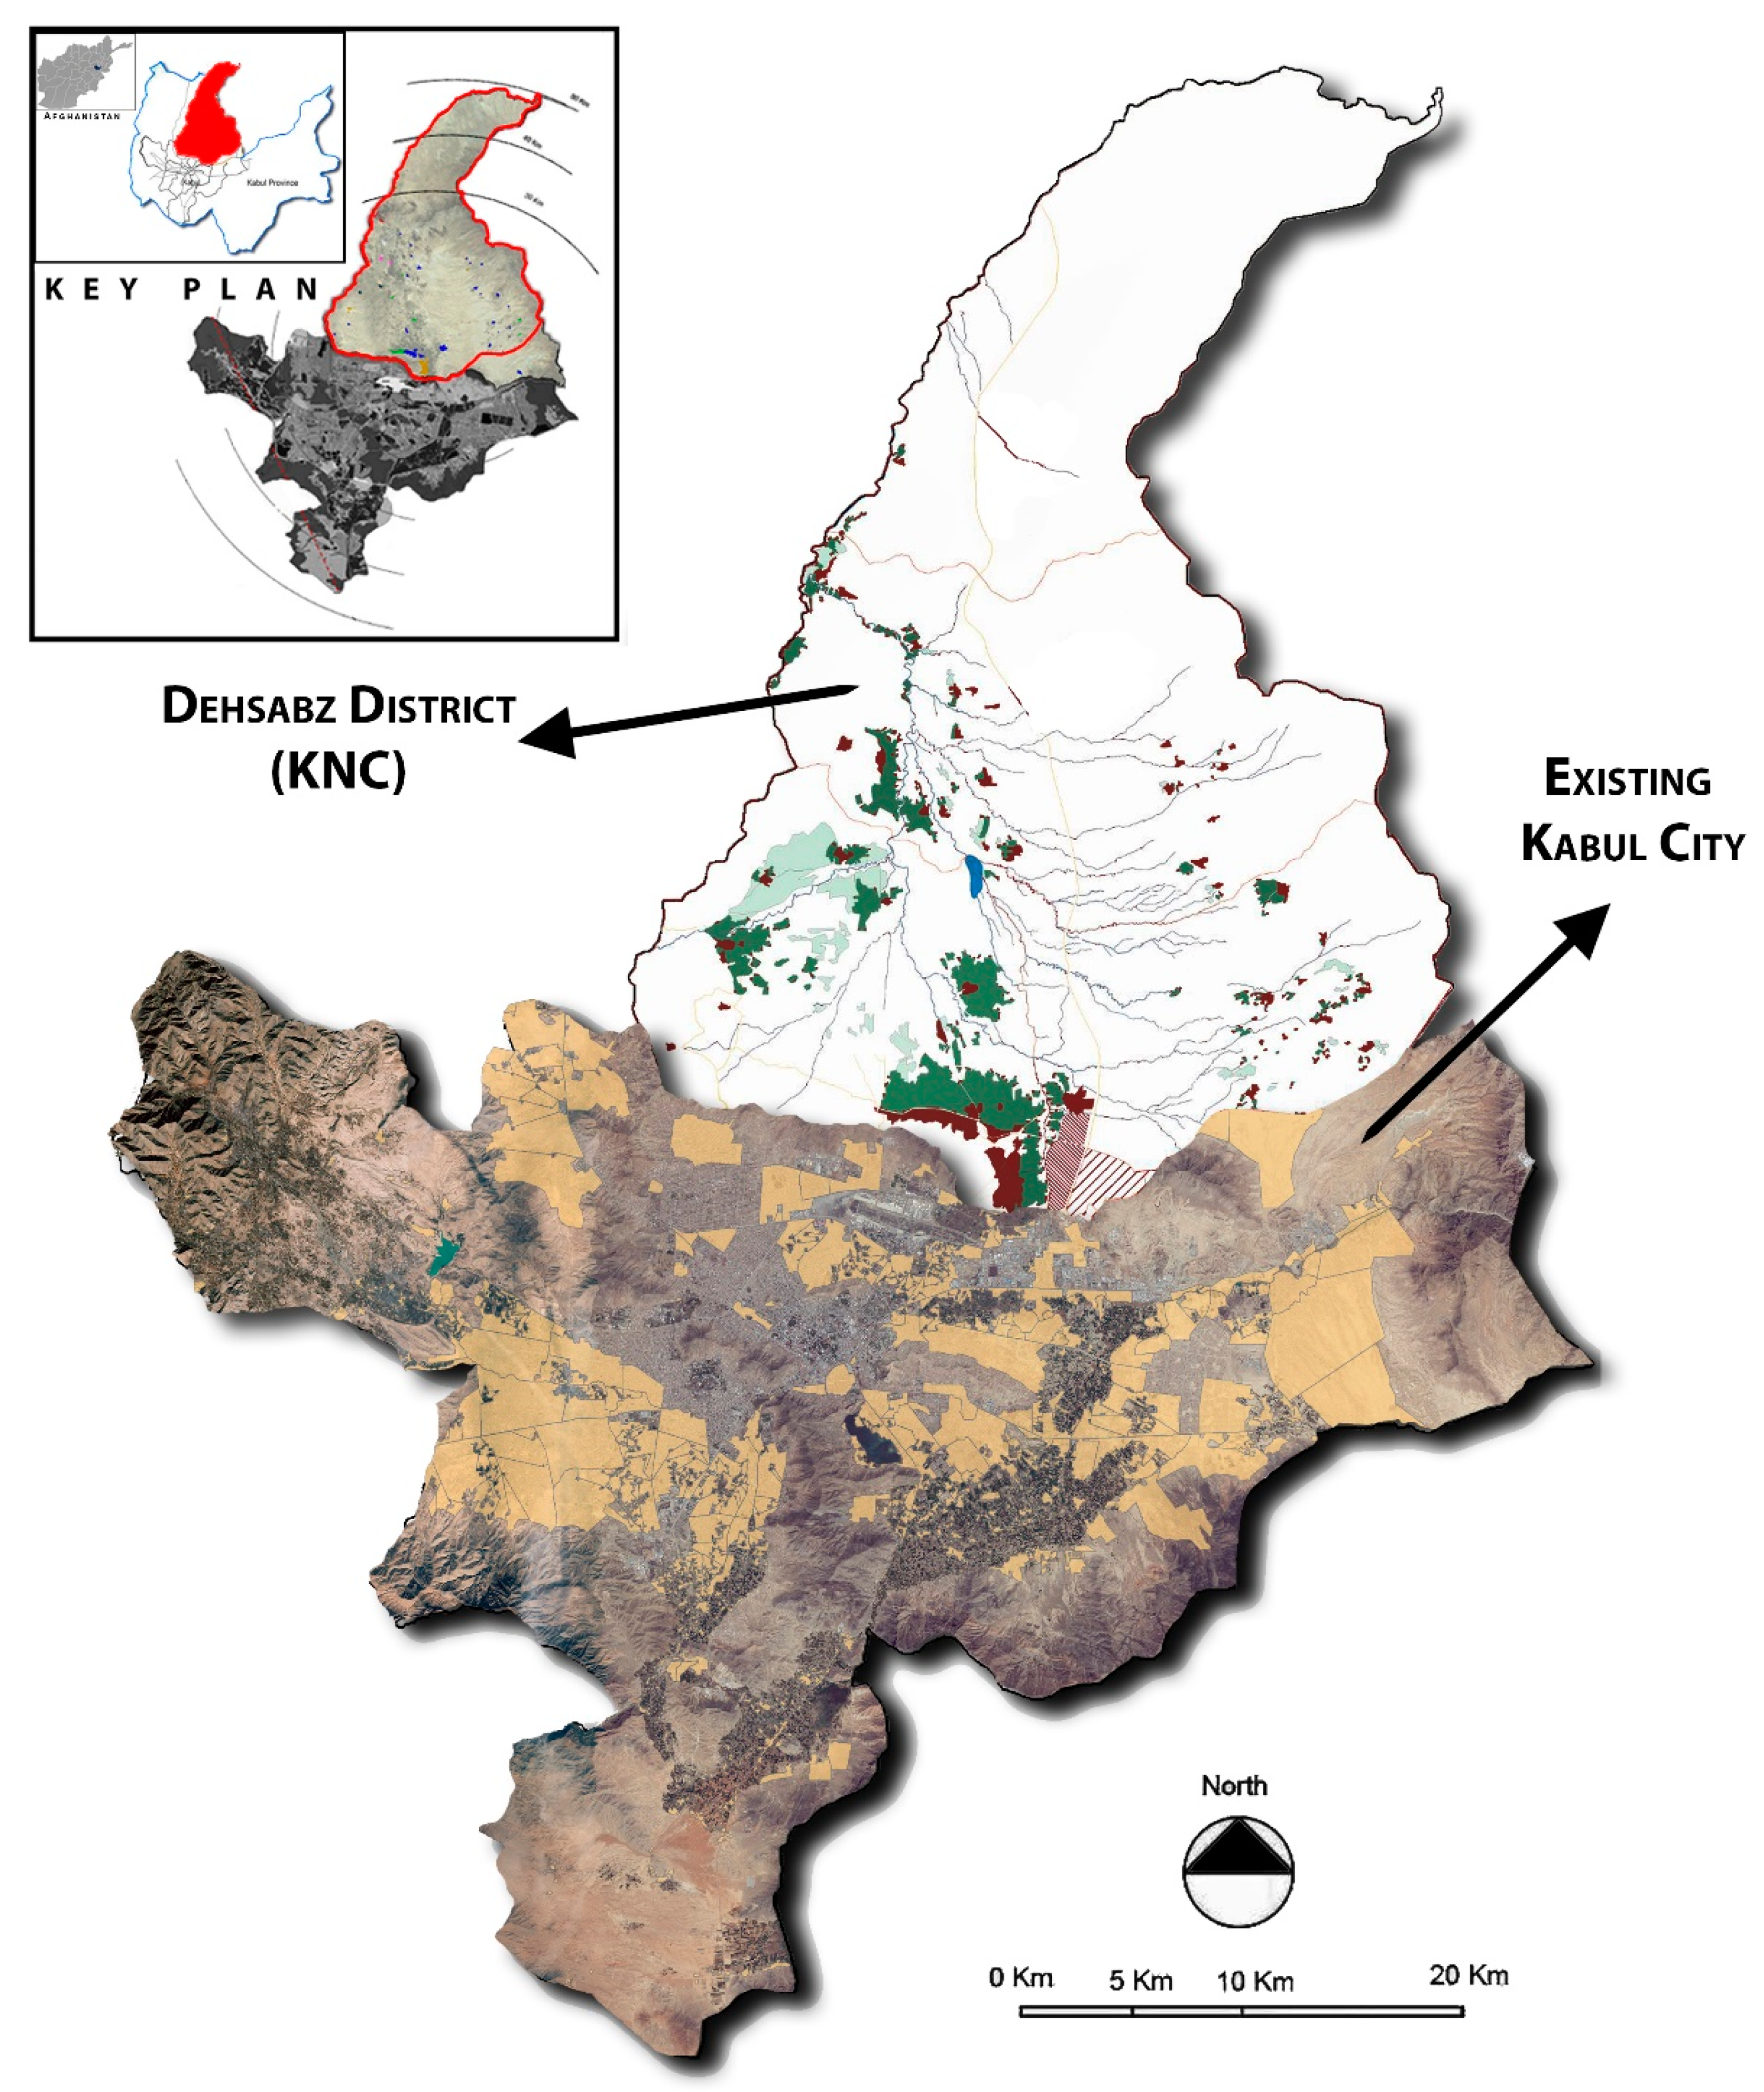
Kabul New City project with 69°36′18″ longitude, 34°20′42″ latitude, and an elevation of 1847 m is located in the north of current Kabul city (see
Figure 2). The area of the project is approximately 740 Km
2. Under the boundary of KNC, there are about 54 villages, some of which are destroyed or do not exist anymore, and about 140,000 people are living there [
4]. Based on the availability of the data, 36 villages have been taken as the research target. The map below shows the location of the research area.
4. Materials and Methods
This study uses a descriptive–analytical method to identify the potential development for each village. The required data for this study were collected from Capital Region Independent Development Authority (CRIDA), and the needed maps (layers) were prepared using ArcGIS and AutoCAD software. Seven principal factors were identified and rated in cooperation with local experts and urban planning specialists. Super Decision Making software was used as an Analytic Hierarchy Process (AHP) tool to analyze and weight the criteria and sub-criteria. Afterward, a spatial model (or Geodatabase) was developed in ArcGIS to combine the maps with the weights received from the experts to generate a map showing potential development by ranking the villages into very high, high, moderate, low, and very low categories.
The pairwise comparisons of various criteria were organized into a square matrix. The elements of the normalized eigenvector were weighted with respect to the criteria and sub-criteria [
20]. The consistency of the matrix of order (
n) was then evaluated. If the consistency index failed to reach a threshold level, then the answers to comparisons were re-examined. The consistency index (
CI) was calculated as:
where
CI is the consistency index,
λmax is the largest or principal eigenvalue of the matrix, and
n is the order of the matrix. Consistency Ratio (
CR) is calculated by dividing the consistency index (
CI) for the set of judgments by the index for the corresponding random matrix [
21]. RI is the random consistency index, which depends on the matrix size (
Table 2) [
22].
As a rule,
CR ≤ 0.1 should be maintained for the matrix to be consistent. A homogeneity of factors within each group, a smaller number of factors in the group, and a better understanding of the decision problem improve the consistency index [
23]. For this study, the consistency ratio (
CR) was calculated as 0.04; thus, indicating that a consistent matrix was formed. The diagram in (
Figure 3) illustrates the whole methodology for this research.
5. Empirical Research Analysis
Questionnaires about performance parameters were prepared for pairwise comparisons, and a survey was conducted by involving experts and technical employees of the urban planning and village development sectors in Afghanistan. After a period of research and discussions with the urban planning experts and considering the main purpose of the research, efforts were made to take into account the most important major factors which are available and have the highest impact from the urban planning point of view with respect to the categorization of villages. The Following are the parameters chosen by the experts after a more in-depth review.
Vacant plot index
Slope index
Proximity to the CBD index
Physical status of the villages index
Literacy rate index
People involved in agriculture index
Agricultural income index
These parameters are so much related to the physical, cultural, and economic status of the villages in Afghanistan, and each one of them has its sub-indexes which will help us in further analysis of the data. Before entering the data into GIS software, a pre-questionnaire was prepared and shared with the experts and urban planners to weigh the parameters (
Table 3). It is worth mentioning that Saaty’s priority theory which is shown in (
Table 4) has been used to rank and weigh the parameters based on their importance level. It presents an underlying scale for pairwise comparisons with a range of crisp values from 1 for equally important to 9 for extremely important, and the integers between them [
24].
Once the experts ranked and weighted the parameters, the data and numbers have processed from the Super Decision Making software and then inserted into GIS for further analysis. The parameters have been described in detail as follow:
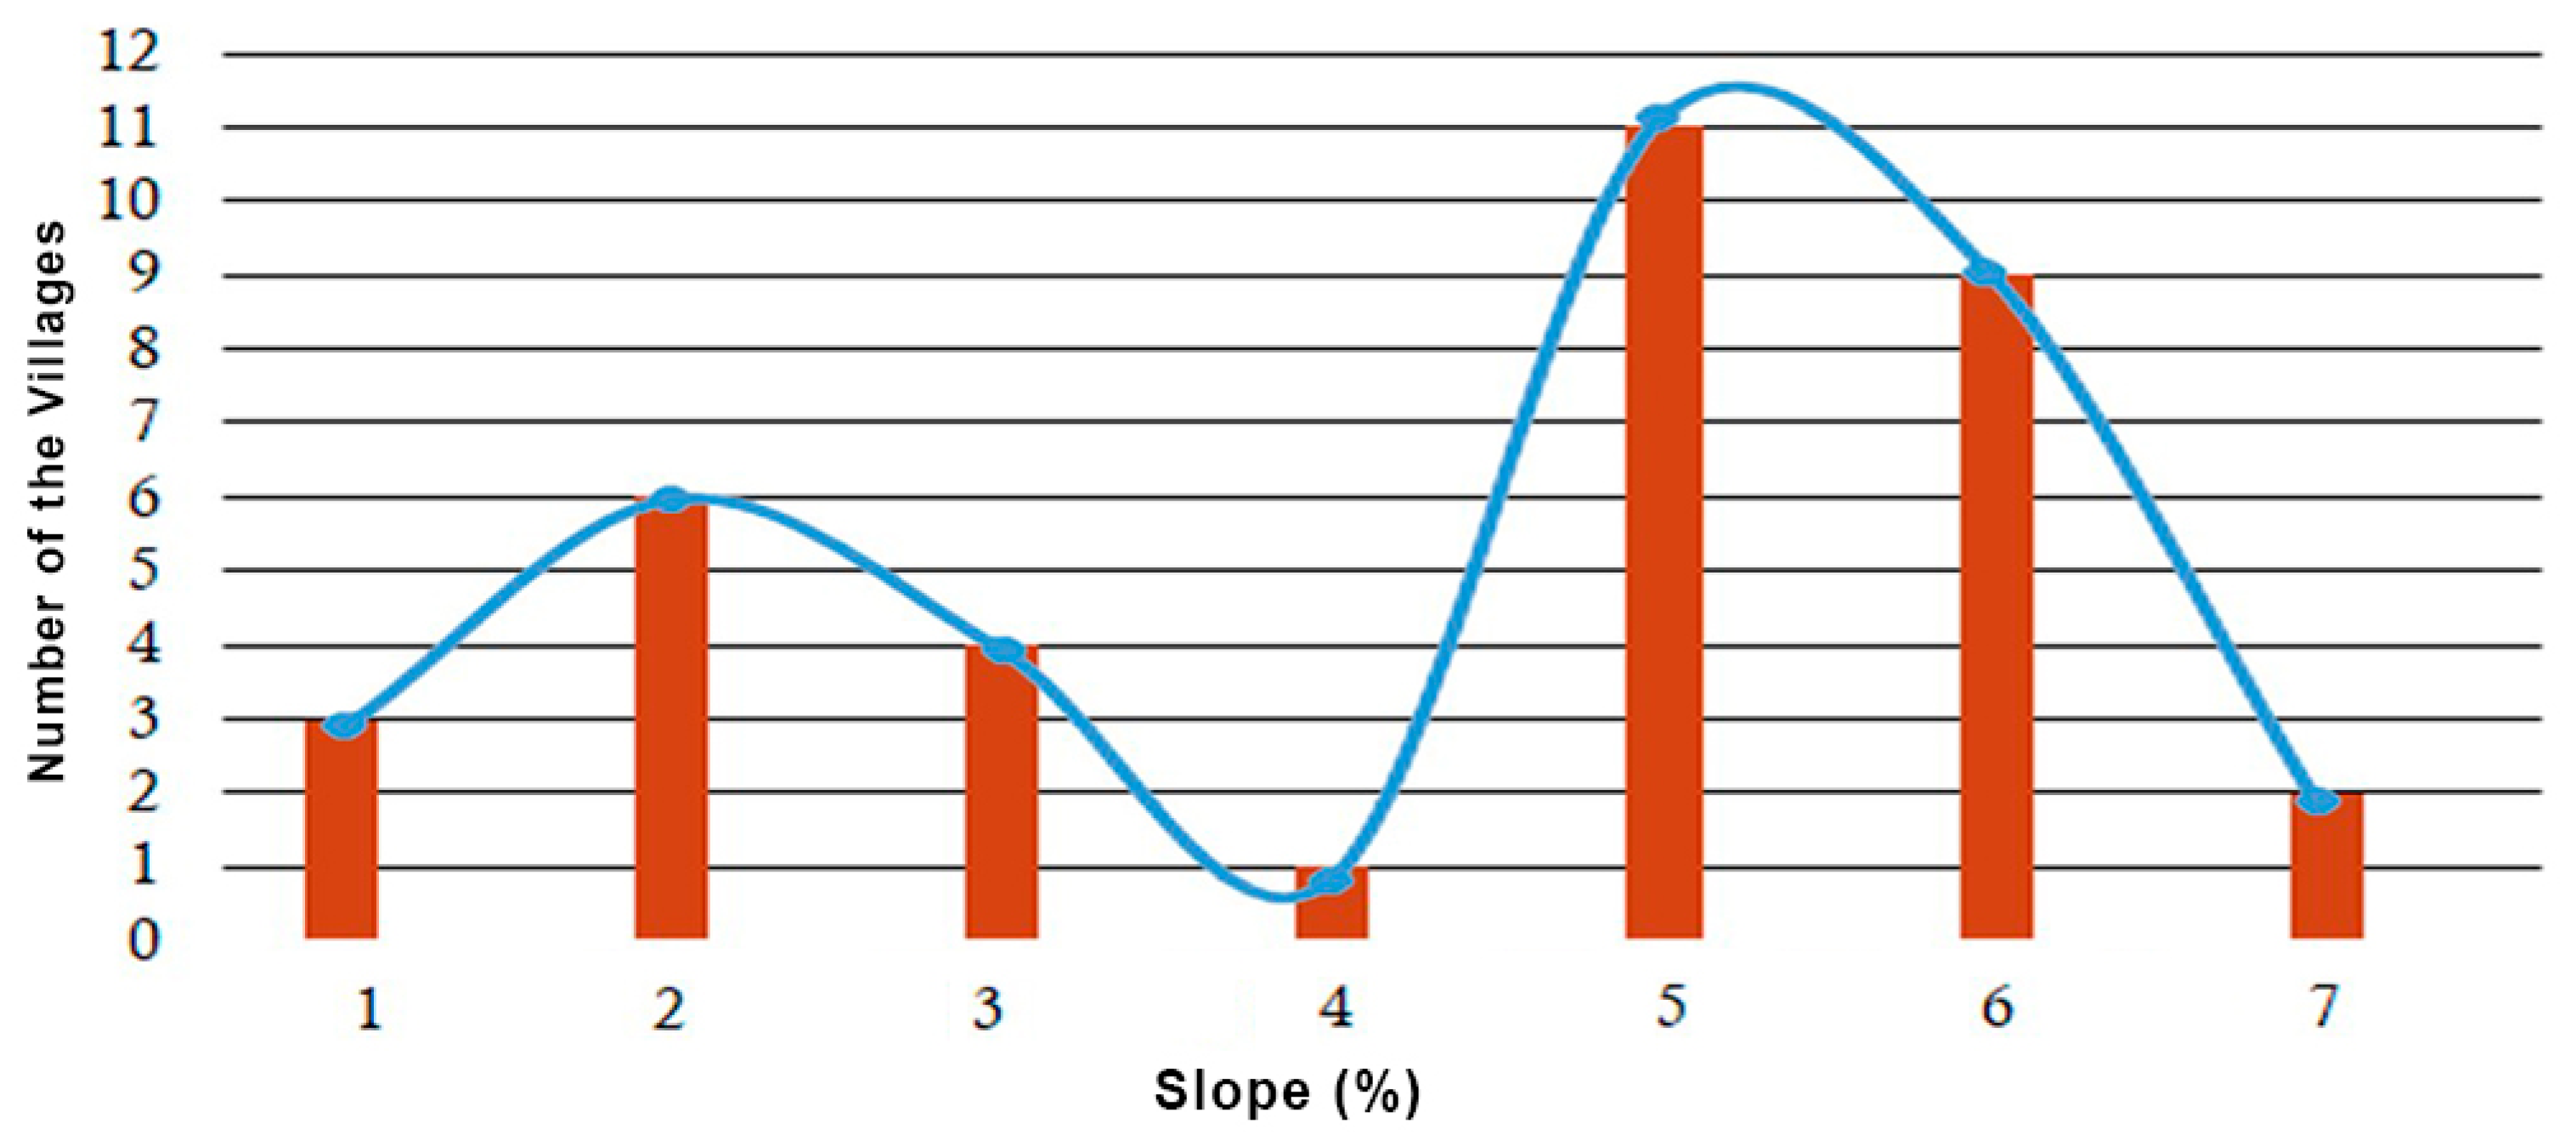
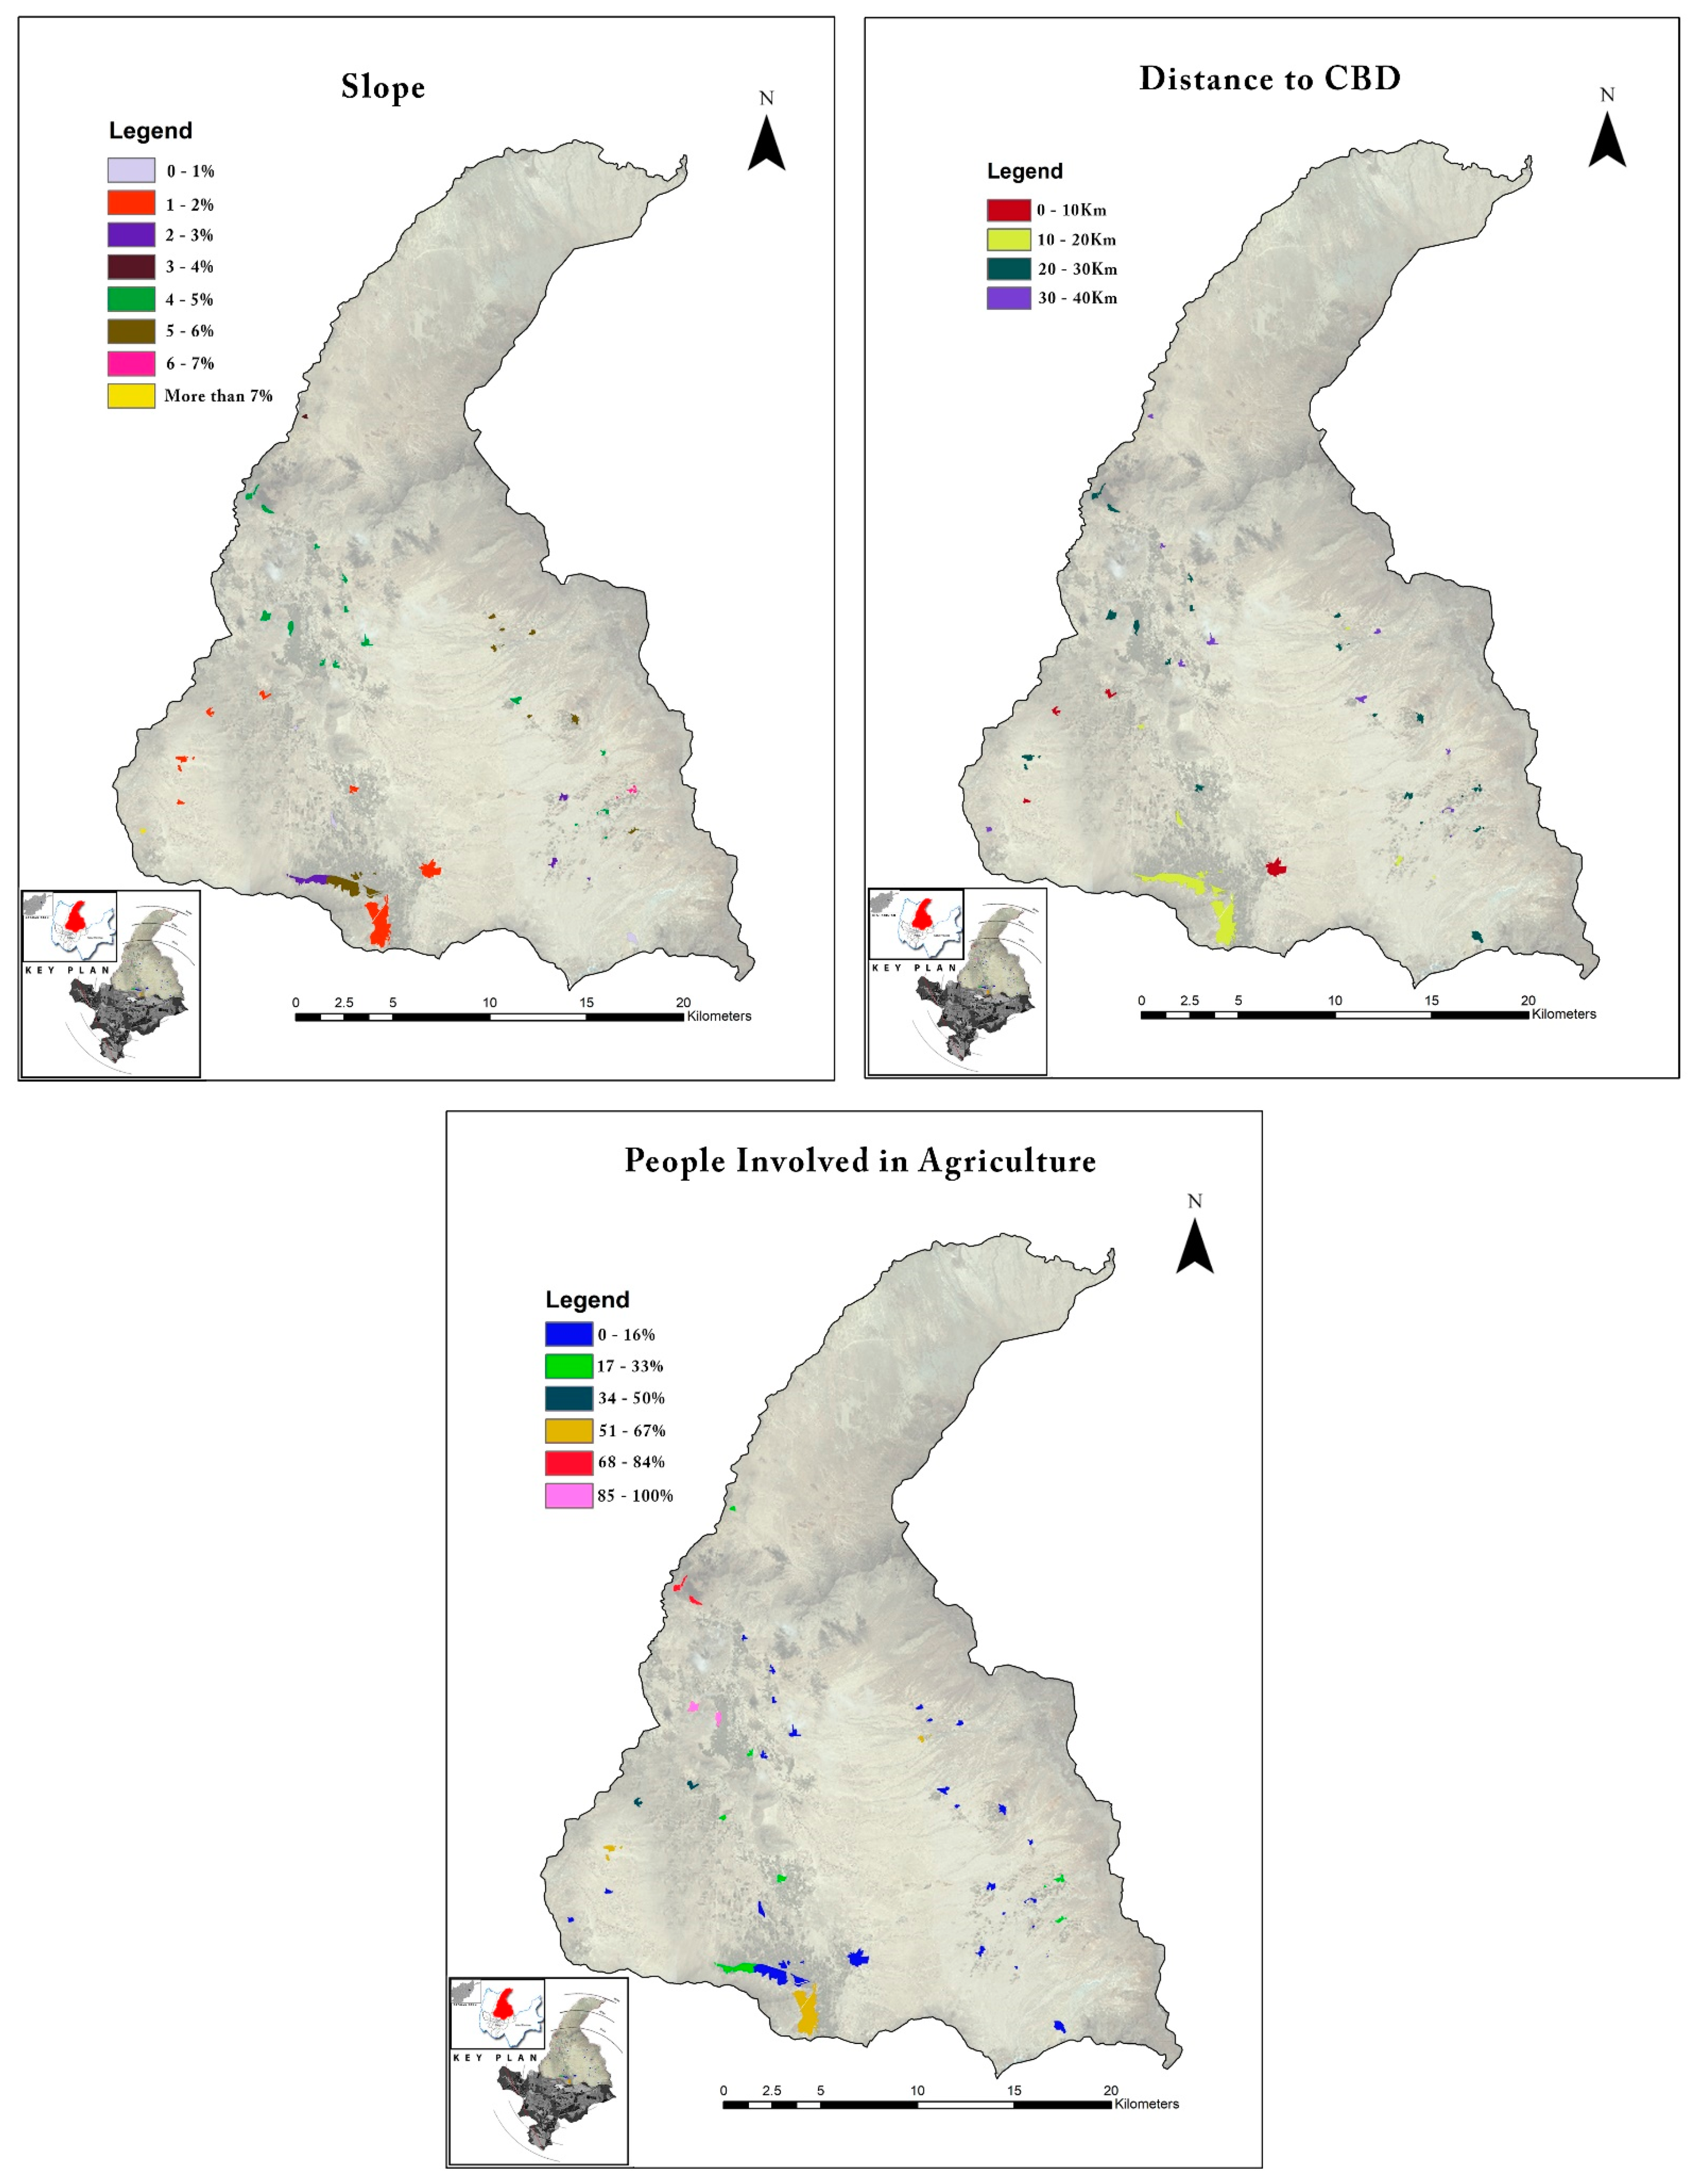
5.1. Parameter #1: Slope
Under the boundary of KNC, all the villages are located on land with less than 10% gradients. It is worth to be mentioned that as the slope is getting smoother, the development is getting easier, and the cost will be lower. The histogram of the slope for the villages is shown in
Figure 4.
Considering the geographical and economic condition of Afghanistan, a slope with less than 10% gradient is considered low and easy for development, and a slope with gradients of 10–30% is accepted as a moderate slope and considered not so difficult for building infrastructures. However, a slope with gradients of over 30% is considered hilly and steep, which is difficult for building infrastructures.
Table 5 illustrates the weights and potential development for each sub-parameter of a slope which has been determined by the experts.
5.2. Parameter #2: Proximity to CBD
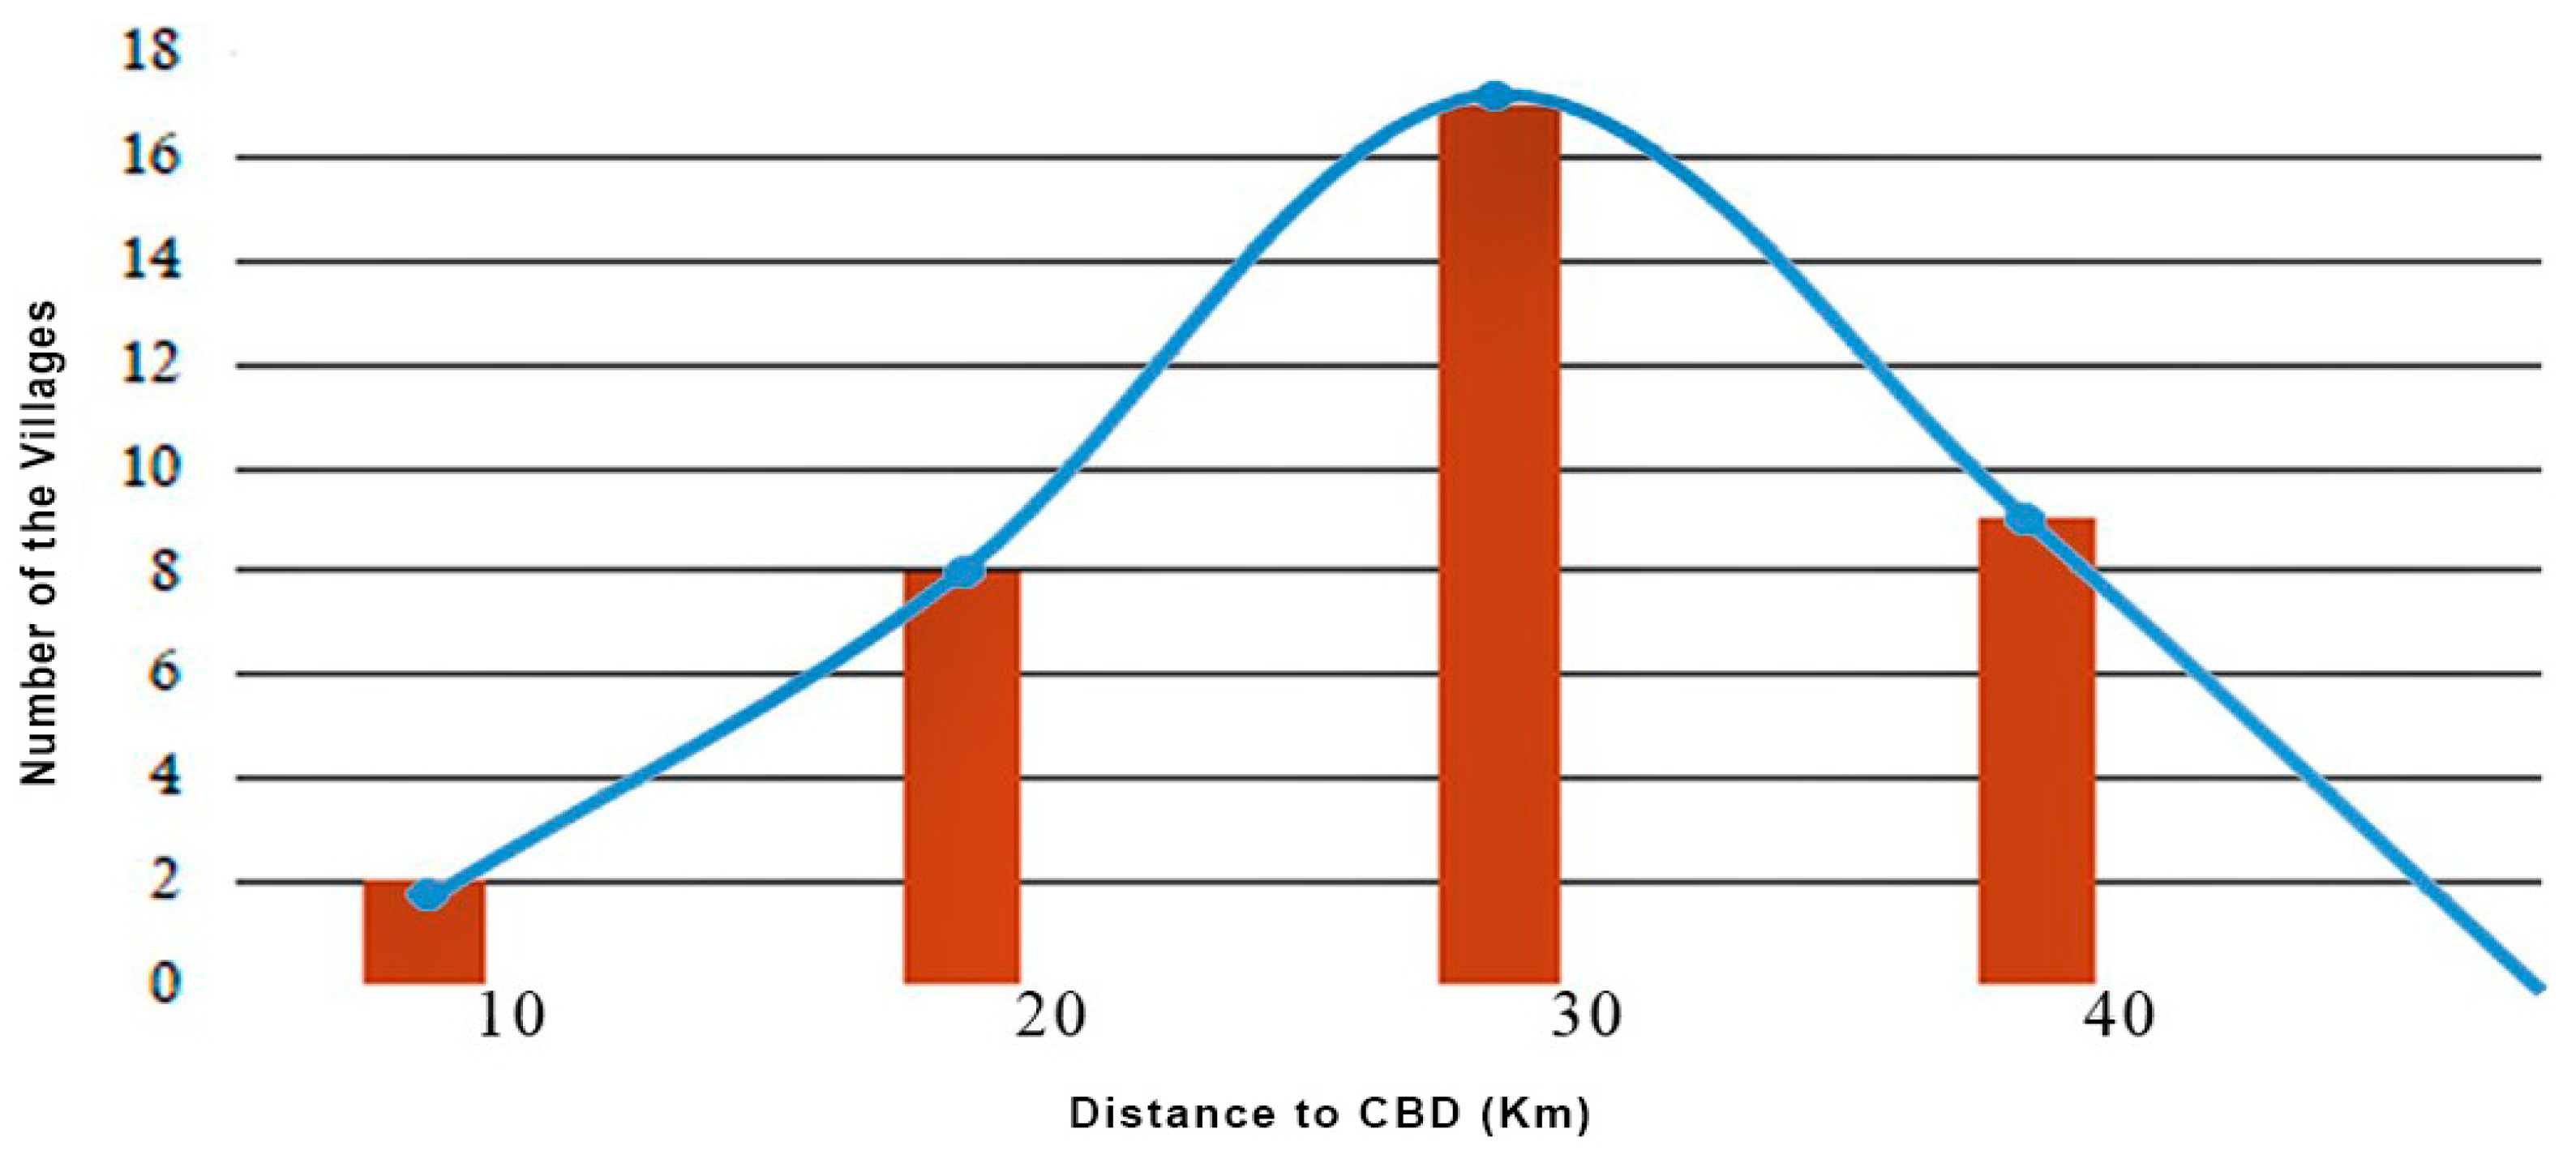
Proximity to Central Business District (CBD) is an important parameter; almost the majority of the villages from the dataset are located within 20–30 Km distance from CBD. Villages that are close to the CBD are considered suitable and better for development due to their land value and other potential developments.
Figure 5 and
Table 6 show the histogram and weights of the Proximity to CBD index.
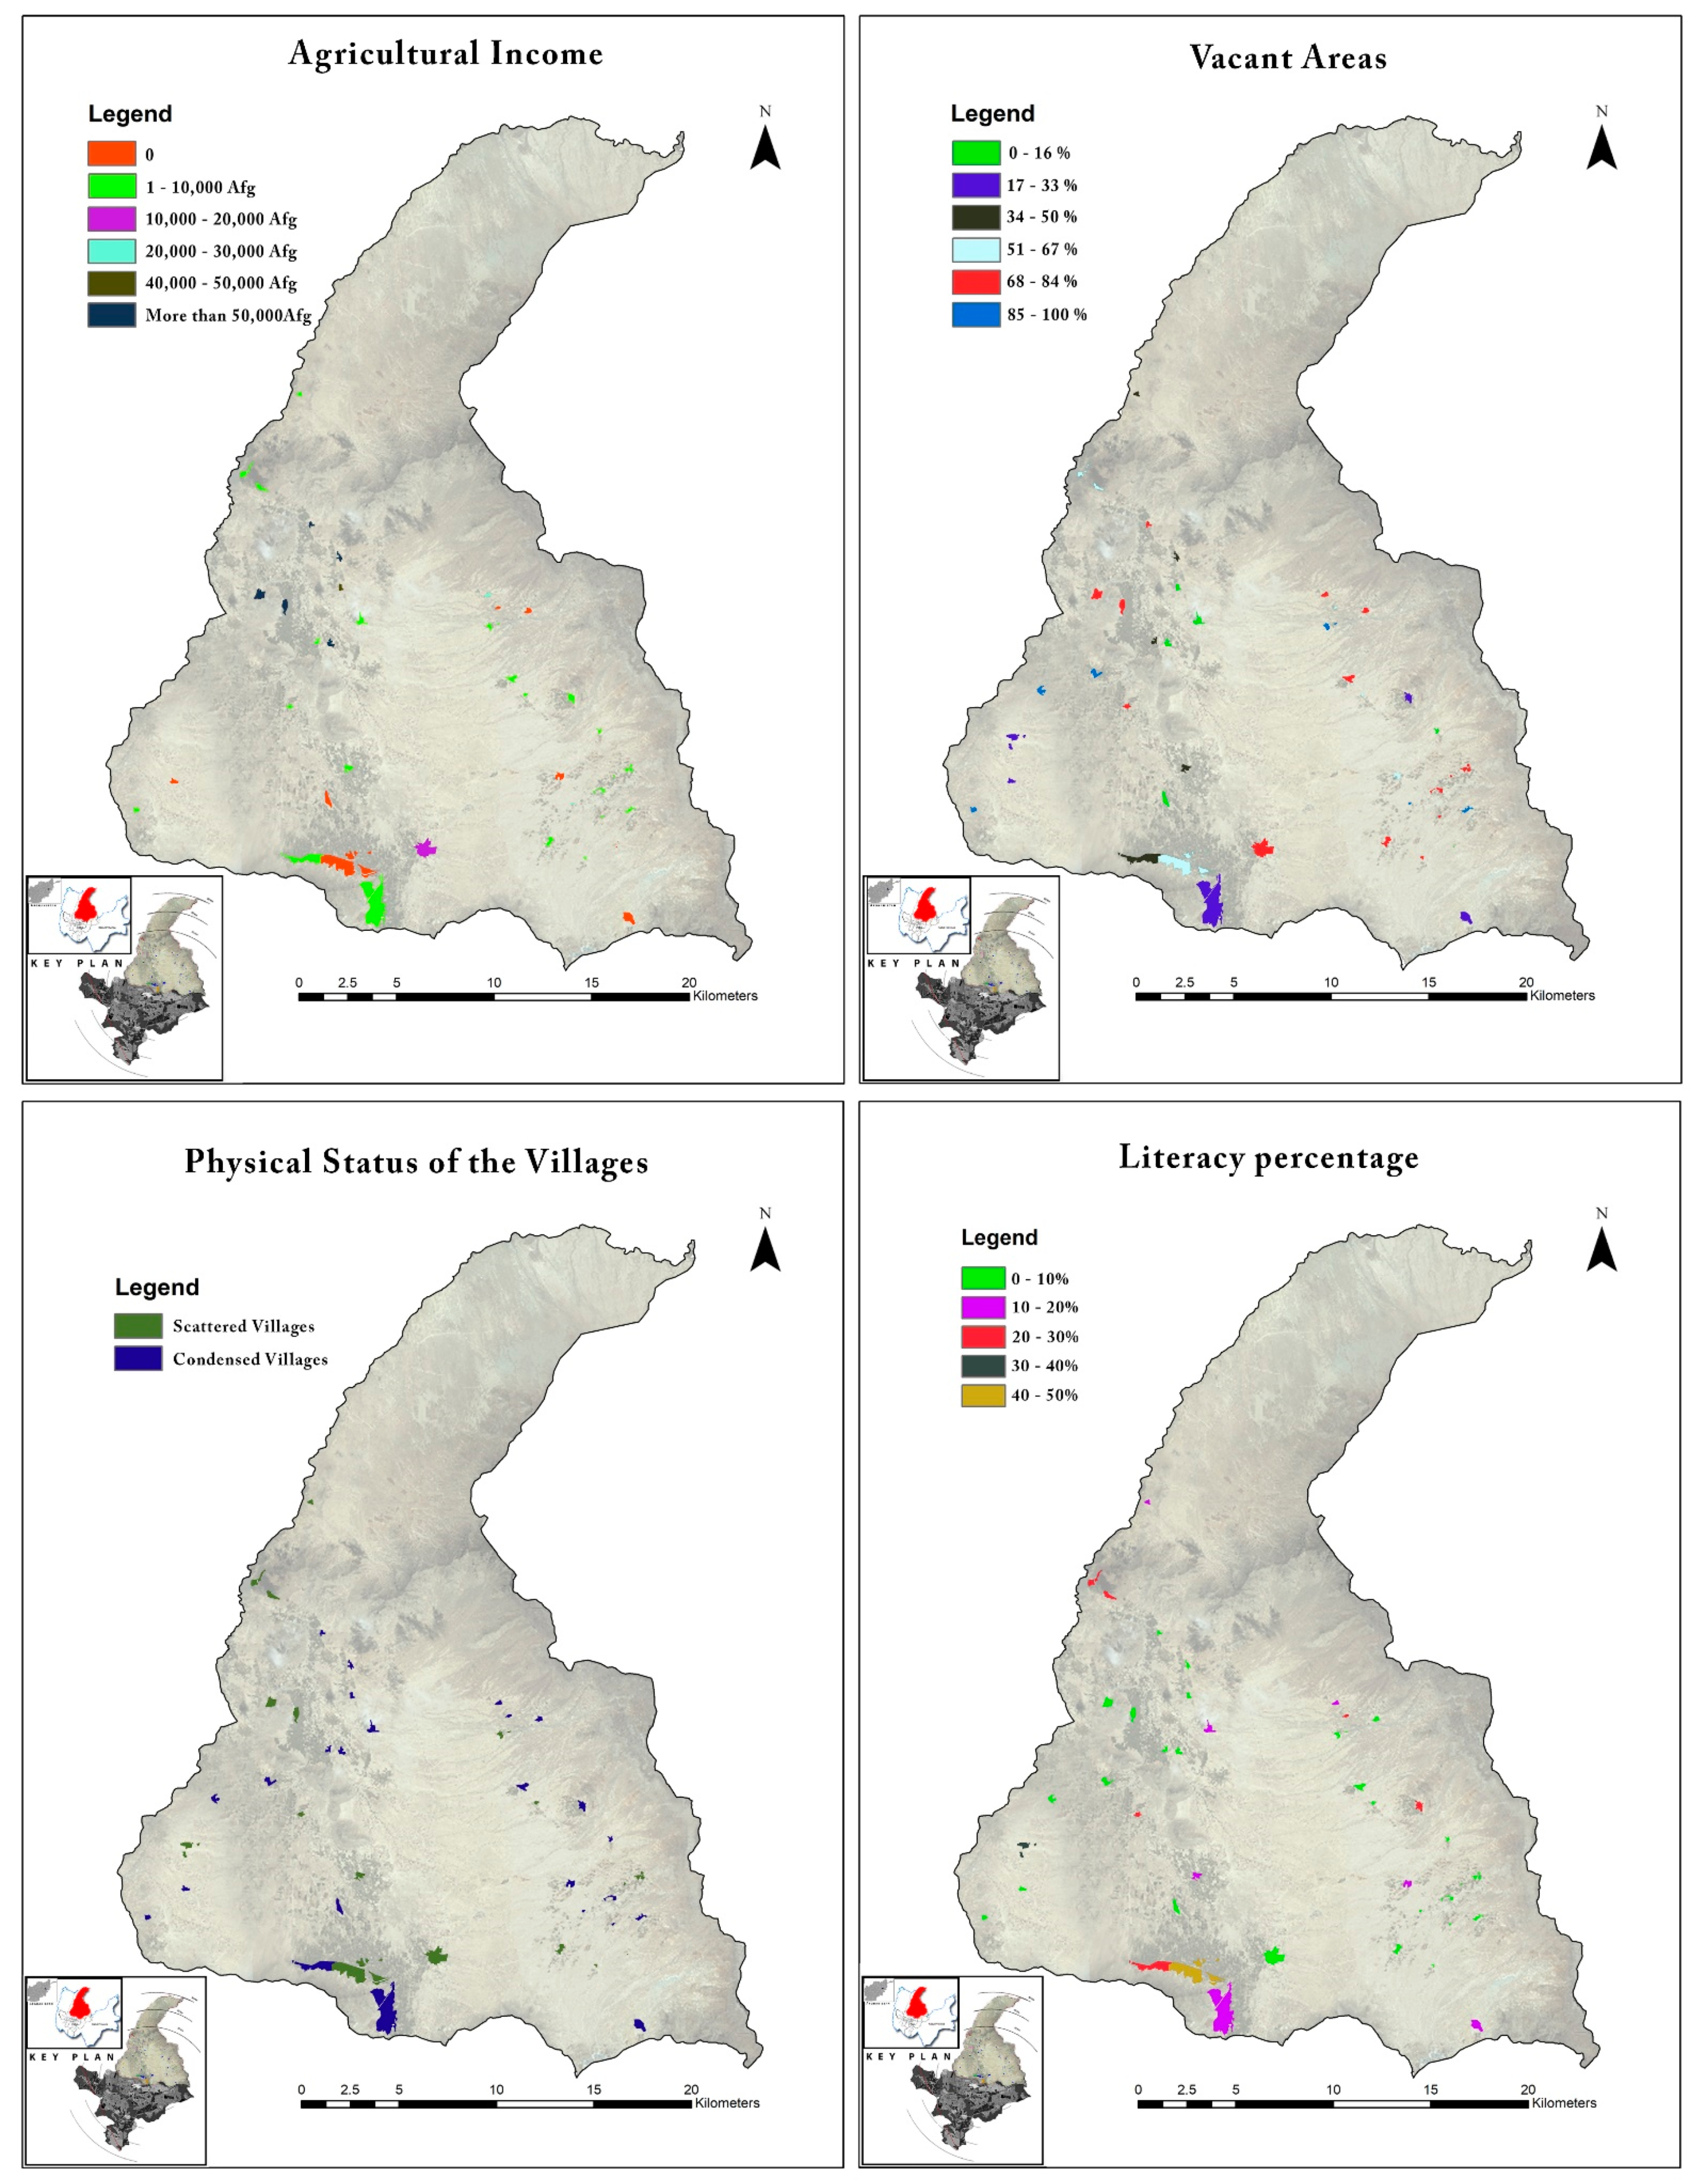
5.3. Parameter #3: Physical Status
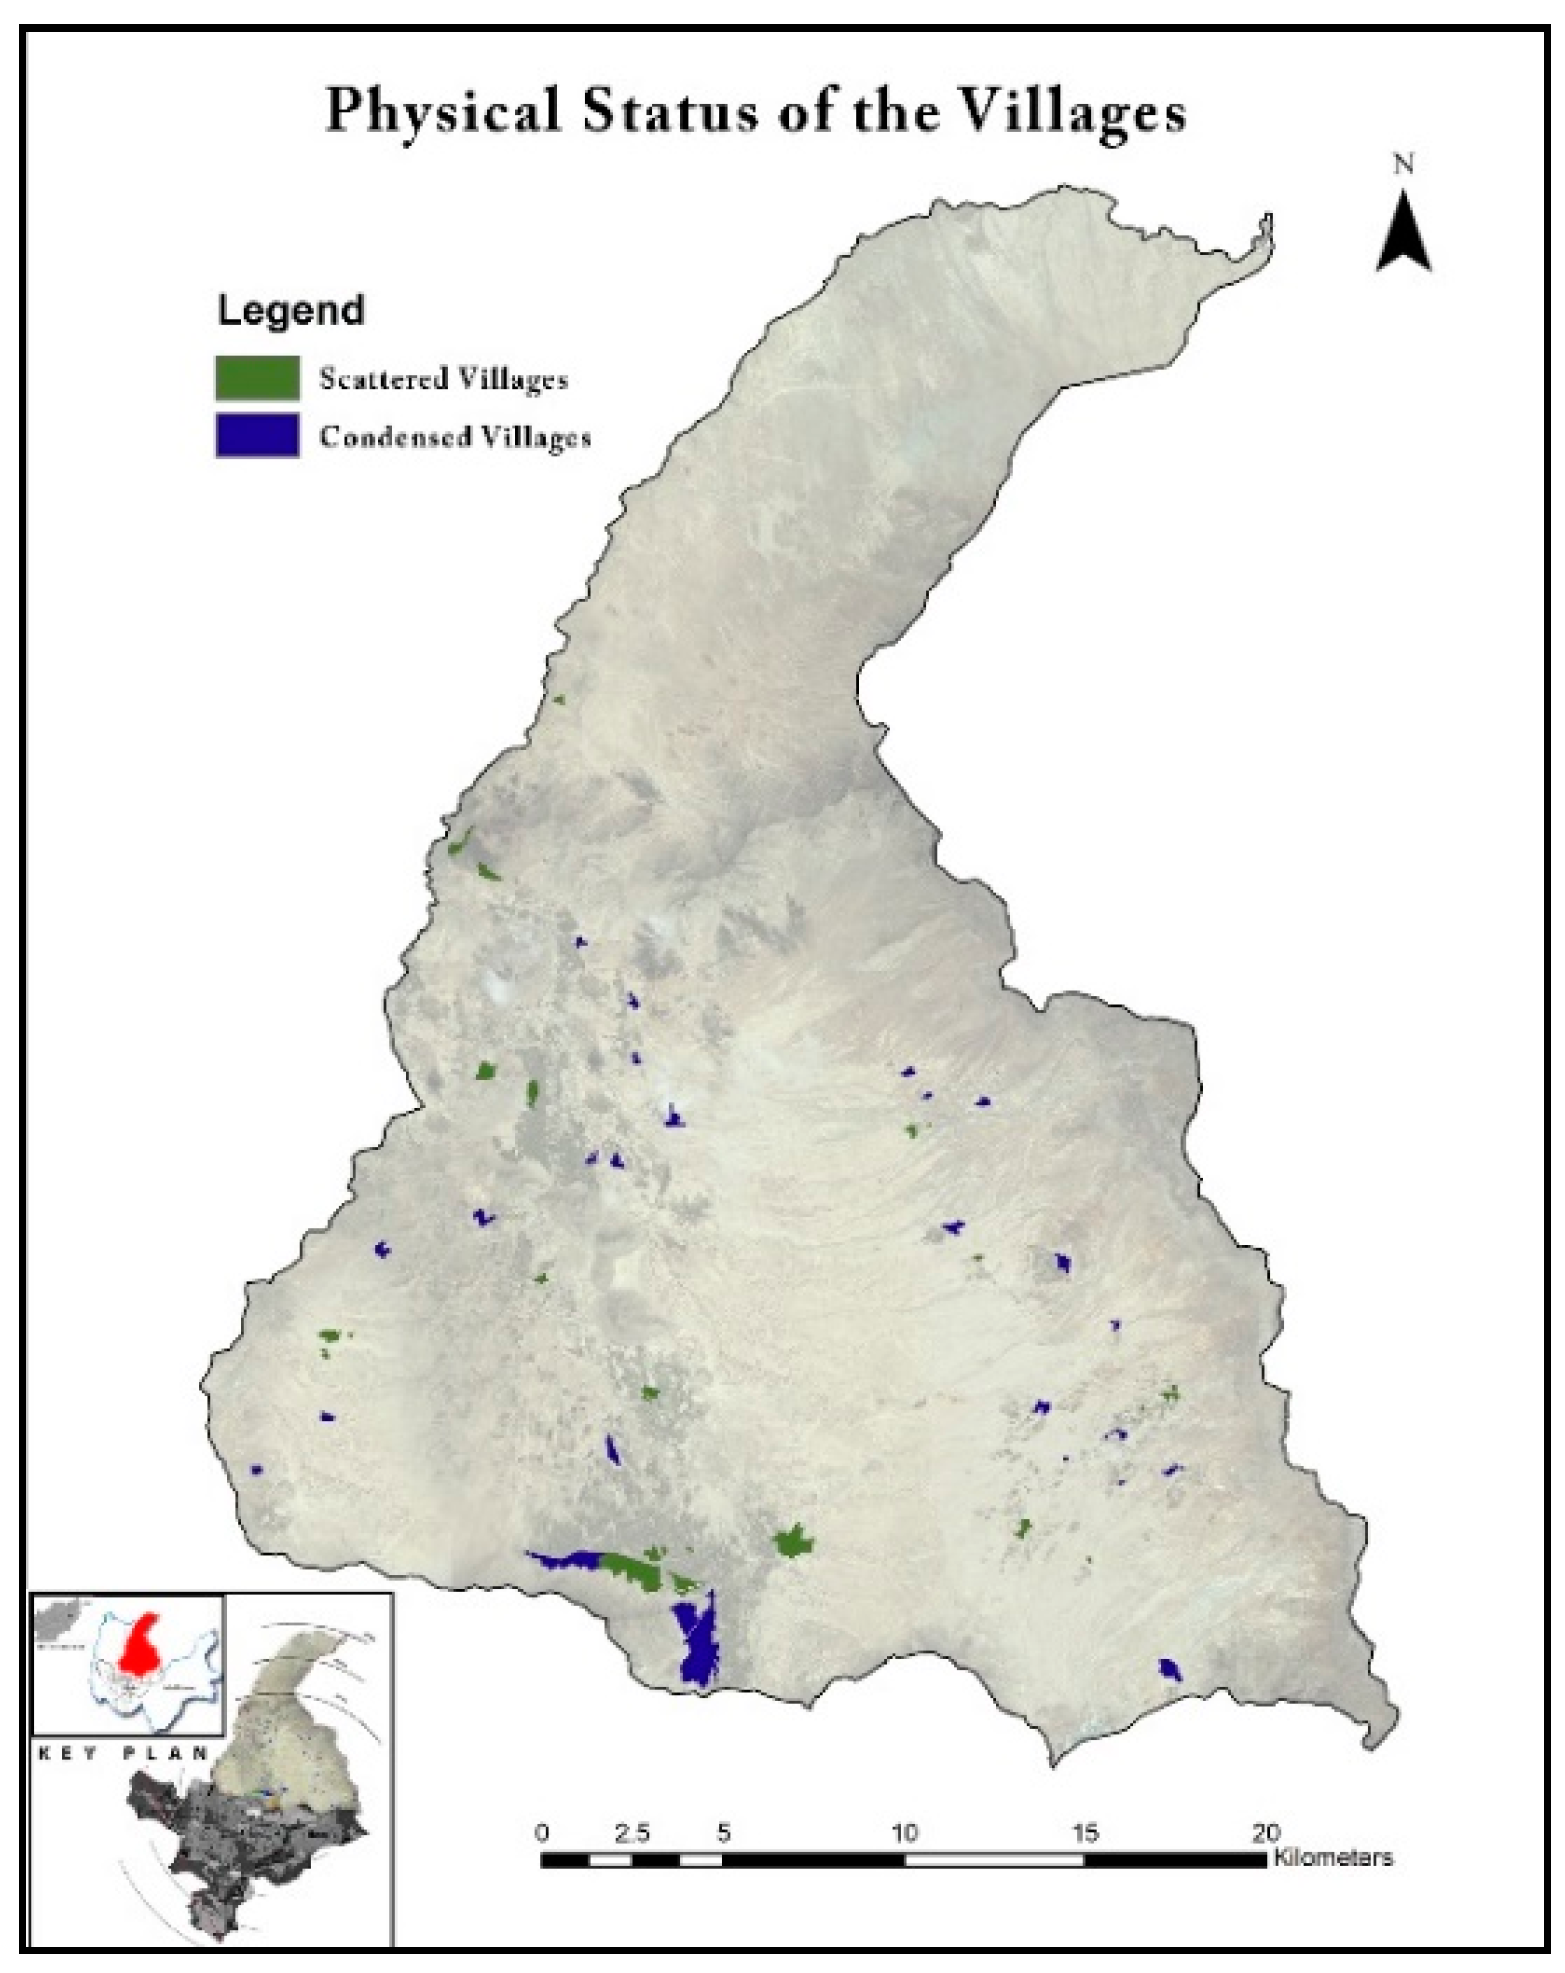
Villages can be divided into two categories when considering the Physical Status index. Villages that are condensed are more suitable for development compared to scattered ones.
The potential development for villages that are condensed is much higher in terms of providing public facilities and connectivity while planning.
Figure 6 and
Table 7 show the physical status and weights which have been assigned by the experts.
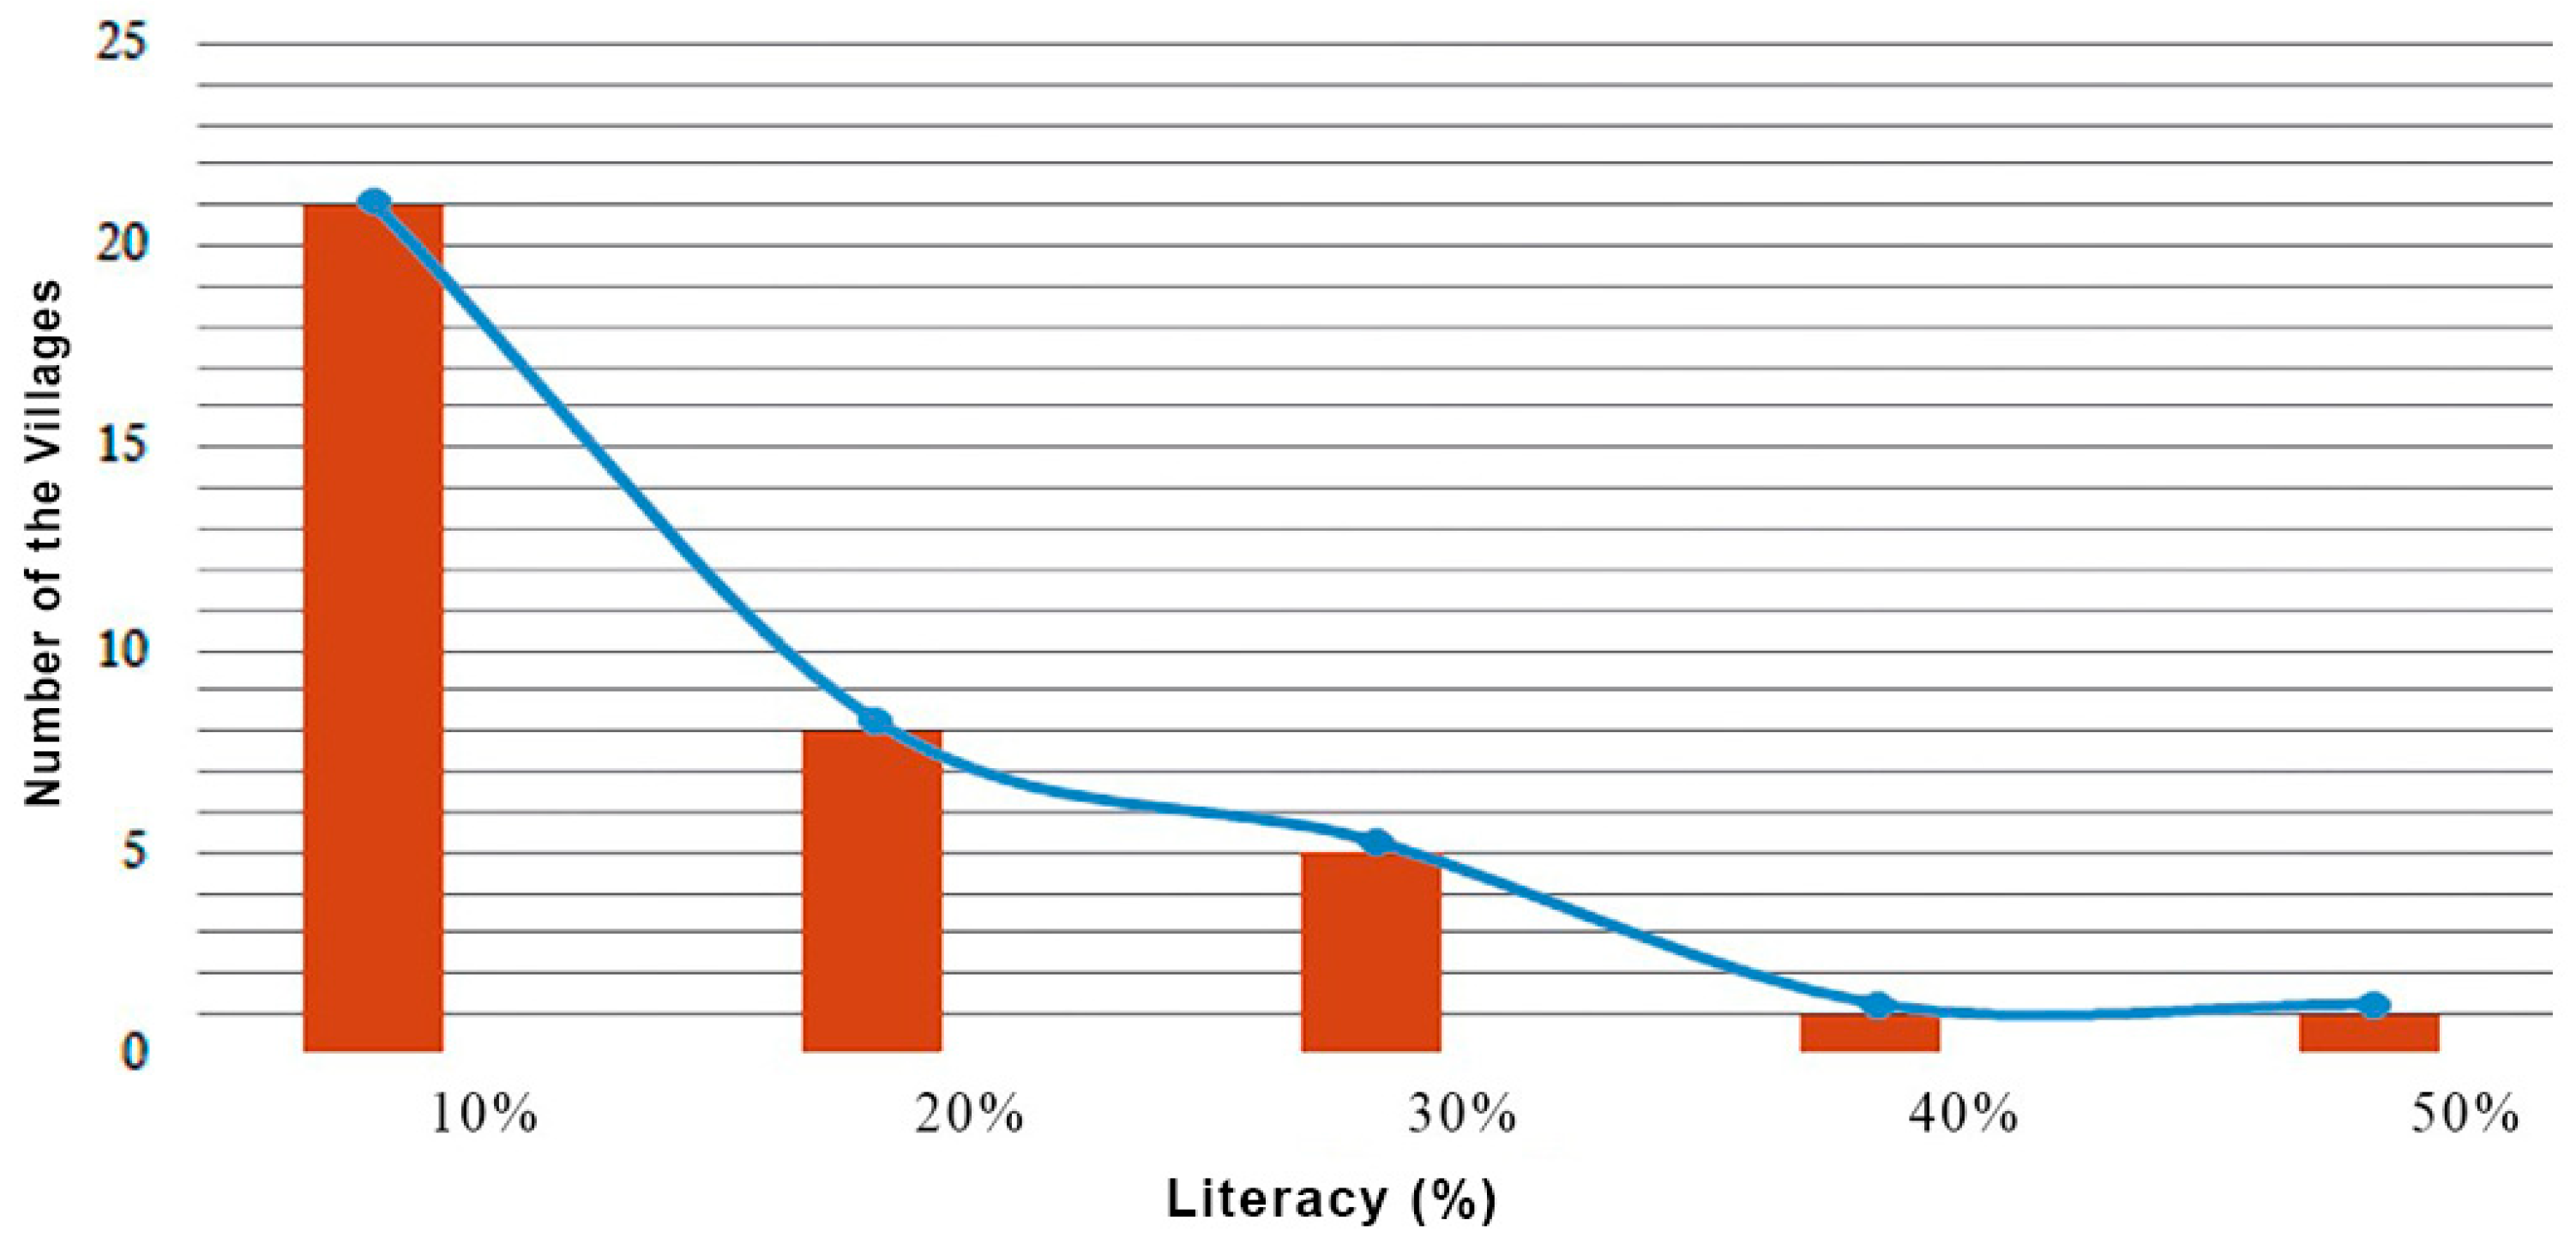
5.4. Parameter #4: Literacy
Literacy is considering one of the key parameters in the categorization of the villages in Afghanistan. As the literacy rate is getting higher, the potentials for development will get higher, and the project duration and cost will be decreased.
Figure 7 shows the histogram for the Literacy index, and
Table 8 illustrates the weights for each sub-index.
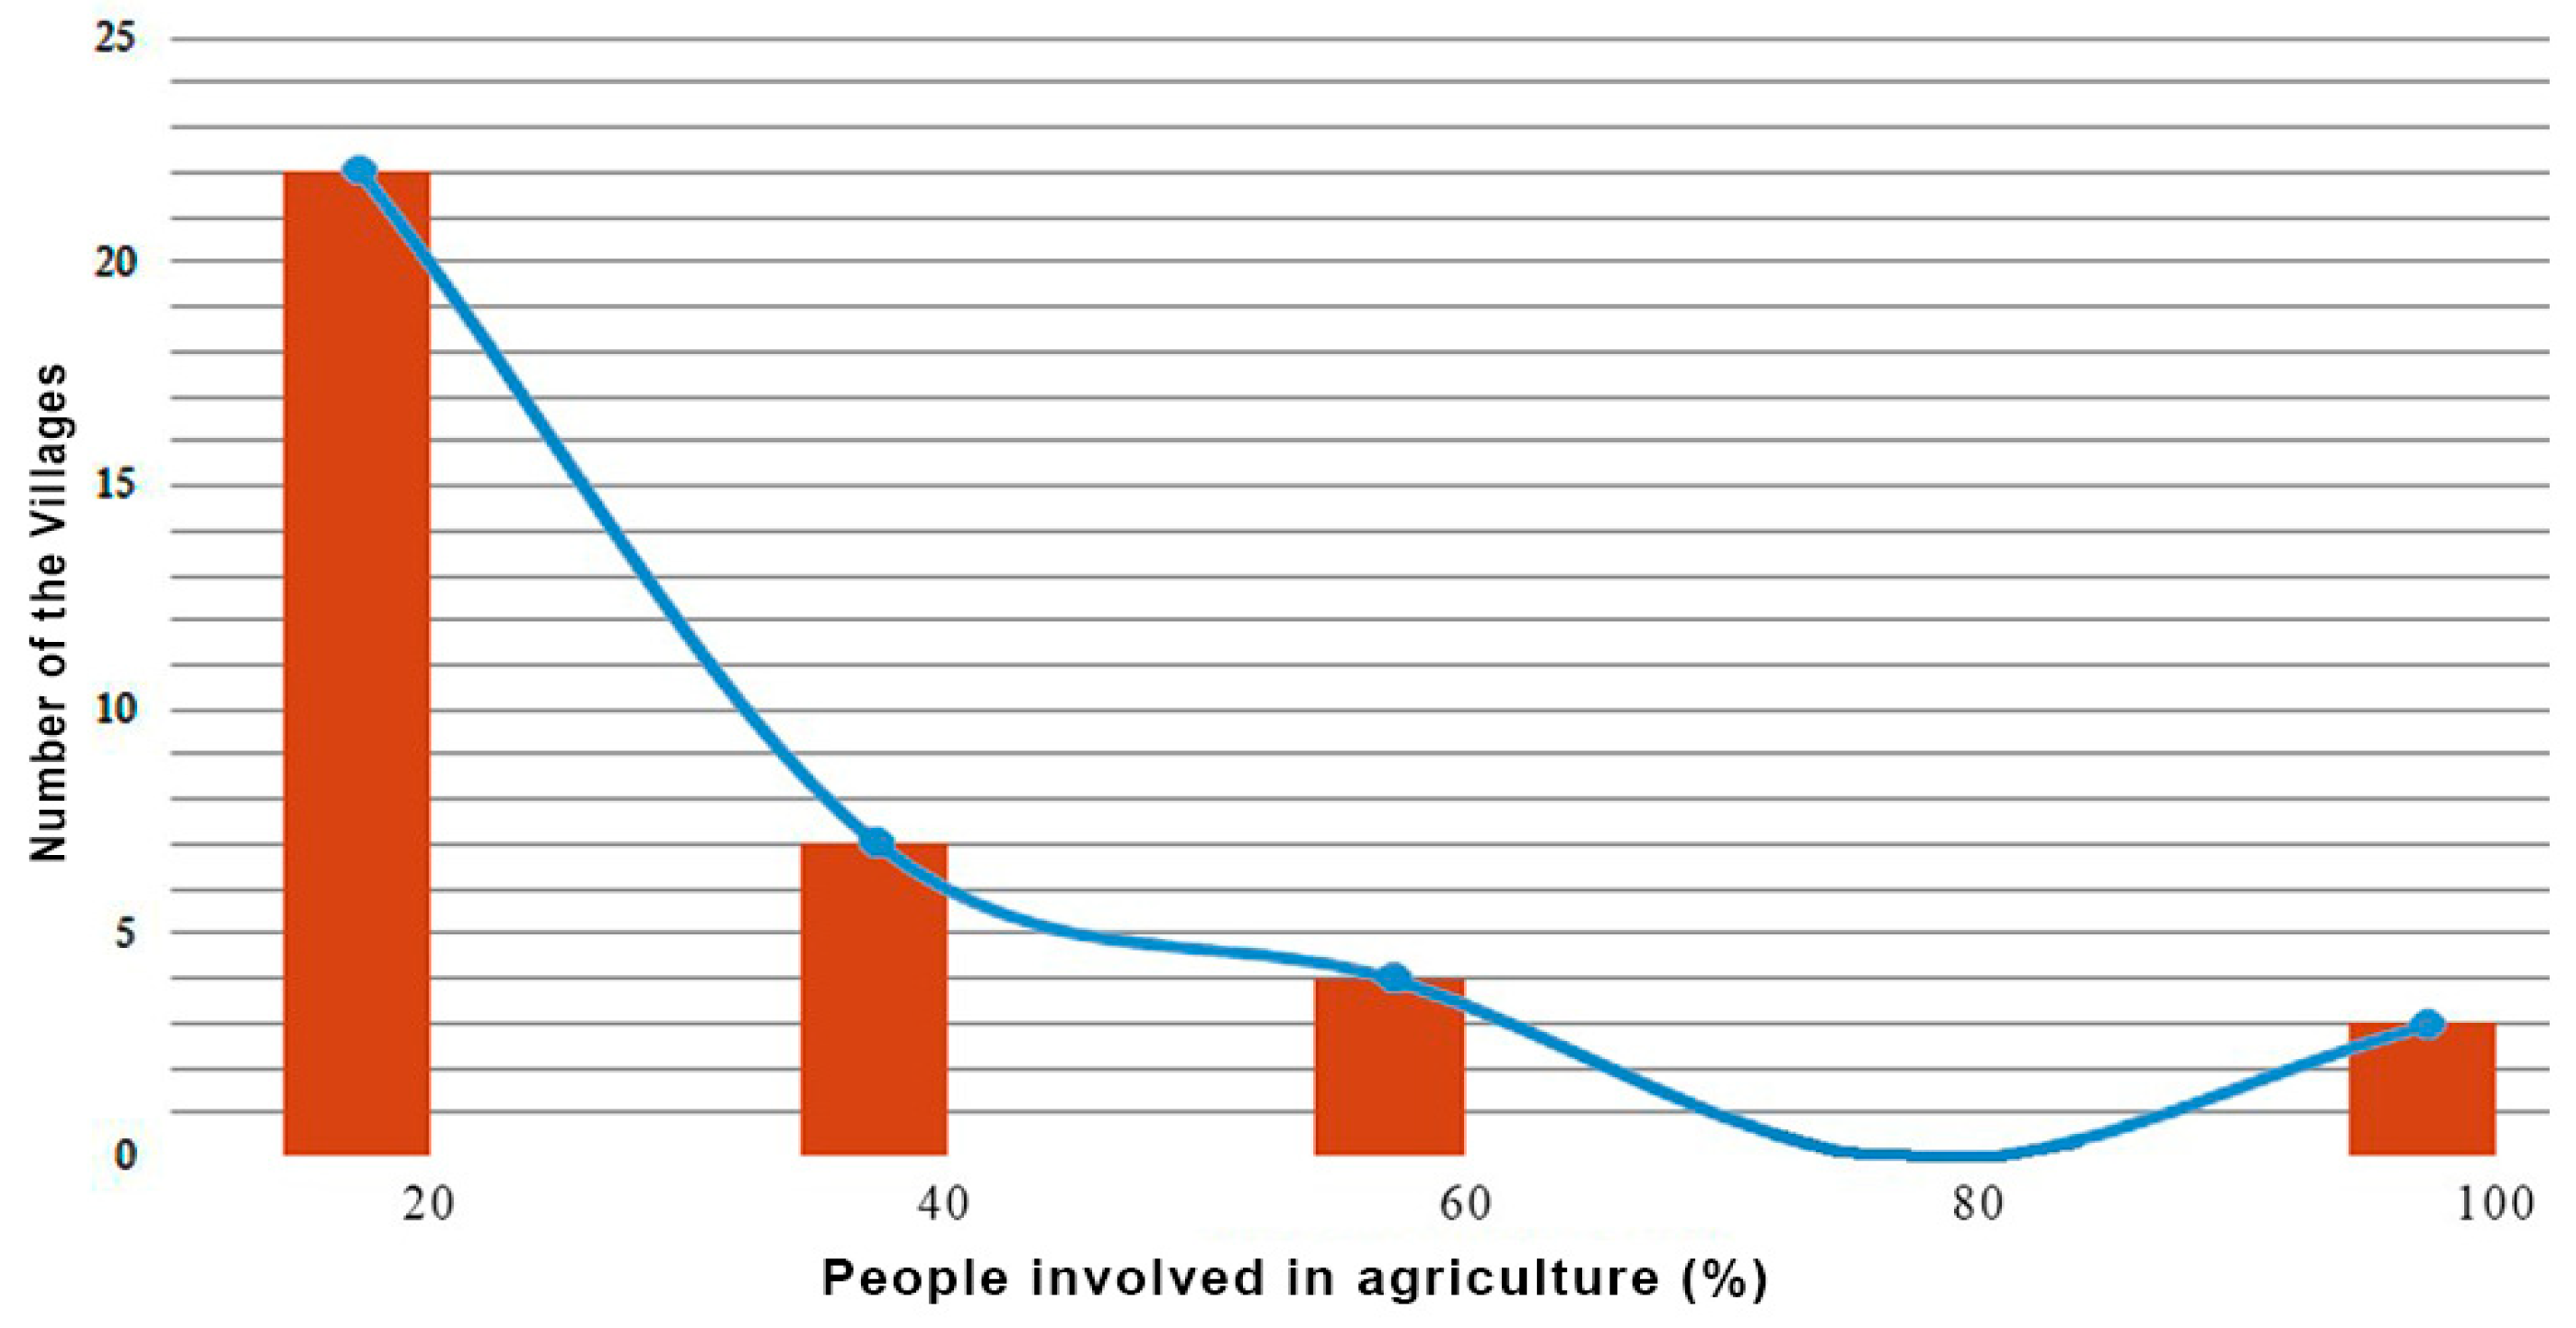
5.5. Parameter #5: People Involved in Agriculture
Agriculture is considered one of the main sources of income and activities in villages. As the people are getting more involved with agriculture, the task of providing job opportunities and maintaining a stable income for the residents would be easier for the planners. The histogram for this parameter is shown in
Figure 8.
Table 9 explains the weights and potential development for each sub-index.
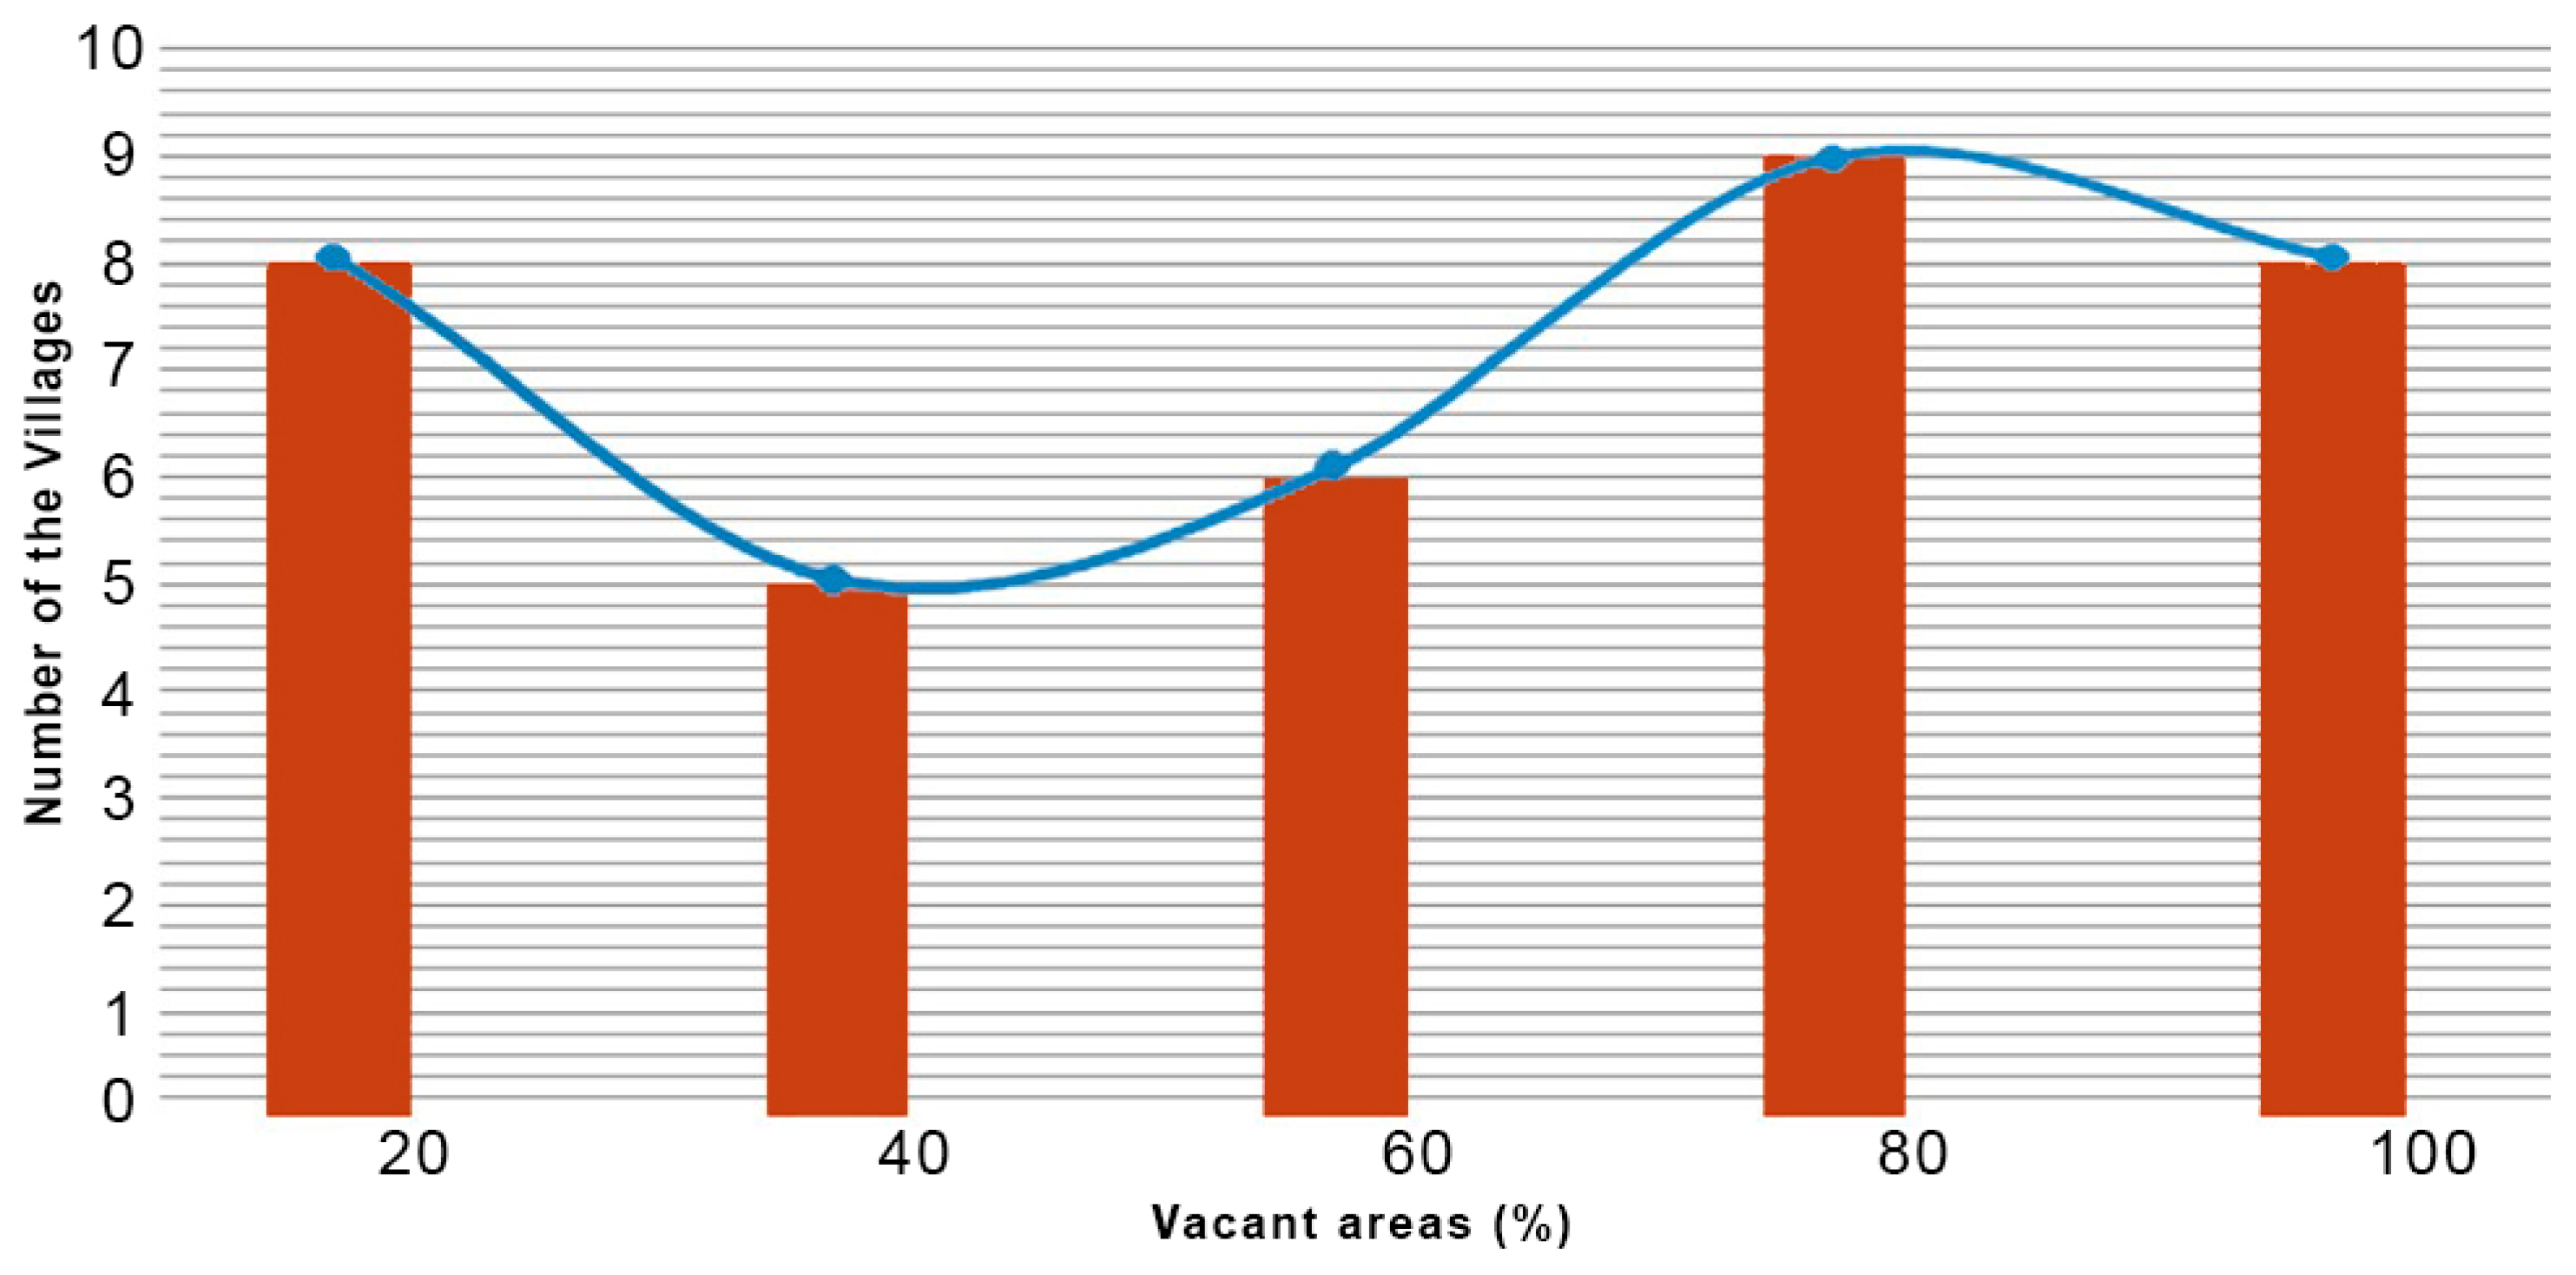
5.6. Parameter #6: Vacant Areas
Vacant plots are considered one of the potential parameters in any development approach. The higher the percentage of vacant plots, the placing of public facilities is easier and cheaper. Moreover, it will increase the possibilities of locating affected households inside the project area which will impressively decrease the rift between the government and the people.
Figure 9 shows the histogram for the Vacant area index, and
Table 10 explains the weights and potential development for each sub-index.
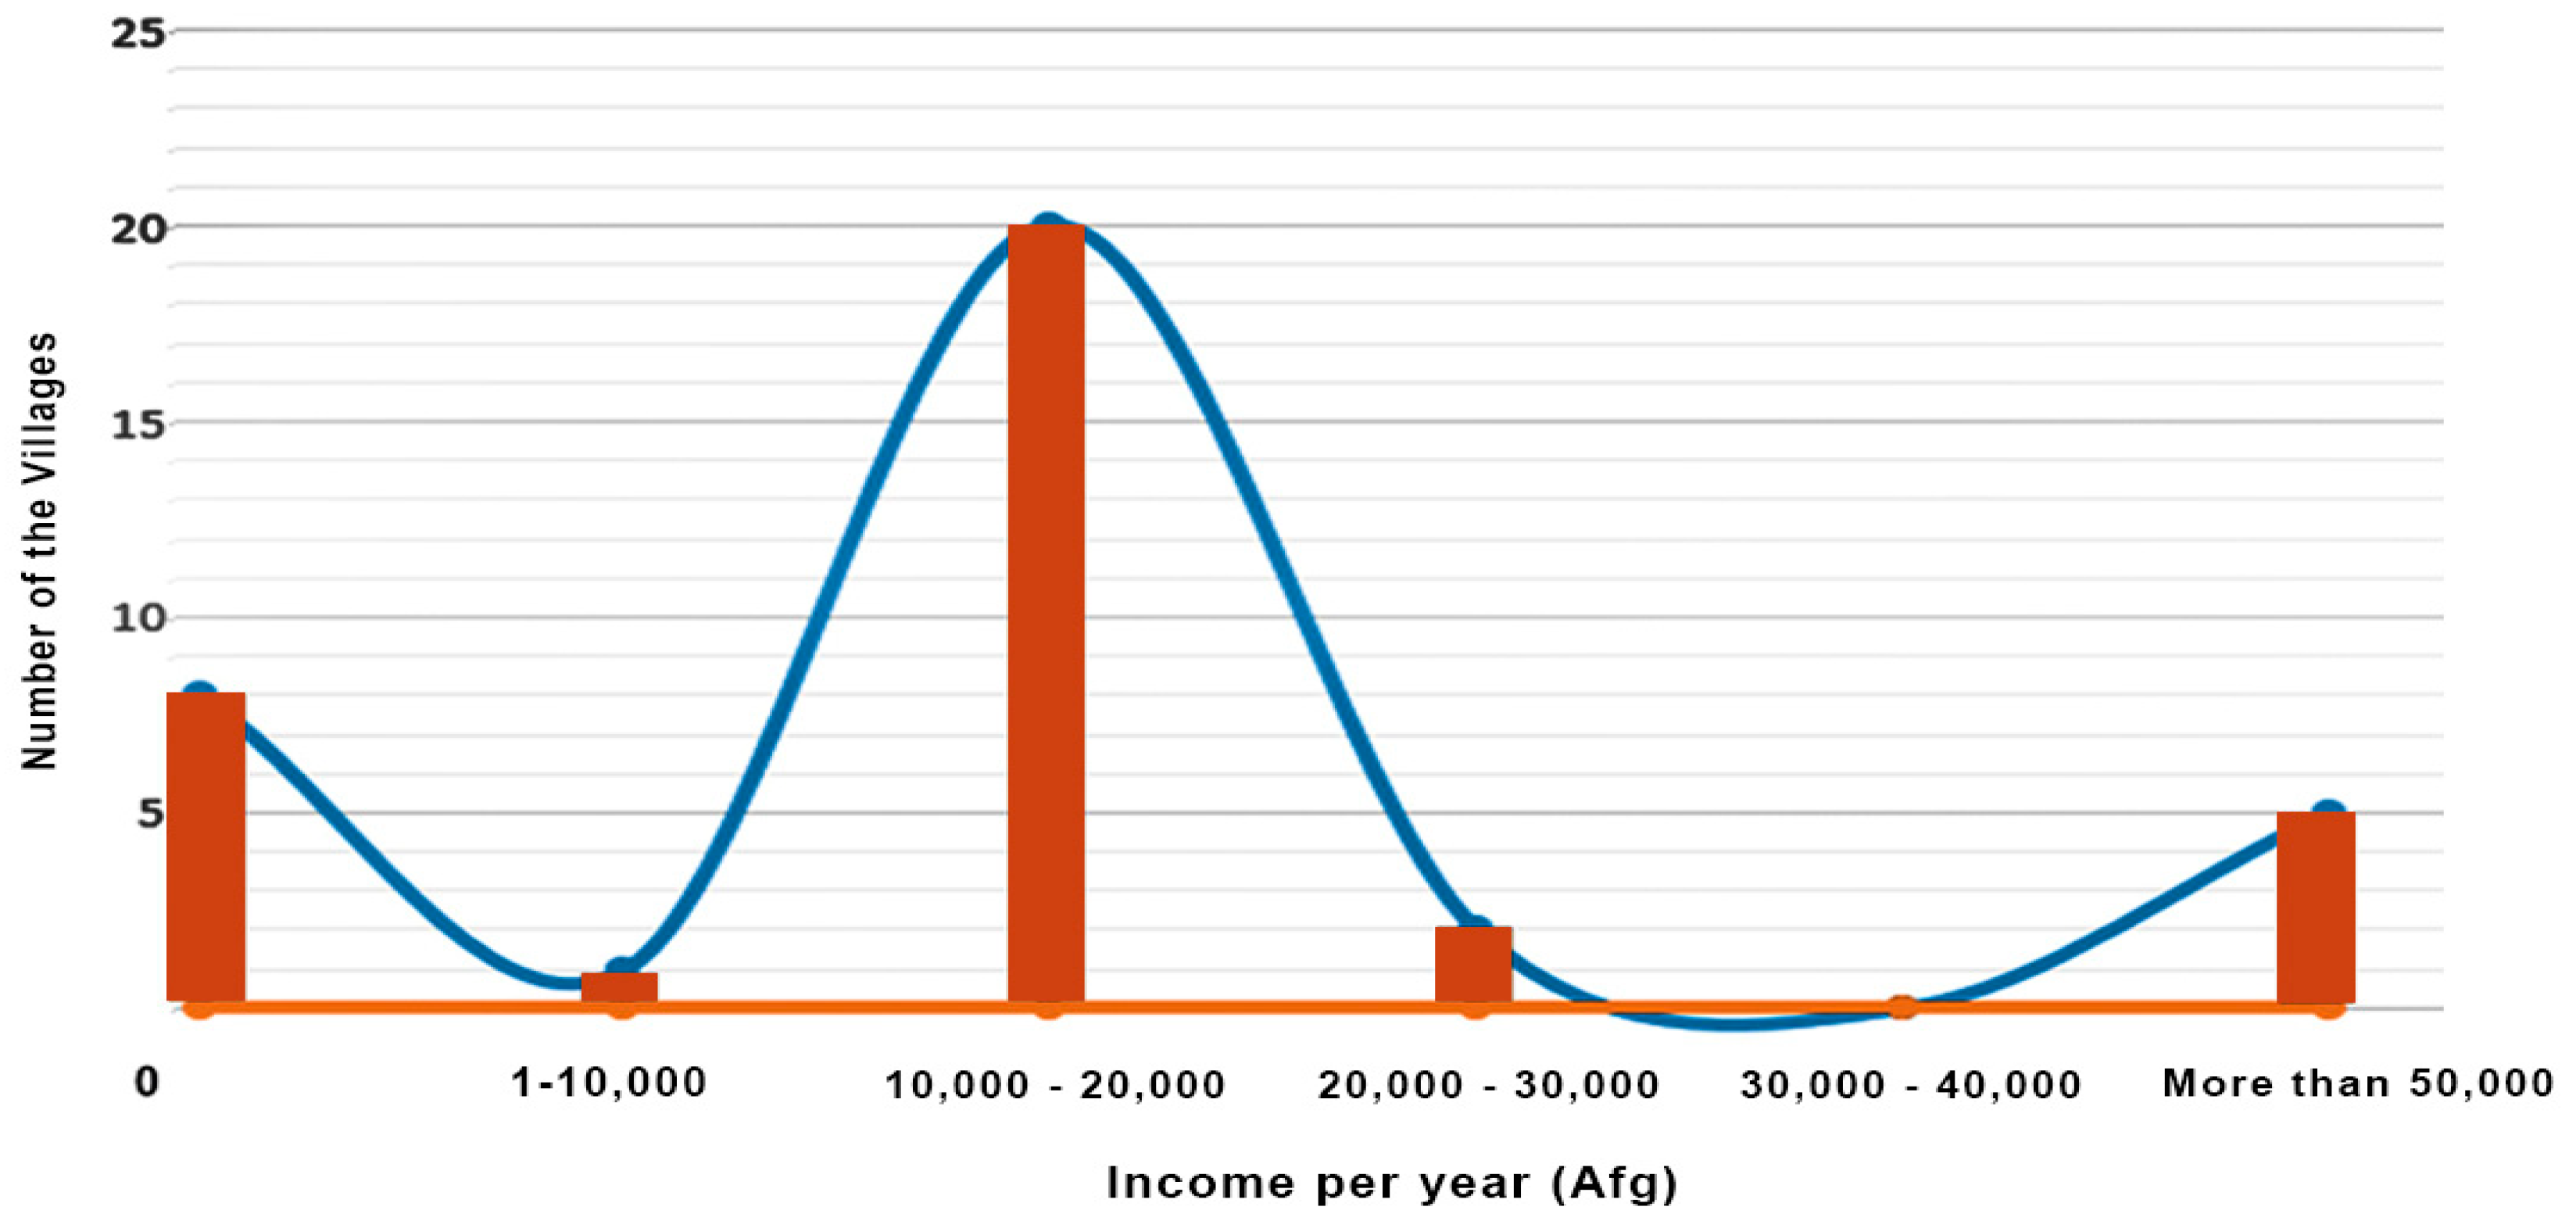
5.7. Parameter #7: Agricultural Income
Since agriculture is the main source of rural income, therefore it is considered one of the major important parameters in the categorization of the villages. According to investigations done by several national and international agencies, considering the daily livelihood expenses in Afghanistan, if a farmer earns on average 200,000–300,000 Afg per year, it is considered a good income.
Figure 10 shows the histogram for agricultural income, and
Table 11 explains the income for different villages and the weights assigned by the experts.
For a better elaboration,
Figure 11 and
Figure 12 show the seven parameters with their sub-indexes on the map.
6. Results and Discussion
The capital Kabul has faced an unorganized and unprecedented urban sprawl in its history in the last two decades, which have clearly affected and increased the number of informal settlements in the city [
25]. KNC villages are not an exception; although there is a huge gap between the term village and slum from an urban planning point of view, but they still have lots of similarities in terms of socio-economic problems. Focusing on the status of the land, the Land Titling and Economic Restricting Activity (LTERA) funded by USAID identified four types of informal settlements in Kabul [
26], among them the category which basically can relate to villages consists of traditional owners of lands. They are individuals who inherited land from their ancestors, mostly in villages. Those lands were previously part of farmlands, but now due to rapid urbanization, they are included in urban areas.
Settlement in the villages comes in different forms of cultural, physical, economic, and environmental aspects. Hence, their problems cannot be addressed by a single development model. As slum development experiences around the globe have shown, there is no common method for developing all settlement types through a single model. Therefore, it requires deep study and research on the existing situation of villages from the urban planning point of view to analyze and rank them into different categories.
For this purpose, MCDA and AHP method has been used to involve experts’ opinions in selecting parameters and assigning weights. MCDA is a technique to identify the single most preferred option or simply to distinguish acceptable from unacceptable possibilities [
27], and AHP is a structured technique for organizing and analyzing multi-criteria decisions [
28]; it represents an accurate approach to quantifying the weights of decisions’ criteria. Individual expert’s experiences are utilized to estimate the relative magnitudes of factors through pairwise comparison.
Additionally, Super Decision Making (SDM) software has been used for the better reliability of its weights and to avoid errors in the system. SDM has been used in many research and practical fields such as manufacturing, environmental management, aviation, small hydropower plants, and agriculture [
29]. It is a decision support software that works based on the Analytic Hierarchy Process (AHP) and Analytic Network Process (ANP) [
15].
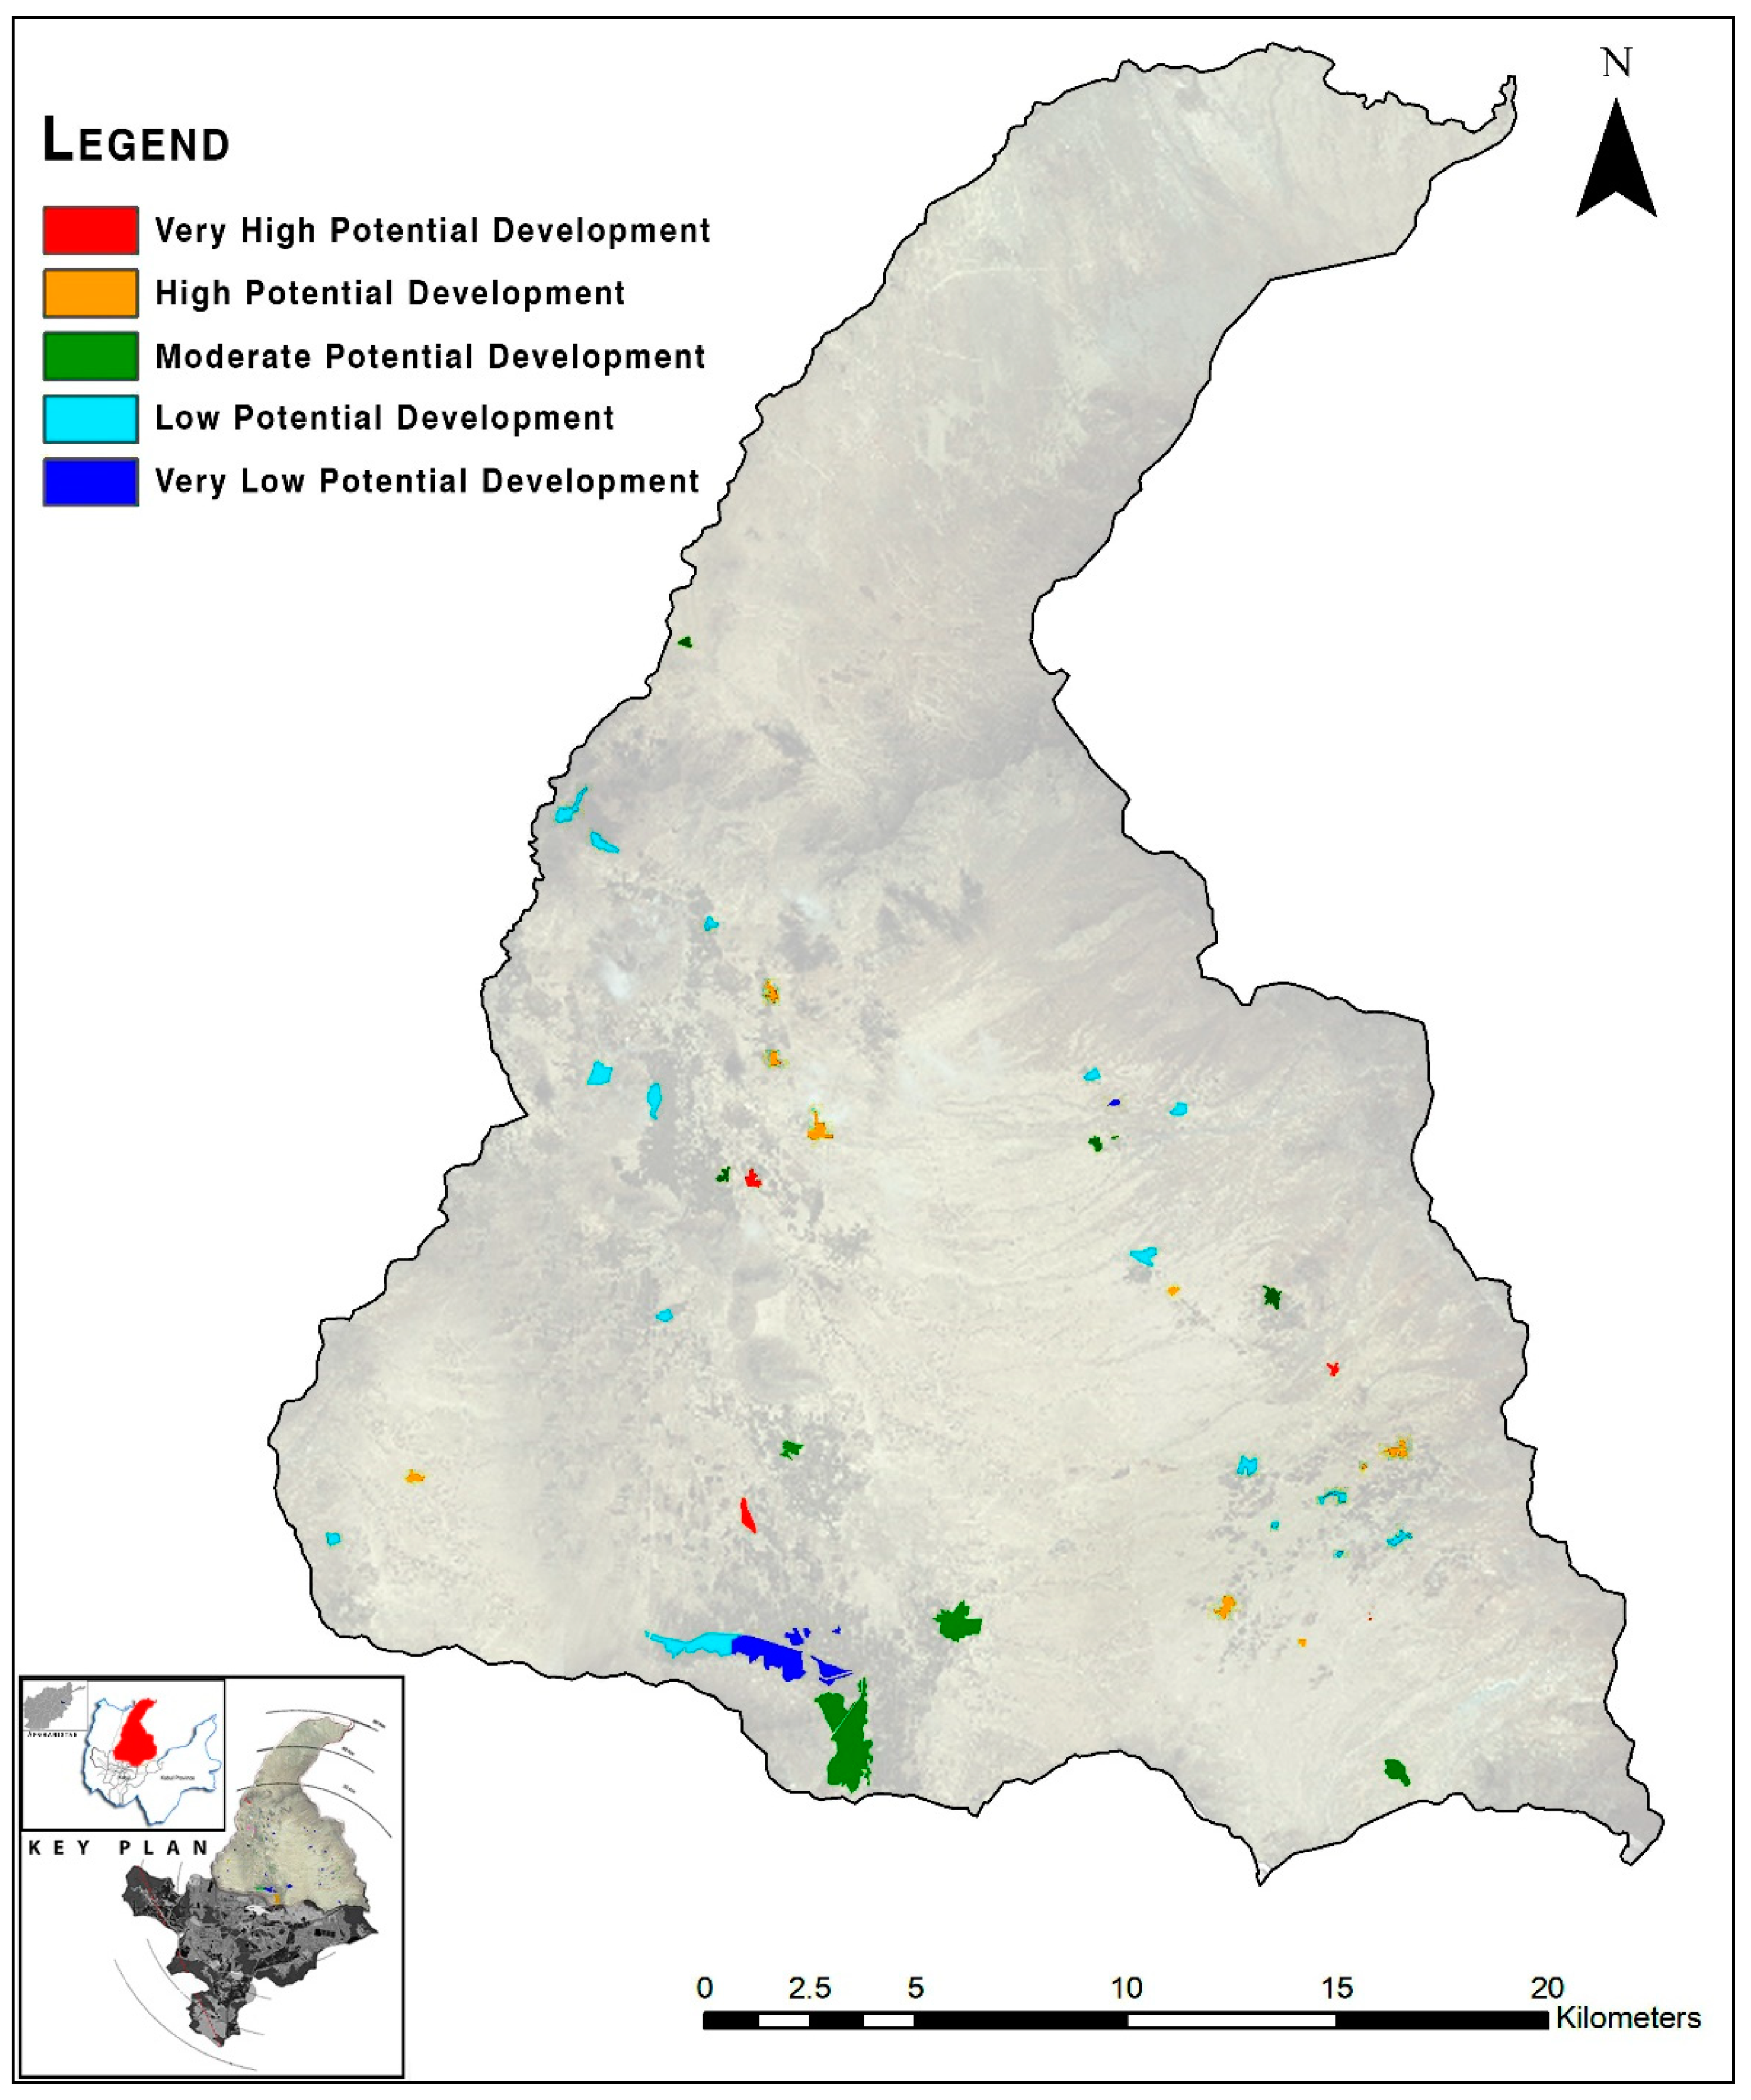
The final output, as shown in
Figure 13, is the result of a multi-criteria assessment and weighting system through spatial analysis of ArcGIS. The overlapping of several layers plus the weighting which we received from the experts have created a map that explains the potential development scale for each village and has essentially categorized them into very high, high, moderate, low, and very low development capacities. The consistency ratio (CR) in this study was calculated as 0.04, which fits the CR ≤ 0.1 rule of AHP requirement and shows the reliability of the prepared model.
The research basically aimed to loosen the burden of development by cutting down the cost of planning and management by ranking the villages and dividing them into various categories. The outcome will surely help the government in choosing a clear and sustainable platform for development. Moreover, it can set a vision and criteria for ranking and categorizing the informal settlements. Undoubtedly, the implementation of urban planning methods depends on the socio-economic and cultural condition of each country [
30]; therefore, the factors which enable classification and ranking can differ from region to region and place to place within the country.
Technical experts, as the main drivers of urban systems, can play an essential role in identifying and weighing the parameters and promoting sustainable and technical solutions within the area of their expertise [
31]. Hence, for the better accuracy and reliability of the research, a questionnaire was prepared and shared with the local experts to get their opinions in choosing parameters and assigning weights for each individual village.
Considering the parameters and weights assigned by the experts,
Table 12 explains that almost two of the entire villages have the highest development capacity while another two villages have the lowest. Furthermore, 8, 9, and 15 villages have been classified respectively into high, moderate, and low categories.
7. Conclusions
In this research, efforts were made to categorize the villages based on the most important parameters. Kabul New City (KNC) villages have been taken as the study area, and seven effective parameters with their sub-indexes have been selected and weighted based on the experts’ considerations. The layers for each criterion were prepared using AutoCAD and Arc-GIS software. Moreover, a technical questionnaire was prepared to ask the experts and urban planners to weigh and rank each parameter. Afterward, for the better reliability and accuracy of the consistency ratio, the weights and numbers were processed in the Super Decision Making (SDM) software and then inserted into Arc-GIS for further analysis and eventually categorization. The final outcome shows a map which scaled as very high, high, moderate, low, and very low potential development.
The study of the classification of villages assumes significance for several reasons. Its study enables us to understand varied social and cultural patterns operating in the rural context. Experiences have shown that most of the upgrading projects which were implemented in the past for the purpose of slum development could not succeed in achieving certain objectives as the characteristic of the area did not match with the development model/method. Even in some projects, it engendered social violence and people’s resistance as they were not properly involved in the project [
6]. Such kind of classification, which is based on important development factors, is instrumental in analyzing the development of specific village communities.
The final output is very easy to read and understand by planners and policymakers to make proper decisions. In Afghanistan, the majority of projects are being selected based on a single criterion and mostly political preference, which raises a lot of conflicts between the government and people. Therefore, this method can be used as a solution to avoid such conflicts.
Essentially this research aimed to loosen the burden of development through saving time and cutting down the cost of planning and management. The result of this research can set a vision and rules for ranking and the categorization of the informal settlements in existing Kabul. As of today, more than 69% of the city has been covered by informal areas which need careful development and certain planning at the policy and management levels. Lack of data and categorization can severely damper the successful implementation of development models if not technically addressed. Therefore, in the next research, the authors are willing to utilize the methodology used in this research by improving the factors and variables to categorize and rank the informal settlements in Kabul city.
Author Contributions
Conceptualization, S.M.H. and H.O.; Methodology, S.M.H.; Software, S.M.H.; Validation, S.M.H., H.O. and A.S.; Formal Analysis, S.M.H., H.O. and A.S.; Investigation, S.M.H.; Resources, S.M.H.; Data Curation, S.M.H. and A.S.; Writing—Original Draft Preparation, S.M.H.; Writing—Review & Editing, S.M.H., H.O. and A.S.; Visualization, S.M.H., H.O. and A.S.; Supervision, H.O.; Project Administration, S.M.H.; Funding Acquisition, S.M.H. and A.S. All authors have read and agreed to the published version of the manuscript.
Funding
This research received no external funding.
Institutional Review Board Statement
Not applicable.
Informed Consent Statement
Not applicable.
Acknowledgments
The authors appreciate the support from the Capital Region Independent Development Authority (CRIDA) and urban planning experts who contributed to the survey and the verification of the data.
Conflicts of Interest
The authors declare no conflict of interest associated with this publication, and there has been no significant financial support for this work that could have influenced its outcome.
References
- Gouttierre, T. 2003 National Geographic Population Map; Center for Afghanistan Studies, University of Nebraska at Omaha: Omaha, NE, USA, 2003. [Google Scholar]
- Urbanization Prospects: The 2014 Revision, Highlights (ST/ESA/SER.A/352). Available online: https://www.compassion.com/multimedia/world-urbanization-prospects.pdf (accessed on 5 November 2020).
- Habibi, S.; Ono, H. Urban Renewal and Slum Development Practices in Developed and Developing Countries; Summaries of technical papers of annual meeting; Architecture Institute of Japan (AIJ): Sendai, Japan, 2018; pp. 209–210. [Google Scholar]
- Promotion of Kabul Metropolitan Area Development: Capacity Development in Business Development Services. Available online: https://openjicareport.jica.go.jp/618/618/618_301_12127056.html (accessed on 20 November 2019).
- Habibi, S.M.; Ono, H. A concept development plan for the upgrading of villages in Kabul New City. IJTRA 2019, 7, 95–102. [Google Scholar]
- Habibi, S.M.; Ono, H. People’s participation in slum development. IJTRA 2019, 7, 20–27. [Google Scholar]
- Tong, D.; Feng, C.; Li, G.; Chen, P. Categories and characteristics of urban villages by GIS-based analysis: A case study of the Shenzhen Special Economic Zone. Sci. China Technol. Sci. 2010, 53, 150–157. [Google Scholar] [CrossRef]
- Mitkovic, P.; Vasilevska, L.; Bogdanovic, I.; Dinic, M. Functional and size typology of the village settlements in the city of Nis territory. Facta Univ. Ser. Archit. Civ. Eng. 2002, 2, 231–249. [Google Scholar] [CrossRef]
- Rikalovic, A.; Cosic, I.; Lazarevic, D. GIS based multi-criteria analysis for industrial site selection. Procedia Eng. 2014, 69, 1054–1063. [Google Scholar] [CrossRef] [Green Version]
- Balew, A.; Alemu, M.; Leul, Y.; Feye, T. Suitable landfill site selection using GIS-based multi-criteria decision analysis and evaluation in Robe town Ethiopia. GeoJournal 2020, 1, 1–26. [Google Scholar] [CrossRef]
- Malczewski, J. GIS-based land-use suitability analysis: A critical overview. Prog. Plan. 2004, 62, 3–65. [Google Scholar] [CrossRef]
- Malczewski, J. GIS and Multicriteria Decision Analysis; Wiley: New York, NY, USA, 1999. [Google Scholar]
- Malczewski, J. GIS-based multicriteria decision analysis: A survey of the literature. Int. J. Geogr. Inf. Sci. 2006, 20, 703–726. [Google Scholar] [CrossRef]
- Mohebbi, M.; Shakeri, K.; Ghanbarpour, Y.; Majzoub, H. Designing optimal multiple tuned mass dampers using genetic algorithms (GAs) for mitigating the seismic response of structures. J. Vib. Control 2013, 19, 605–625. [Google Scholar] [CrossRef]
- Saaty, T. The Analytic Hierarchy Process; McGraw-Hill: New York, NY, USA, 1980. [Google Scholar]
- Adewumi, J.R.; Ejeh, O.J.; Lasisi, K.H.; Ajibade, F.O. A GIS–AHP-based approach in siting MSW landfills in Lokoja Nigeria. SN Appl. Sci. 2019, 1, 1528. [Google Scholar] [CrossRef] [Green Version]
- Eldrandaly, K.A.; Eldin, N.; Sui, D.Z.; Shouman, M.A.; Nawara, G. Integrating GIS and MCDM Using COM Technology. Int. Arab J. Inf. Technol. 2005, 2, 162–167. [Google Scholar]
- Mu, E.; Pereyra-Rojas, M. Building AHP Models Using Super Decisions v3. In Practical Decision Making Using Super Decisions v3; Springer: Cham, Switzerland, 2018. [Google Scholar] [CrossRef]
- Saaty, R. Decision Making in Complex Environments; RWS Publications: Pittsburgh, PA, USA, 2016; pp. 50–53. [Google Scholar]
- Bhushan, N.; Rai, K. Strategic Decision Making: Applying the Analytic Hierarchy Process; Springer: Berlin, Germany, 2004; Volume 9, pp. 11–21. Available online: http://0-www-springer-com.brum.beds.ac.uk/978-1-85233-756-8 (accessed on 8 October 2020).
- Ssebuggwawo, D.; Hoppenbrouwers, S.; Proper, E. Evaluating Modeling Sessions Using the Analytic Hierarchy Process. In IFIP Working Conference on The Practice of Enterprise Modeling; Lecture Notes in Business Information Processing; Springer: Berlin/Heidelberg, Germany, 2009; pp. 69–83. [Google Scholar] [CrossRef]
- Zabihi, H.; Ahmad, A.; Vogeler, I.; Said, M.; Golmohammadi, M.; Golein, B.; Nilashi, M. Land suitability procedure for sustainable citrus planning using the application of the analytical network process approach and GIS. Comput. Electron. Agric. 2015, 117, 114–126. [Google Scholar] [CrossRef]
- Basak, I.; Saaty, T. Group decision making using the analytic hierarchy process. Math. Comput. Model. 1993, 17, 101–109. [Google Scholar] [CrossRef]
- Ghorbanzadeh, O.; Pourmoradian, S.; Blaschke, T.; Feizizadeh, B. Mapping potential nature-based tourism areas by applying GIS-decision making systems in East Azerbaijan Province, Iran. J. Ecotour. 2019, 18, 261–283. [Google Scholar] [CrossRef]
- UN-HABITAT: Knowing Kabul: A Potential Power House of Social and Economic Development. Available online: https://unhabitat.org/sites/default/files/download-manager-files/Discussion%20Paper%2010%20%20Knowing%20Kabul%20%281%29.pdf (accessed on 21 November 2020).
- Draft Kabul City Master Plan: Product of Technical Cooperation Project for Promotion of Kabul Metropolitan Area Development. Available online: https://openjicareport.jica.go.jp/pdf/12058566_01.pdf (accessed on 10 September 2019).
- Department for Communities and Local Government. Multi-Criteria Analysis: A Manual; Communities and Local Government Publications: London, UK, 2009; p. 19. Available online: http://eprints.lse.ac.uk/12761/1/Multi-criteria_Analysis.pdf (accessed on 27 July 2020).
- Ernest, H.F.; Saul, I. The analytical hierarchy process—An exposition. Oper. Res. 2001, 49, 469–487. [Google Scholar] [CrossRef]
- Saracoglu, Burak Omer. An AHP Application in the Investment Selection Problem of Small Hydropower Plants in Turkey. Int. J. Anal. Hierarchy Process. 2015, 7, 3–5. [Google Scholar] [CrossRef]
- Habibi, S.; Ono, H. A Study on the Applicability of an Adapted Land Readjustment Model for Developing the Old City of Kabul. J. Archit. Plan. 2019, 84, 407–414. [Google Scholar] [CrossRef]
- Habibi, S.M.; Ono, H. The role of specialists toward sensitive and sustainable development of slums and the need for land readjustment (LR) experts in Afghanistan. IJTRA 2019, 7, 129–133. [Google Scholar]
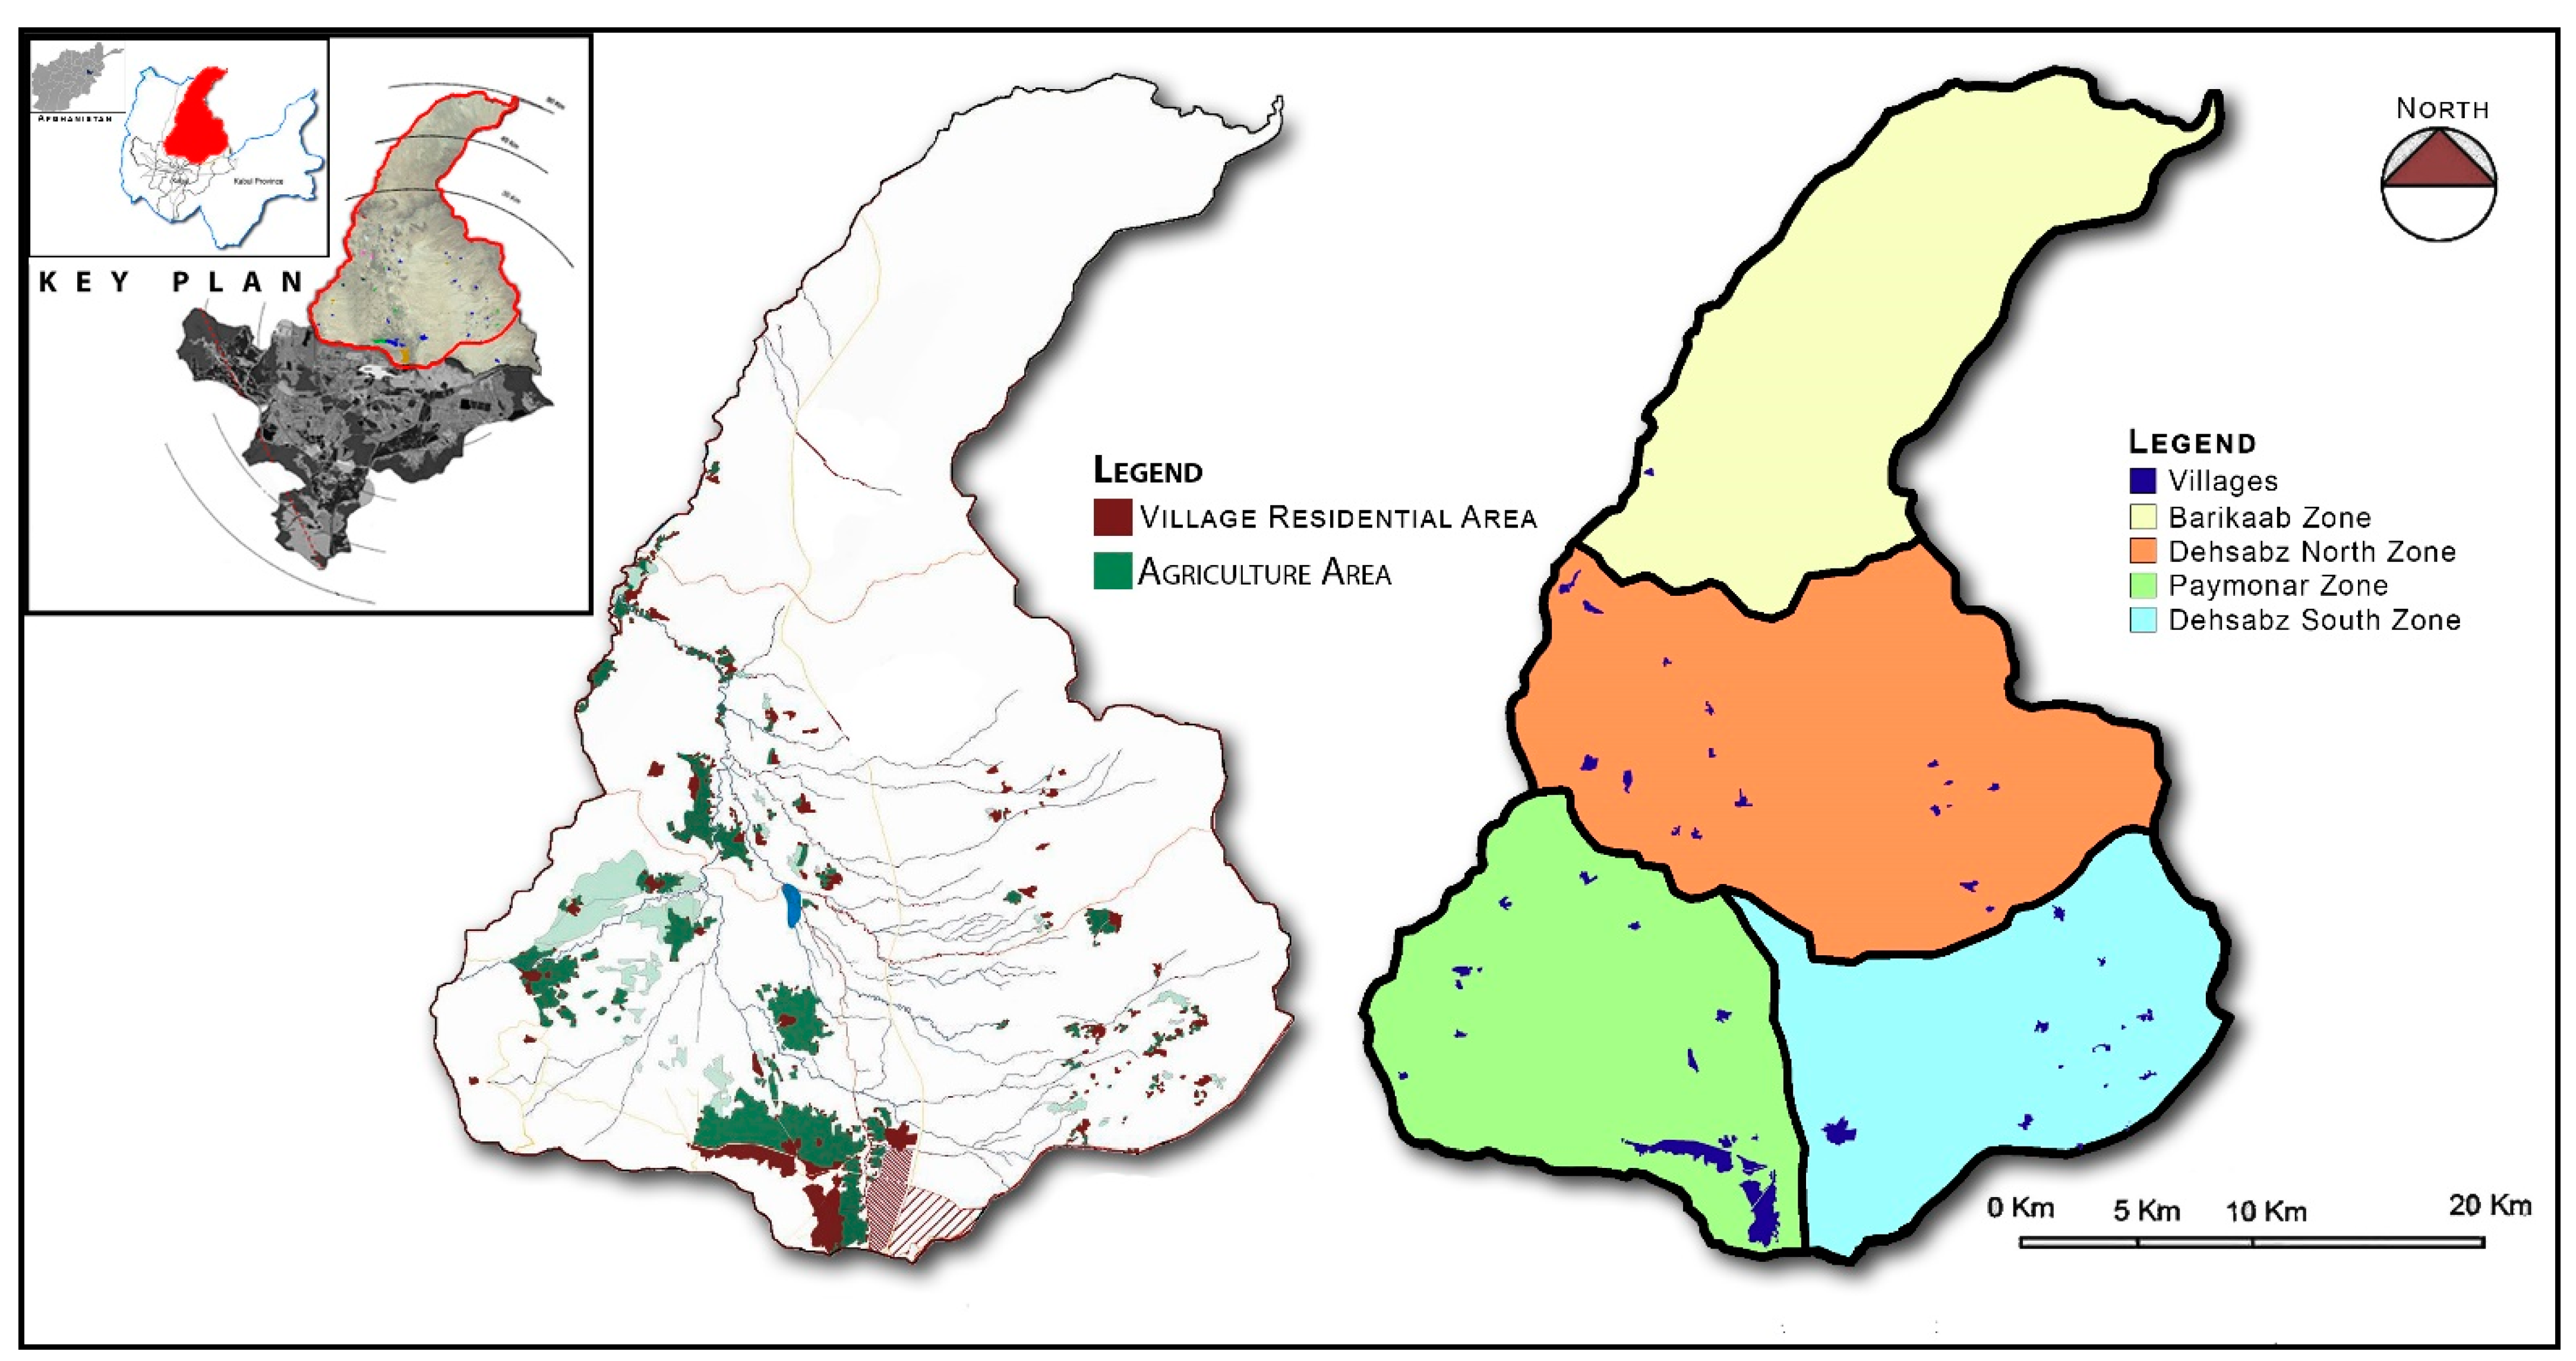
Figure 1.
Different phases of KNC and the location of the villages under the KNC boundary.
Figure 1.
Different phases of KNC and the location of the villages under the KNC boundary.
Figure 2.
Location of the study area.
Figure 2.
Location of the study area.
Figure 3.
Research Methodology Diagram.
Figure 3.
Research Methodology Diagram.
Figure 4.
The histogram for the “Slope” index.
Figure 4.
The histogram for the “Slope” index.
Figure 5.
The histogram of the “Proximity to CBD” index.
Figure 5.
The histogram of the “Proximity to CBD” index.
Figure 6.
Physical status of the villages.
Figure 6.
Physical status of the villages.
Figure 7.
The histogram for the “Literacy” index.
Figure 7.
The histogram for the “Literacy” index.
Figure 8.
The histogram for the “people involved in agriculture” index.
Figure 8.
The histogram for the “people involved in agriculture” index.
Figure 9.
The histogram for the “Vacant area” index.
Figure 9.
The histogram for the “Vacant area” index.
Figure 10.
The histogram for the “Agricultural income” index.
Figure 10.
The histogram for the “Agricultural income” index.
Figure 11.
Parameters with their sub-indexes.
Figure 11.
Parameters with their sub-indexes.
Figure 12.
Parameters with their sub-indexes.
Figure 12.
Parameters with their sub-indexes.
Figure 13.
Final potential development model.
Figure 13.
Final potential development model.
Table 1.
The number of people living in villages.
Table 1.
The number of people living in villages.
| KNC Phases | Barikaab | Dehsabz N | Dehsabz S | Paymonar | Total |
|---|
| Village Population | 9841 | 31,376 | 27,112 | 71,671 | 140,000 |
Table 2.
Average RI for corresponding matrix size.
Table 2.
Average RI for corresponding matrix size.
| (n) | 1 | 2 | 3 | 4 | 5 | 6 | 7 | 8 | 9 | 10 |
|---|
| (RI) | 0 | 0 | 0.58 | 0.9 | 1.12 | 1.24 | 1.32 | 1.41 | 1.45 | 1.49 |
Table 3.
Questionnaire for the experts for weighting and ranking the parameters.
Table 3.
Questionnaire for the experts for weighting and ranking the parameters.
| Agri Inc | 9 | 8 | 7 | 6 | 5 | 4 | 3 | 2 | 1 | 2 | 3 | 4 | 5 | 6 | 7 | 8 | 9 | Literacy |
|---|
| Agri Inc | 9 | 8 | 7 | 6 | 5 | 4 | 3 | 2 | 1 | 2 | 3 | 4 | 5 | 6 | 7 | 8 | 9 | ppl invol in agri |
| Agri Inc | 9 | 8 | 7 | 6 | 5 | 4 | 3 | 2 | 1 | 2 | 3 | 4 | 5 | 6 | 7 | 8 | 9 | Physical st of vill |
| Agri Inc | 9 | 8 | 7 | 6 | 5 | 4 | 3 | 2 | 1 | 2 | 3 | 4 | 5 | 6 | 7 | 8 | 9 | Slope |
| Agri Inc | 9 | 8 | 7 | 6 | 5 | 4 | 3 | 2 | 1 | 2 | 3 | 4 | 5 | 6 | 7 | 8 | 9 | Vacant areas |
| Dist to CBD | 9 | 8 | 7 | 6 | 5 | 4 | 3 | 2 | 1 | 2 | 3 | 4 | 5 | 6 | 7 | 8 | 9 | Literacy Index |
| | 9 | 8 | 7 | 6 | 5 | 4 | 3 | 2 | 1 | 2 | 3 | 4 | 5 | 6 | 7 | 8 | 9 | |
| | 9 | 8 | 7 | 6 | 5 | 4 | 3 | 2 | 1 | 2 | 3 | 4 | 5 | 6 | 7 | 8 | 9 | |
| | 9 | 8 | 7 | 6 | 5 | 4 | 3 | 2 | 1 | 2 | 3 | 4 | 5 | 6 | 7 | 8 | 9 | |
| ppl invol in agri | 9 | 8 | 7 | 6 | 5 | 4 | 3 | 2 | 1 | 2 | 3 | 4 | 5 | 6 | 7 | 8 | 9 | Physical st of vill |
| ppl invol in agri | 9 | 8 | 7 | 6 | 5 | 4 | 3 | 2 | 1 | 2 | 3 | 4 | 5 | 6 | 7 | 8 | 9 | Slope |
| ppl invol in agri | 9 | 8 | 7 | 6 | 5 | 4 | 3 | 2 | 1 | 2 | 3 | 4 | 5 | 6 | 7 | 8 | 9 | Vacant areas |
| Physical st of vill | 9 | 8 | 7 | 6 | 5 | 4 | 3 | 2 | 1 | 2 | 3 | 4 | 5 | 6 | 7 | 8 | 9 | Slope |
| Physical st of vill | 9 | 8 | 7 | 6 | 5 | 4 | 3 | 2 | 1 | 2 | 3 | 4 | 5 | 6 | 7 | 8 | 9 | Vacant areas |
| Slope | 9 | 8 | 7 | 6 | 5 | 4 | 3 | 2 | 1 | 2 | 3 | 4 | 5 | 6 | 7 | 8 | 9 | Vacant areas |
Table 4.
Fundamental scale of absolute numbers used in the questionnaire (Saaty, 1996).
Table 4.
Fundamental scale of absolute numbers used in the questionnaire (Saaty, 1996).
| Importance Level | Ranking |
|---|
| Equally important | 1 |
| Equally important to slightly more important | 2 |
| Slightly more important | 3 |
| Slightly more important to much more important | 4 |
| Much more important | 5 |
| Much more important to very much more important | 6 |
| Very much more important | 7 |
| Very much more important to extremely important | 8 |
| Extremely important | 9 |
Table 5.
Classification of “Slope” index with the weights assigned by the experts.
Table 5.
Classification of “Slope” index with the weights assigned by the experts.
| Slope Index |
|---|
| Slope | Villages | Weights | Potential Development |
|---|
| Sub-Indexes | No | % |
|---|
| 0–1% | 3 | 8.33 | 0.40707 | Very High |
| 1–2% | 6 | 16.7 | 0.21157 | High |
| 2–3% | 4 | 11.1 | 0.14167 | Moderate to high |
| 3–4% | 1 | 2.78 | 0.10996 | Moderate |
| 4–5% | 11 | 30.6 | 0.05796 | Moderate to Low |
| 5–6% | 9 | 25 | 0.04586 | Low |
| More than 6% | 2 | 5.56 | 0.02591 | Very low |
Table 6.
Classification of the “Proximity to CBD” index with the weights assigned by the experts.
Table 6.
Classification of the “Proximity to CBD” index with the weights assigned by the experts.
| Proximity to CBD Index |
|---|
| Distance to CBD | Villages | Weights | Potential Development |
|---|
| Sub-Parameters | No | % |
|---|
| 0–10 Km | 2 | 5.56 | 0.53262 | Very High |
| 10–20 Km | 8 | 22.2 | 0.23435 | High |
| 20–30 Km | 17 | 47.2 | 0.11095 | Moderate |
| 30–40 Km | 9 | 25 | 0.0784 | Low |
| More than 40 Km | 0 | 0 | 0.04369 | Very low |
Table 7.
Classification of the “Physical Status” index with their weights assigned by the experts.
Table 7.
Classification of the “Physical Status” index with their weights assigned by the experts.
| Physical Status Index |
|---|
| Physical Status | Villages | Weights | Potential Development |
|---|
| Sub-Parameters | No | % |
|---|
| Condensed | 23 | 63.9 | 0.85714 | High |
| Scattered | 13 | 36.1 | 0.14286 | Moderate |
Table 8.
Classification of the “Literacy” index with their weights.
Table 8.
Classification of the “Literacy” index with their weights.
| Literacy Index |
|---|
| Literacy | Villages | Weight | Potential Development |
|---|
| Sub-Parameters | No | % |
|---|
| 0–10% | 21 | 58.3 | 0.0441 | Very Low |
| 10–20% | 8 | 22.2 | 0.06912 | Low |
| 20–30% | 5 | 13.9 | 0.16754 | Moderate |
| 30–40% | 1 | 2.78 | 0.23413 | Moderate to high |
| 40–50% | 1 | 2.78 | 0.4851 | High |
Table 9.
Classification of the “people involved in agriculture” index with their weights.
Table 9.
Classification of the “people involved in agriculture” index with their weights.
| People Involved in Agriculture Index |
|---|
| People Involved in Agriculture | Villages | Weights | Potential Development |
|---|
| Sub-Parameters | No | % |
|---|
| 0–20% | 22 | 61.1 | 0.04683 | Very Low |
| 20–40% | 7 | 19.4 | 0.12674 | Low |
| 40–60% | 4 | 11.1 | 0.11609 | Moderate |
| 60–80% | 0 | 0 | 0.26022 | High |
| 80–100% | 3 | 8.33 | 0.45012 | Very high |
Table 10.
Classification of the “Vacant area” index with their weights.
Table 10.
Classification of the “Vacant area” index with their weights.
| Vacant Area Index |
|---|
| Vacant Area | Villages | Weights | Potential Development |
|---|
| Sub-Parameters | No | % |
|---|
| 0–20% | 8 | 22.2 | 0.04481 | Low |
| 20–40% | 5 | 13.9 | 0.07049 | Moderate |
| 40–60% | 6 | 16.7 | 0.15465 | Moderate to high |
| 60–80% | 9 | 25 | 0.29163 | High |
| 80–100% | 8 | 22.2 | 0.43841 | Very high |
Table 11.
Classification of the “Agricultural income” index with their weights.
Table 11.
Classification of the “Agricultural income” index with their weights.
| Agricultural Income Index |
|---|
| Agricultural Income | Villages | Weights | Potential Development |
|---|
| Sub-Parameters | No | % |
|---|
| 0 Afg | 8 | 22.2 | 0.02988 | Very low |
| 1–10,000 Afg | 20 | 55.6 | 0.04265 | Low |
| 10,000–20,000 Afg | 1 | 2.78 | 0.06395 | Low to Moderate |
| 20,000–30,000 Afg | 2 | 5.56 | 0.08849 | Moderate |
| 30,000–40,000 Afg | 0 | 0 | 0.15004 | Moderate to High |
| 40,000–50,000 Afg | 1 | 2.78 | 0.25709 | High |
| More than 50,000 Afg | 4 | 11.1 | 0.36789 | Very high |
Table 12.
Development capacity for each village category.
Table 12.
Development capacity for each village category.
| Development Capacity | Villages |
|---|
| No | Area | % |
|---|
| Very High | 2 | 150,514.2 | 5.6 |
| High | 8 | 598,399.5 | 22.2 |
| Moderate | 9 | 3,154,510.4 | 25.0 |
| Low | 15 | 1,908,323.4 | 41.7 |
| Very Low | 2 | 1,360,777.9 | 5.6 |
| Publisher’s Note: MDPI stays neutral with regard to jurisdictional claims in published maps and institutional affiliations. |
© 2021 by the authors. Licensee MDPI, Basel, Switzerland. This article is an open access article distributed under the terms and conditions of the Creative Commons Attribution (CC BY) license (https://creativecommons.org/licenses/by/4.0/).


