1. Introduction
Since Neolithic times, when prehistoric humans transitioned from a nomadic to a more sedentary lifestyle, cities have served as spaces for community life and social and material exchange. Cities have enabled skills to be pooled, dynamism to be combined and, above all, natural resources and real estate to be shared and optimized [
1]. These spaces of life, exchange and sociability vary across the globe in construction and design, characterized by different colors, materials, shapes, and land uses. Their configurations and materials interact differently with solar irradiation, causing a horizontal thermal gradient between urban cores, which are typically warmer due to sparser vegetation, and the surrounding environment, which is often vegetated and relatively cooler. This thermal contrast has effects on building energy consumption and natural air conditioning efficiency [
2,
3,
4], air pollution [
4,
5,
6], thermal comfort [
4,
7], health [
4,
8], and flora and fauna [
4,
9].
In city construction, the duality between urban materials and rural spaces induces the urban heat island (UHI) and urban heat sink (UHS) phenomena [
10,
11,
12], important and unique features of cities. Both are defined as the difference in temperature between the urban core and rural areas, with the UHI characterized by a higher temperature in urban areas than in rural areas and the UHS occurring when an urban area is cooler than its rural surroundings.
When built with darker color (low albedo) materials, a city absorbs more solar radiation than its greener environment and therefore warms up faster. In addition, due to its shape and roughness, which results from the different heights of the buildings, there is a decrease in wind speed [
13], a modification in energy exchange efficiency within the lower layer of the atmosphere [
14], and alterations in rainfall patterns [
15,
16]. Finally, because of the impermeability of impervious surfaces in cities, there is a reduction in rainwater infiltration and an increase in surface runoff, which often leads to flooding. However, a scientific consensus has emerged on the genesis of UHIs that attributes the reduction of evaporative cooling in urban areas as the dominant factor in their formation [
1].
Several studies have addressed the urban surface climate, some of them in urban areas with climate regions similar to those in Morocco. For example, the work of Bounoua et al. [
17] in the city of Oran (Algeria) studied the sensitivity of the local climate to changes in land cover, as observed on Landsat images on an area of about 650 km
2. The Simple Biosphere Model (SiB2) was used to assess the effects of morphological and physiological changes in vegetation and the implications on water, energy and carbon fluxes between the surface and the atmosphere. It was determined that, during summer, urban areas exhibit additional warming during daytime and slightly less at night relative to areas of needleleaf trees, simulated under similar climate conditions. Boukhabla [
18] worked on the influence of climatic factors on the modification of the UHI in a “canyon” street in Biskra, a city in the desert of Algeria. The objective was to demonstrate that thermal regulation of the urban microclimate in an arid climatic zone can be achieved at street level by judicious choices of street orientation and geometry. The authors carried out a field measurement campaign and modelled the results on Envi-met to produce a series of recommendations on street development in arid climates.
In Morocco, Johansson [
19] conducted a comparative temperature study between two types of neighborhoods in the city of Fez: (1) Seffarine in the traditional urban district of Medina; and (2) the Adarissa neighborhood in the modern district on the outskirts of the city. The results of the winter and summer on-site measurements showed that, during the day, the deep canyon was considerably cooler than the shallow canyon, suggesting that in a hot and dry climate, a compact urban design with very deep canyons is preferable. In a semi-arid region, Lachir et al. [
20] combined Landsat and MODIS (Moderate Resolution Imaging Spectroradiometer) data in the SIB2 model and assessed the impact of urbanization on surface climate in the city of Marrakech and showed that during the vegetation growing season, surface temperature was much higher in built-up areas than over other land cover types. In the sub-humid region of Casablanca, Bahi et al. [
21] found that daytime surface urban heat islands (SUHI) appeared more important in winter than in summer and have gradually increased by more than 1 °C in the residential areas and in some small peri-urban towns from 1984 to 2015. Fathi et al. [
22] carried out the first evaluation of the UHI across several cities in Morocco. The analysis reveals a well-defined UHI in urban areas built on vegetated land and a UHS in urban areas built in arid regions.
The study presented here is positioned differently from previous research. It is based on a matrix of comparison criteria at the crossroads of architecture, urbanism, and landscape, and seeks to better understand the surface temperature structure and UHI/UHS phenomena at different spatial scales and climatic zones in Morocco. The study goes beyond the UHI in its traditional definition and explores, for the first time, its spatial structure and amplitude within the city and its districts. Specifically, an intercomparison of the UHI between cities that differ in climate, typology, architecture, size, and topography is conducted to show the influence of architectural and urban planning elements in the characterization of the UHI amplitude.
2. Data & Methods
2.1. Surface Temperature
As the basis to calculate and map the UHI/UHS effects, we used the newly released Landsat 8 Collection 2 Level 2 Surface Temperature Product (courtesy of the U.S. Geological Survey) [
23,
24]. These data were generated at a 30-m spatial resolution from the Landsat Collection 2 Level 1 thermal infrared bands using Top of Atmosphere (TOA) Reflectance and Brightness Temperature (BT), Advanced Spaceborne Thermal Emission and Reflection Radiometer (ASTER) Global Emissivity Database (GED), Normalized Difference Vegetation Index (NDVI), and atmospheric profiles of geopotential height, specific humidity, and air temperature extracted from Goddard Earth Observing System Model Version 5 Forward Processing Instrument Teams (GEOS-5 FP-IT) and Modern Era Retrospective analysis for Research and Applications Version 2 (MERRA-2).
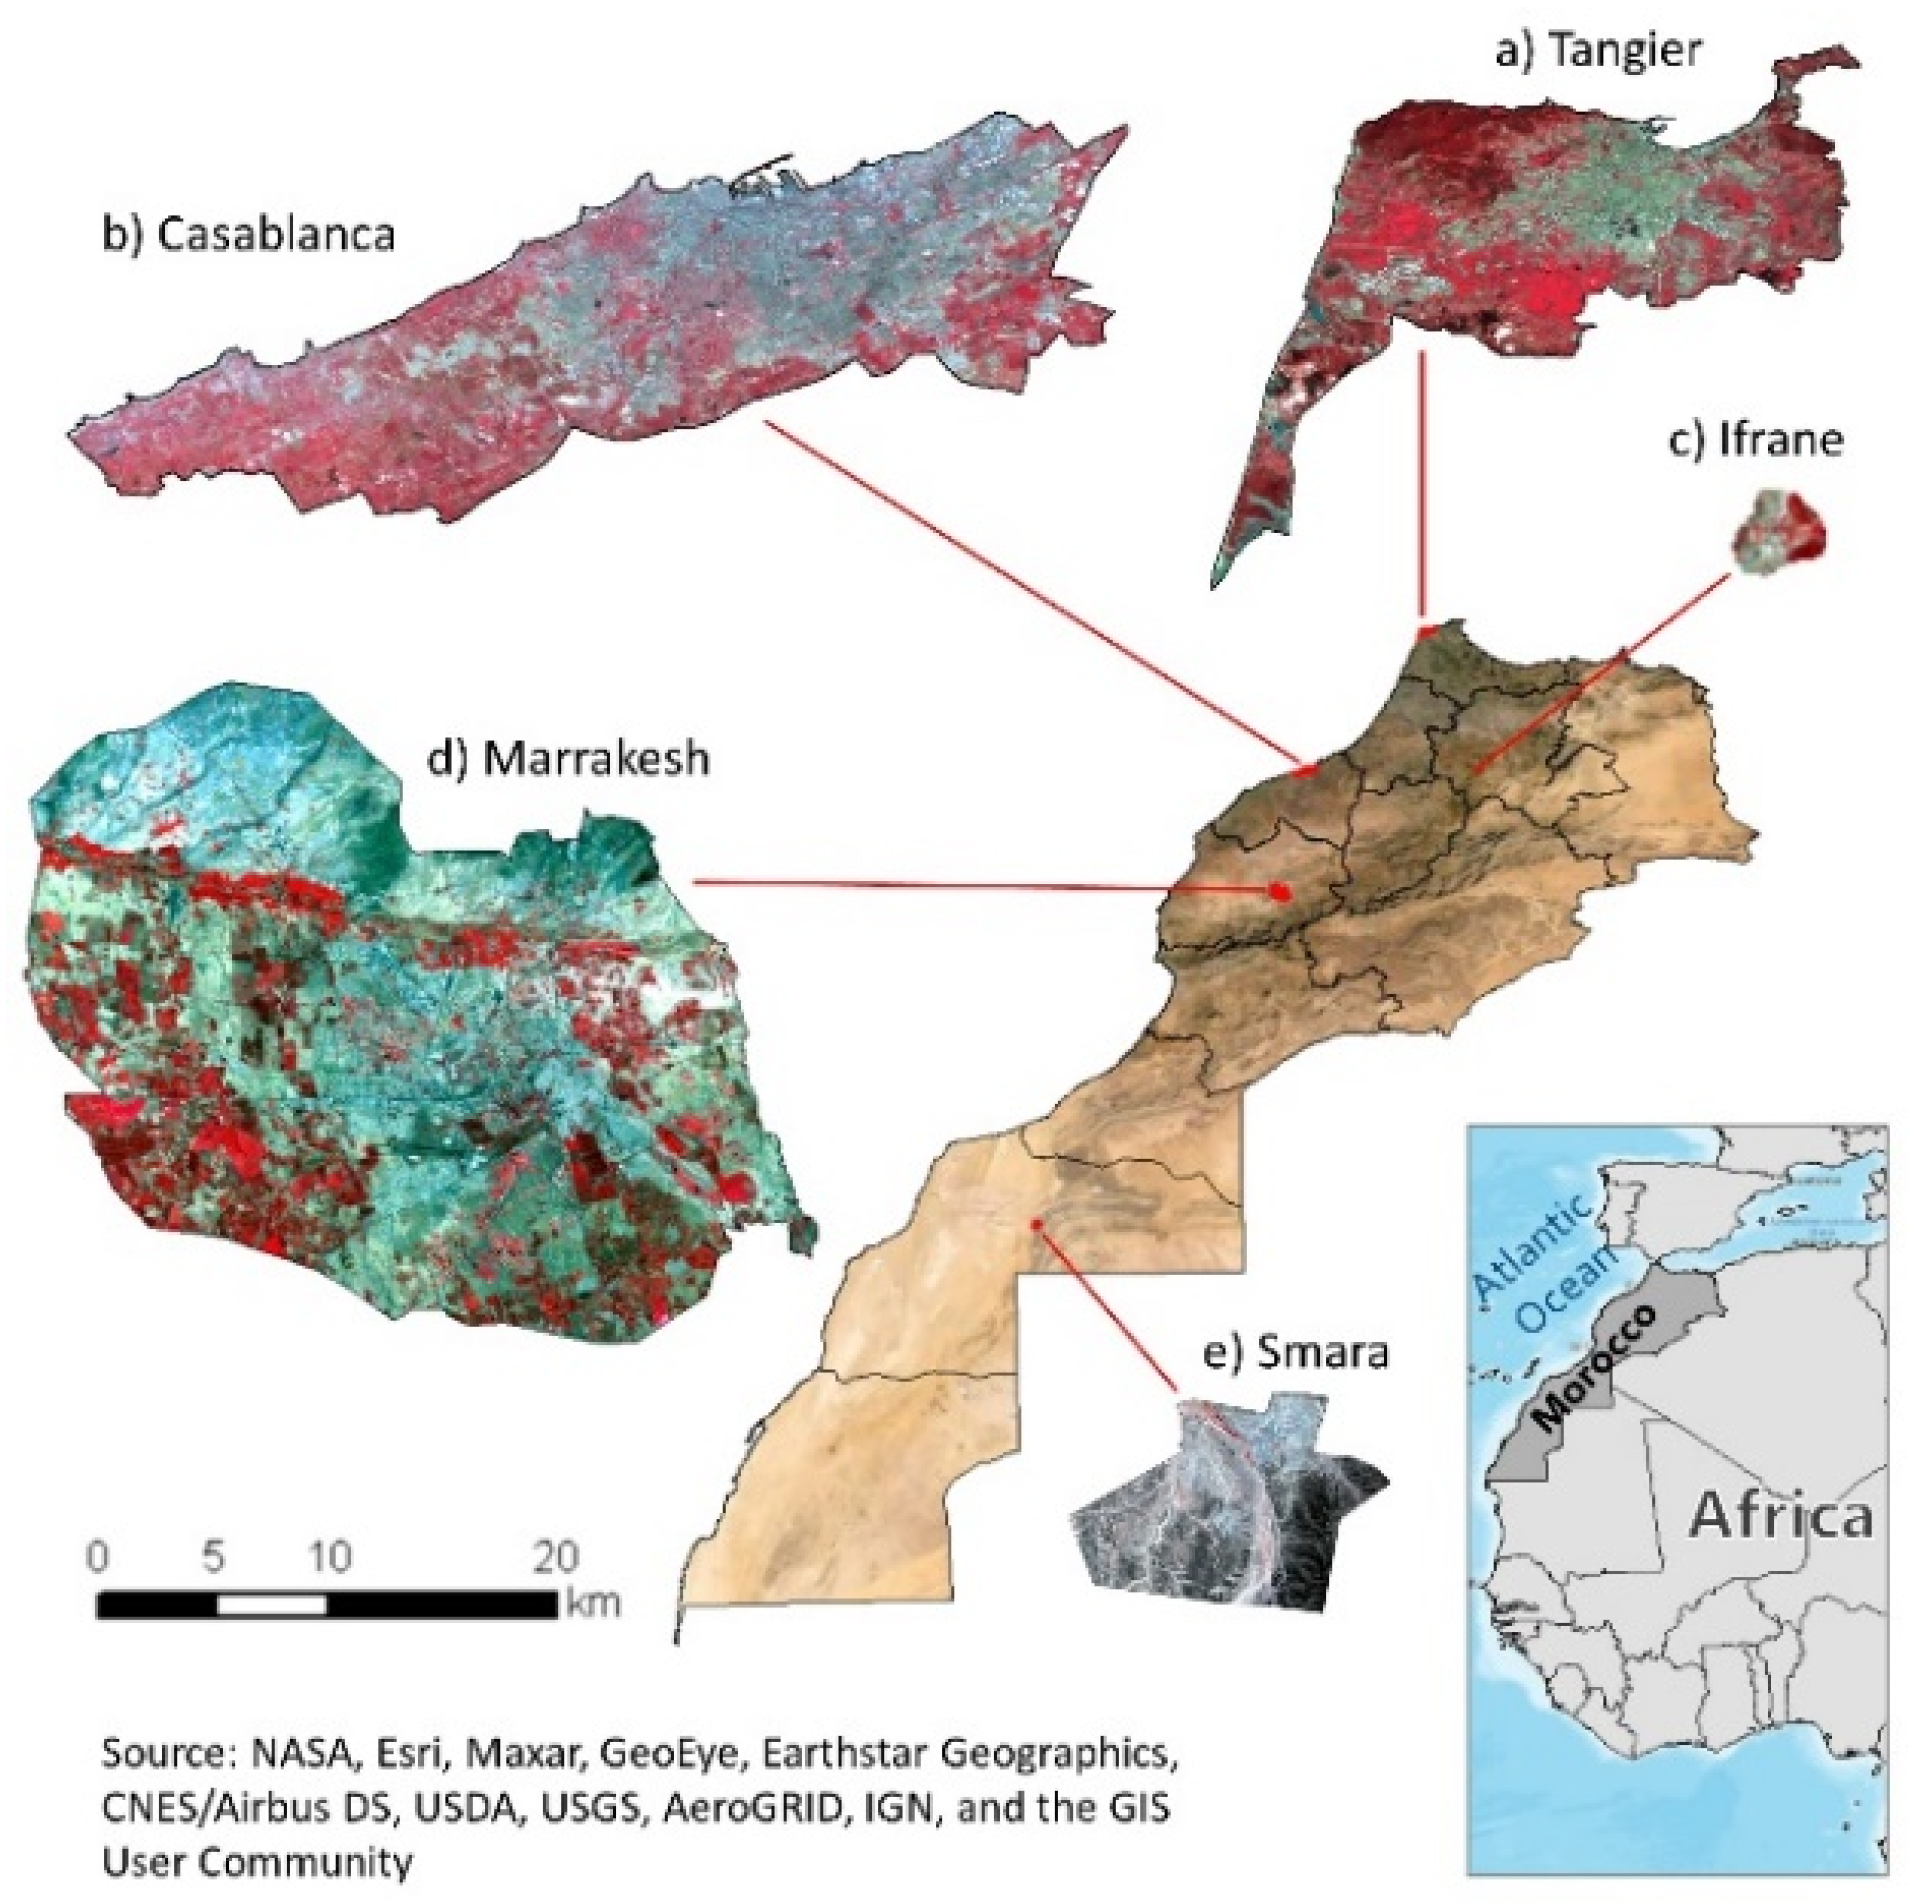
All available 2016 cloud-free Landsat 8 surface temperature data were downloaded from the USGS Earth Explorer data portal (
https://earthexplorer.usgs.gov/ accessed on 2 February 2021) for the five study urban areas: Tangier, Casablanca, Ifrane, Marrakech, and Smara (
Figure 1). Product scenes from summer (June, July, August) months were then time-averaged to create a single dataset representative of the season.
Table 1 lists the scenes used for each study area.
2.2. Land Cover
We used the European Space Agency (ESA) Climate Change Initiative (CCI) 20-m Land Cover dataset to characterize the land cover types in the study areas and to distinguish impervious surfaces from other natural surfaces.
The ESA CCI Land Cover (LC) is based on 1 year of Sentinel-2A reflectance composites collected from December 2015 to December 2016 [
25]. The ESA LC classification is a high-resolution validated product and coincides with our study period.
2.3. Seasonal Temperature Profiles
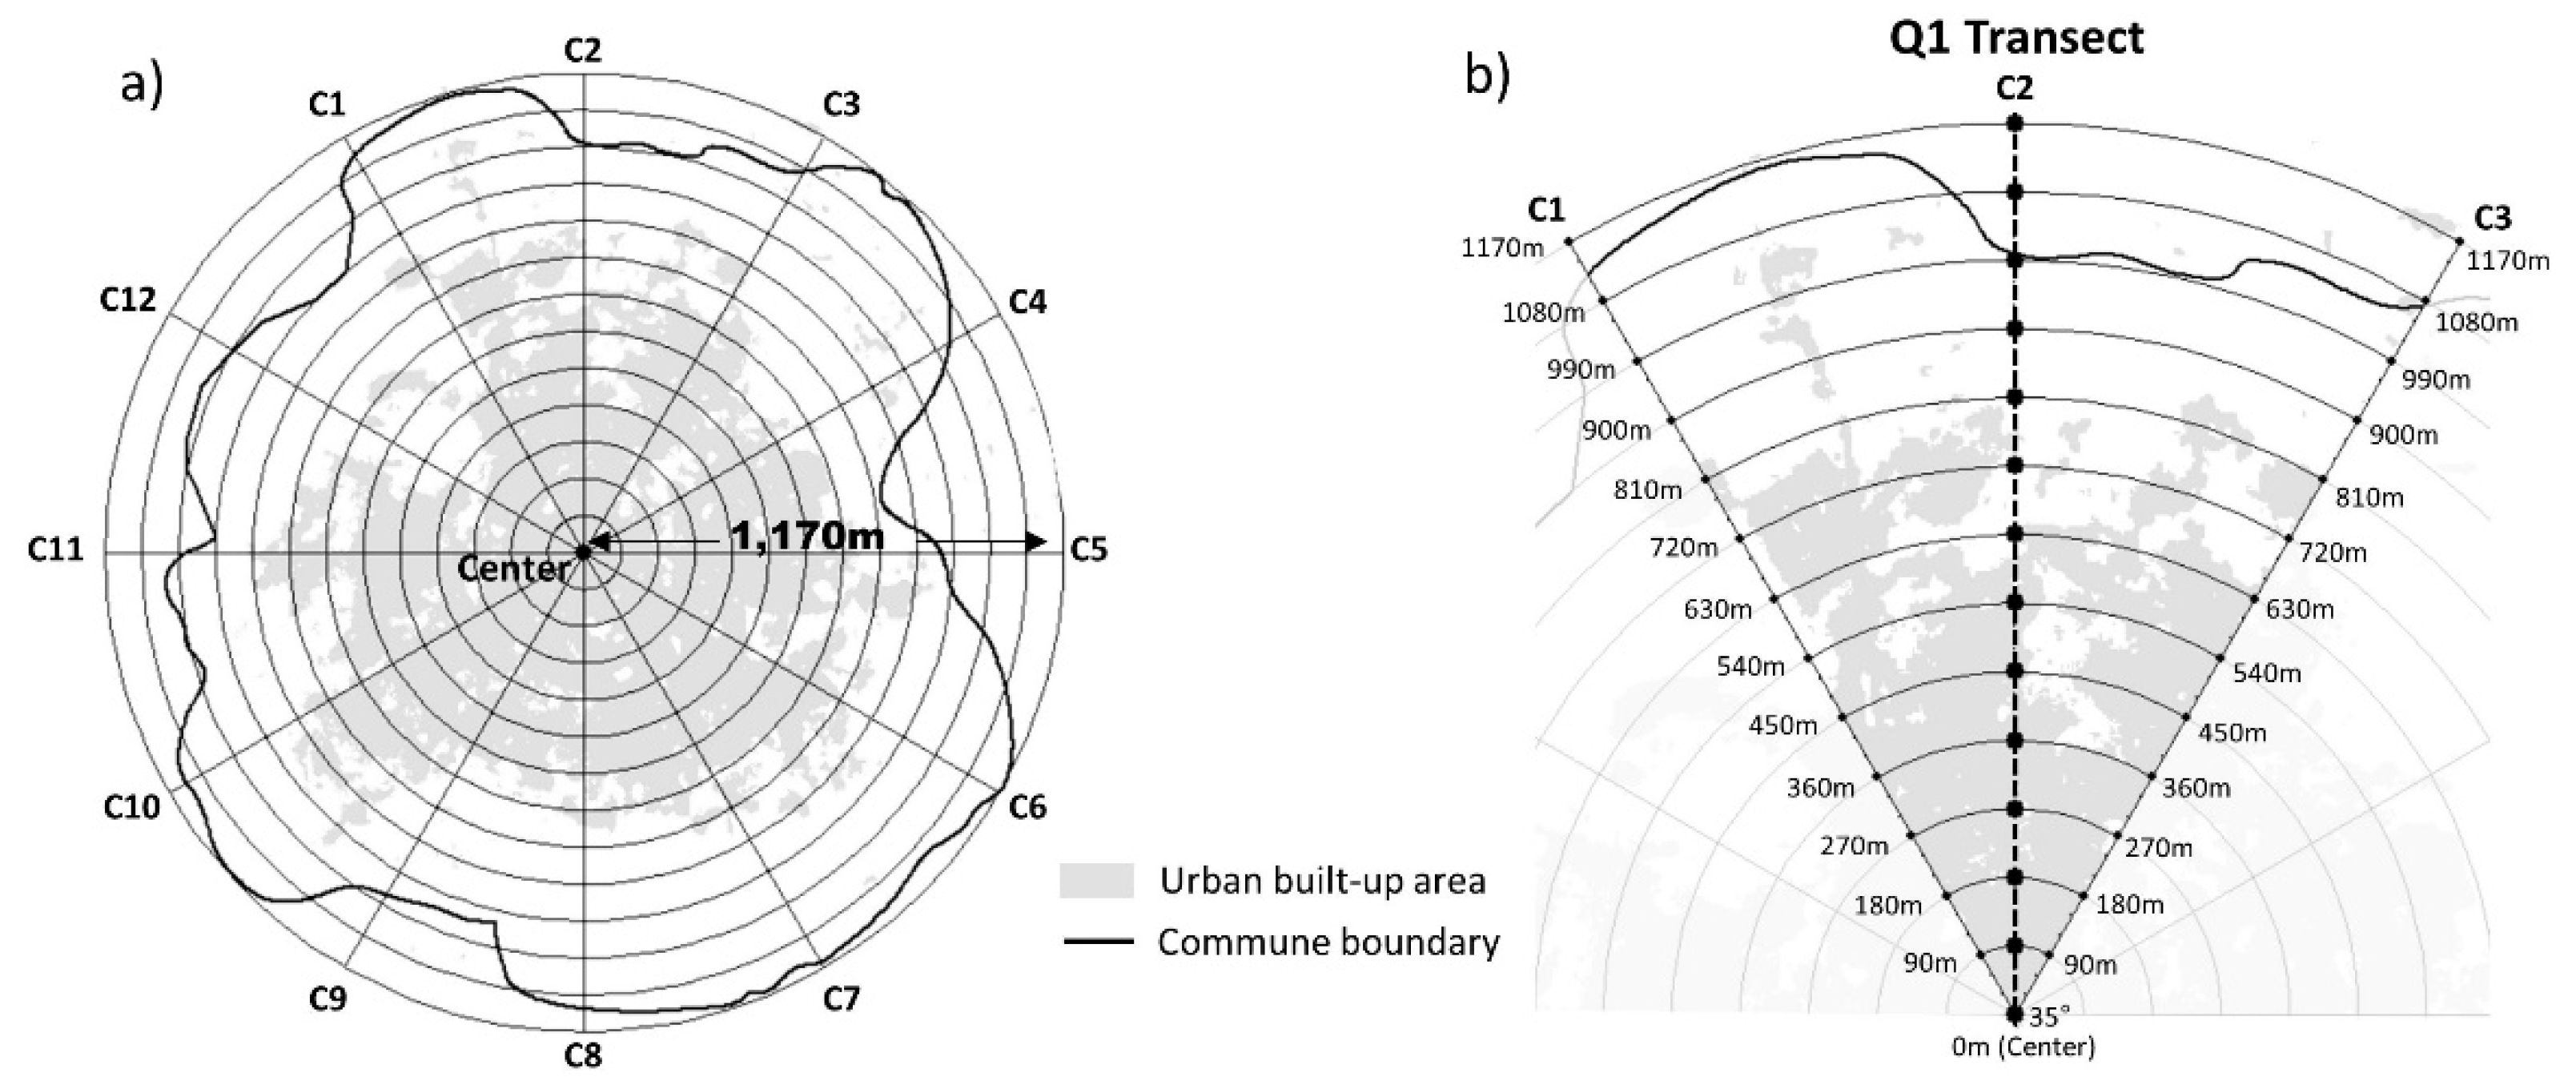
Once the 2016 datasets were generated, the seasonal surface temperature was computed for summertime (June–August) to assess and compare the UHI amplitude between the five urban area cores and their respective surrounding rural land cover. The analysis was confined as much as possible to the boundaries of each designated city, as demarcated by the Morocco Commune Boundary shapefile. To do so, a buffer zone was constructed at 90-m intervals from the representative center of each urban area, indicated by the built-up class, and going outward towards the peripheries. A series of axes were then created, connecting the center to the buffer extent edge, selected in ways to best capture the temperature patterns most representative of the distinction between the urban core and surrounding landscape. The buffer extents and associated axes lengths varied for each study area, since these are dependent on the size and shape of the city boundary and the extent of the built area itself. Along each axis, the seasonal surface temperatures were extracted every 30 m but averaged to produce a temperature every 90 m since the level of detail was not necessary and the Landsat 8 thermal bands, from which the surface temperature is derived, have a 100-m native spatial resolution prior to resampling [
26].
The surface temperature values at each 90-m mark were further averaged across axes within a defined quadrant (or halves in the case of Ifrane and Smara) to derive a single set of values representative of a transect for each urban area direction (
Figure 2).
The general concept of an urban heat island suggests that the city has a regular geometric shape and is surrounded by homogeneous landscapes often of the same nature, implying a symmetric temperature profile around the city-center [
27]. The reality on the ground is quite different from this theoretical structure as cities are not all built the same way, nor are they built in the same surrounding environment. This leads to a spatial distribution of temperature in cities which is not necessarily symmetric around the city center, and sometimes completely opposite from one periphery to another. Hence the relevance of investigating the contribution of urban design to the temperature distribution.
The sampling of the cities was done using the climate zoning of De Martonne [
28]. Within each zone, we selected cities based on their topography, urban planning, and size. Thus Tangier, Casablanca, and Ifrane represent cities with a humid climate while Marrakech and Smara are classified as cities with an arid and hyper-arid climate, respectively.
To ensure uniformity, we have standardized both the approach and the illustration of the maps and graphics for the five cities. For each of the cities studied, and according to its shape and its geolocation (e.g., coastal or mountain city), we have constructed temperature profiles that best reflect its structure. For example, for the cities of Casablanca and Tangier, we constructed temperature profiles on two sections, one perpendicular and another parallel to the coast, so we were able to reveal the temperature structure across the city along these two directions. We were particularly sensitive to the presence of large, landscaped features or natural obstacles that may affect the temperature profile, in particular coastal outskirts, urban forests, and industrial areas.
Because we use the land surface temperature derived from a radiance observed by satellite, the urban heat islands and sinks that we describe in this study are surface phenomena to be distinguished from those obtained using air temperature. Furthermore, the buffer zones selected to define the UHI/UHS are not standards, and while some studies limit the peripheries to the immediate surroundings of the urban center, we elected to be more inclusive and choose larger buffers to include homogeneous rural landscapes.
3. Results and Discussion
3.1. Temperature Structure in Tangier
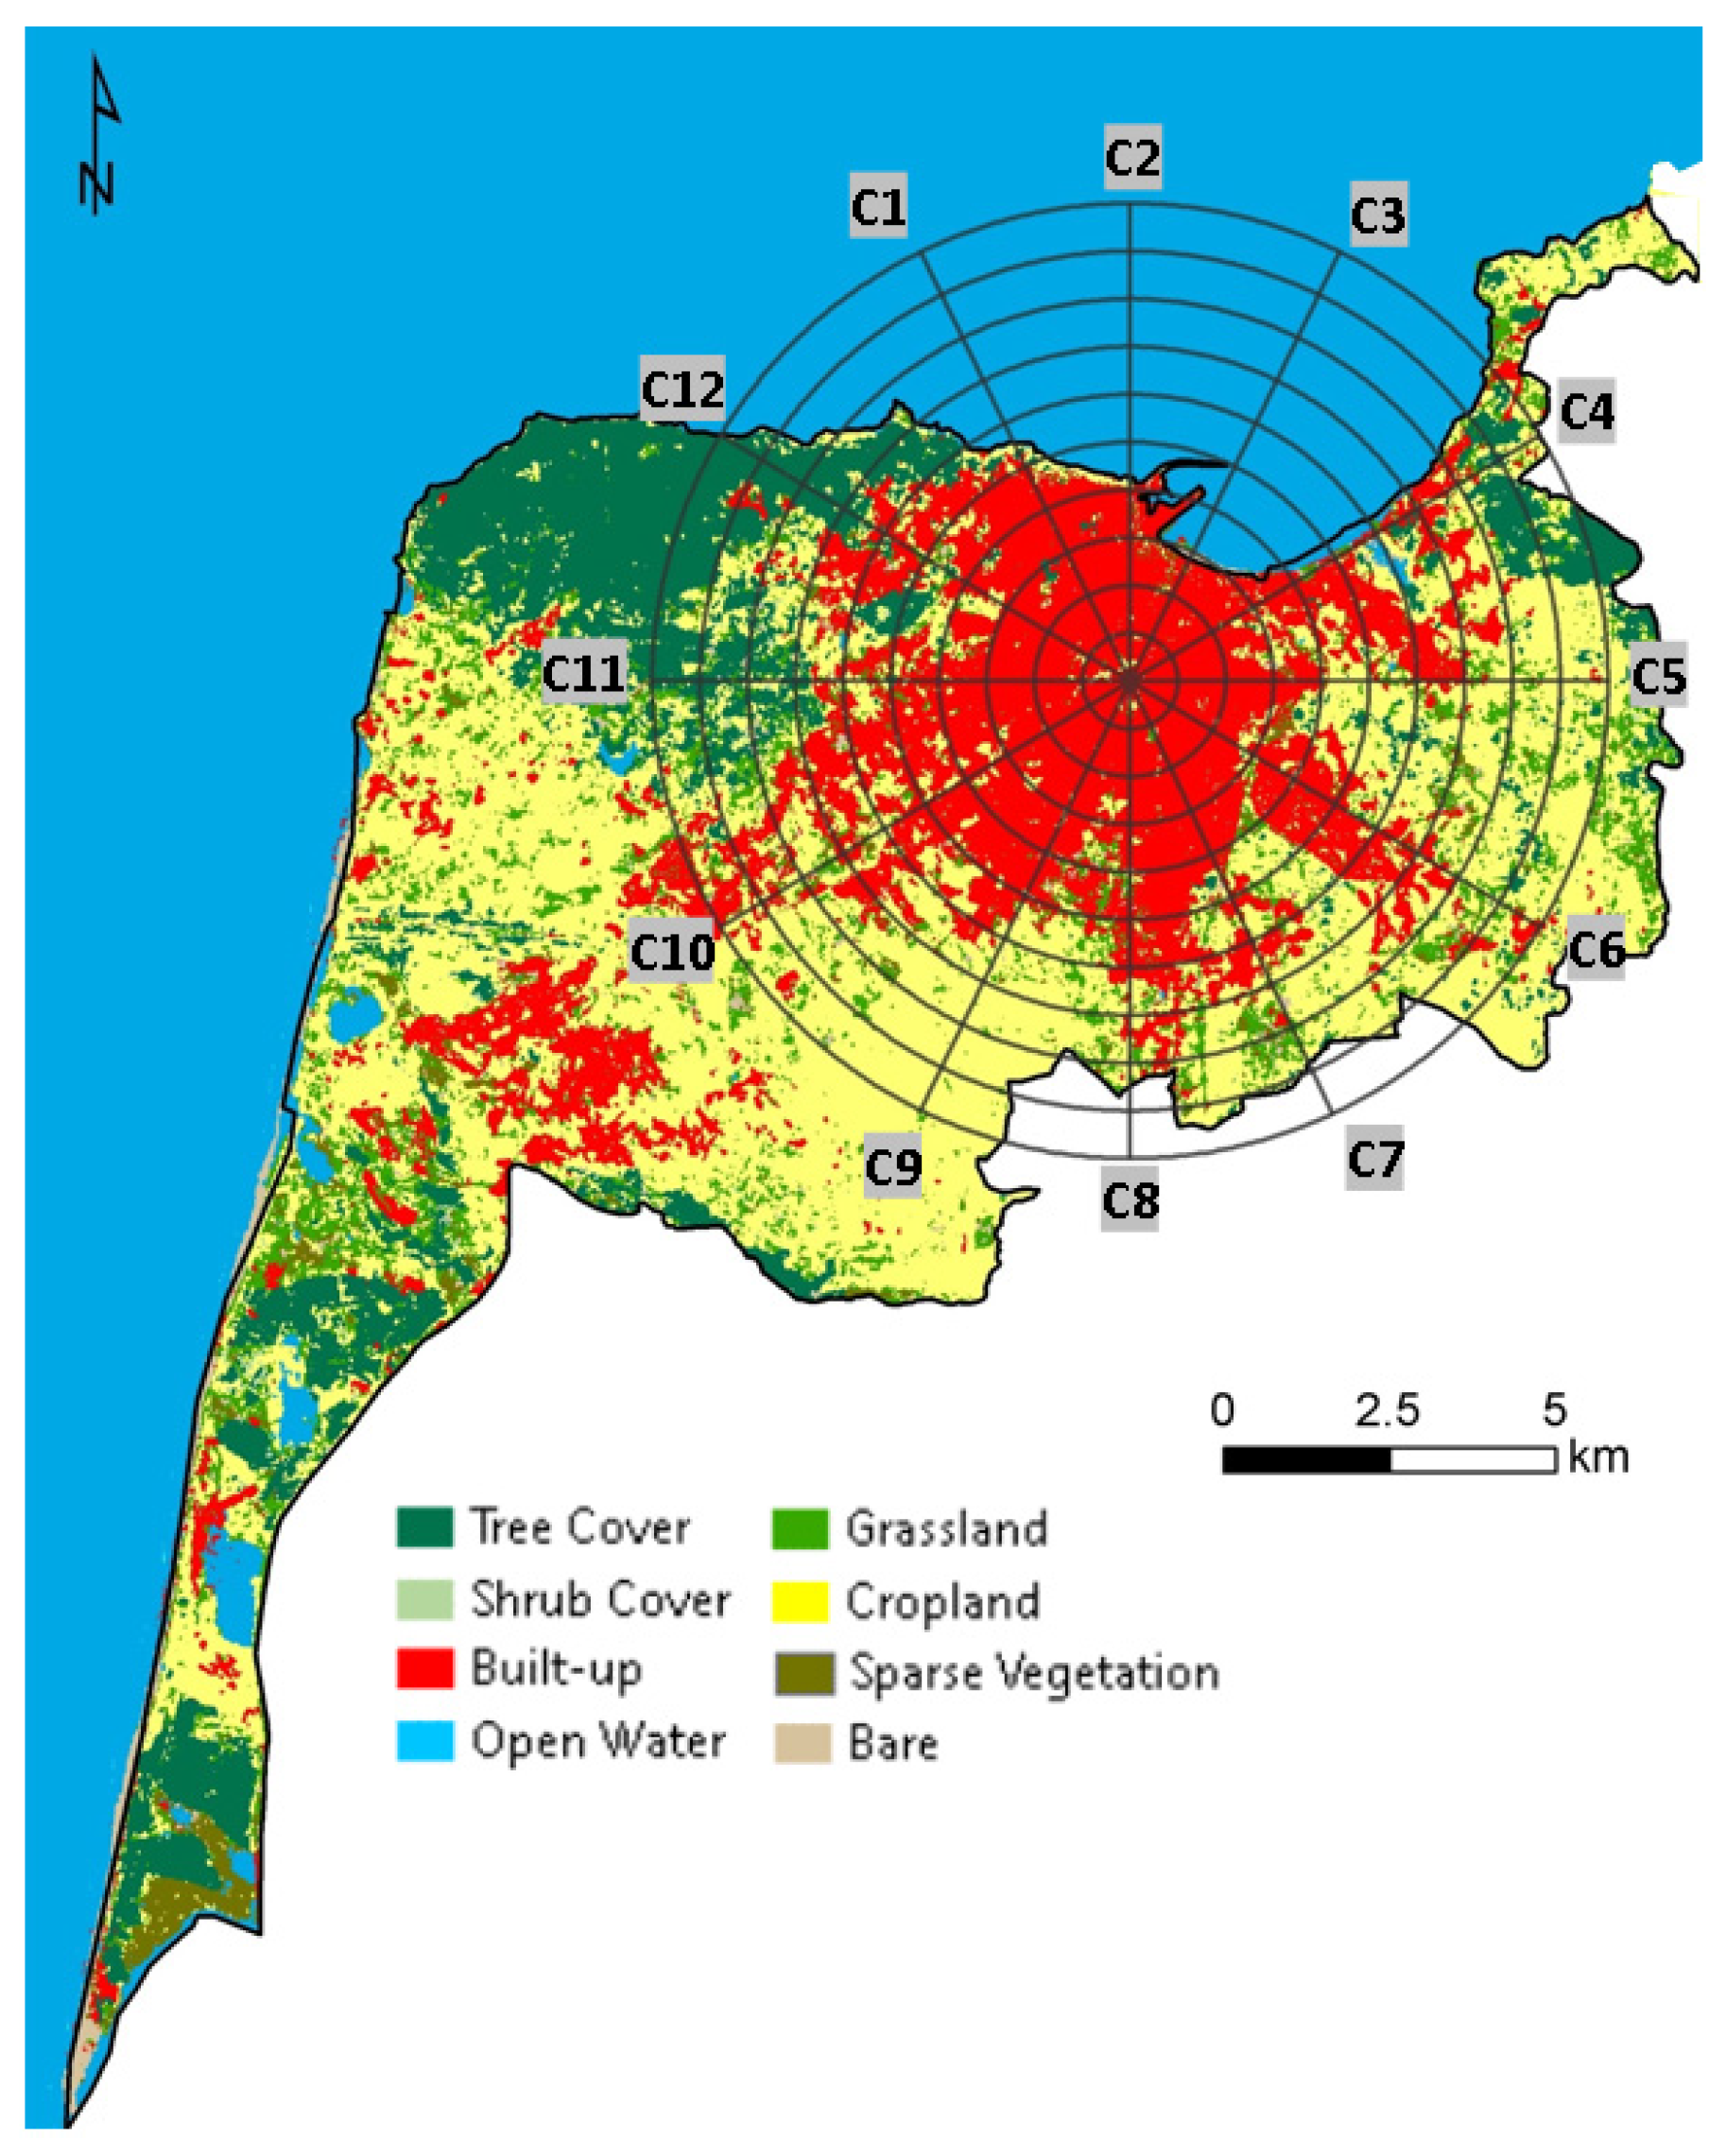
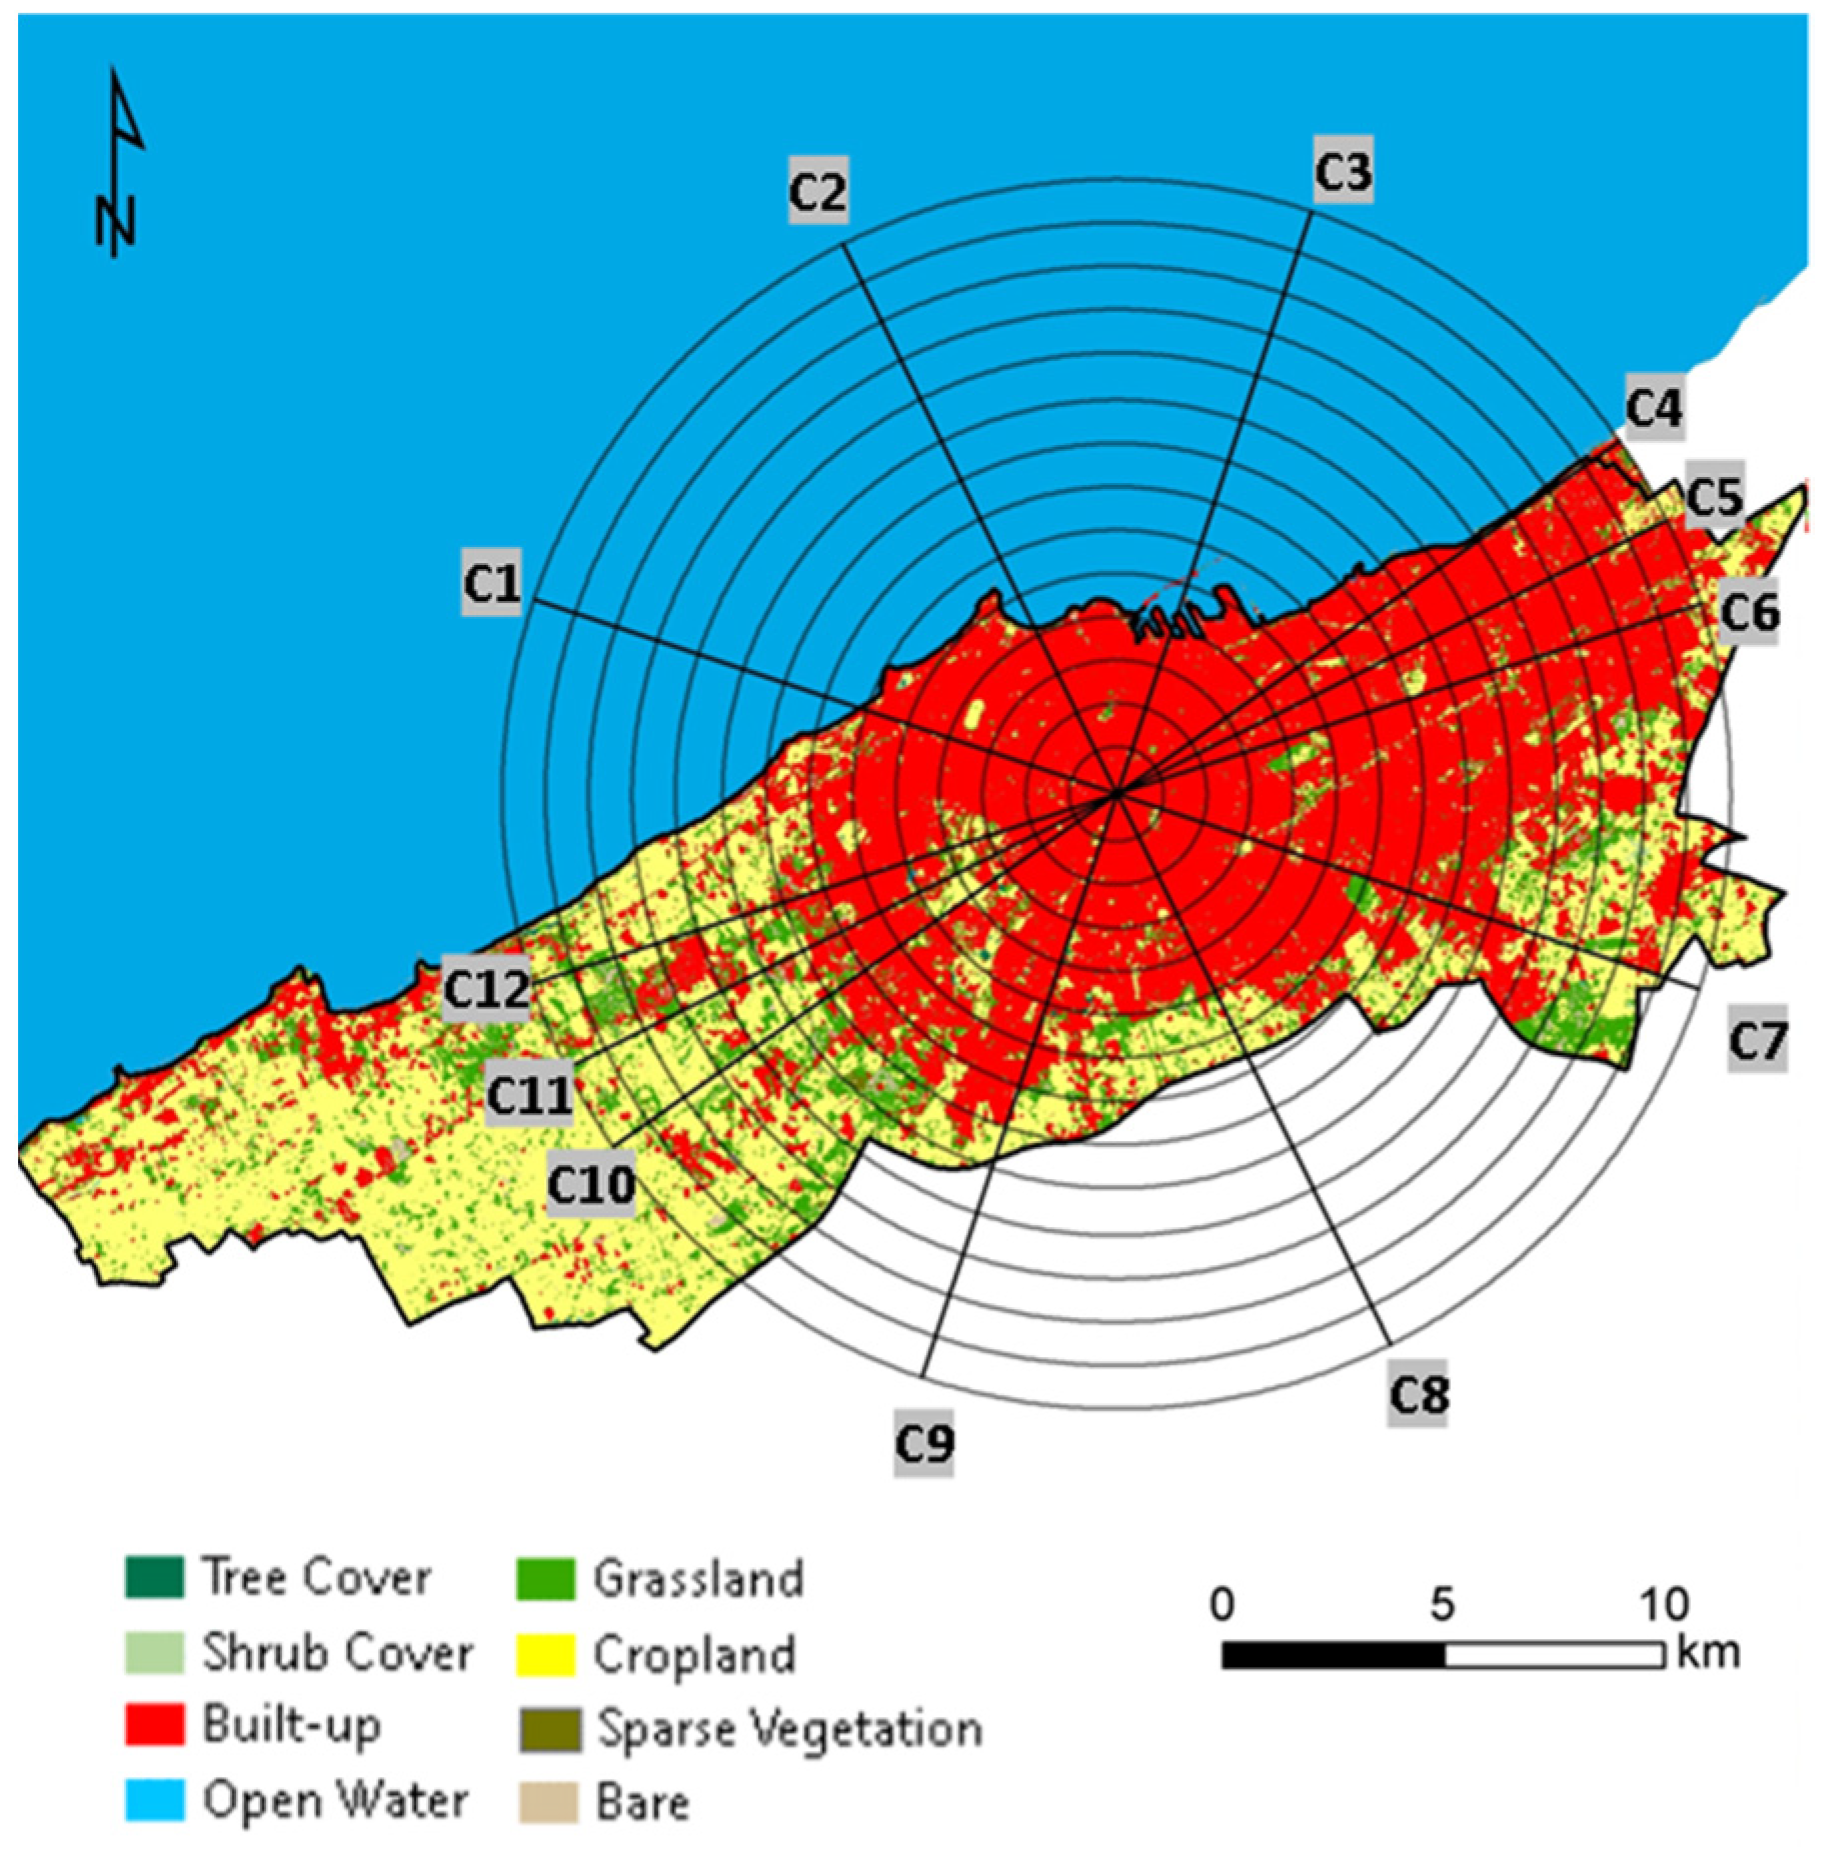
Tangier, the strait city with a subhumid climate, is surrounded by the Atlantic Ocean, the Mediterranean Sea and in large part by vegetated lands, including the Cap Spartel Nature Reserve. Particular attention is given to the study of the spatial distribution of temperature across the city and the definition of the UHI and its amplitude. Two cross-sections, perpendicular and parallel to the coast, were examined.
3.1.1. Perpendicular Cross-Section
The three axes C1, C2 and C3 (
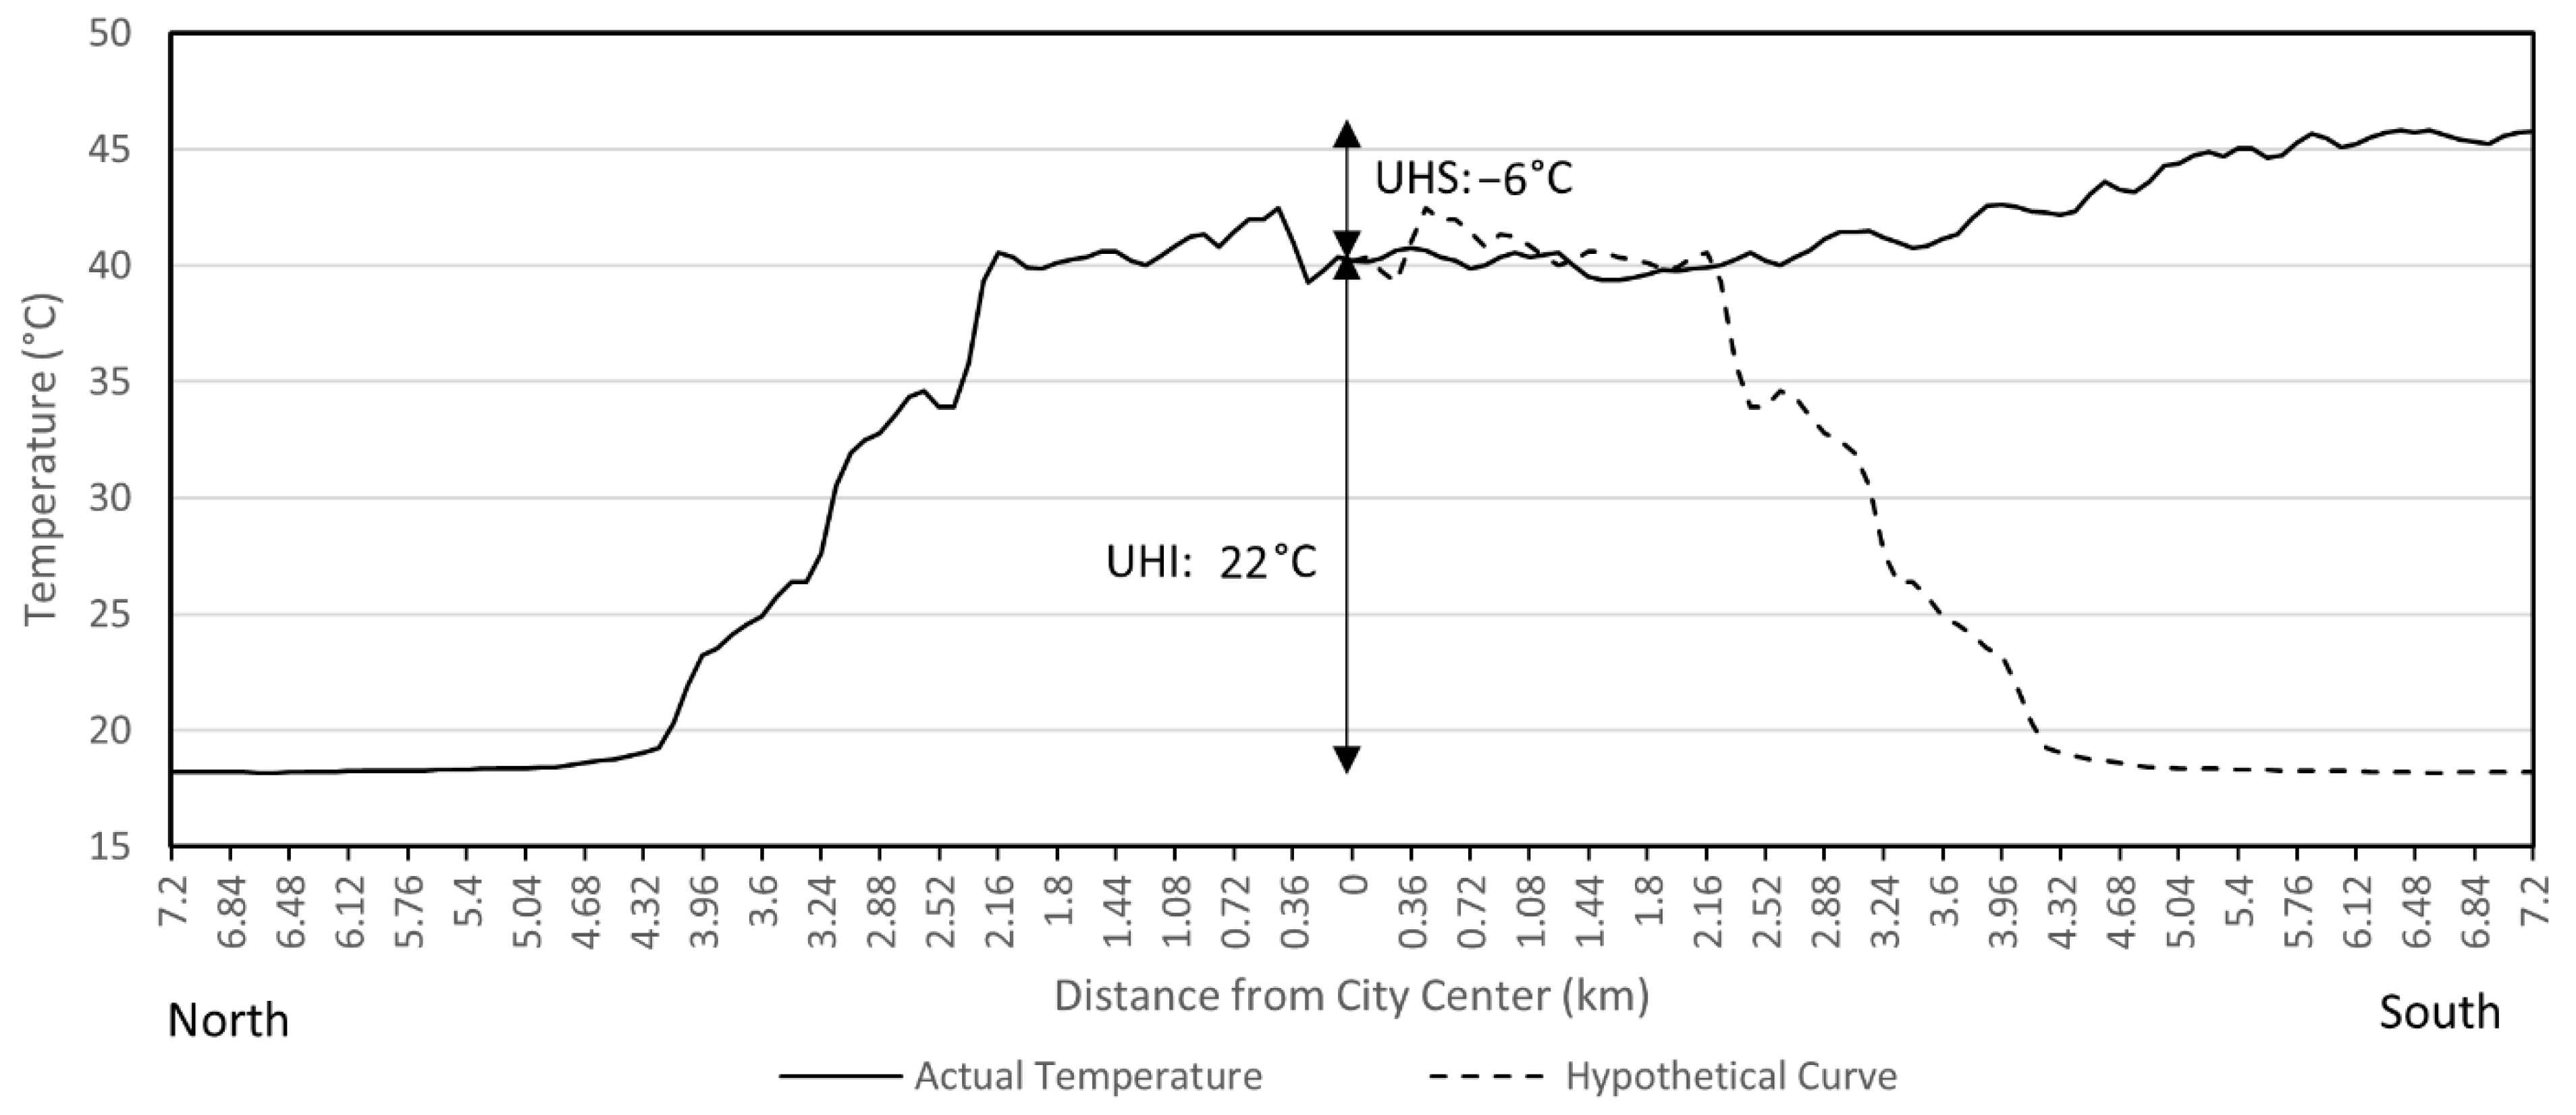
Figure 3) going from the center of the city to the north made it possible to construct a cross section of average temperature perpendicular to the coast. This average profile is represented by the solid line in
Figure 4 and extends for 7200 m on either side of the city center in a north-south direction. Along this cross-section, we notice that the temperature increases from 18 °C on the seafront to 40 °C in the city center, creating an UHI with an amplitude of 22 °C. The southern outskirts, far from the sea breeze effect, have a different land use comprised of fallow agricultural land, bare soils sometimes covered with grass, and agglomerates of slums and unsanitary habitats. We therefore recalculated the temperature profile from the city center to the southern periphery based on the average temperature on the axes C7, C8 and C9. We notice that the temperature recorded along the same transect continues to increase, albeit with a weak slope, towards the southern periphery. By definition, the UHI is calculated as the temperature difference between the city center and its outskirts. In the southern outskirts of Tangier, our results show that the temperature trend is reversed from that in the north, as it ranges from 40 °C in the city center to 46 °C in the southern outskirts, creating a difference of −6 °C. This means that the city center, with a high density of buildings, is significantly cooler than the southern periphery, which is mainly made up of bare land and slums, and in contrast to the UHI observed in the city’s northern periphery. This is referred to as an urban heat sink (UHS) [
29].
The UHS is attributed to the existence of imported trees and shrubs, often irrigated, that provide a cooling effect in urban areas [
1]. For the city of Tangier, this phenomenon is accentuated by the existence in the southern outskirts of a high density of unhealthy dwellings that do not comply with modern urban planning rules.
These habitats are made mostly with cement and zinc sheet roofs that absorb large amounts of solar energy and transform it into sensible heat, thus increasing the surface temperature. So, depending on whether we consider the temperature profile from the northern periphery to the city center or from the southern periphery to the city center, its structure indicates a UHI of amplitude of about 22 °C or a UHS of about 6 °C, respectively. However, if the city of Tangier was completely surrounded by water (like an island), then the hypothetical temperature profile across the southern periphery would resemble the dashed curve shown in
Figure 4 and mirror the profile of the northern periphery, generating an ‘ideal’ UHI. On the other hand, if the city were surrounded by fallow agricultural land and bare soil during the summer, and aggregates of slums as is the case on the southern outskirts, then the temperature profile would generate an ‘ideal’ UHS.
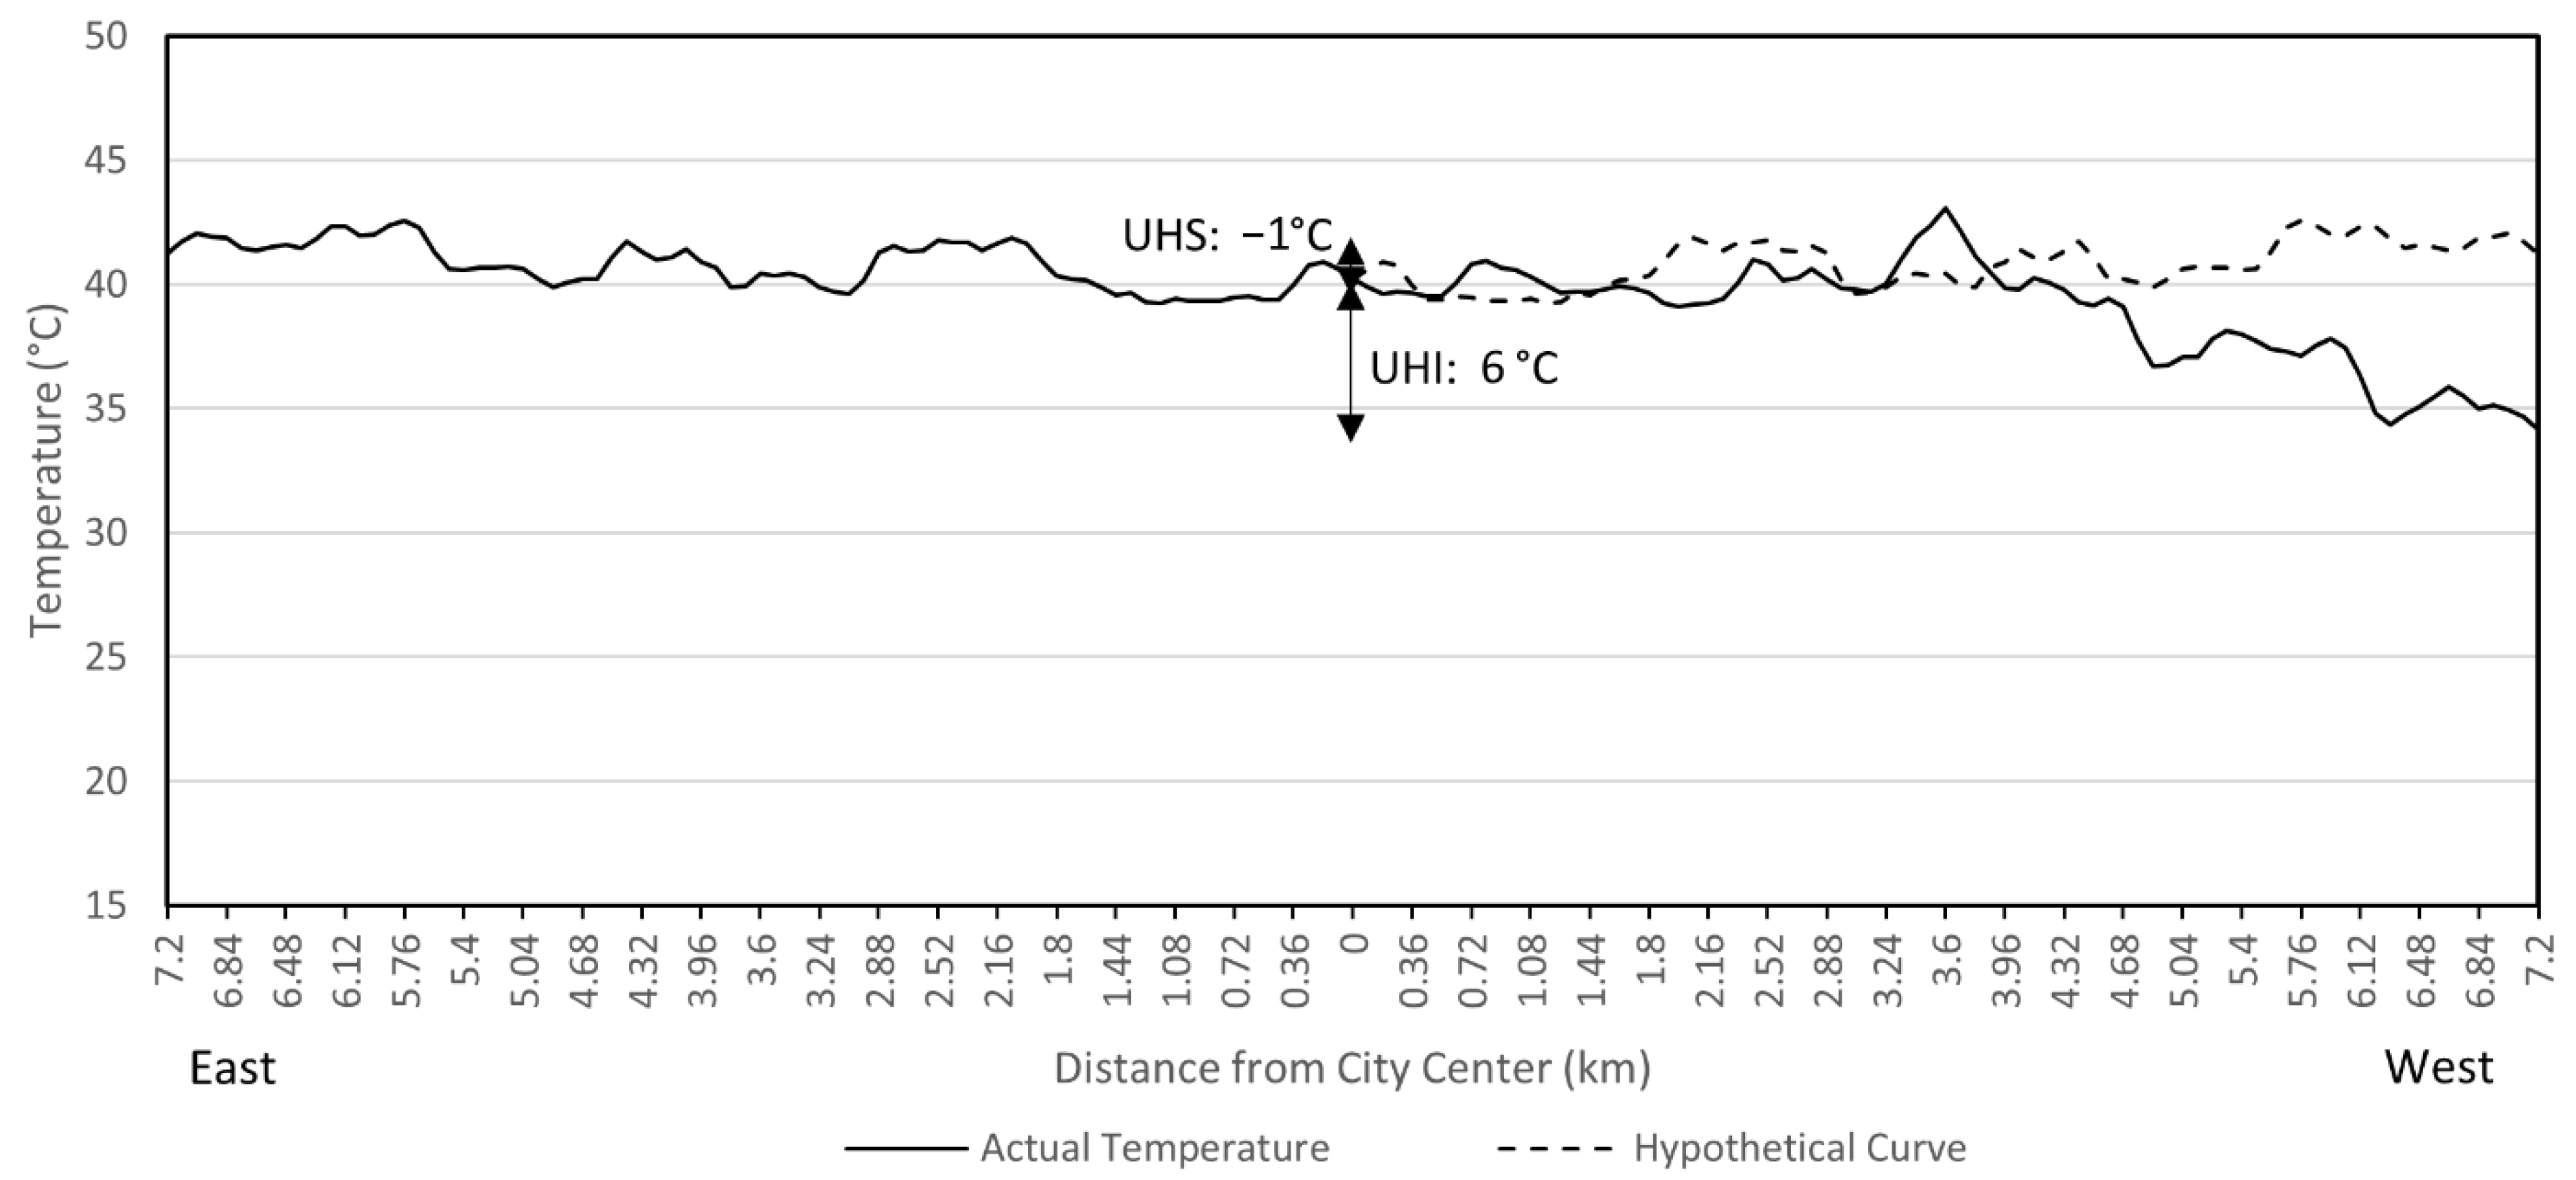
3.1.2. Parallel Cross-Section
In a complementary analysis, we examined the distribution of the surface temperature in the city of Tangier without considering the direct contrast created by the proximity to the sea. For this we made a cross-section parallel to the coast in a general east-west orientation defined by the quadrant limited by axes C4-C6 to provide information relative to the eastern periphery section to the city center, and the average in quadrant C10-C12 for the western periphery. Observations show that the surface temperature drops from 41 °C in the eastern periphery to 40 °C in the city center, i.e., a low amplitude UHS of 1 °C, then from the city center to the western periphery, located approximately 7.2 km from the city center, the temperature continues to decrease to reach 34 °C (
Figure 5). This drop in temperature west of the city center is due to the large nature reserve, the Cape Spartel, which borders the city on the west side. This mixed forest area with various trees and dense evergreen foliage acts as a natural means of cooling the ambient air and the surface. Indeed, during photosynthesis, the tree uses solar energy and groundwater to make organic matter. During this process, the tree sequesters carbon dioxide and releases oxygen. The process is also accompanied by transpiration, an endothermic reaction that draws heat from the surface and therefore cools it. We notice that the UHI and the UHS obtained by crossing the city from east to west (
Figure 5) are similar in shape to those obtained in the cross-section perpendicular to the coast but different in amplitude. The amplitude of the UHS in the cross-section parallel to the coast is only 1 °C while that of the UHI is 6 °C, clearly showing that the temperature structure in and around the city is highly dependent on the land use within the city and in its neighborhoods, highlighting the thermal contrast created by the sea on the city of Tangier and the nature reserve.
3.2. Temperature Structure in Casablanca
In addition to being the largest city in the Kingdom in urban terms, Casablanca is also distinguished by its Atlantic coastal aspect which extends over more than 40 km. As in the case of the coastal city of Tangier, the analysis is conducted using transects both perpendicular and parallel to the coast (
Figure 6).
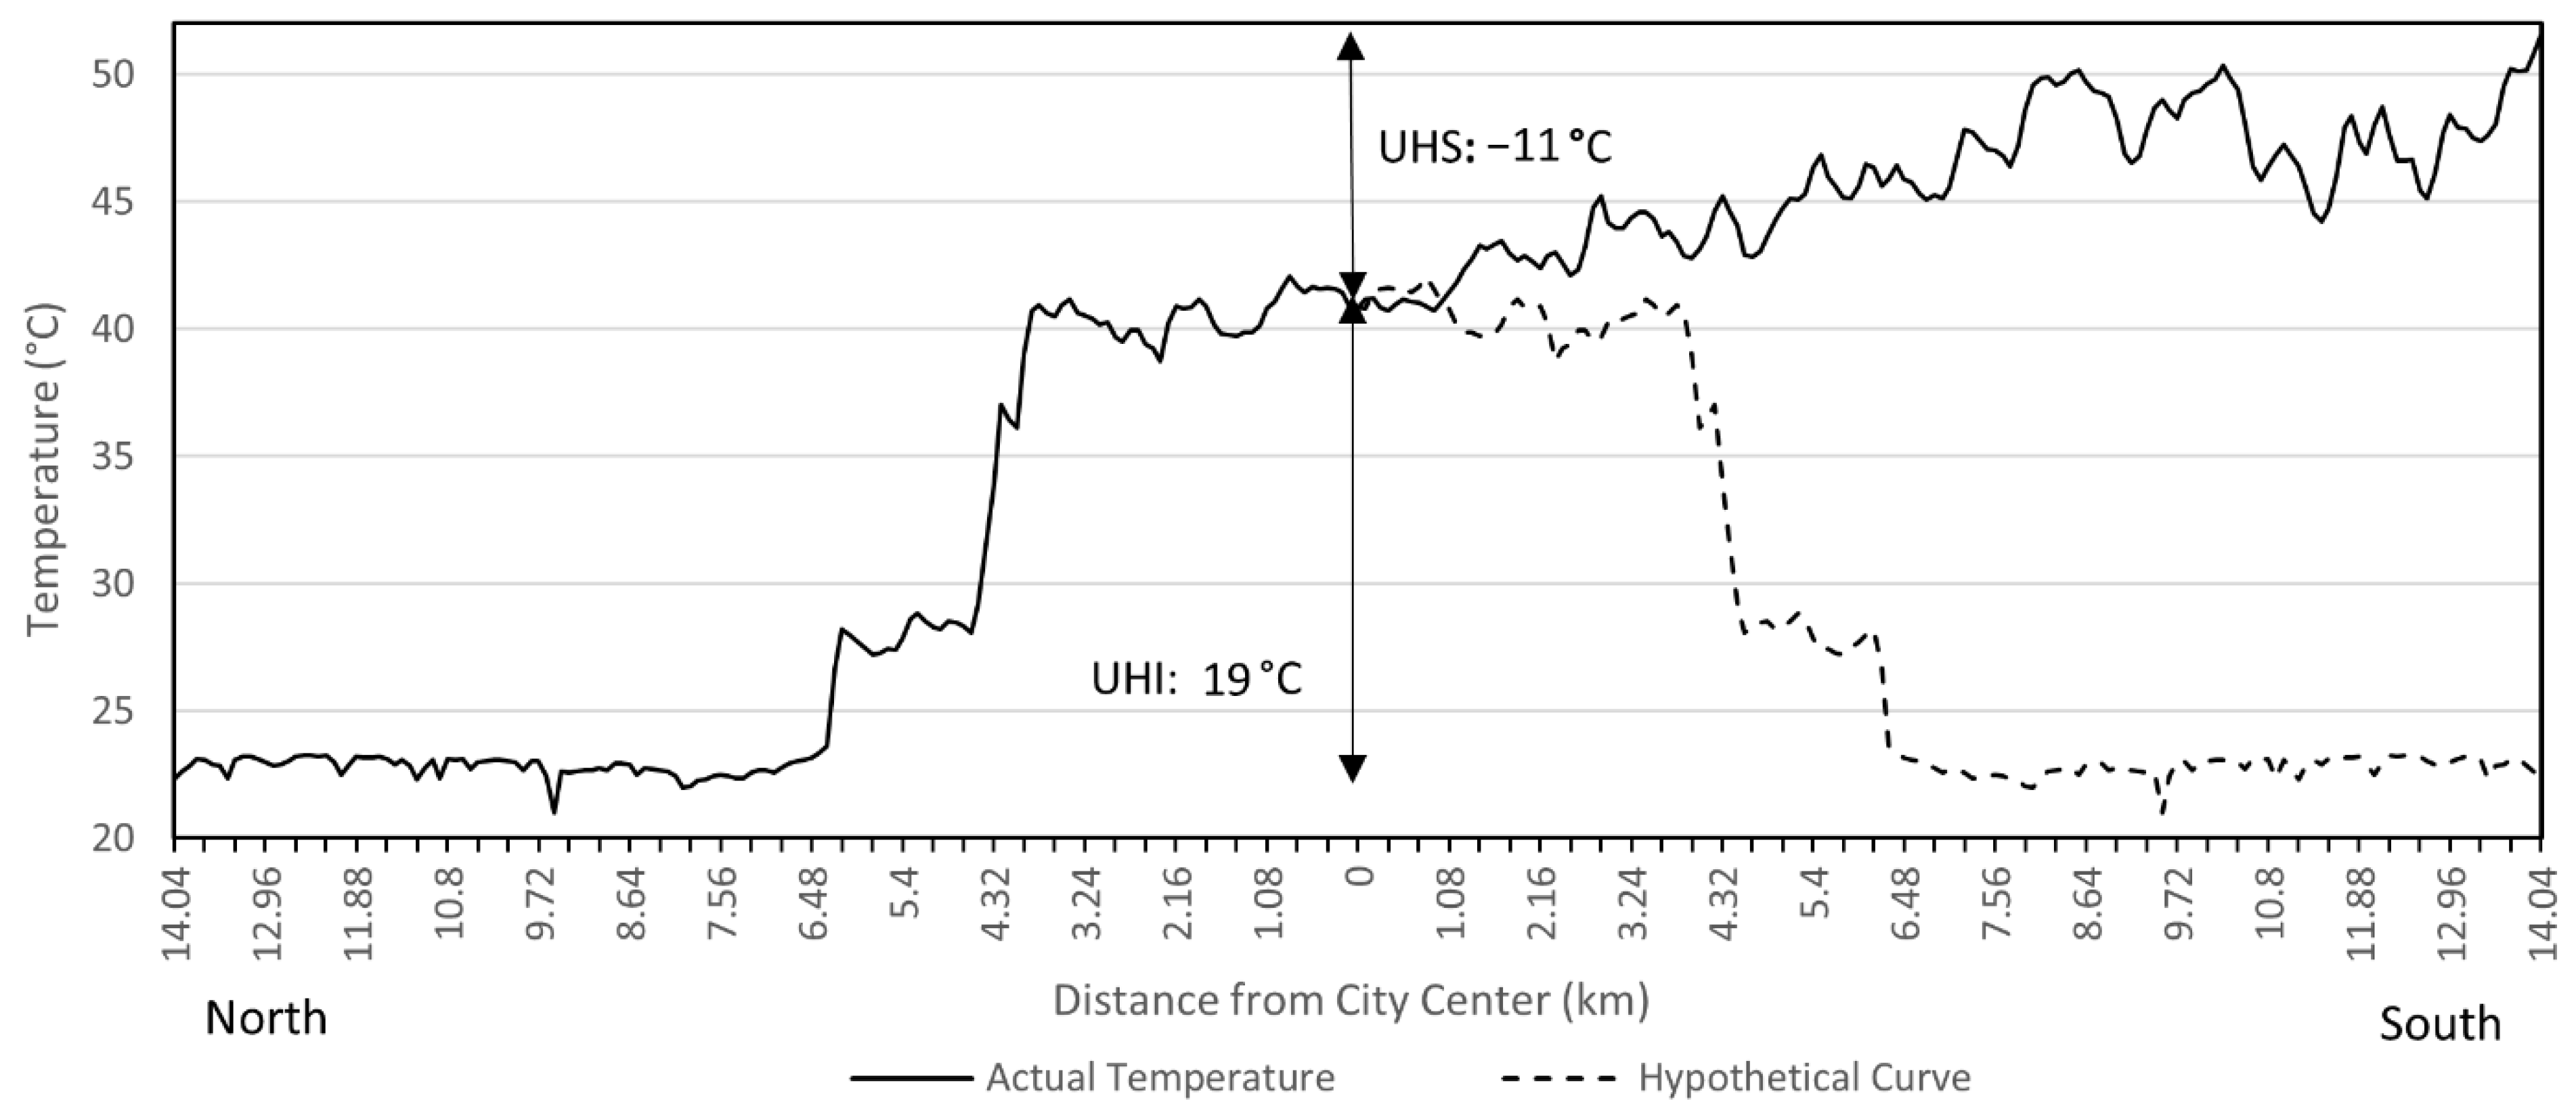
3.2.1. Perpendicular Cross-Section
The cross-section perpendicular to the coast is produced from the average of the temperature readings on the three axes C1, C2, C3 overlapping the seafront and therefore under the influence of the sea surface temperature and the sea breeze. On the seafront, the temperature is 22 °C and increases to reach 41 °C in the city center to create a UHI with an amplitude of 19 °C (
Figure 7). If the city were surrounded by water, the rest of the profile would follow the hypothetical curve generated by symmetry and represented by the dashed line. However, the urban thermal structure of the city is different due to the presence of fallow lands and bare soils of darker shades in the southern outskirts of Casablanca. In this part of the city, the average temperature obtained between axes C7 and C9 continues to increase from 41 °C in the center to 52 °C in the southern outskirts and therefore forms a relatively large UHS with an amplitude of 11 °C (
Figure 7). On this perpendicular cross-section, as in Tangier, we notice two distinct features in the temperature structure. Between the city center and its northern periphery, we observe a well-defined UHI, while in the southern periphery, we observe a well-defined UHS. The thermal structure in and around the city of Casablanca is therefore defined differently depending on its outskirts and presents a significant thermal contrast between the city center and its peripheries.
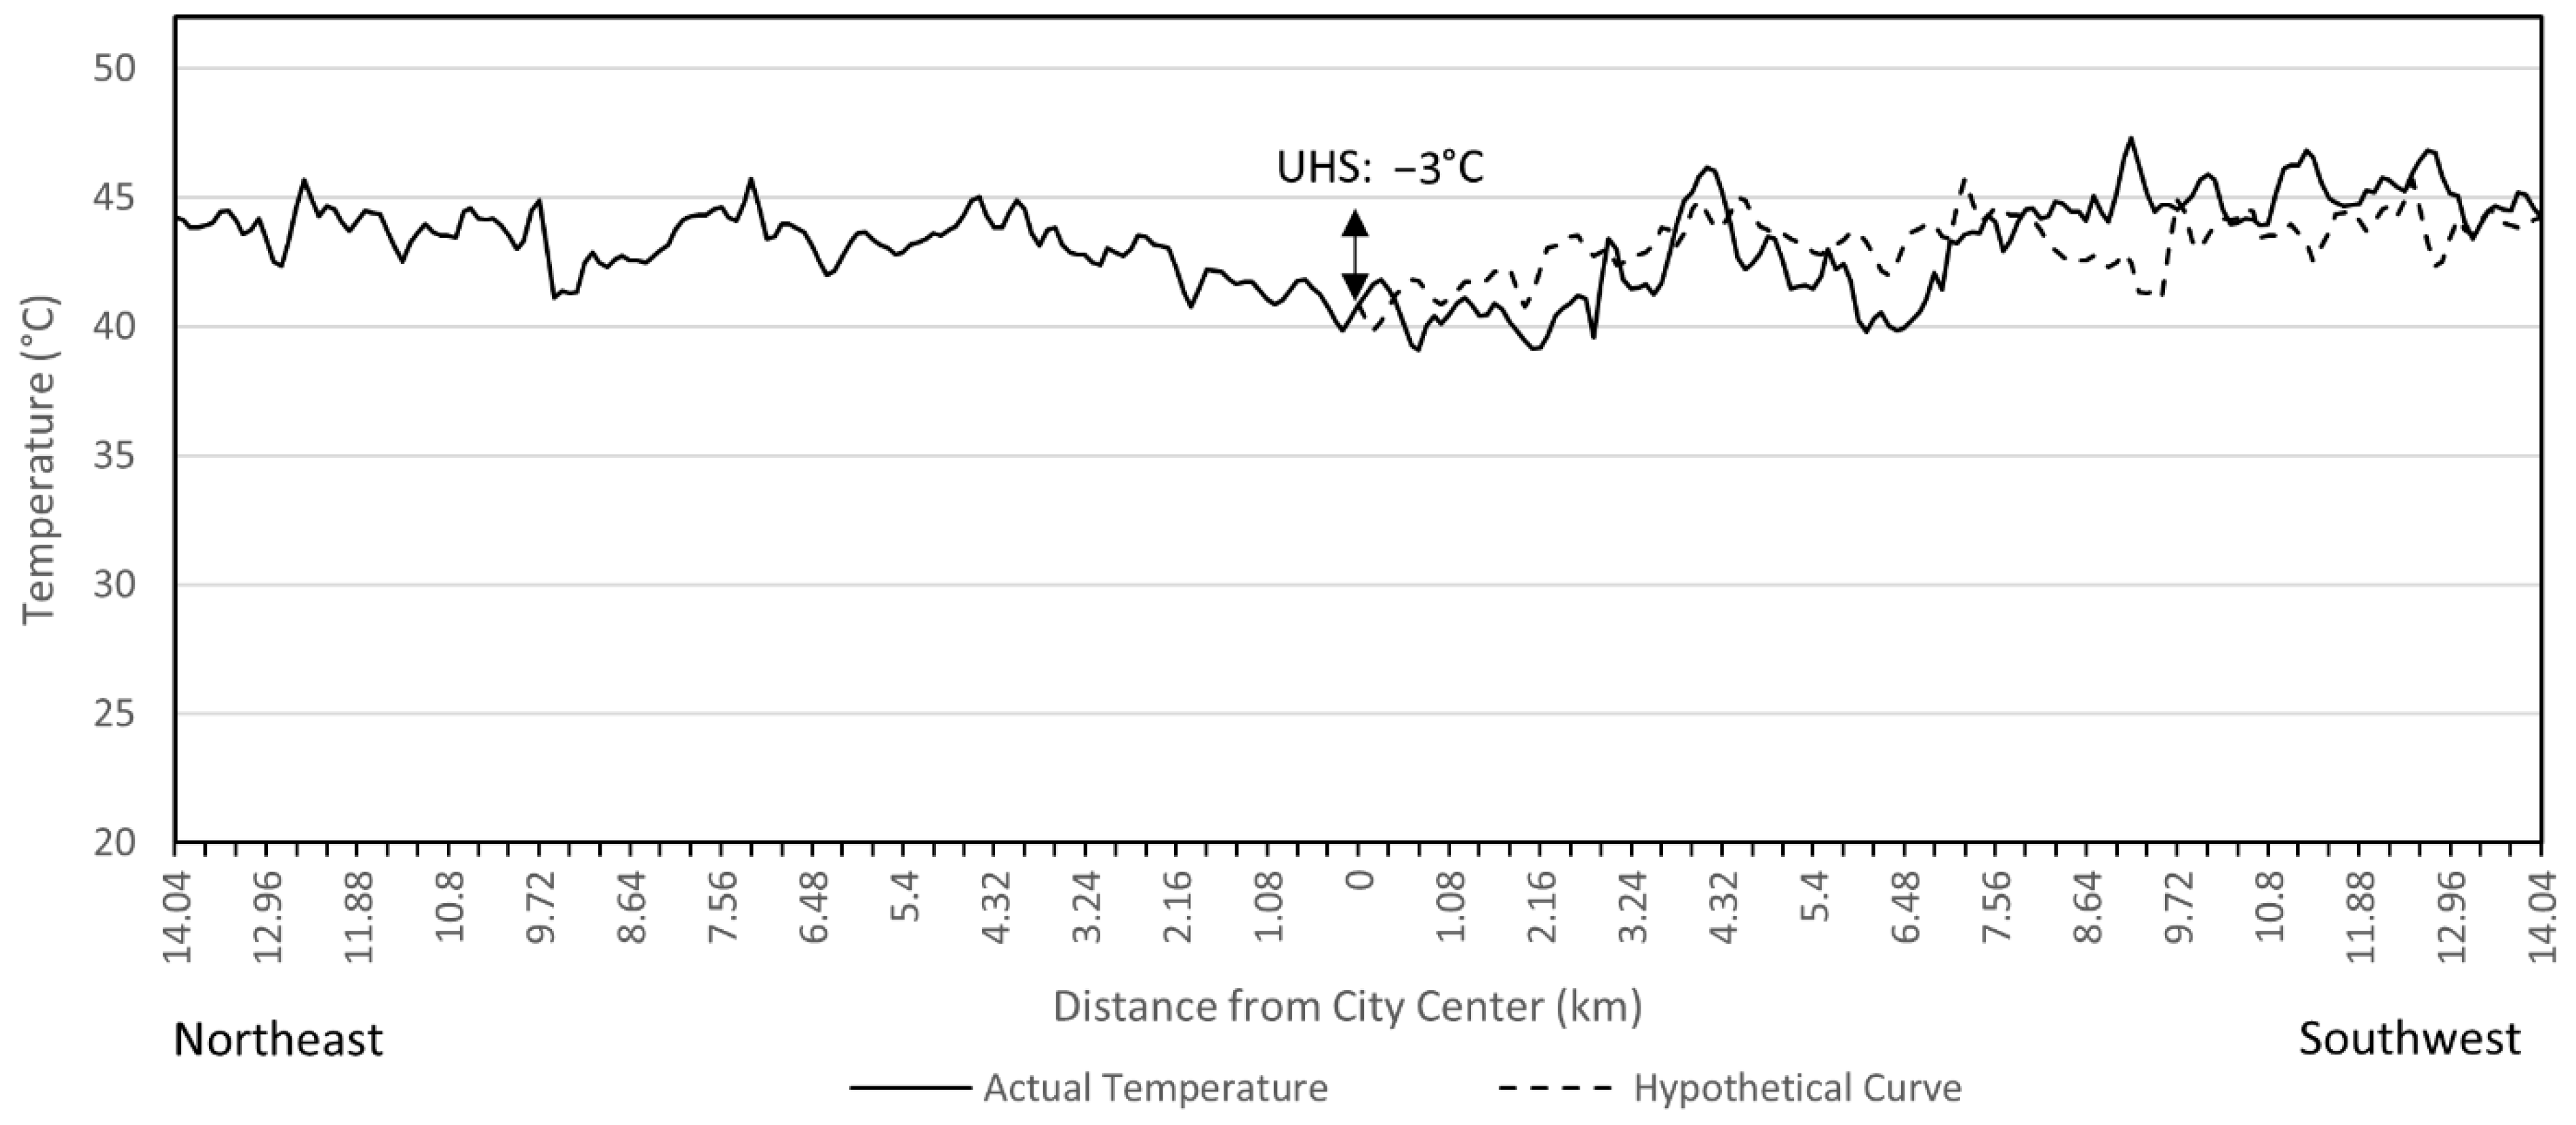
3.2.2. Parallel Cross-Section
To filter the influence of the ocean, a temperature analysis is conducted along a transect parallel to the coastline in a northeast to southwest direction. The average temperature recorded on axes between C4 and C6 was used to construct the profile between the northeast periphery and the city center (Municipality of Maarif) (
Figure 8).
Thereafter, we calculated the average temperature profile between the city center and the southwestern periphery based on the temperature readings on axes C10-C12. The dashed line represents a hypothetical profile obtained by symmetry of the northeastern periphery.
The graph shows a more or less flat temperature structure for the city of Casablanca’s cross-section parallel to the coastline with a UHS of 3 °C from the two peripheries. Indeed, for both the southwest and northeast peripheries, the temperature fluctuates between 39 °C and 47 °C with a standard deviation of ±1.7 °C and an average around 43 °C. This variation, sometimes reaching 3 °C to 4 °C, creates a succession of small amplitude UHI and UHS, depending on the presence of dense residential areas or green parks, respectively, along the cross section. Several remarks can be made regarding this structure: (1) the effect of the sea is homogeneous and affects the city center and the outskirts in the same way, maintaining a rather quasi-constant surface temperature along the transect; (2) the lack of temperature contrast between the built-up area of the city and the vegetated areas towards the southwest may be caused by the average ambient temperature (around 43 °C) which is clearly higher than the inhibition temperature for photosynthesis for most native trees, thus suppressing any evapotranspiration that would have potentially contributed to cooling the surface; and (3) the cooling observed in the city that generates the low UHS of 3 °C, compared to the peripheries, may be attributed to irrigated plants in the urban center and the high albedo of the city. As its name suggests, Casablanca, or ‘white house’, is a white city that reflects a large part of the solar energy that it receives from the sun instead of absorbing it like the agricultural areas on the outskirts which, in summer, become fallow with ochre colors. The thermal structure seen here is an interplay between the proximity of the sea, the albedo, and the transpiration or lack thereof from plants which modulate the temperature profile in Casablanca. It is also worth noting that even though both Tangier and Casablanca are coastal cities, the amplitudes of their UHI and UHS are different, mainly due to their geographic configuration and land use.
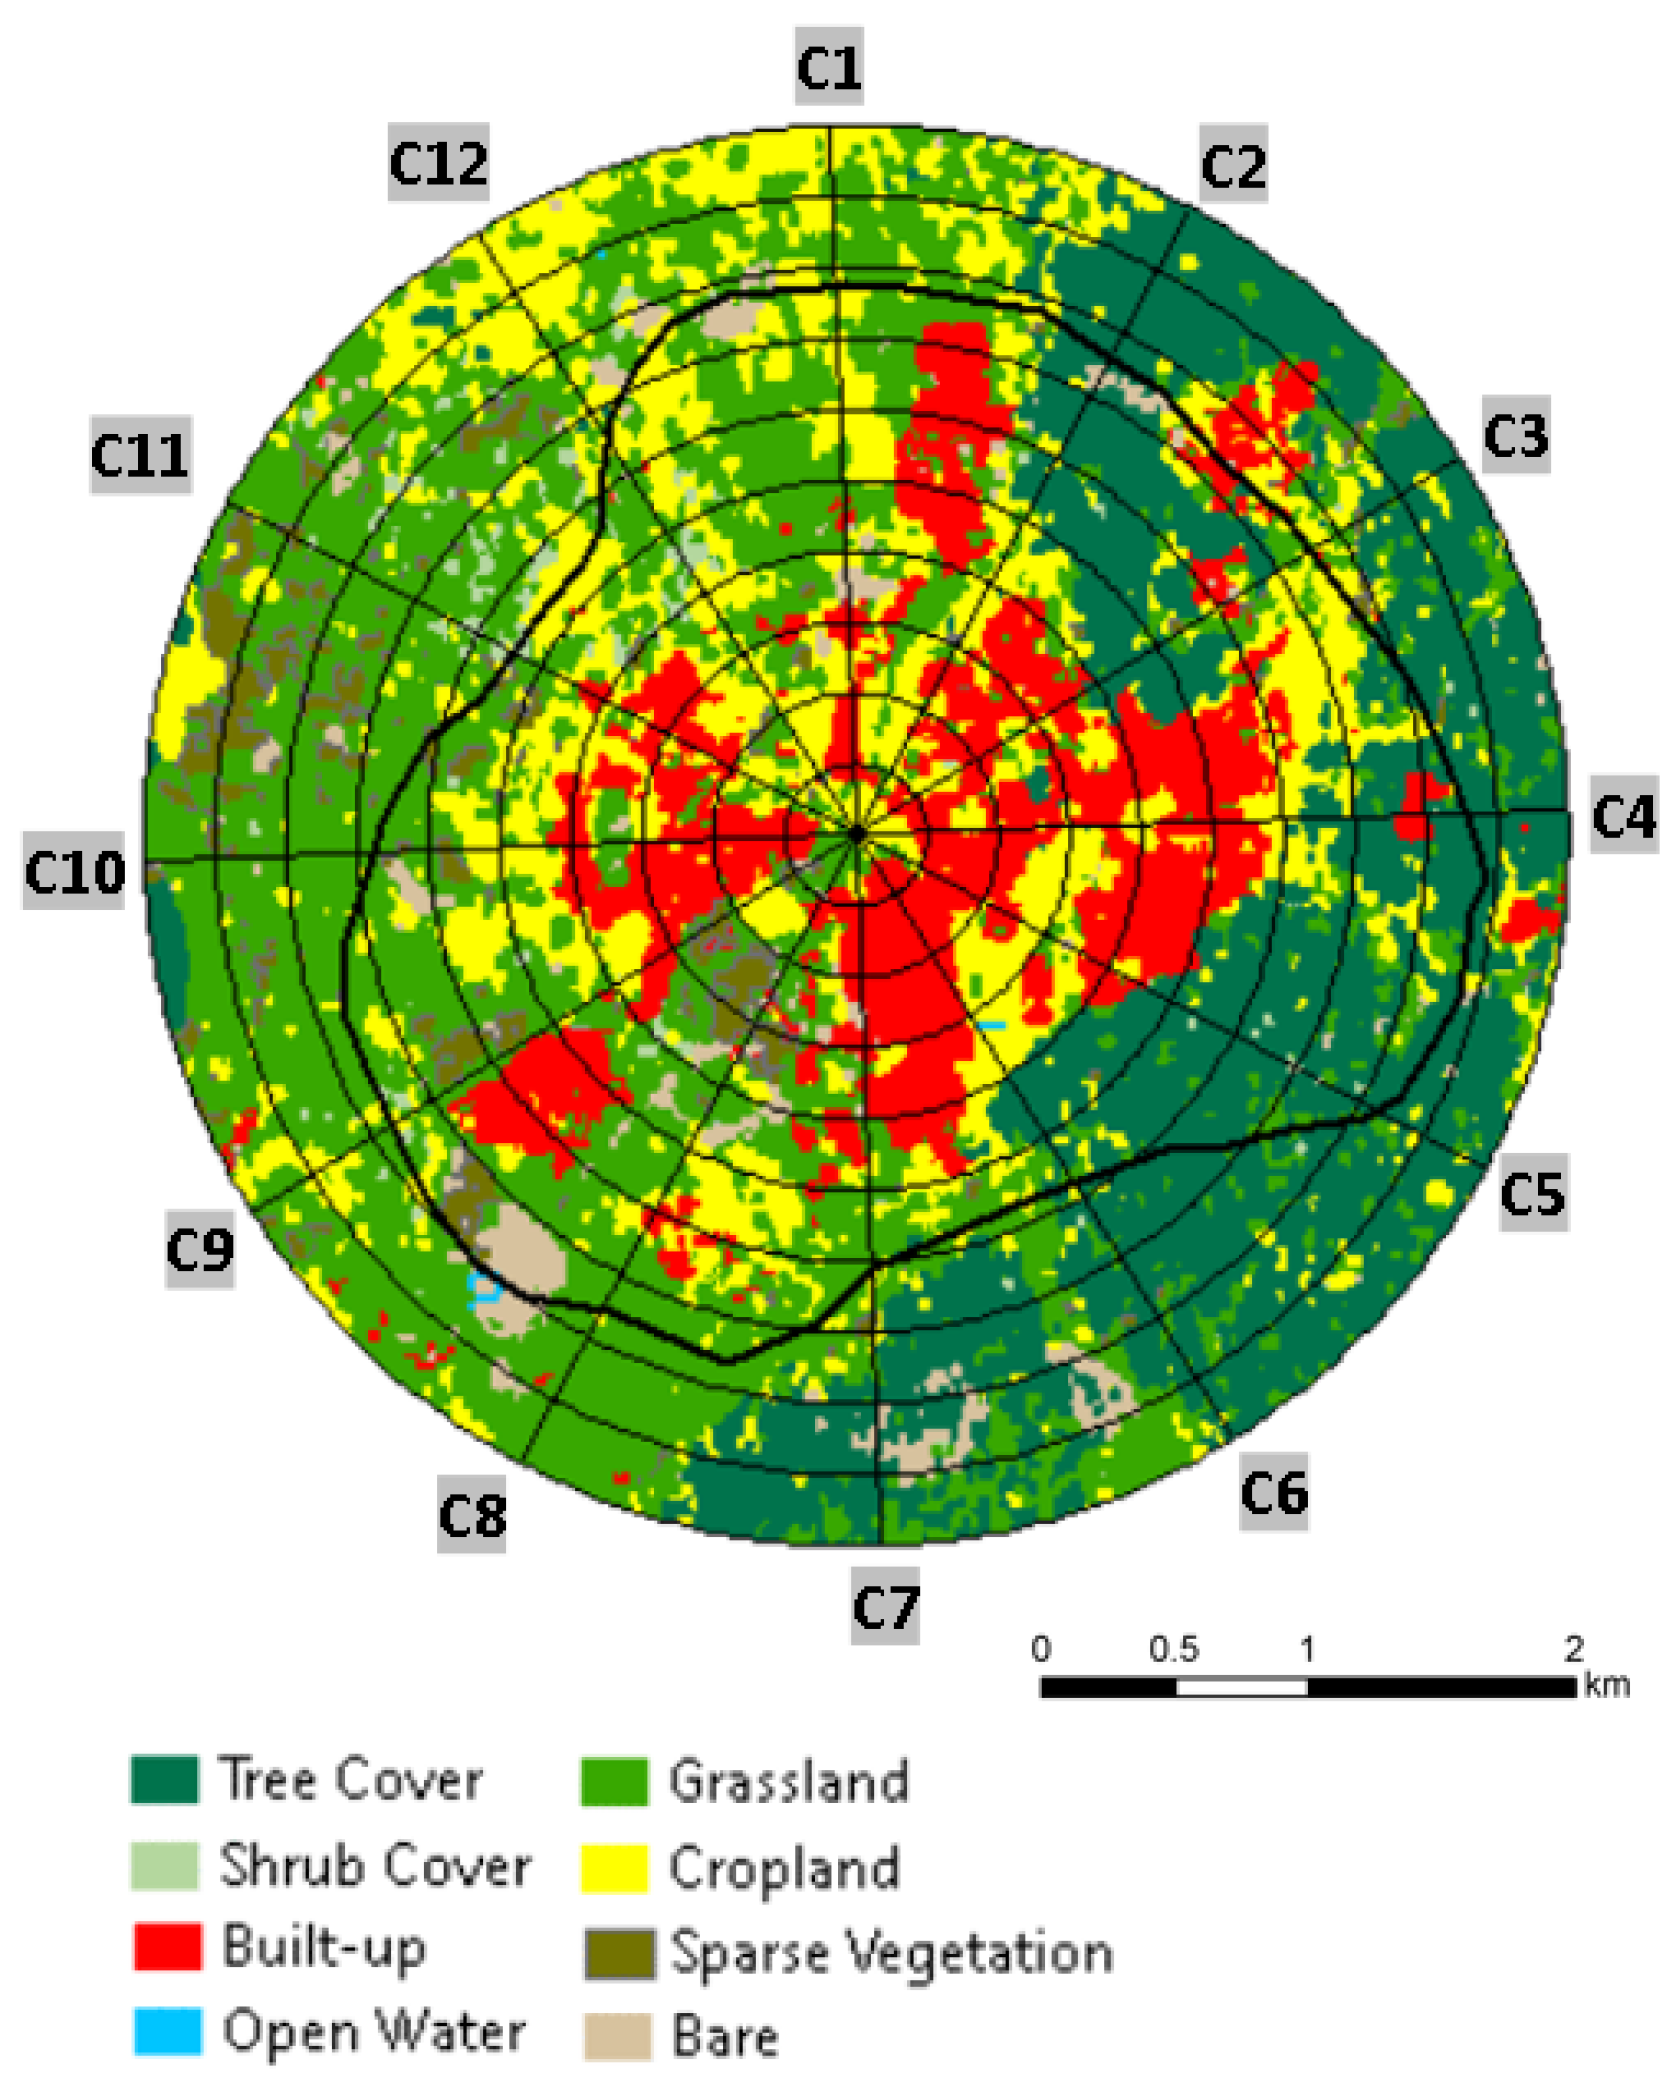
3.3. Temperature Structure in Ifrane
Ifrane is a small city in the Middle Atlas located at an average altitude of 1650 m. It is a city of alpine-style architecture surrounded by ski slopes and forests. All roofs are sloping and covered with terracotta tiles. Its climate has a continental influence with hot, sometimes dry, summers and cold and wet winters. Ifrane’s study of the urban macroform provides insight into the presence of a large, forested area, “Parc de la prairie”, to the east and a city that stretches to the west. This led us to carefully select axes C1–C6 to represent the average temperature in the eastern outskirts, and axes C7–C12 for the western outskirts, in order to investigate the thermal signature across the city and its peripheries (
Figure 9).
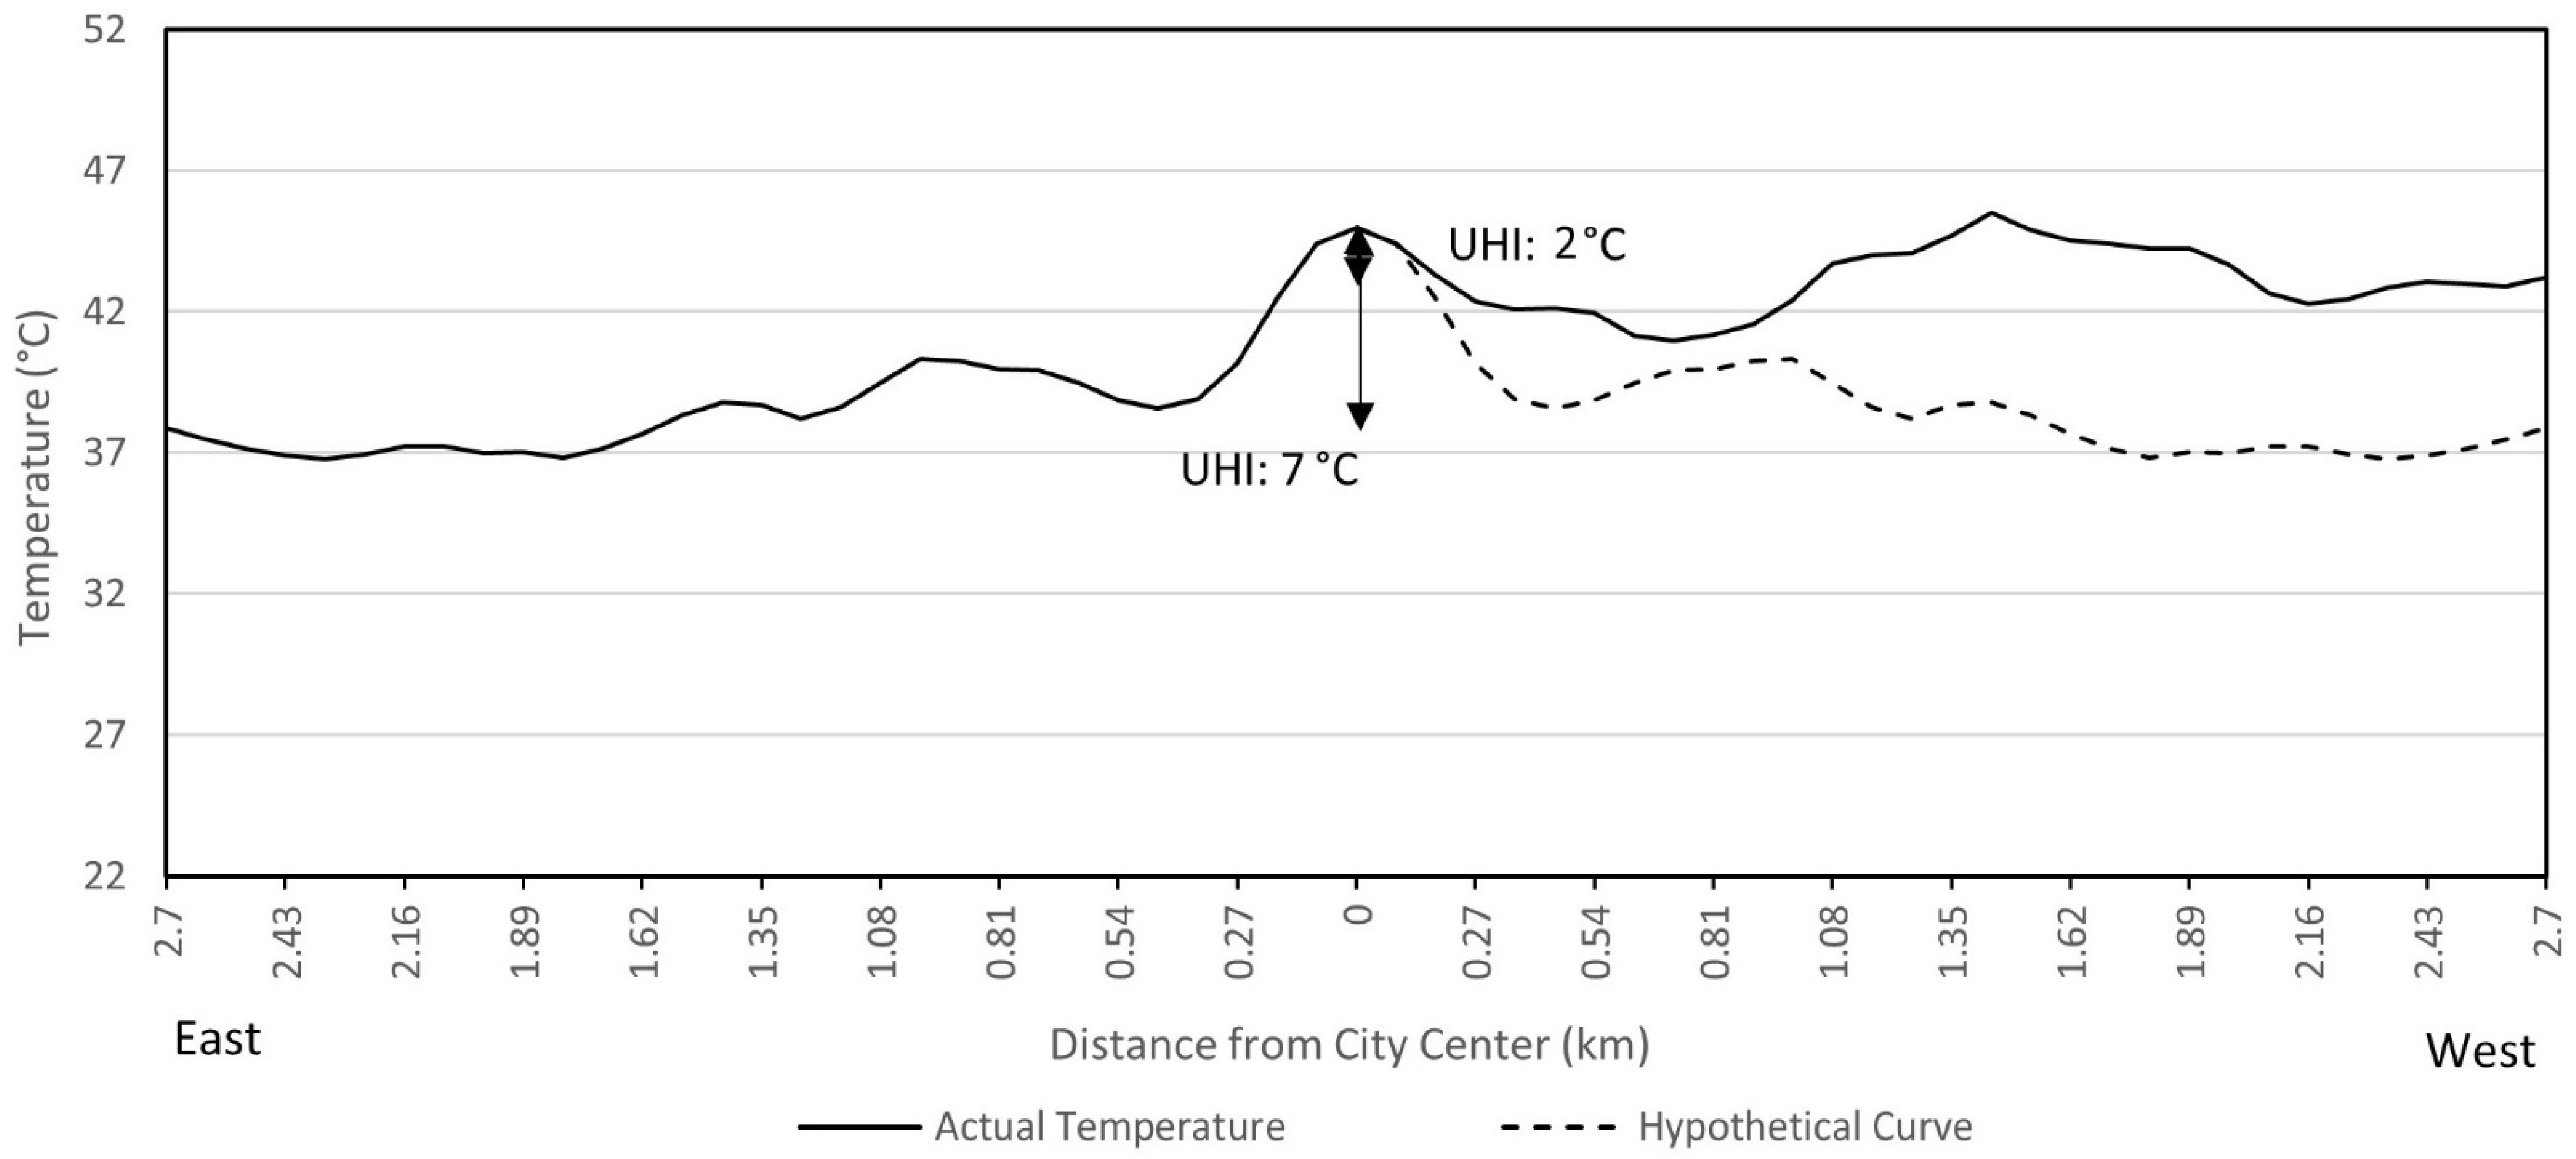
In Ifrane, the city center itself is vegetated and the built-up area is not dense. On the eastern outskirts, we observed a UHI of 7 °C amplitude with a temperature gradient ranging from 45 °C in the city center to 38 °C in the forest (
Figure 10).
The Ifrane case highlights that the UHI is a relative phenomenon that provides information on the temperature difference between two regions, the city center, and its immediate surroundings, both of which exist in the same prevailing ambient climate. The city’s total impact, from its building materials, especially the roofing tiles and the activity that occurs within, resulted in a 7 °C temperature increase relative to its surroundings. However, the western outskirts, mainly occupied by bare soils with sparse vegetation and agricultural fields, appear only slightly cooler than the city center. The discontinuous structure of the build-up in the western periphery is characterized by a secondary UHI generated by a small tourist town southwest of the city-center.
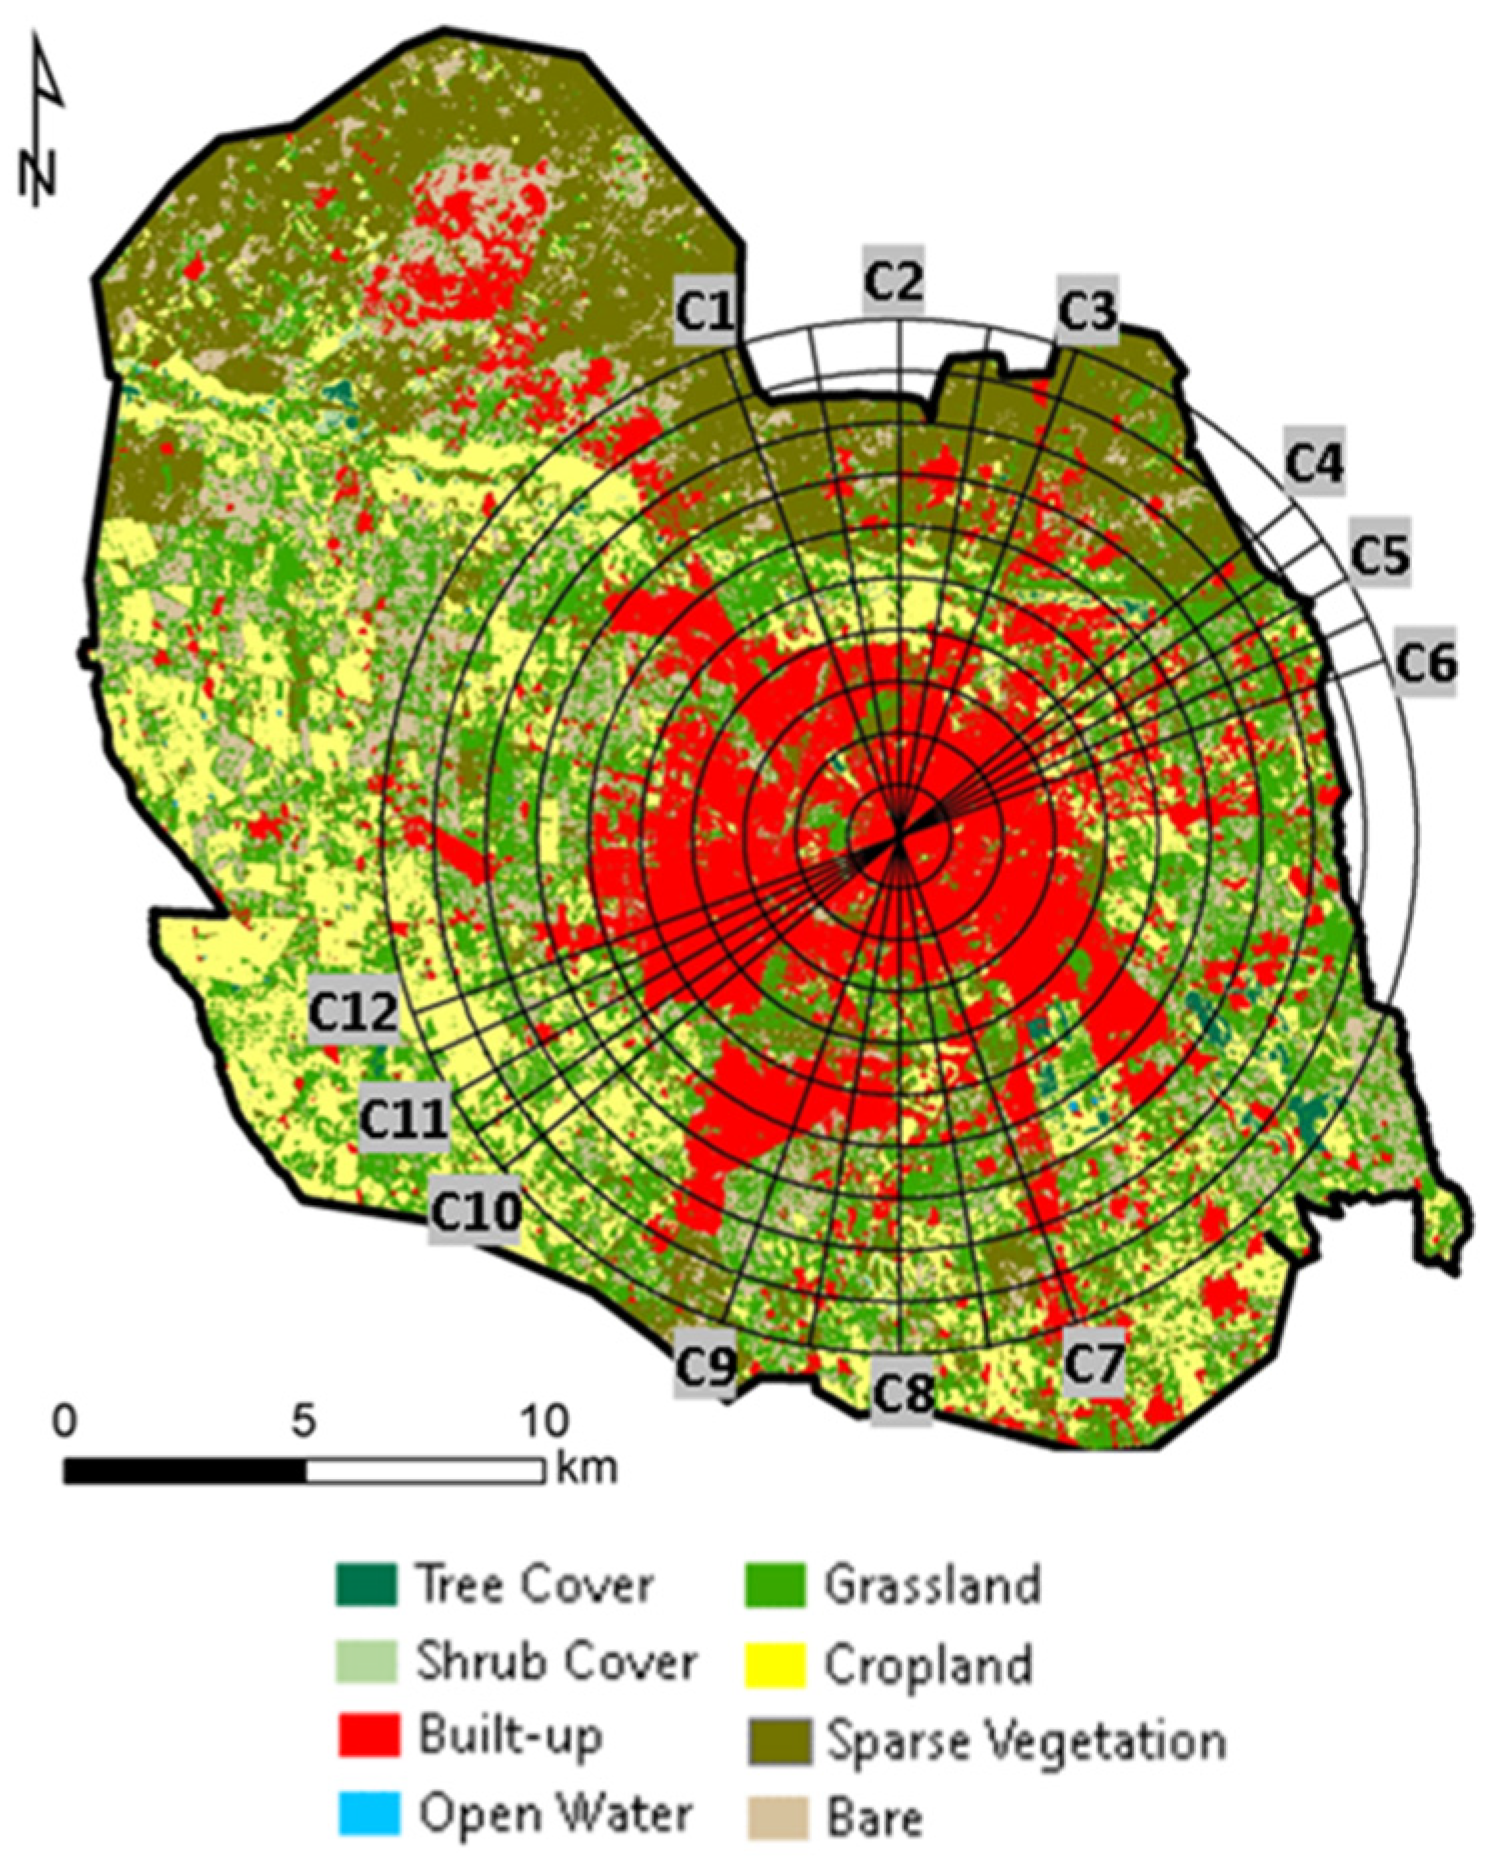
3.4. Temperature Structure in Marrakech
Marrakech is a city with an arid climate located at the northern foot of the Saharan Atlas Mountains. Winters are short, sub-humid and mild while summers are long, dry, and hot. Due to its quasi-concentric shape around a dense urban center (medina), and in the absence of a particular landscape obstacle that could impact the temperature profile, two cross-sections were made, one in the north-south direction including axes C1–C3 and C7–C9, and the other in the northeast-southwest direction including axes C4–C6 and C10–C12, to represent the temperature profile across the city (
Figure 11). Unlike other cities that were located along a seacoast or in the mountains, the thermal structure of the city of Marrakech is practically a reflection of its land use. The city is surrounded by sparse vegetation which, during the summer, is severely drought and temperature stressed and therefore does not photosynthesize. Within the city’s perimeter the buildings are ochre in color. Painted in an enchanting clear ‘reddish color’, Marrakech is passionately called the ‘Red City’ by pilgrims and locals. While this color is agreeable, especially at night, it absorbs as much solar energy as its surrounding vegetation, which explains a relatively weak temperature gradient between the built-up portion of the city and its surroundings (
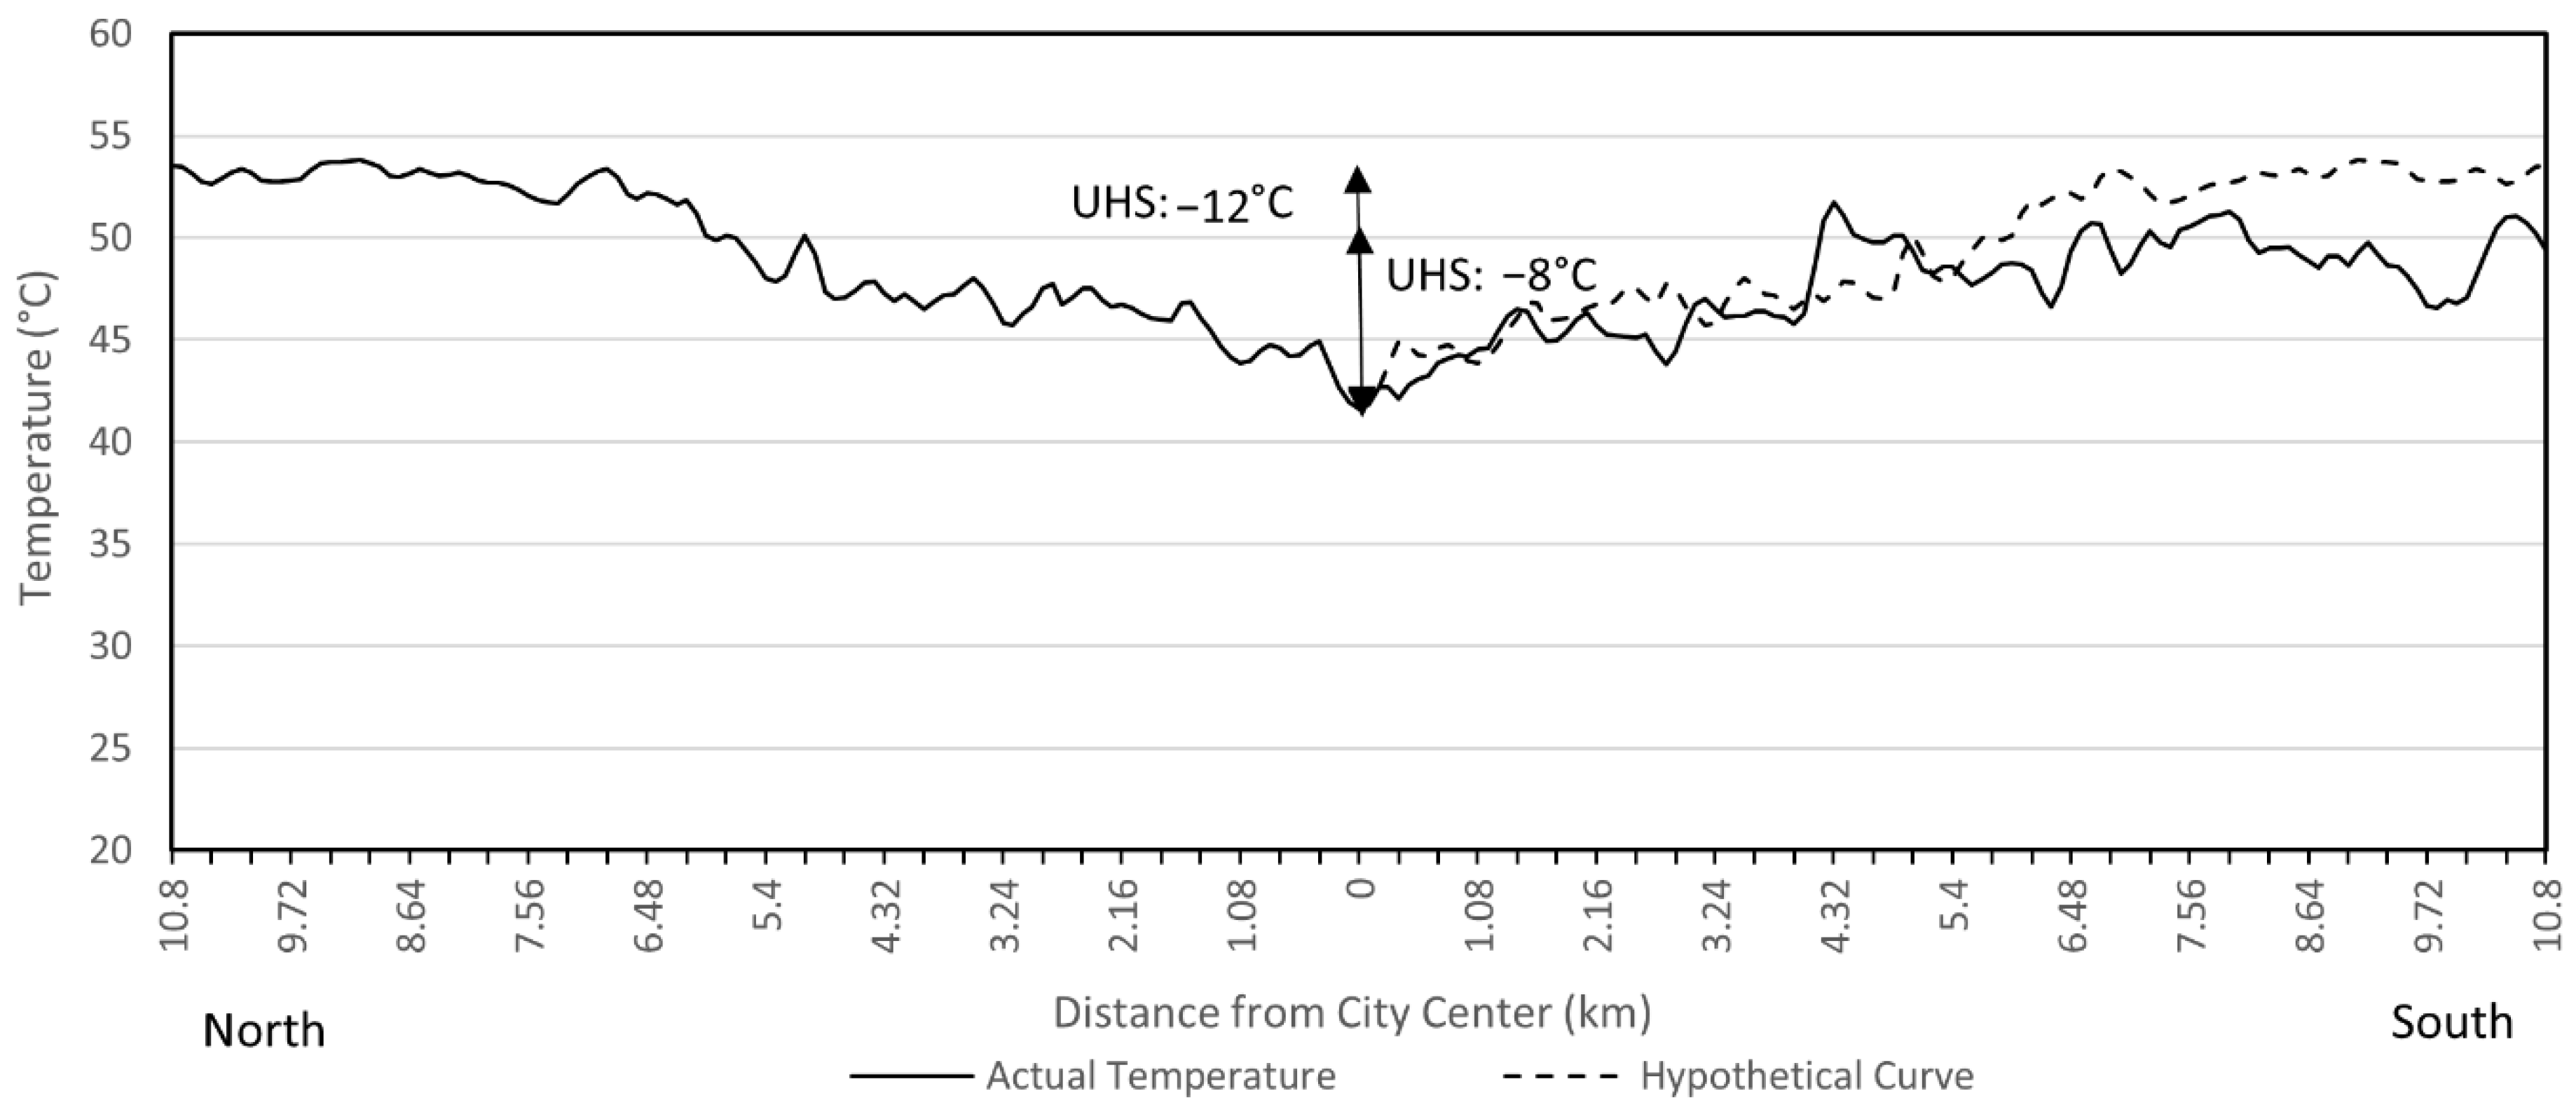
Figure 12).
The gradient is in large part due to the state of the vegetation within and outside the city limits. The 12 °C temperature contrast between the northern outskirts and the city center is due to the evapotranspiration cooling from the abundance of autochthonous trees and other exotic plants in the city, maintained by resource augmentation and regular irrigation, which contrast with the stressed vegetation in the north where surface temperature exceeds the 50 °C mark. In the southern periphery, where the build-up structure is not contiguous with the city core and the vegetation is mainly composed of short vegetation, the temperature gradient between the city center and the southern periphery is similar to that in the north, at least within the first 5 kms around the city center. Beyond that the temperature cools off over agricultural lands, as shown in the hypothetical profile constructed by symmetry. A future increase in buildup density in this direction is a real possibility, with a predictable consequent increase in surface temperature.
A similar structure is observed in the temperature profile in the northeast to southwest cross-section (not shown) with a UHS of 11 °C in the northeast periphery and 4 °C in the southwestern periphery. The analysis of the city of Marrakech suggests that cities built in semi-arid to arid environments do not exhibit a UHI, but rather a UHS, indicating that the surface temperature is cooler inside the city than in its peripheral areas. These results agree with a previous study by Fathi et al. [
22] who suggested that, in arid and semi-arid regions, the surrounding vegetation does not play a preponderant role in the cooling of the surface temperature and the modulation of the thermal structure.
3.5. Temperature Structure in Smara
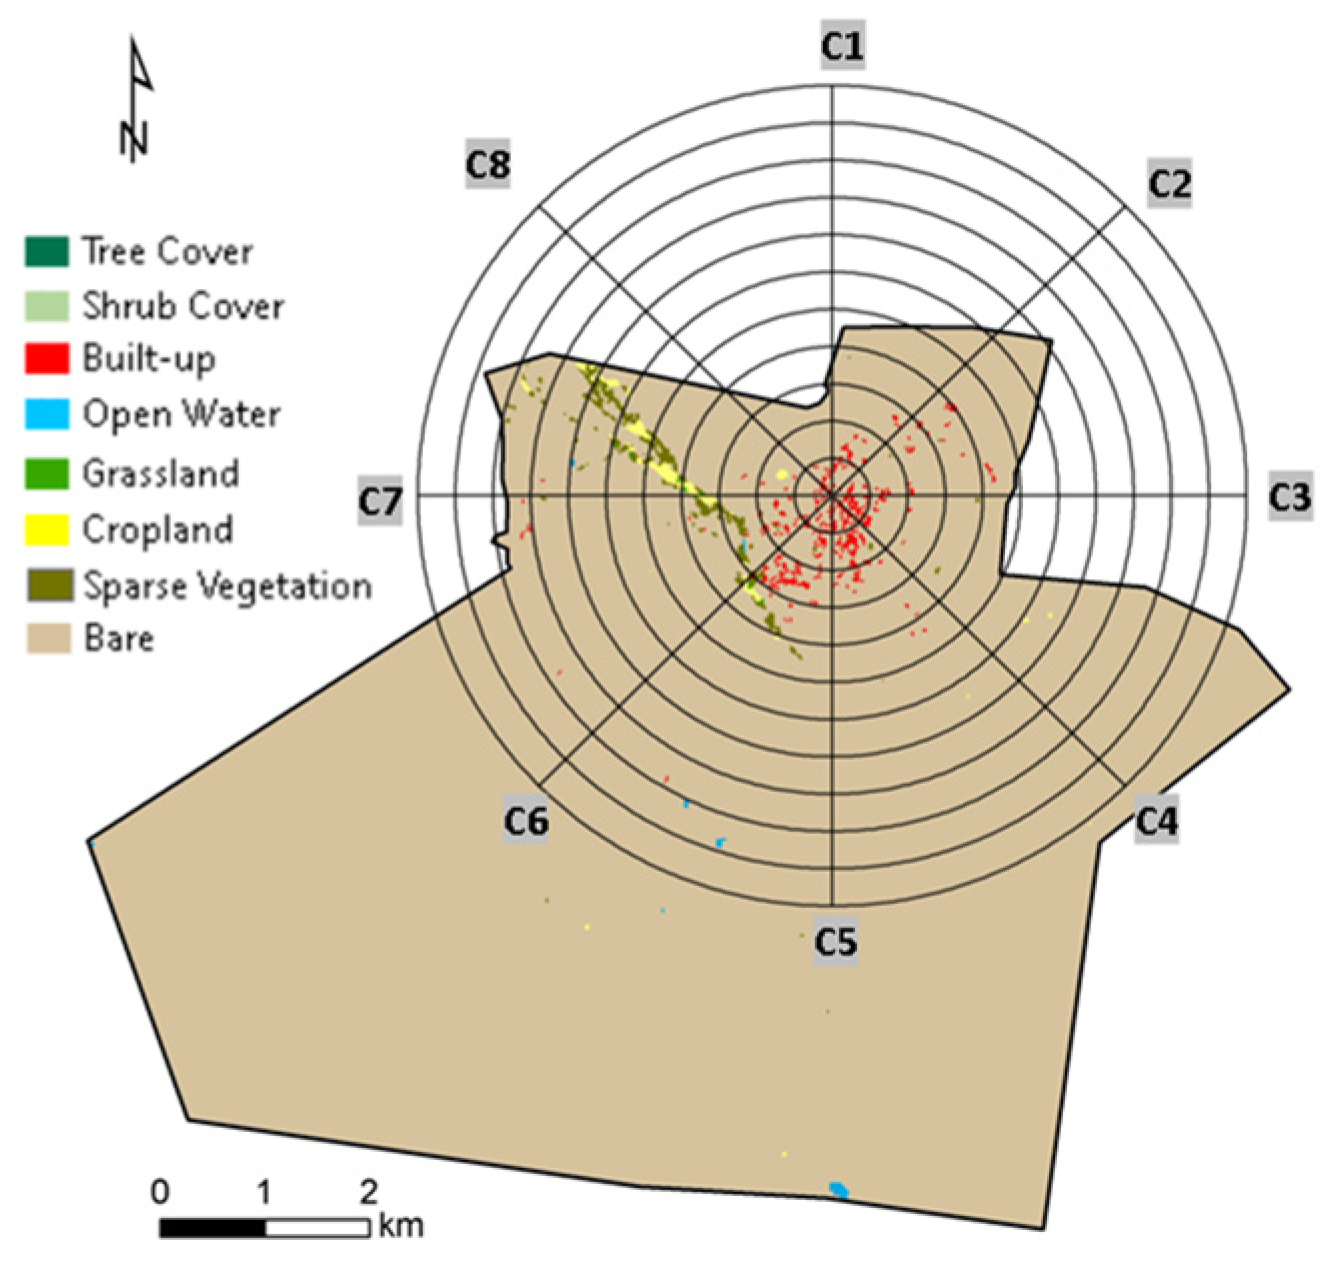
Smara is a city located in the Moroccan desert and, just like Marrakech, is built in a circumscribed space. The city is surrounded by bare soils that are often sandy or rocky. Using the same cross-sections methodology, we constructed temperature profiles along a northeast-southwest transect through the city. The temperatures recorded along axes C1–C4 (
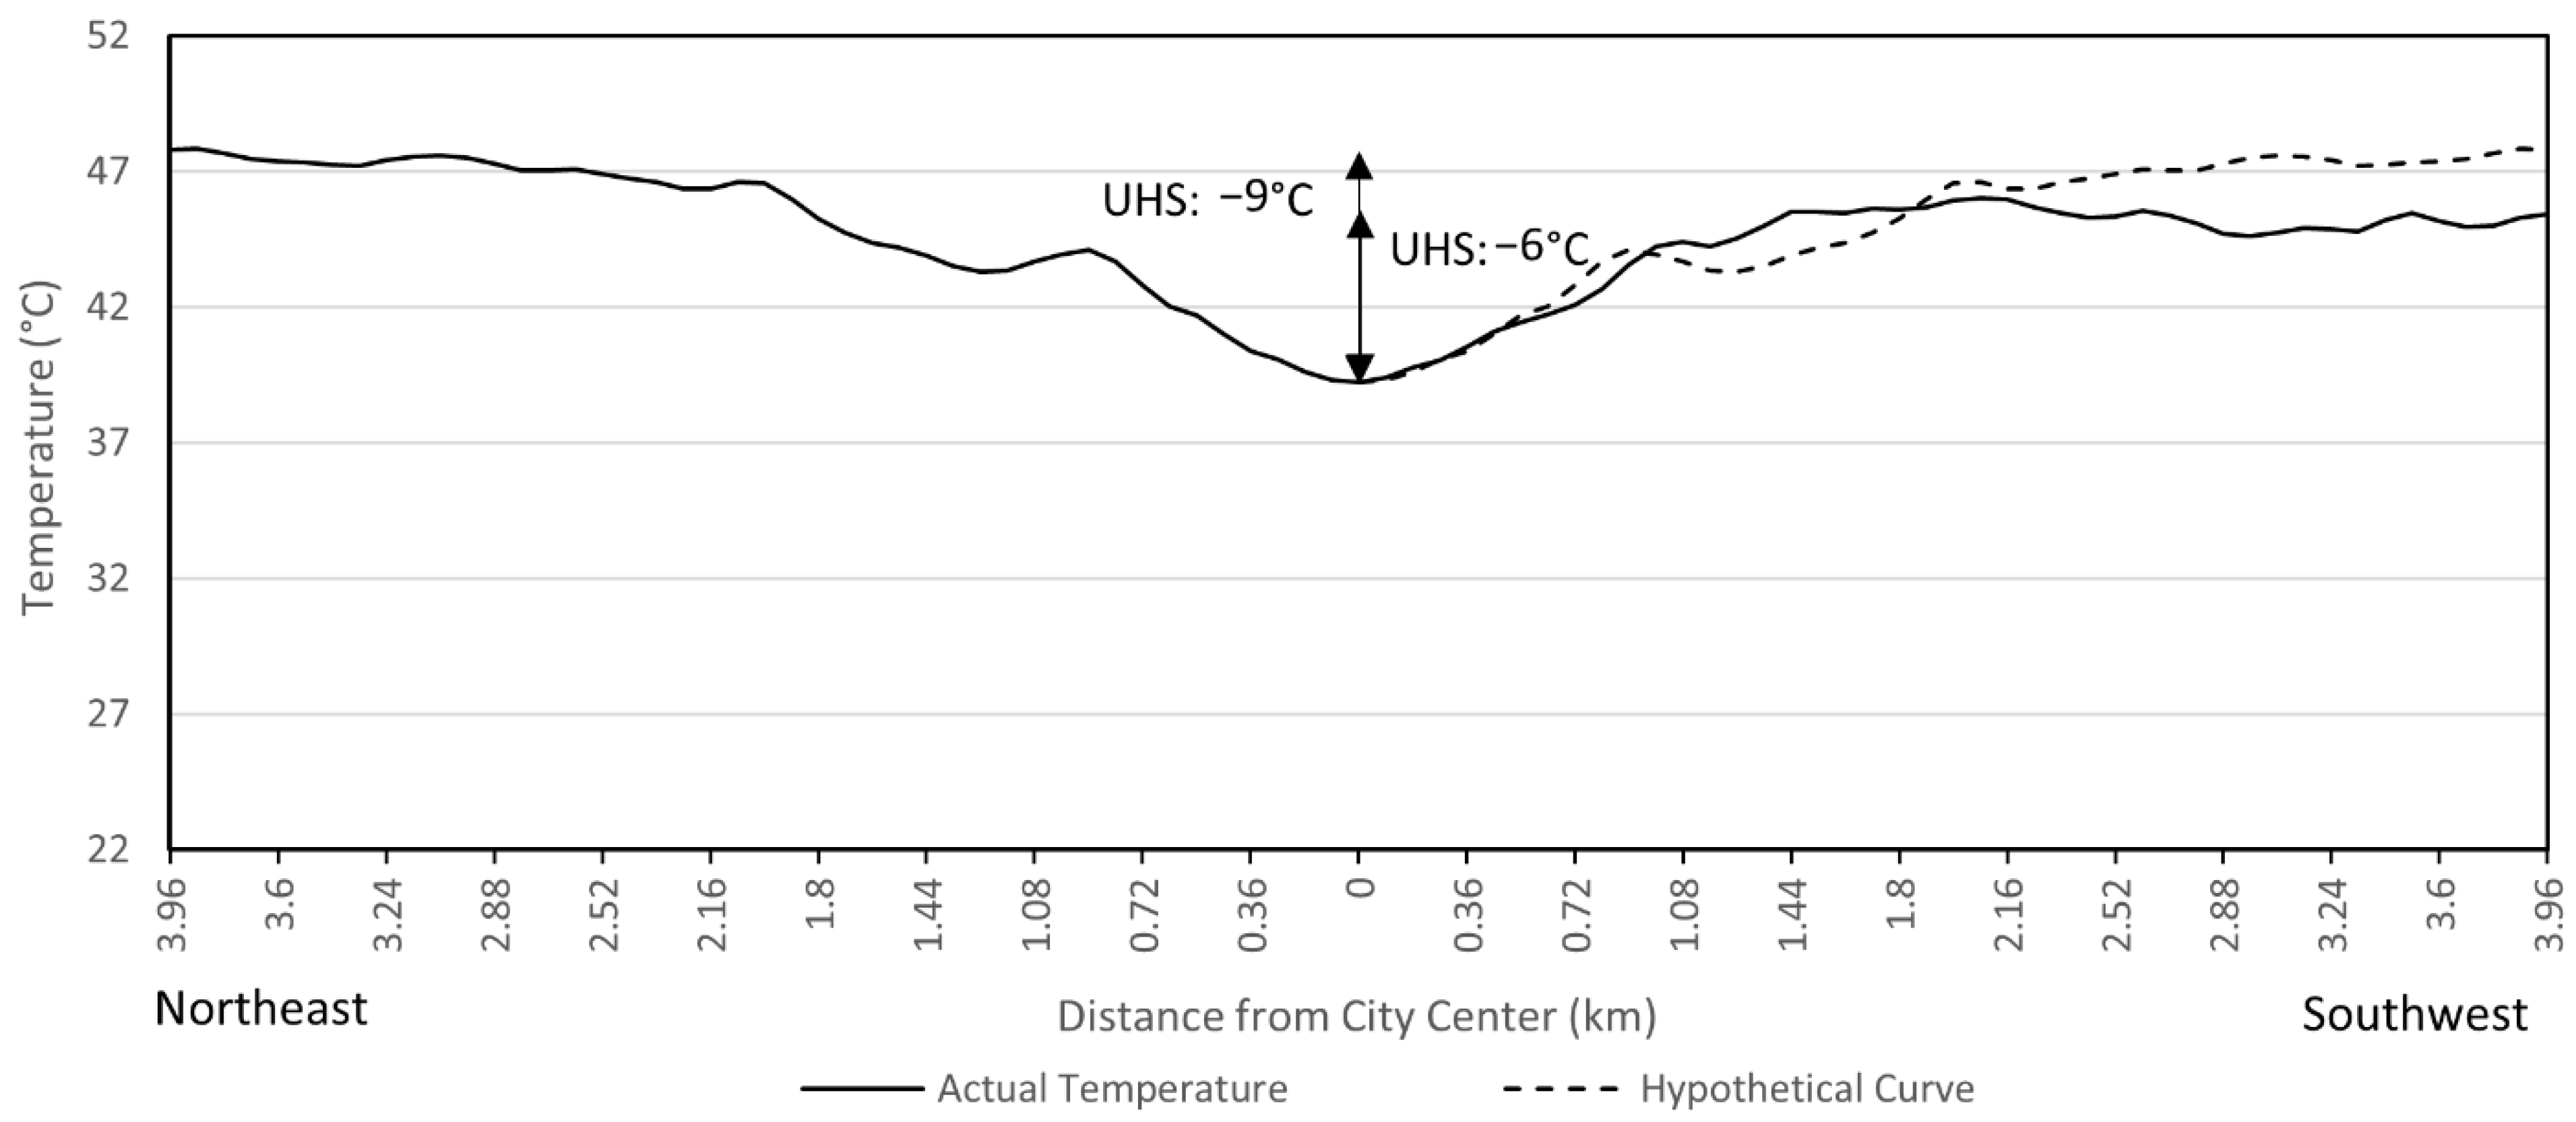
Figure 13) were used to construct the average profile between the northeastern periphery and the city-center, while the profile from the city-center to the southwestern periphery was constructed based on temperatures recorded along axes C5–C8. As with the other cities, we also represented the hypothetical symmetrical profile (dashed line) that would exist if the two peripheries were homogeneous.
The results show a net UHS of 9 °C between the city-center and the northeastern periphery, thus confirming that the city is relatively cooler than its northeastern outskirts (
Figure 14). This is largely due to the fact that the built-up area in Smara has a higher albedo than the surrounding areas and therefore reflects more energy. The surrounding arid lands are rather dark in color, and in the absence of vegetation, all the energy absorbed by the soil is used to increase temperature and released in the form of sensible heat. It is interesting to note that the temperature trend between the city-center and the southwestern periphery mimics, almost identically, the trend of the hypothetical curve in the vicinity of the center. This is due to the homogeneity of the landscapes and the absence of a disturbing element, such as the sea or the mountains, which could cause a change in temperature. If the UHSs were calculated at the strict limit of the city around 1800 m away from the center, its amplitude would have been 6 °C on both peripheries. However, considering the 3960 m buffer, the northeast and southwest peripheries UHS amplitudes are 9 °C and 6 °C, respectively. Smara is a small city with light-colored building material that appears as an oasis in a dark desert.
3.6. Synthesis
Based on the results of our analysis of the five cities in Morocco, we conclude that the thermal structure in and around cities is not uniform and depends largely on the shape of the city and the natural features nearby (topography, coastline, desert, forest). The analysis shows that the thermal structure is not symmetrical and varies as a function of direction. In all cities built in a vegetated environment, we noted both UHIs and UHSs, except for Casablanca, where the build-up occupies the entire north-eastern portion of the city, and Ifrane, with a structure neither dense nor contiguous and built in the form of small agglomerations concealed in forests. These UHIs and UHSs have different amplitudes and are strongly influenced by land use type. On the other hand, in cities built in semi-arid to arid climates, we have observed a predominance of UHSs with amplitudes around 10 °C. In the case of Smara, which is surrounded by a homogeneous dark rocky desert, the UHS is almost symmetrical with respect to the city center.
As expected, large amplitude UHIs form between the sea and the center of the coastal cities of Tangier and Casablanca. This, of course, has an impact on the energy demand during the hours of maximum insolation and on the energy consumption necessary for air conditioning of buildings. In both Tangier and Casablanca, the amplitude of the UHSs is smaller than that of UHIs. As for the cross-sections made parallel to the coastlines, Tangier’s UHI of 6 °C is double that of Casablanca, which is under strong oceanic influence and the alternation of neighborhoods and parks along the transect. Because of its location between a dense forest and fallow land in summer, the city of Ifrane has a UHI of 7 °C amplitude. Marrakech and Smara have UHSs of up to 12 °C and 9 °C, respectively, without UHI formation.
It is important to note that the amplitude of the UHI and UHS should be considered in the context of the average ambient temperature of the city and its surroundings. For example, in the case of Casablanca, moving from the coast to the city center results in a surface temperature increase of 19 °C (to 41 °C), a high but still bearable surface temperature. However, moving from the city center to southern inland outskirts, the surface temperature adds an additional 11 °C, reaching an unhealthy level of 52 °C.
3.7. Intra-City Analysis
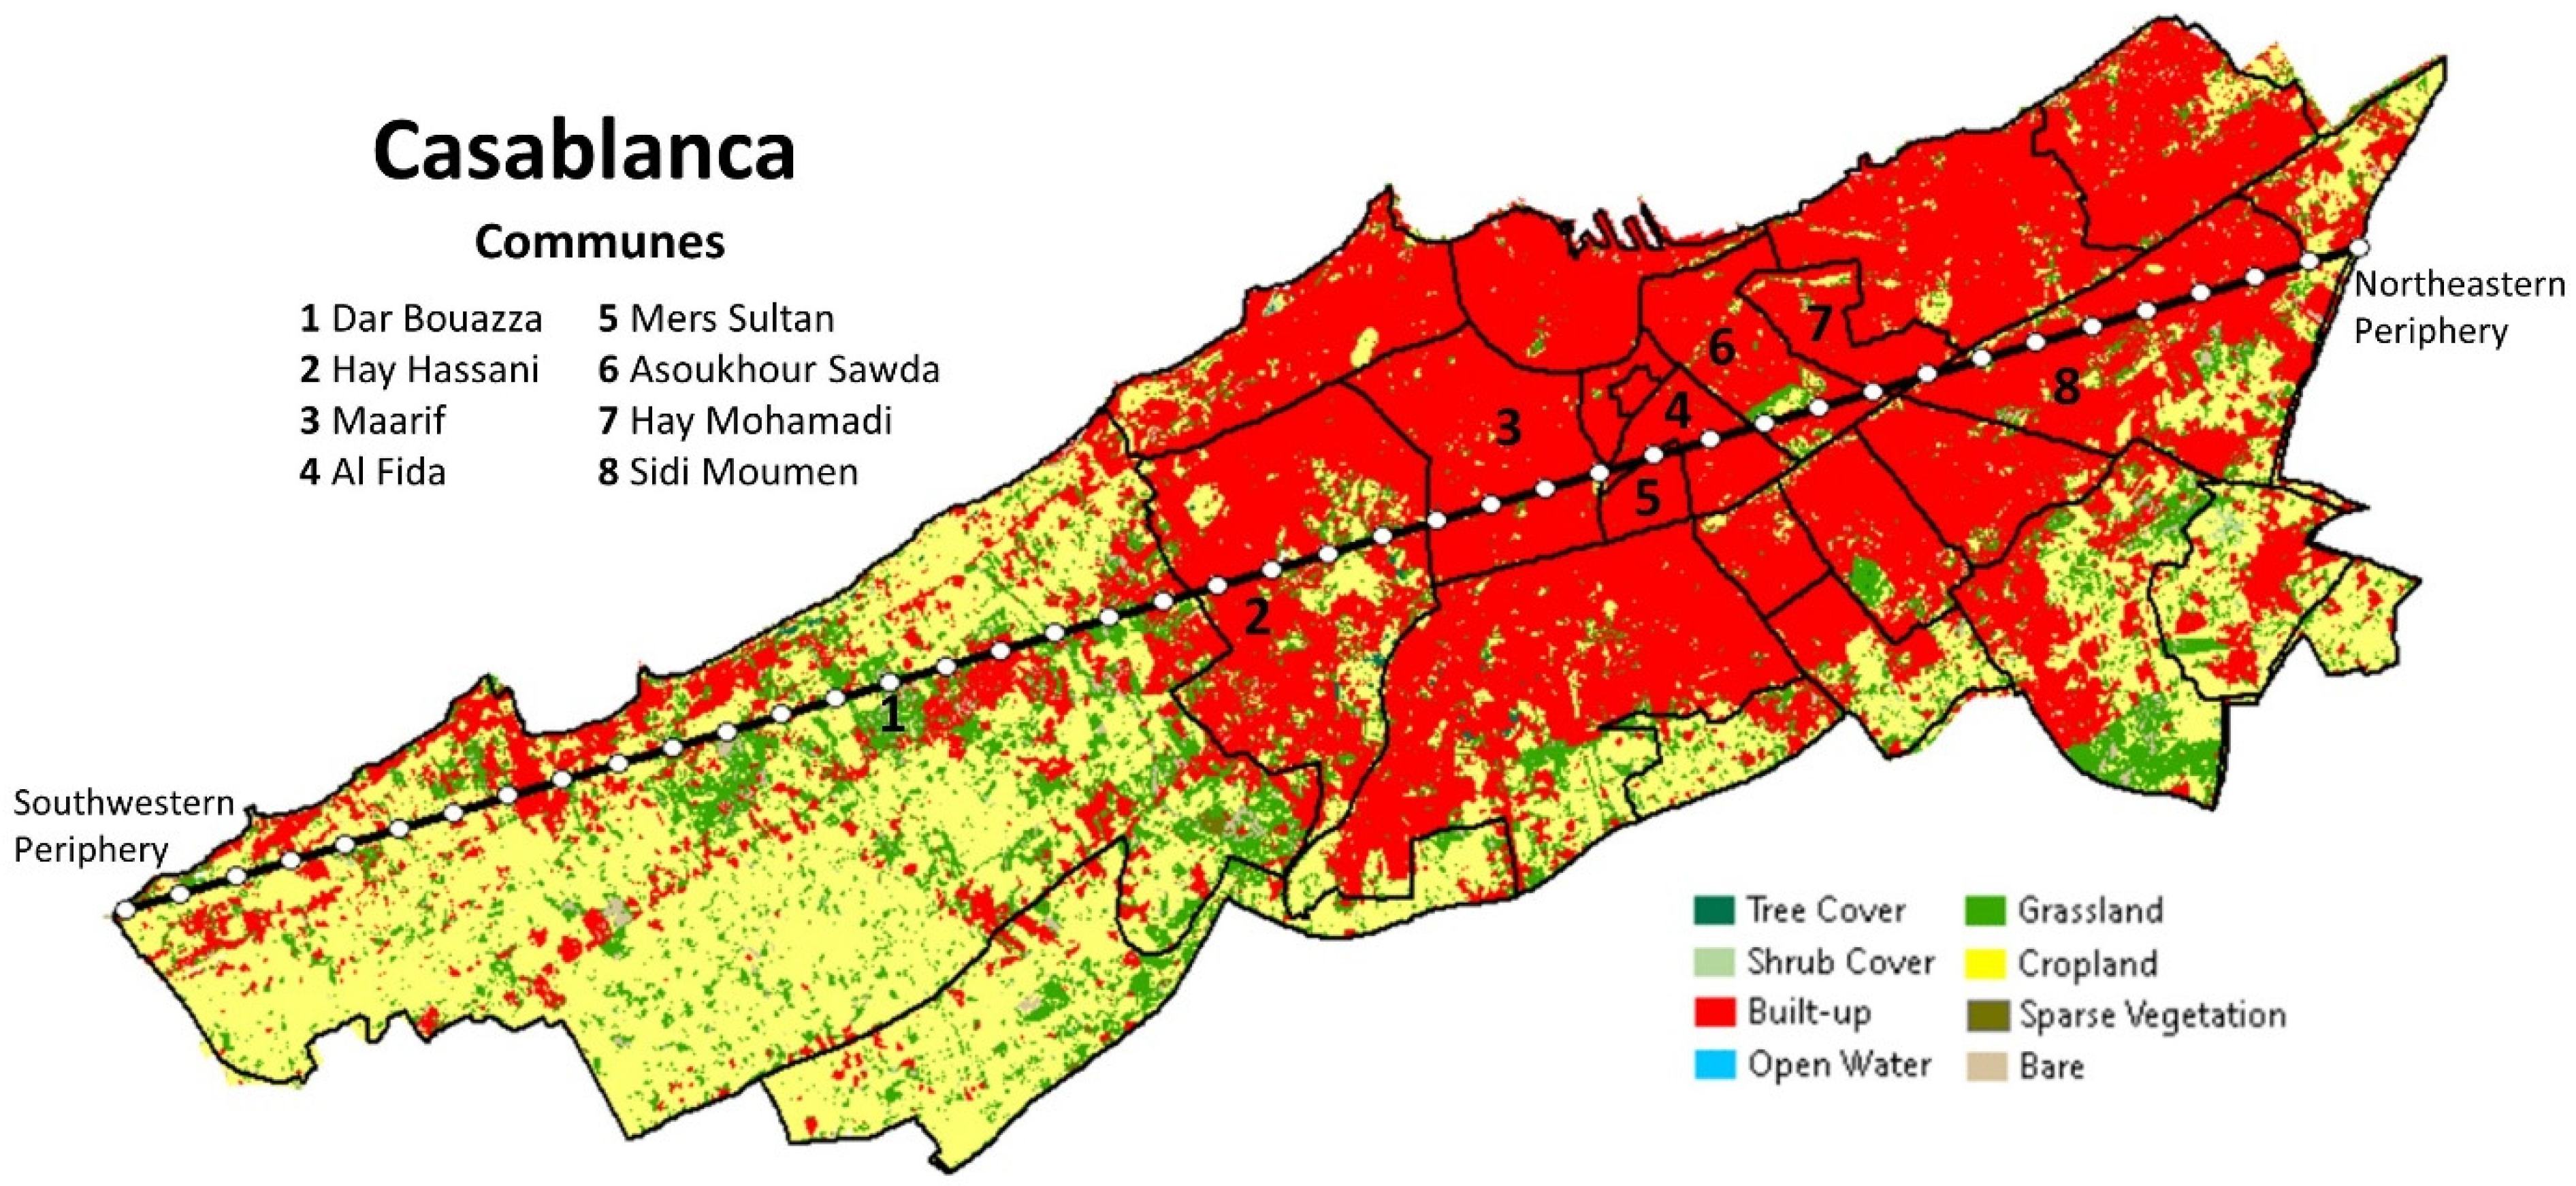
Faced with the complexity of the urban heat island phenomenon and the difference in its structure and amplitude between different cities, we opted to analyze it on a finer scale. Our objective was to evaluate the variations in temperature between the communes inside the urban area and to interpret the results based on urban density, planning and architectural models. This analysis was conducted for the city of Casablanca, selected for its size and variety of architectural materials, and building types found within its limits. As shown in
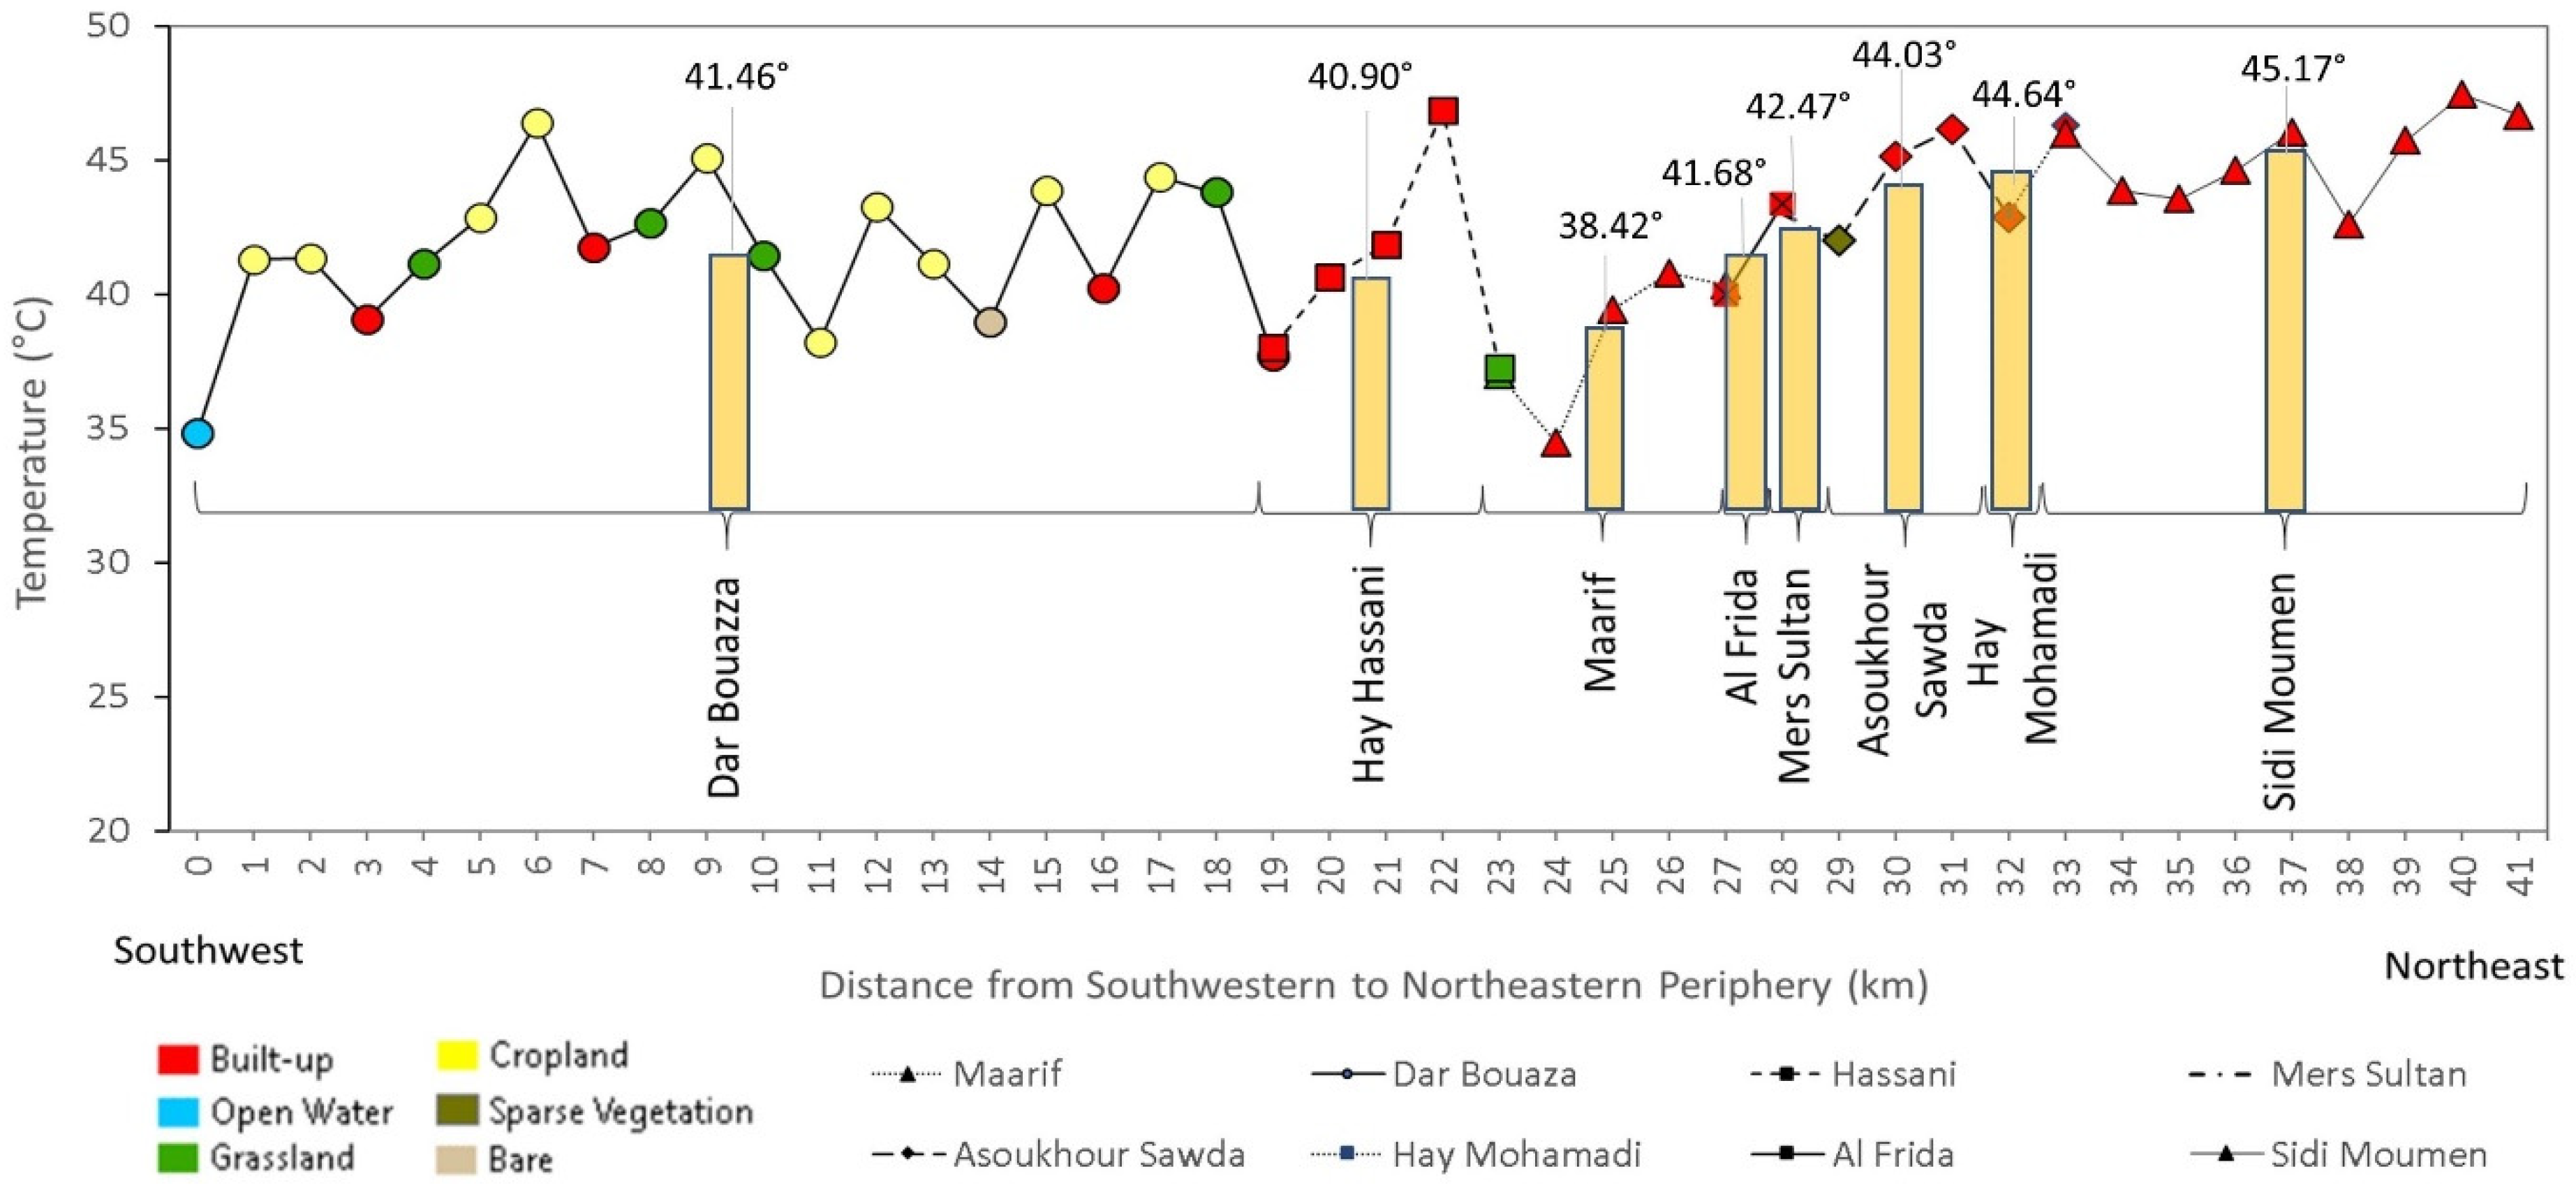
Figure 15, we created a cross section from the southwestern periphery, limited by the commune of Dar Bouazza, to the northeastern periphery, limited by the commune of Sidi Moumen. Temperature measurements were extracted over a 42 km linear transect at 1000 m intervals, producing a series of 42 measurement points over eight major communes, sampling the diversity of Casablanca’s architectural materials and urban structures, including industrial, residential, central, and peripheral districts, neighborhoods of villas, apartment complexes, towers, and slums. Prior to analyzing the temperature in each commune, we first examined the temperature extremes recorded over this 42 km transect. The maximum value of 47.5 °C was recorded on the eastern outskirts of Sidi Moumen (
Figure 16) where the measurement was taken on a plot of land that included zinc roofs of large industrial depots. A similarly high temperature of 46.3 °C was also recorded in Hay Mohamadi at the western side of Sid Moumen. It is important to note that east of the Asoukhour Sawda commune, the area is densely urbanized and includes an industrial zone with very little vegetation and several slums. The largest and best known of these slums is the “Carrières centrales” where the architecture is not ventilated and the construction materials, in particular zinc roofs, are most heat absorbent. There, the surface temperature is greater than 42 °C. West of the Asoukhour Sawda commune, except for the Al Fida commune where the temperature reaches 43.4 °C, the temperature drops below 41 °C to reach a minimum of 34.5 °C in the center of the city (Maarif). To the west, another temperature maximum of 46.8 °C is observed in Hay Hassani. Further west in the large commune of Dar Bouazza, which is affected by sea breeze, intermittent high and low temperatures characterize the alternance of residential neighborhoods and uncultivated shrublands. In general, the surface temperature in these communes of Casablanca increases with increasing urban density from the southwest to the northeast side along the transect, except in the commune of Maarif, where the temperature is the coolest. East of that, an increasing trend in surface temperature characterizes the transition from high density residential to an industrial area. The lowest temperature of 34.5 °C in the city center (Maarif) is due to evapotranspiration from a mixture of irrigated vegetation which helps cool the surface. This analysis shows that land use is a decisive determinant of the surface temperature structure in urban areas and should be a central element in modern architecture and urban planning.
3.8. Intra-Commune Analysis
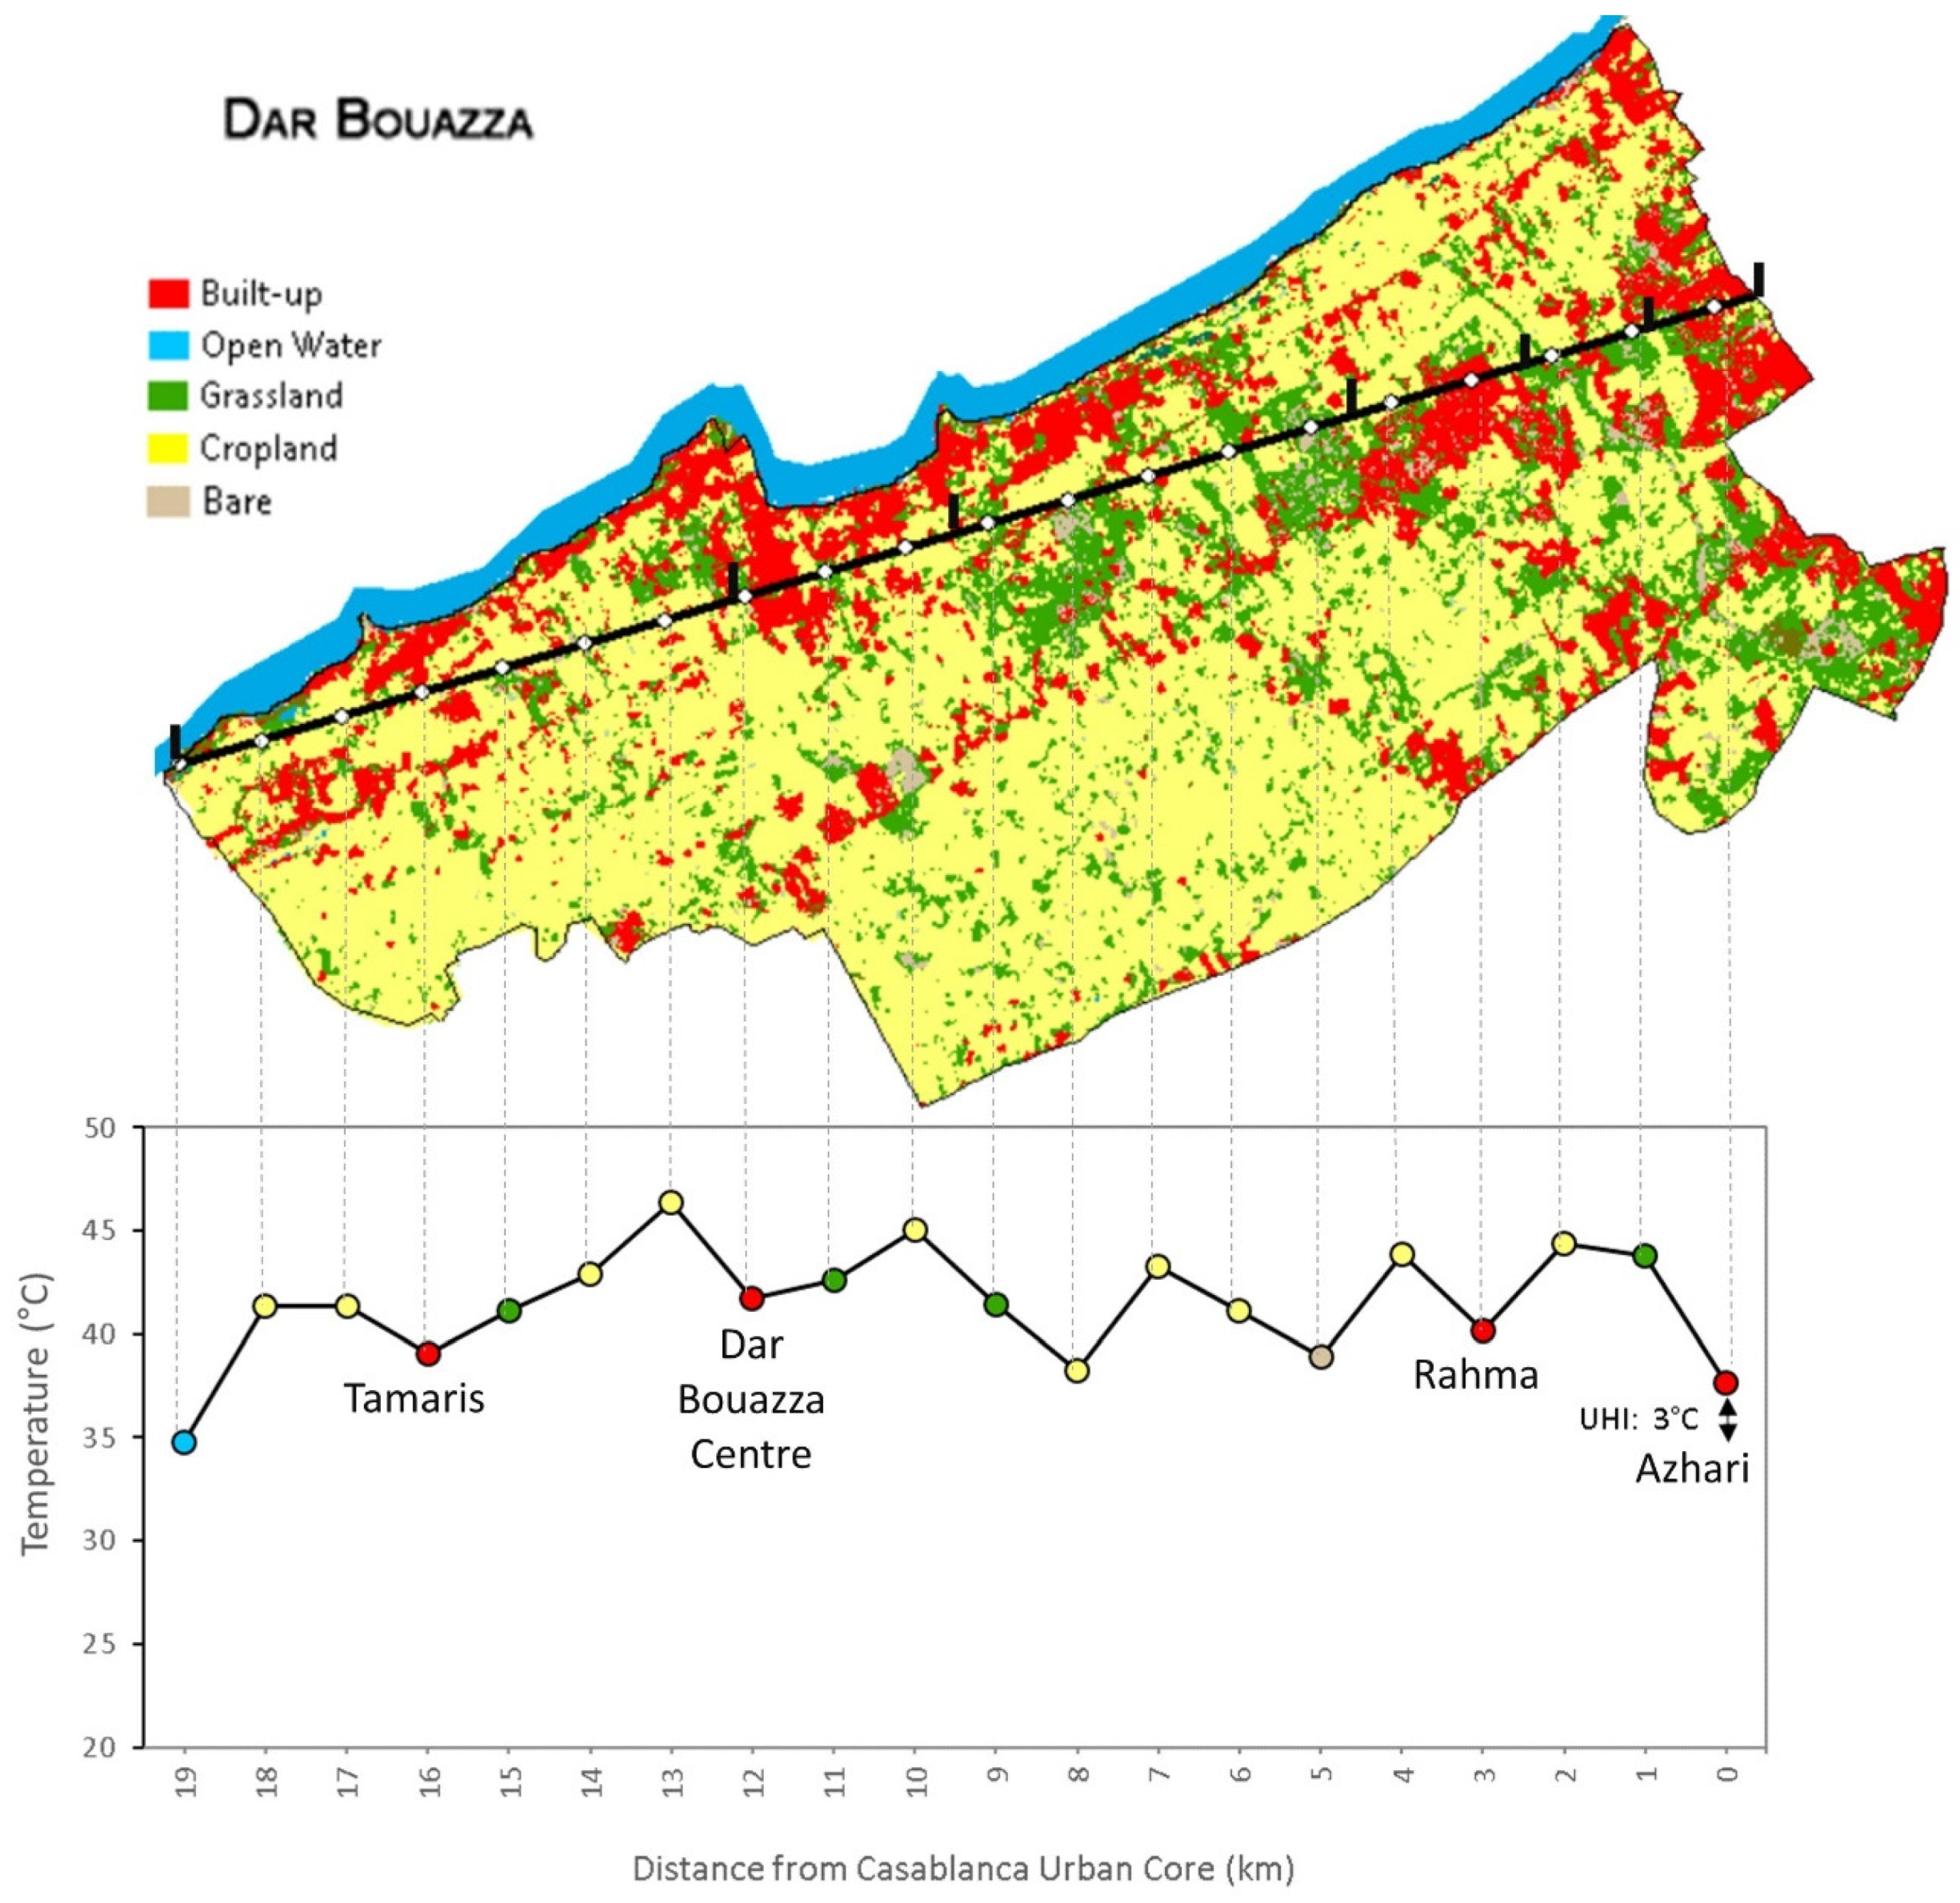
To narrow down the analysis, we further refined the scale of the study, this time focusing on the commune of Dar Bouazza and analyzing its thermal structure. It should be restated that this urban commune is on the coast, and it consists of mostly agricultural land, both planted and in its natural state, with large areas of recent urban developments (
Figure 17). The neighborhoods are scattered and so is the road network. To the north of the commune, along the coast, extends new disparate construction areas with no real road connection between them. In this portion of the commune, the road network is tighter and the green spaces, in the form of residences’ gardens, are numerous.
In most cases we noted that the urban parts of the commune are slightly cooler than the fallow and sparse shrublands. For example, in the urban neighborhood of Tamaris the temperature of 39.1 °C is surrounded by temperatures of 41.3 °C to the west and 41.1 °C to the east, respectively, on grassland and uncultivated croplands during summer. Similar situations are observed in the neighborhoods of Dar Bouazza Centre, Rahma, and Azhari, where urban areas are cooler than their vegetated surroundings. This counterintuitive result of high temperature over vegetated lands confirms the work of Bounoua et al. [
1] on the thermal behavior of non-irrigated vegetation, which under water and thermal stresses reduces its photosynthetic and therefore its evaporative capacity by closing its stomates, and acts as a hot composite material. Relative to their immediate surroundings, the low temperatures in urban areas form what is termed here as neighborhood-scale urban heat sinks (NSUHS), and have observed amplitudes of up to 2 °C.
This examination by neighborhood within the commune provides detailed information on the role that ground and roof materials play in determining the reflectance of solar energy. Asphalted areas, such as parking lots and roof tiles in residential areas, had temperatures of between 42 °C and 43 °C, whereas metal roofs registered the highest temperatures due to the degree of absorption of the alloys. Although it cannot be generalized to the entire urban area of Casablanca, the densely urbanized neighborhoods in some communes are cooler than their surroundings because of irrigated plants.
4. Concluding Remarks
Our study analyzed the urban temperature structure at three different spatial scales. The first level involved a comparison of temperature between cities that are different from an architectural point of view and located in significantly different local climate zones. The second involved analyzing the spatial distribution of temperature within a city, with a focus on the Casablanca metropolis. Finally, the third level involved further down-scaling and zooming in on an urban commune within the city of Casablanca.
We conclude that the Urban Heat Islands (UHI)/Urban Heat Sinks (UHS) are thermal phenomena with multiple causes. They are calculated to contrast the land use and land cover properties between the inner urban core of the city and its immediate surroundings. However, these phenomena are also modulated by the ambient climate, proximity to the coastline or large water body, the presence/absence of a dense forest or desert, and topography. We also argue that, due to a hot climate in summer and the lack of rain, the vegetated spaces are not systematically cooler spots than built-up areas and that the irrigated vegetation has a moderating role for temperature in the cities.
We find UHIs with large amplitudes in coastal cities like Tangier and Casablanca, where the city-center is warmer than coastal areas by as much as 22 °C and 19 °C, respectively. This temperature contrast is significantly reduced when considering a transect along the coastline that filtered out the oceanic effect and resulted in UHSs with amplitudes of 3 °C for Casablanca and 1 °C for Tangier.
It was therefore necessary to put into perspective the notion of the UHI, which idealizes the thermal profile as symmetrical about the city center. The reality of landscape obstacles causes the city to stretch nonuniformly in different directions and register varying temperature profiles, as highlighted in our study.
While it is not possible to entirely reengineer existing cities, these results are relevant for their future expansion and even more so for the design of new modern cities, where an arrangement of build-up surfaces, vegetation and water bodies could result in a desired urban temperature structure that would reduce the UHI and allow savings in energy consumption, in addition to the other environmental benefits that green spaces and water bodies would offer. Our results also show that unstressed vegetation has an important role in modulating the temperature in urban areas. These results, based on observations, confirm the theoretical work on urban temperature modeling e.g., [
1,
17,
20]. However, more work on surface temperature modeling as a function of land use and cover change is needed along with the development of scenarios of land use permutation. This will allow the determination of the fractional coverage of each cover type in order to produce the desired surface temperature in the urban area.


 ,
, 


