
Evaluation of Urban Design Qualities across Five Urban Typologies in Hanoi


1
Transport, Health and Urban Design Research Lab, Melbourne School of Design, The University of Melbourne, Melbourne, VIC 3010, Australia
2
Faculty of Engineering and Information Technology, The University of Melbourne, Melbourne, VIC 3010, Australia
3
Melbourne School of Population and Global Health, The University of Melbourne, Melbourne, VIC 3010, Australia
4
Centre for Human Factors and Sociotechnical Systems, The University of the Sunshine Coast, Sippy Downs, QLD 4556, Australia
5
Faculty of Architecture & Civil Engineering, Phuong Dong University, Hanoi 10000, Vietnam
*
Author to whom correspondence should be addressed.
Urban Sci. 2021, 5(4), 76; https://0-doi-org.brum.beds.ac.uk/10.3390/urbansci5040076
Submission received: 14 August 2021
/
Revised: 23 September 2021
/
Accepted: 26 September 2021
/
Published: 1 October 2021
Abstract
:Urban design has been shown to play a vital role in promoting the health and wellbeing of urban citizens. However, studies of microscale urban design are underrepresented in comparison with macroscale urban design, especially from low- and middle-income countries in Asia, where urban forms are traditionally compact, complex and with multiple layers and varied urban typologies. The study evaluated microscale urban design qualities of streets (n = 40) across five urban typologies in Hanoi—a typical city in a low- and middle-income country in Asia. The study found that urban typologies and their characteristics have particular impacts on urban design qualities. Old and high-density urban typologies tend to report higher urban design qualities than modern and low-density typologies. Urban design qualities are also significantly associated with the number of pedestrians on the streets. Compared to Western cities, the urban design qualities in Hanoi are substantially different, especially in terms of imageability and complexity, reflecting the differences in urban design and cultural context between cities from various regions. Overall, the study contributes to our understanding of urban design circumstances in Hanoi, providing policymakers, planners, urban designers and architects with important insights for sustainable urban design policies, strategies and interventions.
1. Introduction
More than half of the world’s rapidly growing population now live in cities; this is expected to rise to 68% by 2050 [1]. Cities will need to not only accommodate these growing populations but also respond to several challenges including delivering a built environment that is sustainable, safe and conducive to population health. Given the urgency to deliver cities that have prioritized population health, there is a growing body of literature discussing the urban built environment and factors related to the health and wellbeing of its citizens [2]. An important finding, however, is the variation in the factors reported to be important contributors in the built environment along with how the various factors have been measured, with the latter depending primarily on the spatial scale used in the study [2].
In the macroscale, the most well-known built environment variables are the 3Ds (density, diversity and design) first used by Cervero and Kockelman [3], which were expanded to 5Ds by including destination accessibility and distance to transit [4]. Methods in macroscale studies are often objective ones that involve collecting and analyzing data from accessible sources such as GIS. Due to the objectiveness and the availability of data sources, the macroscale studies together with the well-known D variables are dominant in the literature of the study of urban environments. Despite their usefulness and popularity, the D variables are argued to be insufficient to represent the success of the urban environment in terms of physical activity friendliness [5]. One of the reasons for this is the challenge in operationalizing the D variables. While the measurement of density and diversity is often straightforward, quantifying the remaining D variable, design, is a challenge [6]. The gross characteristics of street networks such as intersection density and block size, which are mostly used to calculate the design variable, may not affect the experience of people using the street as much as the microfeatures of the streets [6]. The macro variables should be supplemented by subtle qualities of the street environment for a better understanding of the impact of urban design.
Conversely, microscale studies of the urban environment often investigate the physical features and urban design qualities at the street level. Classic urban design literature has presented many theories and concepts related to street-level urban design such as “imageability” by Lynch [7], “eyes on the street” by Jacobs [8], “livable streets” by Appleyard [9] or “soft edges” by Gehl [10]. The classic literature defined and emphasized the importance of microscale urban design; however, few studies have reported empirical evidence and systematic measuring instruments to support and validate their theories. Recent studies on microscale urban design have focused more on developing measurement tools. Perceived and objective are two types of measures often used in urban design measurement tools. Objective measures, such as Microscale Audits of Pedestrian Streetscapes (MAPS) [11], often investigate physical features of streets (sidewalk width, presence of the sidewalk, crosswalks, traffic lights, building height, traffic volume, trees) using audit tools. Perceived measures, such as the Neighborhood Environmental Walkability Survey (NEWS) [12], in contrast, often report residents’ perceptions of their surrounding urban design using interviews or self-administered questionnaires. However, those physical attributes collected from objective measures may not reflect “people’s overall perceptions of the street environment” [13]. Meanwhile, the perceived measures often face the issues of measurement reliability [14]. Lin and Moudon [15] have also suggested that objective measures of the built environment show a stronger association with physical activity than the subjective ones. In that context, only a few tools, including the tool developed by Ewing et al. [16], have been able to overcome the lack of objectiveness in measuring perceived urban design qualities. They proposed a conceptual framework explaining the process of how the physical features of the environment are perceived by people. The physical features of urban spaces will create the urban design qualities which are perceived differently by different users and lead to their own perception and reactions [17]. Based on their framework, they developed procedures to objectively measure urban design qualities of the walking environment. They did this by relating physical features of urban design qualities to five urban design qualities (imageability, enclosure, human scale, transparency and complexity) and then validated the features (an established tool) in New York [13,18]. The tool has made the subjective urban design concepts more transferable and easier to measure objectively.
Despite the significant effort in developing measurement tools for microscale urban design, the evidence for the impact of microscale urban design remains limited due to the field approach that requires considerable time and cost even for very small scale studies [19]. This highlights why there are so few microscale urban design studies, with even fewer from low- and mid-income countries in Asia. It is important to see whether findings on this research topic from Western cities can be applied to those Asian cities. Most of the cities in low- and middle-income countries in Asia are now undergoing rapid urban development [20]. Hence, there are valuable opportunities to develop or adopt a better urban design that supports active lifestyles and promotes sustainability. Research to fully understand the impact of characteristics of microscale urban design is essential to develop suitable urban design policies and strategies. In low- and middle-income countries, the microscale urban research approach is often ideal than the macroscale approach for many reasons. Firstly, fine-grained geographical data, which are still challenging to access even in high-income countries, are often insufficient, inconsistent or not available and are costly to attain in low- and middle-income countries [21]. Secondly, urban forms in low- and middle-income countries throughout Asia such as Vietnam are often high-density with a vibrant mix of uses [20], which usually come from historical fluctuations and unregulated development rather than official planning [22]. Therefore, focusing on analyzing microscale urban design, instead of studying macroscale variables such as density and diversity, will assist our understanding. More importantly, the microscale characteristics of the pedestrian environment can be modified at a lower cost and in a shorter time frame than reconfiguring the macroscale design [23], which fits the rapid and fragmented urban development and the limited resources of those countries.
Hanoi, the capital and the second-largest city in Vietnam, is a typical city in a low- and middle-income country in Asia. Hanoi has experienced many changes to its urban development over more than 1000 years. The various changes have resulted in multilayered urban structures with five different urban typologies. The present paper assesses the microscale urban design qualities across the various urban typologies identified within Hanoi and explores whether urban design qualities reflect the differences between urban typologies.
2. Materials and Methods
2.1. Materials
The five urban typologies
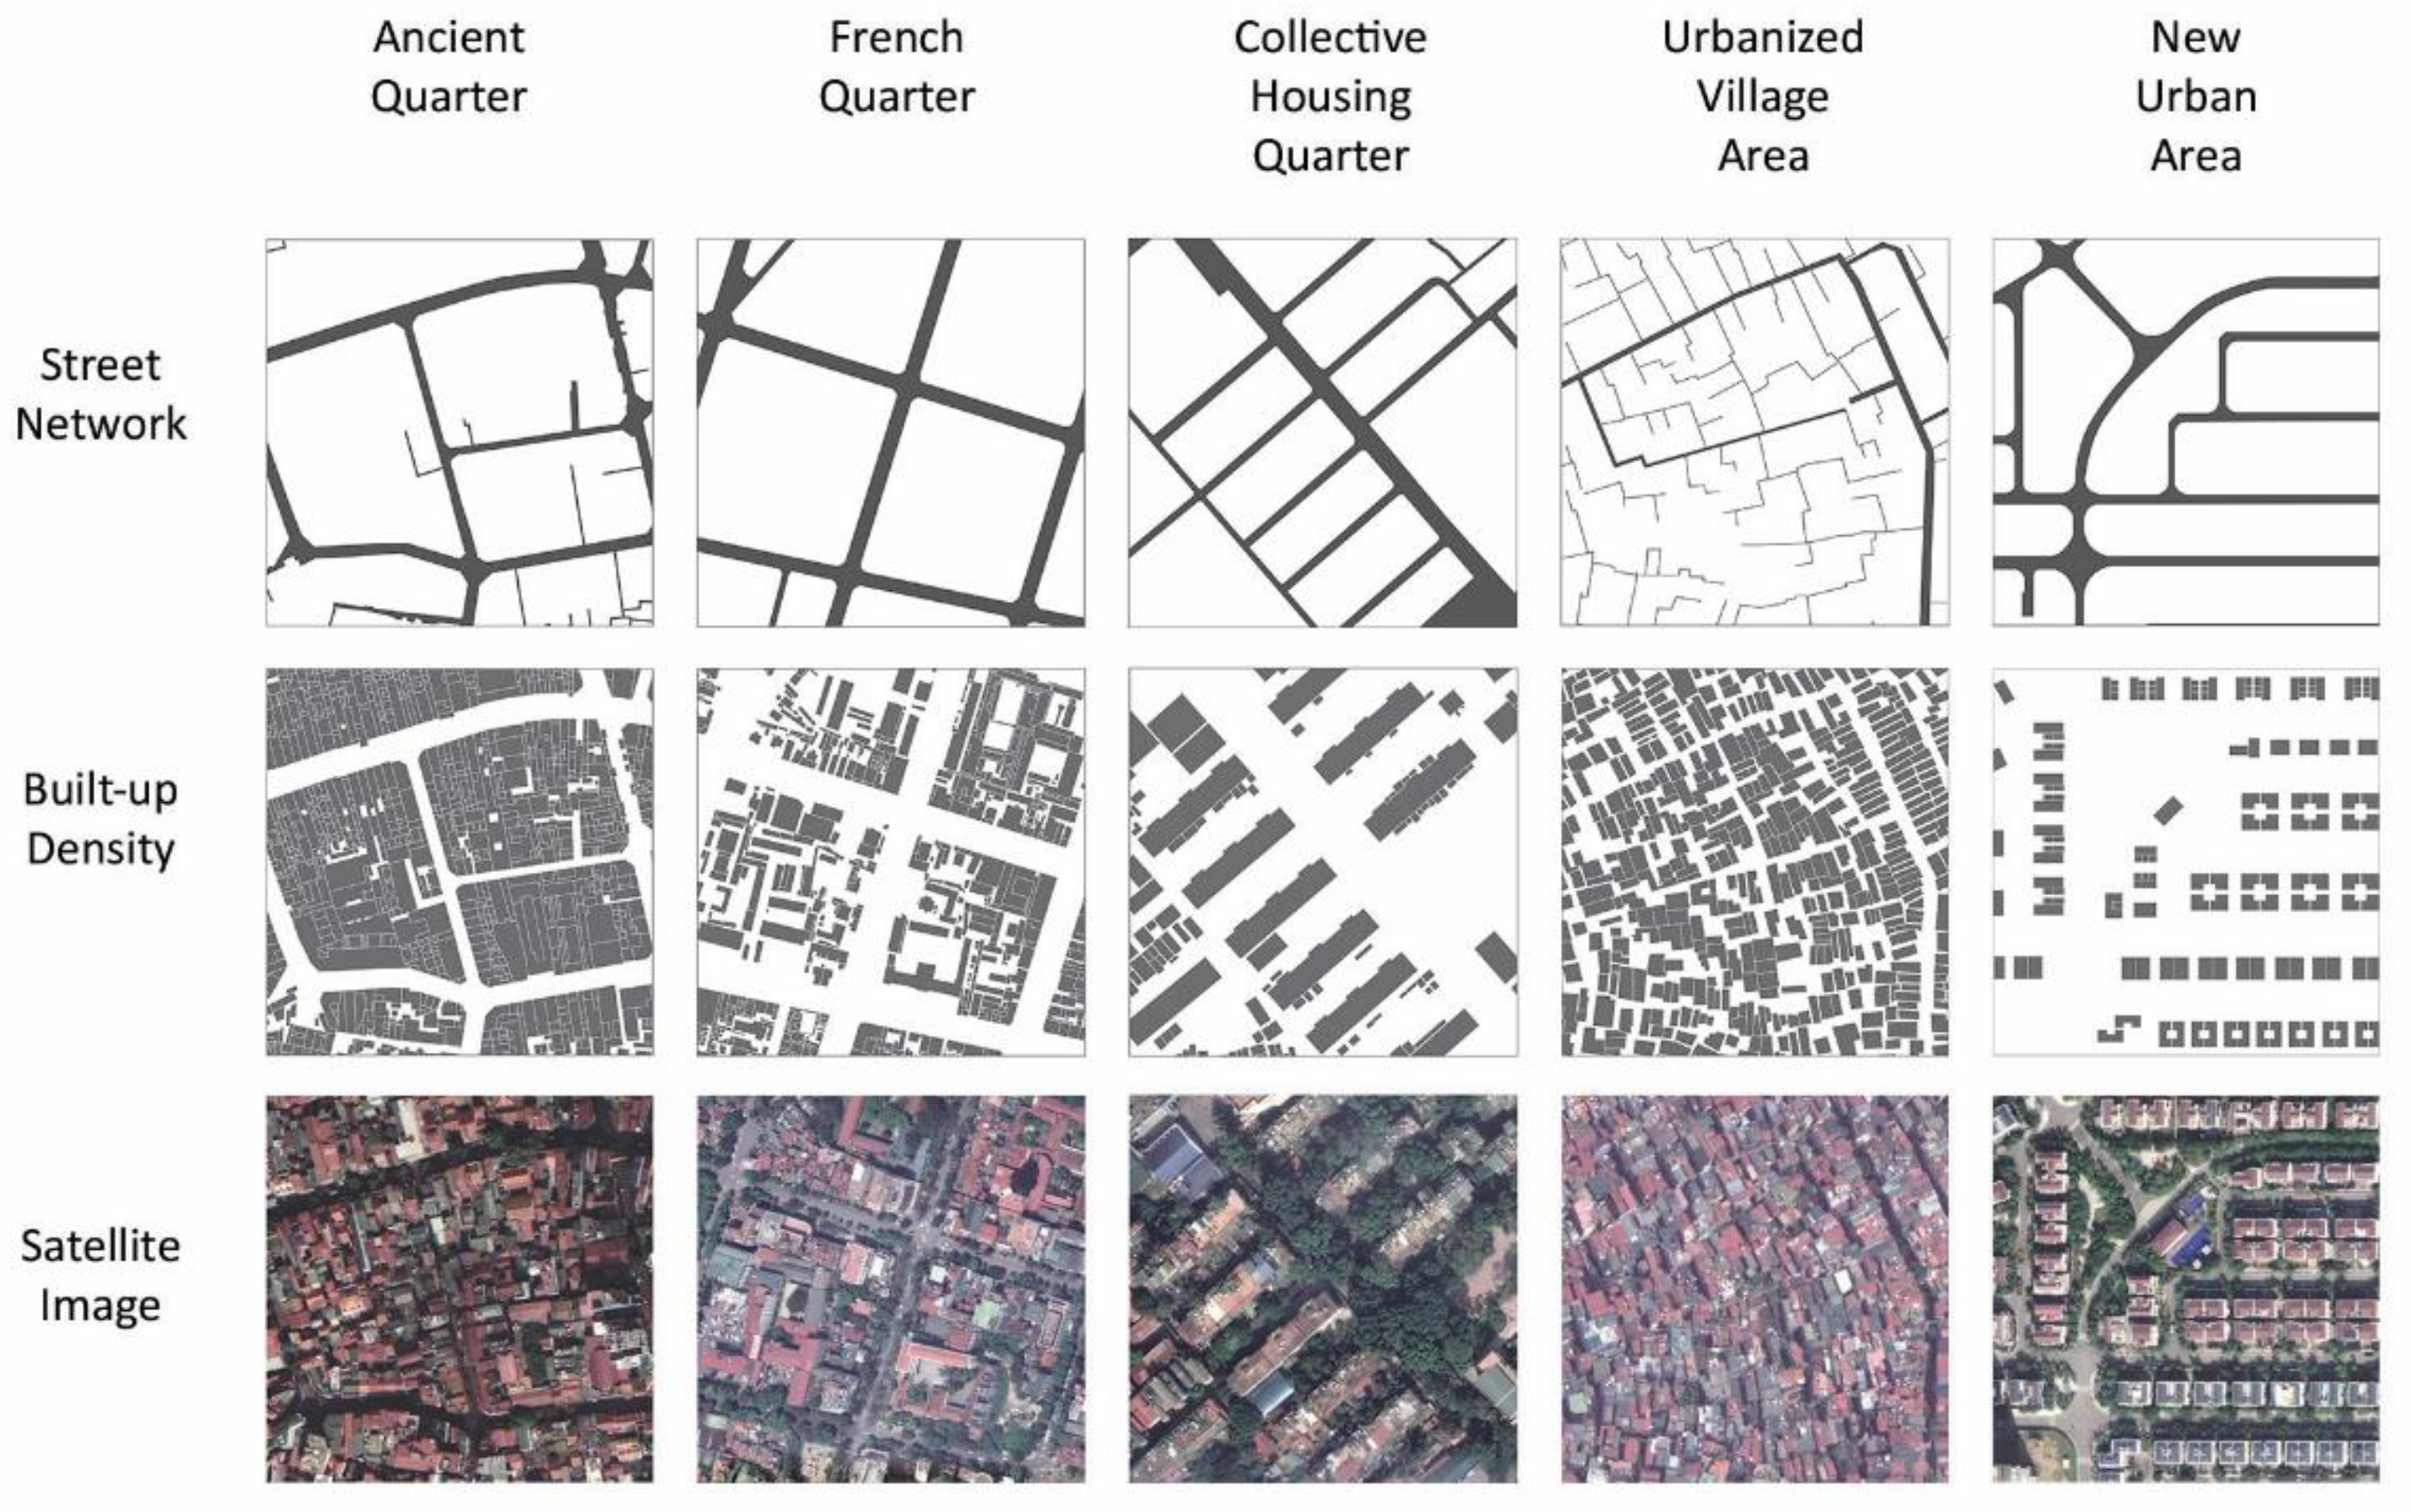
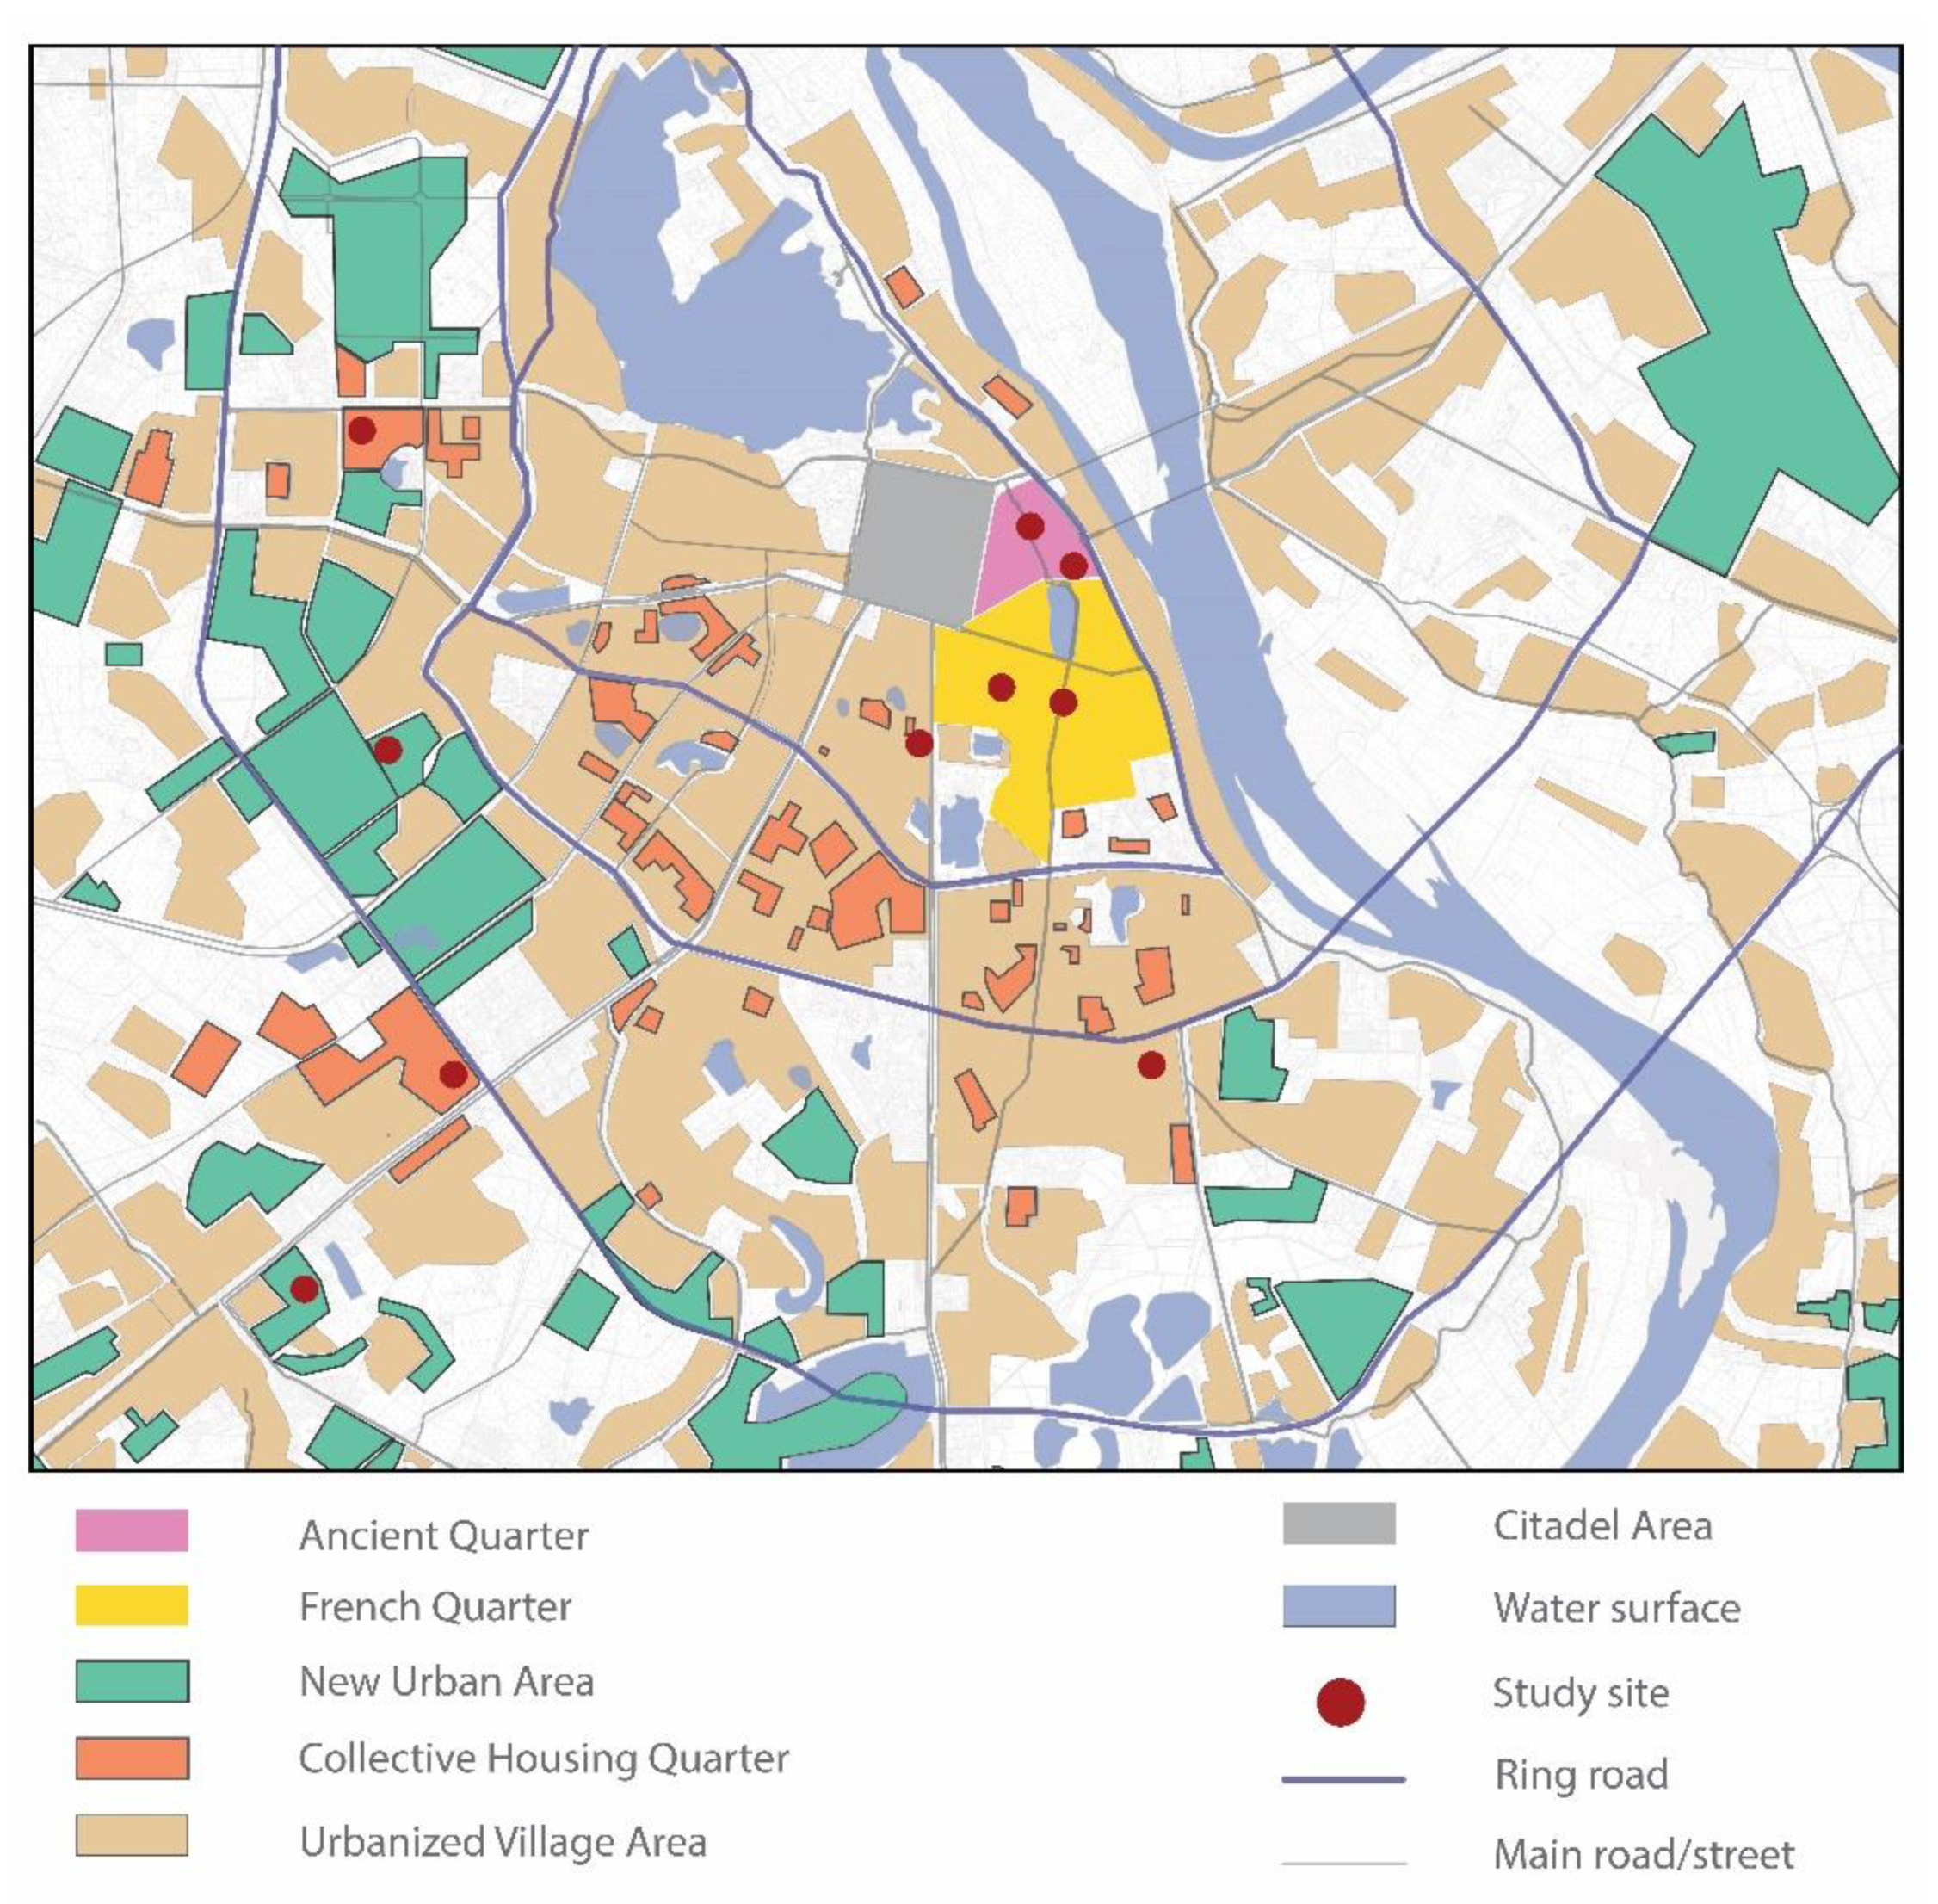
As highlighted in the literature [24,25], Hanoi has five typical urban typologies, namely the Ancient Quarter, the French Quarter, the Collective Housing Quarter, the New Urban Area and the Urbanized Village Area. The Ancient Quarter, initially comprising 36 commercial guild streets, was established in the 11th century during the feudal periods, and since then it has become the center of Hanoi. The Ancient Quarter is characterized by ancient architectural heritage including temples, pagodas, and ancient traditional shophouses. Having narrow streets and sidewalks, the Ancient Quarter features a dense street network with a high intersection density, and the road–area ratio is up to 23.5% [26]. The acceleration of Western foreign influences started with the French colonization (1873-1954), resulting in the establishment of the French Quarter [27]. The French colonial style of architecture and planning was expressed through various buildings, mansions, villas and landscape spaces such as parks and lakes along with a gridlike street network of wide avenues and sidewalks. After independence from French colonization in 1957, Vietnam followed socialism, taking the design from the USSR as a model [27]. From the 1960s, models of Soviet-style collective neighborhoods were constructed across Hanoi. These neighborhoods, often called Collective Housing Quarters or “KTT” in Vietnamese, were designed to accommodate 7000 to 12,000 inhabitants and formulated by typical four- to five-storied residential apartment buildings as the core structure and public facilities such as parks, community courtyards, schools, kindergartens and markets. From 1965 to 1975, many parts of Hanoi were destroyed due to the war and rebuilt. Although the process of transforming villages, especially those near the city center, into urban settlements has been happening for many decades, the most rapid urbanization in Hanoi only happened when the economic reform, the Doi Moi, was initiated in Vietnam in 1986. Without planning and infrastructure development, many villages have been urbanized rapidly to meet the demand for housing during the period of economic growth; this urban typology is referred to as the Urbanized Village Area. These areas are characterized by the dominance of self-built houses and organic road networks consisting of many narrow, long and winding streets that were informally set up and connected based on the former village streets. From the 1990s, new residential projects have been planned and implemented across Hanoi, resulting in various New Urban Areas. These areas feature modern housing typologies including high-rise apartments and large detached houses, along with a high standard of public services including new transportation networks [24]. The characteristics of these five urban typologies are summarized in Figure 1, and the distribution of typologies across Hanoi is illustrated in Figure 2.
2.2. Methods
2.2.1. Site Selection
A sampling frame comprised various wards (Vietnamese third-tier administrative subdivisions) of Hanoi. The eligibility criteria for the inclusion of a ward were as follows: (1) belongs to an urban district and (2) features one of the five identified urban typologies. All wards were divided into five clusters according to their urban typologies. Two wards from each cluster were randomly selected for the study sites. The researchers then selected four streets in each study site. If any ward had fewer than four streets, the largest main alleys were chosen. The final sample comprised ten randomly selected wards with forty streets. The selected study sites are marked as red dots in Figure 2.
2.2.2. Measurement Tool
To assess the urban design qualities of the five urban typologies, we adapted the urban design quality measurement tool developed by Ewing and Clemente [18]. Ewing and Clemente’s tool describes five urban design qualities:
- (1)
- Imageability is the quality of a place that leaves distinct, recognizable and memorable images in the minds of people. Features of high-imageability spaces include physical elements that can capture, create and evoke emotions. The elements measured are the number of people on the street, the proportion of historic buildings, courtyards, plazas, parks and outdoor dining areas.
- (2)
- Enclosure is the degree to which streets have a roomlike feeling, defined by vertical elements such as buildings, walls, trees and other vertical elements. The tool records the number of long sightlines, the proportion of street walls and the proportion of sky view to determine the enclosure level.
- (3)
- Human Scale is the proportion of physical elements’ size, texture and articulation that match the human form and correspond to people’s walking speed. The elements that influence the quality of human scale include the height and length of buildings, the proportion of windows, on-street furniture and small planters.
- (4)
- Transparency refers to the level of human activity that can be seen and perceived beyond the edge of the street or public space. The proportion of windows, street walls and the level of active use of the space are factors that affect the transparency of a street.
- (5)
- Complexity is the level of the visual richness of a street. The variety of physical elements, specifically the numbers and types of buildings, ornaments, landscape features and human activity, contribute to the complexity of a street.
Observational data were collected using the fieldwork manual [18]. Once the various elements of the urban design quality were observed and recorded, specific multipliers along with constants derived from models developed by the tool developers, Ewing and Clemente [18], were applied to obtain the scores for the urban design qualities. Specific details on the application and derivation of the tool can be found in Ewing and Clemente’s paper [18].
To capture the data from Hanoi, we amended the tool with respect to a number of definitions. For example, the definition of "historic buildings", which is determined to be “pre-WWII" in the original version, was changed to be "pre-1954" in the adapted version according to the definition of historic mansions and buildings from the Hanoi Municipal People’s Committee. Additionally, the level of noise in Ewing and Clemente’s tool is subjectively measured by the perception of the researcher in the field on a scale of five points [18]. To overcome this limitation of subjectiveness, we objectively measured the level of noise at each location using a smartphone app, the NIOSH Sound Level Meter (SLM) developed by the U.S. National Institute for Occupational Safety and Health (NIOSH). We classified the recorded levels of noise into five categories based on the scale derived by the American Academy of Audiology: (i) very quiet: under 30 dB, (ii) quiet: from 30 to 50 dB, (iii) normal: from 50 to 70 dB, (iv) loud: from 70 to 90 dB, and (v) very loud: above 90 dB.
2.2.3. Data Collection
A team of four research assistants visited the selected streets on weekdays only. Data collection was undertaken between September and December 2019. For each randomly selected street, observations were carried out along a distance of 100 meters. For streets in which there were multiple 100-meter segments, the team selected the most central part of the street. The researchers measured all variables comprising the five urban design qualities and counted pedestrians along the selected 100-meter segments, strictly adhering to the fieldwork manual [18] which included several steps and requirements. To summarize, it involved the researcher, at a given time point, counting people visible in a 100 m segment of the street along with counting people at the cross street to the observed site. This was repeated at four time intervals, and the average number of pedestrians was documented. For further details on the approach, please refer to the fieldwork manual [18]. All observations/measurements were attained over a one-hour period in each street.
2.2.4. Statistical Analysis
Descriptive statistics were calculated across the five urban design qualities and the total urban design quality score for each urban typology. The mean scores of individual and total combined urban design qualities for five urban typologies were Z-scored for comparison.
Multiple linear regression was undertaken to determine what urban design qualities are associated with the respective urban typology. Urban typologies were dummy coded to enter the regressions with the Urbanized Village Area as the reference category. This urban typology was selected as the reference category as it is the most common typology of the five urban typologies in Hanoi. A simple linear regression was also conducted to assess the association between the number of pedestrians and the total urban design quality score of all streets in Hanoi.
For comparative purposes, the mean scores of individual and total combined urban design qualities attained for Hanoi were compared with three studies that used the same measurement tool as used in the current paper. The three comparative cities are New York, USA; Brisbane, Australia; and Gurgaon, India [18,28,29].
3. Results
3.1. Urban Design Qualities
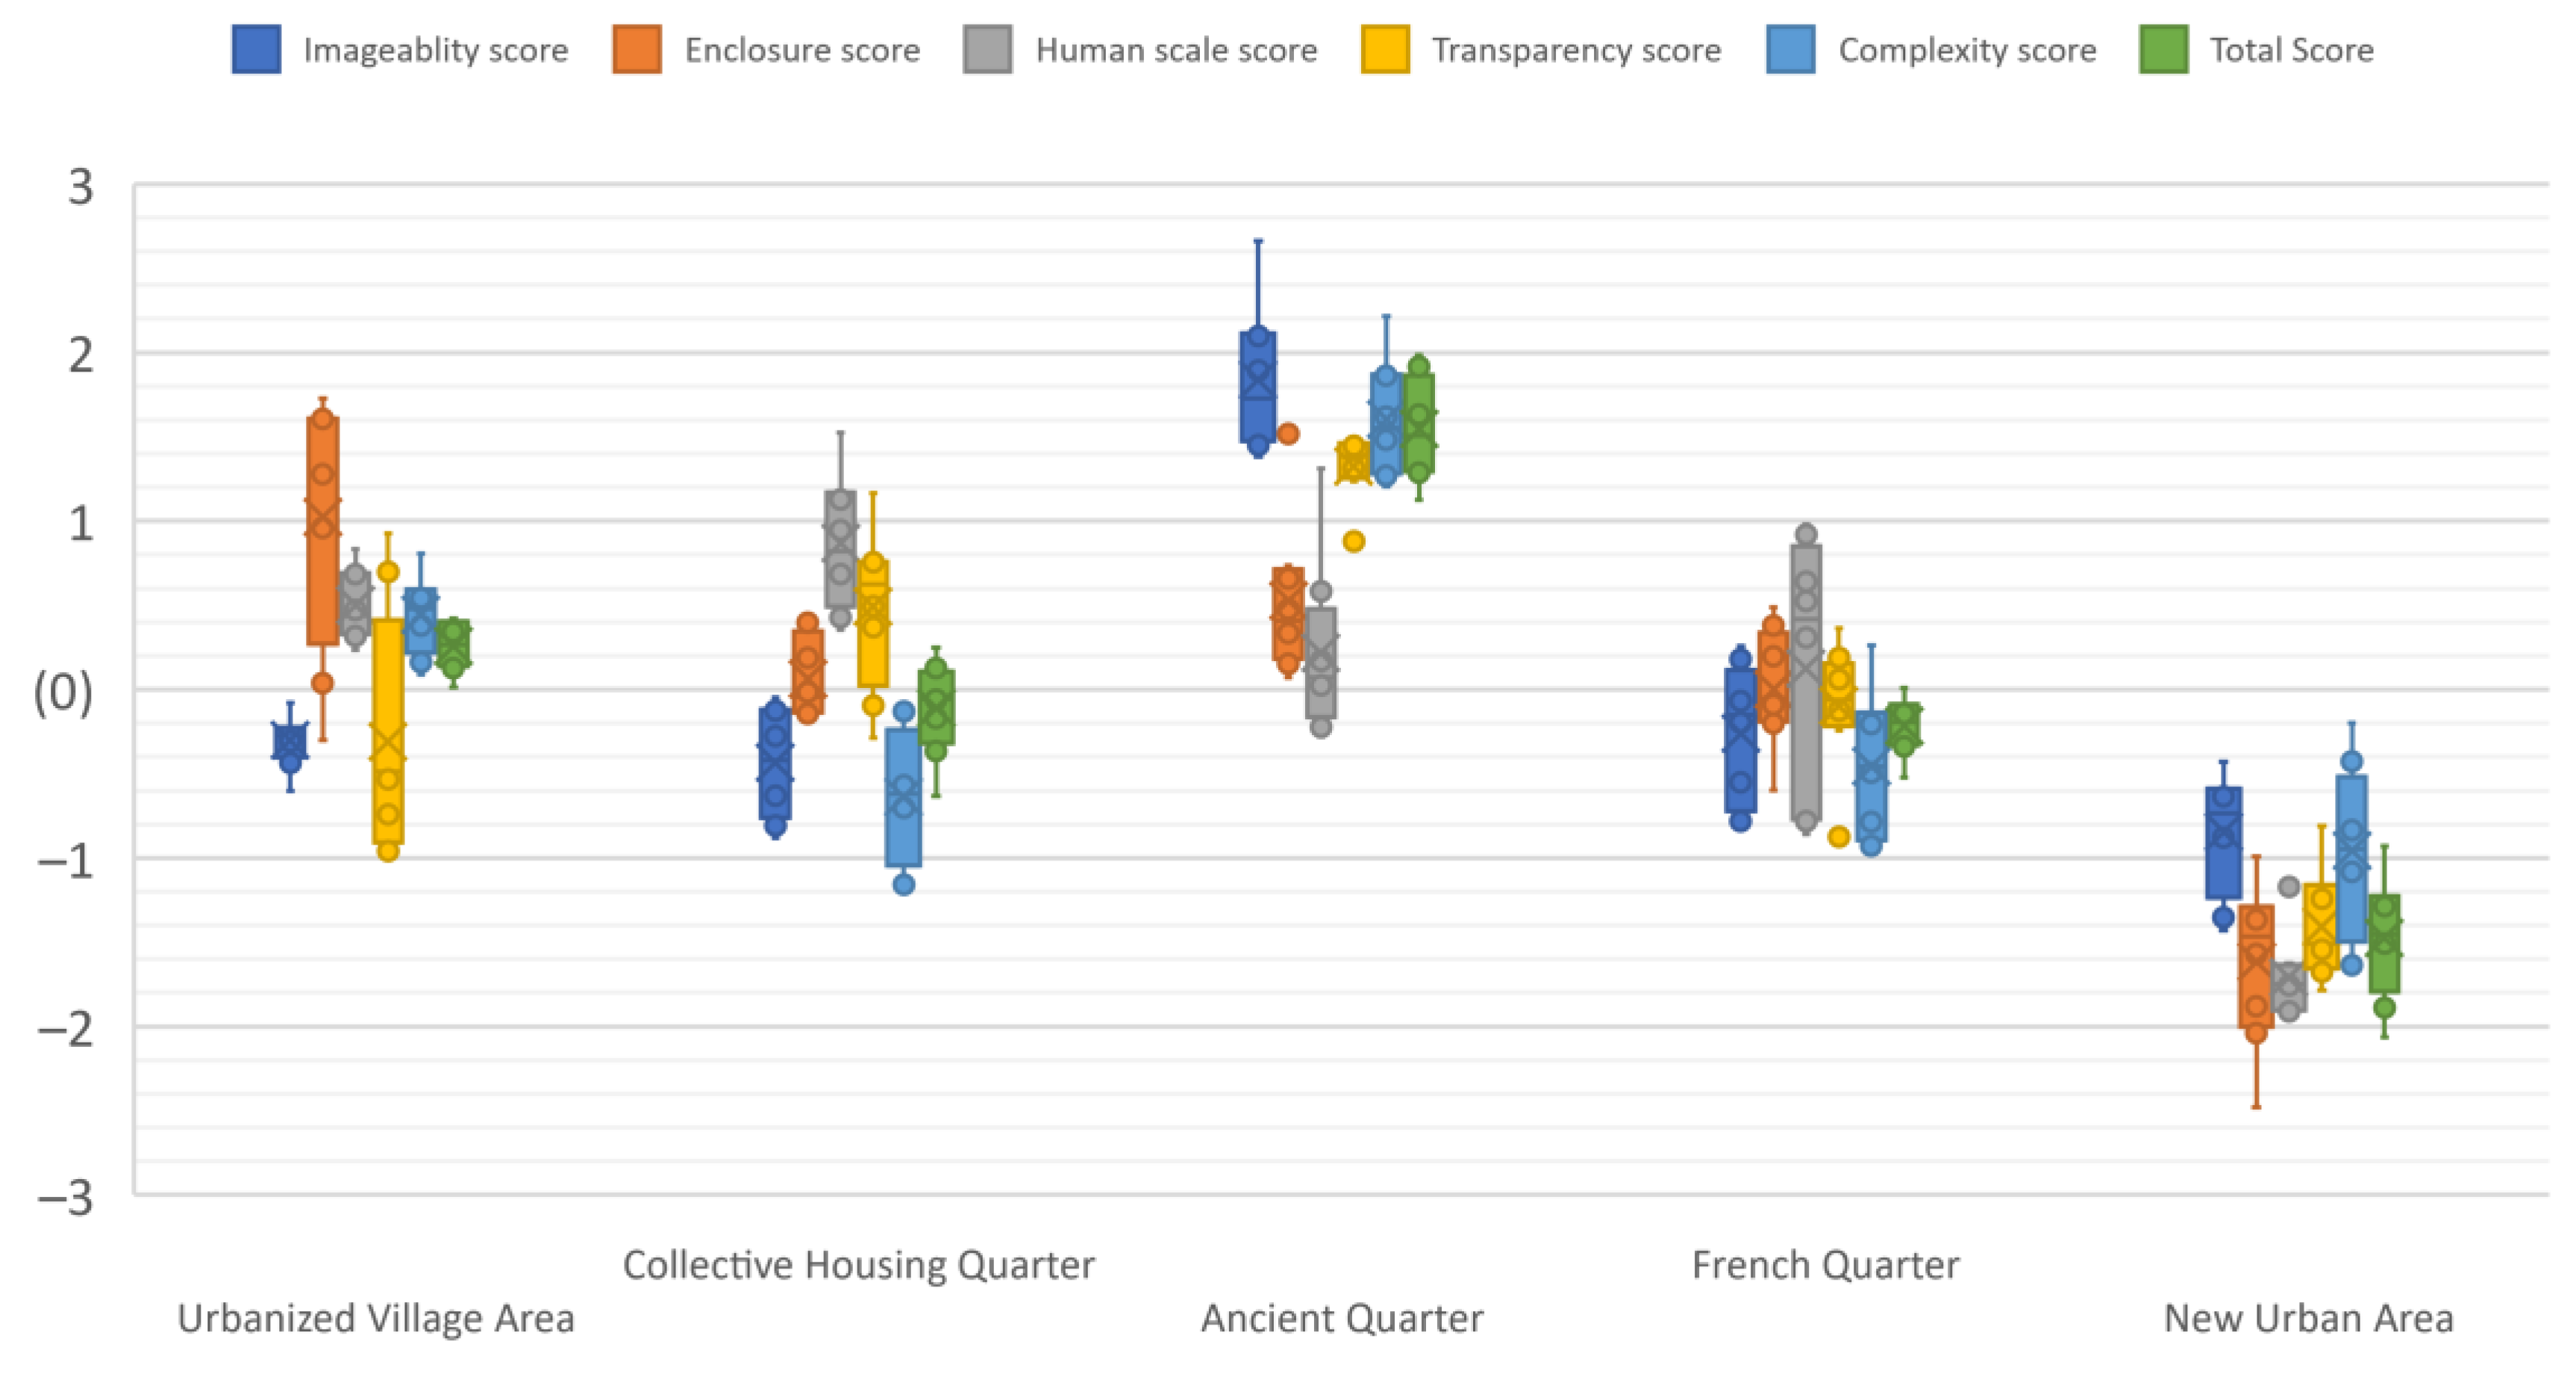
The mean recorded values and scores for the individual items, the five urban design qualities and the total combined urban design quality score for all urban typologies are summarized in Table 1. The Z-score of individual and total combined urban design qualities for five urban typologies is illustrated in Figure 3.
Overall, Hanoi has a mean combined score of urban qualities of 23.92 with the Ancient Quarter having the highest total combined score at 30.32, followed by the Collective Housing Quarter, the French Quarter and the Urbanized Village Area at 25.11, 23.77 and 23.16, respectively. The New Urban Area has the lowest total score of urban design quality at 17.94. In terms of the individual urban design qualities, Hanoi has the Imageability, Enclosure, Human Scale, Transparency and Complexity scores of 8.05, 2.50, 2.91, 3.21 and 7.24, respectively. When assessing each urban typology, Imageability quality places the Ancient Quarter at the top with a score of 11.43, being the only urban typology that has an Imageability score above 8. In contrast, the New Urban Area is the only urban typology that has an Imageability score below 7, which is the lowest score among all urban typologies. For Imageability contributors, Collective Housing Quarter has the highest number of courtyards, plazas and parks but the lowest number of nonrectangular-shaped buildings. The Ancient Quarter has the greatest number of buildings with identifiers and people on the street and, at the same time, the highest level of noise. The Urbanized Village Area ranks first place in terms of the Enclosure with a score of 3.30, which is 2.6 times higher than the Enclosure score for the New Urban Area (1.24) and 1.3 times higher than the Enclosure score of the French Quarter (2.51). For Enclosure contributors, the Ancient Quarter and Urbanized Village Area have the best scores for proportion of street wall and sky view while New Urban Area has the lowest one. In terms of Human Scale and Transparency, the New Urban Area has the lowest scores of 1.35 and 2.56, respectively, while the remaining urban typologies both scored above 2 for Human Scale and above 3 for Transparency. For Human Scale contributors, the Collective Housing Quarter has the greatest number of street furniture and small plants. For Transparency contributors, the Ancient Quarter has 60% of windows at the street level, which is the highest, while the Collective Housing Quarter had more than 90% active ground level. The Ancient Quarter is the only urban typology that had a score above 8 for Complexity (9.04), followed by the Urbanized Village Area at 7.72. The other three urban typologies, namely New Urban Area, Collective Housing Quarter and French Quarter, all had Complexity scores below 7 at 6.17, 6.56 and 6.72, respectively. For Complexity contributors, almost all urban typologies have the presence of outdoor dining, but none of them have the presence of public art.
3.2. Number of Pedestrians and Urban Design Qualities
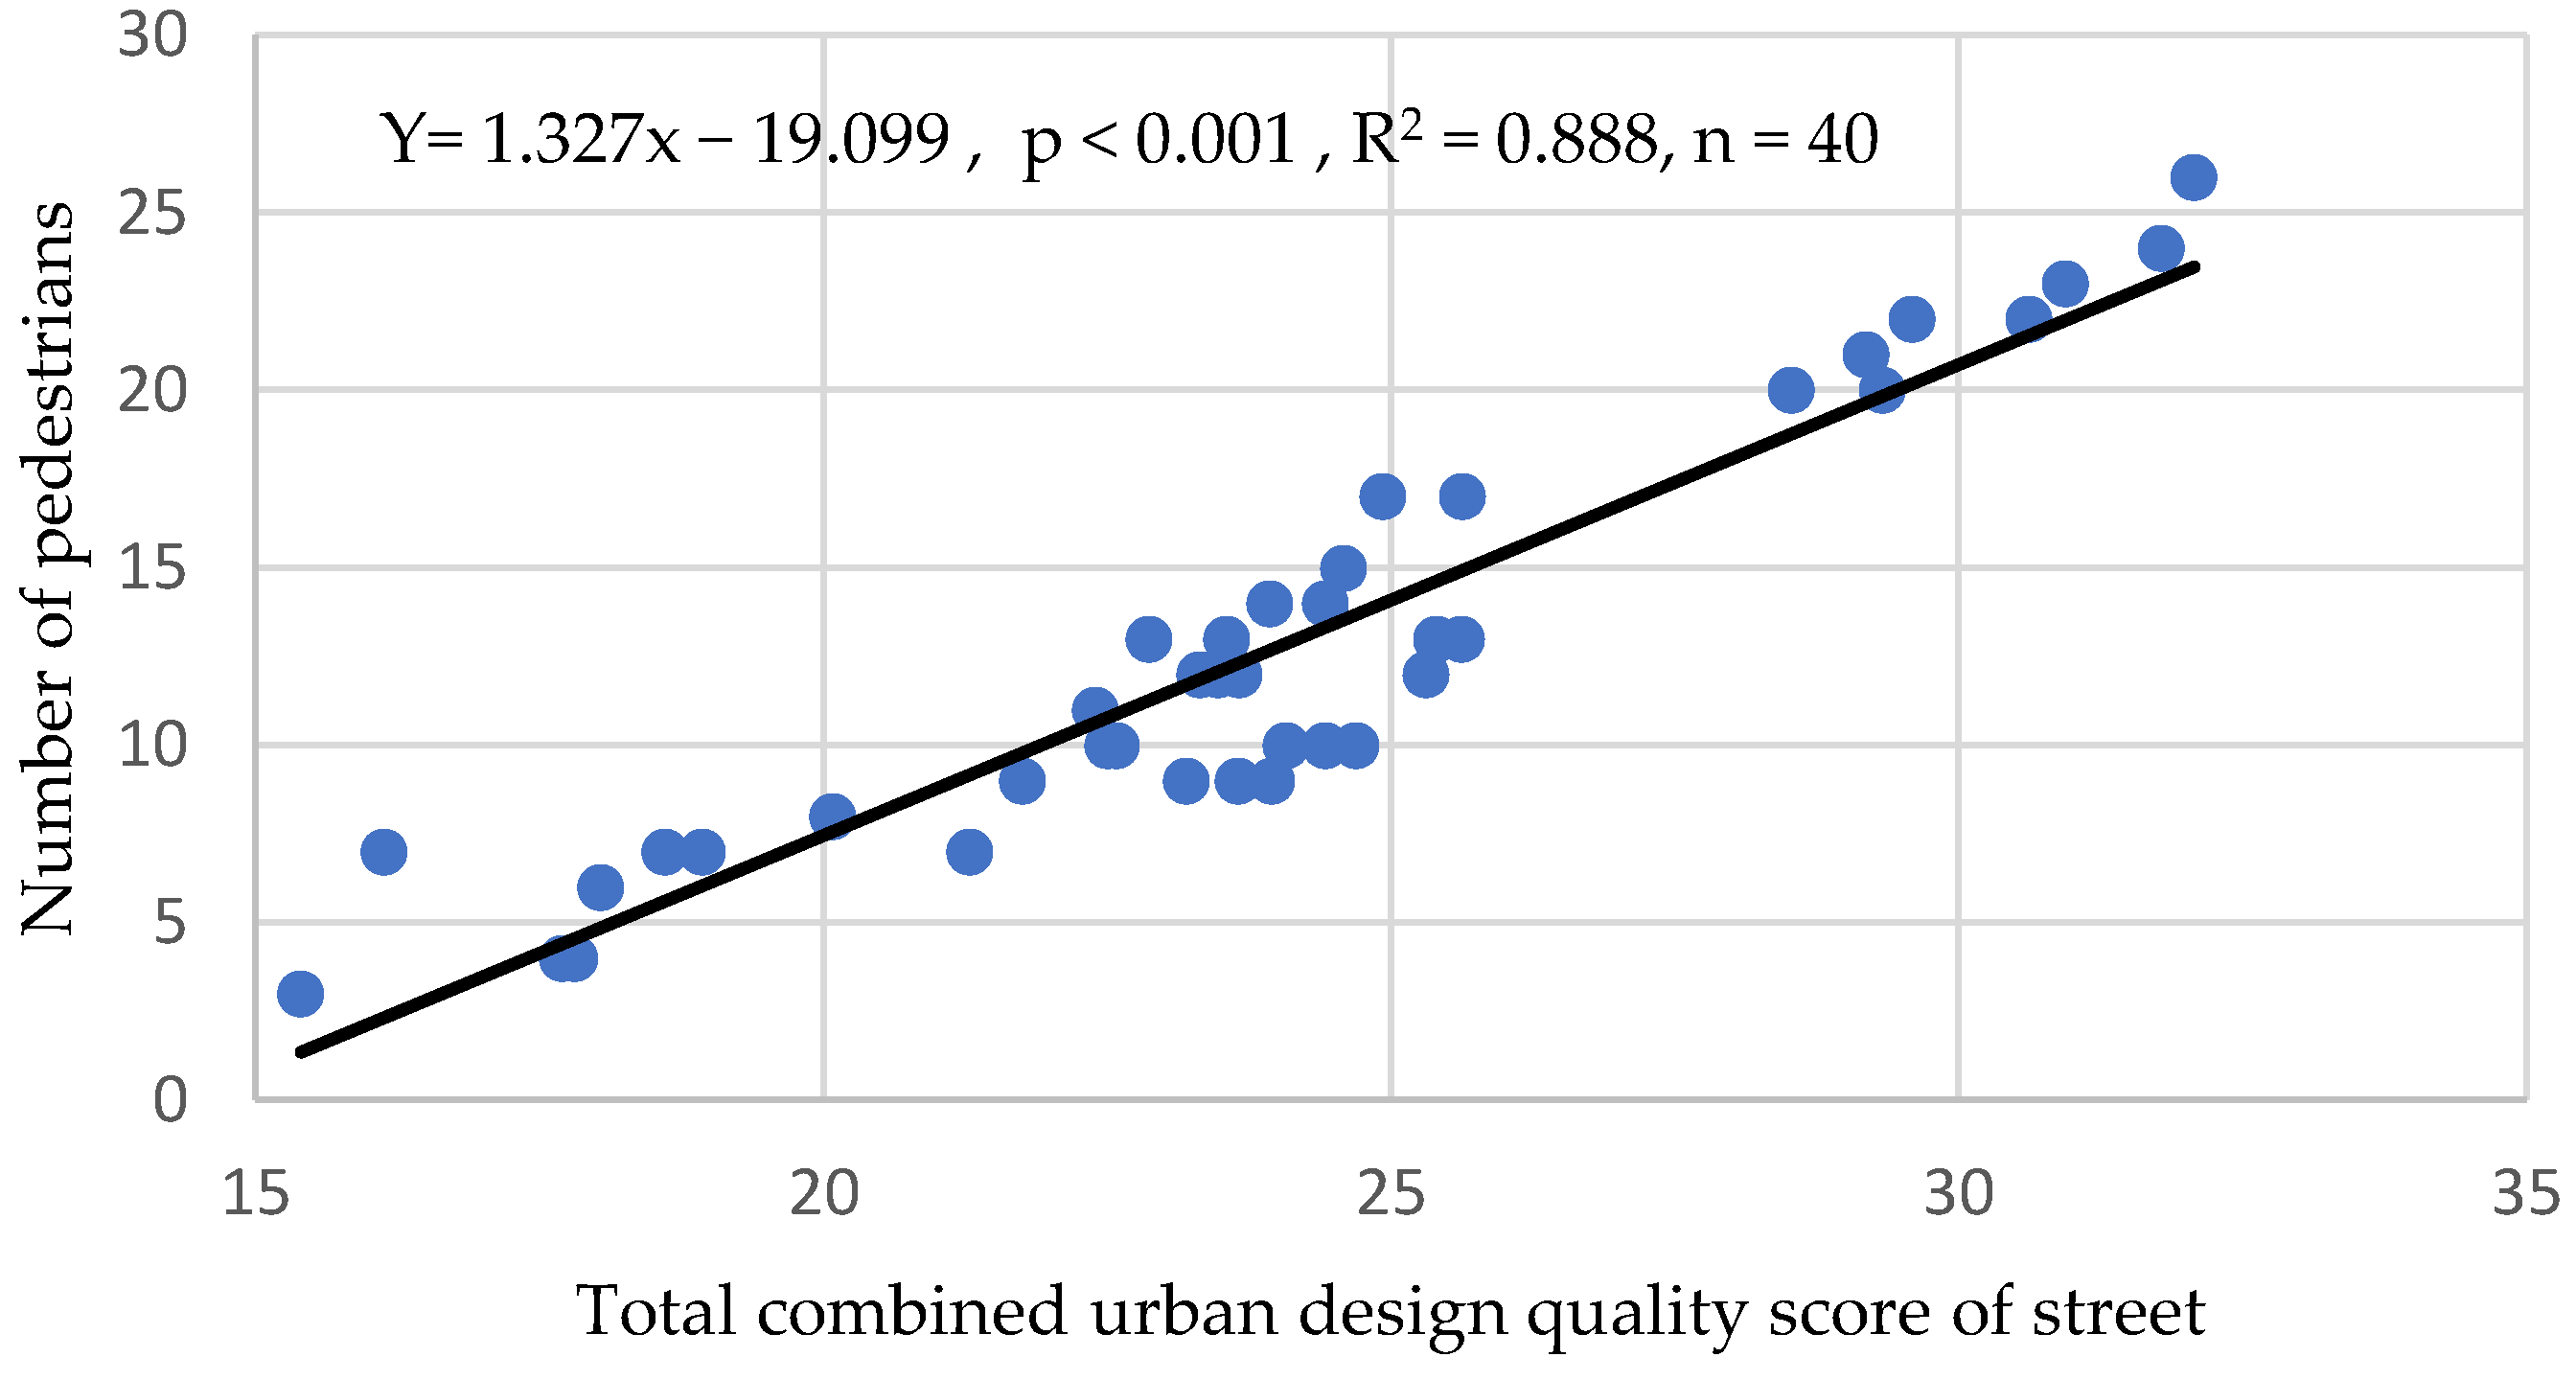
The simple regression confirmed that the total combined score of the urban design qualities is significantly associated with the number of pedestrians observed on the streets (see Figure 4).
3.3. Associations between Urban Typologies and Urban Design Qualities
Table 2 highlights the findings from the regression analysis assessing the associations between the five urban typologies and the five urban design qualities. Compared with streets in the Urbanized Village Area (the reference urban typology), streets in the Ancient Quarter have significantly higher Imageability scores. For Enclosure, both the Collective Housing Quarter and the French Quarter have substantially lower scores than the reference typology. The Human Scale is not considerably different across urban typologies except for the New Urban Area. Streets in the Urbanized Village Area have a lower level of Transparency than those in the Ancient Quarter and the Collective Housing Quarter and a higher Complexity score compared with urban typologies other than the Ancient Quarter. The Urbanized Village Area has significantly higher scores across all five urban design qualities in comparison with the New Urban Area. The total urban design quality score of the Urbanized Village Area is significantly higher than that of the New Urban Area but substantially lower than that of the Ancient Quarter.
3.4. Comparison of Four Cities
Table 3 shows the mean score of five urban design qualities and the total score for New York, Brisbane, Gurgaon and Hanoi. Gurgaon has the highest total combined urban design quality scores at 25.54, followed closely by Hanoi at 23.92. At a much lower level, New York and Brisbane share similar total scores of 17.04 and 17.69, respectively. Despite having levels of both Imageability quality and Complexity above 10, Gurgaon’s score of Enclosure quality is only 0.93, which is the lowest among the four cities. Brisbane ranks first in Transparency quality, just 0.07 points above Hanoi.
4. Discussion
Overall, Hanoi has remarkably high urban design qualities across the city. According to the results, streets in the areas that share the same urban typology tend to have similar scores of urban design qualities even though their locations are considerable distances apart spatially. The finding suggests that the unique urban typologies have an impact on the quality of urban design. Therefore, the authors will not discuss the urban design qualities of individual streets but instead focus on addressing the variation of the five urban design qualities across the urban typologies studied.
4.1. Imageability
The differences in the Imageability scores between the urban typologies are substantial. As expected, the Ancient Quarter (the tourist center for Hanoi) had a vast number of people on the street and many unique shops, restaurants and hotels reflecting the high density of commercial activity here, which led to a high score for building identifier and on-street people. The Imageability of the Ancient Quarter is also boosted by the distinct architecture comprising a mix of ancient houses with modern residential and commercial buildings. In contrast, the French Quarter, the Collective Housing Quarters and the Urbanized Village Areas comprise both positive and negative features providing a balanced Imageability score. For example, the Collective Housing Quarters have numerous community courtyards, but the scores for identifiers and unique shape are low as a consequence of the rectangular-shaped buildings, which are typical characteristics of the Soviet-style apartment blocks. These apartment blocks are usually renovated informally with many extended structures to create extra rooms that are locally called “chuong cop” (tiger cages) [30].
Despite lacking open spaces, the Urbanized Village Areas have a large number of nonrectangular-shaped buildings due to the high building density and the popularity of unregulated self-built dwellings in these locations. The French Quarter receives a good score for imageability due to the heritage French colonial architecture; however, the processes of conservation, privatization and commercial redevelopment, both formally and informally, have changed the structure and appearance of these buildings significantly [31]. New Urban Area ranks as the poorest for Imageability. Although having a low noise level and many open spaces, the urban design in these areas is generic and unmemorable. The dominance of private residential townhouses and villas leads to few people and activities on the streets.
Overall, the positive features of the Imageability of Hanoi are the mixed architecture and the vibrant streets are reflected by a large number of nonrectangular-shaped buildings and people on the street, as well as the presence of outdoor dining across most urban typologies. However, reduced urban design qualities are attributed to the lack of open spaces, which is a consequence of the traditional compact urban form, as well as the recent densification leaving few green open spaces [32]. The vibrant atmosphere on the street across the various urban typologies makes the neighborhoods memorable but simultaneously creates considerable noise, which reduces the Imageability quality. The noise pollution in Hanoi is predominantly the result of high-volume and congested traffic, to which poor urban design is one of contributing factors.
4.2. Enclosure
The high-density urban form in Hanoi enhances the Enclosure design quality significantly. The Urbanized Village Area is the leading typology with respect to this design quality feature. As seen in Figure 1, the Urbanized Village Areas feature an organic street pattern characterized by small streets and alleys that “start and end, curve back and forth, seemingly at random” [33]. Although the building height is limited in these areas, the high density of houses together with the system of narrow streets and alleys create a high proportion of street walls and a low proportion of sky view, resulting in a roomlike quality for spaces.
In contrast, the New Urban Areas have few street walls, but they do have a high sky view due to the wide roads and pavements, large setbacks and breaks in visual continuity with many gaps between buildings. The gaps can be either “soft gaps”, defined as open spaces between buildings such as frontal or surrounding yards and gardens, or “hard gaps” that are unused lots or spaces [34]. While irregular street layouts in Urbanized Village Areas can bring up visual termination points that enhance the sense of enclosure, rectilinear street patterns in New Urban Areas create many long sightlines that undermine the sense of enclosure significantly [18].
4.3. Human Scale
There are few differences in scores for the Human Scale design quality across the urban typologies in Hanoi. This finding is explained by the reduced height of buildings and the high number of small planters and street furniture. This is a direct result of the planning restrictions in Hanoi which restricted the height of buildings in most parts of the city other than the New Urban Areas where high-rise apartment towers were and still are permitted. In the inner city, houses often have a height of 10–13 meters and only 6-8 meters in the case of the Ancient Quarter [35]. The two-story facade of tube houses, which are the most popular dwelling typology in the Ancient Quarter, offers ideal conditions for audiovisual communication between the residents and people from the street, creating a very human-scaled streetscape [36].
Since there are limited open spaces in a dense city such as Hanoi, people use streets and sidewalks as a temporary extension of their small living spaces, which makes each street very lively. Having a vibrant street life, street furniture and small planters are often set up informally. Sidewalks are considered as a semipublic semiprivate space [37] and used for all kinds of activities from social meetings to working, playing, cooking or even bathing children. That multifunctional dimension is unique to Asian streets and opposes the concept of one-space one-function which is prevalent in Western urban design [38].
Despite the minimal variation between urban typologies, the Urbanized Village Areas still stand out in terms of Human Scale quality, followed by the Ancient Quarter. Although suffering from overcrowded traffic, streets in the Ancient Quarter are traditionally well proportioned in relation to the human body since they were originally designed for walking during the feudal periods. In other settings, although street network and urban design in the Urbanized Village Areas were not planned and designed carefully and were sometimes are even set up informally, they still well fit the human form due to the nature of any informal system that is to serve the most basic daily human activities. The absence of long sightlines in Urbanized Village Areas also contributes to the high Human Scale quality of this urban typology.
4.4. Transparency
There are only minor differences in Transparency design scores across the five urban typologies except for the New Urban Area. Although Hanoi does not have a regulation for street-level windows like other cities, the dominance of shophouses [39] and very high commercial activities across the city results in a high proportion of windows at the street level (61%), which increases the Transparency design quality. Due to the narrow width of Hanoi street houses, shop facades are open to the street to encourage entry, at the same time creating a high degree of ground-level transparency between indoors and out. Each shop becomes the “social window” [40] that opens up to the social platform which is the front street. Shop owners and people on the street can easily have audiovisual communication that sometimes happens from the opposites sides of the street [36]. However, due to the increasing level of noise and air pollution in Hanoi, glass walls have been used extensively. Although the use of glass facades reduces the social aspect to some extent, the transparency in the form of windows and open doorways still remains [40].
On the other hand, high solid walls or fences around large government buildings and private residential villas in the French Quarter and the New Urban Areas reduce the Transparency quality significantly. In New Urban Areas, the traditional shops are often replaced by shopping malls, which can provide the neighborhoods with a nonpolluted indoor shopping environment, but at the same time, they reduce the Transparency quality and the social environment of the streets there [40].
4.5. Complexity
As with most of the design qualities, the Ancient Quarter scored highest in the design quality Complexity. Due to the intense densification of Hanoi in relation to the built environment and population density, as well as the dominance of narrow tube houses, the total number of buildings on each street in the Ancient Quarter is significant. In addition, there is mixed architecture and land use together with the development of tourism services in the Ancient Quarter. Buildings and shops exhibit numerous basic and accent colors to attract customers that mostly are tourists. As expected from a center of tourism, a high number of pedestrians are observed on the streets in the Ancient Quarter, contributing to the sense of complexity.
In contrast, the New Urban Areas scored lowest. With the original intent to provide an orderly streetscape, uniform designs have been applied to the houses and buildings in these areas, creating very few types and identical building designs [41], which have reduced the sense of Complexity. Furthermore, the low built-up density together with the presence of many open spaces has lowered the score of the number of buildings.
A noticeable negative factor for Complexity quality is the absence of public art in all studied areas, which might be due to the inadequate arts infrastructure, the lack of funding and resources and the stringent government censorship [42]. In contrast, outdoor dining is present in most studied areas, thanks to Hanoi’s unique street food market and lifestyle, which plays a central role in both culture and informal economy [43].
4.6. Comparing Hanoi with Other Cities
Based on the total scores from five urban design qualities, four cities can be divided into two pairs, namely (i) Hanoi and Gurgaon and (ii) New York and Brisbane, which suggests that cities in the same pair have similar urban designs. This finding also reflects the fact that Hanoi and Gurgaon are both cities in low- and middle-income countries in Asia, while Brisbane and New York are cities from high-income countries which follow the typical Western-style urban planning. The pairs of cities are also in line with the result of a study by Thompson et al. [44] on urban design types and road transport injury across the world. In that research, North American cities such as New York and Australian cities such as Brisbane are classified into the cluster of urban designs named “Motor City” characterized by low-density urban form and grid-based road networks, while Indian cities such as Gurgaon and Vietnamese cities such as Hanoi are classified into the cluster of urban design named “Informal City” characterized by low-capacity informal road networks and low rail transportation [44].
In another highlight, the Imageability and Complexity scores of Gurgaon and Hanoi are significantly higher than those of New York and Brisbane. By analyzing the original studies [18,28,29], these differences can be explained by the fact that Gurgaon and Hanoi have a high number of pedestrian movements and activities on the street, which are important elements contributing to both Imageability and Complexity qualities. In contrast, despite being one of the most walkable cities in the United States, streets in New York were found to have an average of only 5.64 pedestrians on the observer side in the study by Ewing and Clemente [18]. In contrast to Western cities, the lively street life exists naturally in the Asian urban context and is established by numerous aspects such as socio-cultural attributes, the need-hierarchy, psyche and movements, diversity of street use, informal street use and pedestrian culture [45]. While individualism is popular in cultures of Western Europe and North America, collectivism is typical in cultures of Asia, Africa and parts of Europe and Latin America [46]. People in Asia often have more open character and require less privacy than Westerners, which explains their willingness to participate in common activities on the street. Even in the Vietnamese language, streets and roads are called “con pho” and “con duong”, employing “con”, a classifier word for living things, as opposed to “cai” for inanimate objects [47].
The comparison between the four cities has managed to show parts of the differences in urban design qualities between cities in low- and high-income countries and between Asian cities and Western cities. However, it is also important to note that such a comparison may contain some errors because of the considerable differences in the study objectives, the size of the samples studied and the operationalization of the Ewing and Cervante’s tool in the chosen studies. The limited number of studies and geographical locations of the studied cities reduce the ability to robustly compare differing urban models and urban contexts, such as those found in European cities.
5. Conclusions
The present study evaluated the urban design qualities across Hanoi and demonstrated that urban design qualities vary across the five typical urban typologies. Imageability and Complexity are the two urban design qualities that vary the most, whilst the Human Scale, Enclosure and Transparency typologies have little variation, except for the case of the New Urban Area typology. The urban typologies together with their characteristics have an impact on the quality of urban design in both positive and negative directions. Regardless of location, streets and areas that have the same urban typology tend to have the same level of urban design quality.
Among the five urban typologies, the Ancient Quarter has the highest score for urban design qualities and the highest number of pedestrians despite being the oldest urban typology. In contrast, although being carefully designed and having a better system of infrastructure, the New Urban Areas have lower scores across all five urban design qualities. This finding suggests that the path Hanoi is following to develop the city may need to be reconsidered. Rather than adapting modern Western-style planning and urban design, it is essential to study carefully all the existing local urban forms and typologies in order to attain and apply the best urban design. It is also important to learn from lessons that have been documented from experiences of urbanization in Western countries.
In addition, the research confirmed the correlation between the number of pedestrians and the urban design quality score. The streets with better urban design qualities have a higher number of pedestrians. This finding underlines the role of street-level urban design in promoting the walkability of a place that has been recognized in previous studies.
In terms of methods, the research has successfully tested the urban design quality measurement tool constructed by Ewing and Clemente [18], which was developed for U.S. cities, which differ enormously from Hanoi where the urban context and urban design are significantly different. The study helps to fill in the gap of knowledge on street-level urban design, especially in the region of Asian mid- and low-income countries which are heavily underrepresented in the literature. The study results were also compared with previously studied cities, highlighting some significant differences between Asian and Western urban design qualities. Future validation studies of this measuring tool should be conducted in other cities from various parts of the world to better understanding the urban design qualities in different cultures and urban contexts. However, adjustments and the addition of new criteria are essential to capture the influences of different cultures and the urban context of urban design qualities. For example, when applying the measurement tool to high-density urban contexts such as Asian cities, the measures of Imageability and Complexity of the tool, which rely on the number of buildings and the number of people on street, need to be adjusted. Moreover, new criteria should be added to assess the informal and temporary elements commonly present on urban streets of developing countries such as food stalls, street markets or “semipublic semiprivate” spaces and street furniture [37], which may have considerable impact on the sense of complexity, imageability and human scale.
We acknowledge several limitations of this study. The main limitation of our research is the limited number of selected streets (n = 40). Larger sample size could have helped in providing more robust data for analysis. Other limitations include the uniqueness of Hanoi—a capital city and center of tourism in Vietnam—which may increase the data variation. For example, the number of pedestrians on streets in tourism areas may contain not only local residents but also tourists. The uniqueness of Hanoi also makes it more difficult to validate the results in other cities of Vietnam.
In conclusion, the study contributes to understanding the urban design circumstances in Hanoi, providing policymakers, planners, urban designers, architects and others with information on the street-level urban qualities for developing sustainable urban design policies, strategies and interventions that make the city more livable and ultimately promote the health of residents.
Author Contributions
Conceptualization, methodology, investigation, resources, writing, review and editing: T.P.H., M.S., J.T. and T.Q.N. All authors have read and agreed to the published version of the manuscript.
Funding
T.P.H. was supported by Melbourne Research Scholarship.
Institutional Review Board Statement
The study was conducted according to the guidelines of the Declaration of Helsinki, and approved by the Human Research Ethics Committee of the University of Melbourne (Ethics ID: 1954948 and date of approval: 19 July 2019).
Conflicts of Interest
The authors declare no conflict of interest. The funders had no role in the design of the study; in the collection, analyses or interpretation of data; in the writing of the manuscript; or in the decision to publish the results.
References
- United Nations, Department of Economic and Social Affairs, Population Division. World Urbanization Prospects: The 2018 Revision (ST/ESA/SER.A/420); United Nations: New York, NY, USA, 2019. [Google Scholar]
- Brownson, R.C.; Hoehner, C.M.; Day, K.; Forsyth, A.; Sallis, J.F. Measuring the built environment for physical activity: State of the science. Am. J. Prev. Med. 2009, 36, S99–S123.e12. [Google Scholar] [CrossRef] [PubMed] [Green Version]
- Cervero, R.; Kockelman, K. Travel Demand and the Three Ds: Density, Diversity, and Design; Institute of Urban and Regional Development, University of California: Berkeley, CA, USA, 1996; p. 33. [Google Scholar]
- Ewing, R.; Cervero, R. Travel and the built environment: A meta-analysis. J. Am. Plan. Assoc. 2010, 76. [Google Scholar] [CrossRef]
- Sallis, J.F.; Slymen, D.J.; Conway, T.L.; Frank, L.D.; Saelens, B.E.; Cain, K.; Chapman, J.E. Income disparities in perceived neighborhood built and social environment attributes. Health Place 2011, 17, 1274–1283. [Google Scholar] [CrossRef] [PubMed]
- Ewing, R.; Hajrasouliha, A.; Neckerman, K.M.; Purciel-Hill, M.; Greene, W. Streetscape features related to pedestrian activity. J. Plan. Educ. Res. 2015, 36, 5–15. [Google Scholar] [CrossRef] [Green Version]
- Lynch, K.; Studies, J.C.F.U. The Image of the City; Harvard University Press: Cambridge, MA, USA, 1960. [Google Scholar]
- Jacobs, J. The Death and Life of Great American Cities; Vintage Books: New York, NY, USA, 1961. [Google Scholar]
- Appleyard, D.; Gerson, M.S.; Lintell, M. Livable Streets; University of California Press: Oakland, CA, USA, 1981. [Google Scholar]
- Gehl, J. Life between Buildings; Van Nostrand Reinhold: New York, NY, USA, 1987; p. 23. [Google Scholar]
- Millstein, R.A.; Cain, K.L.; Sallis, J.F.; Conway, T.L.; Geremia, C.; Frank, L.D.; Chapman, J.; Van Dyck, D.; Dipzinski, L.R.; Kerr, J.; et al. Development, scoring, and reliability of the microscale audit of pedestrian streetscapes (maps). BMC Public Health 2013, 13, 403. [Google Scholar] [CrossRef] [Green Version]
- Saelens, B.E.; Sallis, J.F.; Black, J.B.; Chen, D. Neighborhood-based differences in physical activity: An environment scale evaluation. Am. J. Public Health 2003, 93, 1552–1558. [Google Scholar] [CrossRef]
- Ewing, R.; Handy, S. Measuring the unmeasurable: Urban design qualities related to walkability. J. Urban Des. 2009, 14, 65–84. [Google Scholar] [CrossRef]
- Kim, S.; Park, S.; Lee, J.S. Meso- or micro-scale? Environmental factors influencing pedestrian satisfaction. Transp. Res. Part D Transp. Environ. 2014, 30, 10–20. [Google Scholar] [CrossRef]
- Lin, L.; Moudon, A.V. Objective versus subjective measures of the built environment, which are most effective in capturing associations with walking? Health Place 2010, 16, 339–348. [Google Scholar] [CrossRef]
- Ewing, R.; Handy, S.; Brownson, R.C.; Clemente, O.; Winston, E. Identifying and measuring urban design qualities related to walkability. J. Phys. Act. Health 2006, 3, S223–S240. [Google Scholar] [CrossRef]
- Parashar, A.; Bnayan, H. Studying Walkability Preferences Using Urban Design Qualities: A Case of Riyadh, Saudi Arabia. Available online: https://0-iopscience-iop-org.brum.beds.ac.uk/article/10.1088/1755-1315/452/1/012140/pdf (accessed on 27 May 2021).
- Ewing, R.; Clemente, O. Measuring Urban Design: Metrics for Livable Places; Island Press: Washington, DC, USA, 2013; pp. 1–183. [Google Scholar]
- Steinmetz-Wood, M.; Velauthapillai, K.; O’Brien, G.; Ross, N.A. Assessing the micro-scale environment using google street view: The virtual systematic tool for evaluating pedestrian streetscapes (virtual-steps). BMC Public Health 2019, 19, 1246. [Google Scholar] [CrossRef] [Green Version]
- Chen, T.-L.; Chiu, H.-W.; Lin, Y.-F. How do east and southeast Asian cities differ from western cities? A systematic review of the urban form characteristics. Sustainability 2020, 12, 2423. [Google Scholar] [CrossRef] [Green Version]
- Koohsari, M.J.; McCormack, G.R.; Shibata, A.; Ishii, K.; Yasunaga, A.; Nakaya, T.; Oka, K. The relationship between walk score® and perceived walkability in ultrahigh density areas. Prev. Med. Rep. 2021, 23, 101393. [Google Scholar] [CrossRef]
- Storch, H.; Eckert, R.; Pfaffenbichler, P. The compactness of urban areas in vietnam. Sustainable urban development and local mobility nodes. 2008, pp. 447–456. Available online: https://www.corp.at/archive/CORP2008_48.pdf (accessed on 27 May 2021).
- Cain, K.L.; Millstein, R.A.; Sallis, J.F.; Conway, T.L.; Gavand, K.A.; Frank, L.D.; Saelens, B.E.; Geremia, C.M.; Chapman, J.; Adams, M.A.; et al. Contribution of streetscape audits to explanation of physical activity in four age groups based on the microscale audit of pedestrian streetscapes (maps). Soc. Sci. Med. 2014, 116, 82–92. [Google Scholar] [CrossRef] [PubMed]
- JICA. The Comprehensive Urban Development Programme in Hanoi Capital City of the Socialist Republic of Vietnam (Haidep). Available online: https://openjicareport.jica.go.jp/pdf/11856093_01.pdf (accessed on 3 February 2021).
- Thi Nhu, D. Urbanisation and urban architectural heritage preservation in hanoi: The community’s participation? Ph.D. Thesis, Université Panthéon-Sorbonne - Paris I, Paris, France, 2017. [Google Scholar]
- Kato, H.; Nguyen, L.H. Land policy and property price in hanoi, vietnam. J. East. Asia Soc. Transp. Stud. 2010, 8, 1011–1026. [Google Scholar]
- Geertman, S. The self-organizing city in Vietnam: Processes of change and transformation in housing in Hanoi. Ph.D. Thesis, Technische Universiteit Eindhoven, Eindhoven, The Netherlands, April 2007. [Google Scholar]
- Hooi, E.; Pojani, D. Urban design quality and walkability: An audit of suburban high streets in an Australian city. J. Urban Des. 2020, 25, 155–179. [Google Scholar] [CrossRef]
- Khetrapal, V.; Chadchan, J. Assessing the urban design qualities of streets for pedestrians: A case study of Gurgaon. Int. J. Sci. Technol. Res. 2019, 8, 3067–3073. [Google Scholar]
- Phuong, D.Q.; Groves, D. The aesthetics of Hanoi’s architecture: Sense of place through the eyes of local painters. J. Aesthet. Art Crit. 2011, 69, 133–142. [Google Scholar] [CrossRef]
- To, K.; Chong, K.H. Heritage conservation vs. Commercial redevelopment in historic city centers: The case of French colonial quarter in Hanoi and lessons from Singapore. J. Habitat Eng. Des. 2013, 5, 89–96. [Google Scholar]
- Mauro, G. Rural–urban transition of Hanoi (Vietnam): Using Landsat imagery to map its recent peri-urbanization. ISPRS Int. J. Geo-Inf. 2020, 9, 669. [Google Scholar] [CrossRef]
- Munson, D. WhichStreet Pattern Represents Your Continent? Available online: https://munsonscity.wordpress.com/2013/10/09/which-street-pattern-represents-your-continent/ (accessed on 10 April 2021).
- Bereitschaft, B. Equity in microscale urban design and walkability: A photographic survey of six Pittsburgh streetscapes. Sustainability 2017, 2017, 1233. [Google Scholar] [CrossRef] [Green Version]
- Anh, P.; Thanh, N.T.N.; Vu, C.T.; Ha, N.V.; Hung, B.Q. Preliminary result of 3d city modelling for Hanoi, Vietnam. 2018 5th NAFOSTED Conference on Information and Computer Science (NICS), Ho Chi Minh City, Vietnam, 23–24 November 2018; pp. 294–299. [Google Scholar]
- Kien, T. “Tube house” and “neo tube house” in Hanoi: A comparative study on identity and typology. J. Asian Archit. Build. Eng. 2008, 7, 255–262. [Google Scholar] [CrossRef] [Green Version]
- To, K. Cultural sustainability and sustainable communities initiative in developing countries. Evidence from vietnam and indonesia. In Sustainable Development—the Cultural Perspective: Concepts—Aspects—Examples, 1st ed.; Banse, G., Nelson, G.L., Parodi, O., Eds.; Nomos Verlagsgesellschaft mbH & Co. KG: Baden-Baden, Germany, 2011; pp. 349–376. [Google Scholar]
- Mateo-Babiano, I.; Ieda, H. Street space renaissance: A spatio-historical survey of two Asian cities. J. East. Asia Soc. Transp. Stud. 2005, 6, 4317–4332. [Google Scholar]
- Davis, H. Living over the Store: Architecture and Local Urban Life; Routledge: Oxfordshire, UK, 2012. [Google Scholar]
- Bäckman, M.; Rundqvist, M. Sociable space in a city of life: The case of Hanoi. Master’s Thesis, Blekinge Tekniska Högskola, Karlshamn, Sweden, 2005. [Google Scholar]
- Tran, H. Urban space production in transition: The cases of the new urban areas of Hanoi. Urban Policy Res. 2014, 33, 79–97. [Google Scholar] [CrossRef]
- Brittney. Nguyen Nhu Huy on Curating a New Path for Vietnamese Contemporary Art. Available online: https://artradarjournal.com/2013/11/22/nguyen-nhu-huy-on-curating-a-new-path-for-vietnamese-contemporary-art/ (accessed on 27 May 2021).
- Atomei, C. The SidewalkDiet: Street Markets and Fresh Food Access in Central Hanoi, Vietnam. 2017. Available online: https://www.researchgate.net/publication/320471609_The_Sidewalk_Diet_street_markets_and_fresh_food_access_in_central_Hanoi_Vietnam (accessed on 27 May 2021).
- Thompson, J.; Stevenson, M.; Wijnands, J.S.; Nice, K.A.; Aschwanden, G.D.P.A.; Silver, J.; Nieuwenhuijsen, M.; Rayner, P.; Schofield, R.; Hariharan, R.; et al. A global analysis of urban design types and road transport injury: An image processing study. Lancet Planet. Health 2020, 4, e32–e42. [Google Scholar] [CrossRef] [Green Version]
- Mateo-Babiano, I.; Ieda, H. Street space sustainability in Asia: The role of the Asian pedestrian and street culture. J. East. Asia Soc. Transp. Stud. 2007, 7, 1915–1930. [Google Scholar]
- Triandis, H.C. Collectivism and individualism: Cultural and psychological concerns. In International Encyclopedia of the Social & Behavioral Sciences, 2nd ed.; Wright, J.D., Ed.; Elsevier: Oxford, UK, 2015; pp. 206–210. [Google Scholar]
- Gibert, M.; So’n, P.T. Understanding the Vietnamese Urban Fabric from The Inside. Available online: https://www.iias.asia/the-newsletter/article/vietnamese-urban-fabric (accessed on 10 April 2021).
Figure 1.
Spatial characteristics of the five urban typologies.

Figure 2.
Distribution of the five urban typologies and study sites.

Figure 3.
Z-score of individual and total combined urban design qualities for five urban typologies.
Figure 3.
Z-score of individual and total combined urban design qualities for five urban typologies.

Figure 4.
Correlation between number of pedestrians on the street and total combined urban design quality score of the street.
Figure 4.
Correlation between number of pedestrians on the street and total combined urban design quality score of the street.


Table 1.
Mean recorded values and scores for individual items and urban design qualities for five urban typologies and Hanoi.
Table 1.
Mean recorded values and scores for individual items and urban design qualities for five urban typologies and Hanoi.
| Urban Typologies and Individual Items | Urban Typologies | Hanoi | |||||||||||
|---|---|---|---|---|---|---|---|---|---|---|---|---|---|
| Urbanized Village Area | Collective Housing Quarter | Ancient Quarter | French Quarter | New Urban Area | |||||||||
| Mean Value | Mean Score | Mean Value | Mean Score | Mean Value | Mean Score | Mean Value | Mean Score | Mean Value | Mean Score | Mean Value | Mean Score | ||
| Imageability | 1. number of courtyards, plazas and parks a | 0.38 | 0.15 | 4.00 | 1.64 | 0.63 | 0.26 | 1.63 | 0.67 | 1.88 | 0.77 | 1.70 | 0.70 |
| 2. number of major landscape features a | 0.00 | 0.00 | 0.25 | 0.18 | 0.13 | 0.09 | 0.13 | 0.09 | 0.00 | 0.00 | 0.10 | 0.07 | |
| 3. proportion of historic building frontage a | 0.00 | 0.00 | 0.00 | 0.00 | 0.16 | 0.16 | 0.34 | 0.33 | 0.00 | 0.00 | 0.10 | 0.10 | |
| 4. number of buildings with identifiers a | 24.75 | 2.72 | 14.63 | 1.61 | 53.63 | 5.90 | 19.00 | 2.09 | 11.88 | 1.31 | 24.78 | 2.73 | |
| 5. number of buildings with nonrectangular shapes a | 24.13 | 1.93 | 13.75 | 1.10 | 28.13 | 2.25 | 21.00 | 1.68 | 25.75 | 2.06 | 22.55 | 1.80 | |
| 6. presence of outdoor dining b | 1.00 | 0.64 | 1.00 | 0.64 | 1.00 | 0.64 | 1.00 | 0.64 | 0.38 | 0.24 | 0.88 | 0.56 | |
| 7. number of people b | 12.38 | 0.25 | 11.66 | 0.23 | 22.00 | 0.44 | 11.66 | 0.23 | 5.28 | 0.11 | 12.59 | 0.25 | |
| 8. noise level a | 3.50 | −0.63 | 3.13 | −0.56 | 4.13 | −0.74 | 3.50 | −0.63 | 2.25 | −0.41 | 3.30 | -0.59 | |
| Total Imageability score | 7.50 | 7.28 | 11.43 | 7.54 | 6.52 | 8.05 | |||||||
| Enclosure | 1. number of long sightlines a | 0.25 | −0.08 | 1.25 | −0.39 | 1.63 | −0.50 | 1.38 | −0.43 | 2.88 | −0.89 | 1.48 | −0.46 |
| 2a. proportion of street wall b | 0.79 | 0.57 | 0.68 | 0.49 | 0.86 | 0.62 | 0.75 | 0.54 | 0.58 | 0.41 | 0.73 | 0.53 | |
| 2b. proportion of street wall c | 0.81 | 0.76 | 0.69 | 0.65 | 0.86 | 0.81 | 0.70 | 0.66 | 0.61 | 0.58 | 0.74 | 0.69 | |
| 3a. proportion of sky ahead | 0.25 | −0.36 | 0.36 | −0.51 | 0.36 | −0.51 | 0.43 | −0.60 | 0.68 | −0.96 | 0.42 | −0.59 | |
| 3b. proportion of sky across | 0.08 | −0.16 | 0.11 | −0.25 | 0.03 | −0.07 | 0.11 | −0.23 | 0.21 | −0.47 | 0.11 | −0.24 | |
| Total Enclosure score | 3.30 | 2.55 | 2.91 | 2.51 | 1.24 | 2.50 | |||||||
| Human Scale | 1. number of long sightlines a | 0.25 | −0.19 | 1.25 | −0.93 | 1.63 | −1.20 | 1.38 | −1.02 | 2.88 | −2.13 | 1.48 | −1.09 |
| 2. proportion of windows at street level b | 0.45 | 0.50 | 0.65 | 0.72 | 0.88 | 0.96 | 0.53 | 0.58 | 0.29 | 0.32 | 0.56 | 0.61 | |
| 3. average building height b | 9.34 | −0.03 | 14.57 | −0.04 | 9.55 | −0.03 | 10.11 | −0.03 | 13.56 | −0.04 | 11.43 | −0.03 | |
| 4. number of small planters b | 3.63 | 0.18 | 13.00 | 0.65 | 6.13 | 0.31 | 5.88 | 0.29 | 4.88 | 0.24 | 6.70 | 0.34 | |
| 5. number of street furniture and other items b | 7.25 | 0.29 | 17.25 | 0.69 | 11.38 | 0.46 | 14.63 | 0.59 | 8.63 | 0.35 | 11.83 | 0.47 | |
| Total Human Scale score | 3.36 | 3.70 | 3.10 | 3.02 | 1.35 | 2.91 | |||||||
| Transparency | 1. proportion of windows at street level b | 0.45 | 0.55 | 0.65 | 0.79 | 0.88 | 1.07 | 0.53 | 0.64 | 0.29 | 0.35 | 0.56 | 0.68 |
| 2. proportion of street wall b | 0.79 | 0.53 | 0.68 | 0.45 | 0.86 | 0.58 | 0.75 | 0.50 | 0.58 | 0.39 | 0.73 | 0.49 | |
| 3. proportion of active uses b | 0.53 | 0.28 | 0.91 | 0.48 | 0.89 | 0.47 | 0.59 | 0.31 | 0.22 | 0.12 | 0.63 | 0.33 | |
| Total Transparency score | 3.07 | 3.44 | 3.83 | 3.17 | 2.56 | 0.00 | 3.21 | ||||||
| Complexity | 1. number of buildings a | 48.88 | 2.44 | 17.63 | 0.88 | 55.00 | 2.75 | 23.25 | 1.16 | 30.25 | 1.51 | 35.00 | 1.75 |
| 2a. number of basic building colors a | 4.00 | 0.92 | 4.38 | 1.01 | 4.88 | 1.12 | 4.13 | 0.95 | 3.88 | 0.89 | 4.25 | 0.98 | |
| 2b. number of basic accent colors a | 7.88 | 0.95 | 10.75 | 1.29 | 11.88 | 1.43 | 10.25 | 1.23 | 7.00 | 0.84 | 9.55 | 1.15 | |
| 3. presence of outdoor dining b | 1.00 | 0.42 | 1.00 | 0.42 | 1.00 | 0.42 | 1.00 | 0.42 | 0.38 | 0.16 | 0.88 | 0.37 | |
| 4. number of pieces of public art a | 0.00 | 0.00 | 0.00 | 0.00 | 0.00 | 0.00 | 0.00 | 0.00 | 0.00 | 0.00 | 0.00 | 0.00 | |
| 5. number of people b | 12.38 | 0.37 | 11.66 | 0.35 | 23.88 | 0.72 | 11.66 | 0.35 | 5.28 | 0.16 | 12.97 | 0.39 | |
| Total Complexity score | 7.71 | 6.56 | 9.04 | 6.72 | 6.17 | 7.24 | |||||||
| Total urban design quality score | 24.95 | 23.53 | 30.32 | 22.95 | 17.84 | 23.92 | |||||||
Note: a: both sides, b: observer side, c: opposite side. Green boldface text: max. Red boldface text: min.
Table 2.
Associations between urban typologies and urban design qualities.
| Imageability | Enclosure | Human Scale | Transparency | Complexity | Total Score | |
|---|---|---|---|---|---|---|
| Ancient Quarter | 0.857 (p < 0.001) | −0.199 (p = 0.050) | −0.114 (p = 0.242) | 0.655 (p < 0.001) | 0.464 (p < 0.001) | 0.516 (p < 0.001) |
| Collective Housing Quarter | −0.052 (p = 0.470) | −0.385 (p < 0.001) | 0.146 (p = 0.136) | 0.321 (p = 0.001) | −0.433 (p < 0.001) | −0.146 (p = 0.105) |
| French Quarter | 0.017 (p = 0.811) | −0.409 (p < 0.001) | −0.151 (p = 0.125) | 0.087 (p = 0.348) | −0.360 (p < 0.001) | −0.190 (p = 0.001) |
| New Urban Area | −0.217 (p < 0.010) | −1.057 (p < 0.001) | −0.885 (p < 0.001) | −0.439 (p < 0.001) | −0.561 (p < 0.001) | −0.692 (p < 0.001) |
| R-Squared | 0.890 | 0.789 | 0.798 | 0.818 | 0.861 | 0.936 |
Note: Boldface font indicates that the coefficient is statistically significant. Urbanized Village Area is the reference urban typology.
Table 3.
The individual and the total combined score of urban design qualities for New York, Brisbane, Gurgaon and Hanoi.
Table 3.
The individual and the total combined score of urban design qualities for New York, Brisbane, Gurgaon and Hanoi.
| Urban Design Quality | New York (USA) | Brisbane (Australia) | Hanoi (Vietnam) | Gurgaon (India) |
|---|---|---|---|---|
| Imageability | 3.58 | 4.68 | 8.05 | 10.01 |
| Enclosure | 3.06 | 2.09 | 2.5 | 0.93 |
| Human Scale | 2.93 | 3.21 | 2.91 | 1.69 |
| Transparency | 2.66 | 3.28 | 3.21 | 2.84 |
| Complexity | 4.81 | 4.43 | 7.24 | 10.07 |
| Total score | 17.04 | 17.69 | 23.92 | 25.54 |
Publisher’s Note: MDPI stays neutral with regard to jurisdictional claims in published maps and institutional affiliations. |
© 2021 by the authors. Licensee MDPI, Basel, Switzerland. This article is an open access article distributed under the terms and conditions of the Creative Commons Attribution (CC BY) license (https://creativecommons.org/licenses/by/4.0/).
Share and Cite
MDPI and ACS Style
Ho, T.P.; Stevenson, M.; Thompson, J.; Nguyen, T.Q. Evaluation of Urban Design Qualities across Five Urban Typologies in Hanoi. Urban Sci. 2021, 5, 76. https://0-doi-org.brum.beds.ac.uk/10.3390/urbansci5040076
AMA Style
Ho TP, Stevenson M, Thompson J, Nguyen TQ. Evaluation of Urban Design Qualities across Five Urban Typologies in Hanoi. Urban Science. 2021; 5(4):76. https://0-doi-org.brum.beds.ac.uk/10.3390/urbansci5040076
Chicago/Turabian StyleHo, Thanh Phuong, Mark Stevenson, Jason Thompson, and Tuan Quoc Nguyen. 2021. "Evaluation of Urban Design Qualities across Five Urban Typologies in Hanoi" Urban Science 5, no. 4: 76. https://0-doi-org.brum.beds.ac.uk/10.3390/urbansci5040076