A Needle in A Haystack: Tracing Bivalve-Associated Viruses in High-Throughput Transcriptomic Data


1
Department of Biology, University of Padua, 35121 Padua, Italy
2
Department of Applied Mathematics and Statistics, Stony Brook University, Stony Brook, NY 11794-5000, USA
3
School of Marine and Atmospheric Sciences, Stony Brook University, Stony Brook, NY 11794-5000, USA
*
Author to whom correspondence should be addressed.
Viruses 2019, 11(3), 205; https://0-doi-org.brum.beds.ac.uk/10.3390/v11030205
Submission received: 1 February 2019
/
Revised: 25 February 2019
/
Accepted: 25 February 2019
/
Published: 1 March 2019
(This article belongs to the Special Issue Virus Bioinformatics)
Abstract
:Bivalve mollusks thrive in environments rich in microorganisms, such as estuarine and coastal waters, and they tend to accumulate various particles, including viruses. However, the current knowledge on mollusk viruses is mainly centered on few pathogenic viruses, whereas a general view of bivalve-associated viromes is lacking. This study was designed to explore the viral abundance and diversity in bivalve mollusks using transcriptomic datasets. From analyzing RNA-seq data of 58 bivalve species, we have reconstructed 26 nearly complete and over 413 partial RNA virus genomes. Although 96.4% of the predicted viral proteins refer to new viruses, some sequences belong to viruses associated with bivalve species or other marine invertebrates. We considered short non-coding RNAs (sncRNA) and post-transcriptional modifications occurring specifically on viral RNAs as tools for virus host-assignment. We could not identify virus-derived small RNAs in sncRNA reads obtained from the oyster sample richest in viral reads. Single Nucleotide Polymorphism (SNP) analysis revealed 938 A-to-G substitutions occurring on the 26 identified RNA viruses, preferentially impacting the AA di-nucleotide motif. Under-representation analysis revealed that the AA motif is under-represented in these bivalve-associated viruses. These findings improve our understanding of bivalve viromes, and set the stage for targeted investigations on the specificity and dynamics of identified viruses.
1. Introduction
Viruses are the most abundant biological entity on the Earth, likely outnumbering bacteria and eukaryotic cells [1], with the oceans being the most likely richest reservoir of virus biodiversity [2]. The only constraint that viruses have is the need for a host for their replication, either to take advantage of the host replication machinery, or to hijack the genome to freely replicate as selfish genetic elements [3]. The evolutionary success of viruses is supported by highly dynamic genomes, which can undergo punctual changes or integration events that enable the circumvention of host immune defenses, the capture of new genes, and even host switching, among other events [4,5]. The frequent exchange of genetic material is evident in the highly variable sizes of viral genomes. While RNA viruses seem to have a ~32 kb size constraint [6], the genomes of DNA viruses can be uncommonly large, with the giant Mimiviruses genomes being in the order of megabases and far exceeding the few kilobases of circular single stranded DNA genomes of cress viruses [7,8]. The presence of an antiviral system in every living organism further supports the global distribution of viruses [9], although their biological roles go beyond pathogenicity [10]. In fact, viruses are responsible for selective pressures causing evolutionary transitions [11] as they drive the dynamics of host populations and interfere with biological invasions [12]. The gene flux from viruses to eukaryotic organisms is suggested to drive the long-term evolution of host genomes [13]. Conversely, the evolutionary pressure of host antiviral defenses shapes viral genomes in a never-ending arms race [14,15,16,17]. According to the sequence data currently available, the viruses identified so far represent a numerically insignificant portion of viral biodiversity, possibly no more than 1% of the extant viruses [1,18]. Thanks to an unprecedented level of sensitivity and accuracy, high-throughput sequencing (HTS) has become the gold standard for viral discovery and for advancements in the characterization of viral metagenomes [19,20], although most of the so-generated viral sequences remain “unclassified” due to uncertainty about authentic virus hosts. As viruses are mostly hidden in the host nucleic acids, and an unusually high sequencing coverage would be necessary to allow their detection, the current representations of the extant virosphere are fragmentary, and they crucially depend on sample preparation strategy, sequencing technology, and sequencing depth [21]. Nevertheless, DNA and RNA sequencing datasets often contain viral sequences, and committed analyses can provide snapshots of the viromes associated with a given organism [5,22].
Although it is steadily expanding, virus discovery and the study of antiviral immunity in invertebrates is biased towards a few model organisms and arthropods of economic and medical importance [23]. In this respect, highly speciose and ecologically important groups like mollusks, and the Lophotrochozoa more widely, remain largely unstudied, leaving huge taxonomic gaps in our knowledge. Since their initial diversification in the early Cambrian (Paleozoic Era), bivalves successfully colonized a variety of aquatic environments, from cold-water seas, to freshwater basins and deep anoxic vents, with some species showing an invasive behavior [24,25,26,27]. A number of bivalve species have been investigated for their peculiar adaptation strategies [28], innate immune systems [29], and bio-inspired applications [30] as well as for their use as models for human health [31]. Today, few bivalve genome drafts are available, whereas more than 2,100 transcriptomic datasets have been deposited in public databases (NCBI SRA archive, accessed in November 2018). So far, very few viruses of bivalve mollusks have been described, mainly those that have major negative economic impacts on farmed species. In particular, a herpesvirus (Ostreid herpesvirus-1, OsHV-1) associated with temperature-related oyster mortalities [32] has become a pressing issue for the production sector, and today, OsHV-1 and its variants are described in numerous studies [33,34,35,36,37,38]. Viruses belonging to the Papovaviridae and Iridoviridae families have been associated with bivalve diseases, whereas a few members of the Togaviridae, Reoviridae, Birnaviridae, and Picornaviridae virus families have been reported without evidence of associated disease [39,40]. Until the advent of HTS technologies, the identification of these viruses was mainly based on electron microscopy, and seldom validated by molecular studies [41].
Virome discovery through RNA HTS is challenging when applied to bivalve samples. According to the ability to detect minute quantities of viral nucleic acids, HTS also catches sequences that possibly derive from tissue surface contamination, or from the simple transit of another virus host in bivalve tissues [42,43]. The identification of giant viruses and human viruses in bivalve samples mainly accumulated in the gills and gut by filter-feeding [44,45,46], and the presence of an algal virus (Heterosigma akashiwo RNA virus-1) in the gills of both Crassostrea gigas and Mytilus galloprovincialis growing up in association [47], exemplify the importance of developing new approaches for assigning a virus to its authentic host. Ecological role and economic importance, peculiar genome features, differential susceptibility to pathogens, as well as their tendency to accumulate microbes highlights filter-feeding bivalves as fascinating models for virus–host interaction studies. The objective of this work was to explore the diversity and distribution of bivalve RNA viruses through the analysis of available RNA-seq samples. To do so, we performed an extensive analysis of the HTS transcriptome data of bivalves, we recovered bivalve-associated RNA viruses, and we traced their distribution over many bivalve RNA-seq samples. Moreover, we investigated how different RNA selection methods applied during library preparation can affect the performance of viral-oriented HTS analysis. Finally, we tested two different in silico approaches for assigning bivalve-associated viruses to their genuine hosts.
2. Materials and Methods
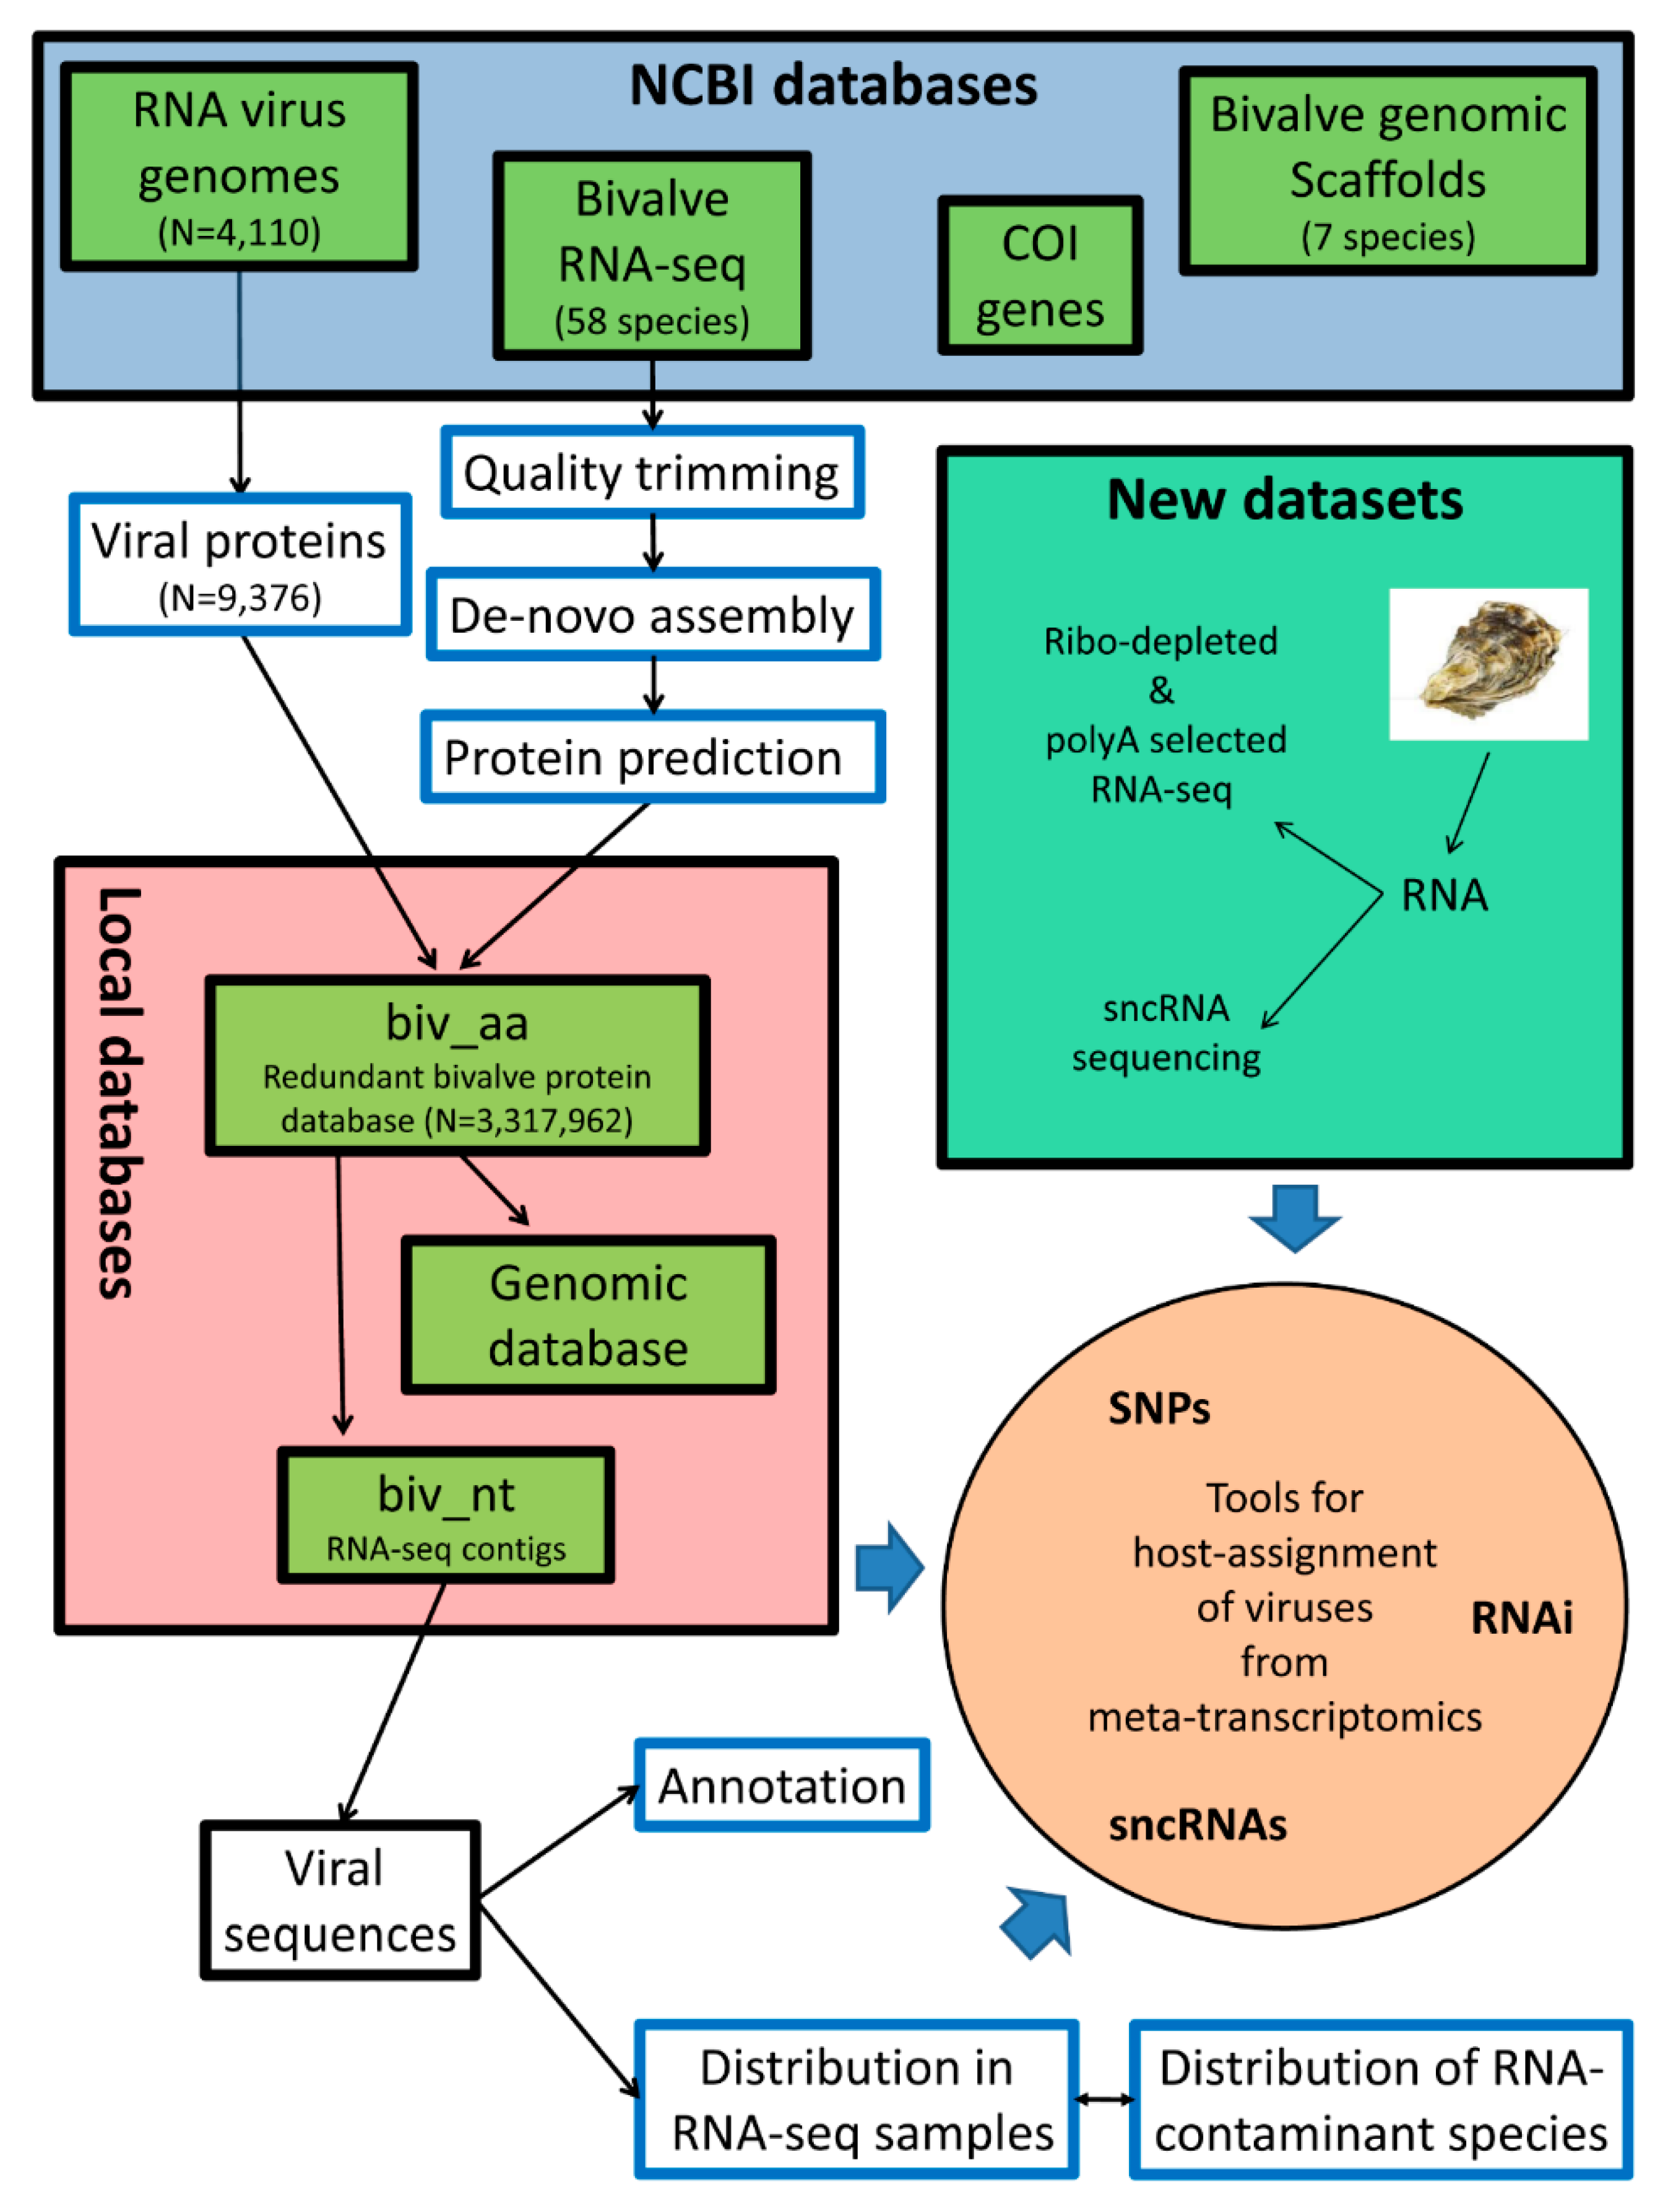
The overall analysis pipeline is summarized in Figure 1, and it is detailed through the following paragraphs. The analyses are based either on the available RNA-seq datasets, or on newly produced data that we submitted to the NCBI SRA archive (the corresponding IDs are cited in the text and tables).
2.1. Data Retrieval
Public sequence datasets were retrieved from NCBI databases in April 2017. A total of 7125 viral genomes, including 3008 RNA viruses, were downloaded from the NCBI Genome database. Additionally 1102 invertebrate-associated RNA virus genomes were downloaded from the NCBI nucleotide database [43,47] for a total of 4110 genomes of RNA viruses. RNA-seq samples referring to 58 bivalve species and four pooled bivalve or gastropod meta-transcriptomic samples were obtained from NCBI SRA archives. Genome drafts of five bivalve species (Bathymodiolus platifrons, C. virginica, Mizuhopecten yessoensi, Modiolus philippinarum, and M. galloprovincialis) were downloaded from the NCBI WGS database, while C. gigas and Pinctada fucata genomes were obtained from EnsembleMetazoa release35 and from [48], respectively. Supplementary Table S1 summarizes the sequence datasets used in this work. Cytochrome C Oxidase Subunit I (COI) sequences were downloaded from the NCBI nucleotide archive, and their redundancies were reduced using cd-hit-est [49], applying a cut-off of 95% similarity. In order to compare two RNA selection methods for their aptitudes of viral read recovery, we retrieved two RNA-seq datasets obtained from a single C. gigas sample (described elsewhere, SRR8237210 and SRR7636587 for polyA and ribo-depleted data, respectively).
2.2. Transcriptome de novo Assembly, ORF Prediction, and Protein Domain Mapping
RNA-seq reads were trimmed for the presence of adaptor sequences, and for quality, using TrimGalore! [50], allowing for a maximum of two ambiguous bases and a quality threshold of PHRED20. Trimmed reads were de novo assembled using CLC Genomic Workbench v.10 (Qiagen, Hilden, Germany), setting automatic word and bubble sizes, and a minimal contig length of 200 bp. The resulting contigs were subjected to open reading frame (ORF) prediction, using the transdecoder tool included in the Trinity suite [51], applying a minimal ORF length of 100 codons. HMMer v.3.1 [52] was used to identify the presence of conserved protein domains (Pfam-A models, v.29 [53], applying a cut-off E-value of 10−5.
2.3. Identification of Viral Sequences
A redundant BLAST database [54] was built, using the predicted proteins obtained from all of the transcriptomic assemblies of bivalve species. All the annotated ORFs encoded by 4110 RNA virus genomes were translated into amino acids, and the resulting 9376 protein sequences were used as blast queries against the bivalve database (blastp, cut-off E-value 10−50). Moreover, all the bivalve-derived protein sequences encoding a viral RNA-dependent RNA-polymerase (vRdRp) domain were selected. A vRdRp was identified by using six different PFAM Hidden Markov Models, corresponding to IDs: PF00680, PF00978, PF00998, PF02123, PF07925, and PF04197. Bivalve genome scaffolds were used to compose a genomic database to discriminate between host-encoded and viral sequences. Sequences identified from the redundant protein database, and from the search of the vRdRp domains, and showing no matches against bivalve genomes, were further processed to reduce the redundancy, applying a cut-off of 90% of similarity (cd-hit). The resulting protein sequences were used to recover the corresponding nucleotidic contigs from the initial transcriptome assemblies and they were considered as complete or partial genomes of RNA viruses. For the purposes of this paper, a viral genome was considered to be “nearly complete” if it was composed of a unique contig that was longer than 5 kb and encoding at least one complete ORF.
2.4. Distribution of Viruses among RNA-Seq Samples, Expression Analysis, and SNP Calling
The amount of reads mapping to the “nearly complete” viral genomes in selected RNA-seq samples was determined by stringent mapping of the trimmed reads on the viral genome sequences (0.9 both for length and similarity fraction, CLC mapper tool). For a selection of informative RNA-seq samples, the total read counts were used to calculate the percentage of reads mapping to each virus over the total numbers of reads of the sample, thus providing a comparison of the amount of viral RNA between RNA-seq samples that was not biased by different sequencing depths or read layouts. To obtain the expression profiles of selected oyster RNAi-related genes, 183 RNA-seq datasets (Supplementary Table S1) were mapped onto C. gigas gene models [55] and used to compute expression values such as transcripts per million (TPM) [56]. RNA-seq data were also used to call single-nucleotide variations (single-nucleotide polymorphisms, SNPs) across viral genomes. Specifically, to detect genuine SNPs, the trimmed reads were mapped onto the “nearly complete” viral genomes, setting 0.5 and 0.8 for the length and similarity fractions, respectively. A SNP was called if it was present in at least 1% of the locally aligned reads after using the following parameters: minimum average quality of the five surrounding bases, PHRED30; minimum required coverage, 50×; minimum required count, 5. The SNPs were annotated according to the neighbor base.
2.5. Estimation of the Contamination Levels of RNA-Seq Samples
To provide an estimation of the fraction of reads that were not related to the declared biological sample (as indicated in the SRA details), we mapped the RNA-seq reads onto a collection of 205,357 non-redundant COI sequences. Reads were mapped applying a similarity fraction of 0.8, over 0.8 of the read length (CLC mapper tool) and the TPM values were computed. Similarly, to estimate the presence of known viruses among the RNA-seq datasets, the amount of reads mapping to the 7125 virus genomes obtained from NCBI was also computed (in this case, by applying 0.9 and 0.9 for the length and similarity fractions, respectively).
2.6. Small RNA Sequencing and Reads Analysis
The fraction of small RNAs (<200 bp) of the C. gigas sample that was used to prepare the paired polyA and ribo-depleted libraries were extracted using the Mirvana kit (Thermofisher, Waltham, MA, USA). RNA was quantified by using a Qubit fluorimeter instrument, and the RNA size profile was determined with an Agilent small RNA chip (Agilent, Santa Clara, CA, USA). Library preparation and sequencing (PE150) was outsourced and carried out on an HiSeq Illumina platform (Admera Health, New York, NY, USA), and submitted to the NCBI SRA archive, under the accession ID SRR8587800. The paired reads were trimmed for quality, and for the presence of adaptors, as described for mRNA reads, and the correctly paired reads were joined into fragments. The resulting clean fragments, in a length range of 15–50 nt, were used for the detection of viral-derived small RNAs (vsRNAs) by direct mapping on the identified viral contigs or by using the VirusDetect pipeline [57]. To discriminate between genuine vsRNAs versus RNA degradation products, we correlated the number of mapped sRNA reads with the viral expression levels.
2.7. Analysis of Viral Genome Editing
The genomes of the RNA viruses retrieved from NCBI were analyzed for the distribution of the frequency of di-nucleotides as hallmarks of the virus genome fitness (i.e., adaptive genome changes). To look for these adaptive genome changes, we used the cytidine deaminase under-representation reporter (CDUR) [58]. Given the user-defined motifs and an input coding sequence, CDUR effectively utilizes a permutation test to determine whether the given motif is significantly depleted in the input sequence than one would expect by chance (details below). The two main metrics that are analyzed are: 1. the “below” metric, which determines whether the number of occurrences of a motif is significantly fewer than expected, and 2. the “repTrFrac” metric, which determines the ratio of motifs that would incur a non-synonymous transition mutation, against the total number of those motifs in the sequence, which is significantly fewer than expected. Both of these metrics are determined by shuffling the coding sequence at the third position of each codons, so that the underlying amino acid sequence is unchanged. We chose this method of shuffling as it also preserves the GC content of the input sequence, as changing the GC content has been reported to yield biased results [14]. This shuffling is repeated 1000 times; in each shuffled sequence, we counted the number of user-defined motifs (“below” metric), as well as the ratio of nonsynonymous transition mutations that occur at those motifs, compared to the number of motifs (“repTrFrac” metric). In both cases, we determined the percentage of shuffled sequences with fewer motif counts and repTrFrac counts than that of the input, to yield a statistical p-value. A sequence with a p-value of <0.05 is said to be under-represented in that motif metric, whereas a p-value of >0.95 is said to be over-represented in that motif metric (see Figure 2 in [58]).
A particularly interesting case is when, for a given motif, a sequence is under-represented in the “below” metric, and is over-represented in the “repTrFrac” metric for that motif. This suggests that this sequence has maximally tried to reduce the number of occurrences of that motif, as any further reduction would result in amino acid changes, which may negatively impact that coding sequence. Recent studies have shown that certain gammaherpesvirus may be under such pressures [59]. In this case, the sequence is considered to have attained maximal under-representation. We performed CDUR analysis on 3872 RNA viral genomes with a known host obtained from NCBI (Supplementary Table S1), as well as on the newly recovered “nearly complete viral genomes” presented in this paper.
2.8. Phylogenetic Analysis
3. Results
We produced transcriptomic assemblies of 58 bivalve species, and we used all of the predicted proteins to produce a redundant BLAST database, including more than 3 million entries (hereinafter called biv_aa). To identify the putative virus sequences associated with the analyzed RNA-seq samples from different bivalve species, we queried biv_aa with 9376 protein sequences belonging to 4110 known RNA virus genomes (Supplementary Table S1). We extracted additional viral sequences from the same database by searching all six available PFAM domains of viral RNA-dependent RNA polymerase (vRdRp). In the absence of a conserved viral gene, we used these domains to identify RNA viruses, since vRdRp is needed for the transcription of the viral genome during productive virus replication [63,64]. For the BLAST searches, we applied a conservative E-value of 10−50, and to further limit false positive results, we discharged the BLAST matches with less than five hits. Moreover, we screened all of the positive hits against a database composed of available genomic scaffolds of bivalve species, to remove genomically encoded sequences (Supplementary Table S1). As a result, 708 biv_aa entries showed a genuine similarity to viral sequences, and the conserved domains included in these proteins further sustained their viral origin, since we found 253 vRdRp, 80 CRPV capsid protein like, 73 RNA helicase, 78 Dicistroviridae minor capsid protein, and 69 Picornavirus capsid protein domains (Supplementary Table S2). The removal of similar sequences (>90% of similarity) resulted in 413 unique sequences. Most of the redundant sequences were found in transcriptomes of the same bivalve species, either in RNA-seq samples originating from the same geographical location, as in the case of M. galloprovincialis or C. gigas samples from Goro (Italy), or obtained from geographically unrelated samples of the same species, although few exceptions are present, and they are discussed below. Despite most sequences being retrieved by BLAST searches using viral sequences as queries, they showed a limited similarity to known viruses (Supplementary Table S2). We could confidently assign only 15 sequences (3.6% of the total) to 11 known viruses (BLASTn with an E-value lower than 10−100 and identity >95%), namely, six bivalve-associated RNA viruses from the lagoon of Goro (Italy), two viruses associated with marine invertebrates from China, plus three other RNA viruses, the algal Heterosigma akashiwo RNA virus, the plant virus Zygocactus virus X, and the Sacbrood virus (Supplementary Table S2).
3.1. Effect of RNA-Seq Library Preparation Protocols on the Detection of Viral Sequences
In order to evaluate the effect of the RNA selection method applied during library preparation on the recovery of viral reads, we analyzed two different datasets, each of them derived from a single biological sample by using alternative RNA selection approaches: polyA RNA selection or ribosomal RNA depletion. The first dataset was prepared specifically for viral meta-transcriptomic analysis, starting from two biological samples (named “mix of bivalves”, sample ID: SAMN04625952 and “mix of gastropods”, sample ID: SAMN04625958 [43]). We analyzed a second dataset obtained from a single C. gigas specimen naturally infected with OsHV-1, using the same two RNA selection methods (sample ID: SAMN09760011). The analysis of the four meta-transcriptomic samples showed that, despite a considerable variability in the numbers of raw reads, the assembled contigs, as well as the number of predicted proteins yielded somewhat comparable values, except for SRR3401755, for which only few proteins could be predicted. For these datasets, polyA-selection allowed for the recovery of a higher ratio of viral to total proteins, particularly for the bivalve samples (Table 1). On the contrary, the analysis of the oyster dataset clearly showed the opposite trend in terms of viral read recovery, since we identified 46 contigs encoding a vRdRP domain in the ribo-depleted sample, compared to 10 in the polyA selected one. Although five out of the 10 polyA viral contigs were also found in the ribo-depleted dataset, the longer contig was always generated from the ribo-depleted dataset.
3.2. Identification of “Nearly Complete” Viral Genomes
As mentioned above, we putatively identified 413 viral protein sequences in 364 nucleotidic contigs, indicating that some contigs included more than one viral ORF. Theoretically, each contig can be considered as a viral genome, but if we compare their average length (1.39 kb) with the median lengths of the known RNA virus genomes (4.8 kb), a realistic assumption is that most of these represent incomplete genomes. For the purpose of this paper, we considered “nearly full-length viral genomes” as only being contigs that are longer than 5 kb and encoding at least one complete ORF. Therefore, we identified 26 contigs ranging in length between 5.4 and 9.7 kb as being “nearly complete viral genomes”, with 12 contigs encoding two ORFs corresponding to one replicative and one structural protein, while the other contigs (14) encoded a single ORF. These “nearly complete” viruses were named according to the species from which they were assembled (for instance, viruses identified in RNA-seq samples rich in viral sequences and referring to C. gigas, M. galloprovincialis, Ruditapes philippinarum, and M. edulis), whereas the unique viral contig found in the Elliptio complanata transcriptome (Table 2) was a complete viral genome (Elicom_virus1, 7106 nt). Notably, five nearly complete viral genomes sequences were identified in our ribo-depleted C. gigas RNA-seq sample. A total of 10 nearly complete viral genomes sequences could be assigned to a known virus, while other eight other sequences displayed an intermediate/low similarity to known viral sequences, and eight other different sequences referred to completely unknown viruses (the latter being associated with RNA-seq samples of C. gigas (4), E. complanata (1), M. galloprovincialis (1), Mizuhopecten yessoensis (1) and R. philippinarum (1)). In three viral genomes (Bivalve RNA virus G1, Rudphi virus 4, and Heterosigma akashiwo RNA virus-1) we could identify a polyA tail at the 3’ end of the sequence (Supplementary Figure S1). New sequences or sequences not fully matching the known viral genomes have been deposited in the NCBI database, and the accession IDs are reported in Table 2.
Subsequently, we evaluated the distribution of these 26 viruses in 226 RNA-seq samples, referring to their putative host species. Since the initial removal of redundant viral proteins suggested that some of these viruses are distributed over RNA-seq samples of multiple species, or they originated from samples that were possibly contaminated by pathogen-associated (e.g., Perkinsus spp.) RNAs, we included additional 24 RNA-seq samples in the distribution analysis, for a total of 250 datasets (Supplementary Table S3).
More than eight million reads were mapped onto the 26 viral genomes, with 862,949 and 7,092,869 reads that matched the Rudphi_virus3 and Rudphi_virus4 genomes, respectively. Twenty-two viral genomes were covered by at least 1000 reads, and 82 out of 250 RNA-seq samples included more than 1000 viral reads, and for this reason, they were selected for further consideration (Supplementary Table S3). In these 82 samples, the fraction of viral reads over the total ones per single virus usually did not exceed 1‰, except for Rudphi_virus4, which was covered by 30‰ of total reads for a larval R. philippinarum RNA-seq sample, and Rudphi_virus3, which reached 6‰ in one gastropod meta-transcriptomic sample (Table 2, and Supplementary Table S3). Few viruses showed a distribution over samples of different bivalves, e.g., Rudphi_virus4 (present in R. decussatus, R. philippinarum, C. cortenzinesis, C. gigas, and M. edulis samples) and Bivalve RNA virus G4 (present in C. gigas, M. galloprovincialis, and Atrina pectinata, Figure 2). Moreover, the occurrences of Rudphi_virus4 and Rudphi_virus3 go beyond bivalve species, since we traced them both in metagenomic gastropod samples. Since Rudphi_virus3 originated from a Perkinsus-infected sample of R. philippinarum, and it was traced in 12 clam datasets, we further investigated the presence of this virus in the publicly available Perkinsus transcriptome data (11 RNA-seq samples, Supplementary Table S1). As a result, some reads (3.9‰) of a sample of Perkinsus olseni trophozoites exposed to clam plasma (SRR2094558) were mapped to this virus, whereas, only 22 viral reads (<0.00001‰) were detected in the paired control (Supplementary Table S3). In contrast, other viruses were associated to the unique RNA sample, for instance, Elicom_virus1, Rudphi_virus5, and Mytedu_virus1 (Figure 2 and Supplementary Table S3).
3.3. Evaluation of Contaminant RNAs in RNA-Seq Samples
We mapped the reads of 16 selected RNA-seq samples to a collection of COI gene sequences, namely, C. gigas S15 (Ribo-0 and polyA), a “mix of gastropods” (Ribo-0 and polyA), one P. olseni, four R. decussatus, and seven R. philippinarum samples, since they included reads of multi-host viruses (Figure 2). We calculated the fraction of reads mapping to each COI entry over the total reads that mapped onto the whole COI dataset, and we used it as a tool to evaluate the contribution of biological contaminants in each RNA-seq dataset. As result, 159 COI entries showed at least 0.01% of mapped reads (Supplementary Table S4). Obviously, the first COI entry of each sample corresponded to the sequenced biological sample, thus confirming that the gastropod mix samples were composed of multiple species. For some samples, we observed additional COI entries with lower percentages, as in the two R. philippinarum samples with the highest numbers of viral reads (SRR391718-19), where we detected several contaminant species (56 and 57 COI entries with at least 1% of mapped reads, respectively). We noted the presence of a known bivalve-associated tunicate (Diplosoma listerianum) in 10 of the tested RNA-seq samples. Although the D. listerianum COI value is equal to 100% in the P. olseni sample, due to the absence of the Alveolata entries in the COI dataset, our analysis confirmed the absence of clam RNAs in the Perkinsus samples, including a high level of Rudphi_virus3. Intriguingly, both the Ribo-0 and polyA S15 datasets showed a low contamination of Lacconectus peguensis (Coleoptera).
3.4. Tools for the Host-Assignment of Bivalve-Associated Viruses
Our analysis further demonstrated that most of the transcriptome-derived viruses could be only tentatively assigned to a specific host, due to their occurrence in samples of even phylogenetically distant species. Under this context, the application of coverage cut-offs appeared to be an unreliable approach for host-assignment. Therefore, we investigated the feasibility of two alternative approaches for the host-assignment of bivalve-associated viruses obtained from transcriptomic data, as follows.
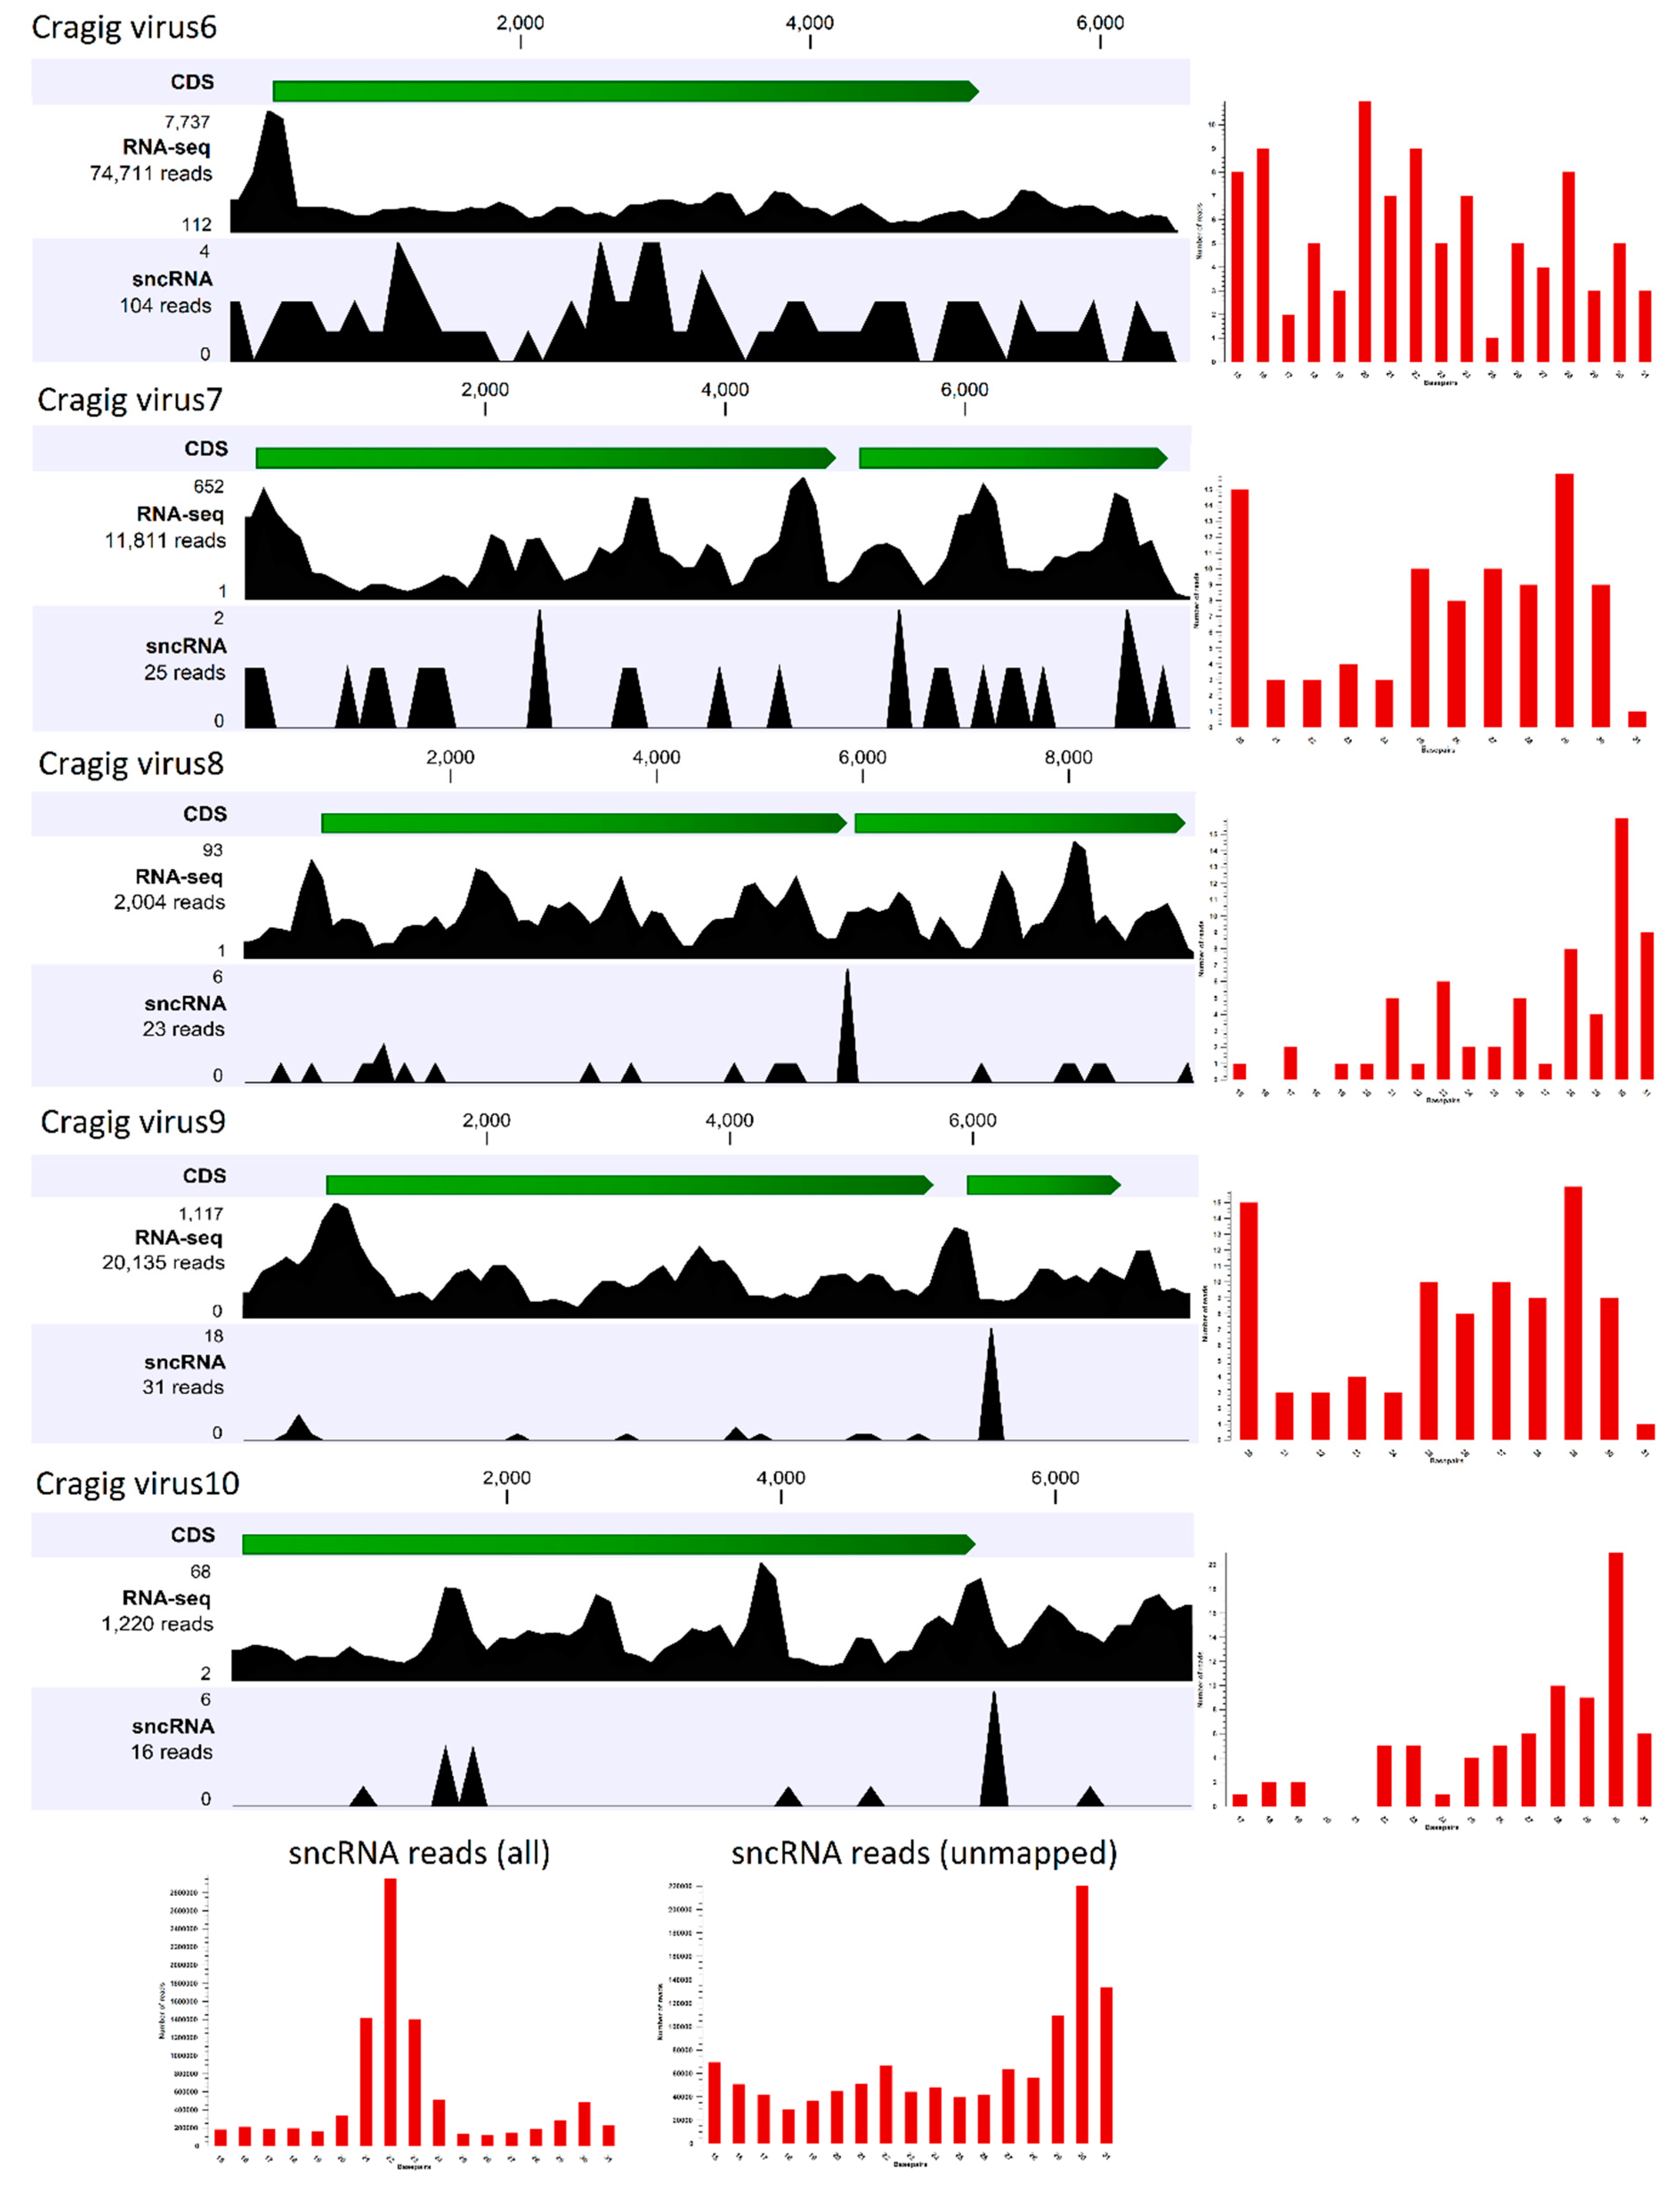
The first approach investigates the presence of virus-derived RNAi products (vsRNAs), and it is used to reconstruct full-length genomes of viruses infecting arthropods [65,66,67]. Since the antiviral role of the RNAi system of bivalves has never been demonstrated, we firstly investigated the expression patterns of selected RNAi-related genes (DICER, DROSHA, ARGONAUTE, PIWI, and RNA-dependent RNA polymerase) in 184 C. gigas RNA-seq samples, including some samples that were very rich in viral reads (Supplementary Table S1), to correlate the gene expression values with the presence of actively transcribing RNA and DNA viruses (Supplementary Table S5). We showed that RNAi-related genes are mostly expressed in the early developmental stages of oyster, when two PIWI and one Argonaute transcript showed remarkable expression levels (Supplementary Table S5, panel A), and PIWI1 was preferentially expressed in gonads (Supplementary Table S5, panel C). Apart from these samples, we reported a considerable expression of PIWI1 in three oyster gill samples, and in an additional sample referring to adductor muscles (SRR334286). While the latter result is difficult to explain, the expression of PIWI1 in the oyster gill samples from Goro (Italy) correlated with the presence of RNA viruses (see Figure 2, Supplementary Tables S3 and S5). Although at lower expression levels we reported that one RNA-dependent RNA polymerase transcript (EKC38952), belonging to a gene family typically expressed in the digestive gland, showed considerable expression levels in a few other samples, namely two out of three biological replicates of oysters infected with OsHV-1 (12 hours after infection, gills) and a spat sample highly infected by the same virus (Supplementary Table S5, panel B; sample G1). Taken together, these results provide limited evidence for an active role of some components of the RNAi pathway during viral infections in oyster. To further investigate the functionality of RNAi as antiviral system, we sequenced the fraction of small RNAs of the C. gigas sample used for library comparison, and found a high number of viral reads belonging both to DNA and RNA viruses (see Figure 2). Small non-coding RNA (sncRNA) sequencing yielded 10.1 million clean fragments in a length range of 15–50 nt. A total of 22,587 sncRNA reads matched the viral contigs identified in this sample, plus the OsHV-1 genome. However, we observed a positive correlation between the expressions of viral genes (using both Ribo-0 and polyA datasets) and the number of sncRNA reads that matched these ORFs (r2 of 0.994 and 0.996, respectively), suggesting that the reads mostly originated from RNA degradation products, instead of being genuine vsRNAs. We further analyzed the coverage of the sncRNA reads along the five “nearly complete viral genomes” originating from the S15 oyster ribo-depleted data. To do this, we mapped to the viral genomes the sncRNA reads that did not match to the oyster genome (1.436 M reads), and we calculated the size profiles of each of the mapped subsets (Figure 3). Notably, comparing the size profile of the whole sncRNA library with the profile of the sncRNA reads that did not match to the oyster genome, we showed that C. gigas sncRNA reads peaked at 21 nt (microRNAs), whereas the unmapped sncRNA reads peaked at 30 nt, indicative of their Piwi-interacting RNA (piRNA) nature. However, only 199 sncRNA reads mapped to one of the five viral genomes reconstructed by using the paired Ribo-depleted RNA-seq reads, and the size profiles showed a low enrichment of 29–30 nt reads with a distribution over the whole viral genome (Figure 3).
Moreover, we subjected the sncRNA reads to VirusDetect, a bioinformatics pipeline that is designed for the identification and reconstruction of viral genomes starting from short reads [57]. Although 169,970 sncRNA reads could be aligned to the viral reference database, and the tool could assemble 40 contigs, the 20–22 nt enrichment fraction was always low, and it did not support their vsRNA nature. According to the presence of numerous OsHV-1 reads in the paired RNA-seq data (the polyA and Ribo-0 datasets), VirusDetect identified several matches to the OsHV-1 genomes, but again, with a low 20–22 nt enrichment fraction.
The second approach that we tested leveraged on the identification of single-nucleotide modifications (SNPs) occurring specifically on viral transcripts produced by the action of host enzymes acting as antiviral defenses. Therefore, we attempted to select and count the subset of total SNPs generated by the host double-stranded RNA (dsRNA) editor enzyme adenosine deaminase acting on dsRNA (ADAR), which is assumed to specifically modify viral dsRNAs through A-to-I editing [68]. For each of the 26 viruses, we selected the RNA-seq sample with the higher number of reads, and we called these low-frequency SNPs; among the identified SNPs, we selected the ADAR-compatible ones (A-to-G). We identified 7569 SNPs located on viral coding sequences, and we classified 938 of them as being ADAR-compatible. Considering the 5’ position, we showed that 31% of the selected SNPs had an adenine at the flanking position, while 42% had a thymine (Figure 4a). Also, we searched for the evolutionary footprint of the action of ADAR on viral genomes in parallel. To do this, we used the CDUR tool [58] (see Materials and Methods) to determine under- or over-representation of a motif in a given sequence. Firstly, we used a training set of 3872 genomes of RNA viruses with a known host (Figure 4b and Supplementary Table S1). By analyzing the WA (W = A/T), AA, CA, GA, and TA motifs, the CDUR analysis showed that the TA motif is under-represented in 62.7% of the analyzed ORFs, while the AA, GA, and CA motifs are under-represented in 32.9, 8.1, and 1.5% of ORFs, respectively. Intriguingly, 4% of TA-under-represented ORFs maximized this under-representation, since additional variations will cause non-synonymous SNPs. Although we have to take into consideration that the viral representatives of each of the host classes are variable (Figure 4b), by linking the under-representation values with the viral host, we showed that most (>70%) of the algae, invertebrate, and vertebrate viruses reduced the TA motifs in their coding regions, while we observed moderate percentages (50–60%) for fungal and plant viruses, and lower percentages for bacterial and protozoa viruses (Figure 4c). Accordingly, the sequences with a maximization of the TA reduction were only a small fraction of the ones for fungal, plant, invertebrate, protozoa and vertebrate viruses (Figure 4c). Subsequently, we used the CDUR package to investigate the under-representation of the motif in the ORFs of the nearly complete RNA virus genomes described in this paper (Figure 4d). Consistent with the previous results, only the TA and AA motifs were statistically significantly under-represented. However, we did not observe ORFs with maximized TA reductions, while eight out of 11 ORFs showing AA being under-represented, significantly maximized the AA motif reduction (Figure 4d).
To better contextualize our results, and to assign the 26 “nearly complete viral genomes” to a viral group, we attempted a phylogenetic analysis based on the regions corresponding to the vRdRP domains (the phylogenetic tree can be visualized at [69], or as Supplementary Data S1). The phylogenetic tree obtained by the comparison of 2019 sequences of viral origins showed poor bootstrap support for most of the nodes, due to the high heterogenicity of the vRdDP sequences. Several of the sequences of the 26 viruses reported herein clustered with picoRNA-like viruses obtained from meta-transcriptomic surveys of mollusk species [43]. These viruses included Mytedu virus1, Myzyes virus1, Cragig virus1, Cragig virus2, Cragig virus3, Cragig virus6, Rudphi virus4, Rudphi virus5, and Bivalve RNA virus G3. Cragig virus 10 showed similarities with Bivalve hepelivirus G (herpes-like viral family, as defined by [43]). Although Cragig virus7 also clustered in a group of picoRNA-like viruses, it appeared to be separated from the other marine picoRNA-like sequences. Similarly, Cragig virus8 and Cragig virus9 formed a cluster including picoRNA-like viruses and one diatom virus (Chaetoceros socialis f. radians RNA virus1). None of our viruses grouped in clusters were characterized by the presence of abundant vertebrate viruses, while Mytcor virus1 was grouped with plant viruses, supporting its BLASY similarity to Pitaya virus X.
4. Discussion
Viruses can infect almost every living organism, and viral nucleic acids, either DNA or RNA, are often found when the host sequences are analyzed, making host RNA-seq samples suitable targets for viral discovery [21,70]. In this study, we analyzed bivalve RNA-seq data, and recovered both partial and complete RNA virus genomes, exploiting them to investigate the limits of meta-transcriptomics approaches oriented to viral discovery in bivalves. We identified 413 unique sequences of viral origin, most of them showing a limited similarity with known viruses, demonstrating that bivalve RNA sequencing allows for the identification of viral sequences. These included 26 nearly complete viral genomes. Although the factors that mostly influence the number of viral reads in an RNA-seq sample seem to be the strategies used for sample collection (e.g., the inclusion of water present in the shell cavity), we showed that the RNA selection method used during library preparation also contributed to the recovery of viral reads. For the samples prepared specifically for viral meta-transcriptomics, it was demonstrated that it is possible to recover multiple RNA virus genomes from single samples [43], while analyzing RNA-seq data (polyA-selected) originally designed for host expression analysis, we could identify at most, one complete viral genome per sample, over multiple (partial) viral genomes. Analyzing available meta-transcriptomic data, we found that polyA-enrichment is somewhat more effective than ribosomal-depletion in term of viral read recovery. However, we demonstrated that ribo-depletion is capable of higher performance, since we could reconstruct five nearly complete viral genomes from a RNA sample prepared for oyster expression survey. Arguably, polyA-selection would bias the virus sequence identification in the case of polyadenylated viral genomes (e.g., Picornavirales), although we could find evidence of the presence of polyA-tails only in three out of 26 viruses. Overall, our result strongly enforced the use of ribo-depletion for the preparation of RNA-seq libraries targeting viral discovery.
In agreement with a recent study reporting a wide host distribution of invertebrate viruses [43], we traced six out of 26 viruses in RNA-seq samples of different bivalve species, and we reported three bivalve-associated viruses that were very similar to viruses identified from gastropod or sponge meta-transcriptomics data [70,71]. The presence of identical viruses in different bivalve species, or even in phylogenetically distant invertebrates has two possible explanations: either these viruses infect a broad-range of animals, or the species hosting these viruses is shared by different (marine) animals. In support of the first hypothesis, even if invertebrates (arthropods in particular) are rich in viruses [72], strong evidence for host–virus co-evolution was rarely reported [17], and host jumping seems to be common for invertebrate viruses [5]. These attributes are in agreement with the new concepts of RNA virus phylogenesis that are inferred by viral metagenomics, suggesting extensive horizontal virus transfer events and a broad host range for protostome viruses [73]. The second hypothesis, i.e., that these viruses are hosted by an organism that is common in the marine environment, may be the easiest explanation for the presence of identical viruses in samples of different species, and can be further supported by the filter-feeding activity of bivalves. In fact, given the functions that are exerted by the gut and gills (the latter tissue is commonly used for RNA-seq experiments), contamination by RNA originating from waterborne bacteria, fungi, microalgae, or even microeukaryotes, is common in bivalve RNA-seq samples. This situation is well-depicted by one of the complete genomes that we recovered, the algal virus Heterosigma akashiwo RNA virus, which we traced in RNA-seq samples of co-cultured C. gigas and M. galloprovincialis, and even in an unrelated R. philippinarum sample. In this study, we exploited the COI reads to identify possible co-occurring organisms of the RNA-seq samples rich in viral reads. Although COI is not a universal gene marker, such an analysis can provide an immediate view of the purity of the samples [71]. In our study, the COI analysis did not identify a contaminant organism that completely matched the distributions of multi-species viruses. The contamination with D. listerianum RNA present in several bivalve RNA-seq samples confirmed the wide distribution of this fouling tunicate, but it could represent only a partial explanation for the multi-species distribution of Rudphi_virus3. The R. philippinarum sample, including 3% of Rudphi_virus4 reads was shown to be heavily contaminated by this tunicate, and by other non-bivalve species, but none of these species correlated with the distribution of this virus.
The determination of the host of meta-transcriptomics-derived viruses is likely one of the main challenges of viromics based on high-throughput data [23]. At the tissue level, both Transmission Electron Microscope (TEM) imaging of viral particles and in situ hybridization techniques are suitable to confirm host assignment only if infection intensity is sufficiently high, but they are unfeasible in the case of a very large number of samples, or for already-sequenced RNA-seq samples, such as the ones that we analyzed. Therefore, we investigated the feasibility of two alternative approaches that, exploiting the same RNA-seq samples used for viral discovery, can provide evidence that is useful for host-assigning bivalve-associated viruses. RNAi is used as an antiviral defense in plants, insects and nematodes, where efficient RNAi processing of viral genomes into virus-derived small RNAs (vsRNAs) perfectly matching to the original genome activates the RNA-induced silencing complex (RISC), which in turn catalytically marks viral sequences for degradation [74]. Differently from immuno-recognition mechanisms based on antibodies, RNAi is not impacted by viral mutations, and in C. elegans, it functions at nano-molar concentrations thanks to the amplification of vsRNA signals using RNA-dependent RNA polymerase [75]. Recently, an RdRP-independent mode of RNAi amplification has been reported in Drosophila, although the underpinning genetic mechanism is still unknown [76]. At least in worms, RNAi-based antiviral immunity can be generationally transmitted, and provide a kind of epigenetic immune-memory [77] that recalls the prokaryotic CRISPR-Cas-based adaptive immunity [78]. Recently, the identification of vsRNAs in a molluscan gastropod (Nucella lapillus) opens intriguing questions about the phylogenetic distribution of the antiviral defense system, and about the mechanism itself [71]. In insects, the analysis of the fraction of vsRNAs among sncRNA datasets allowed for an unbiased reconstruction of pathogenic viruses [65,66,67] but, although bivalve antiviral immunity partially resembles that of arthropods [79], the antiviral role of RNAi has never been directly demonstrated [80]. Our analysis suggested that RNAi exerted limited importance in antiviral defense in bivalves, since even if we showed that C. gigas PIWI1 is induced in RNA-seq samples containing RNA viruses and a more limited induction of one oyster RDR gene was consistent with the active transcription of OsHV-1, we were not able to clearly identify vsRNAs among sncRNA reads obtained from the same oyster sample, including abundant reads of RNA viruses and of OsHV-1 (dsDNA virus). Considering all of the viral contigs obtained from this RNA-seq dataset, our analyses strongly suggest that the sncRNA reads that mapped on these viral contigs are due to RNA degradation. Differently, looking only at the five complete viral genomes, we could not exclude that weak RNAi activity generated few vsRNAs. Improving the power of our analysis by increasing the coverage or by using chemical treatments to specifically enrich the sncRNA fraction [71], it would be possible to detect genuine vsRNAs, even in bivalves. In particular, the size profiles that we reported for the putative vsRNAs seemed to be biased through a non-Dicer production mechanism [65,71].
In vertebrates, the antiviral role of RNAi is superseded by the interferon pathway, which through the activation of interferon-stimulated genes (ISGs), promotes the recognition of viral-derived products and inhibits viral propagation. Among ISGs, powerful sequence editors like ADAR and apolipoprotein B mRNA editing enzyme, catalytic polypeptide-like (APOBEC), enzymatically mutate viral transcripts and genomes [81,82] by acting on target sites that are highly conserved throughout the metazoan evolution [14,83,84,85]. To counteract these host-mediated editing mechanisms, some viral genomes have evolved to reduce the frequency of sites that are more vulnerable to targeting by the host immune system [58,86,87]. Surprisingly, we demonstrated a diffuse under-representation of the “TA” motif in most of the known RNA viruses, although only few of them maximized this reduction, and we could not link this result to a specific class of hosts. A similar trend of TA under-representation was also present in the 26 viruses described herein, but for these viruses, we showed that there was a tendency to maximize the reduction of the AA motif. Similar to the 26 viruses reported herein, a similar trend characterizes, among others, the Antarctic picorna-like virus 1 and 3, Acute bee paralysis virus and Aphid lethal paralysis virus, which represented Picornavirales with a phylogenetic vicinity with some bivalve-derived viruses [47]. SNP analysis did not highlight a predominant fraction of ADAR-compatible variations over the total SNPs in the 26 viruses. Arguably, CDUR analysis only determined under-/over-representation, and the possible role of ADAR as source of these shifts should be confirmed by dedicated experiments.
Overall, This study underlines the heterogeneity and variability of RNA viruses that are associated with marine mollusks, and the limited data that is available on environmental RNA viruses. While the simultaneous analysis of viral products, antiviral host defense processes, and products in the RNA-seq samples could support host assignment, this alone is not enough when dealing with suspension-feeders that are able to accumulate environmental microbes, and their viral symbionts. Given the growing body of knowledge on the role of viruses in host fitness, targeted investigations aimed at unraveling the diversity of “genuine” bivalve viruses are needed for a better understanding of factors affecting the health and well-being of these ecologically- and economically-important species.
Data availability
Short RNA-sequencing reads have been deposited in the NCBI SRA archive with accession ID SRR8587800, as part of the SRA project PRJNA484109.
Supplementary Materials
The following are available online at https://0-www-mdpi-com.brum.beds.ac.uk/1999-4915/11/3/205/s1, Supplementary Table S1. Summary of the sequence data used for this work. 1. Genome data of bivalves. Species name, order, genome status and source are reported. 2. Transcriptome data. Class, Organism abbreviation, project ID (SRA archive), species name and order, sample origin, tissue, read layout, and number of predicted CDS sequences are reported. 3. C. gigas transcriptome data used for RNA-seq expression analysis. Project and SRR IDs, description and millions of reads are reported. 4. Viral genomes. NCBI ID, genome size, virus name, and taxonomical classification are reported. Supplementary Table S2. Annotation of the 413 viral sequences. The E-value, accession, description, and identity of the first BLAST match are reported, as well as the PFAM domain identified on these sequences (region, E-value, PFAM accession, and name). Supplementary Table S3. Virus distribution over 250 RNA-seq samples. The number of reads mapping to the 26 viral genomes are reported for 250 RNA-seq samples. The 82 samples, including more than 1000 viral reads are highlighted in red. Supplementary Table S4. COI mapping results. Mapped reads (reported as per millions) for 16 RNA-seq samples on COI entries (only the entries with at least 0.01 % of mapped reads are reported). Supplementary Table S5. Expression data of 10 RNAi-associated genes in oyster RNA-seq samples. Expression data are reported as TPM. Gene ID, description, and RNA-seq sample IDs, grouped per experimental treatment, are reported. (Panel A-C) Amount of OsHV-1 reads or RNA virus reads are depicted as blue or red dots, respectively, and referred to a secondary log10 bar scale (on the right of each graph). Expression patterns of RNAi-associated genes in oyster RNA-seq samples. Supplementary Figure S1. Genome construction of the 26 “nearly complete viral genomes” described in this work. ORFs are depicted as green arrows, and polyadenylation tails as black boxes. Supplementary Data S1. Phylogenetic tree of vRdRP regions in nexus format.
Author Contributions
Conceptualization, P.V. and B.A.; Data curation, U.R.; Formal analysis, U.R. and M.S.; Funding acquisition, P.V.; Methodology, U.R. and M.S.; Resources, P.V.; Writing—original draft, U.R. and B.A.; Writing—review & editing, U.R., P.V. and B.A.
Funding
This research was supported by grants from the EU Horizon 2020 research and innovation project VIVALDI (GA No. 678589) to P.V., and from the National Science Foundation (IOS-1656753) and New York Sea Grant (R/XG-24) to B.A. U.R. was supported by a biennial grant UNIPD-BIRD 168432.
Conflicts of Interest
The authors declare no conflict of interest.
References
- Simmonds, P.; Adams, M.J.; Benkő, M.; Breitbart, M.; Brister, J.R.; Carstens, E.B.; Davison, A.J.; Delwart, E.; Gorbalenya, A.E.; Harrach, B.; et al. Consensus statement: Virus taxonomy in the age of metagenomics. Nat. Rev. Microbiol. 2017, 15, 161–168. [Google Scholar] [CrossRef] [PubMed]
- Suttle, C.A. Marine viruses — major players in the global ecosystem. Nat. Rev. Microbiol. 2007, 5, 801–812. [Google Scholar] [CrossRef] [PubMed]
- Koonin, E.V.; Dolja, V.V. Virus world as an evolutionary network of viruses and capsidless selfish elements. Microbiol. Mol. Biol. Rev. MMBR 2014, 78, 278–303. [Google Scholar] [CrossRef] [PubMed]
- Schulz, F.; Yutin, N.; Ivanova, N.N.; Ortega, D.R.; Lee, T.K.; Vierheilig, J.; Daims, H.; Horn, M.; Wagner, M.; Jensen, G.J.; et al. Giant viruses with an expanded complement of translation system components. Science 2017, 356, 82–85. [Google Scholar] [CrossRef] [PubMed]
- Zhang, Y.-Z.; Shi, M.; Holmes, E.C. Using Metagenomics to Characterize an Expanding Virosphere. Cell 2018, 172, 1168–1172. [Google Scholar] [CrossRef] [PubMed]
- Mahy, B.W.J. The Evolution and Emergence of RNA Viruses. Emerg. Infect. Dis. 2010, 16, 899. [Google Scholar] [CrossRef]
- Colson, P.; La Scola, B.; Levasseur, A.; Caetano-Anollés, G.; Raoult, D. Mimivirus: Leading the way in the discovery of giant viruses of amoebae. Nat. Rev. Microbiol. 2017, 15, 243–254. [Google Scholar] [CrossRef] [PubMed]
- Rosario, K.; Duffy, S.; Breitbart, M. A field guide to eukaryotic circular single-stranded DNA viruses: Insights gained from metagenomics. Arch. Virol. 2012, 157, 1851–1871. [Google Scholar] [CrossRef] [PubMed]
- Iranzo, J.; Puigbò, P.; Lobkovsky, A.E.; Wolf, Y.I.; Koonin, E.V. Inevitability of Genetic Parasites. Genome Biol. Evol. 2016, 8, 2856–2869. [Google Scholar] [CrossRef] [PubMed]
- TenOever, B.R. The Evolution of Antiviral Defense Systems. Cell Host Microbe 2016, 19, 142–149. [Google Scholar] [CrossRef] [PubMed]
- Koonin, E.V. Viruses and mobile elements as drivers of evolutionary transitions. Philos. Trans. R. Soc. Lond. B. Biol. Sci. 2016, 371. [Google Scholar] [CrossRef] [PubMed]
- Faillace, C.A.; Lorusso, N.S.; Duffy, S. Overlooking the smallest matter: Viruses impact biological invasions. Ecol. Lett. 2017, 20, 524–538. [Google Scholar] [CrossRef] [PubMed]
- Forterre, P.; Prangishvili, D. The major role of viruses in cellular evolution: Facts and hypotheses. Curr. Opin. Virol. 2013, 3, 558–565. [Google Scholar] [CrossRef] [PubMed]
- Chen, J.; MacCarthy, T. The preferred nucleotide contexts of the AID/APOBEC cytidine deaminases have differential effects when mutating retrotransposon and virus sequences compared to host genes. PLoS Comput. Biol. 2017, 13. [Google Scholar] [CrossRef] [PubMed]
- Coffin, J.M. Virions at the gates: Receptors and the host-virus arms race. PLoS Biol. 2013, 11, e1001574. [Google Scholar] [CrossRef] [PubMed]
- Nakano, Y.; Aso, H.; Soper, A.; Yamada, E.; Moriwaki, M.; Juarez-Fernandez, G.; Koyanagi, Y.; Sato, K. A conflict of interest: The evolutionary arms race between mammalian APOBEC3 and lentiviral Vif. Retrovirology 2017, 14, 31. [Google Scholar] [CrossRef] [PubMed]
- Obbard, D.J.; Dudas, G. The genetics of host–virus coevolution in invertebrates. Curr. Opin. Virol. 2014, 8, 73–78. [Google Scholar] [CrossRef] [PubMed]
- Mokili, J.L.; Rohwer, F.; Dutilh, B.E. Metagenomics and future perspectives in virus discovery. Curr. Opin. Virol. 2012, 2, 63–77. [Google Scholar] [CrossRef] [PubMed]
- Van Aerle, R.; Santos, E.M. Advances in the application of high-throughput sequencing in invertebrate virology. J. Invertebr. Pathol. 2017. [Google Scholar] [CrossRef] [PubMed]
- Penaud-Budloo, M.; Lecomte, E.; Guy-Duché, A.; Saleun, S.; Roulet, A.; Lopez-Roques, C.; Tournaire, B.; Cogné, B.; Léger, A.; Blouin, V.; et al. Accurate identification and quantification of DNA species by next-generation sequencing in adeno-associated viral vectors produced in insect cells. Hum. Gene Ther. Methods 2017. [Google Scholar] [CrossRef] [PubMed]
- Greninger, A.L. A decade of RNA virus metagenomics is (not) enough. Virus Res. 2018, 244, 218–229. [Google Scholar] [CrossRef] [PubMed]
- Moniruzzaman, M.; Wurch, L.L.; Alexander, H.; Dyhrman, S.T.; Gobler, C.J.; Wilhelm, S.W. Virus-host relationships of marine single-celled eukaryotes resolved from metatranscriptomics. Nat. Commun. 2017, 8, 16054. [Google Scholar] [CrossRef] [PubMed]
- Obbard, D.J. Expansion of the metazoan virosphere: Progress, pitfalls, and prospects. Curr. Opin. Virol. 2018, 31, 17–23. [Google Scholar] [CrossRef] [PubMed]
- Bielen, A.; Bošnjak, I.; Sepčić, K.; Jaklič, M.; Cvitanić, M.; Lušić, J.; Lajtner, J.; Simčič, T.; Hudina, S. Differences in tolerance to anthropogenic stress between invasive and native bivalves. Sci. Total Environ. 2016, 543, 449–459. [Google Scholar] [CrossRef] [PubMed]
- Darrigran, G.; Damborenea, C. Ecosystem engineering impact of Limnoperna fortunei in South America. Zoolog. Sci. 2011, 28, 1–7. [Google Scholar] [CrossRef] [PubMed]
- Karatayev, A.Y.; Burlakova, L.E.; Mastitsky, S.E.; Padilla, D.K. Predicting the spread of aquatic invaders: Insight from 200 years of invasion by zebra mussels. Ecol. Appl. Publ. Ecol. Soc. Am. 2015, 25, 430–440. [Google Scholar] [CrossRef]
- Plazzi, F.; Ceregato, A.; Taviani, M.; Passamonti, M. A molecular phylogeny of bivalve mollusks: Ancient radiations and divergences as revealed by mitochondrial genes. PLoS ONE 2011, 6, e27147. [Google Scholar] [CrossRef] [PubMed]
- Faure, B.; Schaeffer, S.W.; Fisher, C.R. Species distribution and population connectivity of deep-sea mussels at hydrocarbon seeps in the Gulf of Mexico. PloS ONE 2015, 10, e0118460. [Google Scholar] [CrossRef] [PubMed]
- Buchmann, K. Evolution of Innate Immunity: Clues from Invertebrates via Fish to Mammals. Front. Immunol. 2014, 5. [Google Scholar] [CrossRef] [PubMed]
- Petrone, L.; Kumar, A.; Sutanto, C.N.; Patil, N.J.; Kannan, S.; Palaniappan, A.; Amini, S.; Zappone, B.; Verma, C.; Miserez, A. Mussel adhesion is dictated by time-regulated secretion and molecular conformation of mussel adhesive proteins. Nat. Commun. 2015, 6, 8737. [Google Scholar] [CrossRef] [PubMed]
- Fernández Robledo, J.A.; Yadavalli, R.; Allam, B.; Pales Espinosa, E.; Gerdol, M.; Greco, S.; Stevick, R.J.; Gómez-Chiarri, M.; Zhang, Y.; Heil, C.A.; et al. From the raw bar to the bench: Bivalves as models for human health. Dev. Comp. Immunol. 2019, 92, 260–282. [Google Scholar] [CrossRef] [PubMed]
- Farley, C.A.; Banfield, W.G.; Kasnic, G.; Foster, W.S. Oyster herpes-type virus. Science 1972, 178, 759–760. [Google Scholar] [CrossRef] [PubMed]
- Abbadi, M.; Zamperin, G.; Gastaldelli, M.; Pascoli, F.; Rosani, U.; Milani, A.; Schivo, A.; Rossetti, E.; Turolla, E.; Gennari, L.; et al. Identification of a newly described OsHV-1 µvar from the North Adriatic Sea (Italy). J. Gen. Virol. 2018. [Google Scholar] [CrossRef] [PubMed]
- Bai, C.; Wang, C.; Xia, J.; Sun, H.; Zhang, S.; Huang, J. Emerging and endemic types of Ostreid herpesvirus 1 were detected in bivalves in China. J. Invertebr. Pathol. 2015, 124, 98–106. [Google Scholar] [CrossRef] [PubMed]
- Burioli, E. a. V.; Prearo, M.; Riina, M.V.; Bona, M.C.; Fioravanti, M.L.; Arcangeli, G.; Houssin, M. Ostreid herpesvirus type 1 genomic diversity in wild populations of Pacific oyster Crassostrea gigas from Italian coasts. J. Invertebr. Pathol. 2016, 137, 71–83. [Google Scholar] [CrossRef] [PubMed]
- Chang, P.H.; Kuo, S.T.; Lai, S.H.; Yang, H.S.; Ting, Y.Y.; Hsu, C.L.; Chen, H.C. Herpes-like virus infection causing mortality of cultured abalone Haliotis diversicolor supertexta in Taiwan. Dis. Aquat. Organ. 2005, 65, 23–27. [Google Scholar] [CrossRef] [PubMed]
- Davison, A.J.; Trus, B.L.; Cheng, N.; Steven, A.C.; Watson, M.S.; Cunningham, C.; Le Deuff, R.-M.; Renault, T. A novel class of herpesvirus with bivalve hosts. J. Gen. Virol. 2005, 86, 41–53. [Google Scholar] [CrossRef] [PubMed]
- Martenot, C.; Lethuillier, O.; Fourour, S.; Oden, E.; Trancart, S.; Travaillé, E.; Houssin, M. Detection of undescribed ostreid herpesvirus 1 (OsHV-1) specimens from Pacific oyster, Crassostrea gigas. J. Invertebr. Pathol. 2015, 132, 182–189. [Google Scholar] [CrossRef] [PubMed]
- Arzul, I.; Corbeil, S.; Morga, B.; Renault, T. Viruses infecting marine molluscs. J. Invertebr. Pathol. 2017. [Google Scholar] [CrossRef] [PubMed]
- Zannella, C.; Mosca, F.; Mariani, F.; Franci, G.; Folliero, V.; Galdiero, M.; Tiscar, P.G.; Galdiero, M. Microbial Diseases of Bivalve Mollusks: Infections, Immunology and Antimicrobial Defense. Mar. Drugs 2017, 15, 182. [Google Scholar] [CrossRef] [PubMed]
- Renault, T.; Novoa, B. Viruses infecting bivalve molluscs. Aquat. Living Resour. 2004, 17, 397–409. [Google Scholar] [CrossRef]
- Brum, J.R.; Sullivan, M.B. Rising to the challenge: Accelerated pace of discovery transforms marine virology. Nat. Rev. Microbiol. 2015, 13, 147–159. [Google Scholar] [CrossRef] [PubMed]
- Shi, M.; Lin, X.-D.; Tian, J.-H.; Chen, L.-J.; Chen, X.; Li, C.-X.; Qin, X.-C.; Li, J.; Cao, J.-P.; Eden, J.-S.; et al. Redefining the invertebrate RNA virosphere. Nature 2016, 540, 539–543. [Google Scholar] [CrossRef] [PubMed]
- Andrade, K.R.; Boratto, P.P.V.M.; Rodrigues, F.P.; Silva, L.C.F.; Dornas, F.P.; Pilotto, M.R.; La Scola, B.; Almeida, G.M.F.; Kroon, E.G.; Abrahão, J.S. Oysters as hot spots for mimivirus isolation. Arch. Virol. 2015, 160, 477–482. [Google Scholar] [CrossRef] [PubMed]
- Iaconelli, M.; Purpari, G.; Della Libera, S.; Petricca, S.; Guercio, A.; Ciccaglione, A.R.; Bruni, R.; Taffon, S.; Equestre, M.; Fratini, M.; et al. Hepatitis A and E Viruses in Wastewaters, in River Waters, and in Bivalve Molluscs in Italy. Food Environ. Virol. 2015, 7, 316–324. [Google Scholar] [CrossRef] [PubMed]
- Suffredini, E.; Proroga, Y.T.R.; Di Pasquale, S.; di Maro, O.; Losardo, M.; Cozzi, L.; Capuano, F.; de Medici, D. Occurrence and Trend of Hepatitis A Virus in Bivalve Molluscs Production Areas Following a Contamination Event. Food Environ. Virol. 2017, 9, 423–433. [Google Scholar] [CrossRef] [PubMed]
- Rosani, U.; Gerdol, M. A bioinformatics approach reveals seven nearly-complete RNA-virus genomes in bivalve RNA-seq data. Virus Res. 2016. [Google Scholar] [CrossRef] [PubMed]
- Okinawa Institute of Science and Technology (OIST) Marine Genomics Unit Genome Projects. Available online: http://marinegenomics.oist.jp/ (accessed on 1 January 2019).
- Fu, L.; Niu, B.; Zhu, Z.; Wu, S.; Li, W. CD-HIT: Accelerated for clustering the next-generation sequencing data. Bioinforma. Oxf. Engl. 2012, 28, 3150–3152. [Google Scholar] [CrossRef] [PubMed]
- TrimGalore! Available online: https://www.bioinformatics.babraham.ac.uk/projects/trim_galore/ (accessed on 1 January 2019).
- Haas, B.J.; Papanicolaou, A.; Yassour, M.; Grabherr, M.; Blood, P.D.; Bowden, J.; Couger, M.B.; Eccles, D.; Li, B.; Lieber, M.; et al. De novo transcript sequence reconstruction from RNA-seq using the Trinity platform for reference generation and analysis. Nat. Protoc. 2013, 8, 1494–1512. [Google Scholar] [CrossRef] [PubMed]
- Eddy, S.R. Accelerated Profile HMM Searches. PLoS Comput. Biol. 2011, 7, e1002195. [Google Scholar] [CrossRef] [PubMed]
- Finn, R.D.; Bateman, A.; Clements, J.; Coggill, P.; Eberhardt, R.Y.; Eddy, S.R.; Heger, A.; Hetherington, K.; Holm, L.; Mistry, J.; et al. Pfam: The protein families database. Nucleic Acids Res. 2014, 42, D222–D230. [Google Scholar] [CrossRef] [PubMed]
- Camacho, C.; Coulouris, G.; Avagyan, V.; Ma, N.; Papadopoulos, J.; Bealer, K.; Madden, T.L. BLAST+: Architecture and applications. BMC Bioinf. 2009, 10, 421. [Google Scholar] [CrossRef] [PubMed]
- Zhang, G.; Fang, X.; Guo, X.; Li, L.; Luo, R.; Xu, F.; Yang, P.; Zhang, L.; Wang, X.; Qi, H.; et al. The oyster genome reveals stress adaptation and complexity of shell formation. Nature 2012, 490, 49–54. [Google Scholar] [CrossRef] [PubMed]
- Wagner, G.P.; Kin, K.; Lynch, V.J. A model based criterion for gene expression calls using RNA-seq data. Theory Biosci. Theor. Den Biowiss. 2013, 132, 159–164. [Google Scholar] [CrossRef] [PubMed]
- Zheng, Y.; Gao, S.; Padmanabhan, C.; Li, R.; Galvez, M.; Gutierrez, D.; Fuentes, S.; Ling, K.-S.; Kreuze, J.; Fei, Z. VirusDetect: An automated pipeline for efficient virus discovery using deep sequencing of small RNAs. Virology 2017, 500, 130–138. [Google Scholar] [CrossRef] [PubMed]
- Shapiro, M.; Meier, S.; MacCarthy, T. The cytidine deaminase under-representation reporter (CDUR) as a tool to study evolution of sequences under deaminase mutational pressure. BMC Bioinf. 2018, 19, 163. [Google Scholar]
- Martinez, T.; Shapiro, M.; Bhaduri-McIntosh, S.; MacCarthy, T. Evolutionary effects of the AID/APOBEC family of mutagenic enzymes on human gamma-herpesviruses. Virus Evol. 2019, 5. [Google Scholar] [CrossRef] [PubMed]
- Edgar, R.C. MUSCLE: A multiple sequence alignment method with reduced time and space complexity. BMC Bioinf. 2004, 5, 113. [Google Scholar] [CrossRef] [PubMed]
- Tamura, K.; Stecher, G.; Peterson, D.; Filipski, A.; Kumar, S. MEGA6: Molecular Evolutionary Genetics Analysis version 6.0. Mol. Biol. Evol. 2013, 30, 2725–2729. [Google Scholar] [CrossRef] [PubMed]
- Interactive Tree Of Life (iTOL). Available online: https://itol.embl.de/ (accessed on 28 February 2019).
- Venkataraman, S.; Prasad, B.V.L.S.; Selvarajan, R. RNA Dependent RNA Polymerases: Insights from Structure, Function and Evolution. Viruses 2018, 10, 76. [Google Scholar] [CrossRef] [PubMed]
- Dolan, P.T.; Whitfield, Z.J.; Andino, R. Mechanisms and Concepts in RNA Virus Population Dynamics and Evolution. Annu. Rev. Virol. 2018, 5, 69–92. [Google Scholar] [CrossRef] [PubMed]
- Miesen, P.; Joosten, J.; van Rij, R.P. PIWIs Go Viral: Arbovirus-Derived piRNAs in Vector Mosquitoes. PLoS Pathog. 2016, 12, e1006017. [Google Scholar] [CrossRef] [PubMed]
- Vijayendran, D.; Airs, P.M.; Dolezal, K.; Bonning, B.C. Arthropod viruses and small RNAs. J. Invertebr. Pathol. 2013, 114, 186–195. [Google Scholar] [CrossRef] [PubMed]
- Vodovar, N.; Goic, B.; Blanc, H.; Saleh, M.-C. In silico reconstruction of viral genomes from small RNAs improves virus-derived small interfering RNA profiling. J. Virol. 2011, 85, 11016–11021. [Google Scholar] [CrossRef] [PubMed]
- Samuel, C.E. Adenosine deaminases acting on RNA (ADARs) are both antiviral and proviral. Virology 2011, 411, 180–193. [Google Scholar] [CrossRef] [PubMed]
- Interactive Tree Of Life (iTOL). Available online: https://itol.embl.de/shared/umbertorosani (accessed on 28 February 2019).
- Shi, M.; Zhang, Y.-Z.; Holmes, E.C. Meta-transcriptomics and the evolutionary biology of RNA viruses. Virus Res. 2018, 243, 83–90. [Google Scholar] [CrossRef] [PubMed]
- Waldron, F.M.; Stone, G.N.; Obbard, D.J. Metagenomic sequencing suggests a diversity of RNA interference-like responses to viruses across multicellular eukaryotes. PLoS Genet. 2018, 14, e1007533. [Google Scholar] [CrossRef] [PubMed]
- Li, C.-X.; Shi, M.; Tian, J.-H.; Lin, X.-D.; Kang, Y.-J.; Chen, L.-J.; Qin, X.-C.; Xu, J.; Holmes, E.C.; Zhang, Y.-Z. Unprecedented genomic diversity of RNA viruses in arthropods reveals the ancestry of negative-sense RNA viruses. eLife 2015, 4, 5378. [Google Scholar] [CrossRef] [PubMed]
- Dolja, V.V.; Koonin, E.V. Metagenomics reshapes the concepts of RNA virus evolution by revealing extensive horizontal virus transfer. Virus Res. 2017. [Google Scholar] [CrossRef] [PubMed]
- Chin, W.-X.; Ang, S.K.; Chu, J.J.H. Recent advances in therapeutic recruitment of mammalian RNAi and bacterial CRISPR-Cas DNA interference pathways as emerging antiviral strategies. Drug Discov. Today 2017, 22, 17–30. [Google Scholar] [CrossRef] [PubMed]
- Tsai, H.-Y.; Chen, C.-C.G.; Conte, D.; Moresco, J.J.; Chaves, D.A.; Mitani, S.; Yates, J.R.; Tsai, M.-D.; Mello, C.C. A ribonuclease coordinates siRNA amplification and mRNA cleavage during RNAi. Cell 2015, 160, 407–419. [Google Scholar] [CrossRef] [PubMed]
- Petit, M.; Mongelli, V.; Frangeul, L.; Blanc, H.; Jiggins, F.; Saleh, M.-C. piRNA pathway is not required for antiviral defense in Drosophila melanogaster. Proc. Natl. Acad. Sci. USA 2016, 113, E4218–E4227. [Google Scholar] [CrossRef] [PubMed]
- Gammon, D.B.; Ishidate, T.; Li, L.; Gu, W.; Silverman, N.; Mello, C.C. The Antiviral RNA Interference Response Provides Resistance to Lethal Arbovirus Infection and Vertical Transmission in Caenorhabditis elegans. Curr. Biol. CB 2017, 27, 795–806. [Google Scholar] [CrossRef] [PubMed]
- Koonin, E.V. Evolution of RNA- and DNA-guided antivirus defense systems in prokaryotes and eukaryotes: Common ancestry vs convergence. Biol. Direct 2017, 12, 5. [Google Scholar] [CrossRef] [PubMed]
- Green, T.J.; Rolland, J.-L.; Vergnes, A.; Raftos, D.; Montagnani, C. OsHV-1 countermeasures to the Pacific oyster’s anti-viral response. Fish Shellfish Immunol. 2015, 47, 435–443. [Google Scholar] [CrossRef] [PubMed]
- Green, T.J.; Speck, P. Antiviral Defense and Innate Immune Memory in the Oyster. Viruses 2018, 10, 133. [Google Scholar] [CrossRef] [PubMed]
- Bass, B.L. RNA editing by adenosine deaminases that act on RNA. Annu. Rev. Biochem. 2002, 71, 817–846. [Google Scholar] [CrossRef] [PubMed]
- Liu, M.-C.; Liao, W.-Y.; Buckley, K.M.; Yang, S.Y.; Rast, J.P.; Fugmann, S.D. AID/APOBEC-like cytidine deaminases are ancient innate immune mediators in invertebrates. Nat. Commun. 2018, 9, 1948. [Google Scholar] [CrossRef] [PubMed]
- Carpenter, J.A.; Keegan, L.P.; Wilfert, L.; O’Connell, M.A.; Jiggins, F.M. Evidence for ADAR-induced hypermutation of the Drosophila sigma virus (Rhabdoviridae). BMC Genet. 2009, 10, 75. [Google Scholar] [CrossRef] [PubMed]
- Porath, H.T.; Carmi, S.; Levanon, E.Y. A genome-wide map of hyper-edited RNA reveals numerous new sites. Nat. Commun. 2014, 5, 4726. [Google Scholar] [CrossRef] [PubMed]
- Porath, H.T.; Schaffer, A.A.; Kaniewska, P.; Alon, S.; Eisenberg, E.; Rosenthal, J.; Levanon, E.Y.; Levy, O. A-to-I RNA Editing in the Earliest-Diverging Eumetazoan Phyla. Mol. Biol. Evol. 2017, 34, 1890–1901. [Google Scholar] [CrossRef] [PubMed]
- Piontkivska, H.; Matos, L.F.; Paul, S.; Scharfenberg, B.; Farmerie, W.G.; Miyamoto, M.M.; Wayne, M.L. Role of Host-Driven Mutagenesis in Determining Genome Evolution of Sigma Virus (DMelSV.; Rhabdoviridae) in Drosophila melanogaster. Genome Biol. Evol. 2016, 8, 2952–2963. [Google Scholar] [CrossRef] [PubMed]
- Piontkivska, H.; Frederick, M.; Miyamoto, M.M.; Wayne, M.L. RNA editing by the host ADAR system affects the molecular evolution of the Zika virus. Ecol. Evol. 2017, 7, 4475–4485. [Google Scholar] [CrossRef] [PubMed]
Figure 1.
Summary of the analysis pipeline. The graph summarizes all of the steps that were used to extract viral sequences from bivalve RNA-seq datasets. Additional details are reported in corresponding sections of Materials and Methods.
Figure 1.
Summary of the analysis pipeline. The graph summarizes all of the steps that were used to extract viral sequences from bivalve RNA-seq datasets. Additional details are reported in corresponding sections of Materials and Methods.

Figure 2.
Coverage heat map for the 26 bivalve-associated viruses over 82 RNA-seq samples with at least 1000 viral reads. Data are reported as log10, as depicted in the colored scale. Raw data are reported in Supplementary Table S3.
Figure 2.
Coverage heat map for the 26 bivalve-associated viruses over 82 RNA-seq samples with at least 1000 viral reads. Data are reported as log10, as depicted in the colored scale. Raw data are reported in Supplementary Table S3.

Figure 3.
Small non-coding RNA (sncRNA) reads analysis. The RNA-seq and sncRNA read distribution for each of the five “nearly complete viral genomes” reconstructed from the ribo-depleted oyster RNA-seq data are shown. The open reading frames (ORFs) for each virus are shown in green, while the number of mapped reads are reported on the left. The histograms on the right represent the size distributions of the mapped sncRNA reads (in the range of 15–31 nt). The bottom histograms show the size distribution for the whole library (left), and for the reads that did not match the oyster genome (right).

Figure 4.
Analysis of virus editing. (a). Distribution of the flanking base of ADAR-compatible SNPs. (b). Host distribution of the 3872 viral genomes used as a training set. (c). Percentage of viral sequences (N = 3872) showing statistically significant TA under-representation (<0.05) and maximization (>0.95), divided per host class. (d). Percentage of TA and AA under-representation (<0.05) and maximization (>0.95), measured on the coding sequences of the nearly complete viral genomes reported in this paper.


Table 1.
Assembly statistics of four viral-metagenomic samples. SRA and sample IDs, RNA selection methods, number of reads in million, and the number of assembled contigs and predicted proteins are reported. The number of viral RNA-dependent-RNA-polymerase (vRdRp) domains, the ratio of viral protein to total proteins, as well as the number of complete viral genomes, are also indicated.
| SRA ID | Sample ID | RNA Selection Method | No. of Reads (M) | No. Of Assembled Contig | No. of Predicted Protein | No. of vRdRp | Ratio of Viral Proteins | No. of Complete Genomes * |
|---|---|---|---|---|---|---|---|---|
| SRR3401648 | SAMN04625952 | Ribo-depletion | 99.7 | 96,102 | 45,343 | 30 | 0.00007 | 2 |
| SRR3401653 | polyA-selection | 58.3 | 120,399 | 38,498 | 129 | 0.00034 | 9 | |
| SRR3401753 | SAMN04625958 | Ribo-depletion | 47.9 | 180,272 | 48,687 | 43 | 0.00009 | 6 |
| SRR3401755 | polyA-selection | 60.3 | 105,611 | 14,661 | 54 | 0.00037 | 4 | |
| SRR7637587 | SAMN09760011 | Ribo-depletion | 54.1 | 156,166 | 41,785 | 46 | 0.00011 | 5 |
| SRR8237210 | polyA-selection | 52.0 | 93,172 | 40,301 | 10 | 0.00002 | 0 |
* additional details on the complete viral genomes are reported in Table 2.
Table 2.
Summary of the 26 nearly complete viral genomes. Bivalve species, total number of viral sequences, non-redundant (nr) sequences, and number of “nearly complete viral genomes” are reported. Sequenced tissue and geographical origins of the RNA samples, library type, virus name, and virus distribution in transcriptomes of other bivalves and virus coverage are also reported (as is the total number of viral reads, and as a percentage over the total reads). The BLAST similarities are reported with the E-values, NCBI ID, and the description and percentage of identity.
| Species | Viral Sequences | Tissue | Geographic Origin | Library Type | Virus Name | Virus Distribution among Bivalve RNA-seq | Total Viral Reads | % of Viral Reads * | NCBI ID | Blastp | ||||
|---|---|---|---|---|---|---|---|---|---|---|---|---|---|---|
| Total | nr | Nearly Complete | E-Value | Description | Identity % | |||||||||
| Atrina pectinata | 17 | 15 | 1 | mixed | China | PA | Atrpec_virus1 | \ | 2104 | 0.00202 | MG210792 | 0 | Wenzhou picorna-like virus 26 | 99.57 |
| Crassostrea gigas | 148 | 109 | 13 | gills | Italy | PA | Cragig_virus3 | mytgal | 898 | 0.00135 | MG210795 | \ | \ | \ |
| PA | Bivalve hepelivirus G | mytgal | 4058 | 0.00611 | KX158876 | 0 | Bivalve hepelivirus G | 99.95 | ||||||
| PA | Bivalve RNA virus G5 | \ | 1382 | 0.00173 | KX158874 | 0 | Bivalve RNA virus G5 | 100 | ||||||
| PA | Bivalve RNA virus G3 | mytgal | 1286 | 0.00161 | KX158873 | 0 | Bivalve RNA virus G3 | 100 | ||||||
| PA | Cragig_virus1 | \ | 890 | 0.00134 | MG210793 | \ | \ | \ | ||||||
| PA | Cragig_virus2 | mytgal | 468 | 0.00058 | MG210794 | 0 | Wenzhou picorna-like virus 24 | 93.6 | ||||||
| PA | Bivalve RNA virus G1 | mytgal | 37902 | 0.04732 | KX158871 | 0 | Bivalve RNA virus G1 | 100 | ||||||
| PA | AY337486 | mytgal | 5156 | 0.00644 | AY337486 | 0 | Heterosigma akashiwo RNA virus | 100 | ||||||
| RD | Cragig_virus6 | \ | 30047 | 0.05554 | MK561968 | 1^-108 | Beihai picorna-like virus 21 | 66 | ||||||
| RD | Cragig_virus7 | \ | 5493 | 0.01015 | MK561969 | 3^-40 | Wenzhou picorna-like virus 41 | 70 | ||||||
| RD | Cragig_virus8 | \ | 955 | 0.00177 | MK561970 | 0 | Rhizosolenia setigera RNA virus | 69 | ||||||
| RD | Cragig_virus9 | \ | 9200 | 0.01701 | MK561971 | \ | \ | \ | ||||||
| RD | Cragig_virus10 | \ | 568 | 0.00105 | MK561972 | \ | \ | \ | ||||||
| Elliptio complanata | 2 | 1 | 1 | mixed | USA | PA | Elicom_virus1 | \ | 2268 | 0.00552 | MG210796 | \ | \ | \ |
| Mizuhopecten yessoensis | 25 | 25 | 1 | mixed | China | PA | Mizyes_virus1 | \ | 1974 | 0.00522 | MG210800 | \ | \ | \ |
| Mytilus coruscus | 1 | mixed | China | PA | Mytcor_virus1 | \ | 4460 | 0.01028 | MG210801 | 0 | Pitaya virus X isolate P37 | 98.24 | ||
| Mytilus edulis | 37 | 33 | 1 | mixed | France | PA | Mytedu_virus1 | \ | 1936 | 0.00694 | MG210802 | 0 | Barns Ness breadcrumb sponge aquatic picorna-like virus 2 | 99 |
| Mytilus galloprovincialis | 115 | 52 | 3 | gills | Italy | PA | Bivalve RNA virus G4 | cragig, atrpec | 4818 | 0.00713 | KX158875 | 0 | Bivalve RNA virus G4 | 99.77 |
| PA | Mytgal_virus1 | cragig | \ | \ | MG210803 | \ | \ | \ | ||||||
| PA | Mytgal_virus2 | cragig | 1432 | 0.00212 | MG210804 | 0 | Wenzhou picorna-like virus 51 | 78.7 | ||||||
| Ruditapes philippinarum | 121 | 49 | 5 | gills | China | PA | Rudphi_virus1 | \ | 9842 | 0.02869 | MG210805 | 0 | Wenzhou picorna-like virus 38 | 72.9 |
| gills | China | PA | Rudphi_virus2 | \ | 1031 | 0.00301 | MG210806 | \ | \ | \ | ||||
| gills | China | PA | Rudphi_virus3 | \ | 181992 | 0.29884 | MG210807 | 0 | Wenzhou gastropodes virus 2 | 97.3 | ||||
| gills | China | PA | Rudphi_virus4 | ruddec, ostste, ostlur, cracor, cragig, mytedu | 5388365 | 3.06157 | MG210808 | 0 | Wenzhou gastropodes virus 1 | 92 | ||||
| larvae | USA | PA | Rudphi_virus5 | \ | 19965 | 0.02936 | MG210809 | 0 | Marine RNA virus BC-4 | 70 | ||||
Abbreviations: ruddec, R. decussatus; rudphi, R. philippinarum; ostste, O. stentina; ostlur, O. lurida; cragig, C. gigas; atrpec, A. pectinata; mytgal, M. galloprovincialis; mytedu, M. edulis; PA, polyadenylated RNA library; RD, ribo-depleted RNA library; * percentage of reads from the RNA-seq sample with the highest number of mapped reads, mapping to the given virus (counting only correctly paired reads).
© 2019 by the authors. Licensee MDPI, Basel, Switzerland. This article is an open access article distributed under the terms and conditions of the Creative Commons Attribution (CC BY) license (http://creativecommons.org/licenses/by/4.0/).
Share and Cite
MDPI and ACS Style
Rosani, U.; Shapiro, M.; Venier, P.; Allam, B. A Needle in A Haystack: Tracing Bivalve-Associated Viruses in High-Throughput Transcriptomic Data. Viruses 2019, 11, 205. https://0-doi-org.brum.beds.ac.uk/10.3390/v11030205
AMA Style
Rosani U, Shapiro M, Venier P, Allam B. A Needle in A Haystack: Tracing Bivalve-Associated Viruses in High-Throughput Transcriptomic Data. Viruses. 2019; 11(3):205. https://0-doi-org.brum.beds.ac.uk/10.3390/v11030205
Chicago/Turabian StyleRosani, Umberto, Maxwell Shapiro, Paola Venier, and Bassem Allam. 2019. "A Needle in A Haystack: Tracing Bivalve-Associated Viruses in High-Throughput Transcriptomic Data" Viruses 11, no. 3: 205. https://0-doi-org.brum.beds.ac.uk/10.3390/v11030205
Note that from the first issue of 2016, this journal uses article numbers instead of page numbers. See further details here.