
Comparative Transcriptome Profiling of Human and Pig Intestinal Epithelial Cells after Porcine Deltacoronavirus Infection


Abstract
:1. Introduction
2. Materials and Methods
2.1. Virus
2.2. Intestinal Epithelial Swine (IPEC-J2), Human Intestinal Epithelial Cells (HIEC), and PDCoV Infection
2.3. Immunofluorescent Staining (IF) for the Detection of PDCoV Antigen in HIEC Cells
2.4. RNA Extraction and Quality Control
2.5. Library Preparation and Sequencing
2.6. Data Preprocessing and Alignment
2.7. Expression Data Preprocessing
2.8. Differential Expression
2.9. GO Function and KEGG Pathway Enrichment Analysis
2.10. Selection of Genes for RT-qPCR Validation and Primer Design
2.11. Reverse-Transcription Quantitative Polymerase Chain Reaction and Viral RNA Titers (RT-qPCR)
3. Results
3.1. HIEC Cells Are Susceptible to PDCoV Infection
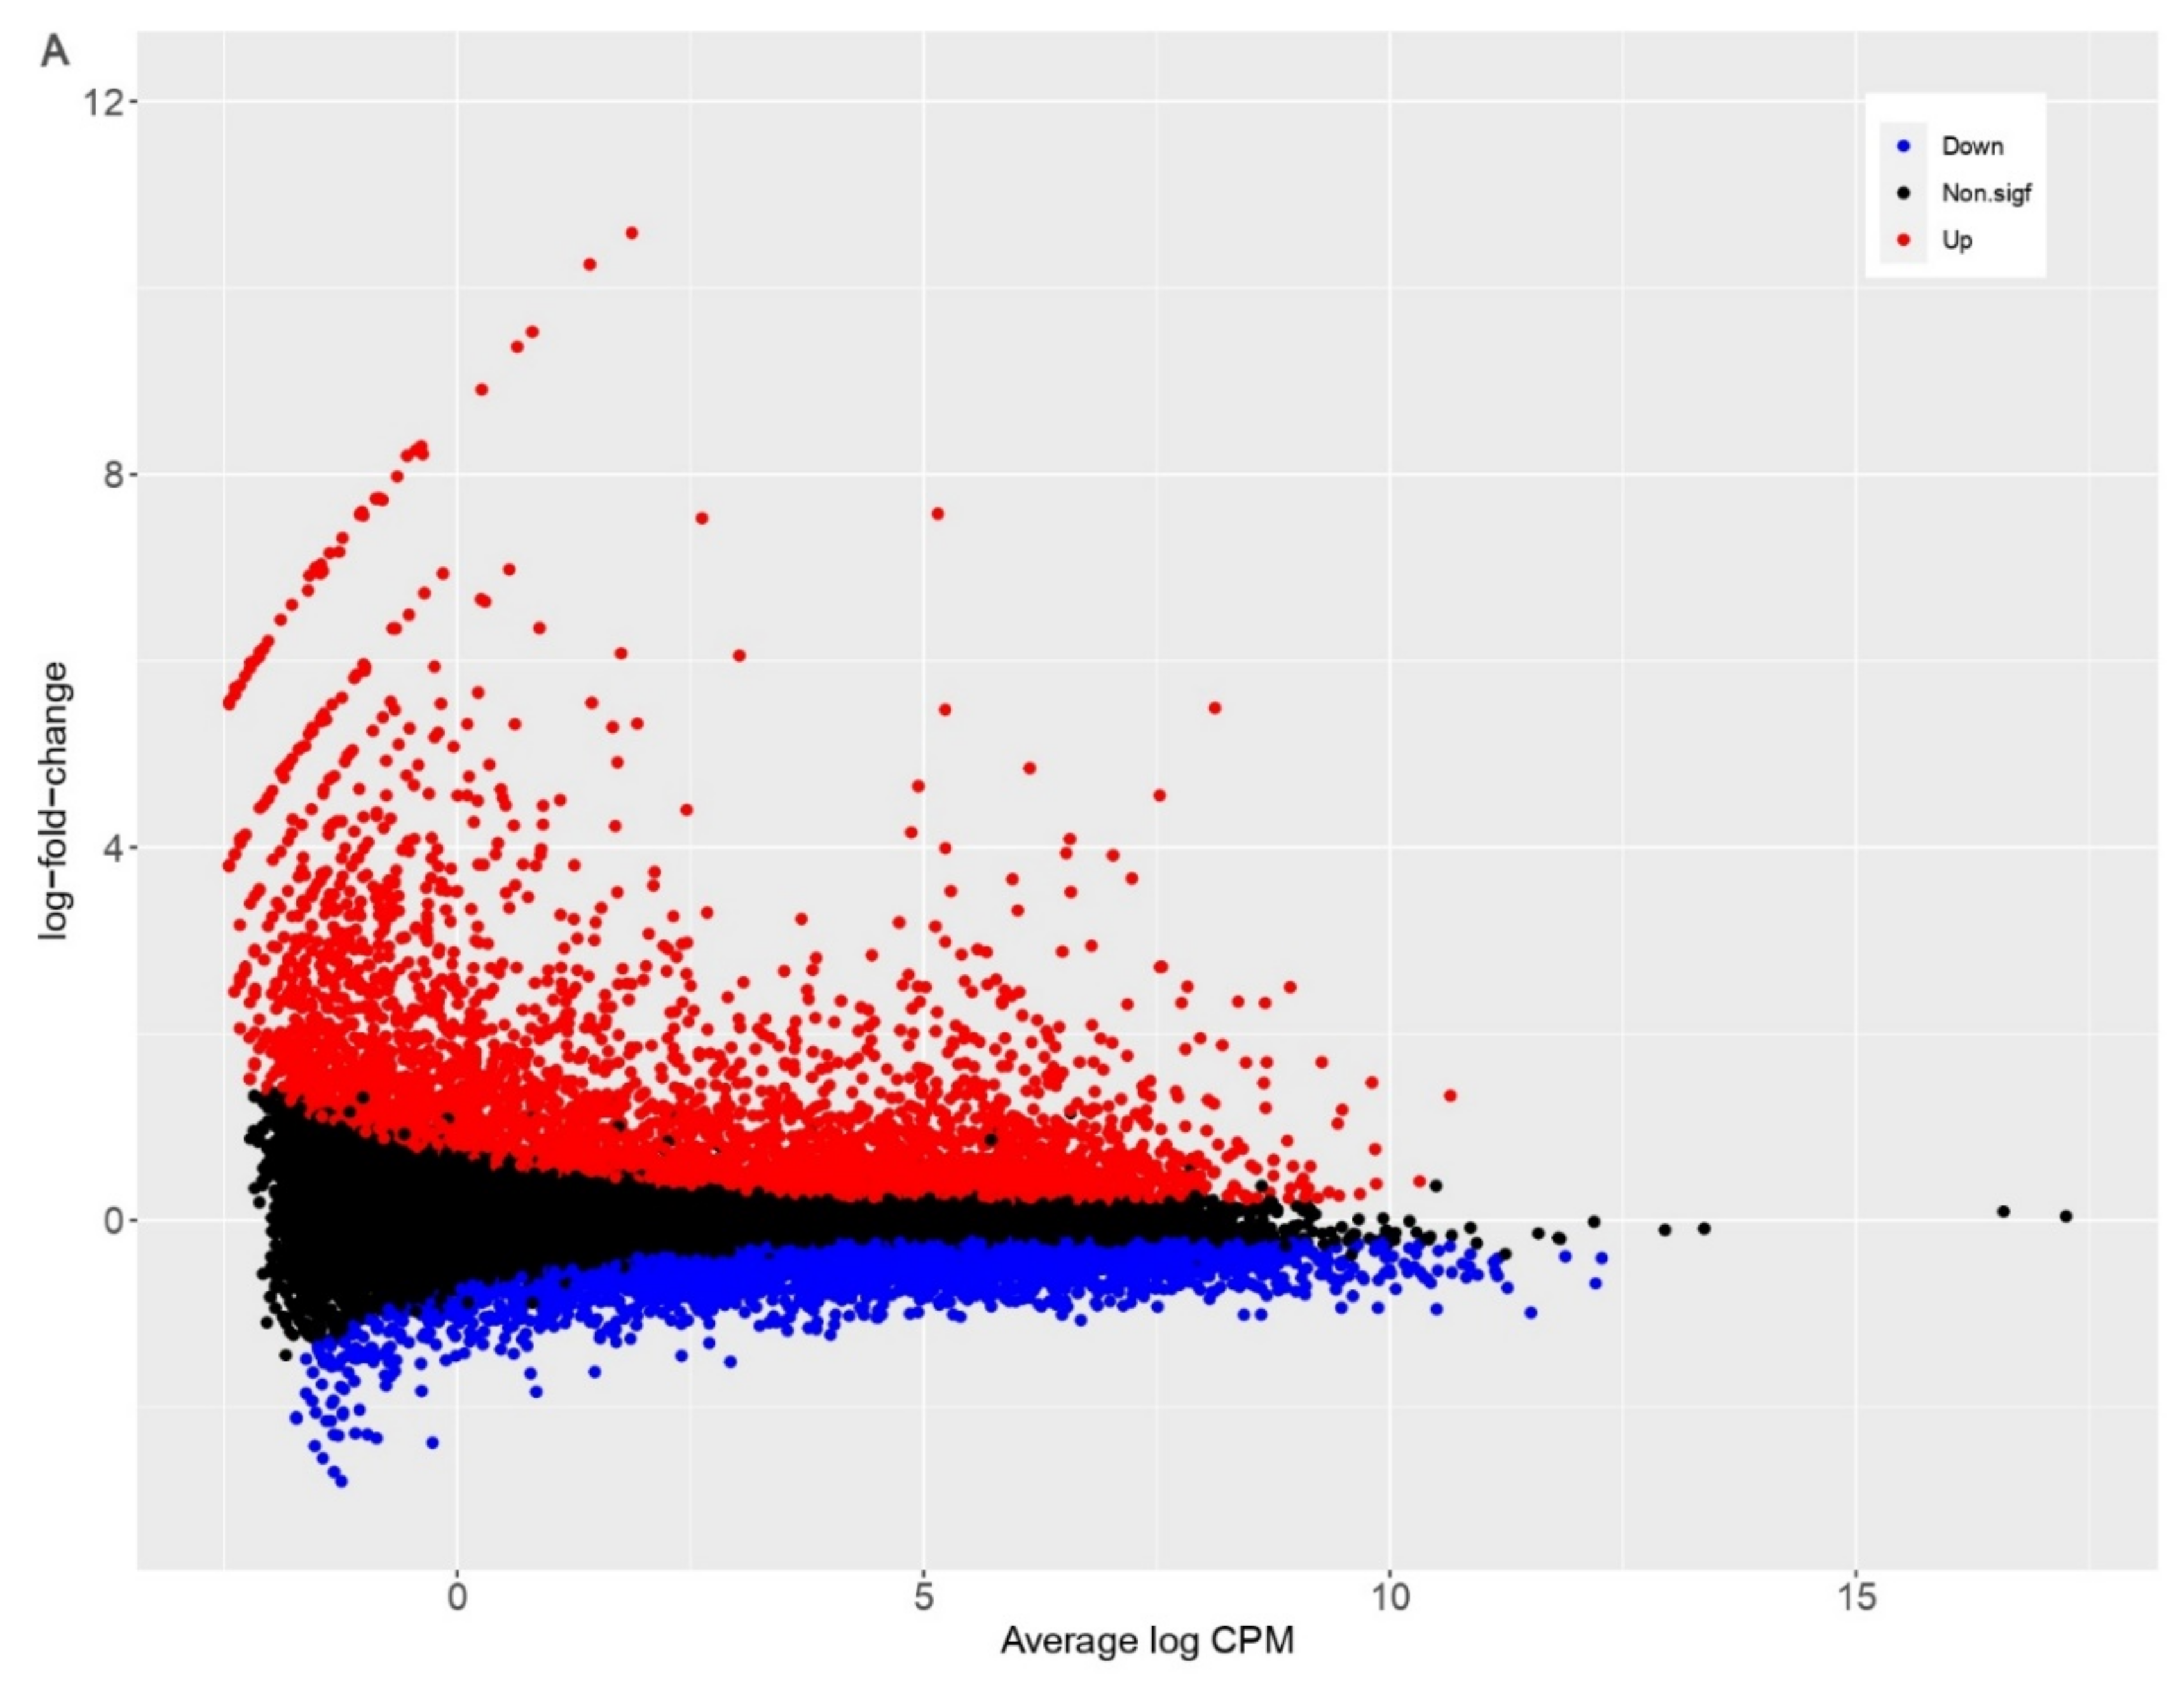
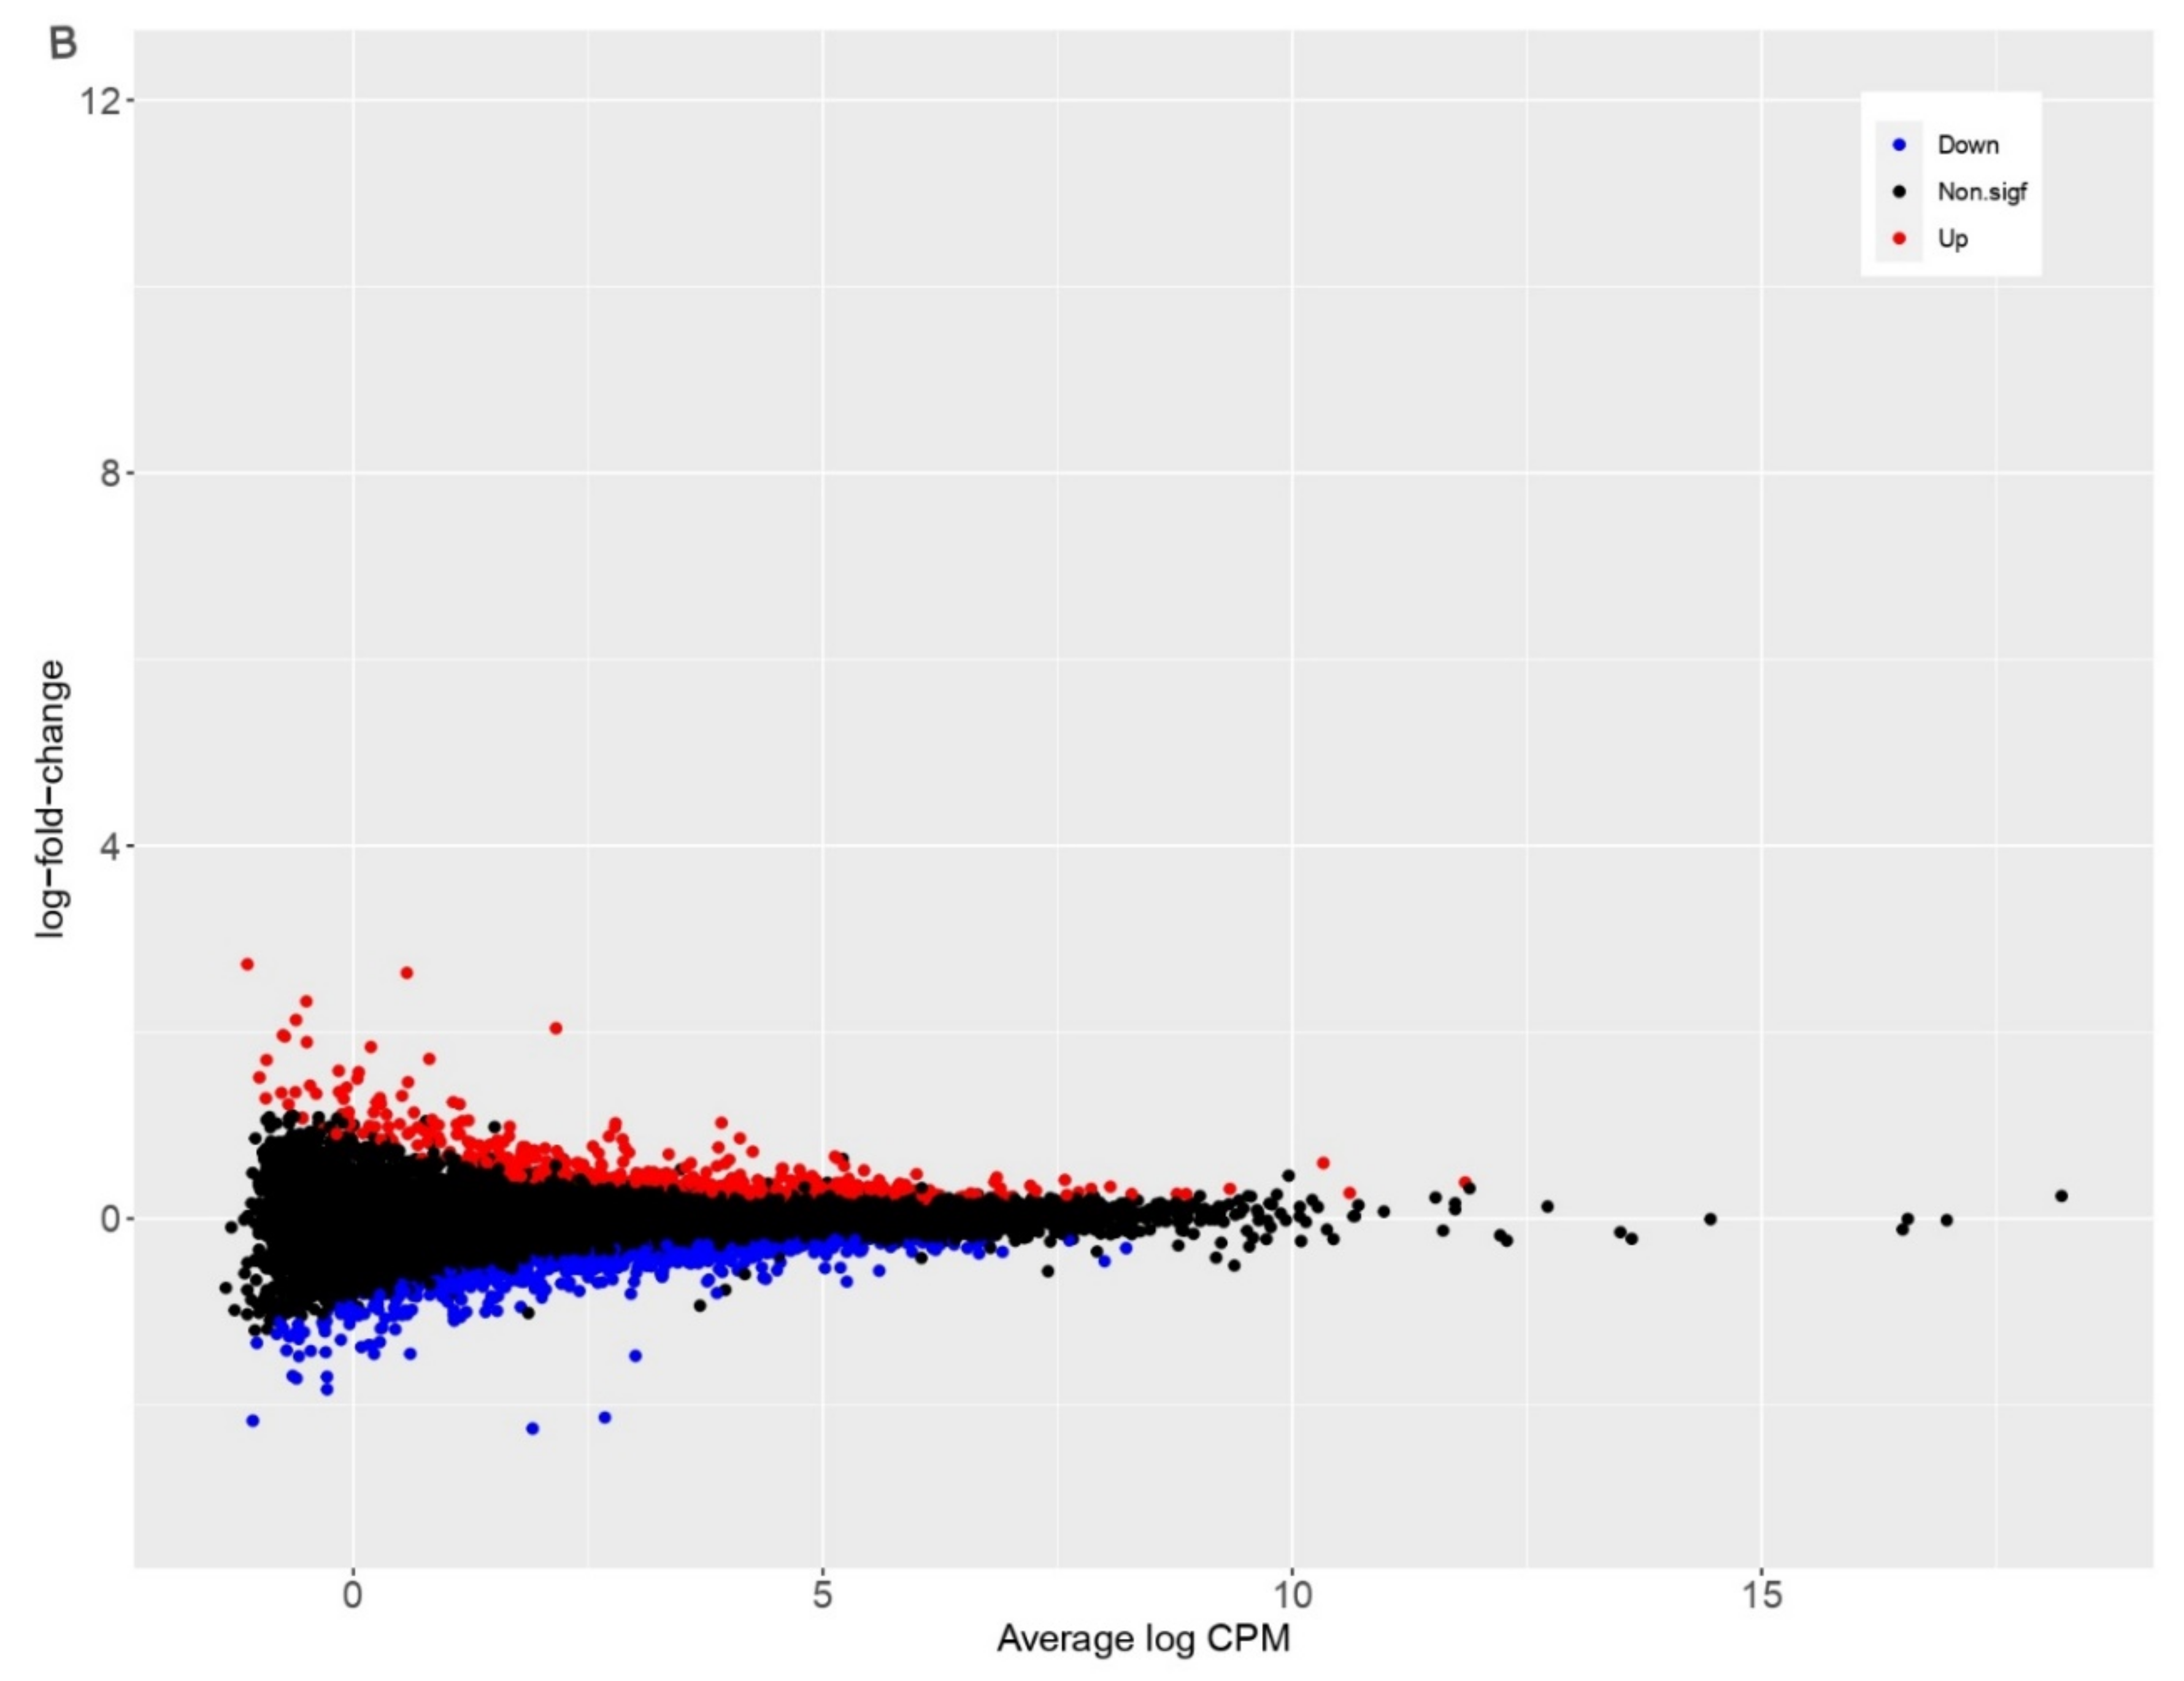
3.2. PDCoV Infection Results in More Differentially Expressed Genes in Human Cells Compared to Pig Cells
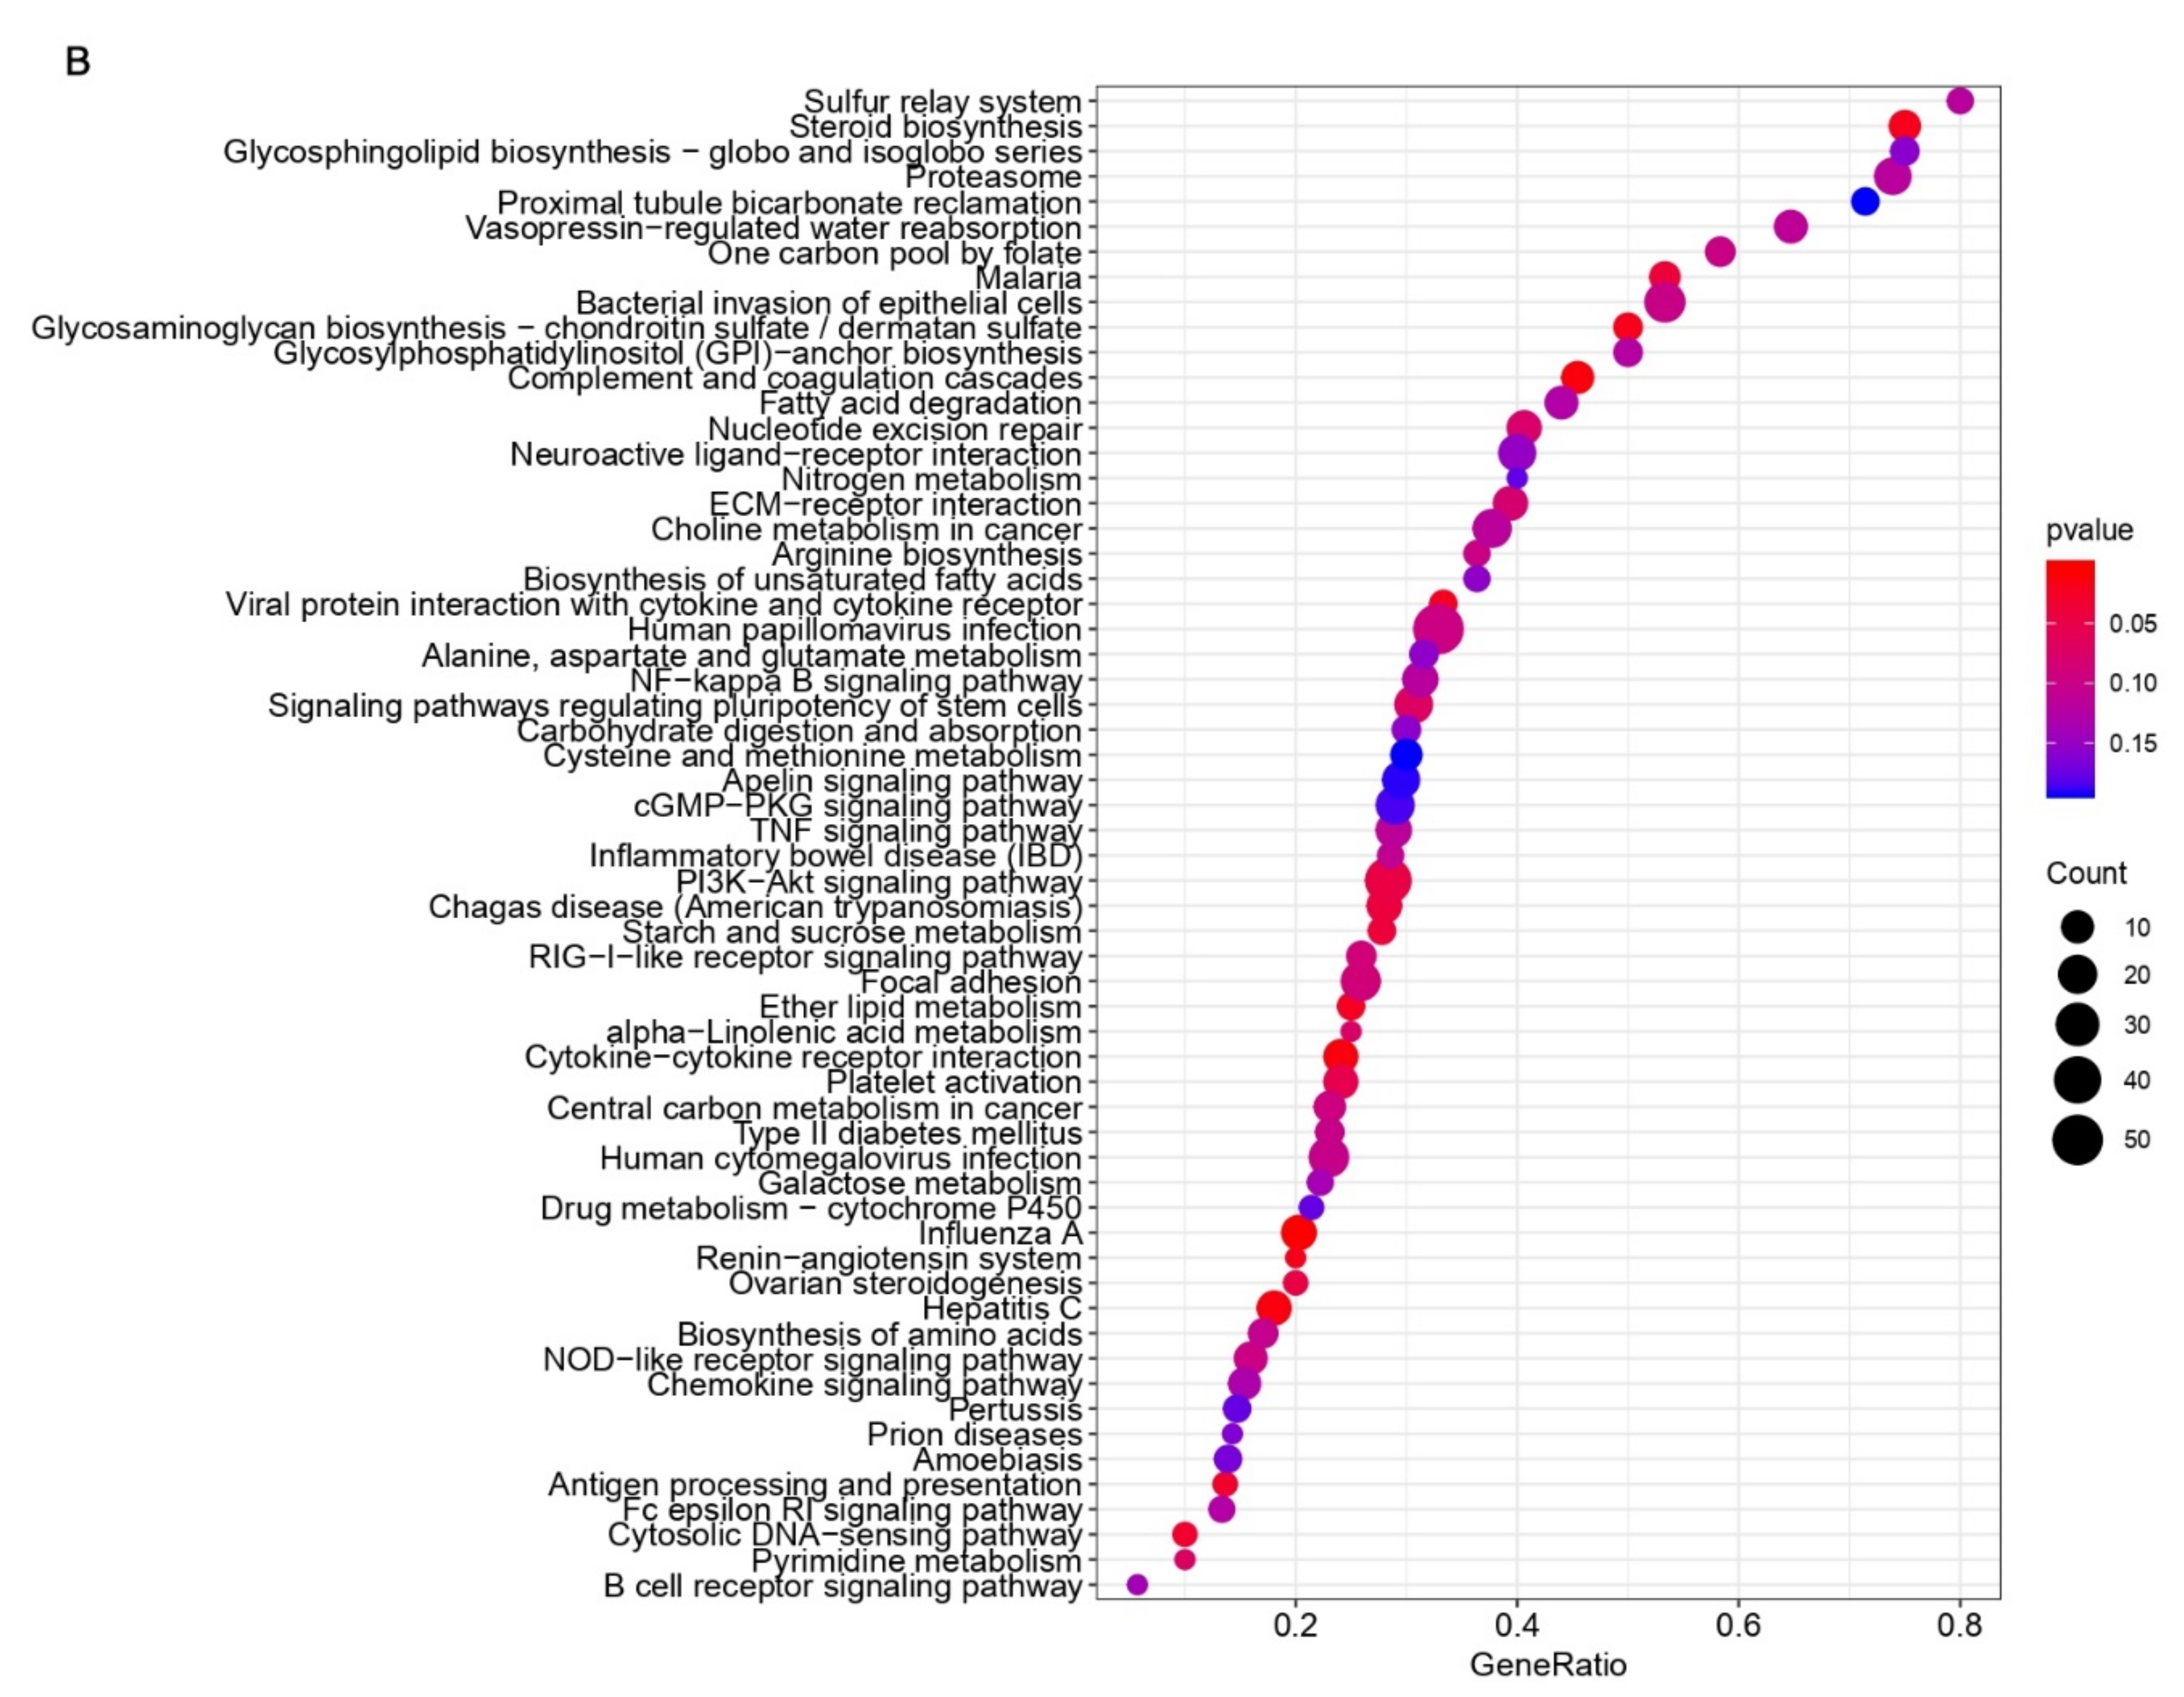
3.3. Common Pathways and Genes Are Affected in the Immune Associated Response to PDCoV Infection in Human and Pig Cells
4. Discussion
5. Conclusions
Supplementary Materials
Author Contributions
Funding
Data Availability Statement
Acknowledgments
Conflicts of Interest
References
- Wertheim, J.O.; Chu, D.K.W.; Peiris, J.S.M.; Pond, S.L.K.; Poon, L.L.M. A Case for the Ancient Origin of Coronaviruses. J. Virol. 2013, 87, 7039–7045. [Google Scholar] [CrossRef] [Green Version]
- Woo, P.C.Y.; Huang, Y.; Lau, S.K.P.; Yuen, K.-Y. Coronavirus Genomics and Bioinformatics Analysis. Viruses 2010, 2, 1804–1820. [Google Scholar] [CrossRef] [PubMed] [Green Version]
- Woo, P.C.Y.; Lau, S.K.P.; Huang, Y.; Yuen, K.-Y. Coronavirus Diversity, Phylogeny and Interspecies Jumping. Exp. Biol. Med. 2009, 234, 1117–1127. [Google Scholar] [CrossRef] [Green Version]
- Woo, P.C.; Lau, S.K.; Lam, C.S.; Lau, C.C.; Tsang, A.K.; Lau, J.H.; Bai, R.; Teng, J.L.; Tsang, C.C.; Wang, M.; et al. Discovery of Seven Novel Mammalian and Avian Coronaviruses in the Genus Deltacoronavirus Supports Bat Coronaviruses as the Gene Source of Alphacoronavirus and Betacoronavirus and Avian Coronaviruses as the Gene Source of Gammacoronavirus and Deltacoronavirus. J. Virol. 2012, 86, 3995–4008. [Google Scholar] [CrossRef] [Green Version]
- Hu, B.; Ge, X.; Wang, L.-F.; Shi, Z. Bat origin of human coronaviruses. Virol. J. 2015, 12, 221. [Google Scholar] [CrossRef] [PubMed] [Green Version]
- Blanco-Melo, D.; Nilsson-Payant, B.; Wen-Chun, L.; Moller, R.; Panis, M.; Sachs, D.; Albrecht, R. SARS-CoV-2 launches a unique transcriptional signature from in vitro, ex vivo, and in vivo systems. bioRxiv 2020. [Google Scholar] [CrossRef] [Green Version]
- Donnelly, C.A.; Fisher, M.C.; Fraser, C.; Ghani, A.C.; Riley, S.; Ferguson, N.M.; Anderson, R.M. Epidemiological and genetic analysis of severe acute respiratory syndrome. Lancet Infect. Dis. 2004, 4, 672–683. [Google Scholar] [CrossRef] [Green Version]
- Wang, L.-F.; Eaton, B.T. Bats, Civets and the Emergence of SARS. Curr. Top. Microbiol. Immunol. 2007, 315, 325–344. [Google Scholar] [CrossRef] [PubMed]
- Goldstein, S.A.; Weiss, S.R. Origins and pathogenesis of Middle East respiratory syndrome-associated coronavirus: Recent advances. F1000Research 2017, 6, 1628. [Google Scholar] [CrossRef] [PubMed]
- Memish, Z.A.; Mishra, N.; Olival, K.J.; Fagbo, S.F.; Kapoor, V.; Epstein, J.H.; AlHakeem, R.; Durosinloun, A.; Al-Asmari, M.; Islam, A.; et al. Middle East Respiratory Syndrome Coronavirus in Bats, Saudi Arabia. Emerg. Infect. Dis. 2013, 19, 1819–1823. [Google Scholar] [CrossRef] [Green Version]
- Wu, F.; Zhao, S.; Yu, B.; Chen, Y.-M.; Wang, W.; Song, Z.-G.; Hu, Y.; Tao, Z.-W.; Tian, J.-H.; Pei, Y.-Y.; et al. A new coronavirus associated with human respiratory disease in China. Nature 2020, 579, 265–269. [Google Scholar] [CrossRef] [Green Version]
- World Health Organization (WHO). A Report About Coronavirus Disease (COVID-19); World Health Organization: Geneva, Switzerland, 2020; Available online: https://covid19.who.int/ (accessed on 22 September 2020).
- Zhou, P.; Yang, X.-L.; Wang, X.-G.; Hu, B.; Zhang, L.; Zhang, W.; Si, H.-R.; Zhu, Y.; Li, B.; Huang, C.-L.; et al. A pneumonia outbreak associated with a new coronavirus of probable bat origin. Nature 2020, 579, 270–273. [Google Scholar] [CrossRef] [Green Version]
- Wu, A.; Peng, Y.; Huang, B.; Ding, X.; Wang, X.; Niu, P.; Meng, J.; Zhu, Z.; Zhang, Z.; Wang, J.; et al. Genome Composition and Divergence of the Novel Coronavirus (2019-nCoV) Originating in China. Cell Host Microbe 2020, 27, 325–328. [Google Scholar] [CrossRef] [Green Version]
- Zhang, T.; Wu, Q.; Zhang, Z. Probable Pangolin Origin of SARS-CoV-2 Associated with the COVID-19 Outbreak. Curr. Biol. 2020, 30, 1346–1351.e2. [Google Scholar] [CrossRef]
- Zhou, P.; Fan, H.; Lan, T.; Yáng, X.-L.; Shi, W.-F.; Zhang, W.; Zhu, Y.; Zhang, Y.-W.; Xie, Q.-M.; Mani, S.; et al. Fatal swine acute diarrhoea syndrome caused by an HKU2-related coronavirus of bat origin. Nature 2018, 556, 255–258. [Google Scholar] [CrossRef] [PubMed]
- Wang, Q.; Vlasova, A.N.; Kenney, S.P.; Saif, L.J. Emerging and re-emerging coronaviruses in pigs. Curr. Opin. Virol. 2019, 34, 39–49. [Google Scholar] [CrossRef] [PubMed]
- Chen, Q.; Wang, L.; Yang, C.; Zheng, Y.; Gauger, P.C.; Anderson, T.; Harmon, K.M.; Zhang, J.; Yoon, K.-J.; Main, R.G.; et al. The emergence of novel sparrow deltacoronaviruses in the United States more closely related to porcine deltacoronaviruses than sparrow deltacoronavirus HKU17. Emerg. Microbes Infect. 2018, 7, 1–4. [Google Scholar] [CrossRef] [PubMed] [Green Version]
- Li, W.; Hulswit, R.J.G.; Kenney, S.P.; Widjaja, I.; Jung, K.; Alhamo, M.A.; van Dieren, B.; van Kuppeveld, F.J.M.; Saif, L.J.; Bosch, B.-J. Broad receptor engagement of an emerging global coronavirus may potentiate its diverse cross-species transmissibility. Proc. Natl. Acad. Sci. USA 2018, 115, E5135–E5143. [Google Scholar] [CrossRef] [Green Version]
- Hu, H.; Jung, K.; Vlasova, A.N.; Chepngeno, J.; Lu, Z.; Wang, Q.; Saif, L.J. Isolation and Characterization of Porcine Deltacoronavirus from Pigs with Diarrhea in the United States. J. Clin. Microbiol. 2015, 53, 1537–1548. [Google Scholar] [CrossRef] [Green Version]
- Zhang, J. Porcine deltacoronavirus: Overview of infection dynamics, diagnostic methods, prevalence and genetic evolution. Virus Res. 2016, 226, 71–84. [Google Scholar] [CrossRef] [PubMed]
- Wang, L.; Byrum, B.; Zhang, Y. Detection and Genetic Characterization of Deltacoronavirus in Pigs, Ohio, USA, 2014. Emerg. Infect. Dis. 2014, 20, 1227–1230. [Google Scholar] [CrossRef]
- Wang, L.; Hayes, J.; Sarver, C.; Byrum, B.; Zhang, Y. Porcine deltacoronavirus: Histological lesions and genetic characterization. Arch. Virol. 2016, 161, 171–175. [Google Scholar] [CrossRef] [PubMed]
- Jung, K.; Hu, H.; Saif, L.J. Porcine deltacoronavirus infection: Etiology, cell culture for virus isolation and propagation, molecular epidemiology and pathogenesis. Virus Res. 2016, 226, 50–59. [Google Scholar] [CrossRef]
- Koonpaew, S.; Teeravechyan, S.; Frantz, P.N.; Chailangkarn, T.; Jongkaewwattana, A. PEDV and PDCoV Pathogenesis: The Interplay Between Host Innate Immune Responses and Porcine Enteric Coronaviruses. Front. Vet. Sci. 2019, 6, 34. [Google Scholar] [CrossRef] [Green Version]
- Marthaler, D.; Jiang, Y.; Collins, J.; Rossow, K. Complete Genome Sequence of Strain SDCV/USA/Illinois121/2014, a Porcine Deltacoronavirus from the United States. Genome Announc. 2014, 2. [Google Scholar] [CrossRef] [PubMed] [Green Version]
- Hu, H.; Jung, K.; Vlasova, A.N.; Saif, L.J. Experimental infection of gnotobiotic pigs with the cell-culture-adapted porcine deltacoronavirus strain OH-FD22. Arch. Virol. 2016, 161, 3421–3434. [Google Scholar] [CrossRef] [Green Version]
- Jiang, S.; Li, F.; Li, X.; Wang, L.; Zhang, L.; Lu, C.; Zheng, L.; Yan, M. Transcriptome analysis of PK-15 cells in innate immune response to porcine deltacoronavirus infection. PLoS ONE 2019, 14, e0223177. [Google Scholar] [CrossRef] [Green Version]
- Masuda, T.; Tsuchiaka, S.; Ashiba, T.; Yamasato, H.; Fukunari, K.; Omatsu, T.; Furuya, T.; Shirai, J.; Mizutani, T.; Nagai, M. Development of one-step real-time reverse transcriptase-PCR-based assays for the rapid and simultaneous detection of four viruses causing porcine diarrhea. Jpn. J. Vet. Res. 2016, 64, 5–14. [Google Scholar] [PubMed]
- Thachil, A.; Gerber, P.F.; Xiao, C.-T.; Huang, Y.-W.; Opriessnig, T. Development and Application of an ELISA for the Detection of Porcine Deltacoronavirus IgG Antibodies. PLoS ONE 2015, 10, e0124363. [Google Scholar] [CrossRef] [PubMed] [Green Version]
- Lim, Y.X.; Ng, Y.L.; Tam, J.P.; Liu, D.X. Human Coronaviruses: A Review of Virus–Host Interactions. Diseases 2016, 4, 26. [Google Scholar] [CrossRef]
- Lee, Y.J.; Lee, C. Porcine deltacoronavirus induces caspase-dependent apoptosis through activation of the cytochrome c -mediated intrinsic mitochondrial pathway. Virus Res. 2018, 253, 112–123. [Google Scholar] [CrossRef]
- Nam, E.; Lee, C. Contribution of the porcine aminopeptidase N (CD13) receptor density to porcine epidemic diarrhea virus infection. Vet. Microbiol. 2010, 144, 41–50. [Google Scholar] [CrossRef] [PubMed]
- Delmas, B.; Gelfi, J.; L’Haridon, R.; Sjöström, H.; Laude, H. Aminopeptidase N is a major receptor for the entero-pathogenic coronavirus TGEV. Nature 1992, 357, 417–420. [Google Scholar] [CrossRef] [PubMed] [Green Version]
- Xia, P.; Wang, Y.; Zhu, C.; Zou, Y.; Yang, Y.; Liu, W.; Hardwidge, P.R.; Zhu, G. Porcine aminopeptidase N binds to F4+ enterotoxigenic Escherichia coli fimbriae. Vet. Res. 2016, 47, 24. [Google Scholar] [CrossRef] [Green Version]
- Woolhouse, M.; Scott, F.; Hudson, Z.; Howey, R.; Chase-Topping, M. Human viruses: Discovery and emergence. Philos. Trans. R. Soc. B Biol. Sci. 2012, 367, 2864–2871. [Google Scholar] [CrossRef] [PubMed] [Green Version]
- Ibrahim, B.; McMahon, D.P.; Hufsky, F.; Beer, M.; Deng, L.; le Mercier, P.; Palmarini, M.; Thiel, V.; Marz, M. A new era of virus bioinformatics. Virus Res. 2018, 251, 86–90. [Google Scholar] [CrossRef] [Green Version]
- Reed, L.; Muench, H. A simple method of estimating fifty per cent endpoints12. Am. J. Epidemiol. 1938, 27, 493–497. [Google Scholar] [CrossRef]
- Pourianfar, H.R.; Javadi, A.; Grollo, L. A Colorimetric-Based Accurate Method for the Determination of Enterovirus 71 Titer. Indian J. Virol. 2012, 23, 303–310. [Google Scholar] [CrossRef] [Green Version]
- Vergauwen, H. The IPEC-J2 Cell Line. In The Impact of Food Bioactives on Health: In vitro and ex vivo models; Springer Nature: Basel, Switzerland, 2015; pp. 125–134. [Google Scholar]
- Jung, K.; Miyazaki, A.; Hu, H.; Saif, L.J. Susceptibility of porcine IPEC-J2 intestinal epithelial cells to infection with porcine deltacoronavirus (PDCoV) and serum cytokine responses of gnotobiotic pigs to acute infection with IPEC-J2 cell culture-passaged PDCoV. Vet. Microbiol. 2018, 221, 49–58. [Google Scholar] [CrossRef]
- New England BioLabs (NEB). NEBNext Ultra II Directional RNA Library Prep Kit for Illumina; New England BioLabs: Ipswich, MA, USA, 2019; Available online: https://www.neb.com/-/media/nebus/files/manuals/manuale7760_e7765.pdf (accessed on 11 October 2019).
- Babraham. FastQC: A Quality Control Tool for High Throughput Sequence Data. 2015. Available online: https://www.bioinformatics.babraham.ac.uk/projects/fastqc/ (accessed on 13 January 2020).
- Bushnell, B. BBMap: A Fast, Accurate, Splice-Aware Aligner. United States. 2014. Available online: https://sourceforge.net/projects/bbmap/ (accessed on 13 January 2020).
- Chen, Y.; Lun, A.T.; Smyth, G.K. From reads to genes to pathways: Differential expression analysis of RNA-Seq experiments using Rsubread and the edgeR quasi-likelihood pipeline. F1000Research 2016, 5, 1438. [Google Scholar]
- Robinson, M.D.; Oshlack, A. A scaling normalization method for differential expression analysis of RNA-seq data. Genome Biol. 2010, 11, R25. [Google Scholar] [CrossRef] [Green Version]
- Sherman, B.T.; Lempicki, R.A. Systematic and Integrative Analysis of Large Gene Lists Using DAVID Bioinformatics Resources. Nat. Protoc. 2009, 4, 44–57. Available online: https://david.ncifcrf.gov/tools.jsp (accessed on 10 February 2020).
- Mi, H.; Muruganujan, A.; Ebert, D.; Huang, X.; Thomas, P.D. PANTHER version 14: More genomes, a new PANTHER GO-slim and improvements in enrichment analysis tools. Nucleic Acids Res. 2019, 47, D419–D426. [Google Scholar] [CrossRef] [PubMed]
- Ogata, H.; Goto, S.; Sato, K.; Fujibuchi, W.; Bono, H.; Kanehisa, M. KEGG: Kyoto Encyclopedia of Genes and Genomes. Nucleic Acids Res. 2000, 28, 27–30. [Google Scholar] [CrossRef] [Green Version]
- VIB. Calculate and Draw Custom Venn Diagrams. Available online: http://bioinformatics.psb.ugent.be/webtools/Venn/ (accessed on 6 March 2020).
- Altschul, S.F.; Gish, W.; Miller, W.; Myers, E.W.; Lipman, D.J. Basic local alignment search tool. J. Mol. Biol. 1990, 215, 403–410. [Google Scholar] [CrossRef]
- Bruel, T.; Guibon, R.; Melo, S.; Guillén, N.; Salmon, H.; Girard-Misguich, F.; Meurens, F. Epithelial induction of porcine suppressor of cytokine signaling 2 (SOCS2) gene expression in response to Entamoeba histolytica. Dev. Comp. Immunol. 2010, 34, 562–571. [Google Scholar] [CrossRef]
- Livak, K.J.; Schmittgen, T.D. Analysis of relative gene expression data using real-time quantitative PCR and the 2(-Delta Delta C(T)) Method. Methods 2001, 25, 402–408. [Google Scholar] [CrossRef] [PubMed]
- Guezguez, A.; Paré, F.; Benoit, Y.D.; Basora, N.; Beaulieu, J.-F. Modulation of stemness in a human normal intestinal epithelial crypt cell line by activation of the WNT signaling pathway. Exp. Cell Res. 2014, 322, 355–364. [Google Scholar] [CrossRef] [Green Version]
- Stanifer, M.L.; Kee, C.; Cortese, M.; Zumaran, C.M.; Triana, S.; Mukenhirn, M.; Kraeusslich, H.G.; Alexandrov, T.; Bartenschlager, R.; Boulant, S. Critical Role of Type III Interferon in Controlling SARS-CoV-2 Infection in Human Intestinal Epithelial Cells. Cell Rep. 2020, 32, 107863. [Google Scholar] [CrossRef]
- Mair, K.; Sedlak, C.; Käser, T.; Pasternak, A.; Levast, B.; Gerner, W.; Saalmüller, A.; Summerfield, A.; Gerdts, V.; Wilson, H.; et al. The porcine innate immune system: An update. Dev. Comp. Immunol. 2014, 45, 321–343. [Google Scholar] [CrossRef] [PubMed]
- Burkey, T.; Skjolaas, K.; Dritz, S.; Minton, J. Expression of porcine Toll-like receptor 2, 4 and 9 gene transcripts in the presence of lipopolysaccharide and Salmonella enterica serovars Typhimurium and Choleraesuis. Vet. Immunol. Immunopathol. 2009, 130, 96–101. [Google Scholar] [CrossRef]
- Costanzo, M.C.; Kim, D.; Creegan, M.; Lal, K.G.; Ake, J.A.; Currier, J.R.; Streeck, H.; Robb, M.L.; Michael, N.L.; Bolton, D.L.; et al. Transcriptomic signatures of NK cells suggest impaired responsiveness in HIV-1 infection and increased activity post-vaccination. Nat. Commun. 2018, 9, 1212. [Google Scholar] [CrossRef] [Green Version]
- Campbell, A.R.; Regan, K.; Bhave, N.; Pattanayak, A.; Parihar, R.; Stiff, A.R.; Trikha, P.; Scoville, S.D.; Liyanarachchi, S.; Kondadasula, S.V.; et al. Gene expression profiling of the human natural killer cell response to Fc receptor activation: Unique enhancement in the presence of interleukin-12. BMC Med. Genom. 2015, 8, 66. [Google Scholar] [CrossRef] [Green Version]
- Barber, G.N. Host defense, viruses and apoptosis. Cell Death Differ. 2001, 8, 113–126. [Google Scholar] [CrossRef] [PubMed] [Green Version]
- Song, P.; Li, W.; Xie, J.; Hou, Y.; You, C. Cytokine storm induced by SARS-CoV-2. Clin. Chim. Acta 2020, 509, 280–287. [Google Scholar] [CrossRef] [PubMed]
- Yue, J.; Xie, M.; Gou, X.; Lee, P.; Schneider, M.D.; Wu, X. Microtubules regulate focal adhesion dynamics through MAP4K4. Dev. Cell 2014, 31, 572–585. [Google Scholar] [CrossRef] [Green Version]
- Aouadi, M.; Tesz, G.J.; Nicoloro, S.M.; Wang, M.; Chouinard, M.; Soto, E.; Ostroff, G.R.; Czech, M.P. Orally delivered siRNA targeting macrophage Map4k4 suppresses systemic inflammation. Nat. Cell Biol. 2009, 458, 1180–1184. [Google Scholar] [CrossRef] [Green Version]
- Jin, M.; Chu, H.; Li, Y.; Tao, X.; Cheng, Z.; Pan, Y.; Meng, Q.; Li, L.; Hou, X.; Chen, Y.; et al. MAP4K4 deficiency in CD4 + T cells aggravates lung damage induced by ozone-oxidized black carbon particles. Environ. Toxicol. Pharmacol. 2016, 46, 246–254. [Google Scholar] [CrossRef]
- Chuang, H.-C.; Wang, J.-S.; Lee, I.-T.; Sheu, W.H.-H.; Tan, T.-H. Epigenetic regulation of HGK/MAP4K4 in T cells of type 2 diabetes patients. Oncotarget 2016, 7, 10976–10989. [Google Scholar] [CrossRef] [PubMed] [Green Version]
- Flach, R.J.R.; Skoura, A.; Matevossian, A.; Danai, L.V.; Zheng, W.; Cortes, C.; Bhattacharya, S.K.; Aouadi, M.; Hagan, N.; Yawe, J.C.; et al. Endothelial protein kinase MAP4K4 promotes vascular inflammation and atherosclerosis. Nat. Commun. 2015, 6, 8995. [Google Scholar] [CrossRef] [Green Version]
- Danai, L.V.; Flach, R.J.R.; Virbasius, J.V.; Menendez, L.G.; Jung, D.Y.; Kim, J.H.; Kim, J.K.; Czech, M.P. Inducible Deletion of Protein Kinase Map4k4 in Obese Mice Improves Insulin Sensitivity in Liver and Adipose Tissues. Mol. Cell. Biol. 2015, 35, 2356–2365. [Google Scholar] [CrossRef] [PubMed] [Green Version]
- Gao, X.; Gao, C.; Liu, G.; Hu, J. MAP4K4: An emerging therapeutic target in cancer. Cell Biosci. 2016, 6, 56. [Google Scholar] [CrossRef] [PubMed] [Green Version]
- Stanifer, M.L.; Pervolaraki, K.; Boulant, S. Differential Regulation of Type I and Type III Interferon Signaling. Int. J. Mol. Sci. 2019, 20, 1445. [Google Scholar] [CrossRef] [Green Version]
- Jennings, J.; Sang, Y. Porcine Interferon Complex and Co-Evolution with Increasing Viral Pressure after Domestication. Viruses 2019, 11, 555. [Google Scholar] [CrossRef] [Green Version]
- Lee, A.J.; Ashkar, A.A. The Dual Nature of Type I and Type II Interferons. Front. Immunol. 2018, 9, 2061. [Google Scholar] [CrossRef] [PubMed] [Green Version]
- Thapa, M.; Kuziel, W.A.; Carr, D.J.J. Susceptibility of CCR5-Deficient Mice to Genital Herpes Simplex Virus Type 2 Is Linked to NK Cell Mobilization. J. Virol. 2007, 81, 3704–3713. [Google Scholar] [CrossRef] [PubMed] [Green Version]
- Ashkar, A.A.; Rosenthal, K.L. Interleukin-15 and Natural Killer and NKT Cells Play a Critical Role in Innate Protection against Genital Herpes Simplex Virus Type 2 Infection. J. Virol. 2003, 77, 10168–10171. [Google Scholar] [CrossRef] [PubMed] [Green Version]
- Kaminskyy, V.; Zhivotovsky, B. To kill or be killed: How viruses interact with the cell death machinery. J. Intern. Med. 2010, 267, 473–482. [Google Scholar] [CrossRef]


| Sample | Raw Reads | Clean Reads | Total Mapping (%) |
|---|---|---|---|
| Hs_1 | 47007321 | 45421159 | 95.83% |
| Hs_2 | 50022577 | 48880712 | 95.52% |
| Hs_3 | 43496780 | 42168797 | 94.63% |
| Hs_Dc_1 | 15600403 | 14820248 | 85.82% |
| Hs_Dc_2 | 24140872 | 23537480 | 82.23% |
| Hs_Dc_3 | 48513411 | 47055941 | 81.59% |
| Ss_1 | 23545237 | 23195923 | 94.46% |
| Ss_2 | 53210729 | 51875151 | 95.94% |
| Ss_3 | 53026614 | 52011848 | 94.54% |
| Ss_Dc_1 | 44124431 | 42370051 | 89.67% |
| Ss_Dc_2 | 53543270 | 52298369 | 86.84% |
| Ss_Dc_3 | 50508987 | 48861970 | 94.36% |
| Species | Up | Down | Non.sigf | Total Genes | Total DEGs |
|---|---|---|---|---|---|
| Homo sapiens | 4011 | 3475 | 10784 | 18270 | 7486 |
| Sus scrofa | 542 | 592 | 10716 | 11850 | 1134 |
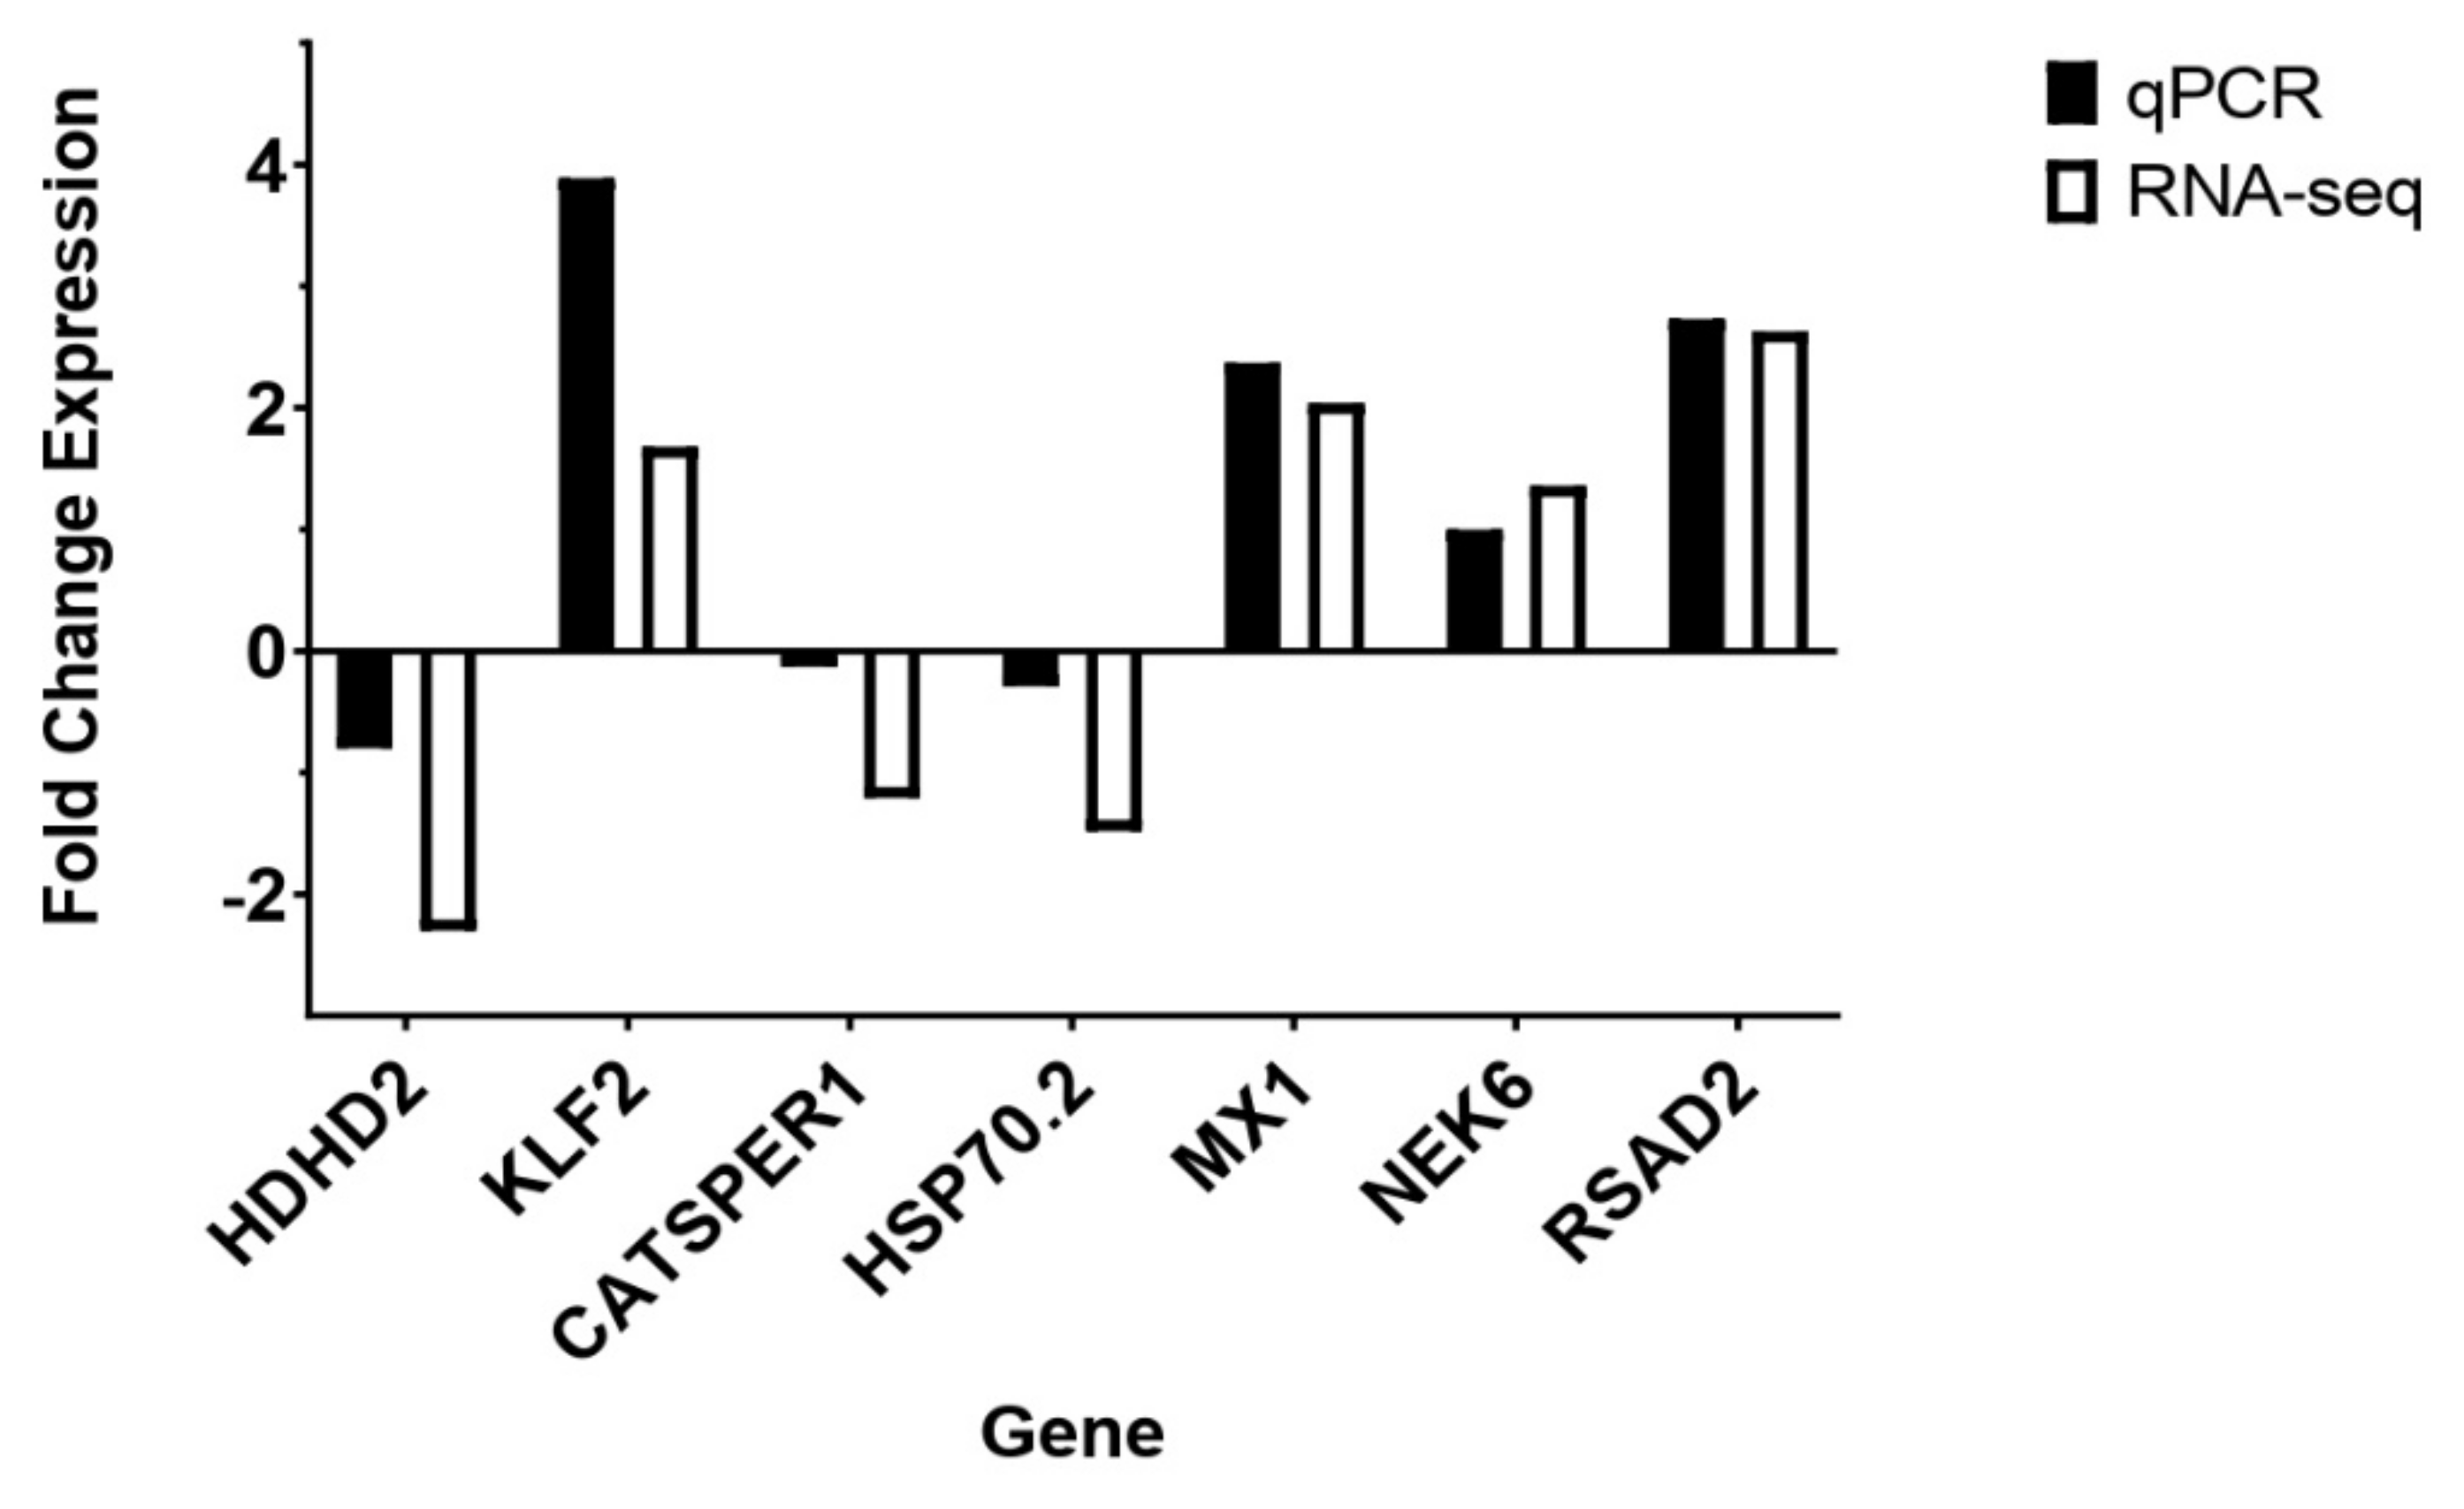
| Gene | Cell Type | RT-qPCR | RNA-seq |
|---|---|---|---|
| HDHD2 | HIEC | −0.8 | −2.3 |
| KLF2 | HIEC | 3.89 | 1.68 |
| CATSPER1 | IPEC | −0.13 | −1.21 |
| HSP70.2 | IPEC | −0.29 | −1.48 |
| NEK6 | IPEC | 1 | 1.36 |
| MX1 | IPEC | 2.37 | 2.04 |
| RSAD2 | IPEC | 2.73 | 2.63 |
Publisher’s Note: MDPI stays neutral with regard to jurisdictional claims in published maps and institutional affiliations. |
© 2021 by the authors. Licensee MDPI, Basel, Switzerland. This article is an open access article distributed under the terms and conditions of the Creative Commons Attribution (CC BY) license (http://creativecommons.org/licenses/by/4.0/).
Share and Cite
Cruz-Pulido, D.; Boley, P.A.; Ouma, W.Z.; Alhamo, M.A.; Saif, L.J.; Kenney, S.P. Comparative Transcriptome Profiling of Human and Pig Intestinal Epithelial Cells after Porcine Deltacoronavirus Infection. Viruses 2021, 13, 292. https://0-doi-org.brum.beds.ac.uk/10.3390/v13020292
Cruz-Pulido D, Boley PA, Ouma WZ, Alhamo MA, Saif LJ, Kenney SP. Comparative Transcriptome Profiling of Human and Pig Intestinal Epithelial Cells after Porcine Deltacoronavirus Infection. Viruses. 2021; 13(2):292. https://0-doi-org.brum.beds.ac.uk/10.3390/v13020292
Chicago/Turabian StyleCruz-Pulido, Diana, Patricia A. Boley, Wilberforce Zachary Ouma, Moyasar A. Alhamo, Linda J. Saif, and Scott P. Kenney. 2021. "Comparative Transcriptome Profiling of Human and Pig Intestinal Epithelial Cells after Porcine Deltacoronavirus Infection" Viruses 13, no. 2: 292. https://0-doi-org.brum.beds.ac.uk/10.3390/v13020292