Article

The Development of Bacteriophage Resistance in Vibrio alginolyticus Depends on a Complex Metabolic Adaptation Strategy

by
Dimitrios Skliros
1,
Panos G. Kalatzis
2,
Chrysanthi Kalloniati
1,
Fotios Komaitis
1,
Sokratis Papathanasiou
1,
Evangelia D. Kouri
3,
Michael K. Udvardi
3,
Constantina Kokkari
4,
Pantelis Katharios
4 and
Emmanouil Flemetakis
1,*
1
Laboratory of Molecular Biology, Department of Biotechnology, School of Applied Biology and Biotechnology, Agricultural University of Athens, 1855 Athens, Greece
2
Department of Biology, Marine Biological Section, University of Copenhagen, 3000 Helsingør, Denmark
3
The Noble Research Institute, 2510 Sam Noble Pkwy, Ardmore, OK 73401, USA
4
Institute of Marine Biology, Biotechnology and Aquaculture, Hellenic Centre for Marine Research, 71500 Heraklion, Greece
*
Author to whom correspondence should be addressed.
Submission received: 8 December 2020 / Revised: 7 April 2021 / Accepted: 8 April 2021 / Published: 10 April 2021
(This article belongs to the Special Issue Phage-Host Interactions 2021)

Abstract

:
Lytic bacteriophages have been well documented to play a pivotal role in microbial ecology due to their complex interactions with bacterial species, especially in aquatic habitats. Although the use of phages as antimicrobial agents, known as phage therapy, in the aquatic environment has been increasing, recent research has revealed drawbacks due to the development of phage-resistant strains among Gram-negative species. Acquired phage resistance in marine Vibrios has been proven to be a very complicated process utilizing biochemical, metabolic, and molecular adaptation strategies. The results of our multi-omics approach, incorporating transcriptome and metabolome analyses of Vibrio alginolyticus phage-resistant strains, corroborate this prospect. Our results provide insights into phage-tolerant strains diminishing the expression of phage receptors ompF, lamB, and btuB. The same pattern was observed for genes encoding natural nutrient channels, such as rbsA, ptsG, tryP, livH, lysE, and hisp, meaning that the cell needs to readjust its biochemistry to achieve phage resistance. The results showed reprogramming of bacterial metabolism by transcript regulations in key-metabolic pathways, such as the tricarboxylic acid cycle (TCA) and lysine biosynthesis, as well as the content of intracellular metabolites belonging to processes that could also significantly affect the cell physiology. Finally, SNP analysis in resistant strains revealed no evidence of amino acid alterations in the studied putative bacterial phage receptors, but several SNPs were detected in genes involved in transcriptional regulation. This phenomenon appears to be a phage-specific, fine-tuned metabolic engineering, imposed by the different phage genera the bacteria have interacted with, updating the role of lytic phages in microbial marine ecology.

1. Introduction

Bacteriophage and bacteria interactions have been shown to drive coevolution in marine habitats and ecosystems [1]. These interactions also mutually contribute to both their coexistence and their genetic variability [2]. Interest in phage therapy has increased during the last decade as bacterial resistance to antibiotics has risen, although the application of this technology is hampered by the development of phage-resistant bacterial strains [3].
Successful bacteriophage infection is dependent on an efficient entry mechanism, involving many bacterial surface elements. Phages of Gram-positive bacteria are able to recognize and attach to the thick peptidoglycan layer that is composed of teichoic and lipoteichoic acids [4] before lysozyme action [5]. Phage infection of Gram-negative bacteria involves more complex mechanisms. Gram-negative species are thought to possess a very fluidic membrane, able to adapt to various conditions [6]. Surface proteins are constantly in contact with the surrounding environment, and some, such as porins, act as channels for nutrients into the periplasm. These proteins could represent the main conduits for phages [7]. After entering the periplasmic space, phages penetrate the thin layer of peptidoglycan, employing the activity of their tail-lysozyme [8]. It has been shown that tailed bacteriophages, such as T4, are able to generate enough force [9,10] to fuse inner and outer membranes, enabling phage DNA to reach outside the cytoplasm [11,12,13]. Hence, proteins with nutrient-related functions that are localized in the periplasmic space [14] can act as natural passages for DNA to enter the cytoplasm [15].
Aproximately 30% of bacterial genomes are thought to encode membrane proteins or proteins related to transmembrane transport [16]. Apart from porins, there are two major families of transporters that mediate and regulate the uptake of specific substrates in bacteria. The first of these, found exclusively in Gram-negative bacteria, employs a phosphotransferase system (PTS) that phosphorylates the substrate (mainly sugars) before transporting it into the cytoplasm [17]. This mechanism utilizes a phosphate group from phosphoenolpyruvic acid (PEP), producing and transporting to the cytoplasm a 6-phosphoryl sugar, in the case of sugar transport [18]. The second major family is the ABC transporters, which utilize ATP to energize nutrient transport. Members of the ABC transporter family are typically composed of three different subunits. The first is able to bind ATP, the second is located in the periplasmic space where it binds to the substrate, and the third component is a transmembrane protein that translocates the substrate into the cytoplasm [19].
Phage therapy applications require the use of strictly lytic phages that will necessarily infect and kill their bacterial hosts; on the other hand, phage-resistant strains will naturally emerge as a consequence of a bacterial strategy to counteract viral infection [20,21]. Multiple bacterial intracellular molecular defense mechanisms against virulent phages have been described over the past years [22] including the CRISPR/Cas9 system [23], BREX strategy [24], the prokaryotic Argonaute-based interference [25], or DISARM defense system [26]. Finally, prophages and prophage elements have also been shown to increase bacterial survivability and protect bacteria against virulent phages [27]. Although the aforementioned mechanisms can confer bacteriophage resistance, they cannot describe any resistance phenomena taking place in the bacterial membrane or in any bacterial species that do not harbor them.
In this study, we used Vibrio alginolyticus, in order to gain insight into the molecular and biochemical mechanisms of resistance development, during interaction with lytic phages, using both targeted transcriptomic and metabolomic approaches. V. alginolyticus is an opportunistic Gram-negative rod-shaped pathogen of various aquatic animals that has been occasionally reported in human infections [28], from which various bacteriophages have been isolated over the years. Our results indicate that the development of phage-resistant V. alginolyticus strains is accompanied by changes in the levels of nutrient transport-related transcripts, linked to an extensive reprogramming of several key metabolic processes within the host cell. We demonstrate that lytic bacteriophages interacting with V. alginolyticus could play a pivotal role in cell physiology. More specifically, resistant cells regulate the expression of proteins involved in nutrient uptake that are found in abundance on the bacterial membranes of Gram-negative species. This regulation seems to mainly affect nutrient uptake and availability, shifting the intracellular biochemical processes accordingly and, in a phage-dependent manner, highlighting a newly reported adaptation strategy. In addition, whole genome sequencing of the resistant strains revealed several SNPs in genes involved in bacterial transcriptional regulation. Interestingly, these complex transcriptional and metabolic interactions of lytic bacteriophages in Gram-negative species remain elusive, although various results on phage-induced phenotypes have been reported.

2. Materials and Methods

2.1. Vibrio alginolyticus Strain V1

V. alginolyticus strain V1, including its genome, has been thoroughly described in the past [29]. This strain was isolated from diseased gilthead seabream (Sparus aurata) in Crete, Greece. Culture and growth conditions included Luria–Bertani (LB) broth supplemented with MgSO4 1 mM and CaCl2 1 mM; the LB broth contained Tryptone (10 g/L), NaCl (10 gL), and Yeast Extract (5 g/L). All culture conditions (liquid and solid) included an incubation temperature of 25 °C and vigorous shaking. Long periods of preservation of the bacterial strain included cells in the exponential phase in glycerol stocks (20%) and −80 °C preservation temperature.

2.2. Bacteriophages Aphrodite1, phiSt2, and Ares1

Three lytic bacteriophages were used in the current study to generate phage-resistant strains of V. alginolyticus, (Table 1). Two of them belong to the Myoviridae family and one to Siphoviridae. phiSt2 was isolated in Crete, Greece [30], and belongs to the Schizotequatrovirus phage genus according to the International Committee on Taxonomy of Viruses (ICTV) as detailed described in [31]. Aphrodite1 belongs to the Aphroditevirus genus according to ICTV and was isolated from the aquatic area of North Euboea Greece. Ares1, a typical Siphoviridae family phage (genus still unclassified) was isolated from South Attika, Greece. All bacteriophages formed clear lytic plaques following the standard double-layer agar (0.5%) method [32]. For Transmission Electron Microscopy (TEM), virions were prepared on collodium copper grids, negatively stained with a 2% uranyl acetate, and examined using an electron microscope (JEOL JEM-1005) at 80 kV.

2.3. Vibrio alginolyticus Phage-Resistant Strains

Phage-resistant bacterial strains were generated after overnight exposure to each phage at a multiplicity of infection (MOI) of 100. In detail, three independent cultures of V. alginolyticus grown in LB medium were inoculated during their exponential phase (OD600: ~0.2) with each phage at MOI 100. The cultures were incubated overnight at 25 °C. Dilutions of the phage lysate were conducted after overnight culture and subsequently cultured on LB medium with 1.5% agar. After overnight incubation at 25 °C, single colonies were isolated. All selected colonies were re-cultured in LB liquid broth and infected by their corresponding phages by the spot test assay. High titer (>109) phage stocks were used to confirm resistance. To test if bacteriophages could remain inside the cells, we used colony PCR with bacteriophage primers (Supplemental Table S2) for at least three independent resistant strains for each phage. We were not able to detect any amplified DNA region (data not shown). Phage-resistant colonies were re-plated, and three independent colonies that served as biological replicates from each bacterial host were stored with 20% glycerol at −80 °C for further analysis.

2.4. Growth Kinetics, Phage Biological Characteristics, and Phage Adsorption Dynamics

The growth curves of three phage-resistant strains and three control (wild type) strains were generated by culturing them at 25 °C in liquid LB medium. During the exponential phase, they were transferred to a 200 μL volume of a 96-well plate (TrueLine) using three technical replicates for each resistant strain. The OD600 was measured every 30 min by using a plate reader at 25 °C with shaking (Infinite M200 PRO, TECAN).
Biological characteristics of the novel bacteriophages Aphrodite1 and Ares1 were determined by using the protocol described in [30]. Briefly, bacteriophages were added to the host bacterial culture in the early exponential phase in triplicate, using an MOI of 0.01 following incubation at 25 °C for 15 min. Cells were then centrifuged, and the supernatant containing unattached phages was discarded. Virocells were suspended in Luria–Bertani broth supplemented with MgSO4 and CaCl2 medium and transferred to 20 mL fresh liquid medium. Petri dishes containing a bacterial lawn of the host were spotted every 10 min for a total duration of 90 min. Phage plaques were formed after overnight incubation at 25 °C.
In order to monitor the adsorption dynamics of phage-resistant strains, we co-cultured each phage with the corresponding resistant strain in liquid LB with an initial phage titer of 104 PFU mL−1. Bacteriophages were inoculated in the liquid culture during the exponential phase (OD600 = ~0.2) of the bacteria, and sample time points were 20 min, 40 min, 60 min, and 960 min post inoculation for every resistant and susceptible strain. Sample time points were established in order to monitor phage adsorption before the completion of a replication cycle for each bacteriophage with the addition of a long-term sample time point. For every time point, an aliquot of 100 μL was used for titration by spot assay.

2.5. Phage DNA Extraction and Sequencing

Bacteriophage DNA extraction and sequencing for Aphrodite1 and Ares1 were done as previously described [31]. Briefly, liquid bacterial cultures of V. alginolyticus strain V1 at the exponential phase of growth (grown in LB medium), were infected separately by bacteriophages Aphrodite1 and Ares1 with an MOI of 10. Both cultures were incubated overnight at 25 °C with reciprocal shaking. The following day, the cultures were centrifuged, and their supernatants were filtered (0.22 µm), titered, and stored at 4 °C. Starting with an optimal titer of 1010 PFU mL−1, phages were then concentrated using standard poly-ethylene glycol/NaCl precipitation. Concentrated phages were treated with Turbo DNAse (Ambion, TX, USA) and RNAse to remove the host’s and contaminant nucleic acids before phage DNA was extracted from the capsids. Genomic DNA was purified using a QIAamp DNA Blood Mini Kit (QIAGEN, Hilden, Germany) following the manufacturer’s instructions with the addition of absolute ethanol before the first column wash to ensure the efficient binding of the gDNA to the silica membrane. DNA integrity and purification were monitored by using NanoDrop (ThermοFisher Scientific, Waltham, MA, USA) measurements and by 0.7% agarose gel before library construction.
At least 5 μg of high-purity phage genomic DNA was used to ensure quality with a BioAnalyzer (BioRad, CA, USA) and for the construction of a paired-end library using a Nextera Library Construction Kit (Illumina, San Diego, CA, USA) with an insert size of 800 bp followed by Illumina sequencing using an Illumina Hi Seq 2000 (Illumina, San Diego, CA, USA) sequencer. Sequencing was conducted at the Beijing Genomic Institute (Shenzhen, Guangdong, China) according to the manufacturer’s protocol.

2.6. Bacterial DNA Extraction and Sequencing

Bacterial DNA from the obtained resistant strains for each bacteriophage was extracted using a sodium dodecyl sulfate (SDS)-based protocol including protease treatment. Briefly, cells were harvested during the exponential phase, washed, and incubated at 56 °C for 2 h with the DNA extraction buffer (2% SDS, 200 μg/mL proteinase k, Tris 7.2 pH 10 mM, EDTA 0.1 mM and beta-mercaptoethanol 0.1%). RNAse treatment followed at 37 °C, and DNA was then purified by using DNA purification silica columns with a commercially available kit (Macherey-Nagel, Duren, Germany) according to the manufacturer’s protocol. DNA quality and RNA contamination were assessed by using a 0.7% agarose gel and Nanodrop spectrophotometer (ThermoFisher Scientific, Waltham, MA, USA).
At least 5 μg of high-purity bacterial DNA for each resistant strain was used to ensure quality with a BioAnalyzer (BioRad, CA, USA) and for the construction of a paired-end library using a Nextera Library Construction Kit (Illumina, San Diego, CA, USA) with an insert size of 350 bp, using a paired-end 300 genomic library followed by Illumina sequencing. In order to detect possible Single Nucleotide Polymorphisms (SNPs), we used a genome sequence depth of at least 50x.

2.7. Bacteria and Bacteriophage Genome Analyses

After the phage DNA sequencing, possible contaminated reads, primers, N-terminus, and 3’-, 5’- low quality reads were trimmed off with an error rate threshold of 0.05 from the raw data. De novo assembly was conducted using Velvet software (version 1.2.10) [33] and the Geneious platform (R10 version; Biomatters Ltd., Auckland, New Zealand; [34]). Assembly resulted in single contigs on both occasions.
Annotations were performed with the gene caller software Glimmer (version 3.0, [35]), the Rapid Annotation Subsystem Technology (R.A.S.T.; [36,37]), and the B2Go (BioBam, Valencia, Spain) platform against a non-reductant protein database and UniProt database with an E-value threshold of ≤10−6. The results from all annotators were filtered, evaluated, and combined. Putative protein products derived from the annotators were verified with the Kyoto Encyclopedia of Genes and Genomes database (K.E.G.G.; [38,39]). Bacteriophage genomic analysis presented in Supplemented Data 2 was conducted with the MAUVE (version 2.4.0) whole genome aligner [40]. Whole genome similarity was carried out using the LastZ algorithm (default parameters; version 1.02.00).
Bacterial putative CRISPR/Cas protein products were analyzed with CRISPRs Finder software [41] and verified by using HMMCAS software with default parameters [42].
For the analysis of the resistant bacterial genomes, PE 300 reads for each library were filtered (removed reads containing adapters, Ns > 10%, and low quality (Qscore ≤ 5)) and merged accordingly. Duplicate reads were removed with Dedupe software (version 37.25) based on a k-mer value of 31 before assembly with the Geneious assembler (R10 version; Biomatters Ltd., Auckland, New Zealand; [34]), with a 5-time iteration parameter, and reads were compared to the reference genome of Vibrio alginolyticus strain V1 in the present study [29]. Quality coverage was assessed with a standard deviation from the mean equal to 2, before analyzing each contig for SNPs. Variant motifs (single nucleotides, insertions, and deletions) were searched with a minimum variant frequency of 0.25, a maximum variant p-value of 10−6, and a minimum strand-bias p-value of 10−5.

2.8. Gene Expression Analysis

Gene expression was studied in wild type (phage-sensitive strains) and phage-resistant bacterial colonies after retrieval from −80 °C stocks and overnight growth at 25 °C under vigorous shaking in LB medium. RNA extraction was performed using the NucleozolTM (Macherey-Nagel, Düren, Germany) reagent according to the manufacturer’s protocol. After harvesting, the cells were washed with 150 mM NaCl and then homogenized in 500 μL NucleozolTM followed by vortexing and multiple centrifugations at 6200× g for better homogenization of the cells. Then, ddH2O (200 μL) was added, and the samples were incubated at room temperature for 15 min before centrifugation at 12,000× g for 15 min. Isopropanol (700 μL) was added in the aqueous phase in order to precipitate RNA after incubation for 10 min at room temperature and centrifugation for 15 min at 13,000× g. The pellet was washed twice with 75% ethanol before dissolution in ddH2O. RNA integrity was checked by agarose gel electrophoresis.
RNA (6 μg per sample) was treated with TURBO DNAse (Ambion, TX, USA) according to the manufacturer’s protocol to remove DNA contaminants and then tested with PCR to verify absence of bacterial DNA. After the DNase treatment, a 70% yield was retrieved, and the integrity of the remaining RNA was checked again by using a 2% agarose gel. RNA quality was estimated using a Nanodrop (ThermoFisher Scientific, Waltham, MA, USA). Approximately 800 ng of RNA was used per cDNA synthesis step, employing the PrimeScript RT reagent (Takara, Dalian, China) synthesis kit, which utilizes the reverse transcription efficiency of the PrimescriptTM enzyme. Specifically, reverse-strand cDNA synthesis was performed in a 10 μL total reaction volume containing 800 ng total RNA, 0.5 μL PrimeScript™ RT Enzyme mix, 2 μL random hexamers (100 μM), PrimeScript Buffer for Real-Time, and the addition of RNase-free ddH2O up to 10 μL. A master mix of the reagents was prepared before the addition of RNA for each sample. The reverse transcription took place by utilizing the following regime: 37 °C for 15 min, 85 °C for 7 s, and 4 °C for 5 min.
Primer pairs for cDNA amplification (Supplemental Table S2) were designed using the sequenced genome of the V. alginolyticus strain V1 [29] utilizing Geneious software (R10 version; Biomatters Ltd., Auckland, New Zealand; [34]) and were in silico tested against bacterial and bacteriophage genomic DNA to ensure that a single amplicon of 70 bps would be amplified. The sequences of studied genes were also compared to the reference strain 12G01 (NZ_CP042449, NZ_CP042450) to validate their function. Quantitative real-time PCR was performed on a StepOnePlus™ Real-Time PCR System (Applied Biosystems, Foster City, CA, USA) using SYBR Select Master Mix (Applied Biosystems, Austin, TX, USA) up to 10 μL per reaction. The gene-specific primers were used at a final concentration of 0.2 μΜ each. In total, 1 μL of cDNA template was used per reaction. PCR cycling started with initial polymerase activation at 95 °C for 10 min, followed by 40 cycles at 95 °C for 15 s and 60 °C for 1 min. The formation of primer dimers and each primer’s specificity were monitored by dissociation curve analysis and agarose gel electrophoresis. Melt curves for each reaction were also monitored to ensure single product amplification. Additionally, dense agarose gel (3%) was used after each reaction to monitor the correct product size (70 bps). The expression levels of V. alginolyticus gyrase A (gyrA) and the HSP70 protein (dnaK) were used as housekeeping genes (HK) to normalize cDNA templates and compute the relative transcript levels for each gene, which were calculated as (1 + E)−ΔCt. ΔCt was calculated as (CtX–CtH), whereas CtX corresponds to the Ct of the targeted gene, and CtH is the geometrical mean of the two HK genes’ Cts. PCR efficiency (E) for each amplicon (Supplemental Table S1) was calculated by applying the linear regression method to the log (fluorescence) per cycle number data, using LinRegPCR software [43].

2.9. Metabolite Extraction and Intracellular Metabolite Analysis

Five resistant V. alginolyticus biological replicates for each phage and four wild-type strains were grown in LB medium and harvested during their exponential phase, washed with 150 mM NaCl, and collected by centrifugation. Metabolites were extracted by using the cold methanol extraction method for Gram-negative bacteria according to [44]. At least 12 mg of bacterial dry biomass was extracted using 400 μL of methanol, and 5 μL of 1 mg/mL ribitol was added as an internal standard. The samples were then incubated at 70 °C for 15 min before the addition of 200 μL of chloroform to each sample in order to separate the polar from the non-polar metabolites. The samples were incubated at 37 °C with continuous agitation for 5 min. Finally, 400 μL of ddH2O was added, and the samples were centrifuged for 5 min at 16,200× g. Then, 100 μL from the aqueous phase was evaporated under N2 gas to prevent oxidation of metabolites. The derivatization protocol included re-suspension of every sample in 25 μL of methoxlyamine-HCl (20 mg mL−1 in pyridine) and incubation for 90 min at 30 °C with continuous gentle shaking followed by the addition of 50 μL of N-methyl-N-(trimethylsilyl)-trifluoroacetamide (MSTFA). Samples were then incubated for 30 min at 37 °C under continuous agitation. Finally, 10 μL of an n-alkane mix was added for the determination of retention indexes (RIs) using AMDIS software (version 2.72) with an RI window of 50*0.01.
GC/MS analysis was carried out on an Agilent 6890 GC coupled to a 5973i MSD (Agilent Technologies, Palo Alto, CA, USA). The separation was achieved on a DB-5MS fused capillary column (60 m long, 0.25 mm internal diameter, film thickness 0.25 μm, J&W Scientific). Helium was used as carrier gas at a flow rate of 1 mL min−1. The split mode of injection was used, and the injection volume was 1 μL. The GC inlet temperature was held at 280 °C. The oven temperature program was as follows: initial temperature 80 °C (held for 2 min), followed by an increase to 315 °C (held for 12 min) at a rate of 5 °C min−1. The total run time was 60 min. The MS source was held at 250 °C and the quadruple at 150 °C, scanned from 50–650 m/z. The GC/MS results were analyzed with AMDIS (version 2.72, minimum factor: 60, multiple identifications per component) software utilizing both Golm [45] and Fiehn [46] metabolite libraries. Final values are represented as the ratio between the area of the target metabolite divided by the area of ribitol (m/z 319), which was used as a reference metabolite and reported relative to the dry weight of each sample.

2.10. Statistical Analysis

Statistical analysis, including one-way ANOVA with adjusted Student’s t-test as post-hoc analysis for multiple tests, and plot generation took place using SigmaPlot software (Systat Software Inc., San Jose, CA, USA; version 12.0). Partial least square discriminant analysis was conducted with the Multibase version of the 2015 add-on for Microsoft Excel and visualized with Sigmaplot. Heat maps were created by using Microsoft Excel.
All figure legends include details regarding statistical significance, number of biological replications used, the statistical test used, significance threshold, and dispersion and precision measures.

2.11. Accession Numbers

The draft genomes of the newly introduced bacteriophages Aphrodite1 and Ares1 are available in the GenBank public DNA repository under accession numbers MG720308 and MG720309, respectively. Additionally, the bacteriophage phiSt2 genome is available in the GenBank public DNA repository under the accession number MG720309. The V. alginolyticus strain V1 genome is also available in the GenBank public DNA repository under the accession number LCUM00000000. The genomes of the bacteriophage-resistant strains have been deposited n GenBank under the accession number JAGFOO000000000 for Vibrio alginolyticus strain VaAphrodite1_A, JAGFON000000000 for Vibrio alginolyticus strain VaAphrodite1_B, JAGFOM000000000 for Vibrio alginolyticus strain VaAphrodite1_C, JAGFOJ000000000 Vibrio alginolyticus strain VaphiSt2_A, JAGFOI000000000 for Vibrio alginolyticus strain VaphiSt2_B, JAGFOL000000000 for Vibrio alginolyticus strain VaAres1_A, JAGGED000000000 for VaAres1_B, and JAGFOK000000000 for Vibrio alginolyticus strain VaAres1_C.

3. Results

3.1. Description of Novel Bacteriophage Isolates

In this work, we report two newly isolated bacteriophages from coastal areas in Greece. Aphrodite1 was isolated from northern Euboea. Transmission electron microscopy showed a typical myovirus morphotype (Supplemental Data 1), different from phiSt2. Genome assembly resulted in a single contig of 237,722 bps, and according to ICTV, was assigned to the Aphroditevirus genus. This phage exhibits whole genome nucleotide similarity with the Vibrio phages pTD1 (AP017972) (76.8%) and VP4B (KC131130) (62%), which belong to the genus Tidunavirus according to ICTV. No integrase gene was detected in the genome, suggesting that it is a phage with a likely explicit lytic lifestyle. Aphrodite1 has an 80-min latent period.
Ares1 was isolated from South Attika. Transmission electron microscopy revealed a virion with a long non-contractile tail, a typical siphovirus morphotype (Supplemental Data 2). Its genome was assembled to a single contig of 80,500 bps. No ORF homologous to integrase was identified. Whole genome nucleotide similarity (82%) with bacteriophage VHS1 Vibrio phage (unclassified genus) indicates that the lifestyle of Ares1 remains an open question [47]. Ares1 has a 30-min latent period.

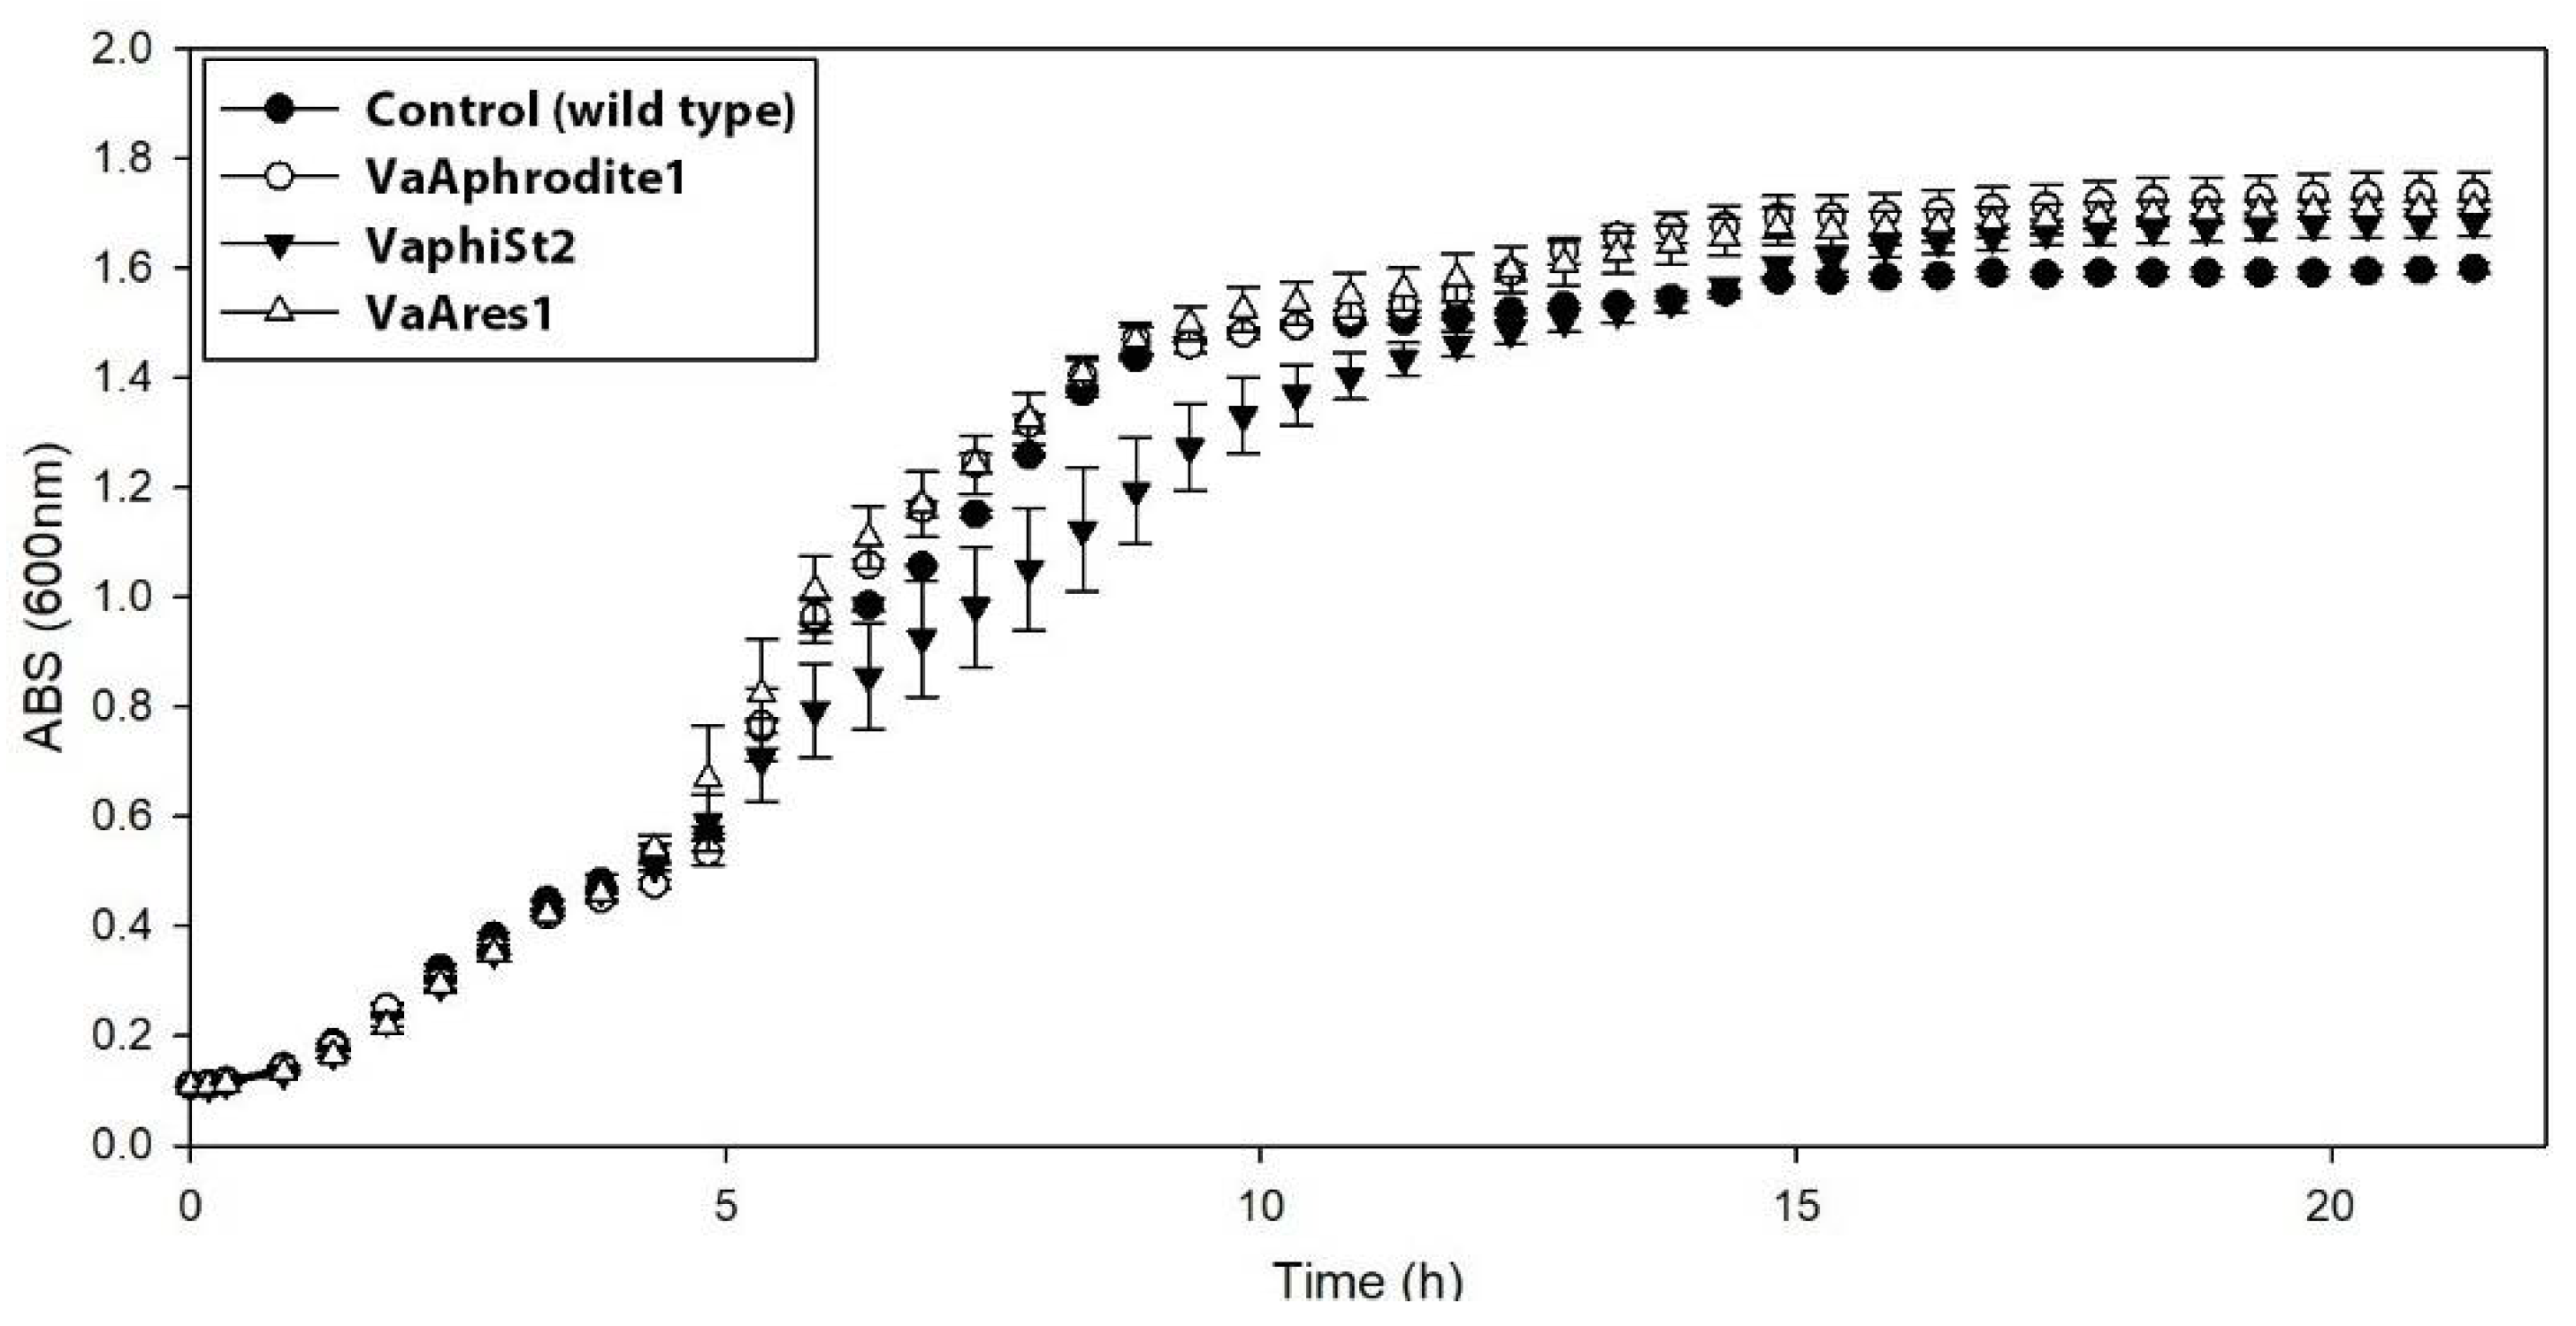
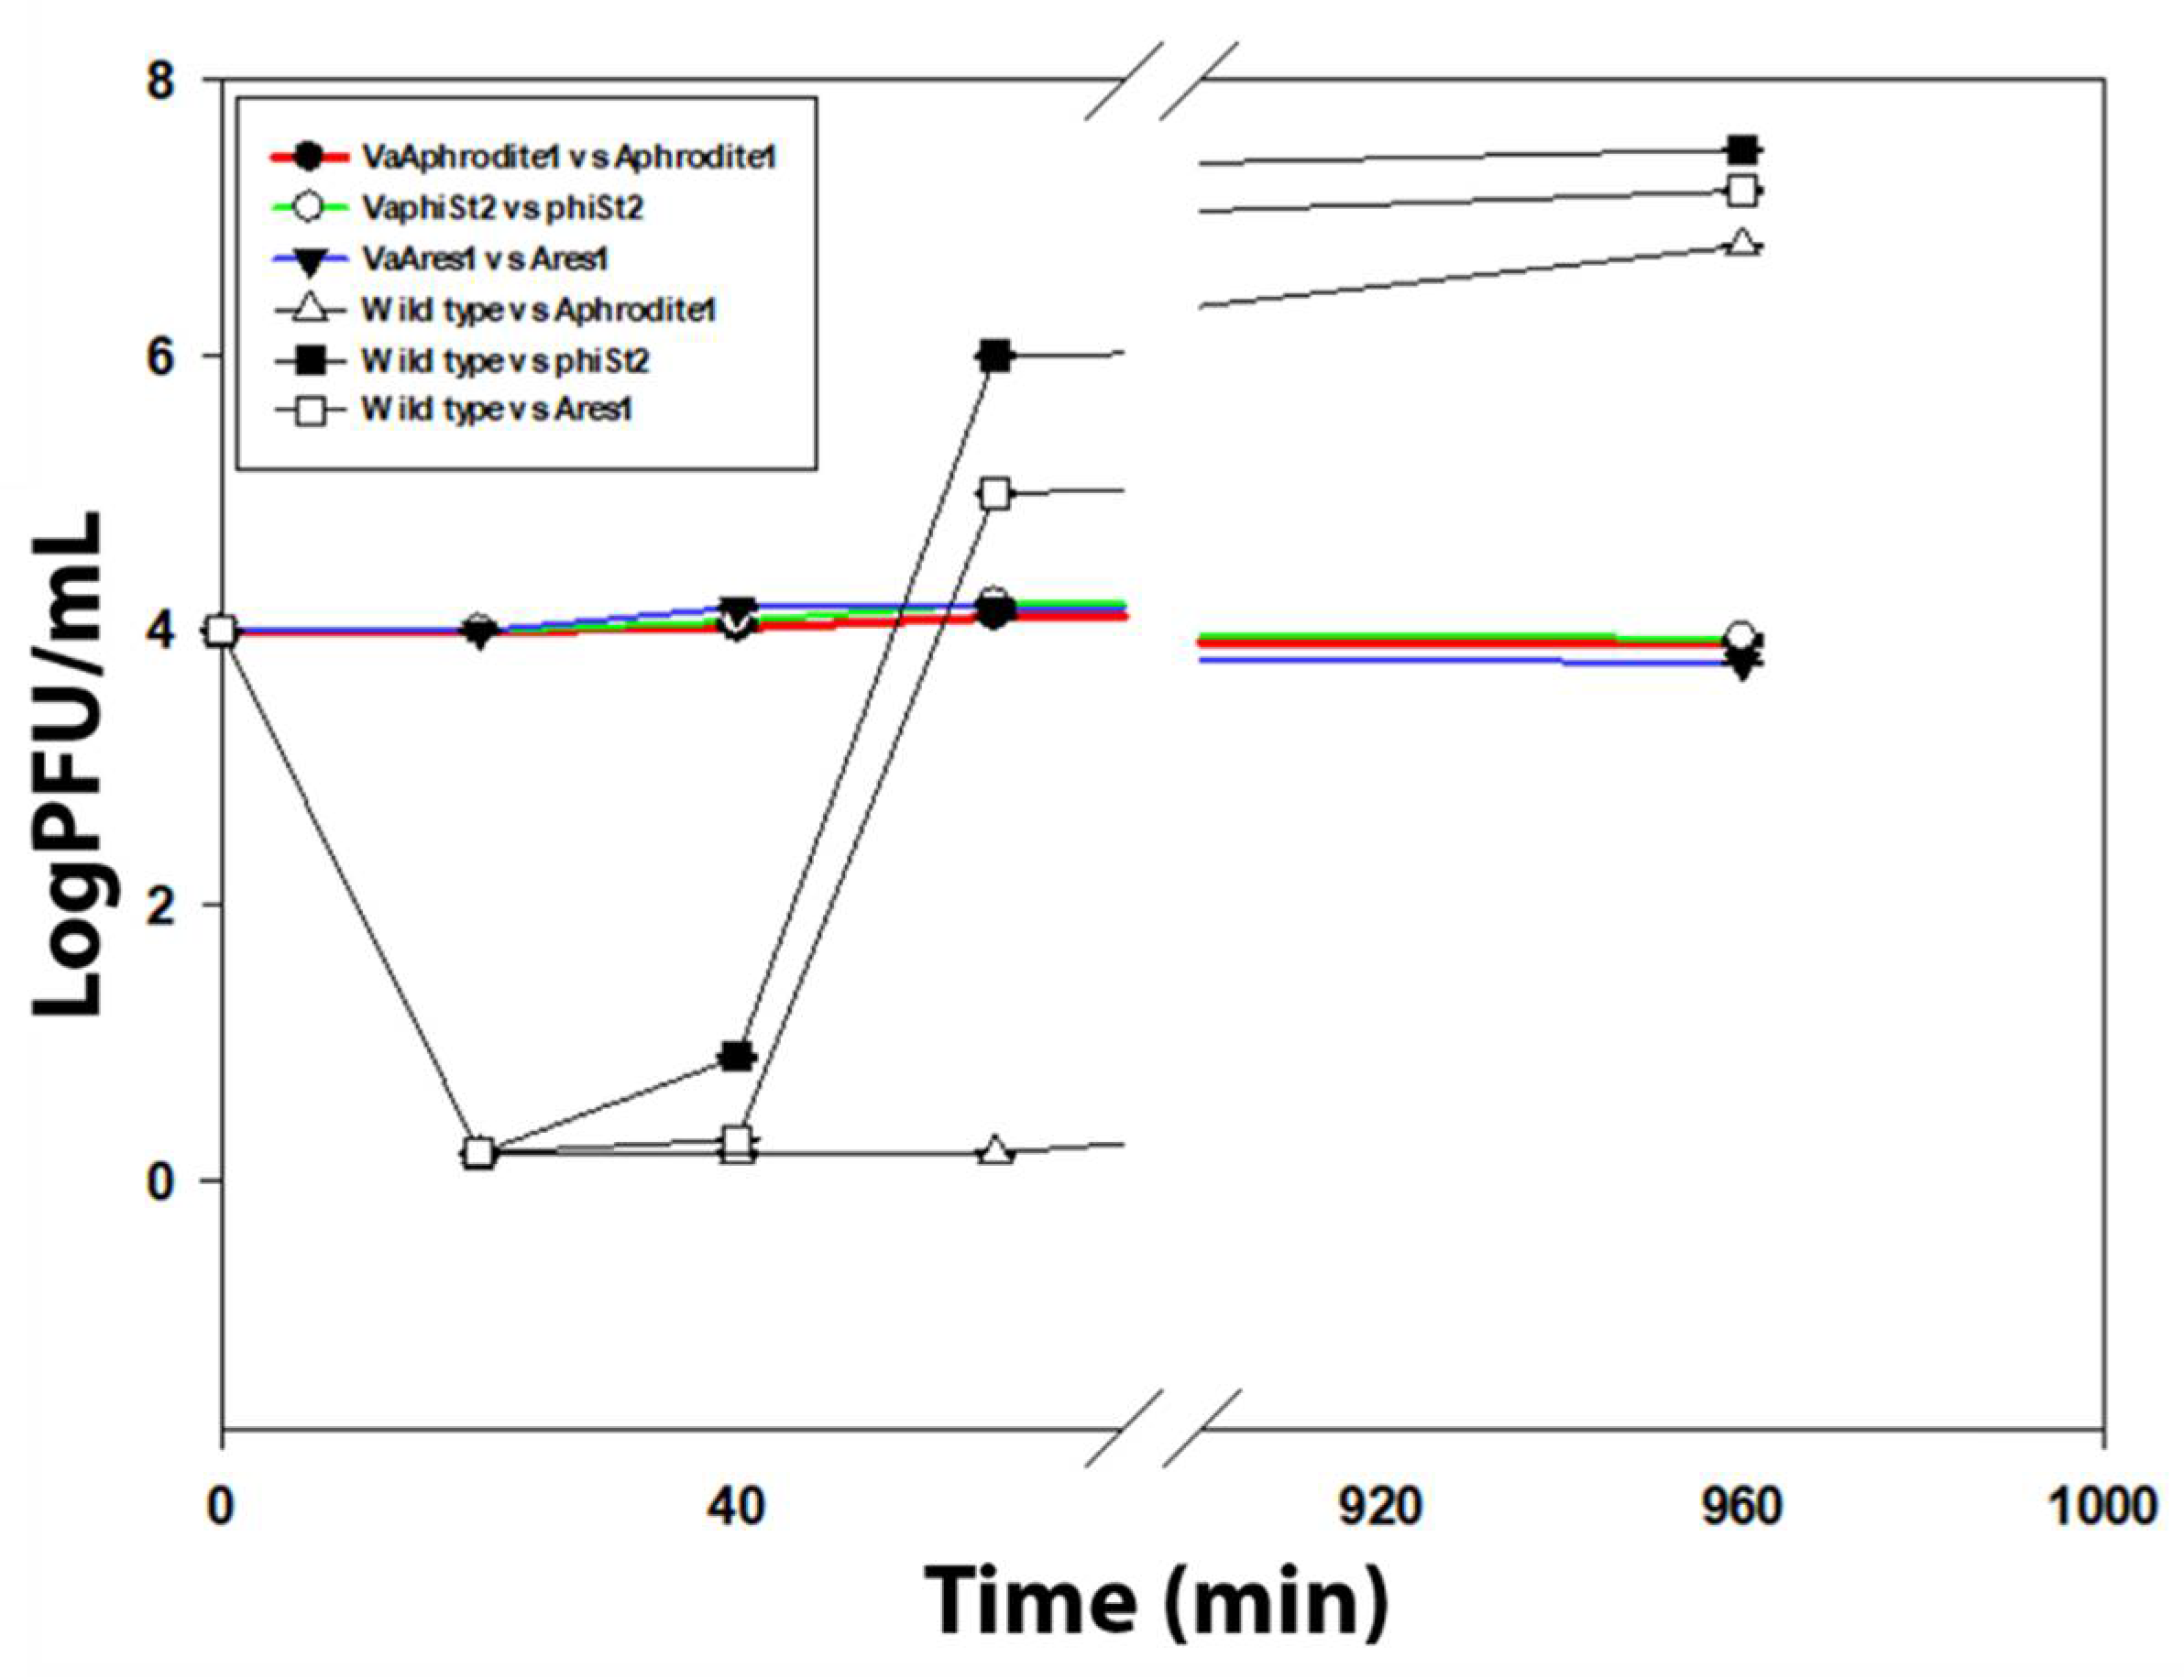
3.2. Cross Infection and Growth Curve of Phage-Resistant Strains

Phage-resistant colonies were obtained as described in the respective materials and methods section and annotated based upon the phage to which they developed resistance, i.e., VaAphrodite1, VaphiSt2, and VaAres1 (Table 2). Resistance was maintained throughout all the experiments for all strains. In addition, cross-infection with all the phages presented in Table 2 showed that bacteriophages remained ineffective against their corresponding phage-resistant strain and effective against all the remaining strains, apart from Ares1, which remained ineffective against VaAphrodite1.
Furthermore, the growth kinetics of the phage-resistant strains were compared to those of the phage-susceptible strains (Figure 1). The resistant strains VaAphrodite1 and VaAres1 did not show any apparent changes in their growth rate. In contrast, resistant strains VaphiSt2 displayed a diverse growth pattern. Two out of the three resistant strains exhibited reduced growth compared to the wild type, while the growth rate of the third remained unaffected. Specifically, during their exponential phase and 5 h after incubation, the two independent colonies exhibited 36% and 12.5% reduced OD600 compared to the wild-type strains, resulting in a differentiation in their growth rate (Supplemental Figure S1).

3.3. Study of Anti-Phage Defense Systems of Vibrio alginolyticius

To uncover mechanisms of acquired resistance, two different strategies were followed: (i) a genome annotation analysis of V. alginolyticus strain V1, to pinpoint known molecular mechanisms that could confer acquired resistance, and (ii) measurement of phage adsorption on resistant strains. The genome of V. alginolyticus strain V1 was in silico analyzed in order to identify potential CRISPR/Cas systems [23], which could confer an adaptive molecular mechanism. We identified three putative Cas homologs, with corresponding protein ids KLI72196, KLI72197, KLI72198 in the genome of V. alginolyticus strain V1, via comparative sequence analysis. However, our initial annotation could not be verified using the CRISPRsFinder software. Only a small genomic region in Contig 18 was identified as a putative Crispr/Cas associated product, using CRISPRsFinder, and this was not supported by HMMCAS software, leading us to conclude that this Vibrio stain does not possess a functional CRISPR/Cas system. Harbored prophages in the bacterial genomes have also been shown to contribute to phage resistance against lytic bacteriophages by a molecular mechanism called superinfection immunity [48]. Genome annotation did not reveal the presence of any whole prophage harbored in the genome of strain V1, and only isolated phage-related proteins were located, for example, genome ids KLI74070, KLI74028, KLI74283, KLI74284, KLI74285, and KLI74292. Finally, genome alignment of known and well-characterized BREX and DISARM genome cassettes in the genome of V. alginolyticus V1 did not reveal any positive results, which could also potentially confer resistance. On the other hand, phage adsorption assays revealed no adsorption process by resistant strains, even after 16 h of co-culture (Figure 2), when using phages of the original stock. These results indicate a radical modification of proteins that consist of the bacterial membrane, possibly responsible for the impaired adsorption and infection.

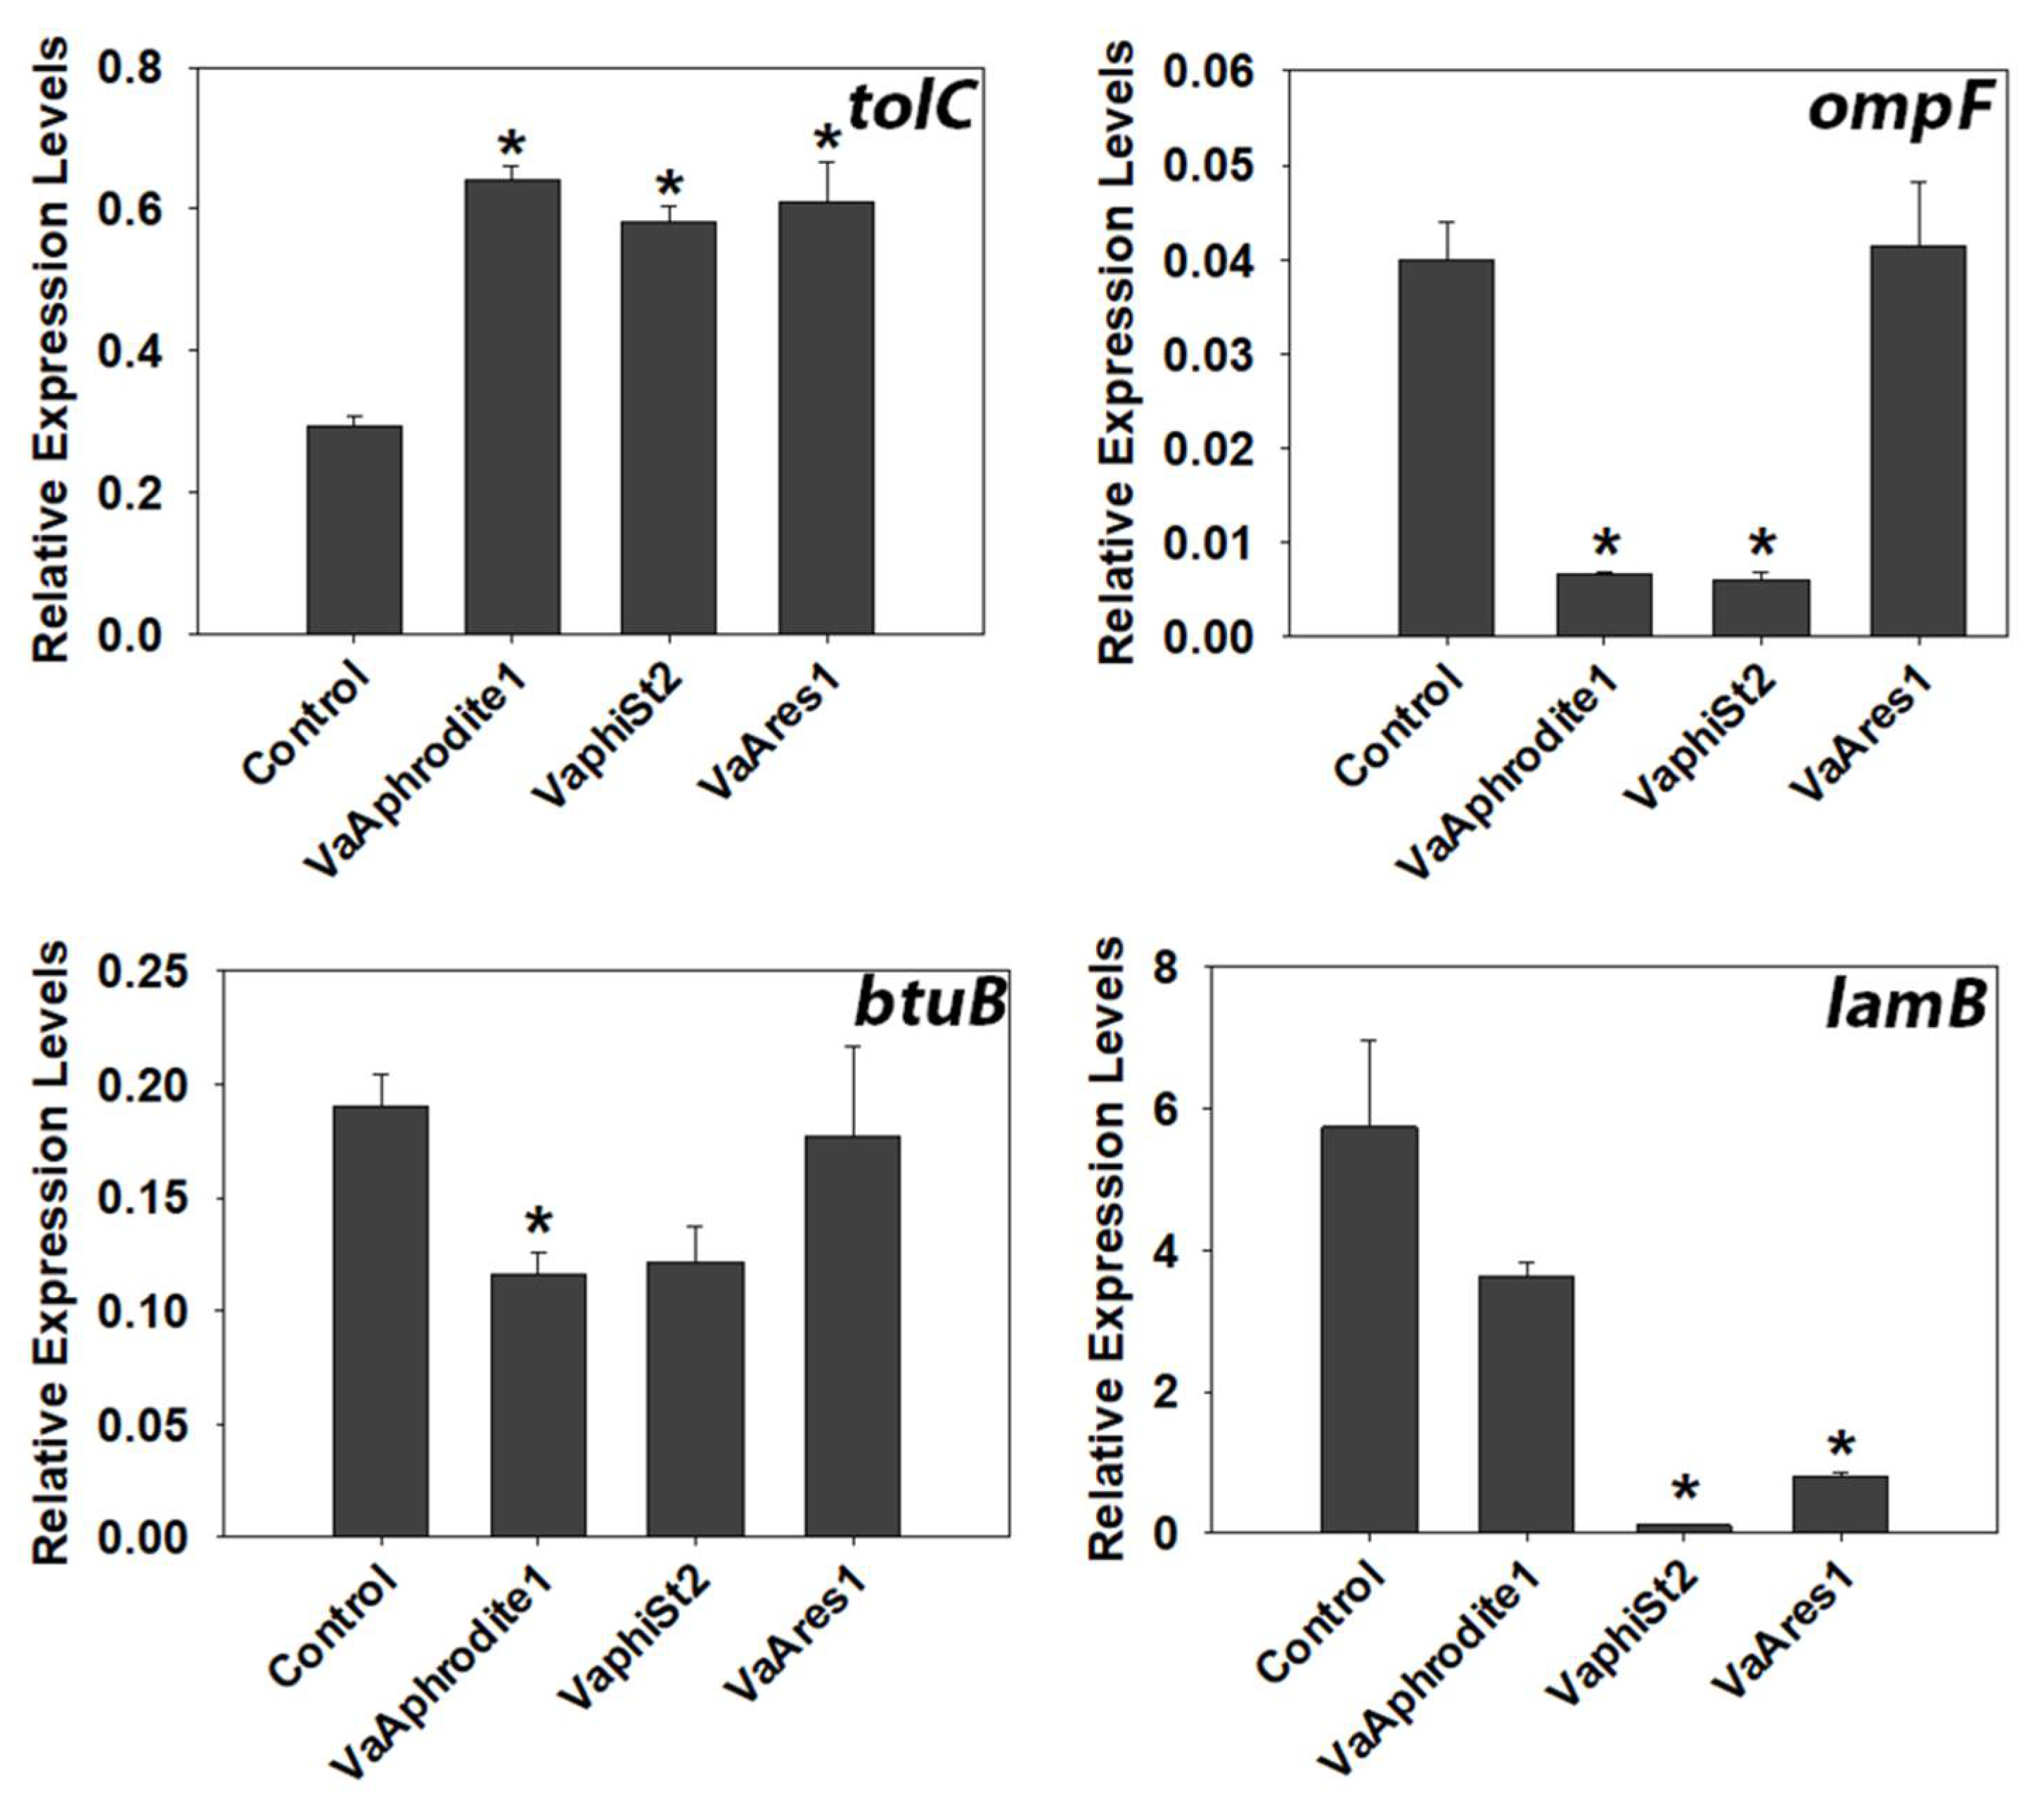
3.4. Transcript Profiling of Bacterial Genes Involved in the Phage Infection Process

Bacteriophage adsorption is the initial step for a successful infection process, as was demonstrated in detail for λ bacteriophage [49]. In the case of Aphrodite1, phiSt2, and Ares1, the exact bacterial receptors mediating infection remain to be established. However, in order to test whether the observed phage resistance is accompanied by changes in the expression of selected genes coding for bacterial outer and inner membrane proteins, we used an RT-qPCR-targeted transcriptomic approach. Targeted outer membrane proteins included proteins that have been well characterized as phage receptors, such as vitamin porin protein BtuB [50], maltose porin LamB [49], osmotic adjustment protein OmpF [51], and TolC ABC-like transmembrane protein [52] (Figure 3, Supplemental Table S1). Interestingly, ompF showed a 10-fold downregulation in the resistant strains for bacteriophages Aphrodite1 and phiSt2. Additionally, the lamB relative transcript levels were drastically 57- and 7-fold downregulated in VaphiSt2 and VaAres1 resistant strains, respectively. Finally, the btuB relative transcript levels were significantly downregulated in VaAphrodite1 strains. In contrast, we were able to detect a 2-fold statistically significant accumulation of tolC gene transcripts in all the resistant bacterial strains included in this work.
Additionally, we selected several membrane and transmembrane transport systems in order to study their gene expression patterns in wild-type and phage-resistant Vibrio strains for all phages used in the study (Supplemental Table S1). Interestingly, the results revealed mostly highly depleted relative transcript levels for all three bacteriophages. These included mainly ABC and PTS transporters, which consist of several subunits, among them permeases, which are responsible for delivering the nutrients from the periplasmic space into the cytoplasm (Table 3 and Table 4). Transcript levels for the permease domains livH, livB, and azlC, which are responsible for the transport of aliphatic amino acids with side chains, such as leucine, valine, and isoleucine, were studied. Our results revealed a statistically significant downregulation of the relative transcript levels for both livH and livB for the resistant strains. For the two azlC genes, in the case of VaphiSt2 and VaAphrodite1, we observed a 4-fold and 0.7-fold reduction in Azlc1 transcript levels, respectively, while azlC 2 transcripts were 2-fold downregulated in VaAres1. As for the cysteine transporter-encoding gene tcyP, we observed a significant downregulation for all the resistant strains. Transcripts for metL, metN, and metQ genes, encoding the three subunits of the methionine ABC transporter, showed significant downregulation in the resistant strain VaAphoridite1 in comparison to phage-susceptible strains. In addition, VaphiSt2 strains showed a significant downregulation for metl and metN subunit transcripts although transcript downregulation was also observed in metQ without being statistically significant. In the case of Arginine transporters encoded by the genes artP and artL, both showed a 5-fold downregulation in the case of VaAphrodite1. They also presented a 2-fold downregulation in the case of VaAres1, with artL being statistically significant. No alterations were observed in the case of VaphiSt2. The lysine export system in bacteria is represented by a protein encoded by the gene lysE, showing drastically reduced transcript levels (76-fold downregulation) only in the case of VaAphrodite1 resistant strains, but transcript levels remained unaffected for the other two phage-resistant strains. In addition, one of the rhtB genes coding for an LysE-like transport system, responsible for the export of Homoserine and Threonine, showed lower transcripts in the VaphiSt2-resistant strains. Finally, our results revealed that the hisP gene transcripts, encoding an ATP-binding protein dedicated for energy delivery in transport systems of Histidine, Lysine, Arginine, and Ornithine, were significantly downregulated in the resistant strains VaAphrodite1 and VaphiSt2.
In addition, we studied the transcription of selected genes coding for sugar and polyol transport systems. Genome wide annotation [29] of V. alginolyticus showed that the glucose PTS transport system is comprised of two permease isoforms encoded by ptsG 1 and ptsG 2 genes, and one subunit responsible for delivering ATP to the transport system encoded by crr. Interestingly, our results revealed statistically significant downregulation of ptsG 2 and crr in all resistant strains. By contrast, ptsG 1 expression was upregulated 4-fold in the resistant strain VaAphrodite1. The trehalose transport system is encoded partially by the gene treB, a subunit responsible for encapsulation and transport from the periplasmic space to the cytoplasm. Our results revealed a significant downregulation only for the resistant strains of bacteriophage Aphrodite1. A similar pattern was observed for fruA transcripts, encoding for the permease protein responsible for transporting fructose. In addition, mtlA transcripts, coding for a transmembrane complex responsible for transportation and phosphorylation of mannitol, showed a 10-fold downregulation only in VaphiSt2 strains. As part of the ribose transport system, rbsA, encoding for the ATP-binding subunit, was downregulated in all three phage-resistant strains. Furthermore, the cellB gene, encoding for permease responsible for translocating cellulose, was found to be significantly downregulated in VaAphrodite1 and VaphiSt2. Finally, ptsN gene transcripts, coding for a nitrogen transport protein, exhibited significant downregulation in both VaAphrodite1- and VaphiSt2-resistant strains, while ptsH, coding for the phosphorous carrier protein Hpr, showed lower mRNA levels only for VaphiSt2-resistant strains. The results showed that amino acids-related proteins were subjected to a more significant transcript reprogramming across all phage-resistant strains than the sugar-related proteins.

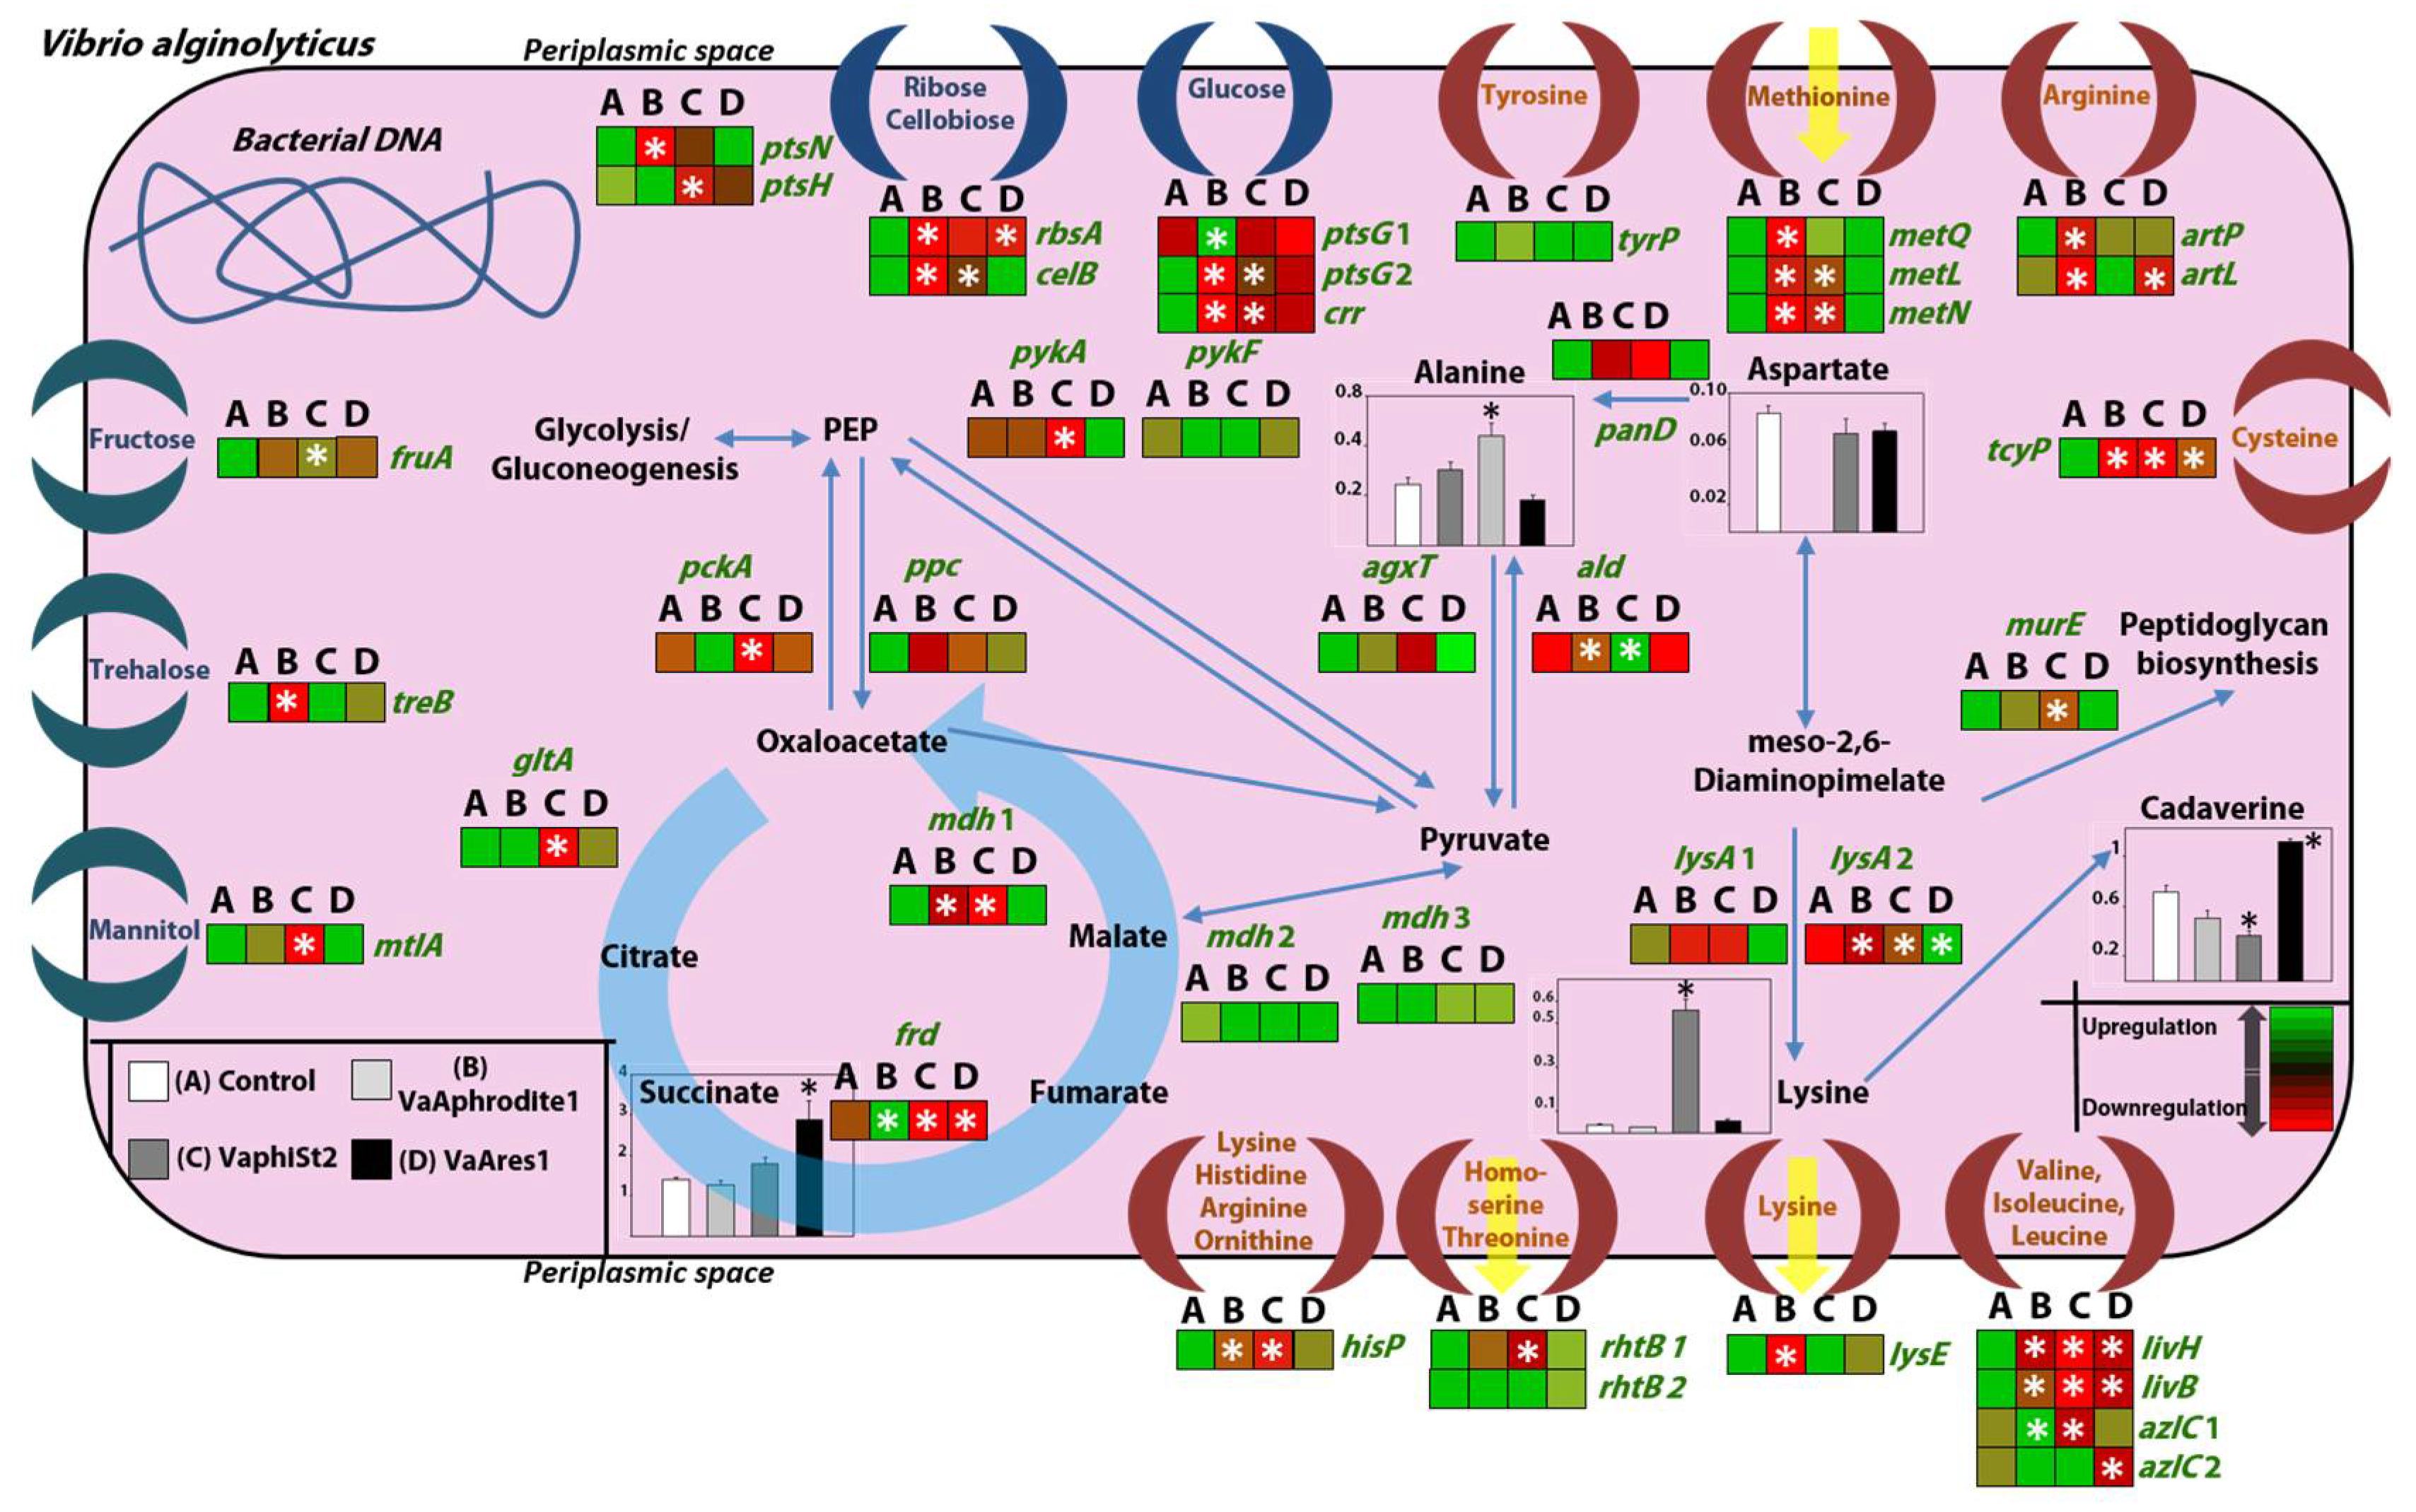
3.5. Transcript Profiling of Genes Coding for Key Metabolic Enzymes

The observed changes in the accumulation patterns of many bacterial transcripts involved in nutrient transport prompted us to study the cellular biochemical processes involved in the metabolism of the respective compounds. For this purpose, an expression study of 21 selected genes involved in major bacterial metabolic pathways was conducted for our resistant Vibrio strains (Supplemental Table S1, Table 4 and Table 5). Three major metabolic pathways were studied, including alanine metabolism, lysine metabolism, and the TCA cycle and its anaplerotic reactions. Interestingly, transcript accumulation for ald encoding alanine dehydrogenase was significantly higher in resistant strains VaAphrodite1 and VaphiSt2 compared to wild-type bacteria. The amino acid ligase encoded by murE shown a 2-fold transcript accumulation only for VaphiSt2-resistant strains. The results for one of the lysine decarboxylase genes, lysA 2, showed a statistically significant upregulation for all the resistant strains, with VaAres1 exhibiting a 10-fold transcript accumulation. Additionally, alanine glycosylate (agxT) and aspartate 4-decarboxylase (panD) did not exhibit any statistically significant differences among the resistant strains. The study of genes involved in the TCA cycle and its anaplerotic reactions revealed substantial differences between the resistant and susceptible strains. Specifically, relative transcript levels of phosphoenolpyruvate carboxykinase (pckA) showed a 2-fold statistically significant accumulation for VaAphrodite1-resistant strains and a drastic 40-fold significant downregulation for VaphiSt2-resistant strains. Fumaric acid reductase (frd) also showed a similar pattern of a 7-fold statistically significant upregulation for VaAphrodite1 strains and a 17.5- fold statistically significant upregulation for VaphiSt2, while VaAres1 appeared to be significantly downregulated. Malic acid decarboxylase (mdh) showed significant downregulation for both resistant strains VaAphrodite1 and VaphiSt2. PEP carboxylase (ppc) transcripts appeared to be downregulated in all of the respective resistant strains without being statistically significant. Citrate synthase (gltA) was statistically significantly downregulated in resistant strains only for VaphiSt2. Two pyruvate kinases were tested in this study (pykA and pykF). Only pykA appeared to be downregulated significantly (12-fold) for resistant strain VaphiSt2, while it was upregulated for VaAres1. The results of the studied metabolic pathways revealed a strong metabolic adjustment for bacteriophage phiSt2, a medium adjustment for bacteriophage Aphrodite1, and a minor adjustment for bacteriophage Ares1.

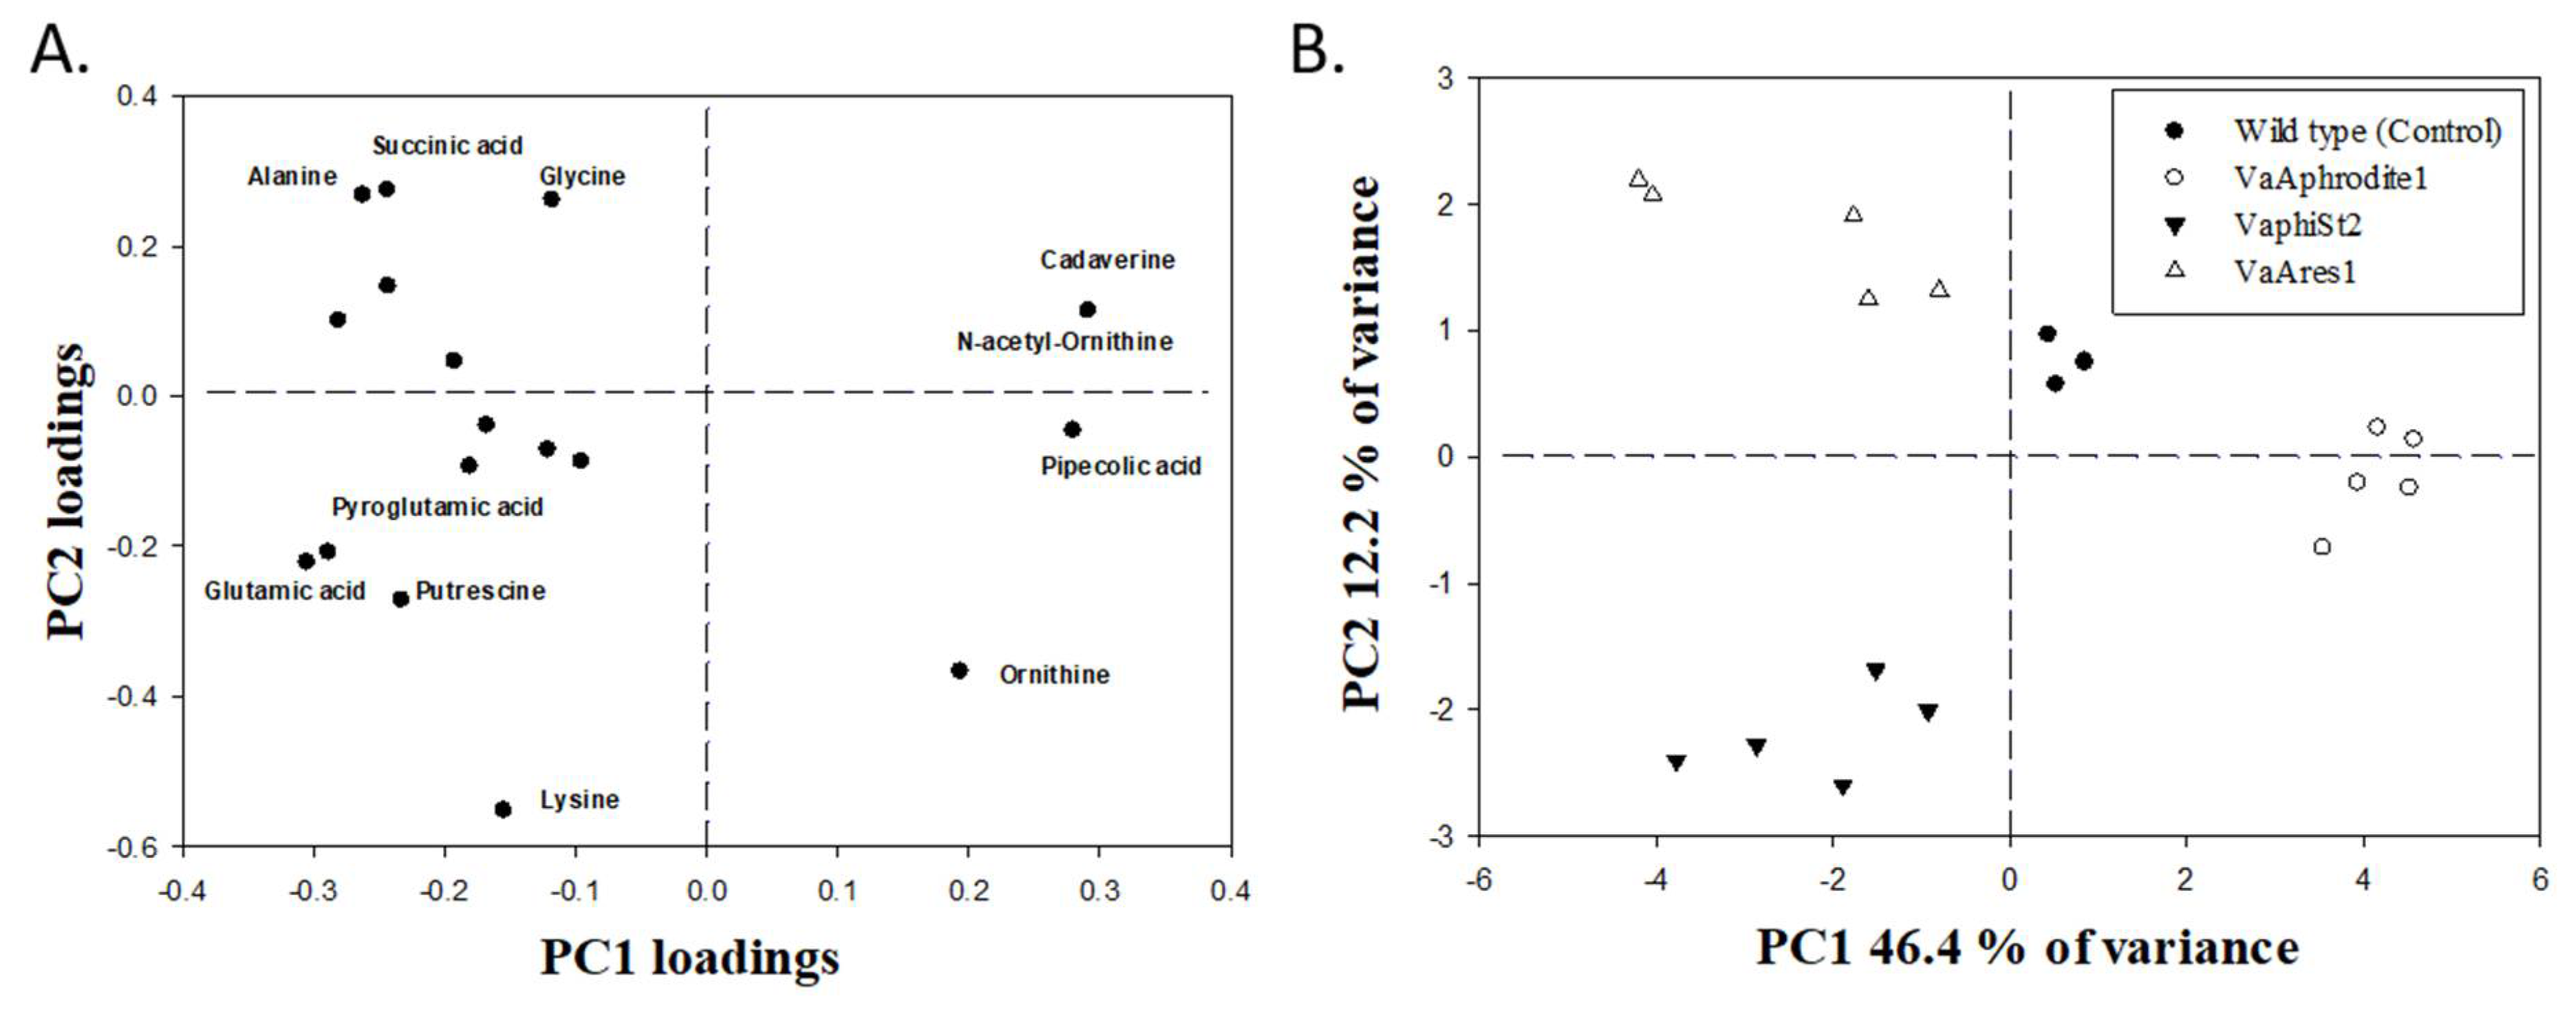
3.6. Metabolomic Profiling of the Resistant Strains

In order to test whether the transcriptional reprogramming observed in several transport systems and related metabolic processes in our Vibrio-resistant strains could also lead to changes in the cell metabolome, we employed a GC-MS-based metabolomic approach. Partial Least Squares Discriminant Analysis (PLS-DA), which clusters the samples into groups, revealed strong differentiation in metabolite contents after interaction with different bacteriophages, hinting at phage-specific metabolome reprogramming. The first principal component (PC) accounted for 46.4% of the total variance in the means of the relative metabolite content and separated resistant strains VaArphrodite1 and VaAres1 from the wild type (control). The second PC component accounted for 12.2% of the total variance and discriminated resistant strains VaphiSt2 (Figure 4B, Table 6).
Several amino acids as well as some organic acids were positively identified. Among them, proline and aspartic acid were not detected in VaAphrodite1 strains. Ornithine showed statistically significant accumulation in VaAphrodite1 strains and was not detected in VaAres1-resistant strains. Glutamic acid showed a statistically significant reduction of its relative content in VaAphrodite1 strains. By contrast, significant accumulation in the resistant strain VaphiSt2 was observed. Similar accumulation in the resistant strain VaphiSt2 appeared for pyroglutamic acid. Cadaverine showed accumulation in each of the VaAphrodite1 strains, but a significant reduction in its relative content levels in VaphiSt2. Lysine showed 10-fold higher accumulation only in VaphiSt2-resistant strains, while the leucine content decreased in VaphiSt2 and VaAres1. Norleucine, alanine, and glycine also exhibited accumulation only in resistant strain VaAres1. Interestingly, the polyamine putrescine exhibited a 2-fold higher content only in VaphiSt2. These results are indicative of a strong amino acid metabolism reprogramming accompanying the development of resistance for the lytic bacteriophages. Correlations between alterations of amino acid contents and transcript regulation of genes due to acquired resistance were also observed. Finally, in the group of organic acids, succinic acid showed a 3-fold statistically significant increase in its respective relative content levels only in resistant strain VaAres1, and pipecolic acid was detected only in resistant strain VaAphrodite1.

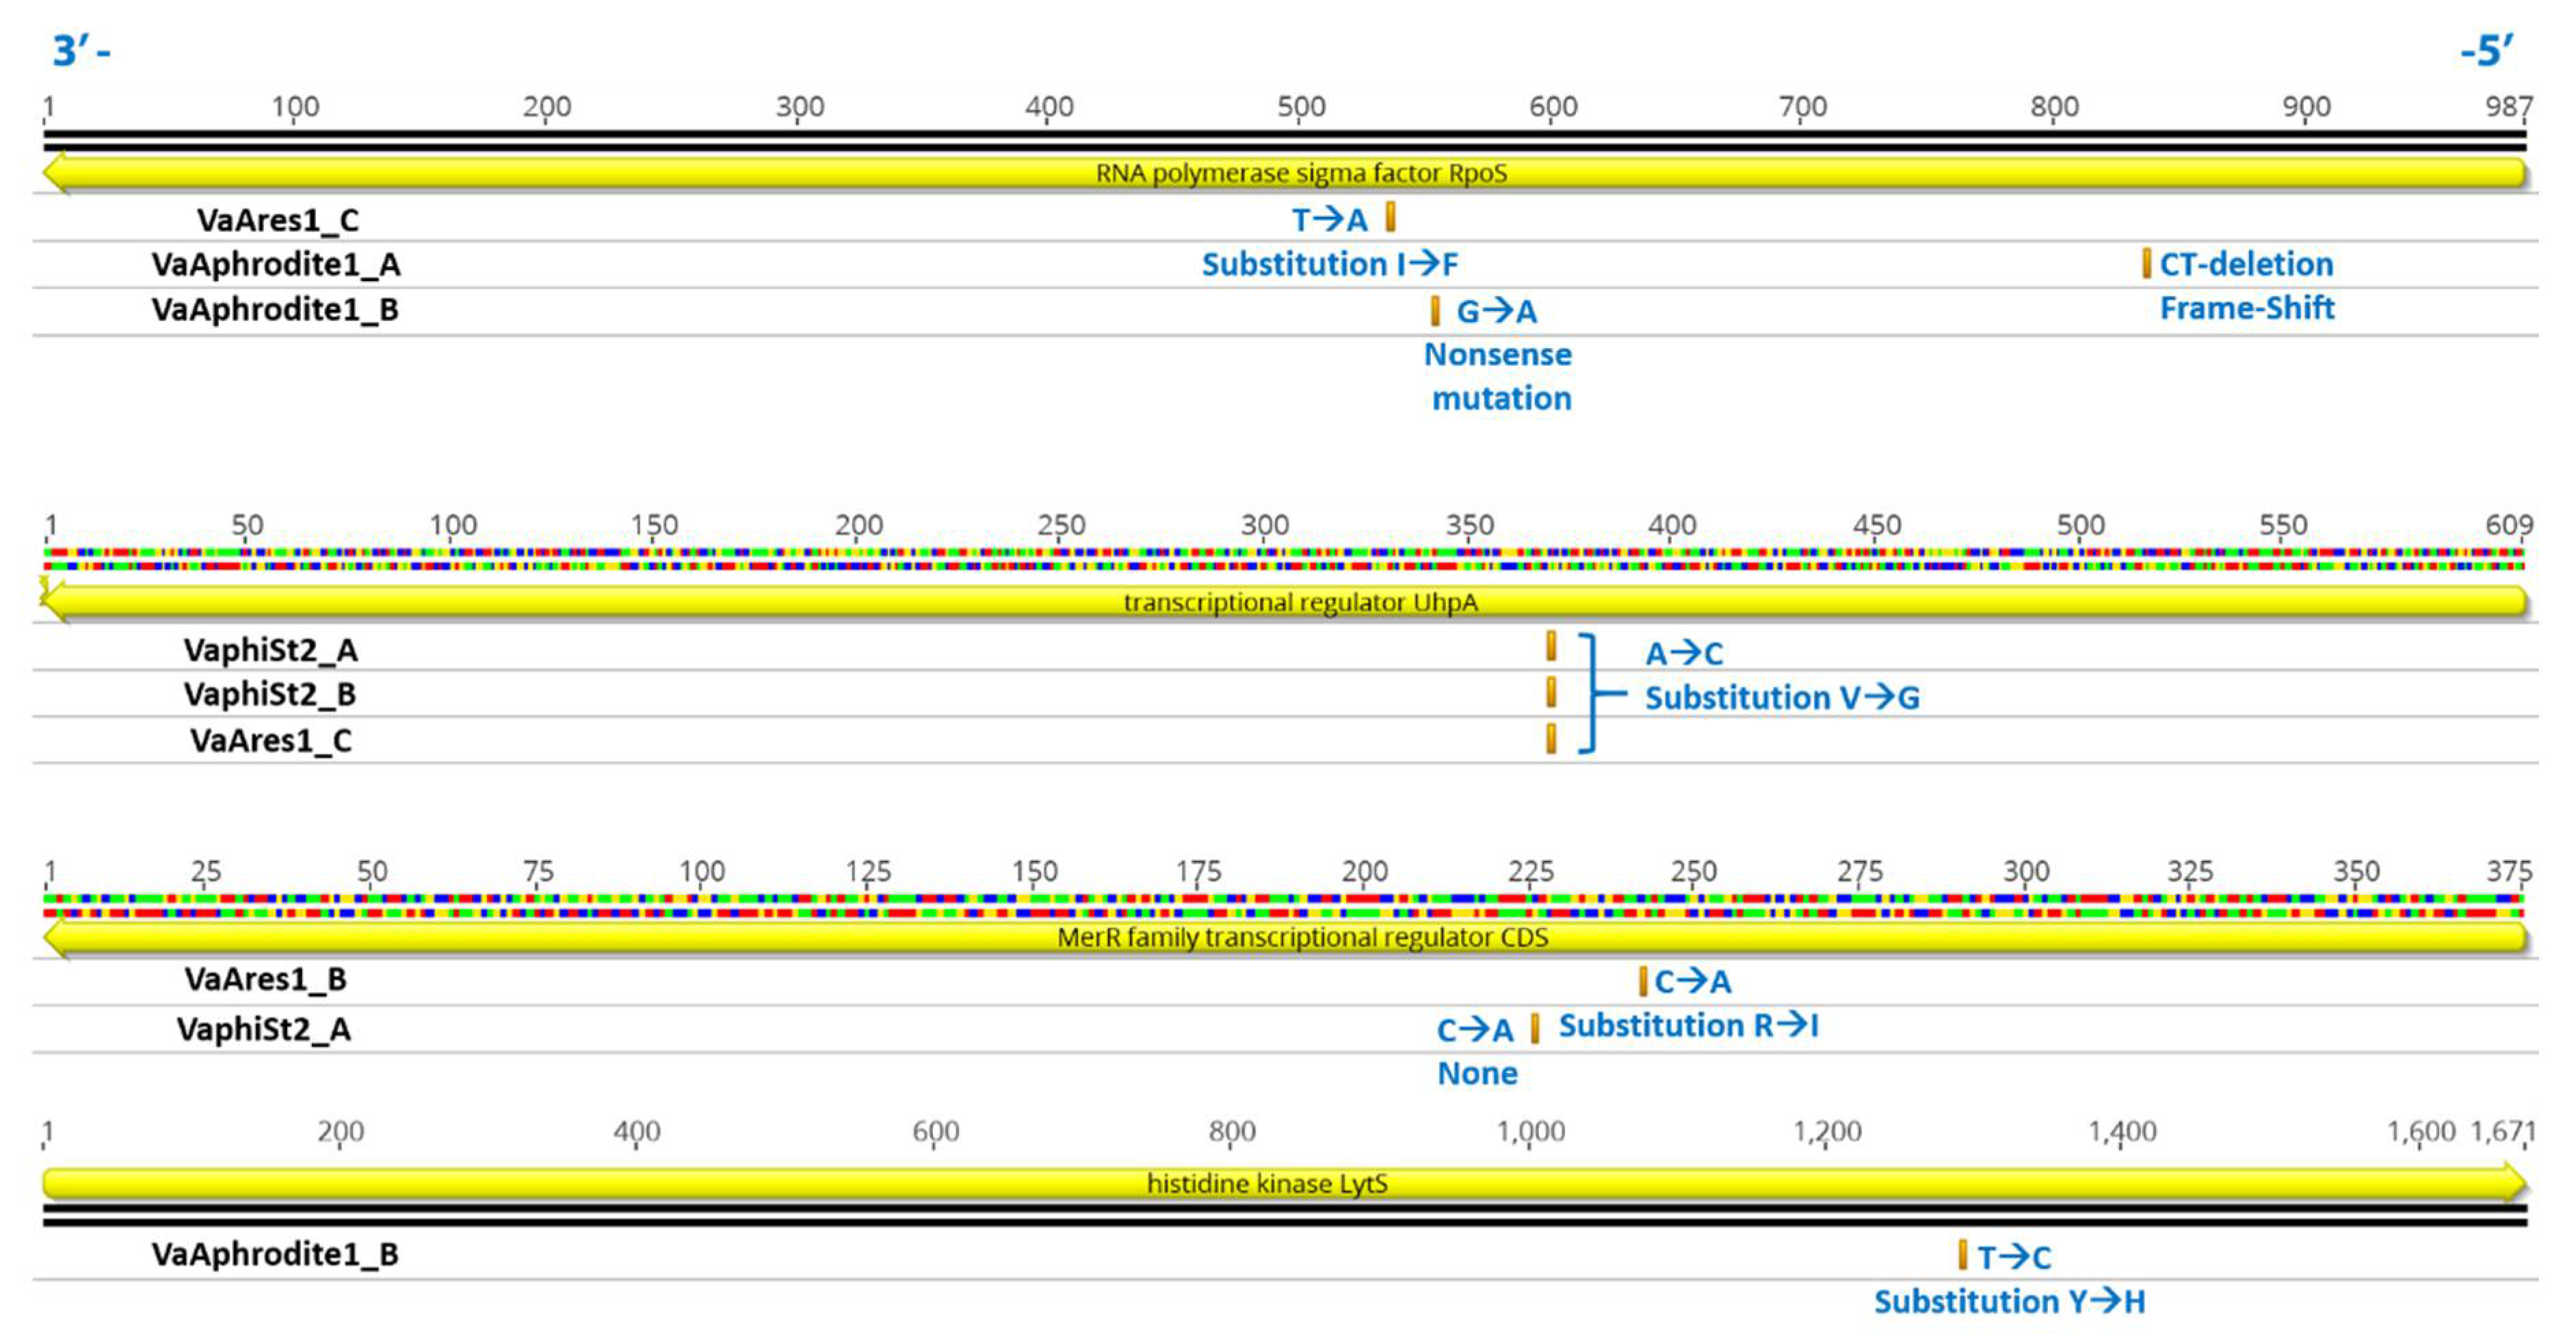
3.7. Comparative Genomic Analysis of Resistant Vibrio Strains

In an attempt to gain a deeper insight into the molecular mechanisms of the observed impaired phage adsorption and transcriptional changes, we employed whole genome sequencing and comparative genome analysis of the target resistant Vibrio strains. Our main goals were (i) to investigate if the reported phage receptors studied here harbored amino acid substitutions that could result in defective phage adsorption and/or (ii) if the overall underlying genetic changes could provide clues for the observed transcriptional reprogramming. Thus, we sequenced three resistant strains for bacteriophages Aphrodite1 and Ares1 and two resistant strains for bacteriophage phiSt2. Illumina sequencing produced 7307072, 6,051,830, and 8,298,832 clean reads for VaAphrodite1 strains, 6,868,528 and 8,946,130 of clean reads for VaphiSt2 strains, and 6282184, 6,509,178, and 8,535,362 clean reads for VaAres1 strains. The map used for the reference assembly process mapped 6334151, 5,786,703, and 8,285,229 reads for VaAphrodite1 resistant strains, 4,031,927 and 8,930,089 for resistant strain VaphiSt2 and, 8285229, 4,341,793, and 6,485,229 for resistant strain VaAres1. These 150 bps reads corresponded to at least a 110X genome coverage for each assembly.
Interestingly, we could not detect any polymorphisms, deletions, or insertions in the resistant strains regarding the candidate phage receptors included in this study, or any of the reported genes that are related to membrane or transmembrane nutrient transport (Supplemental Table S3) or their neighboring genomic areas. Nevertheless, several polymorphisms were detected in numerous regions (Supplemental Table S3). Overall, resistant strain VaAphrodite1 harbored 471, 477, and 437 SNPs, VaphiSt2 harbored 525 and 451, and VaAres1 strains 493, 496, and 489 SNPs for each different resistant colony that was sequenced. In total, only two genomic deletions were observed, including the resistant strain for bacteriophage phiSt2, harboring a genomic deletion of 9171 bases in Contig 2 of the reference strain, between bases 223,684 and 232855. This region harbors 14 CDSs, including 10 hypothetical proteins (KLI74020, KLI74022, KLI74024, KLI74025, KLI74026, KLI74027, KLI74029, KLI74030, KLI74031, KLI74070), one putative regulatory protein containing a DUF3653 domain (KLI74019), one protein with phospholipase activity and a putative DNA repair role (KLI74021), one phage-related protein, and finally a peptide described as a toxin, harboring a Zot domain (KLI74023). All the resistant strains had a deletion in Contig 68 of the reference strain, within a hypothetical protein (KLI69882), known to have a tandem repeat motif, common among Vibrio species. In addition, several common SNPs among all the resistant strains were observed in the ribosomal 5 s, 16 s, and 23 s rRNA genes. Interestingly, genes coding for sigma factors, two-component systems, and transcription regulators were found to be usual targets of SNPs in the resistant strains studied here (Figure 5). These included the transcriptional regulator UhprA (KLI73980), known for regulating the phosphorylation of hexoses in Gram-negative bacteria, which exhibited a Val80 to Gly80 substitution in one of VaAphrodite1-resistant strain and in both the VaphiSt2-resistant strains. The MerR transcriptional regulator (KLI73845), which is known to respond to the presence of antibiotics and environmental stimuli, also showed a Tyr134 to His134 substitution in one VaAres1-resistant mutant. Additionally, the sigma factor RpoD of RNA polymerase (KLI73168) was a target of nine polymorphisms in one VaphiSt2 resistant strain and 20 in one VaAres1 resistant strain, although none of these polymorphisms resulted in amino acid substitutions or other protein effects (Supplemental Table S3). On the other hand, the gene coding for the RpoS sigma factor of RNA polymerase (KLI71089), harbored mutations in two out of three VaAphrodite1-resistant strains, including a 2-nucleotide deletion in position 150 driving a protein frameshift, and the introduction of a stop codon in position Ala151, resulting in a nonsense mutation and subsequently a merely or non-functional protein. Additionally, a substitution of Iso433 to Phe433 was observed in one VaAres1-resistant strain. Finally, one of the VaAphrodite1 mutants was also found to harbor a Tyr432 to His432 transition in a histidine kinase (KLI70462) sensor.

4. Discussion

Biological models of coevolving a gene for a gene between virulent bacteriophages and bacteria cannot provide explanations for the origin of various bacterial traits [53], which could be the result of a more complex molecular and metabolic strategy. In our study, we were able to pinpoint alterations in both the metabolic and phenotypic levels by generating independent phage-resistant strains for three phylogenetically distant vibriophages. We were also able to conclude that the most prominent would be to search for an adaptive mechanism with a membrane-related origin responsible for phage rejection by examining the molecular capacity of V. alginolyticus strain V1 and the reduced adsorption process of the resistant strains (Figure 2). Additionally, growth kinetics revealed a slight reduction in the growth of resistant strains for bacteriophage phiSt2 (Figure 1). This observation suggests a phenotypic impact, especially taking into account the very short duplication time of Vibrio species [54]. This indication corroborates previous results on Vibrio species [55], which demonstrated various novel traits (including reduced growth) of resistant bacteria to a lytic bacteriophage.
Survivability of bacteria against virulent phages depends on agile evolution [56] represented either as genomic mutations [57] and/or adjustment of an already present mechanism to counter infection [57,58]. Mutations have been demonstrated and linked with acquired resistance on motility proteins and putative transporters [59] and outer membrane proteins [54,60,61] in aquatic Gram-negative species.
In the past, proteomic analysis of phage-bacterial interactions indicated that acquired resistance could be a result of a larger scale, fine-tuned protein regulation mechanism, including alterations of protein abundance of main phage receptors, inner membrane, and transmembrane proteins, as well as key metabolic enzymes capable of reprogramming cell metabolism [62].

4.1. Major Transcriptional Reprogramming Could Confer Phage Tolerance

Bacterial membrane protein modifications, either at the transcriptional or structural level, could represent a defensive strategy against bacteriophages [58]. Bacteriophage λ is able to utilize mainly a maltose porin for adsorption at the membrane of E. coli [49]. Considering infection strategies such as λ bacteriophage, putative transcriptional changes of membrane and transmembrane proteins were studied (Table 3 and Table 4, Figure 3 and Figure 6). Generally, bacteriophages recognize various receptors in the outer membrane of bacteria, which could be proteins or even polysaccharides [63]. It is also well established that the same phage genera could also utilize the same receptors for adsorption [64].
Our results showed statistically significant downregulation in the relative transcript levels of outer membrane proteins involved in phage adsorption, such as OmpF in the case of resistant strains VaAphrodite1 and VaphiSt2. OmpC, OmpF, and OmpK porin proteins have been strongly correlated with phage adsorption for Tequatrovirus phages and Schizotequatroviruses phages [65,66,67] and have also been characterized as major virulence factors [68]. Transcriptional adjustment of these proteins could correlate with phenotypic variations in bacterial virulence [69]. Additionally, lamB transcripts appeared to be almost depleted in the case of Ares1 and phiSt2 bacteriophages. LamB porin is the main receptor of the siphovirus λ, information that is in accordance with our results of the bacteria resistant to siphovirus Ares1 (Figure 3). This phage receptor has not been proposed to act as a binding site for Myoviridae phages, and the results for VaphiSt2-resistant strains show a transcriptional adjustment of non-specific phage receptors. The absence or decreased presence of the LamB porin in E. coli mutants was strongly correlated with decreased phage infection in the case of λ bacteriophages [15]. Decreased transcript levels were also observed for the BtuB protein in strains that interacted with the Aphrodite1 bacteriophage, a possible receptor for Tequintavirus bacteriophages [50]. In contrast, TolC protein, a possible receptor of podoviruses and siphoviruses, was upregulated in all three resistant strains. It is possible that by using the AcrAB-TolC efflux pump protein system, the resistant strains could enhance the extrusion of cytoplasmic nutrients and molecules [70] when other extraction channels are not functioning properly.
Loss or configuration of natural nutrient channels in both bacterial membranes of Gram-negative species interferes with the viral infection process and potentially could be involved in conferring a resistant phenotype [58,66,71,72]. Many membrane and transmembrane proteins have been linked to the viral invasion process [53], whose main role is nutrient assimilation and scavenging from the environment or the periplasmic bacterial space [19]. Our results revealed a strong transcript regulation of inner membrane proteins, including subunits localized in the cytoplasm, after phage-host interaction. We observed almost exclusively a significant reduction in mRNA levels for several transporter-coding genes, including transcripts for cysteine transporters (in all resistant strains) and the lysine exporter for VaAphrodite1 strains, where relative expression levels were almost totally depleted. Overall, results hint towards transcript reprogramming of the nutrient transport systems of the cells, which depends on the bacteriophage the bacteria have interacted with. Interestingly, the bacteriophages with the larger genome size (such as Aphrodite1 and phiSt2 with genome sizes greater than 200 kbs) resulted in more extensive transcriptional reprogramming in the cells. Significant gene expression changes in membrane and transmembrane proteins have also been reported previously [73] in Gram-negative Pseudomonas aeruginosa during infection with a lytic bacteriophage. Additionally, it is a well-known fact that the T4 bacteriophage causes extensive inner membrane protein redistribution in its host to achieve successful infection [11]. These results indicate that changes in the transcription of genes coding for both outer and inner membrane proteins in the host cell may play a pivotal role in conferring phage tolerance or in some cases, resistance.

4.2. Resistance to Lytic Bacteriophages Includes Metabolic Adaptation Mechanisms

The results of the transcript accumulation of membrane proteins hinted towards possible changes in the bacterial intracellular metabolism, a hypothesis tested by studying transcript levels of key metabolic enzymes and by monitoring the intracellular metabolome. Furthermore, possible metabolic reprogramming could account for the observed alterations in bacterial growth [55,72,74,75] and mobility [76,77,78].
In our case, the combination of transcript profiling with metabolome analysis revealed a clear shift of bacterial metabolism, linked to the development of phage resistance, and depended on the bacteriophage the bacteria interacted with (Figure 4). The observed changes in the transcription of the bacterial membrane proteins could result in extensive metabolic alterations in the tolerant bacterial strains [1,72,74,79,80] due to the failure of successfully assimilating the available nutrients in their habitat (Figure 6) [2,53,81].
Our study clearly showed an intense metabolic reprogramming of the bacteria as a result of bacteriophage resistance development, which includes accumulation or depletion of key gene transcripts and metabolites (Table 5 and Table 6, Figure 6), a fine-tuned bacteriophage-dependent process. Resistant strain VaAphrodite1 seemed to favor an alternative route for PEP production for fueling the TCA cycle, as seen by the highly induced pckA and frd genes and downregulation of mdh. This phenomenon agrees with the reduced content of several amino acids such as, proline, aspartic acid, glutamic acid, and pyroglutamic acid. The accumulation of ornithine also agrees with the downregulation of the hisP gene, an energy-providing subunit for ornithine translocation. Simultaneously, most PTS sugar transporters’ transcript levels were highly reduced, potentially resulting in a low intracellular content of sugars and polyols. These results hint towards a shift in the metabolism towards gluconeogenesis, which could require higher ATP consumption and correlate with the observed reduced transcript levels of ATP-subunits (such as mtlA, crr, rbsA, and hisP) in many transporters, which are known to be regulated allosterically [81]. Finally, these bacterial strains seem to not favor lysine conversion from the diaminopimelate (DAP) pathway, with lysA genes being significantly downregulated and the exported (lysE) having depleted transcript levels. Lysine biosynthesis is important for bacterial cell wall biosynthesis [82], and the DAP pathway being under expressed, could impose the low lysE transcripts regulation and subsequently reduced lysine excretion. Phage-resistant strains have a strong need for a robust lysine-rich membrane to maintain fitness and peptidoglycan integrity [83].
Our data suggest that bacteriophage phiSt2 causes the cell to undergo even greater metabolic reprogramming. Amino acids appear to play a key role in the metabolic state of these resistant strains. Most of the amino acids detected showed significant accumulation. Especially in the cases of lysine, glutamic acid, pyroglutamic acid, and leucine, the increased content was statistically significant. The leucine and isoleucine increased contents correlate with the decreased transcription levels of the corresponding membrane transporters, such as livH, livB, and azlC 1 (encoding for permeases responsible for transporting aliphatic amino acids with side chains) and their energy-providing subunit hisP. At the same time, depleted transcript levels of gltA, mdh, and frd genes were detected, hinting at highly reduced activity of the TCA cycle. It could be that the TCA cycle intermediates are being channeled towards amino acid biosynthesis such as glutamic acid, which is accumulated here, a precursor of the highly significantly accumulated lysine, a frequently targeted pathway in microbial engineering [84,85,86,87]. In fact, it is well documented that an adjusted carbon flux of the TCA cycle towards lysine production is adequate for sufficient cell growth [87]. In addition, the observed significantly reduced murE transcript levels, involved in peptidoglycan biosynthesis, correlate with the reduced growth observed for these resistant strains. Additionally, a significantly reduced cadaverine content could be indicative of high excretion of this particular metabolite. Gram-negative species are known to excrete cadaverine for decreasing outer membrane porins’ permeability, a mechanism that could significantly assist in achieving phage tolerance [88,89]. In addition, pckA, pykA, and lower level ppc transcripts were found to be significantly downregulated, indicating a decrease in the ATP-demanding process of gluconeogenesis and PEP abundance. Low ATP abundance could regulate the transcription of transporters allosterically as also discussed in the case of VaAphrodite1 strains. Low putative PEP abundance correlates with the statistically significantly reduced transcript levels of the HPr protein (ptsH gene), a protein that carries phosphorus from PEP to all PTS transport systems [18]. It is possible that an unknown mechanism controlling ATP and PEP as a bacterial community response to phage presence could orchestrate the regulation of ABC and PTS transporters, resulting in phage exclusion, but with utmost implications for cell physiology. PEP-dependent PTS systems are known to be strongly correlated with quorum sensing mechanisms in Gram-negative bacteria [90], assisting in the spreading of fine-tuned metabolic adaptation strategies to overcome various abiotic and biotic ecological niches.
Finally, in the case of resistant strain VaAres1, statistically significant accumulation of succinic acid correlated with the statistically significant downregulation of relative transcript levels of fumaric acid reductase (frd gene), which could indicate (i) that the cells favor the production of acetyl-CoA to fuel the TCA cycle through amino acids, such as leucine, alanine, glycine, and isoleucine, that appear to be accumulated and (ii) saves ATP molecules that could be incorporated to fuel ATP-subunits of the nutrient transport systems. At the same time, the relative transcript levels of livH and livB, which encode permeases of the ABC antiporter system of leucine and isoleucine, appeared strongly decreased, a common response of all presented phage-resistant strains. This could mean that excess of these amino acids cannot be sufficiently exported. Additionally, impaired transcription of ptsG genes could also be responsible for the accumulation of succinic acid [91] in Gram-negative bacteria. It is unknown whether the accumulation of succinic acid is also a result of low transcript levels in the succinic acid export protein or merely a collateral event of excess amino acids. Generally, this bacteriophage caused milder metabolic reprogramming in the cells as observed from the studied genes.
Interestingly resistant strains for Aphrodite1 also appeared resistant to Ares1, without the two corresponding resistant strains showing a common transcript decrease in the studied outer membrane receptors. In contrast, the results revealed common decreases in the relative transcript levels of transporter proteins, which could account for common unknown metabolic shifts, concluding that it is possible for phage tolerance to be accomplished via interaction with phages that are phylogenetically distant.
In comparison, bacteriophage phiSt2 affected the metabolic state of the cells more radically and caused a more complicated adaptive metabolism in the cells (Figure 6 and Figure 7), a possible fact that may be a result of a combined fast and efficient lytic activity contrary to the other phages [30], rendered by its complicated genetic “armory” [31].

4.3. Transcription Reprogramming in Phage-Resistant Becterial Strains Could Be Triggered by Genomic Lesions

In order to better understand the observed transcriptional alterations in the Vibrio- resistant strains, we performed whole genome sequencing and a comparison of the independent resistant strains used in this study with the wild-type Vibrio strain. This comparative genomic analysis revealed that in all cases, the development of resistance to the selected phages was not accompanied by induced mutation in any of the putative phage receptors and/or nutrient transporters studied (Supplemental Table S3). In contrast, several genomic lesions were clustered in genomic regions involved in bacterial transcriptional processes [92], including RNA polymerase sigma factor RpoS, the histidine kinase Lyts family, and transcriptional regulators (Figure 5). Interestingly, sigma factor RpoS has been implicated as a main transcriptional regulator during stress responses. Impairment of this gene was previously shown to induce profound metabolic reprogramming in Gram-negative bacteria under specific growth conditions, including several genes involved in glucose transport [93]. In addition, loss of RpoS has been shown to enable the cell to utilize an alternative range of substrates for metabolic purposes [94]. Dysfunction of this sigma factor also correlates with improved nutrient scavenging and utilization of alternate metabolic pathways [95]. In addition, substitutions, such as that observed for the VaAres1 strain, can result in the radical effect of dysfunction in the highly conserved sigma70_r2 domain of the protein [94]. Histidine kinases are also known to contribute to the regulation of transcription. In our work, the LytS histidine kinase mutated in one resistant VaAphrodite1 strain, in which sigma factor RpoS was also affected. Being part of a two-component regulatory system, this kinase is known to regulate genes involved in biofilm formation and cell wall metabolism [96]. In our resistant strain, the substitution was observed in the LytS domain. The MerR HTH family of regulatory proteins was also affected in one VaAres1-resistant mutant. Most MerR family transcriptional regulators are known to respond in antibiotic or other abiotic stresses [97] and can activate suboptimal sigma70-dependent promoters [98]. DNA-binding capacity is also altered when mutations are introduced in Gram-negative species, subsequently affecting its transcriptional role [97]. Combined mutations in both MerR and its promoter have revealed several and various phenotypes in Gram-negative species [97]. Regarding the transcriptional regulator UhpA, substitutions in the REC-domain, which acts as a phosphoroacceptor, could positively impact the phosphorus-binding feature of the protein, as previously seen [99]. The UhpA regulatory protein is known for controlling the expression of the hexose phosphate transporter UhpT by binding to its promoter. Increased phosphorylation of UhpA could result in decreased binding to the promoter of UhpT transporter and subsequently, decreased expression of the regulated metabolic pathway [100]. Strong correlations between transcriptional regulation of ptsH and UhpA system were shown previously [101]. In our work, the ptsH gene was significantly downregulated in VaphiSt2 strains (Figure 6), in which the uprA regulator exhibited SNPs. Inorganic phosphorus could significantly affect how cells reprogram their PTS system transcription [101] and subsequently could play a pivotal role in how cells develop phage resistance against specific bacteriophages in certain ecological niches.
Taken together, the observed mutations point towards a molecular mechanism resulting in the drastic transcriptional alterations observed in the current work and subsequently, to metabolic reprogramming of bacteriophage-resistant strains. To this end, our work is in line with previous work on Vibrio anguillarum resistant mutants, which showed various mutations between resistant mutants for a lytic bacteriophage and that transcriptional regulators and sigma factors can be targets of SNPs, with diverse metabolical and phenotypical effects [55]. Our work corroborates that study in the Vibrio genus. In any case, complementation experiments have to be performed in order to elucidate the precise molecular role of these genes in the induced phage resistance mechanism. In our case, we could not detect mutations in the case of the main receptors or their possible promoters (Supplemental Table S3), as was reported previously [55]. It is possible that for the Vibrio genus, spontaneous mutations in phage receptors are not required for impaired adsorption or/and infection.

5. Conclusions

The results presented here complement previous reports on the alterations taking place at the genomic and metabolic level after lytic phage-host interactions and raises the hypothesis of a far more complicated adaptation strategy for Gram-negative bacteria against lytic bacteriophages related to phage resistance (Figure 7). By combining data from different approaches, we examined a new perspective, that interaction could impose a complicated transcriptional-dependent resistance adaptation strategy, with metabolic implications on cell physiology. The observed metabolic reprogramming appeared to be customized for every bacteriophage that interacted with V. alginolyticus. It is possible that the limited host range of many bacteriophages observed for Gram-negative species is due to the metabolic state of the studied cells, a result of their habitat, nutrient availability, and/or ancestry phage interactions. This hypothesis could impact and update primarily the role of bacteriophages in microbial ecology in various habitats; in our case, the marine realm [102,103]. New experimental strategies could also elucidate how quorum sensing contributes to the spreading of a fine-tuned metabolic adaptation state for successful tolerance [104,105]. Detailed genomic characterization of phage-resistant mutants and in-depth analysis of SNPs in the future will also assist in elucidating the metabolic phenotype reported here. Future results from other Gram-negative phage-resistant strains and multiphage-resistant strains will show how widespread and agile this metabolic response is. By examining the complicated metabolic and genomic adaptations that are taking place, phage biology in the future could reveal that phenomenon and render a more successful phage therapy.

Supplementary Materials

The following are available online at https://0-www-mdpi-com.brum.beds.ac.uk/article/10.3390/v13040656/s1; Supplemental Data 1. Biological characterization of bacteriophage Aphrodite1; Supplemental Data 2. Biological characterization of bacteriophage Ares1; Figure S1. Growth kinetics of phage-resistant and phage-susceptible strains in detail. Table S1. Relative transcript abundance of genes studied. Table S2. Primer list for the real-time qPCR platform. Table S3. List of polymorphisms that were localized in the three respective resistant strains.

Author Contributions

Conceptualization, D.S., P.G.K., P.K. and E.F.; Data curation, D.S., C.K. (Chrysanthi Kalloniati), F.K., E.D.K., M.K.U. and C.K. (Constantina Kokkari); Funding acquisition, P.K. and E.F.; Methodology, D.S., P.G.K., C.K. (Chrysanthi Kalloniati), F.K., S.P., E.D.K., M.K.U., P.K., C.K. (Constantina Kokkari) and E.F.; Software, D.S. and C.K. (Chrysanthi Kalloniati); Supervision, P.K. and E.F.; Validation, P.G.K., P.K. and E.F.; Writing—original draft, D.S. and E.F.; Writing—review & editing, D.S., P.G.K., C.K. (Chrysanthi Kalloniati), F.K., S.P., E.D.K., M.K.U., P.K., C.K. (Constantina Kokkari) and E.F. All authors have read and agreed to the published version of the manuscript.

Funding

This work received funds from the Operational Program Fisheries and Maritime 2014–2020 in the framework of the project “Biological control of pathogens in fish hatcheries using bacteriophages” 5010932.

Institutional Review Board Statement

Not applicable.

Informed Consent Statement

Not applicable.

Data Availability Statement

The data is contained within the article or Supplementary Material.

Acknowledgments

We thank Manolis Mandalakis for assisting in the growth kinetics studies. We thank Konstantinos Fasseas for assisting with the transmission electron microscopy photographs presented in Supplementary Data 1, 2.

Conflicts of Interest

The authors declare no conflict of interest.

References

  1. Lennon, J.T.; Khatana, S.A.M.; Marston, M.F.; Martiny, J.B.H. Is there a cost of virus resistance in marine cyanobacteria? ISME J. 2007, 1, 300–312. [Google Scholar] [CrossRef] [PubMed]
  2. Buckling, A.; Rainey, P.B. Antagonistic coevolution between a bacterium and a bacteriophage. Proc. R. Soc. B Biol. Sci. 2002, 269, 931–936. [Google Scholar] [CrossRef] [PubMed] [Green Version]
  3. Oechslin, F. Resistance Development to Bacteriophages Occurring during Bacteriophage Therapy. Viruses 2018, 10, 351. [Google Scholar] [CrossRef] [PubMed] [Green Version]
  4. Baptista, C.; Santos, M.A.; São-José, C. Phage SPP1 Reversible Adsorption to Bacillus subtilis Cell Wall Teichoic Acids Accelerates Virus Recognition of Membrane Receptor YueB. J. Bacteriol. 2008, 190, 4989–4996. [Google Scholar] [CrossRef] [Green Version]
  5. São-José, C.; De Frutos, M.; Raspaud, E.; Santos, M.A.; Tavares, P. Pressure built by DNA packing inside virions: Enough to drive DNA ejection in vitro, largely insufficient for delivery into the bacterial cytoplasm. J. Mol. Biol. 2007, 374, 346–355. [Google Scholar] [CrossRef]
  6. Jakutytė, L.; Baptista, C.; São-José, C.; Daugelavičius, R.; Lopez, R.C.; Tavares, P. Bacteriophage Infection in Rod-Shaped Gram-Positive Bacteria: Evidence for a Preferential Polar Route for Phage SPP1 Entry in Bacillus subtilis. J. Bacteriol. 2011, 193, 4893–4903. [Google Scholar] [CrossRef] [Green Version]
  7. Rakhuba, D.V.; Kolomiets, E.I.; Dey, E.S.; Novik, G.I. Bacteriophage receptors, mechanisms of phage adsorption and penetration into host cell. Pol. J. Microbiol. 2010, 59, 145–155. [Google Scholar] [CrossRef]
  8. Oliveira, H.; Thiagarajan, V.; Walmagh, M.; Sillankorva, S.; Lavigne, R.; Neves-Petersen, M.T.; Kluskens, L.D.; Azeredo, J. A Thermostable Salmonella Phage Endolysin, Lys68, with Broad Bactericidal Properties against Gram-Negative Pathogens in Presence of Weak Acids. PLoS ONE 2014, 9, e108376. [Google Scholar] [CrossRef] [Green Version]
  9. Grayson, P.; Molineux, I.J. Is phage DNA “injected” into cells—Biologists and physicists can agree. Curr. Opin. Microbiol. 2007, 10, 401–409. [Google Scholar] [CrossRef] [Green Version]
  10. Bertozzi Silva, J.; Storms, Z.; Sauvageau, D. Host receptors for bacteriophage adsorption. FEMS Microbiol. Lett. 2016, 363, fnw002. [Google Scholar] [CrossRef] [Green Version]
  11. Tarahovsky, Y.S.; Khusainov, A.A.; Deev, A.A.; Kim, Y.V. Membrane fusion during infection of Escherichia coli cells by phage T4. FEBS Lett. 1991, 289, 8–22. [Google Scholar] [CrossRef] [Green Version]
  12. Tarahovsky, Y.; Khusainov, A.; Daugelavichus, R.; Bakene, E. Structural changes in Escherichia coli membranes induced by bacteriophage T4 at different temperatures. Biophys. J. 1995, 68, 157–163. [Google Scholar] [CrossRef] [Green Version]
  13. Hu, B.; Margolin, W.; Molineux, I.J.; Liu, J. Structural remodeling of bacteriophage T4 and host membranes during infection initiation. Proc. Natl. Acad. Sci. USA 2015, 112, E4919–E4928. [Google Scholar] [CrossRef] [Green Version]
  14. Bonhivers, M.; Ghazi, A.; Boulanger, P.; Letellier, L. FhuA, a transporter of the Escherichia coli outer membrane, is converted into a channel upon binding of bacteriophage T5. EMBO J. 1996, 15, 1850–1856. [Google Scholar] [CrossRef]
  15. Chatterjee, S.; Rothenberg, E. Interaction of Bacteriophage l with Its E. coli Receptor, LamB. Viruses 2012, 4, 3162–3178. [Google Scholar] [CrossRef] [Green Version]
  16. Wallin, E.; von Heijne, G. Genome-wide analysis of integral membrane proteins from eubacterial, archaean, and eukaryotic organisms. Protein Sci. 1998, 7, 1029–1038. [Google Scholar] [CrossRef]
  17. Barabote, R.D.; Saier, M.H. Comparative Genomic Analyses of the Bacterial Phosphotransferase System. Microbiol. Mol. Biol. Rev. 2005, 69, 608–634. [Google Scholar] [CrossRef] [Green Version]
  18. Siebold, C.; Flükiger, K.; Beutler, R.; Erni, B. Carbohydrate transporters of the bacterial phosphoenolpyruvate: Sugar phosphotransferase system (PTS). FEBS Lett. 2001, 504, 104–111. [Google Scholar] [CrossRef] [Green Version]
  19. Davidson, A.L.; Maloney, P.C. ABC transporters: How small machines do a big job. Trends Microbiol. 2007, 15, 448–455. [Google Scholar] [CrossRef]
  20. Holmfeldt, K.; Middelboe, M.; Nybroe, O.; Riemann, L. Large Variabilities in Host Strain Susceptibility and Phage Host Range Govern Interactions between Lytic Marine Phages and Their Flavobacterium Hosts. Appl. Environ. Microbiol. 2007, 73, 6730–6739. [Google Scholar] [CrossRef] [Green Version]
  21. Hampton, H.G.; Watson, B.N.J.; Fineran, P.C. The arms race between bacteria and their phage foes. Nat. Cell Biol. 2020, 577, 327–336. [Google Scholar] [CrossRef]
  22. Bernheim, A.; Sorek, R. The pan-immune system of bacteria: Antiviral defence as a community resource. Nat. Rev. Genet. 2020, 18, 113–119. [Google Scholar] [CrossRef]
  23. Sorek, R.; Kunin, V.; Hugenholtz, P. CRISPR—A widespread system that pro-vides acquired resistance against phages in bacteria and archaea. Nat. Rev. Microbiol. 2008, 6, 181–186. [Google Scholar] [CrossRef]
  24. Goldfarb, T.; Sberro, H.; Weinstock, E.; Cohen, O.; Doron, S.; Charpak-Amikam, Y.; Afik, S.; Ofir, G.; Sorek, R. BREX is a novel phage resistance system widespread in microbial genomes. EMBO J. 2014, 34, 169–183. [Google Scholar] [CrossRef]
  25. Swarts, D.C.; Jore, M.M.; Westra, E.R.; Zhu, Y.; Janssen, J.H.; Snijders, A.P.; Wang, Y.; Patel, D.J.; Berenguer, J.; Brouns, S.J.J.; et al. DNA-guided DNA interference by a prokaryotic Argonaute. Nat. Cell Biol. 2014, 507, 258–261. [Google Scholar] [CrossRef] [Green Version]
  26. Ofir, G.; Melamed, S.; Sberro, H.; Mukamel, Z.; Silverman, S.; Yaakov, G.; Doron, S.; Sorek, R. DISARM is a widespread bacterial defence system with broad anti-phage activities. Nat. Microbiol. 2018, 3, 90–98. [Google Scholar] [CrossRef] [Green Version]
  27. Dedrick, R.M.; Jacobs-Sera, D.; Bustamante, C.A.G.; Garlena, R.A.; Mavrich, T.N.; Pope, W.H.; Reyes, J.C.C.; Russell, D.A.; Adair, T.; Alvey, R.; et al. Prophage-mediated defence against viral attack and viral counter-defence. Nat. Microbiol. 2017, 2, 1–13. [Google Scholar] [CrossRef]
  28. Mustapha, S.; Mustapha, E.M.; Nozha, C. Vibrio alginolyticus: An emerging pathogen of food borne diseases. Int. J. Sci. Technol. 2013, 2, 302–309. [Google Scholar]
  29. Castillo, D.; D’Alvise, P.; Kalatzis, P.G.; Kokkari, C.; Middelboe, M.; Gram, L.; Liu, S.; Katharios, P. Draft Genome Sequences ofVibrio alginolyticusStrains V1 and V2, Opportunistic Marine Pathogens. Genome Announc. 2015, 3, e00729-15. [Google Scholar] [CrossRef] [Green Version]
  30. Kalatzis, P.G.; Bastías, R.; Kokkari, C.; Katharios, P. Isolation and Characterization of Two Lytic Bacteriophages, phiSt2 and phiGrn1; Phage Therapy Application for Biological Control of Vibrio alginolyticus in Aquaculture Live Feeds. PLoS ONE 2016, 11, e0151101. [Google Scholar] [CrossRef] [Green Version]
  31. Skliros, D.; Kalatzis, P.G.; Katharios, P.; Flemetakis, E. Comparative Functional Genomic Analysis of Two Vibrio Phages Reveals Complex Metabolic Interactions with the Host Cell. Front. Microbiol. 2016, 7, 1807. [Google Scholar] [CrossRef] [PubMed] [Green Version]
  32. Kutter, E. Phage host range and efficiency of plating. Methods Mol. Biol. 2009, 501, 141–149. [Google Scholar] [PubMed]
  33. Zerbino, D.R.; Birney, E. Velvet: Algorithms for de novo short read assembly using de Bruijn graphs. Genome Res. 2008, 18, 821–829. [Google Scholar] [CrossRef] [PubMed] [Green Version]
  34. Kearse, M.; Moir, R.; Wilson, A.; Stones-Havas, S.; Cheung, M.; Sturrock, S.; Buxton, S.; Cooper, A.; Markowitz, S.; Duran, C.; et al. Geneious Basic: An integrated and extendable desktop software platform for the organization and analysis of sequence data. Bioinformatics 2012, 28, 1647–1649. [Google Scholar] [CrossRef]
  35. Delcher, A.L.; Harmon, D.; Kasif, S.; White, O.; Salzberg, S.L. Improved microbial gene identification with GLIMMER. Nucleic Acids Res. 1999, 27, 4636–4641. [Google Scholar] [CrossRef]
  36. Aziz, R.K.; Bartels, D.; Best, A.A.; DeJongh, M.; Disz, T.; Edwards, R.A.; Formsma, K.; Gerdes, S.; Glass, E.M.; Kubal, M.; et al. The RAST Server: Rapid Annotations using Subsystems Technology. BMC Genom. 2008, 9, 75. [Google Scholar] [CrossRef] [Green Version]
  37. Overbeek, R.; Olson, R.; Pusch, G.D.; Olsen, G.J.; Davis, J.J.; Disz, T.; Edwards, R.A.; Gerdes, S.; Parrello, B.; Shukla, M.; et al. The SEED and the Rapid Annotation of microbial genomes using Subsystems Technology (RAST). Nucleic Acids Res. 2014, 42, D206–D214. [Google Scholar] [CrossRef]
  38. Ogata, H.; Goto, S.; Sato, K.; Fujibuchi, W.; Bono, H.; Kanehisa, M. KEGG: Kyoto Encyclopedia of Genes and Genomes. Nucleic Acids Res. 1999, 27, 29–34. [Google Scholar] [CrossRef] [Green Version]
  39. Kanehisa, M.; Sato, Y.; Furumichi, M.; Morishima, K.; Tanabe, M. New approach for understanding genome variations in KEGG. Nucleic Acids Res. 2019, 47, D590–D595. [Google Scholar] [CrossRef] [Green Version]
  40. Darling, A.C.E.; Mau, B.; Blattner, F.R.; Perna, N.T. Mauve: Multiple Alignment of Conserved Genomic Sequence with Rearrangements. Genome Res. 2004, 14, 1394–1403. [Google Scholar] [CrossRef] [Green Version]
  41. Grissa, I.; Vergnaud, G.; Pourcel, C. CRISPRFinder: A web tool to identify clustered regularly interspaced short palindromic repeats. Nucleic Acids Res. 2007, 35, W52–W57. [Google Scholar] [CrossRef] [Green Version]
  42. Chai, G.; Yu, M.; Jiang, L.; Duan, Y.; Huang, J. HMMCAS: A Web Tool for the Identification and Domain Annotations of CAS Proteins. IEEE/ACM Trans. Comput. Biol. Bioinform. 2019, 16, 1313–1315. [Google Scholar] [CrossRef]
  43. Ramakers, C.; Ruijter, J.M.; Lekanne Deprez, R.H.; Moorman, A.F.M. Assumption-free analysis of quantitative real-time polymerase chain reaction (PCR) data. Neurosci. Lett. 2003, 339, 62–66. [Google Scholar] [CrossRef]
  44. Maharjan, R.P.; Ferenci, T. Global metabolite analysis: The influence of ex-traction methodology on metabolome profiles of Escherichia coli. Anal. Biochem. 2003, 313, 145–154. [Google Scholar] [CrossRef]
  45. Schauer, N.; Steinhauser, D.; Strelkov, S.; Schomburg, D.; Allison, G.; Moritz, T. GC-MS libraries for the rapid identification of metabolites in complex biological samples. FEBS Lett. 2005, 579, 1332–1337. [Google Scholar] [CrossRef]
  46. Fiehn, O.; Barupal, D.K.; Kind, T. Extending biochemical databases by metabolomic surveys. J. Biol Chem. 2011, 286, 23637–23643. [Google Scholar] [CrossRef] [Green Version]
  47. Khemayan, K.; Pasharawipas, T.; Puiprom, O.; Sriurairatana, S.; Flegel, T.W. Unstable lysogeny and pseudolysogeny in VHS1 bacteriophage of Vibrio harveyi. Appl. Environ. Microbiol. 2006, 72, 1355–1363. [Google Scholar] [CrossRef] [Green Version]
  48. Zinder, N.D. Lysogenization and superinfection immunity in Salmonella. Virology 1958, 5, 291–326. [Google Scholar] [CrossRef]
  49. Werts, C.; Michel, V.; Hofnung, M.; Charbit, A. Adsorption of bacteriophage lambda on the LamB protein of Escherichia coli K-12: Point mutations in gene J of lambda responsible for extended host range. J. Bacteriol. 1994, 176, 941–947. [Google Scholar] [CrossRef] [Green Version]
  50. Kim, M.; Ryu, S. Characterization of a T5-Like Coliphage, SPC35, and Differential Development of Resistance to SPC35 inSalmonella entericaSerovar Typhimurium andEscherichia coli. Appl. Environ. Microbiol. 2011, 77, 2042–2050. [Google Scholar] [CrossRef] [Green Version]
  51. Ho, T.D.; Slauch, J.M. OmpC is the receptor for Gifsy-1 and Gifsy-2 bacteriophages of Salmonella. J. Bacteriol. 2001, 183, 1495–1498. [Google Scholar] [CrossRef] [PubMed] [Green Version]
  52. Ricci, V.; Piddock, L.J.V. Exploiting the Role of TolC in Pathogenicity: Identification of a Bacteriophage for Eradication of Salmonella Serovars from Poultry. Appl. Environ. Microbiol. 2010, 76, 1704–1706. [Google Scholar] [CrossRef] [PubMed] [Green Version]
  53. Lenski, R.E.; Levin, B.R. Constraints on the Coevolution of Bacteria and Virulent Phage: A Model, Some Experiments, and Predictions for Natural Communities. Am. Nat. 1985, 125, 585–602. [Google Scholar] [CrossRef]
  54. Gibson, B.; Wilson, D.J.; Feil, E.; Eyre-Walker, A. The distribution of bacterial doubling times in the wild. Proc. R. Soc. B Biol. Sci. 2018, 285, 20180789. [Google Scholar] [CrossRef]
  55. León, M.; Kokkari, C.; García, K.; Castillo, D.; Katharios, P.; Bastías, R. Diversification of Vibrio anguillarum Driven by the Bacteriophage CHOED. Front. Microbiol. 2019, 10, 1396. [Google Scholar] [CrossRef] [Green Version]
  56. Stern, A.; Sorek, R. The phage-host arms race: Shaping the evolution of microbes. BioEssays 2010, 33, 43–51. [Google Scholar] [CrossRef] [Green Version]
  57. Pal, C.; Maciá, M.D.; Oliver, A.; Schachar, I.; Buckling, A. Coevolution with viruses drives the evolution of bacterial mutation rates. Nat. Cell Biol. 2007, 450, 1079–1081. [Google Scholar] [CrossRef]
  58. Labrie, S.J.; Samson, J.E.; Moineau, S. Bacteriophage resistance mechanisms. Nat. Rev. Genet. 2010, 8, 317–327. [Google Scholar] [CrossRef]
  59. Castillo, D.; Christiansen, R.H.; Dalsgaard, I.; Madsen, L.; Middelboe, M. Bacteriophage Resistance Mechanisms in the Fish Pathogen Flavobacterium psychrophilum: Linking Genomic Mutations to Changes in Bacterial Virulence Factors. Appl. Environ. Microbiol. 2014, 81, 1157–1167. [Google Scholar] [CrossRef] [Green Version]
  60. Bassford, P.J.; Diedrich, D.L.; Schnaitman, C.L.; Reeves, P. Outer membrane proteins of Escherichia coli. VI. Protein alteration in bacteriophage-resistant mutants. J. Bacteriol. 1977, 131, 608–622,. [Google Scholar] [CrossRef] [Green Version]
  61. Hantke, K. Compilation of Escherichia coli K-12 outer membrane phage receptors–their function and some historical remarks. FEMS Microbiol. Lett. 2020, 367, fnaa013. [Google Scholar] [CrossRef]
  62. Huang, C.; Zhang, Y.; Jiao, N. Phage Resistance of a Marine Bacterium, Roseobacter denitrificans OCh114, as Revealed by Comparative Proteomics. Curr. Microbiol. 2010, 61, 141–147. [Google Scholar] [CrossRef] [Green Version]
  63. Shin, H.; Lee, J.-H.; Kim, H.; Choi, Y.; Heu, S.; Ryu, S. Receptor Diversity and Host Interaction of Bacteriophages Infecting Salmonella enterica Serovar Typhimurium. PLoS ONE 2012, 7, e43392. [Google Scholar] [CrossRef]
  64. Gencay, Y.E.; Gambino, M.; Prüssing, T.F.; Brøndsted, L. The genera of bacteriophages and their receptors are the major determinants of host range. Environ. Microbiol. 2019, 21, 2095–2111. [Google Scholar] [CrossRef]
  65. Yu, F.; Mizushima, S. Roles of lipopolysaccharide and outer membrane protein OmpC of Escherichia coli K-12 in the receptor function for bacteriophage T4. J. Bacteriol. 1982, 151, 718–722. [Google Scholar] [CrossRef] [Green Version]
  66. Inoue, T.; Matsuzaki, S.; Tanaka, S. A 26-kDa outer membrane protein, OmpK, common to Vibrio species is the receptor for a broad-host-range vibriophage, KVP40. FEMS Microbiol. Lett. 1995, 125, 101–105. [Google Scholar] [CrossRef]
  67. Hu, B.; Margolin, W.; Molineux, I.J.; Liu, J. The Bacteriophage T7 Virion Undergoes Extensive Structural Remodeling during Infection. Science 2013, 339, 576–579. [Google Scholar] [CrossRef] [Green Version]
  68. Rollauer, S.E.; Sooreshjani, M.A.; Noinaj, N.; Buchanan, S.K. Outer membrane protein biogenesis in Gram-negative bacteria. Philos. Trans. R. Soc. B Biol. Sci. 2015, 370, 20150023. [Google Scholar] [CrossRef]
  69. Laanto, E.; Bamford, J.K.H.; Laakso, J.; Sundberg, L.-R. Phage-Driven Loss of Virulence in a Fish Pathogenic Bacterium. PLoS ONE 2012, 7, e53157. [Google Scholar] [CrossRef] [Green Version]
  70. Martinez, J.L.; Sánchez, M.B.; Martínez-Solano, L.; Hernandez, A.; Garmendia, L.; Fajardo, A.; Alvarez-Ortega, C. Functional role of bacterial multidrug efflux pumps in microbial natural ecosystems. FEMS Microbiol. Rev. 2009, 33, 430–449. [Google Scholar] [CrossRef]
  71. Samson, J.E.; Magadán, A.H.; Sabri, M.; Moineau, S. Revenge of the phages: Defeating bacterial defences. Nat. Rev. Genet. 2013, 11, 675–687. [Google Scholar] [CrossRef] [PubMed]
  72. Bohannan, B.J.M.; Lenski, R.E. Linking genetic change to community evolution: Insights from studies of bacteria and bacteriophage. Ecol. Lett. 2000, 3, 362–377. [Google Scholar] [CrossRef]
  73. Chevallereau, A.; Blasdel, B.G.; De Smet, J.; Monot, M.; Zimmermann, M.; Kogadeeva, M.; Sauer, U.; Jorth, P.; Whiteley, M.; Debarbieux, L.; et al. Next-Generation “-omics” Approaches Reveal a Massive Alteration of Host RNA Metabolism during Bacteriophage Infection of Pseudomonas aeruginosa. PLoS Genet. 2016, 12, e1006134. [Google Scholar] [CrossRef] [PubMed] [Green Version]
  74. Lenski, R.E. Dynamics of interactions between bacteria and virulent bacteriophage. In Advances in Microbial Ecology; Springer: New York, NY, USA, 1988; pp. 1–44. [Google Scholar]
  75. Brockhurst, M.A.; Rainey, P.B.; Buckling, A. The effect of spatial heterogeneity and parasites on the evolution of host diversity. Proc. R. Soc. B Biol. Sci. 2004, 271, 107–111. [Google Scholar] [CrossRef] [Green Version]
  76. Heierson, A.; Sidén, I.; Kivaisi, A.; Boman, H.G. Bacteriophage-resistant mutants of Bacillus thuringiensis with decreased virulence in pupae of Hyalophoracecropia. J. Bacteriol. 1986, 167, 18–24. [Google Scholar] [CrossRef] [Green Version]
  77. Paruchuri, D.K.; Harshey, R.M. Flagellar variation in Serratia marcescens is associated with color variation. J. Bacteriol. 1987, 169, 61–65. [Google Scholar] [CrossRef] [Green Version]
  78. Brockhurst, M.A.; Buckling, A.; Rainey, P.B. The effect of a bacteriophage on diversification of the opportunistic bacterial pathogen, Pseudomonas aeruginosa. Proc. R. Soc. B Biol. Sci. 2005, 272, 1385–1391. [Google Scholar] [CrossRef] [Green Version]
  79. Lennon, J.T.; Martiny, J.B.H. Rapid evolution buffers ecosystem impacts of viruses in a microbial food web§. Ecol. Lett. 2008, 11, 1178–1188. [Google Scholar] [CrossRef]
  80. Middelboe, M.; Holmfeldt, K.; Riemann, L.; Nybroe, O.; Haaber, J.K. Bacteriophages drive strain diversification in a marineFlavobacterium: Implications for phage resistance and physiological properties. Environ. Microbiol. 2009, 11, 1971–1982. [Google Scholar] [CrossRef]
  81. Jones, P.M.; George, A.M. Nucleotide-dependent Allostery within the ABC Transporter ATP-binding Cassette: A computational study of the mj0796 dimer. J. Biol. Chem. 2007, 282, 22793–22803. [Google Scholar] [CrossRef] [Green Version]
  82. Mukherjee, S.; Barash, D.; Sengupta, S. Comparative genomics and phylogenomic analyses of lysine riboswitch distributions in bacteria. PLoS ONE 2017, 12, e0184314. [Google Scholar] [CrossRef]
  83. Juan, C.; Torrens, G.; Barceló, I.M.; Oliver, A. Interplay between Peptidoglycan Biology and Virulence in Gram-Negative Pathogens. Microbiol. Mol. Biol. Rev. 2018, 82, e00033-18. [Google Scholar] [CrossRef] [Green Version]
  84. Becker, J.; Zelder, O.; Häfner, S.; Schröder, H.; Wittmann, C. From zero to hero—Design-based systems metabolic engineering of Corynebacterium glutamicum for l-lysine production. Metab. Eng. 2011, 13, 159–168. [Google Scholar] [CrossRef]
  85. Kind, S.; Becker, J.; Wittmann, C. Increased lysine production by flux coupling of the tricarboxylic acid cycle and the lysine biosynthetic pathway metabolic engineering of the availability of succinyl-CoA in Corynebacterium glutamicum. Metab. Eng. 2013, 15, 184–195. [Google Scholar] [CrossRef]
  86. Xu, J.Z.; Han, M.; Ren, X.D.; Zhang, W.G. Modification of aspartokinase III and dihydrodipicolinate synthetase increases the production of L-lysine in Escherichia coli. Biochem. Eng. J. 2016, 114, 82–89. [Google Scholar] [CrossRef]
  87. Xu, J.-Z.; Wu, Z.-H.; Gao, S.-J.; Zhang, W. Rational modification of tricarboxylic acid cycle for improving l-lysine production in Corynebacterium glutamicum. Microb. Cell Factories 2018, 17, 105. [Google Scholar] [CrossRef] [Green Version]
  88. Kamio, Y.; Nakamura, K. Putrescine and cadaverine are constituents of peptidoglycan in Veillonella alcalescens and Veillonella parvula. J. Bacteriol. 1987, 169, 2881–2884. [Google Scholar] [CrossRef] [Green Version]
  89. Samartzidou, H.; Delcour, A.H. Excretion of Endogenous Cadaverine Leads to a Decrease in Porin-Mediated Outer Membrane Permeability. J. Bacteriol. 1999, 181, 791–798. [Google Scholar] [CrossRef] [Green Version]
  90. Pereira, C.S.; Santos, A.J.M.; Bejerano-Sagie, M.; Correia, P.B.; Marques, J.C.; Xavier, K.B. Phosphoenolpyruvate phosphotransferase system regulates detection and processing of the quorum sensing signal autoinducer-2. Mol. Microbiol. 2012, 84, 93–104. [Google Scholar] [CrossRef]
  91. Chatterjee, R.; Millard, C.S.; Champion, K.; Clark, D.P.; Donnelly, M.I. Mutation of the ptsG Gene Results in Increased Production of Succinate in Fermentation of Glucose byEscherichia coli. Appl. Environ. Microbiol. 2001, 67, 148–154. [Google Scholar] [CrossRef] [Green Version]
  92. Vicente, M.; Chater, K.F.; De Lorenzo, V. Bacterial transcription factors involved in global regulation. Mol. Microbiol. 1999, 33, 8–17. [Google Scholar] [CrossRef] [Green Version]
  93. Rahman, M.; Hasan, M.R.; Oba, T.; Shimizu, K. Effect of rpoS gene knockout on the metabolism of Escherichia coli during exponential growth phase and early stationary phase based on gene expressions, enzyme activities and intracellular metabolite concentrations. Biotechnol. Bioeng. 2006, 94, 585–595. [Google Scholar] [CrossRef]
  94. Schellhorn, H.E. Function, Evolution, and Composition of the RpoS Regulon in Escherichia coli. Front. Microbiol. 2020, 11, 2282. [Google Scholar] [CrossRef]
  95. Zlatkov, N.; Uhlin, B.E. Absence of Global Stress Regulation in Escherichia coli Promotes Pathoadaptation and Novel c-di-GMP-dependent Metabolic Capability. Sci. Rep. 2019, 9, 2600. [Google Scholar] [CrossRef] [Green Version]
  96. Behr, S.; Fried, L.; Jung, K. Identification of a Novel Nutrient-Sensing Histidine Kinase/Response Regulator Network in Escherichia coli. J. Bacteriol. 2014, 196, 2023–2029. [Google Scholar] [CrossRef] [Green Version]
  97. Brown, N.L.; Stoyanov, J.V.; Kidd, S.P.; Hobman, J.L. The MerR family of transcriptional regulators. FEMS Microbiol. Rev. 2003, 27, 145–163. [Google Scholar] [CrossRef] [Green Version]
  98. Thomas, S.A.; Immormino, R.M.; Bourret, R.B.; Silversmith, R.E. Nonconserved Active Site Residues Modulate CheY Autophosphorylation Kinetics and Phosphodonor Preference. Biochemistry 2013, 52, 2262–2273. [Google Scholar] [CrossRef] [Green Version]
  99. del Peso-Santos, T.; Landfors, M.; Skärfstad, E.; Ryden, P.; Shingler, V. Pr is a member of a restricted class of σ70-dependent promoters that lack a recognizable—10 element. Nucleic Acids Res. 2012, 40, 11308–11320. [Google Scholar] [CrossRef] [Green Version]
  100. Webber, C.A.; Kadner, R.J. Involvement of the amino-terminal phosphorylation module of UhpA in activation of uhpT transcription in Escherichia coli. Mol. Microbiol. 1997, 24, 1039–1048. [Google Scholar] [CrossRef]
  101. Västermark, Å.; Saier, M.H., Jr. The involvement of transport proteins in transcriptional and metabolic regulation. Curr. Opin. Microbiol. 2014, 18, 8–15. [Google Scholar] [CrossRef] [Green Version]
  102. Holmfeldt, K.; Solonenko, N.; Shah, M.; Corrier, K.; Riemann, L.; VerBerkmoes, N.C.; Sullivan, M.B. Twelve previously unknown phage genera are ubiquitous in global oceans. Proc. Natl. Acad. Sci. USA 2013, 110, 12798–12803. [Google Scholar] [CrossRef] [PubMed] [Green Version]
  103. Breitbart, M.; Bonnain, C.; Malki, K.; Sawaya, N.A. Phage puppet masters of the marine microbial realm. Nat. Microbiol. 2018, 3, 754–766. [Google Scholar] [CrossRef] [PubMed]
  104. Hoque, M.M.; Bin Naser, I.; Bari, S.M.N.; Zhu, J.; Mekalanos, J.J.; Faruque, S.M. Quorum Regulated Resistance of Vibrio cholerae against Environmental Bacteriophages. Sci. Rep. 2016, 6, 37956. [Google Scholar] [CrossRef] [PubMed]
  105. Castillo, D.; Nanna, R.; Johanna, J.; Janina, L.; Demeng, T.; Panos, G.K.; Sine, L.S.; Mathias, M. Phage defense mechanisms and their genomic and phenotypic implications in the fish pathogen Vibrio anguillarum. FEMS Microbiol. Ecol. 2019, 95, 3. [Google Scholar] [CrossRef]
Figure 1. Growth kinetics of phage-resistant and phage-susceptible strains. Growth (average, ±SE) of the Control (phage-susceptible strains; black circle; n = 3), VaAphrodite1 strains (phage strains resistant to bacteriophage Aphrodite1; white circle; n = 9), VaphiSt2 strains (phage strains resistant to bacteriophage phiSt2; black triangle; n = 9), and VaAres1 strains (phage strains resistant to bacteriophage Ares1; white triangle; n = 9).
Viruses 13 00656 g001
Figure 2. Adsorption assay for bacteriophages Aphrodite1, phiSt2, and Ares1 against their corresponding resistant strains. Initial titer was 104, and cultures upon infection were in their exponential phase (±SE; n = 3).
Viruses 13 00656 g002
Figure 3. Relative expression levels of genes encoding for outer membrane and transmembrane proteins. Bars represent means ± SE of independent biological repeats (n = 3). Asterisks * indicate significantly different values based on Student’s t-test. Statistical significance was postulated for p ≤ 0.05.
Viruses 13 00656 g003
Figure 4. Partial Least Squares Discriminant Analysis (PLS-DA) of metabolomics results. and representation of component 1 (46.4%) and component 2 (12.2%) (A) of the identified metabolites discussed in the results and discussion section comparing the wild type (Control, phage-susceptible strains; n = 4), VaAphrodite1 strains (phage strains resistant to bacteriophage Aphrodite1; n = 5), VaphiSt2 strains (phage strains resistant to bacteriophage phiSt2; n = 5), and VaAres1 strains (phage strains resistant to bacteriophage Ares1; n = 5). (B) Loadings of individually identified components showing the highest variability under the studied experimental conditions.
Viruses 13 00656 g004
Figure 5. Schematic representation of nucleotide sequences of four CDSs and their orientation, involved in transcriptional regulation of V. alginolyticus, and their SNPs as presented in the text. Yellow represents CDS; orange, SNP positions; and blue, information of SNPs and protein effects in resistant bacteria VaAphoridte1 (A, B), VaphiSt2 (A, B), and VaAres1 (B, C). Orientation of the genome is also shown with blue numbers.
Viruses 13 00656 g005
Figure 6. Schematic representation of metabolic reprogramming that takes place in phage-resistant strains. Relative transcript levels (heat maps) of sugar–polyol transporters (blue crescent moon) and amino acid transporters (brown crescent moon) of the inner bacterial membrane, accompanied by genes that are involved in important biochemical intracellular pathways of phage-susceptible (A) and phage-resistant (B, C, D) strains. Bars represent relative content levels of intracellular metabolites (±SE) in susceptible (white) and resistant strains in bacteriophages Aphrodite1 (light grey), phiSt2 (dark grey), and Ares1 (black). Blue arrows represent biochemical pathways in brief; the light blue round arrow represents part of the TCA cycle; yellow arrows represent putative extraction of metabolites through membrane proteins. White and black asterisks represent statistically significant differences between phage-susceptible strains and phage-resistant strains (ANOVA, post-hoc analysis Student’s t-test, p < 0.05).
Viruses 13 00656 g006
Figure 7. Schematic representation of how metabolic reprogramming of bacterial cells could introduce phage resistance against lytic bacteriophages after phage–host interaction. Arrows represent genes (as seen in Table 3) involved in nutrient assimilation or exportation for which their relative transcript levels were significantly downregulated compared to the control (wild-type) strains in the current study. Gray: outer membrane receptors (lamb and ompF); Blue: inner bacterial membrane sugars and polyols (ptsG 2, crr, rbsA, celB, mtlA); Red: inner bacterial membrane amino acids (metQ, metL metN, livH, livB and hisP). OM: outer membrane; PG: peptidoglycan layer.
Viruses 13 00656 g007
Table 1. Main characteristics of the phages used in this study.
PhageFamilyGenusLifestyleGenome (bps)GC %Predicted # ORFsLatent
Period
Accession NumberReference
Aphrodite1MyoviridaeAphroditevirusLytic237.72243.420780 minMG720308This study
phiSt2MyoviridaeSchizotequatrovirusLytic250.48542.641230 minKT919973[30,31]
Ares1SiphoviridaeunclassifiedUnknown80.50045.111930 minMG720309This study
Abbreviations: bps: base pairs; GC: genomic GC content; ORFs: open reading frames.
Table 2. Cross-infection test (- for the absence of lytic plaques; + for high lytic activity) of wild-type and resistant strains against highly lytic bacteriophages described in the present study.
Bacteriophages with High Lytic Activity
Vibrio alginolyticus StrainsAphrodite1phiSt2Ares1
Control (wild type)+++
VaAphrodite1-+-
VaphiSt2+-+
VaAres1++-
Table 3. Main characteristics of the inner membrane-related proteins that were studied in phage-susceptible and phage-resistant strains.
Gene NameNutrient Transport
Participation
Type of
Transporter
SubunitSubunit Role
mtlAMannitolPTSIIA, IIB, IICAffinity, Transport, Energy
treBTrehalosePTSIIB, IICAffinity, Transport
fruAFructosePTSIIB, IICAffinity, Transport
celBCellulosePTSIICAffinity
ptsG 1GlucosePTSIIB, IICAffinity, Transport
ptsG 2GlucosePTSIIB, IICAffinity, Transport
crrGlucosePTSIIB, IICEnergy
ptsNNitrogenPTSIIATransport
ptsHPhosphorusPTSIIATransport
tyrPTyrosine--
rbsARiboseABCATP-subunitEnergy
metQMethionineABCIIAAffinity
metlMethionineABCSubstrate subunitTransport
metNMethionineABCTransmembrane subunitEnergy
artPArginineABCSubstrate subunitAffinity
artLArginineABCATP-subunitEnergy
tcyPCysteine--Transport
lysELysineLysE-like-Lysine Export
rhtB 1Homoserine and ThreonineLysE-like-Homoserine and Threonine Export
rhtB 2Homoserine and ThreonineLysE-like-Homoserine and Threonine Export
hisPLysine, Histidine, Arginine, OrnithineABCATP-subunitEnergy
azlC 1Valine, Isoleucine, LeucineABCTransmembrane subunitTransport
azlC 2Valine, Isoleucine, LeucineABCTransmembrane subunitTransport
livHValine, Isoleucine, LeucineABCTransmembrane subunitTransport
livMValine, Isoleucine, LeucineABCTransmembrane subunitTransport
Table 4. Heat maps of relative transcript levels of some of the genes that were altered for every resistant strain expressed as a ratio vs. Control strains (r > 1 represents upregulation, 0 < r < 1 represents downregulation). Asterisks indicate statistically significant differences compared to control (wild-type) strains (Student’s t-test; p < 0.05).
Expression Ratio vs. Control
GeneVaAphrodite1VaphiSt2VaAres1
livH***
livB***
metl**
metN**
metQ*
tcyp***
lysE*
hisp**
ptsG1*
ptsG2**
crr**
rbsH* *
cellB**
ptsH *
murE *
gltA *
frd**
mdh1**
pykA *
pykF
pckA**
r > 104 < r < 102 < r < 41.41 < r < 21.19 < r < 1.410.84 < r < 1.190.71 < r < 0.840.5 < r < 0.710.25 < r < 0.50.1 < r < 0.25r < 0.1
Table 5. Main metabolic genes and their corresponding coding enzymes that were studied in phage-susceptible and phage-resistant strains.
Gene NameCoding EnzymeE.C. NumberMetabolic Pathway
aldAlanine dehydrogenase1.4.11Alanine metabolism
agxTAlanine-glycosylate and serine pyruvate aminotransferase2.6.1.44Alanine metabolism
panDaspartate 4-decarboxylase; desulfinase4.1.1.12Alanine metabolism
lysA 1Lysine decarboxylase4.1.1.20Lysine metabolism
lysA 2Lysine decarboxylase4.1.1.20Lysine metabolism
murEAmino acid ligase6.3.2.13Peptidoglycan biosynthesis
gltACitrate synthase2.3.3.16TCA cycle
mdh 1Malic acid decarboxylase1.1.1.37TCA cycle
frdFumarate reductase1.3.5.4TCA cycle
pykAPyruvate kinase2.7.1.40Anaplerotic reactions of the TCA cycle
pykFPyruvate kinase2.7.1.40Anaplerotic reactions of the TCA cycle
pckAPEP carboxykinase4.1.1.49Anaplerotic reactions of the TCA cycle
mdh 2Malic acid dehydrogenase1.1.1.38Anaplerotic reactions of the TCA cycle
mdh 3Malic acid dehydrogenase1.1.1.39Anaplerotic reactions of the TCA cycle
ppcPEP carboxylase4.1.1.31Anaplerotic reactions of the TCA cycle
Table 6. Average relative response of intracellularly detected compounds and their respective retention time, mass charge ratio, and p-value (ANOVA, post-hoc Student’s t-test, <0.05; Control n = 4; Resistant strains n = 5). Bold values represent statistical significance.
CompoundRTM/ZControlVaAphrodite1 VaphiSt2VaAres1p
Phenylalanine25.902180.0460.0680.0790.0870.093
Lysine32.19730.0370.0530.5580.0250.000
Isoleucine17.341580.0740.0910.1130.1050.129
Alanine12.051160.2460.1840.3040.4400.000
Ornithine30.021420.0240.1270.0800.0000.000
Proline17.541420.0590.0000.0570.0720.000
Valine15.191440.1210.1700.1830.1740.243
Glycine17.731740.0840.1570.1210.2190.032
Leucine16.731580.1610.2390.3760.5320.002
Aspartic acid23.212320.0860.0000.0710.0730.000
Glutamic acid25.612460.2480.1160.4860.3430.000
Pyroglutamic acid23.371560.1210.0920.2390.1560.001
Norleucine16.731580.1780.2380.3240.3470.047
Putrescine28.391740.1660.1210.2680.2010.000
Cadaverine30.521740.7171.1200.3610.5070.000
Succinic acid17.921481.3941.2711.7842.8810.003
Pipecolic acid23.371560.0000.0740.0000.0000.000
Publisher’s Note: MDPI stays neutral with regard to jurisdictional claims in published maps and institutional affiliations.

