
Disclosing Potential Key Genes, Therapeutic Targets and Agents for Non-Small Cell Lung Cancer: Evidence from Integrative Bioinformatics Analysis

 and
and
Abstract
:1. Introduction
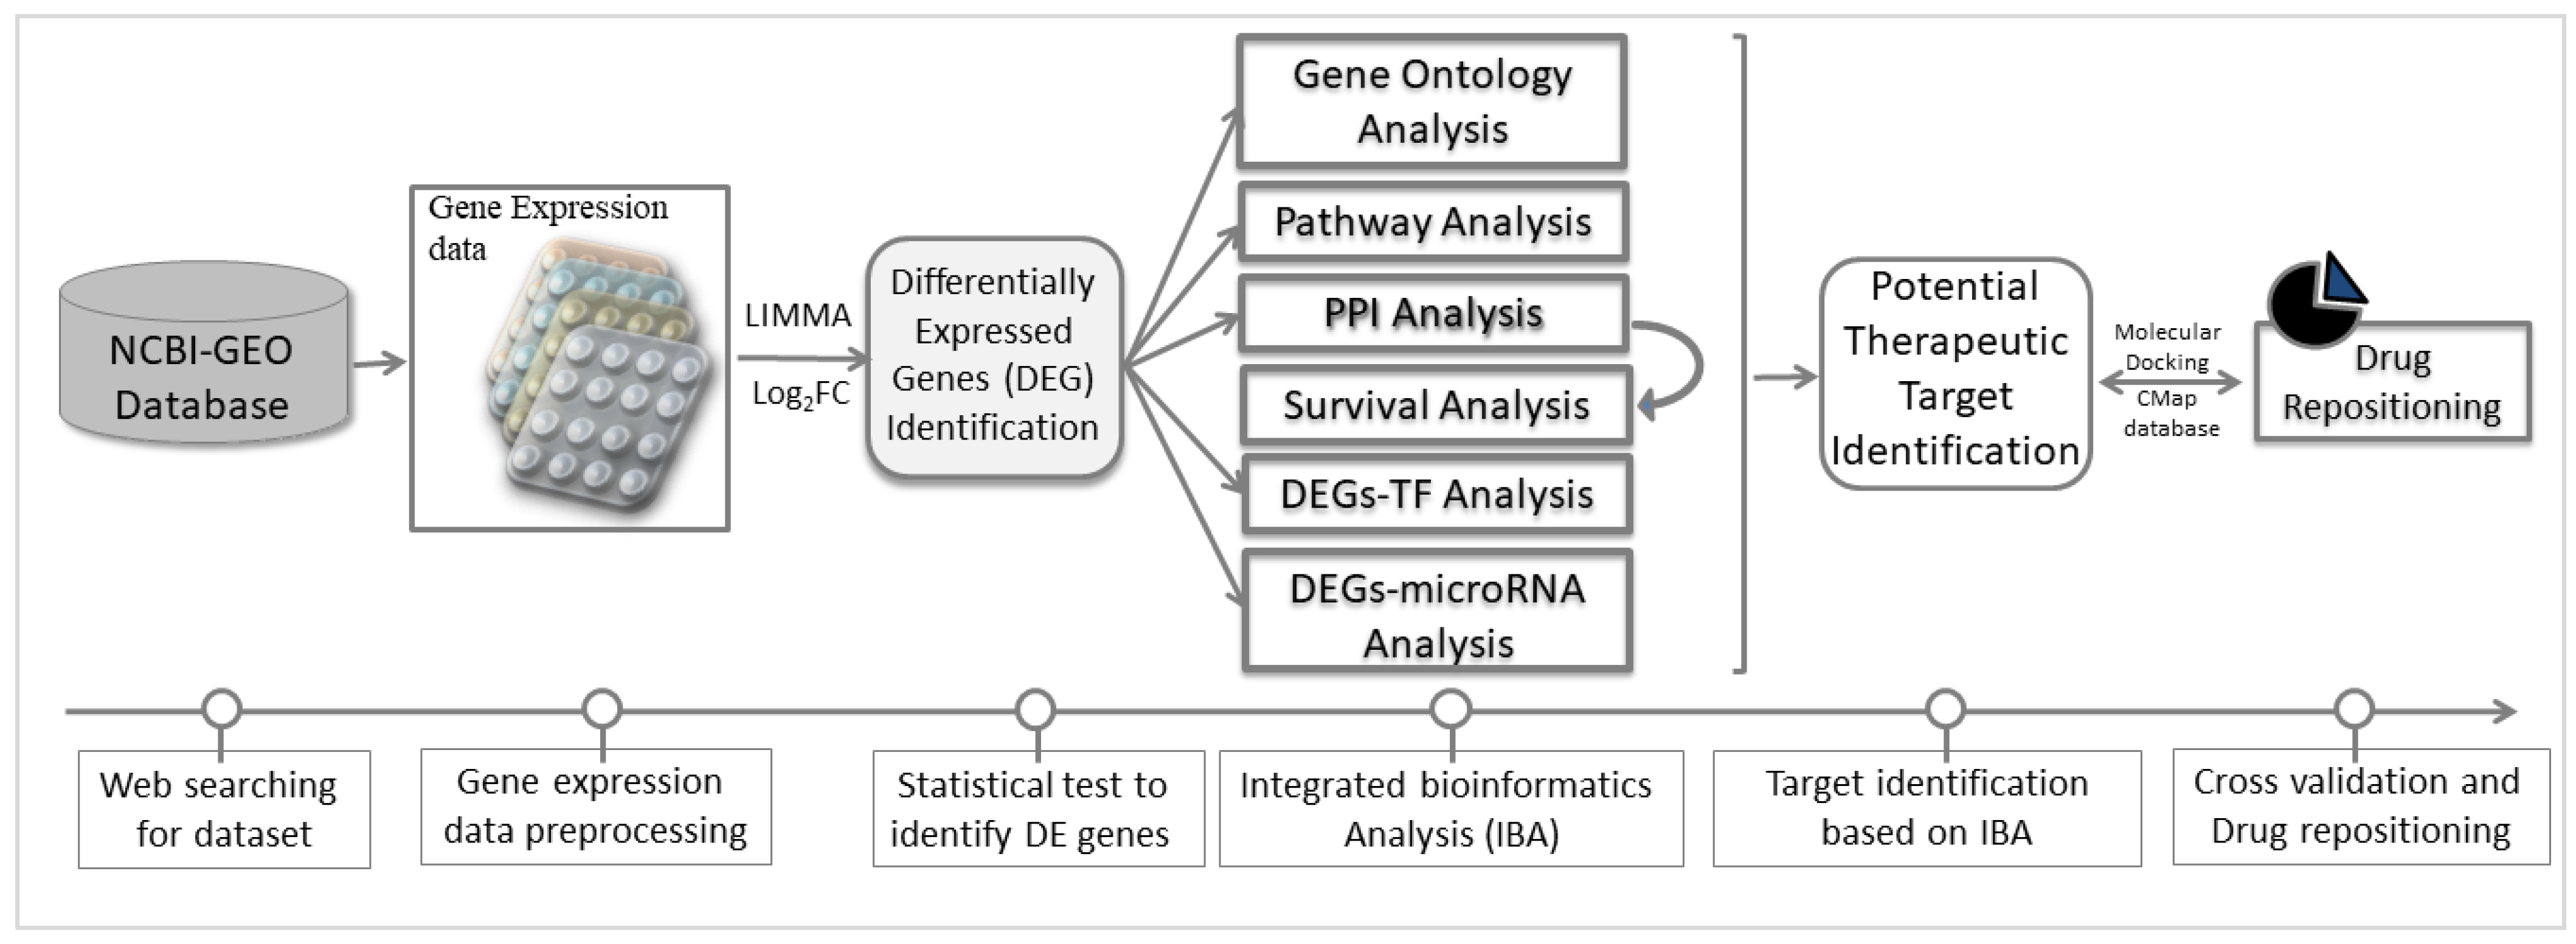
2. Materials and Methods
2.1. Collection of Gene Expression Profiles for NSCLC
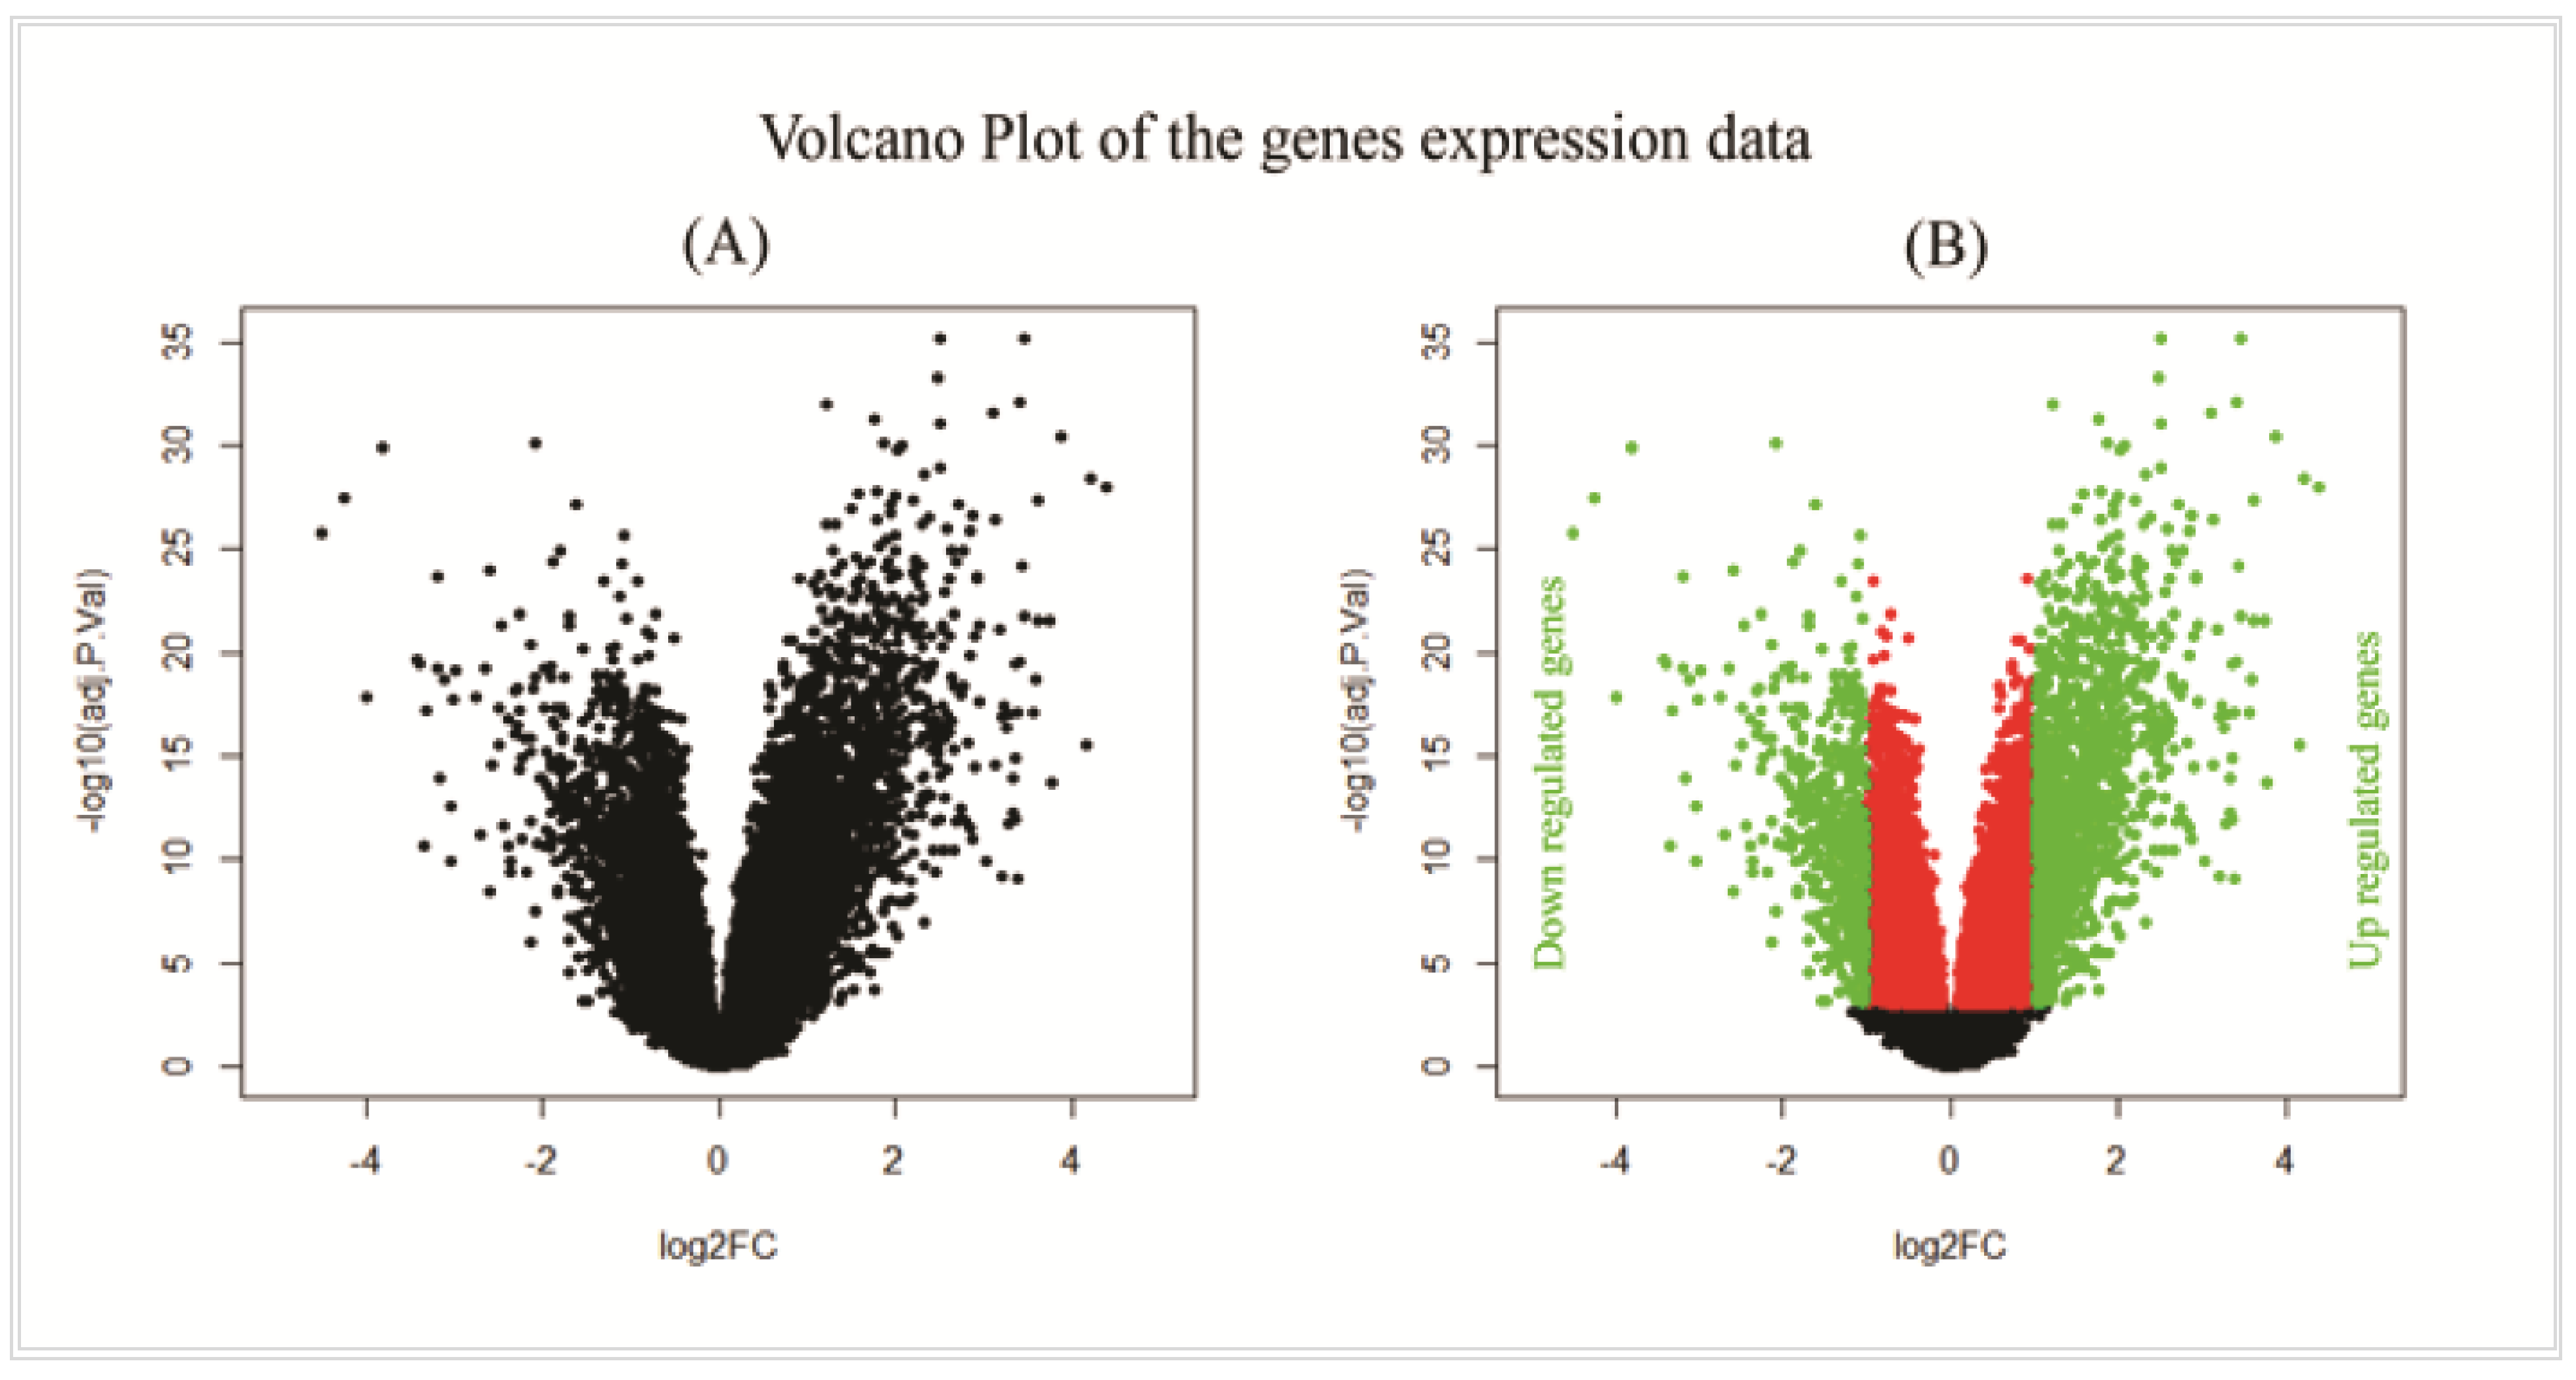
2.2. Differentially Expressed Genes (DEGs) Identification
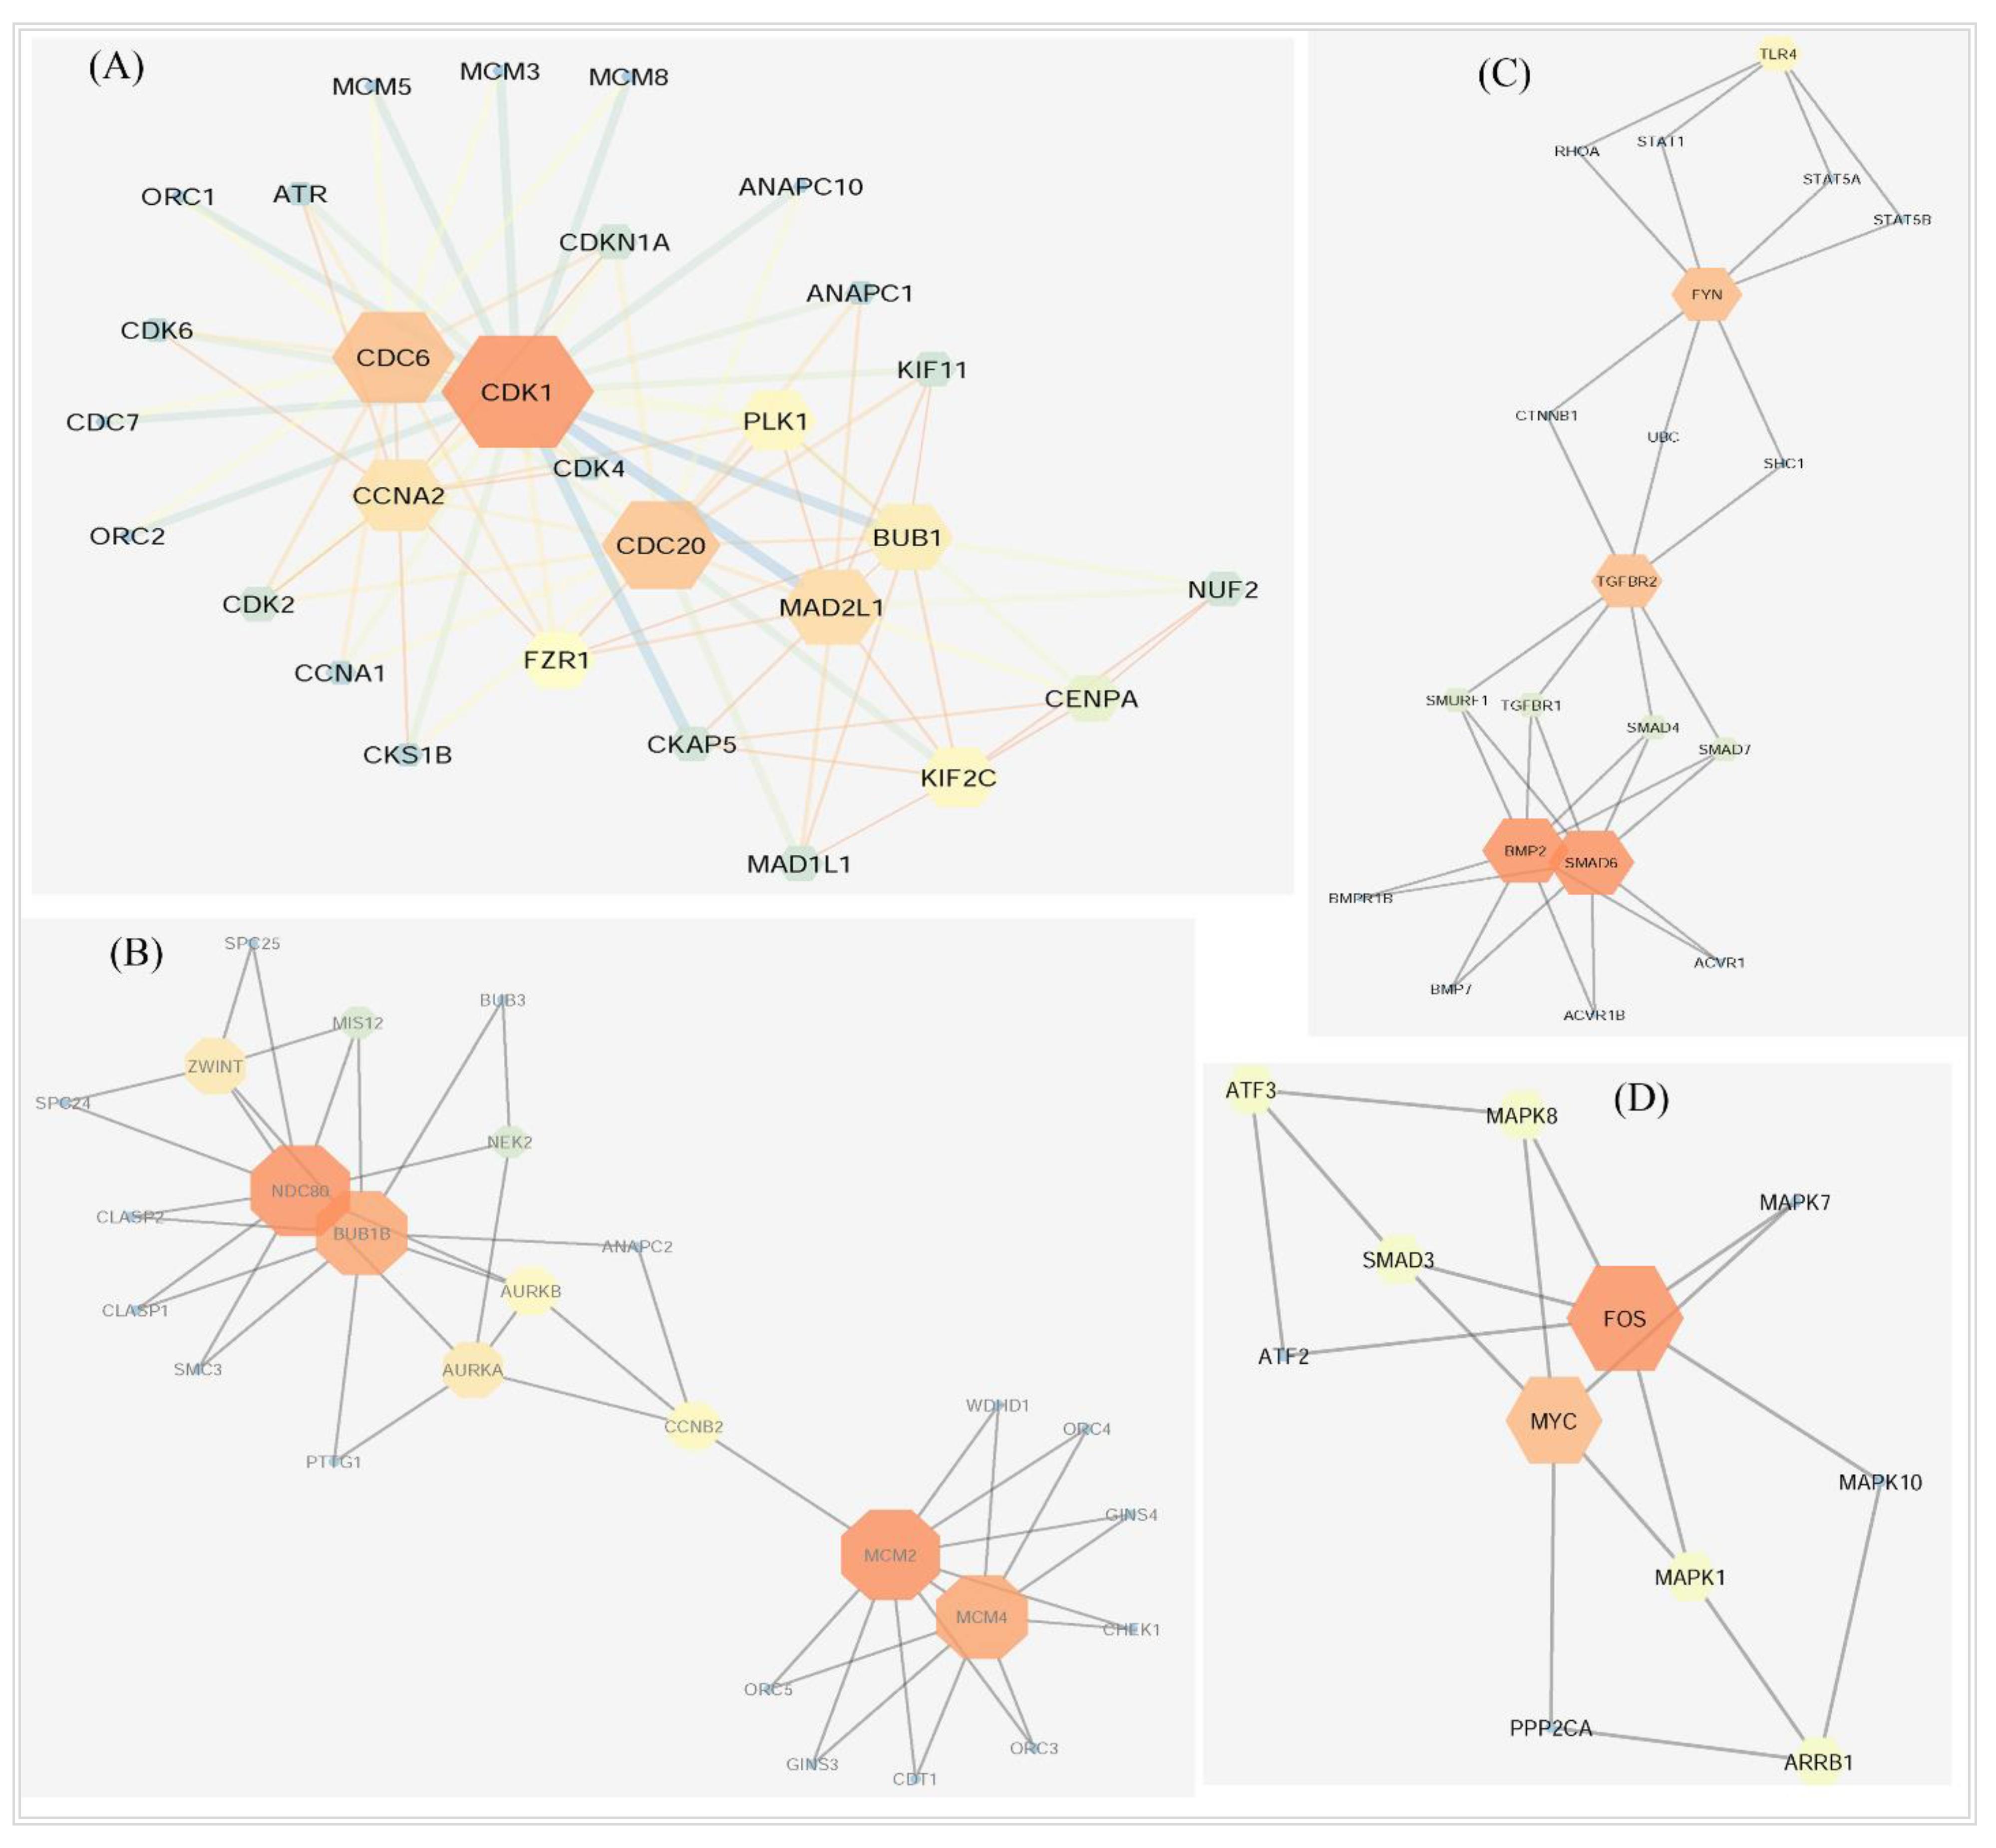
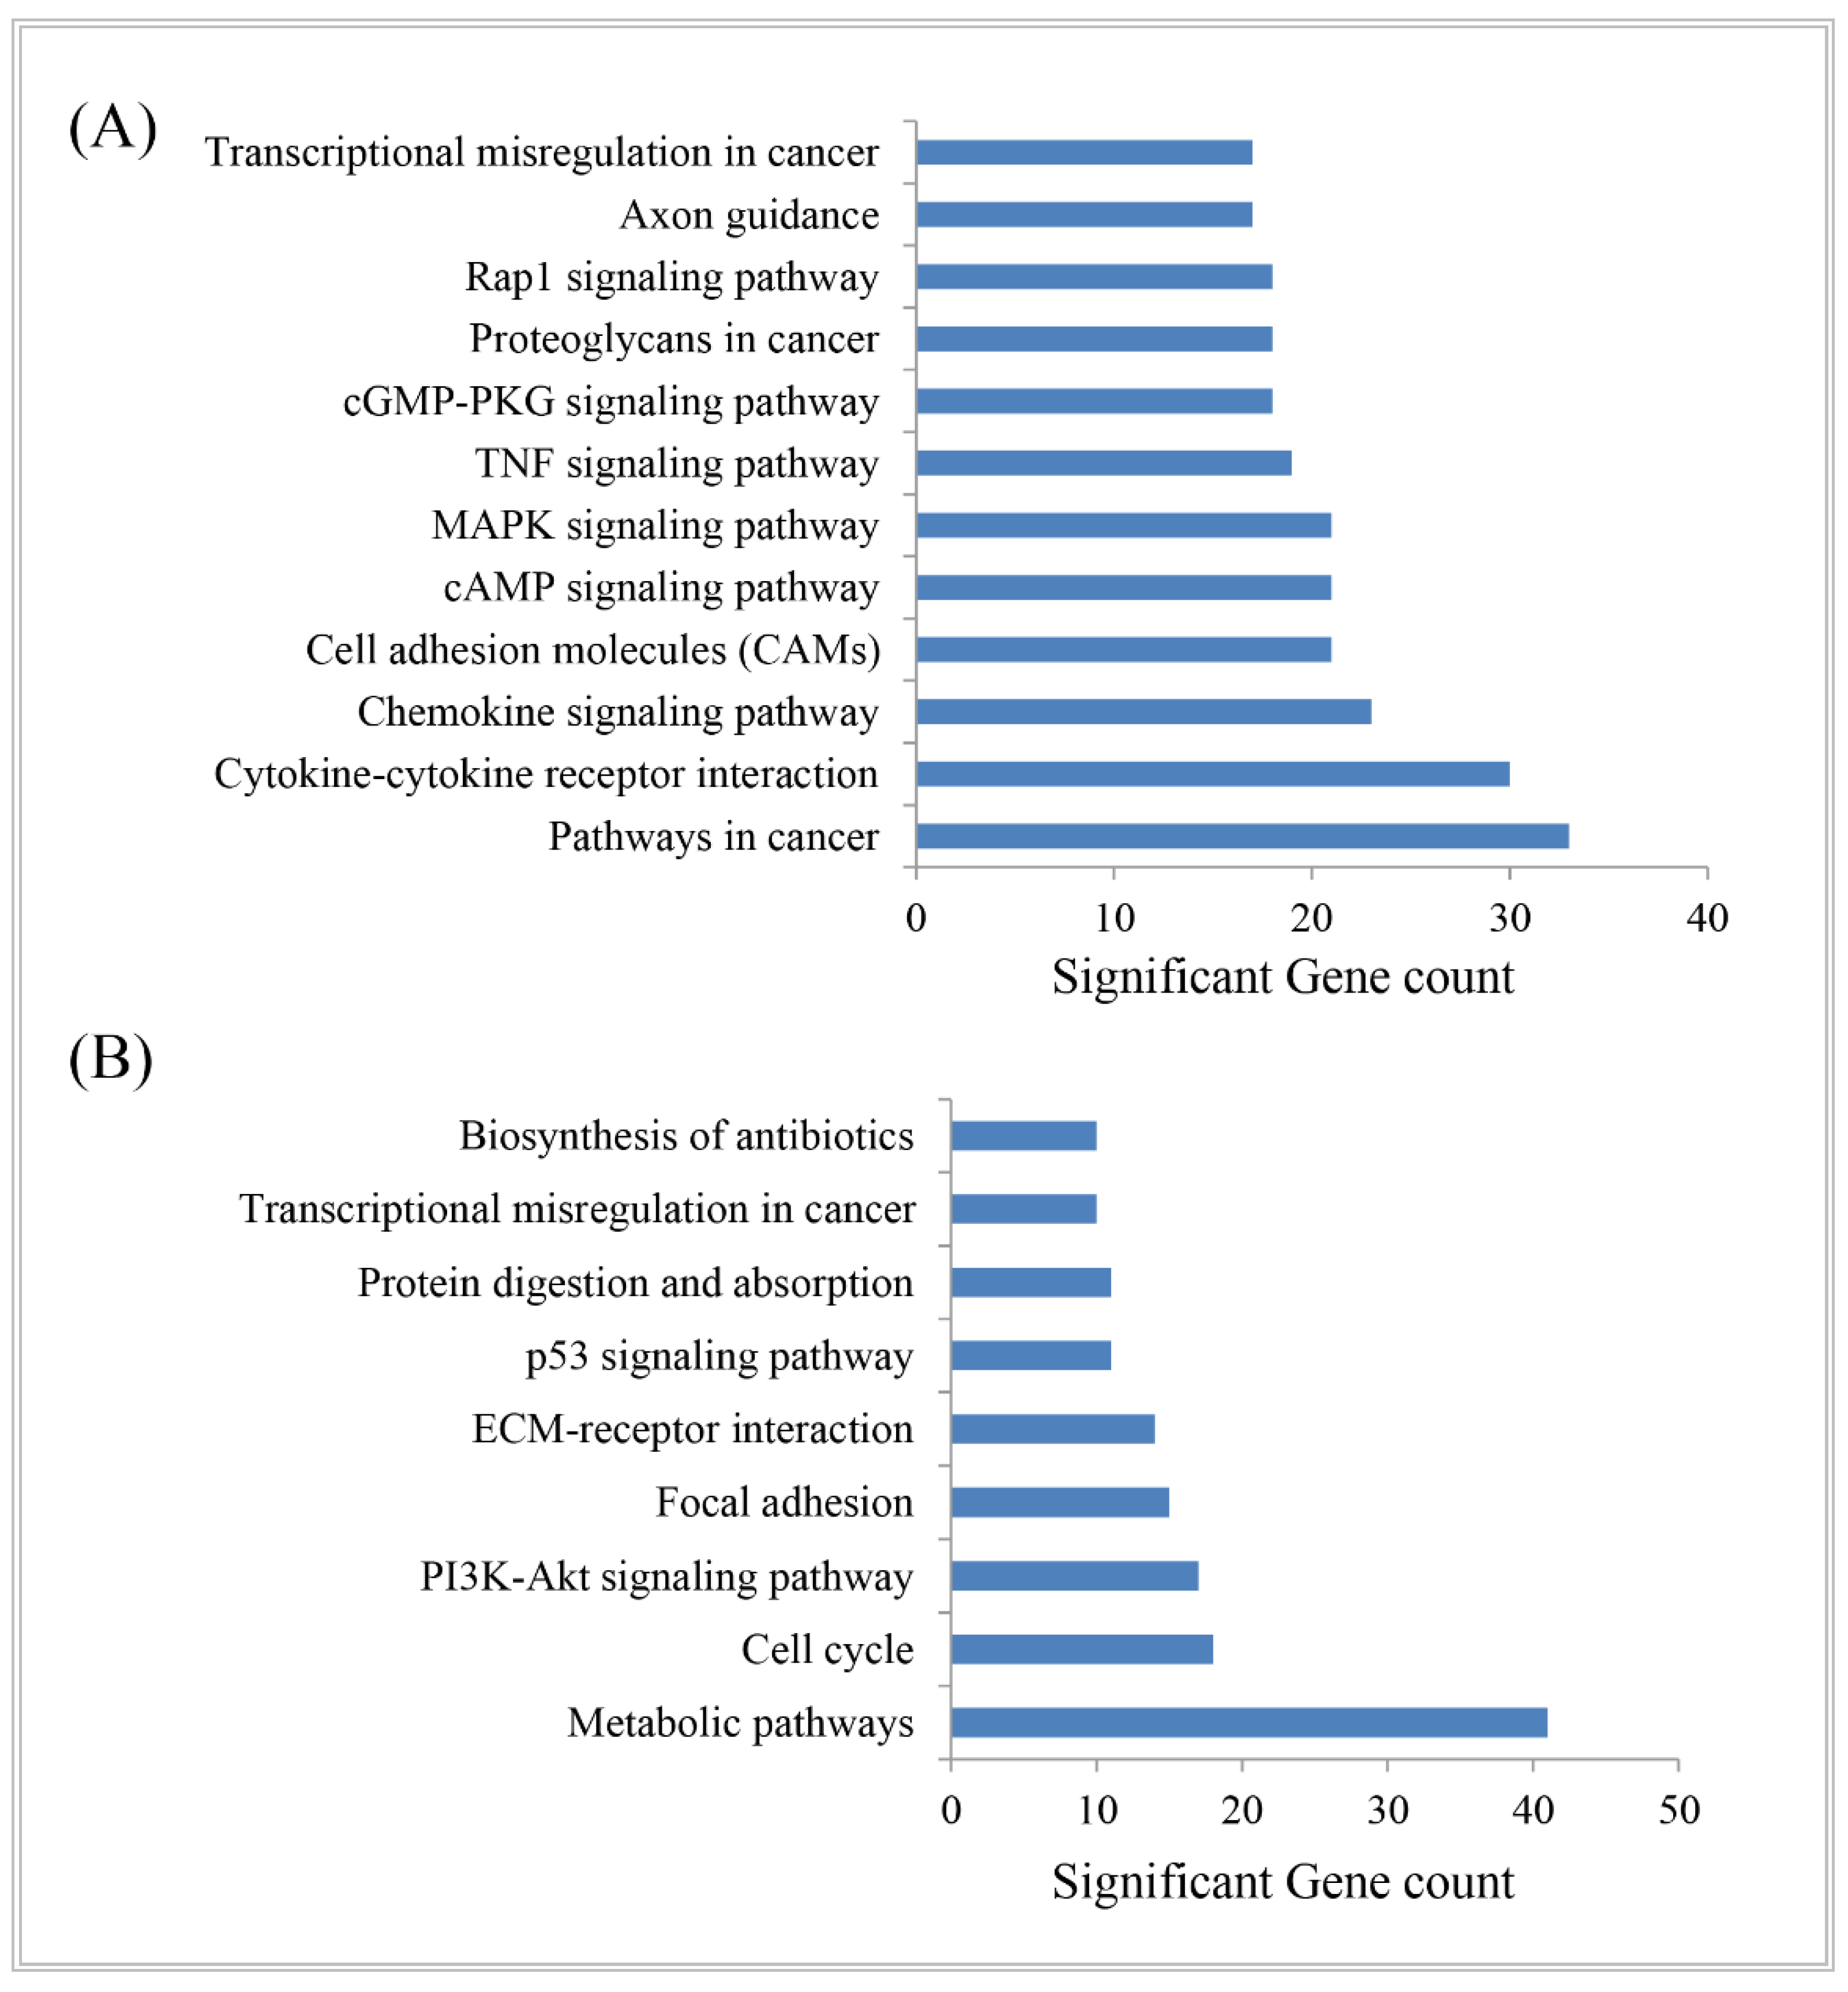
2.3. DEGs-Set Enrichment Analysis
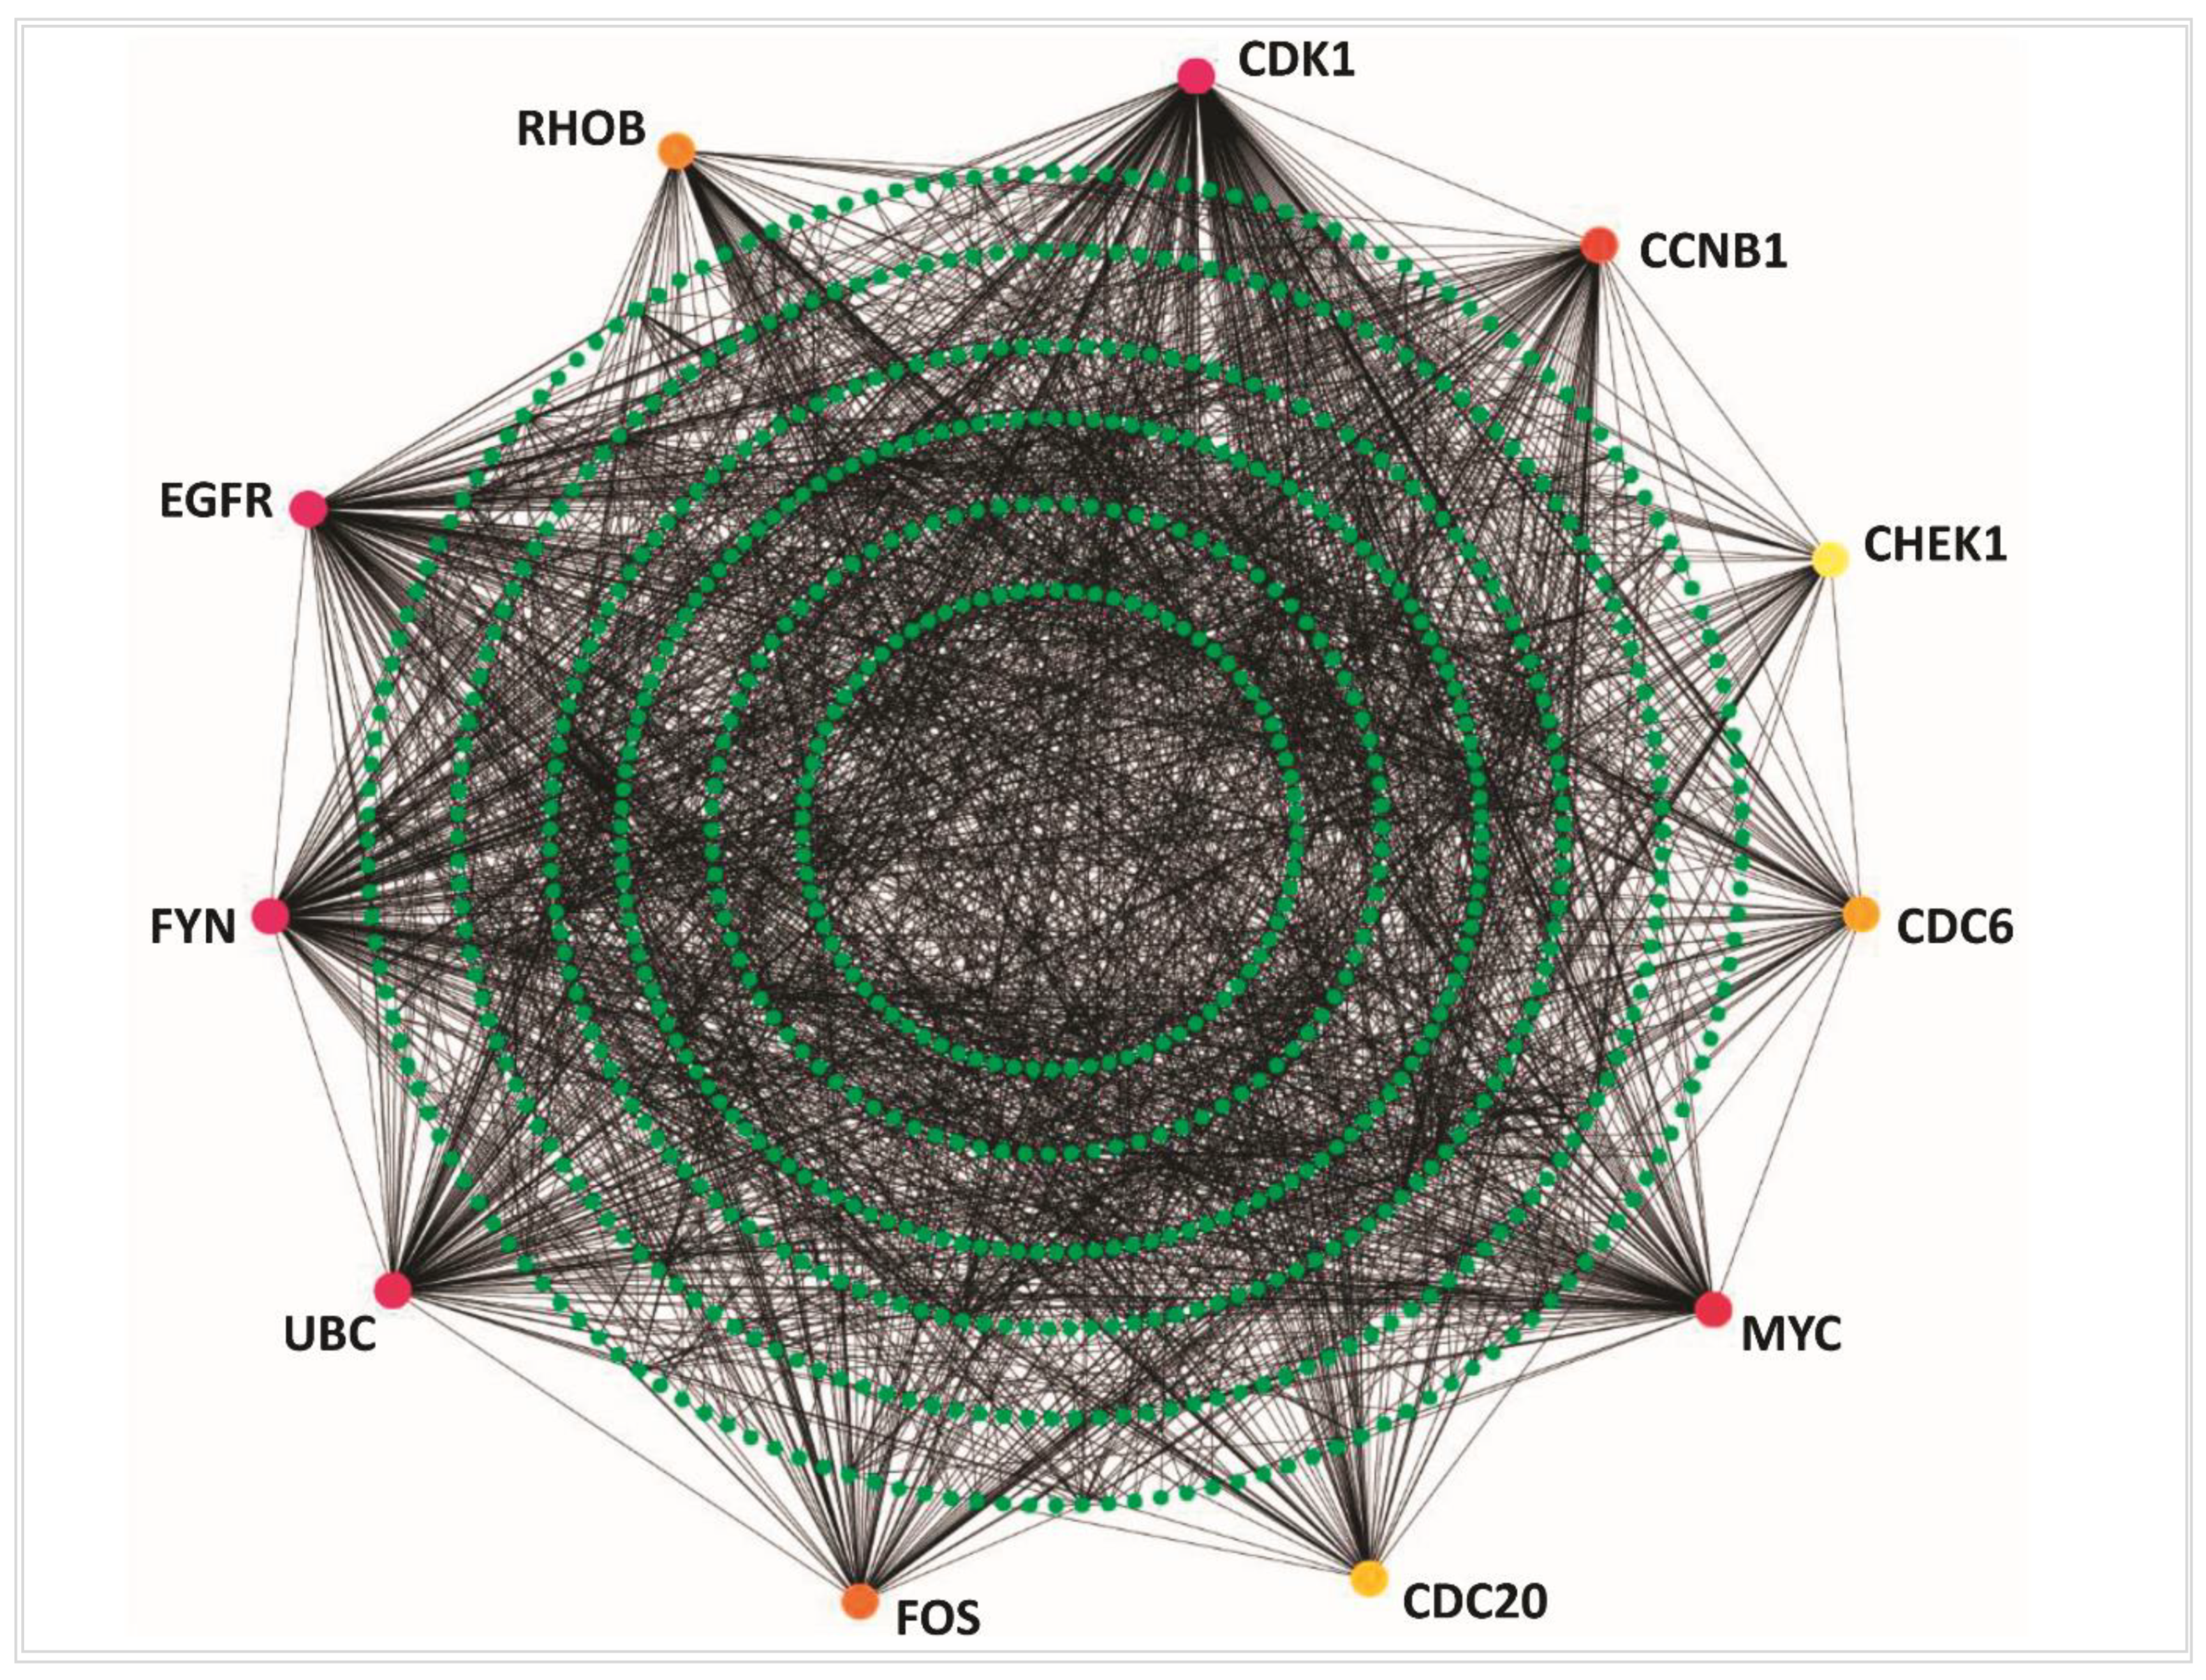
2.4. Protein-Protein Interaction Network Analysis of DEGs
2.5. Mutation Analysis of Hub-DEGs
2.6. Physicochemical Properties of Hub Proteins
2.7. Regulatory Biomolecules Selection
2.8. Cross-Validation and Evaluation of the Performance of Reported Biomolecules
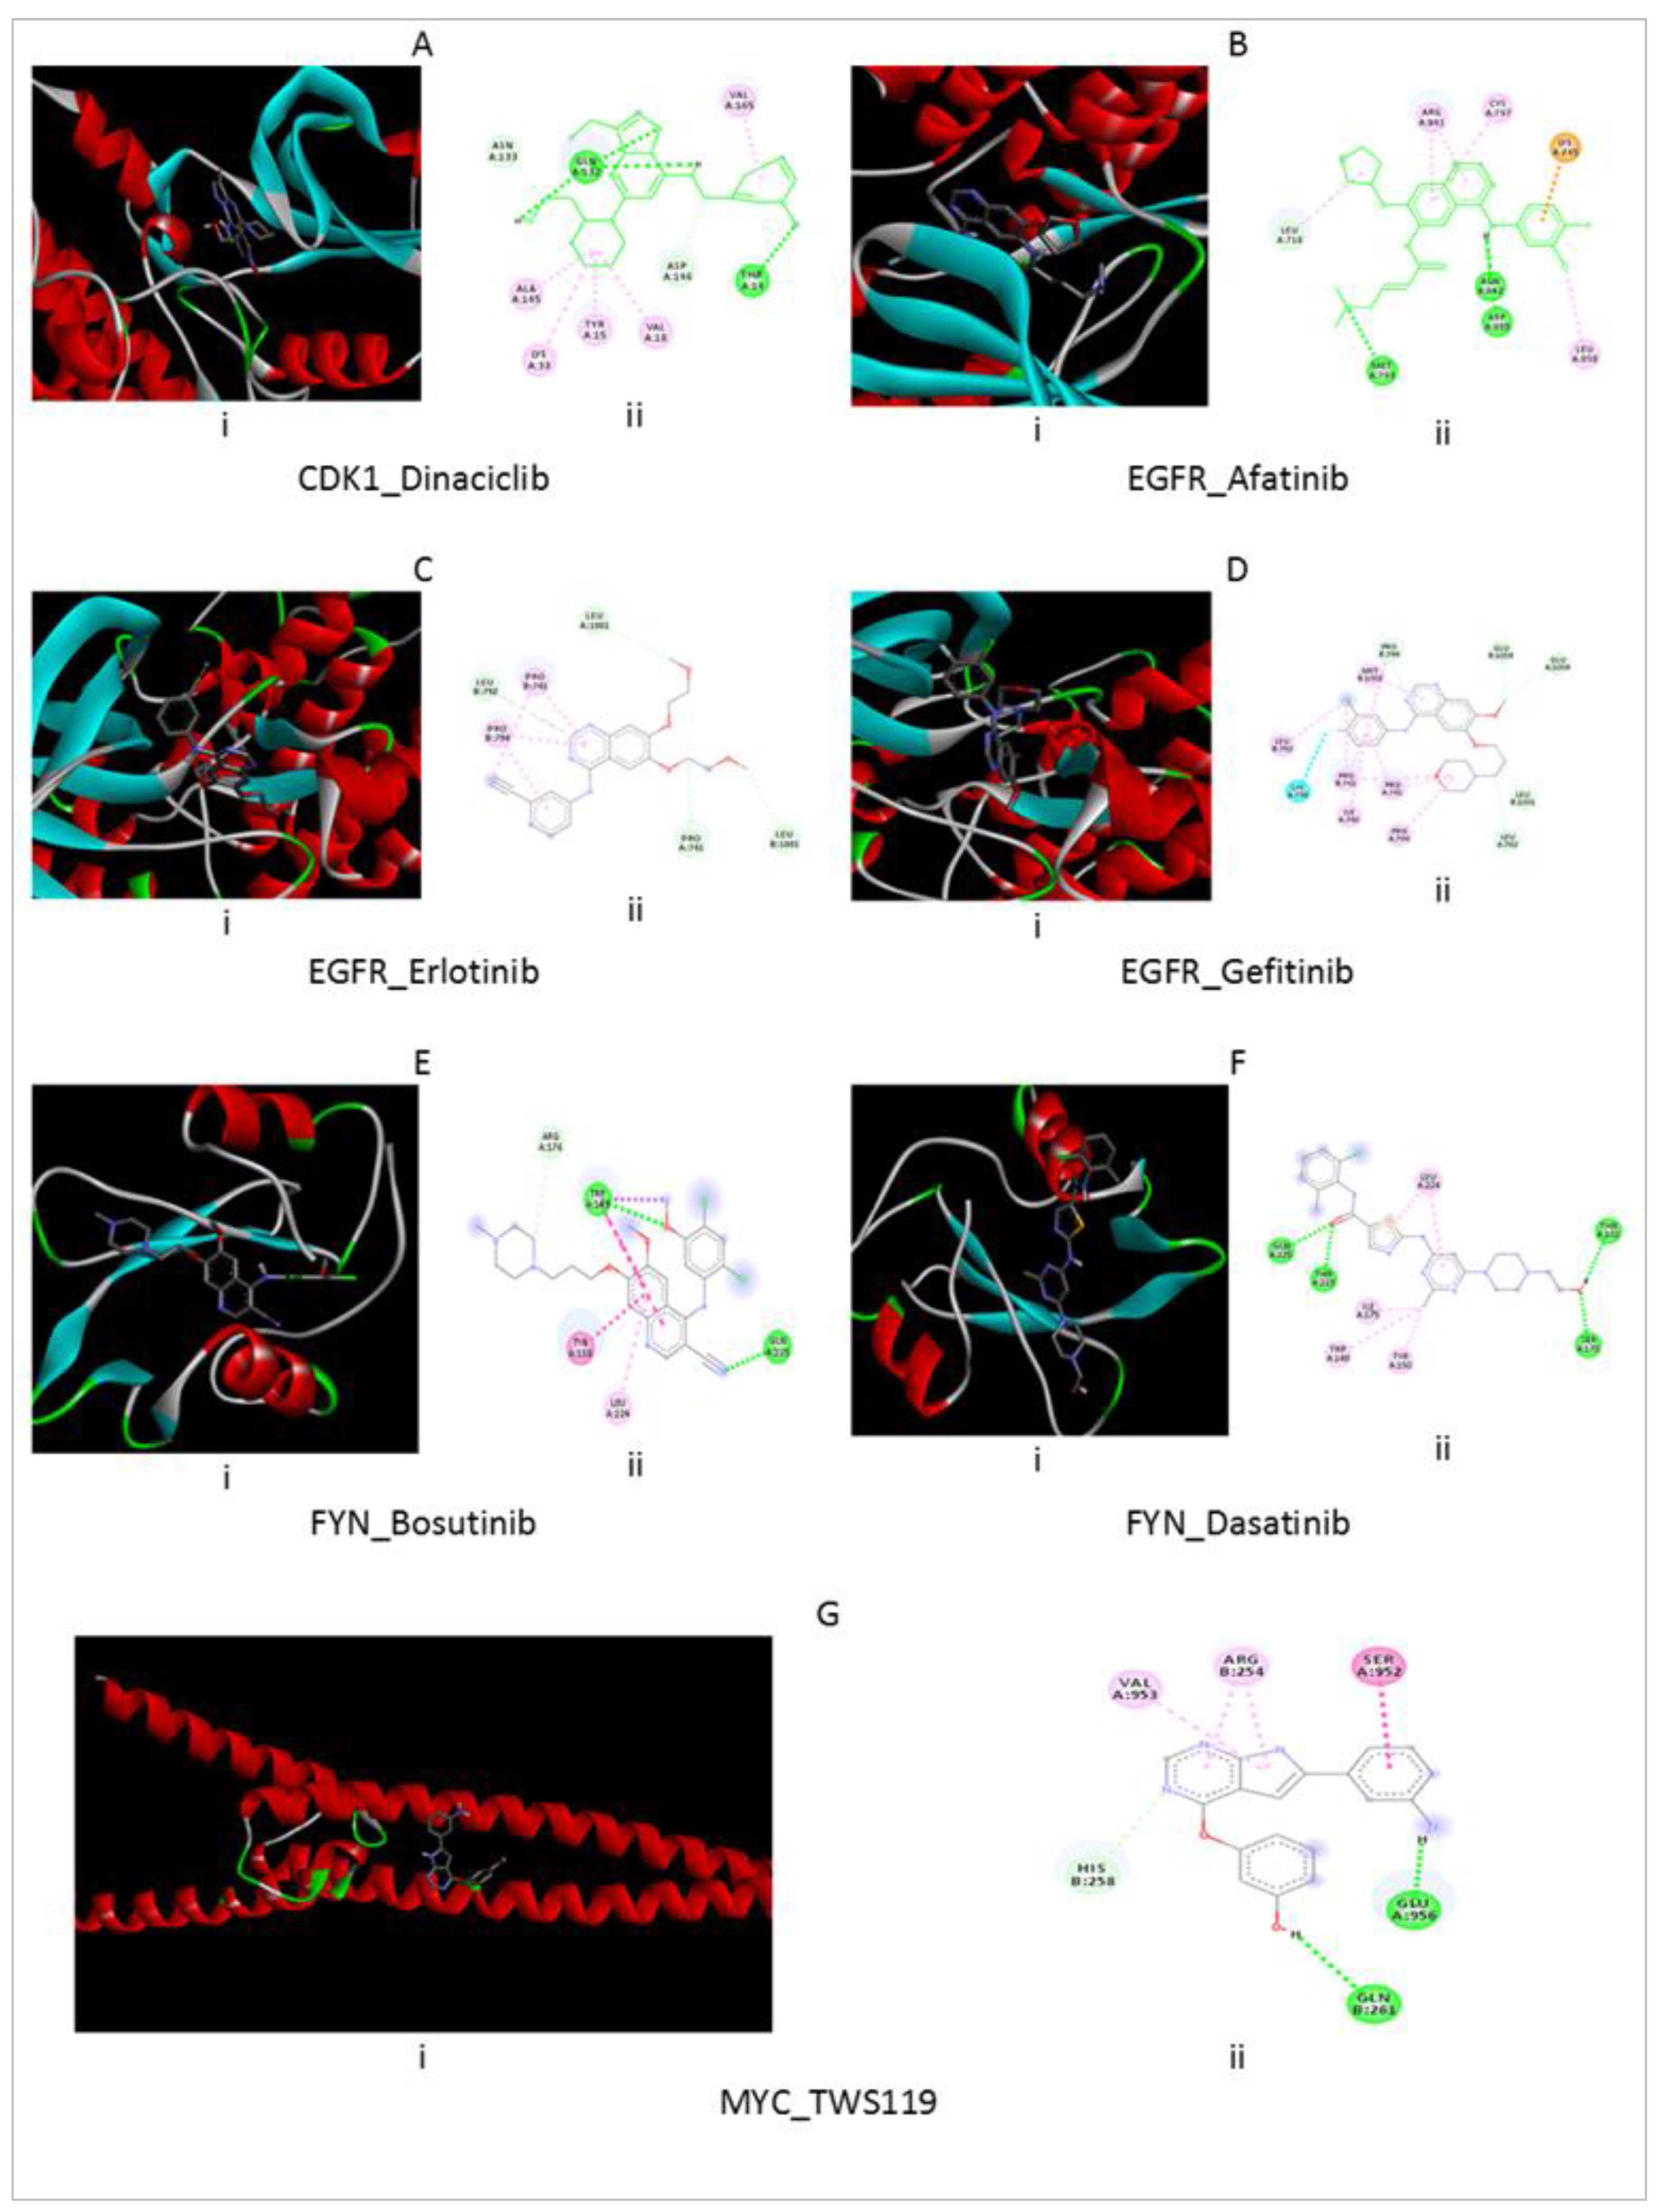
2.9. Drug Repositioning
3. Results
3.1. Differentially Expressed Genes (DEGs) Identification
3.2. Protein-Protein Interaction Analysis
3.3. Mutation Analysis of Hub-DEGs
3.4. Biological Importance of DEGs
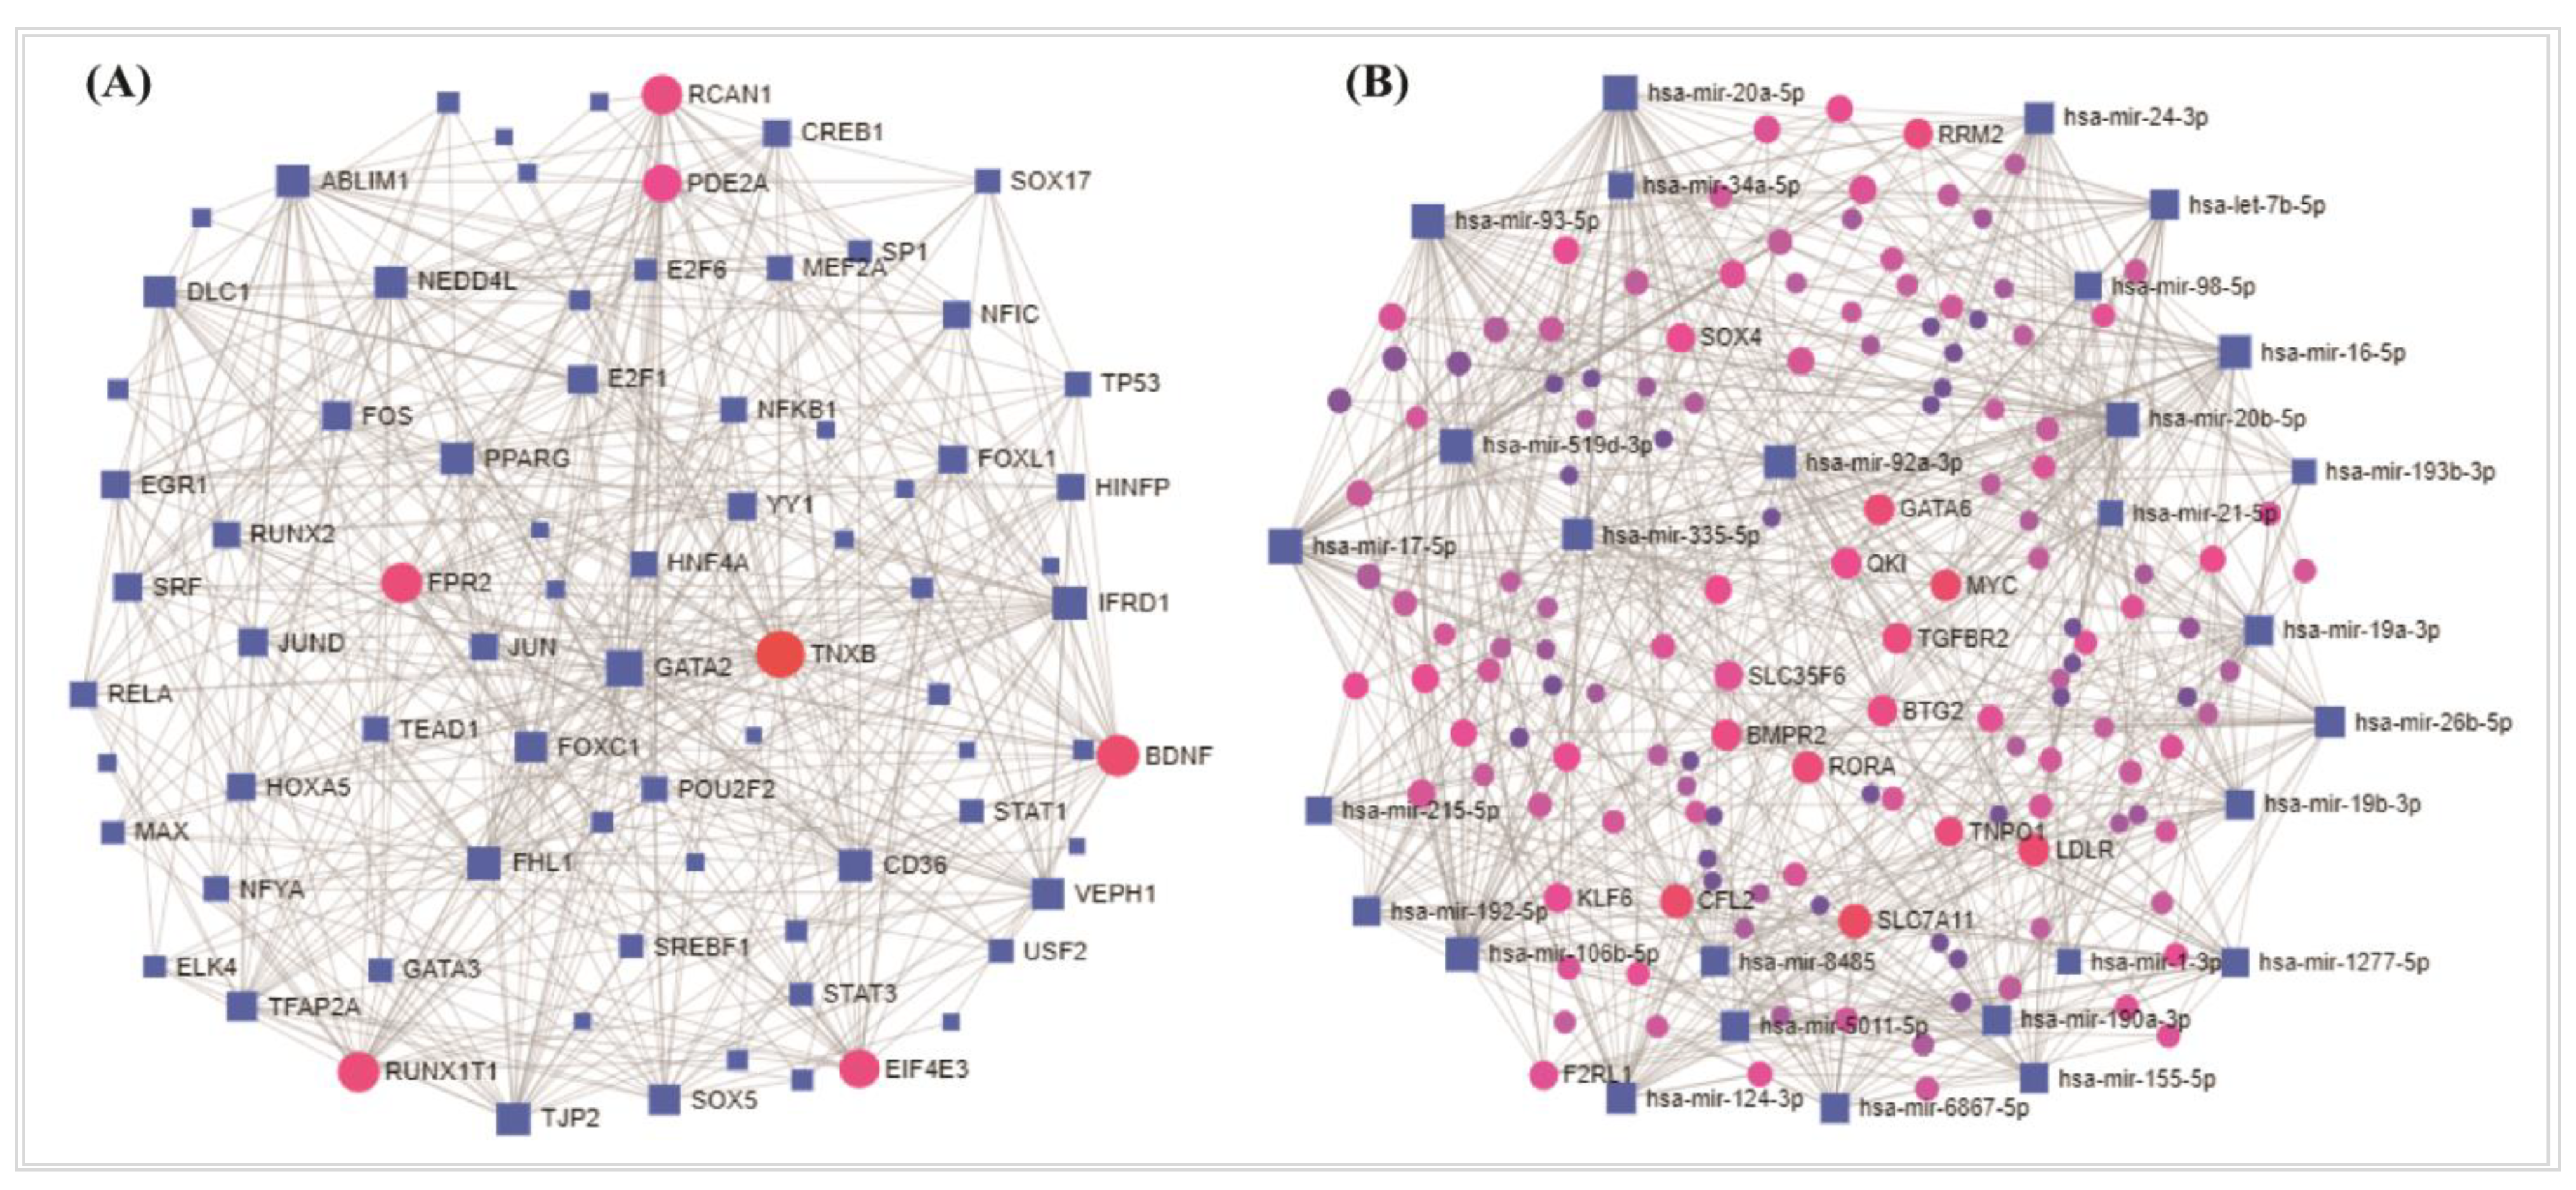
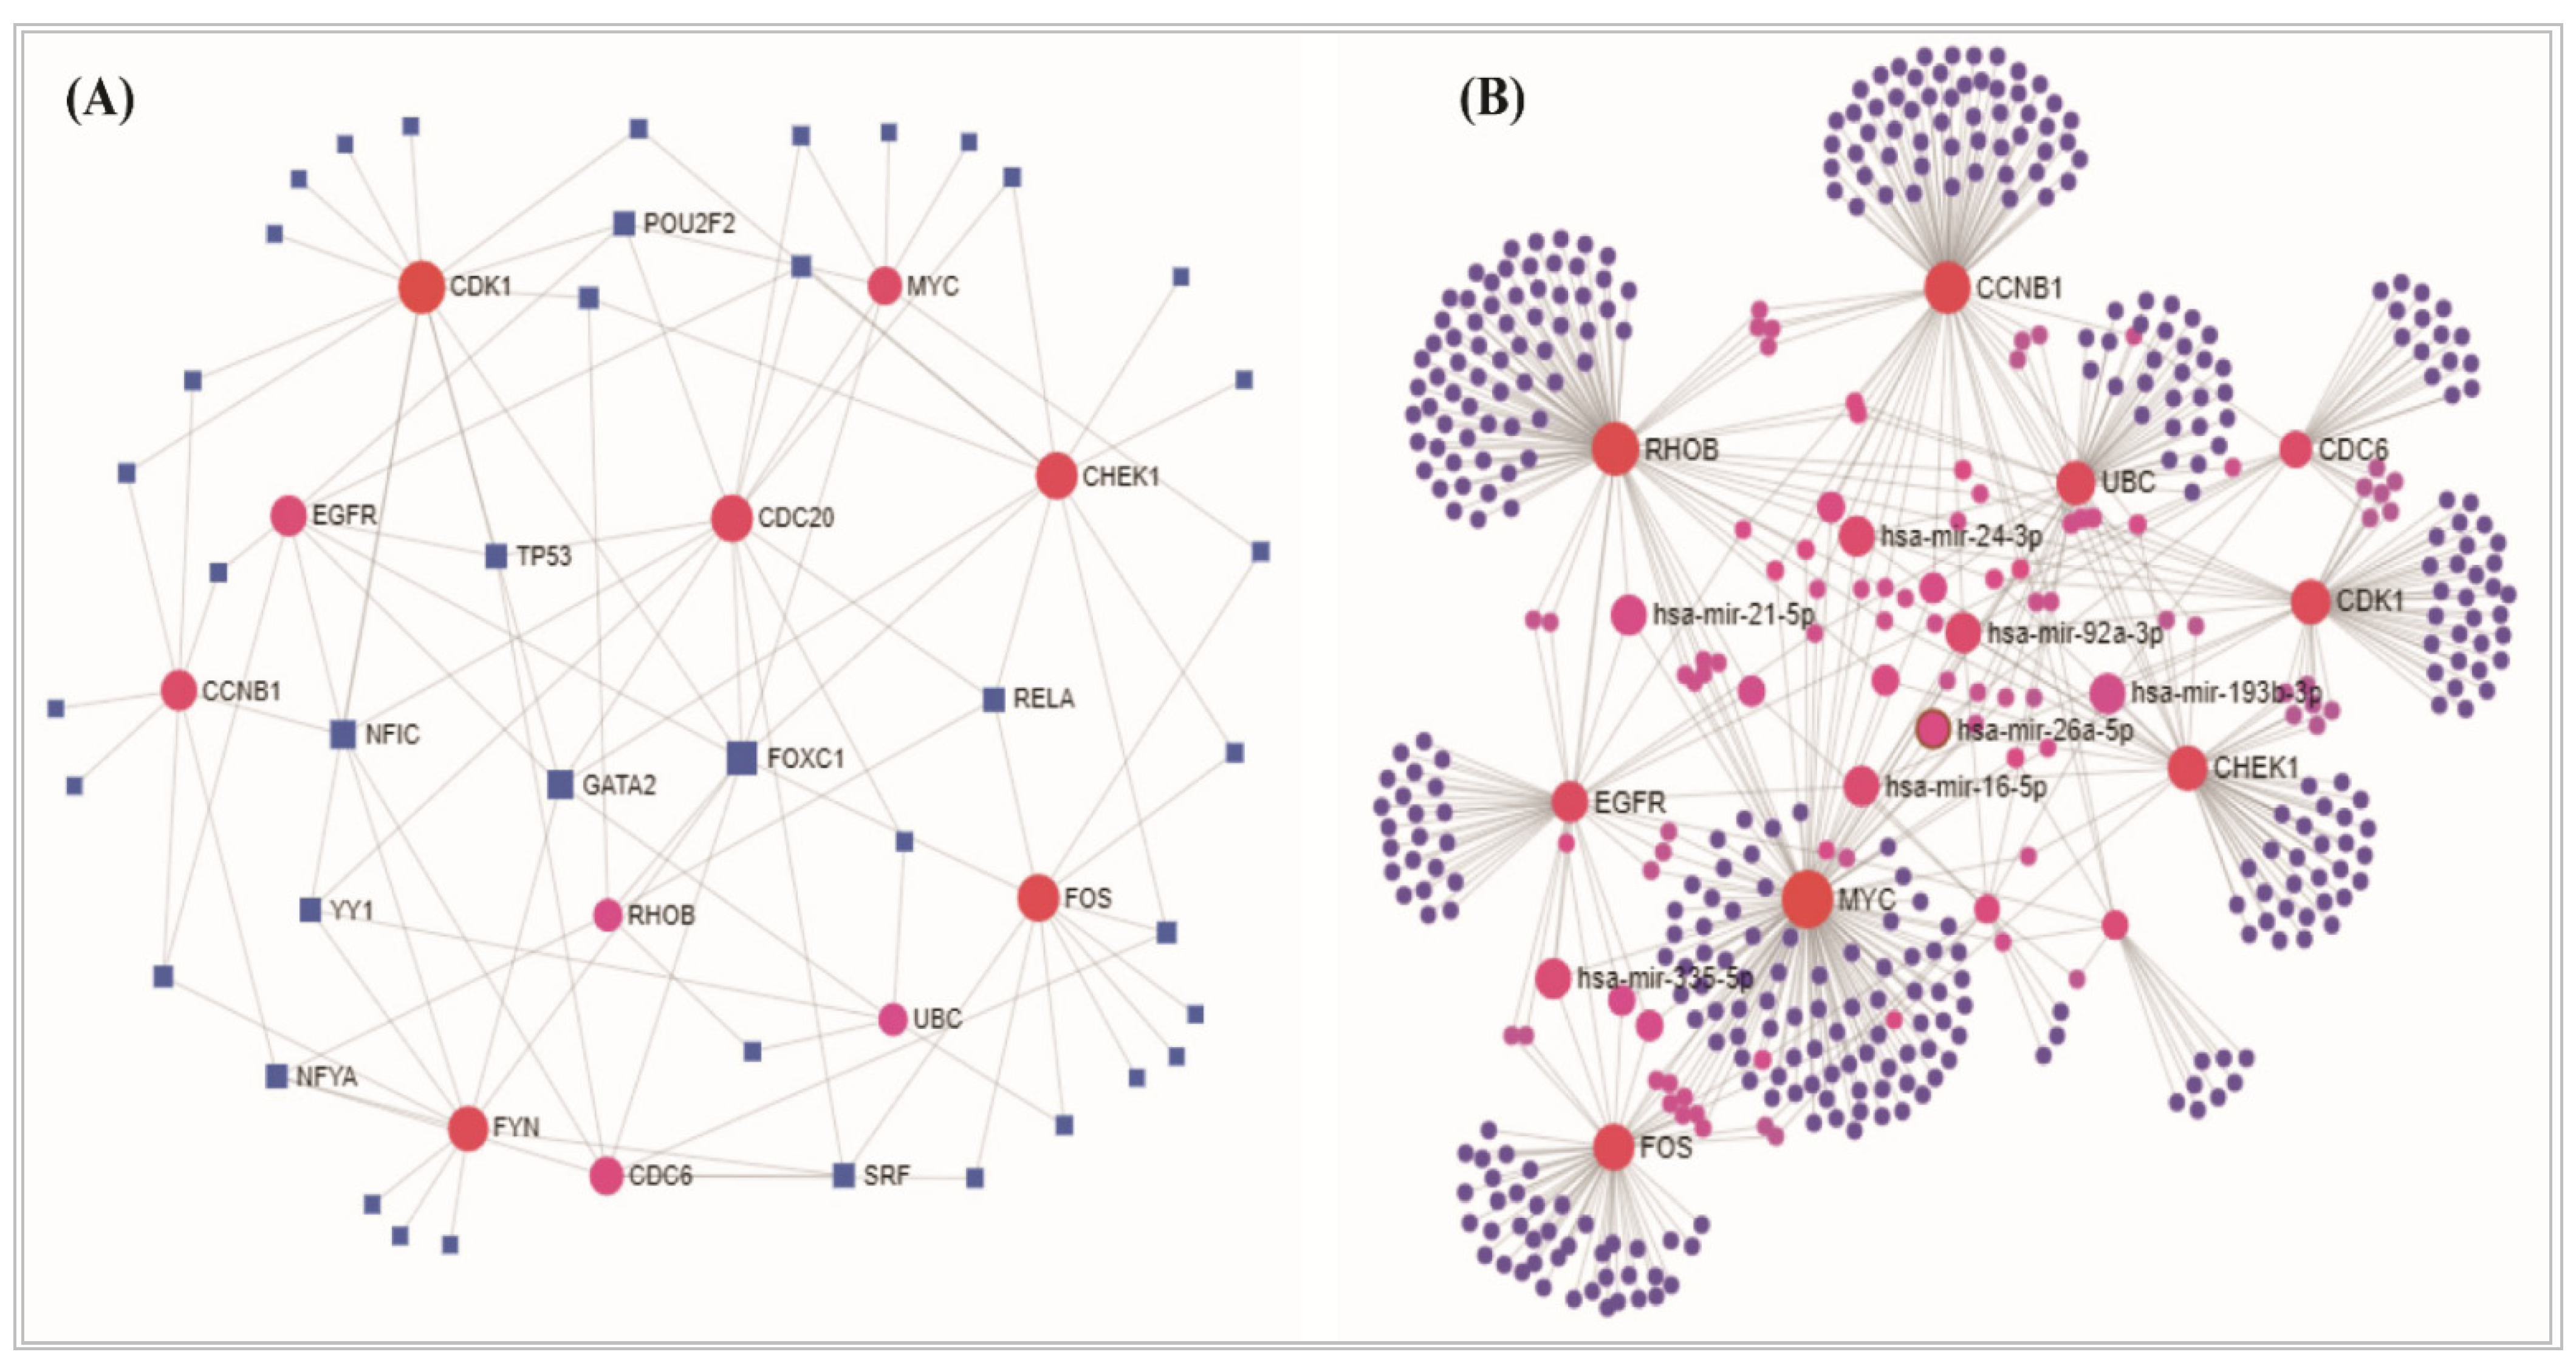
3.5. Regulatory Transcriptional/Post Transcriptional Candidates in in NSCLC
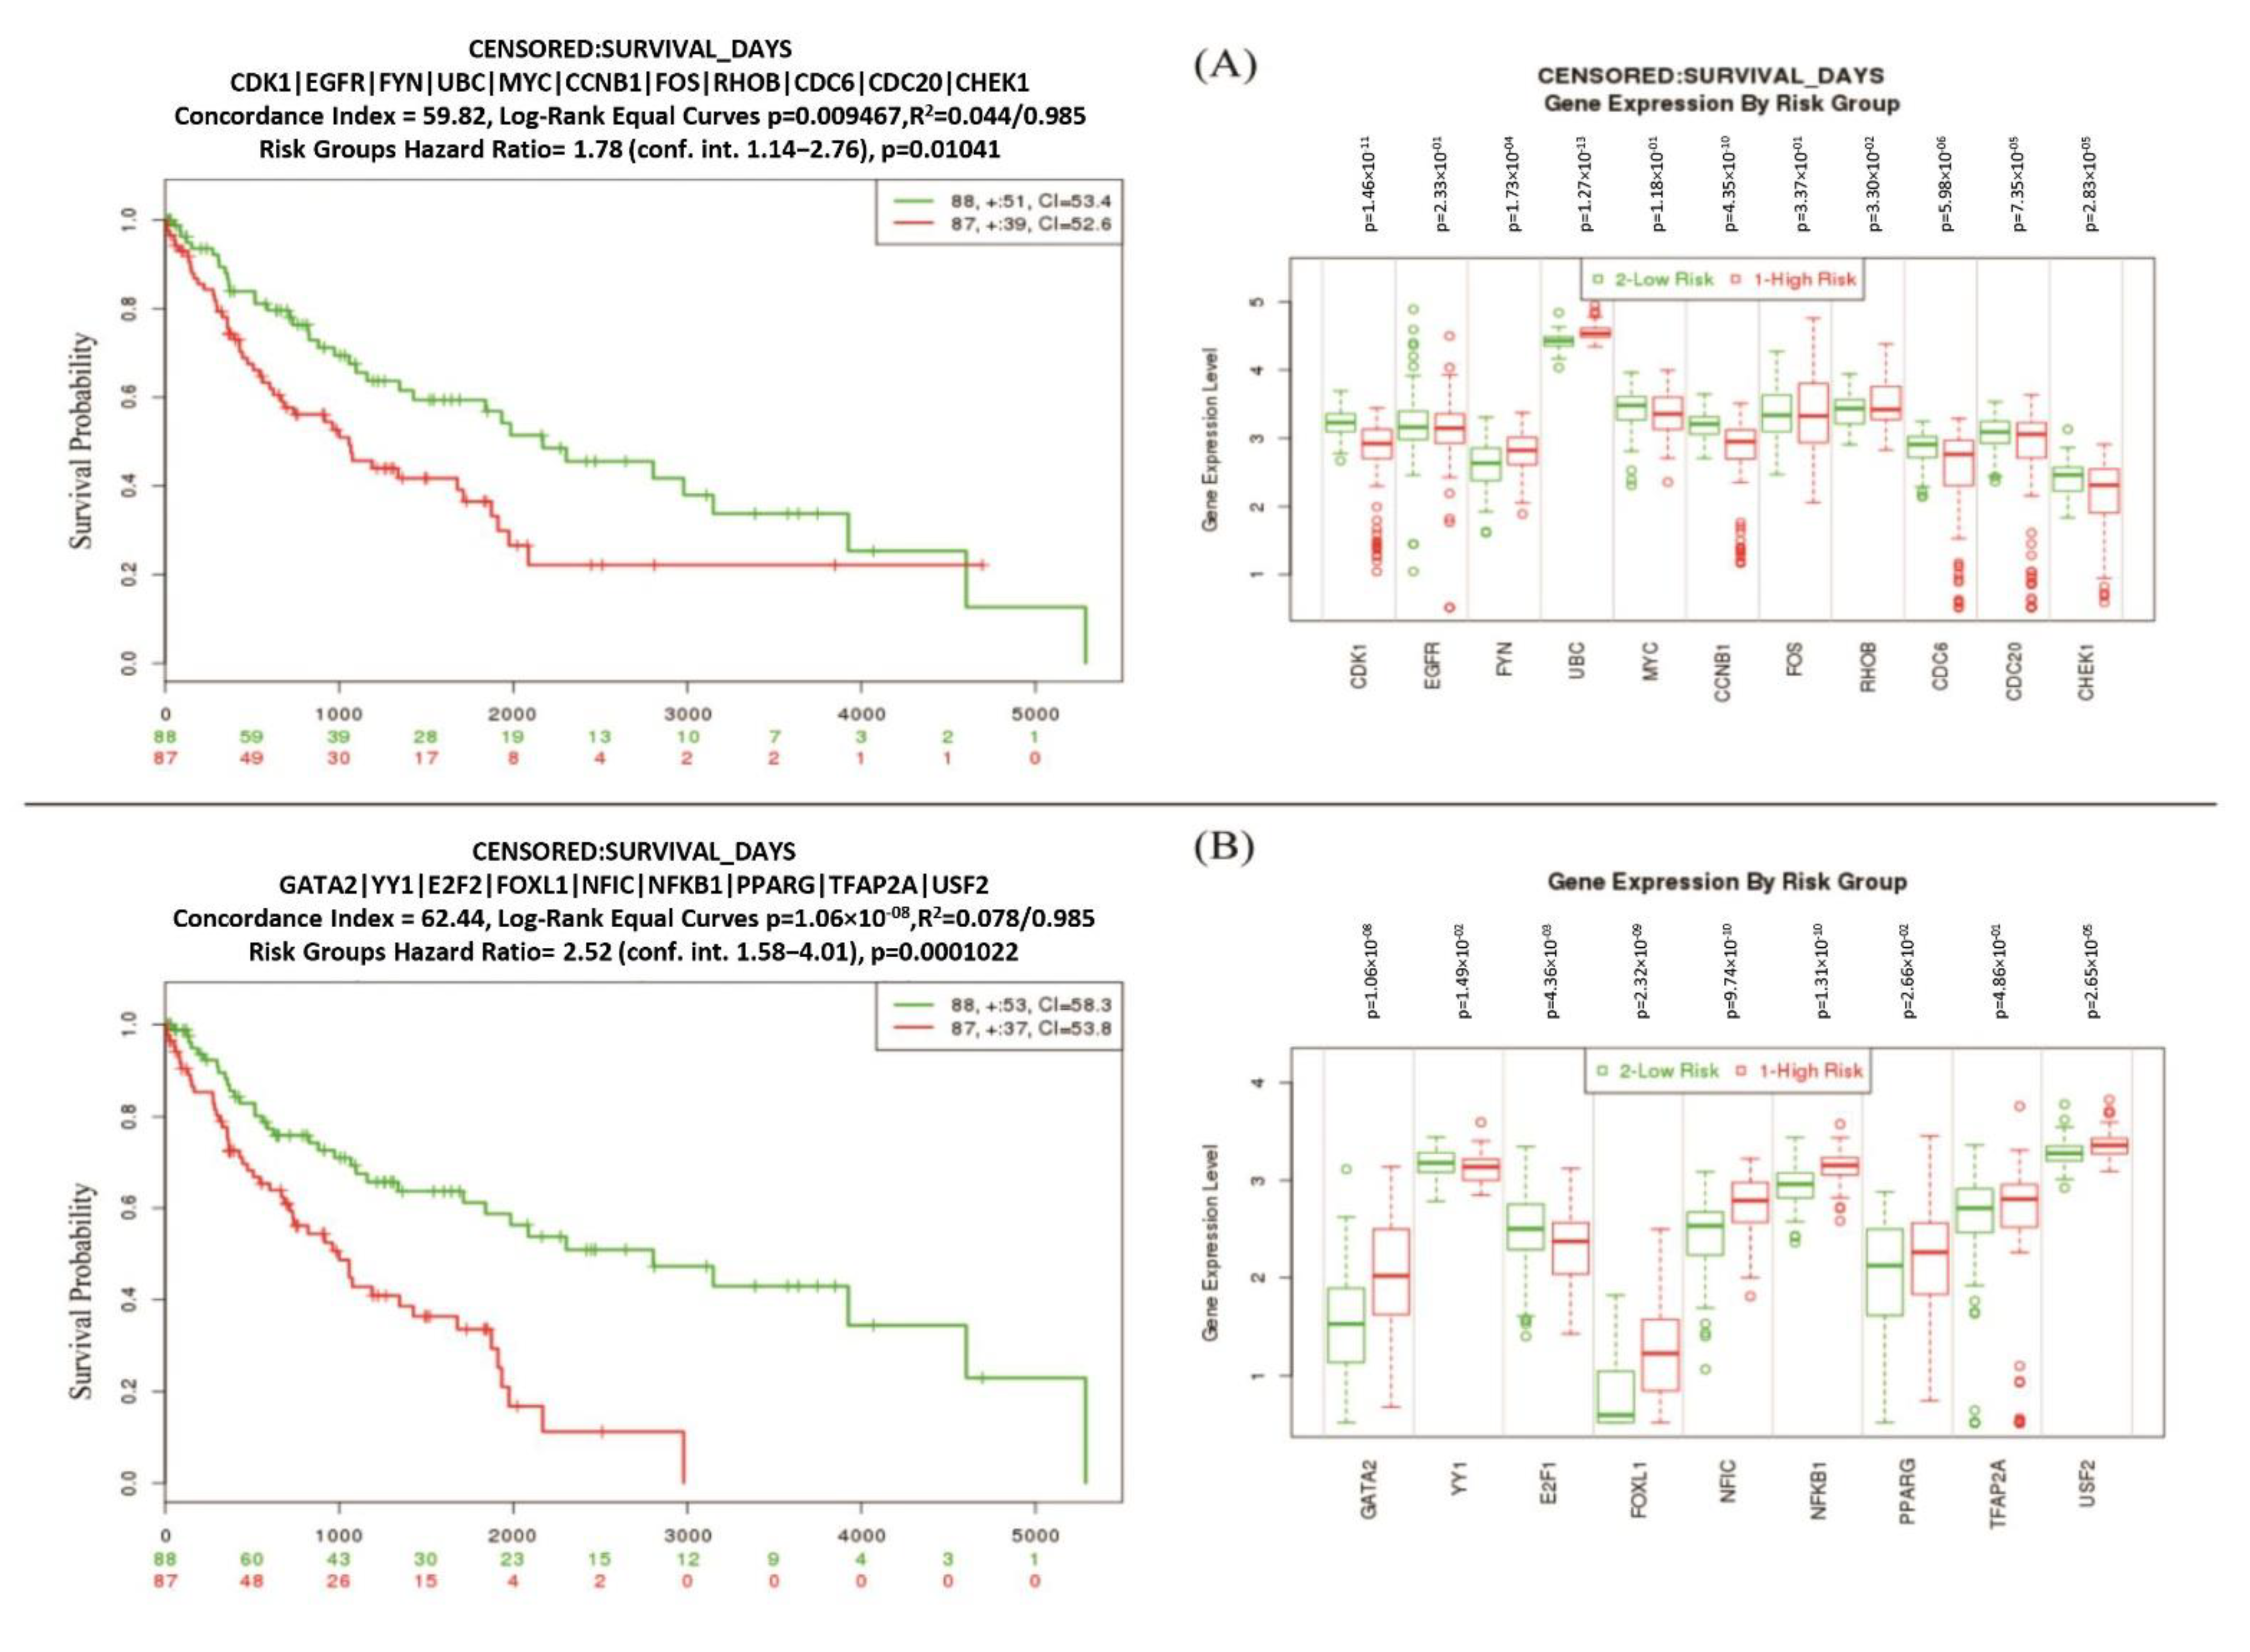
3.6. Risk Discrimination Performance of Reporter Biomolecules
3.7. Drug Repositioning
4. Discussion
5. Conclusions
Supplementary Materials
Author Contributions
Funding
Conflicts of Interest
References
- Jiang, H.; Xu, A.; Li, M.; Han, R.; Wang, E.; Wu, D.; Fei, G.; Zhou, S.; Wang, R. Seven autophagy-related lncRNAs are associated with the tumor immune microenvironment in predicting survival risk of nonsmall cell lung cancer. Brief. Funct. Genom. 2021. [Google Scholar] [CrossRef] [PubMed]
- Siegel, R.L.; Miller, K.D.; Jemal, A. Cancer statistics, 2020. CA Cancer J. Clin. 2020, 70, 145–164. [Google Scholar] [CrossRef] [PubMed] [Green Version]
- Qu, Y.; Emoto, K.; Eguchi, T.; Aly, R.G.; Zheng, H.; Chaft, J.E.; Tan, K.S.; Jones, D.R.; Kris, M.G.; Adusumilli, P.S.; et al. Pathologic Assessment after Neoadjuvant Chemotherapy for NSCLC: Importance and Implications of Distinguishing Adenocarcinoma From Squamous Cell Carcinoma. J. Thorac. Oncol. 2019, 14, 482–493. [Google Scholar] [CrossRef] [PubMed] [Green Version]
- Travis, W.D. Pathology of Lung Cancer. Clin. Chest Med. 2011, 32, 669–692. [Google Scholar] [CrossRef]
- Milovanovic, I.; Stjepanovic, M.; Mitrovic, D. Distribution patterns of the metastases of the lung carcinoma in relation to histological type of the primary tumor: An autopsy study. Ann. Thorac. Med. 2017, 12, 191–198. [Google Scholar] [CrossRef]
- D’Amico, T.A. Molecular Biologic Staging of Lung Cancer. Ann. Thorac. Surg. 2008, 85, S737–S742. [Google Scholar] [CrossRef]
- Alibolandi, M.; Ramezani, M.; Abnous, K.; Sadeghi, F.; Atyabi, F.; Asouri, M.; Ahmadi, A.A.; Hadizadeh, F. In vitro and in vivo evaluation of therapy targeting epithelial-cell adhesion-molecule aptamers for non-small cell lung cancer. J. Control. Release 2015, 209, 88–100. [Google Scholar] [CrossRef]
- Morgan, K.M.; Riedlinger, G.M.; Rosenfeld, J.; Ganesan, S.; Pine, S.R. Patient-derived xenograft models of non-small cell lung cancer and their potential utility in personalized medicine. Front. Oncol. 2017, 7, 2. [Google Scholar] [CrossRef] [Green Version]
- Desai, N.; Neyaz, A.; Szabolcs, A.; Shih, A.R.; Chen, J.H.; Thapar, V.; Nieman, L.T.; Solovyov, A.; Mehta, A.; Lieb, D.J.; et al. Temporal and spatial heterogeneity of host response to SARS-CoV-2 pulmonary infection. Nat. Commun. 2020, 11, 6319. [Google Scholar] [CrossRef]
- Kriegsmann, K.; Zgorzelski, C.; Muley, T.; Christopoulos, P.; Thomas, M.; Winter, H.; Eichhorn, M.; Eichhorn, F.; von Winterfeld, M.; Herpel, E.; et al. Role of Synaptophysin, Chromogranin and CD56 in adenocarcinoma and squamous cell carcinoma of the lung lacking morphological features of neuroendocrine differentiation: A retrospective large-scale study on 1170 tissue samples. BMC Cancer 2021, 21, 486. [Google Scholar] [CrossRef]
- Alberg, A.J.; Brock, M.V.; Ford, J.G.; Samet, J.M.; Spivack, S.D. Epidemiology of lung cancer: Diagnosis and management of lung cancer, 3rd ed.: American college of chest physicians evidence-based clinical practice guidelines. Chest 2013, 143, e1S–e29S. [Google Scholar] [CrossRef] [PubMed] [Green Version]
- Cho, J.Y.; Kim, J.; Lee, J.S.; Kim, Y.J.; Kim, S.H.; Lee, Y.J.; Cho, Y.-J.; Yoon, H.I.; Lee, J.H.; Lee, C.-T.; et al. Characteristics, incidence, and risk factors of immune checkpoint inhibitor-related pneumonitis in patients with non-small cell lung cancer. Lung Cancer 2018, 125, 150–156. [Google Scholar] [CrossRef] [PubMed]
- Akhtar, N.; Bansal, J.G. Risk factors of Lung Cancer in nonsmoker. Curr. Probl. Cancer 2017, 41, 328–339. [Google Scholar] [CrossRef] [PubMed]
- Malhotra, J.; Malvezzi, M.; Negri, E.; La Vecchia, C.; Boffetta, P. Risk factors for lung cancer worldwide. Eur. Respir. J. 2016, 48, 889–902. Available online: https://erj.ersjournals.com/content/48/3/889 (accessed on 27 February 2022). [CrossRef] [PubMed] [Green Version]
- Zappa, C.; Mousa, S.A. Non-small cell lung cancer: Current treatment and future advances. Transl. Lung Cancer Res. 2016, 5, 288. Available online: https://0-www-ncbi-nlm-nih-gov.brum.beds.ac.uk/pmc/articles/PMC4931124/ (accessed on 27 February 2022). [CrossRef] [Green Version]
- Reza, M.S.; Harun-Or-Roshid, M.; Islam, M.A.; Hossen, M.A.; Hossain, M.T.; Feng, S.; Xi, W.; Mollah, N.H.; Wei, Y. Bioinformatics Screening of Potential Biomarkers from mRNA Expression Profiles to Discover Drug Targets and Agents for Cervical Cancer. Int. J. Mol. Sci. 2022, 23, 3968. Available online: https://0-www-mdpi-com.brum.beds.ac.uk/1422-0067/23/7/3968/htm (accessed on 6 May 2022). [CrossRef]
- Alam, M.S.; Rahaman, M.M.; Sultana, A.; Wang, G.; Mollah, M.N.H. Statistics and network-based approaches to identify molecular mechanisms that drive the progression of breast cancer. Comput. Biol. Med. 2022, 145, 105508. Available online: https://pubmed.ncbi.nlm.nih.gov/35447458/ (accessed on 6 May 2022). [CrossRef]
- Delany, I.; Rappuoli, R.; De Gregorio, E. Vaccines for the 21st century. EMBO Mol. Med. 2014, 6, 708–720. [Google Scholar] [CrossRef]
- Okuda, K.; Wada, Y.; Shimada, M. Recent developments in preclinical DNA vaccination. Vaccines 2014, 2, 89–106. [Google Scholar] [CrossRef]
- Wahren, B.; Liu, M.A. Dna vaccines: Recent developments and the future. Vaccines 2014, 2, 785–796. [Google Scholar] [CrossRef] [Green Version]
- Nakayama, Y.; Aruga, A. Comparison of Current Regulatory Status for Gene-Based Vaccines in the U.S.; Europe and Japan. Vaccines 2015, 3, 186–202. Available online: https://0-www-mdpi-com.brum.beds.ac.uk/2076-393X/3/1/186/htm (accessed on 6 May 2022). [CrossRef] [PubMed] [Green Version]
- Ulmer, J.B.; Wahren, B.; Liu, M.A. Gene-based vaccines: Recent technical and clinical advances. Trends Mol. Med. 2006, 12, 216–222. [Google Scholar] [CrossRef] [PubMed]
- Xu, H.; Huang, J.; Hua, S.; Liang, L.; He, X.; Zhan, M.; Lu, L.; Chu, J. Interactome analysis of gene expression profiles identifies CDC6 as a potential therapeutic target modified by miR-215-5p in hepatocellular carcinoma. Int. J. Med. Sci. 2020, 17, 2926–2940. [Google Scholar] [CrossRef] [PubMed]
- Ennishi, D.; Takata, K.; Béguelin, W.; Duns, G.; Mottok, A.; Farinha, P.; Bashashati, A.; Saberi, S.; Boyle, M.; Meissner, B.; et al. Molecular and genetic characterization of MHC deficiency identifies ezh2 as therapeutic target for enhancing immune recognition. Cancer Discov. 2019, 9, 546–563. [Google Scholar] [CrossRef] [PubMed] [Green Version]
- Xu, J.; Zhu, C.; Yu, Y.; Wu, W.; Cao, J.; Li, Z.; Dai, J.; Wang, C.; Tang, Y.; Zhu, Q.; et al. Systematic cancer-testis gene expression analysis identified CDCA5 as a potential therapeutic target in esophageal squamous cell carcinoma. eBioMedicine 2019, 46, 54–65. [Google Scholar] [CrossRef] [Green Version]
- Wei, Z.; Liu, Y.; Qiao, S.; Li, X.; Li, Q.; Zhao, J.; Hu, J.; Wei, Z.; Shan, A.; Sun, X.; et al. Identification of the potential therapeutic target gene ube2c in human hepatocellular carcinoma: An investigation based on geo and tcga databases. Oncol. Lett. 2019, 17, 5409–5418. [Google Scholar] [CrossRef] [Green Version]
- Islam, T.; Rahman, R.; Gov, E.; Turanli, B.; Gulfidan, G.; Haque, A.; Arga, K.Y.; Mollah, N.H. Drug Targeting and Biomarkers in Head and Neck Cancers: Insights from Systems Biology Analyses. Omics J. Integr. Biol. 2018, 22, 422–436. [Google Scholar] [CrossRef]
- Mosharaf, M.P.; Reza, M.S.; Kibria, M.K.; Ahmed, F.F.; Kabir, M.H.; Hasan, S.; Mollah, N.H. Computational identification of host genomic biomarkers highlighting their functions, pathways and regulators that influence SARS-CoV-2 infections and drug repurposing. Sci. Rep. 2022, 12, 4279. Available online: https://0-www-nature-com.brum.beds.ac.uk/articles/s41598-022-08073-8 (accessed on 21 April 2022). [CrossRef]
- Faysal Ahmed, F.; Selim Reza, M.; Shahin Sarker, M.; Samiul Islam, M.I.; Parvez Mosharaf, M.; Hasan, S.; Mollah, N.H. Identification of host transcriptome-guided repurposable drugs for SARS-CoV-1 infections and their validation with SARS-CoV-2 infections by using the integrated bioinformatics approaches. PLoS ONE 2022, 17, e0266124. Available online: https://journals.plos.org/plosone/article?id=10.1371/journal.pone.0266124 (accessed on 21 April 2022).
- Barrett, T.; Wilhite, S.E.; Ledoux, P.; Evangelista, C.; Kim, I.F.; Tomashevsky, M.; Marshall, K.A.; Phillippy, K.H.; Sherman, P.M.; Holko, M.; et al. NCBI GEO: Archive for functional genomics data sets—Update. Nucleic Acids Res. 2013, 41, D991–D995. [Google Scholar] [CrossRef] [Green Version]
- Lu, T.P.; Tsai, M.H.; Lee, J.M.; Hsu, C.P.; Chen, P.C.; Lin, C.W.; Shih, J.Y.; Yang, P.C.; Hsiao, C.K.; Lai, L.C.; et al. Identification of a novel biomarker, SEMA5A, for non-small cell lung carcinoma in nonsmoking women. Cancer Epidemiol. Biomarkers Prev. 2010, 19, 2590–2597. [Google Scholar] [CrossRef] [PubMed] [Green Version]
- Gentleman, R.C.; Carey, V.J.; Bates, D.M.; Bolstad, B.; Dettling, M.; Dudoit, S.; Ellis, B.; Gautier, L.; Ge, Y.; Gentry, J.; et al. Bioconductor: Open software development for computational biology and bioinformatics. Genome Biol. 2004, 5, R80. [Google Scholar] [CrossRef] [Green Version]
- Benjamini, Y.; Hochberg, Y. Controlling the False Discovery Rate: A Practical and Powerful Approach to Multiple Testing. J. R. Stat. Soc. Ser. B 1995, 57, 289–300. [Google Scholar] [CrossRef]
- Huang, D.W.; Sherman, B.T.; Lempicki, R.A. Bioinformatics enrichment tools: Paths toward the comprehensive functional analysis of large gene lists. Nucleic Acids Res. 2009, 37, 1–13. [Google Scholar] [CrossRef] [PubMed] [Green Version]
- Huang, D.W.; Sherman, B.T.; Lempicki, R.A. Systematic and integrative analysis of large gene lists using DAVID bioinformatics resources. Nat. Protoc. 2009, 4, 44–57. [Google Scholar] [CrossRef] [PubMed]
- Kanehisa, M.; Furumichi, M.; Tanabe, M.; Sato, Y.; Morishima, K. KEGG: New perspectives on genomes, pathways, diseases and drugs. Nucleic Acids Res. 2017, 45, D353–D361. Available online: https://pubmed.ncbi.nlm.nih.gov/27899662/ (accessed on 8 October 2021). [CrossRef] [Green Version]
- Kanehisa, M.; Sato, Y.; Kawashima, M.; Furumichi, M.; Tanabe, M. KEGG as a reference resource for gene and protein annotation. Nucleic Acids Res. 2016, 44, D457–D462. [Google Scholar] [CrossRef] [Green Version]
- Kanehisa, M.; Goto, S. KEGG: Kyoto Encyclopedia of Genes and Genomes. Nucleic Acids Res. 2000, 28, 27–30. [Google Scholar] [CrossRef]
- Szklarczyk, D.; Morris, J.H.; Cook, H.; Kuhn, M.; Wyder, S.; Simonovic, M.; Santos, A.; Doncheva, N.T.; Roth, A.; Bork, P.; et al. The STRING database in 2017: Quality-controlled protein-protein association networks, made broadly accessible. Nucleic Acids Res. 2017, 45, D362–D368. [Google Scholar] [CrossRef]
- Li, X.; Li, W.; Zeng, M.; Zheng, R.; Li, M. Network-based methods for predicting essential genes or proteins: A survey. Brief. Bioinform. 2020, 21, 566–583. [Google Scholar] [CrossRef]
- Xia, J.; Gill, E.E.; Hancock, R.E.W. NetworkAnalyst for statistical, visual and network-based meta-analysis of gene expression data. Nat. Protoc. 2015, 10, 823–844. [Google Scholar] [CrossRef] [PubMed]
- Chin, C.H.; Chen, S.H.; Wu, H.H.; Ho, C.W.; Ko, M.T.; Lin, C.Y. cytoHubba: Identifying hub objects and sub-networks from complex interactome. BMC Syst. Biol. 2014, 8, S11. [Google Scholar] [CrossRef] [PubMed] [Green Version]
- Calimlioglu, B.; Karagoz, K.; Sevimoglu, T.; Kilic, E.; Gov, E.; Arga, K.Y. Tissue-Specific Molecular Biomarker Signatures of Type 2 Diabetes: An Integrative Analysis of Transcriptomics and Protein-Protein Interaction Data. Omics J. Integr. Biol. 2015, 19, 563–573. [Google Scholar] [CrossRef] [PubMed]
- Bandettini, W.P.; Kellman, P.; Mancini, C.; Booker, O.J.; Vasu, S.; Leung, S.W.; Wilson, J.R.; Shanbhag, S.M.; Chen, M.Y.; Arai, A.E. MultiContrast Delayed Enhancement (MCODE) improves detection of subendocardial myocardial infarction by late gadolinium enhancement cardiovascular magnetic resonance: A clinical validation study. J. Cardiovasc. Magn. Reson. 2012, 14, 83. Available online: https://pubmed.ncbi.nlm.nih.gov/23199362/ (accessed on 20 September 2021). [CrossRef] [Green Version]
- Gao, J.; Aksoy, B.A.; Dogrusoz, U.; Dresdner, G.; Gross, B.; Sumer, S.O.; Sun, Y.; Jacobsen, A.; Sinha, R.; Larsson, E.; et al. Integrative analysis of complex cancer genomics and clinical profiles using the cBioPortal. Sci. Signal. 2013, 6, pl1. Available online: https://pubmed.ncbi.nlm.nih.gov/23550210/ (accessed on 6 May 2022). [CrossRef] [Green Version]
- Cerami, E.; Gao, J.; Dogrusoz, U.; Gross, B.E.; Sumer, S.O.; Aksoy, B.A.; Jacobsen, A.; Byrne, C.J.; Heuer, M.L.; Larsson, E.; et al. The cBio Cancer Genomics Portal: An Open Platform for Exploring Multidimensional Cancer Genomics Data. Cancer Discov. 2012, 2, 401–404. Available online: https://aacrjournals.org/cancerdiscovery/article/2/5/401/3246/The-cBio-Cancer-Genomics-Portal-An-Open-Platform (accessed on 6 May 2022). [CrossRef] [Green Version]
- Karagkouni, D.; Paraskevopoulou, M.D.; Chatzopoulos, S.; Vlachos, I.S.; Tastsoglou, S.; Kanellos, I.; Papadimitriou, D.; Kavakiotis, I.; Maniou, S.; Skoufos, G.; et al. DIANA-TarBase v8: A decade-long collection of experimentally supported miRNA-gene interactions. Nucleic Acids Res. 2018, 46, D239–D245. [Google Scholar] [CrossRef] [Green Version]
- Chou, C.H.; Chang, N.W.; Shrestha, S.; Hsu, S.D.; Lin, Y.L.; Lee, W.H.; Yang, C.D.; Hong, H.C.; Wei, T.Y.; Tu, S.J.; et al. miRTarBase 2016: Updates to the experimentally validated miRNA-target interactions database. Nucleic Acids Res. 2016, 44, D239–D247. Available online: https://pubmed.ncbi.nlm.nih.gov/26590260/ (accessed on 20 September 2021). [CrossRef]
- Khan, A.; Fornes, O.; Stigliani, A.; Gheorghe, M.; Castro-Mondragon, J.A.; Van Der Lee, R.; Bessy, A.; Cheneby, J.; Kulkarni, S.R.; Tan, G.; et al. JASPAR 2018: Update of the open-access database of transcription factor binding profiles and its web framework. Nucleic Acids Res. 2018, 46, D260–D266. [Google Scholar] [CrossRef] [Green Version]
- Aguirre-Gamboa, R.; Gomez-Rueda, H.; Martínez-Ledesma, E.; Martínez-Torteya, A.; Chacolla-Huaringa, R.; Rodriguez-Barrientos, A.; Tamez-Pena, J.G.; Treviño, V. SurvExpress: An Online Biomarker Validation Tool and Database for Cancer Gene Expression Data Using Survival Analysis. PLoS ONE 2013, 8, e74250. [Google Scholar] [CrossRef] [Green Version]
- Lamb, J.; Crawford, E.D.; Peck, D.; Modell, J.W.; Blat, I.C.; Wrobel, M.J.; Lerner, J.; Brunet, J.-P.; Subramanian, A.; Ross, K.N.; et al. The connectivity map: Using gene-expression signatures to connect small molecules, genes, and disease. Science 2006, 313, 1929–1935. [Google Scholar] [CrossRef] [PubMed] [Green Version]
- Meng, X.-Y.; Zhang, H.-X.; Mezei, M.; Cui, M. Molecular Docking: A Powerful Approach for Structure-Based Drug Discovery. Curr. Comput. Aided-Drug Des. 2012, 7, 146–157. [Google Scholar] [CrossRef] [PubMed]
- Halgren, T.A. Merck molecular force field. I. Basis, form, scope, parameterization, and performance of MMFF94. J. Comput. Chem. 1996, 17, 490–519. [Google Scholar] [CrossRef]
- Wass, M.N.; Kelley, L.A.; Sternberg, M.J.E. 3DLigandSite: Predicting ligand-binding sites using similar structures. Nucleic Acids Res. 2010, 38, W469–W473. [Google Scholar] [CrossRef] [PubMed] [Green Version]
- Morris, G.M.; Huey, R.; Lindstrom, W.; Sanner, M.F.; Belew, R.K.; Goodsell, D.S.; Olson, A.J. AutoDock4 and AutoDockTools4: Automated docking with selective receptor flexibility. J. Comput. Chem. 2009, 30, 2785–2791. [Google Scholar] [CrossRef] [PubMed] [Green Version]
- Oleg, T.; Arthur, J.O. AutoDock Vina: Improving the Speed and Accuracy of Docking with a New Scoring Function, Efficient Optimization, and Multithreading. J. Comput. Chem. 2010, 31, 455–461. [Google Scholar]
- Accelrys Software Inc. Visualizer DS, Version 4. 0. 100. 13345; Accelrys Software Inc.: San Diego, CA, USA, 2016. [Google Scholar]
- Rahman, R.; Islam, T.; Gov, E.; Turanli, B.; Gulfidan, G.; Shahjaman, M.; Banu, N.A.; Mollah, N.H.; Arga, K.Y.; Moni, M.A. Identification of prognostic biomarker signatures and candidate drugs in colorectal cancer: Insights from systems biology analysis. Medicina 2019, 55, 20. [Google Scholar] [CrossRef] [Green Version]
- Islam, T.; Rahman, M.R.; Aydin, B.; Beklen, H.; Arga, K.Y.; Shahjaman, M. Integrative transcriptomics analysis of lung epithelial cells and identification of repurposable drug candidates for COVID-19. Eur. J. Pharmacol. 2020, 887, 173594. [Google Scholar] [CrossRef]
- Rahman, M.R.; Islam, T.; Turanli, B.; Zaman, T.; Faruquee, H.M.; Rahman, M.M.; Mollah, M.N.H.; Nanda, R.K.; Arga, K.Y.; Gov, E.; et al. Network-based approach to identify molecular signatures and therapeutic agents in Alzheimer’s disease. Comput. Biol. Chem. 2019, 78, 431–439. [Google Scholar] [CrossRef]
- Moni, M.A.; Islam, M.B.; Rahman, M.R.; Rashed-Al-Mahfuz, M.; Awal, M.A.; Islam, S.M.S.; Mollah, N.H.; Quinn, M.W. Network-Based Computational Approach to Identify Delineating Common Cell Pathways Influencing Type 2 Diabetes and Diseases of Bone and Joints. IEEE Access 2020, 8, 1486–1497. [Google Scholar] [CrossRef]
- Satu, S.; Khan, I.; Rahman, R.; Howlader, K.C.; Roy, S.; Roy, S.S.; Quinn, J.M.W.; Ali Moni, M. Diseasome and comorbidities complexities of SARS-CoV-2 infection with common malignant diseases. Brief Bioinform. 2021, 22, 1415–1429. [Google Scholar] [CrossRef] [PubMed]
- Shahjaman, M.; Rezanur Rahman, M.; Shahinul Islam, S.M.; Nurul Haque Mollah, M. A robust approach for identification of cancer biomarkers and candidate drugs. Medicina 2019, 55, 269. [Google Scholar] [CrossRef] [PubMed] [Green Version]
- Dzobo, K.; Senthebane, D.A.; Rowe, A.; Thomford, N.E.; Mwapagha, L.; Al-Awwad, N.; Dandara, C.; Parker, M.I. Cancer Stem Cell Hypothesis for Therapeutic Innovation in Clinical Oncology? Taking the Root Out, Not Chopping the Leaf. Omics J. Integr. Biol. 2016, 20, 681–691. [Google Scholar] [CrossRef]
- Gollapalli, K.; Ghantasala, S.; Atak, A.; Rapole, S.; Moiyadi, A.; Epari, S.; Srivastava, S. Tissue Proteome Analysis of Different Grades of Human Gliomas Provides Major Cues for Glioma Pathogenesis. Omics J. Integr. Biol. 2017, 21, 275–284. [Google Scholar] [CrossRef] [PubMed]
- Gov, E.; Kori, M.; Arga, K.Y. Multiomics Analysis of Tumor Microenvironment Reveals Gata2 and miRNA-124-3p as Potential Novel Biomarkers in Ovarian Cancer. Omics J. Integr. Biol. 2017, 21, 603–615. [Google Scholar] [CrossRef] [PubMed]
- Hu, M.; Qian, C.; Hu, Z.; Fei, B.; Zhou, H. Biomarkers in tumor microenvironment? Upregulation of fibroblast activation protein-α correlates with gastric cancer progression and poor prognosis. Omics J. Integr. Biol. 2017, 21, 38–44. [Google Scholar] [CrossRef]
- Miskolczi, Z.; Smith, M.P.; Rowling, E.J.; Ferguson, J.; Barriuso, J.; Wellbrock, C. Collagen abundance controls melanoma phenotypes through lineage-specific microenvironment sensing. Oncogene 2018, 37, 3166–3182. [Google Scholar] [CrossRef] [Green Version]
- Sevimoglu, T.; Arga, K.Y. The role of protein interaction networks in systems biomedicine. Comput. Struct. Biotechnol. J. 2014, 11, 22–27. [Google Scholar] [CrossRef] [Green Version]
- Ni, Z.; Wang, X.; Zhang, T.; Li, L.; Li, J. Comprehensive analysis of differential expression profiles reveals potential biomarkers associated with the cell cycle and regulated by p53 in human small cell lung cancer. Exp. Ther. Med. 2018, 15, 3273–3782. [Google Scholar] [CrossRef] [Green Version]
- Shi, Y.-X.; Zhu, T.; Zou, T.; Zhuo, W.; Chen, Y.-X.; Huang, M.-S.; Zheng, W.; Wang, C.-J.; Li, X.; Mao, X.-Y.; et al. Prognostic and predictive values of CDK1 and MAD2L1 in lung adenocarcinoma. Oncotarget 2016, 7, 85235–85243. [Google Scholar] [CrossRef] [Green Version]
- Bethune, G.; Bethune, D.; Ridgway, N.; Xu, Z. Epidermal growth factor receptor (EGFR) in lung cancer: An overview and update. J. Thorac. Dis. 2010, 2, 48–51. [Google Scholar] [PubMed]
- Sousa, A.; Silveira, C.; Janeiro, A.; Malveiro, S.; Oliveira, A.R.; Felizardo, M.; Nogueira, F.; Teixeira, E.; Martins, J.; Carmo-Fonseca, M. Detection of rare and novel EGFR mutations in NSCLC patients: Implications for treatment-decision. Lung Cancer 2020, 139, 35–40. [Google Scholar] [CrossRef] [PubMed]
- Tang, Y.; Geng, Y.; Luo, J.; Shen, W.; Zhu, W.; Meng, C.; Li, M.; Zhou, X.; Zhang, S.; Cao, J. Downregulation of ubiquitin inhibits the proliferation and radioresistance of non-small cell lung cancer cells in vitro and in vivo. Sci. Rep. 2015, 5, 9476. [Google Scholar] [CrossRef] [PubMed] [Green Version]
- Zou, Y.; Jing, L. Identification of key modules and prognostic markers in adrenocortical carcinoma by weighted gene co-expression network analysis. Oncol. Lett. 2019, 18, 3673–3681. [Google Scholar] [CrossRef] [PubMed] [Green Version]
- Mohammed, A.; Abdulhadi, S. Evaluation of the Concentration of Ubiquitin C Protein (UBC) in Patients of Lung Cancer and Comparing with Healthy Subjects. Eng. Technol. J. 2020, 38, 61–65. [Google Scholar] [CrossRef]
- Hao, S.; Li, S.; Wang, J.; Zhao, L.; Yan, Y.; Cao, Q.; Wu, T.; Liu, L.; Wang, C. Transcriptome analysis of phycocyanin-mediated inhibitory functions on non-small cell lung cancer A549 cell growth. Mar. Drugs 2018, 16, 511. [Google Scholar] [CrossRef] [Green Version]
- Wen, P.; Chidanguro, T.; Shi, Z.; Gu, H.; Wang, N.; Wang, T.; Li, Y.; Gao, J. Identification of candidate biomarkers and pathways associated with SCLC by bioinformatics analysis. Mol. Med. Rep. 2018, 18, 1538–1550. [Google Scholar] [CrossRef] [Green Version]
- Chinnappan, J.; Ramu, A.; Vidhya Rajalakshmi, V.; Akil Kavya, S. Integrative Bioinformatics approaches to therapeutic gene target selection in various cancers for Nitroglycerin. Sci. Rep. 2021, 11, 22036. [Google Scholar] [CrossRef]
- Yang, Z.; Jiang, S.; Cheng, Y.; Li, T.; Hu, W.; Ma, Z.; Chen, F.; Yang, Y. FOXC1 in cancer development and therapy: Deciphering its emerging and divergent roles. Ther. Adv. Med. Oncol. 2017, 9, 797–816. [Google Scholar] [CrossRef]
- Tessema, M.; Yingling, C.M.; Snider, A.M.; Do, K.; Juri, D.E.; Picchi, M.A.; Zhang, X.; Liu, Y.; Leng, S.; Tellez, C.S.; et al. GATA2 is epigenetically repressed in human and mouse lung tumors and is not requisite for survival of KRAS mutant lung cancer. J. Thorac. Oncol. 2014, 9, 784–793. [Google Scholar] [CrossRef] [Green Version]
- Yu, S.; Jiang, X.; Li, J.; Li, C.; Guo, M.; Ye, F.; Zhang, M.; Jiao, Y.; Guo, B. Comprehensive analysis of the GATA transcription factor gene family in breast carcinoma using gene microarrays, online databases and integrated bioinformatics. Sci. Rep. 2019, 9, 4467. [Google Scholar] [CrossRef] [PubMed]
- Huang, T.; Wang, G.; Yang, L.; Peng, B.; Wen, Y.; Ding, G.; Wang, Z. Transcription Factor YY1 Modulates Lung Cancer Progression by Activating lncRNA-PVT1. DNA Cell Biol. 2017, 36, 947–958. [Google Scholar] [CrossRef] [PubMed]
- Miyamoto, K.; Seki, N.; Matsushita, R.; Yonemori, M.; Yoshino, H.; Nakagawa, M.; Enokida, H. Tumour-suppressive miRNA-26a-5p and miR-26b-5p inhibit cell aggressiveness by regulating PLOD2 in bladder cancer. Br. J. Cancer 2016, 115, 354–363. [Google Scholar] [CrossRef] [Green Version]
- Wu, K.L.; Tsai, Y.M.; Lien, C.T.; Kuo, P.L.; Hung, J.Y. The roles of microRNA in lung cancer. Int. J. Mol. Sci. 2019, 20, 1611. [Google Scholar] [CrossRef] [PubMed] [Green Version]
- Fan, L.; Sha, J.; Teng, J.; Li, D.; Wang, C.; Xia, Q.; Chen, H.; Su, B.; Qi, H. Evaluation of Serum Paired MicroRNA Ratios for Differential Diagnosis of Non-Small Cell Lung Cancer and Benign Pulmonary Diseases. Mol. Diagn. Ther. 2018, 22, 493–502. [Google Scholar] [CrossRef]
- Sanfiorenzo, C.; Ilie, M.I.; Belaid, A.; Barlési, F.; Mouroux, J.; Marquette, C.-H.; Brest, P.; Hofman, P. Two Panels of Plasma MicroRNAs as Non-Invasive Biomarkers for Prediction of Recurrence in Resectable NSCLC. PLoS ONE. 2013, 8, e54596. [Google Scholar] [CrossRef] [Green Version]
- Pasculli, B.; Barbano, R.; Fontana, A.; Biagini, T.; Di Viesti, M.P.; Rendina, M.; Valori, V.M.; Morritti, M.; Bravaccini, S.; Ravaioli, S.; et al. Hsa-miR-155-5p Up-Regulation in Breast Cancer and Its Relevance for Treatment with Poly[ADP-Ribose] Polymerase 1 (PARP-1) Inhibitors. Front. Oncol. 2020, 10, 1415. [Google Scholar] [CrossRef]


| Hub Protein’s Name | Number of Amino Acids | Molecular Weight (kda) | Theoretical pI | Number of Negatively Charged Residues (Asp + Glu) | Number of Positively Charged Residues (Arg + Lys) | * Extinction Coefficient | Instability Index | Aliphatic Index | Grand Average of Hydropathicity (GRAVY) |
|---|---|---|---|---|---|---|---|---|---|
| CDK1 | 297 | 34,095.45 | 8.38 | 37 | 39 | 42,860 | 39.26 | 97.78 | −0.281 |
| EGFR | 1210 | 134,277.4 | 6.26 | 138 | 126 | 128,890 | 44.59 | 80.74 | −0.316 |
| FYN | 537 | 60,761.9 | 6.23 | 68 | 63 | 94,240 | 36.41 | 75.36 | −0.489 |
| UBC | 158 | 18,006.82 | 8.87 | 18 | 22 | 29,700 | 45.78 | 72.91 | −0.533 |
| MYC | 439 | 48,804.08 | 5.33 | 64 | 51 | 29,505 | 92.23 | 66.42 | −0.772 |
| CCNB1 | 433 | 48,337.43 | 7.09 | 52 | 52 | 30,620 | 50.59 | 90.09 | −0.239 |
| FOS | 380 | 40,695.41 | 4.77 | 51 | 33 | 21,930 | 78.82 | 65.32 | −0.369 |
| RHOB | 196 | 22,123.39 | 5.1 | 32 | 26 | 21,930 | 46.35 | 87.96 | −0.26 |
| CDC6 | 560 | 62,720.28 | 9.64 | 58 | 91 | 20,940 | 48.57 | 94.89 | −0.383 |
| CDC20 | 499 | 54,722.59 | 9.33 | 42 | 54 | 106,255 | 47.72 | 76.31 | −0.483 |
| CHEK1 | 476 | 54,433.57 | 8.5 | 61 | 66 | 76,485 | 42.26 | 84.75 | −0.459 |
| Upregulated Genes | ||||
| GO Term | Number of Genes | Coverage (%) | p-Value | |
| GOTERM_BP_DIRECT | ||||
| GO:0001525 angiogenesis | 40 | 4.27 | 1.77 × 10⁻¹² | |
| GO:0007155 cell adhesion | 59 | 6.3 | 1.28 × 10⁻¹¹ | |
| GO:0006954 inflammatory response | 50 | 5.3 | 2.33 × 10⁻¹⁰ | |
| GO:0007166 cell-surface receptor signaling pathway | 41 | 4.4 | 2.97 × 10⁻¹⁰ | |
| GO:0006955 immune response | 49 | 5.2 | 2.29 × 10⁻⁸ | |
| GO:0032496 response to lipopolysaccharide | 26 | 2.8 | 2.80 × 10⁻⁷ | |
| GO:0006935 chemotaxis | 22 | 2.3 | 3.17 × 10⁻⁷ | |
| GO:0007165 signal transduction | 94 | 10.0 | 5.91 × 10⁻⁷ | |
| GOTERM_CC_DIRECT | ||||
| GO:0005886 plasma membrane | 295 | 31.5 | 8.30 ×10⁻¹⁶ | |
| GO:0005576 extracellular region | 145 | 15.5 | 1.69 ×10⁻¹⁴ | |
| GO:0005615 extracellular space | 127 | 13.5 | 3.91× 10⁻¹⁴ | |
| GO:0045121 membrane raft | 34 | 3.6 | 6.18 × 10⁻¹⁰ | |
| GO:0070062 extracellular exosome | 185 | 19.7 | 9.29 × 10⁻⁷ | |
| GO:0009986 cell surface | 52 | 5.5 | 2.02 × 10⁻⁶ | |
| GO:0005925 focal adhesion | 41 | 4.4 | 3.45 × 10⁻⁶ | |
| GO:0016021 integral component of membrane | 297 | 31.7 | 2.91 × 10⁻⁵ | |
| GOTERM_MF_DIRECT | ||||
| GO:0008201 heparin binding | 29 | 3.1 | 1.15 × 10⁻⁹ | |
| GO:0030246 carbohydrate binding | 27 | 2.9 | 1.36 × 10⁻⁶ | |
| GO:0005178 integrin binding | 19 | 2.0 | 1.46 × 10⁻⁶ | |
| GO:0005509 calcium ion binding | 59 | 6.3 | 2.60 × 10⁻⁵ | |
| GO:0051015 actin filament binding | 19 | 2.0 | 3.86 × 10⁻⁵ | |
| GO:0004872 receptor activity | 25 | 2.7 | 7.30 × 10⁻⁵ | |
| GO:0005515 protein binding | 460 | 49.1 | 8.91 × 10⁻⁵ | |
| GO:0003779 actin binding | 28 | 3.0 | 2.41 × 10⁻⁴ | |
| Down Regulated Genes | ||||
| GO Term | Number of Genes | Coverage (%) | p-Value | |
| GOTERM_BP_DIRECT | ||||
| GO:0030574 | collagen catabolic process | 15 | 3.4 | 1.70 × 10⁻¹⁰ |
| GO:0007067 | mitotic nuclear division | 26 | 5.9 | 7.35 × 10⁻¹⁰ |
| GO:0051301 | cell division | 29 | 6.5 | 1.30 × 10⁻⁸ |
| GO:0007062 | sister chromatid cohesion | 14 | 3.2 | 7.36 × 10⁻⁷ |
| GO:0030198 | extracellular matrix organization | 19 | 4.3 | 7.37 × 10⁻⁷ |
| GO:0000082 | G1/S transition of mitotic cell cycle | 13 | 3.0 | 4.17 × 10⁻⁶ |
| GO:0030199 | collagen fibril organization | 8 | 1.8 | 2.75 × 10⁻⁵ |
| GO:0001649 | osteoblast differentiation | 12 | 2.7 | 2.90 × 10⁻⁵ |
| GO:0000281 | mitotic cytokinesis | 7 | 1.6 | 4.50 × 10⁻⁵ |
| GO:0006508 | proteolysis | 27 | 6.1 | 1.12 × 10⁻⁴ |
| GOTERM_CC_DIRECT | ||||
| GO:0005615 | extracellular space | 63 | 14.2 | 5.08 × 10⁻⁸ |
| GO:0070062 | extracellular exosome | 101 | 22.8 | 1.18 × 10⁻⁶ |
| GO:0005578 | proteinaceous extracellular matrix | 21 | 4.7 | 3.05 × 10⁻⁶ |
| GO:0000777 | condensed chromosome kinetochore | 12 | 2.7 | 3.95 × 10⁻⁶ |
| GO:0005581 | collagen trimer | 12 | 2.7 | 6.85 × 10⁻⁶ |
| GO:0030496 | midbody | 14 | 3.2 | 6.95 × 10⁻⁶ |
| GO:0005576 | extracellular region | 64 | 14.4 | 1.01 × 10⁻⁵ |
| GO:0005819 | spindle | 12 | 2.7 | 9.10 × 10⁻⁵ |
| GOTERM_MF_DIRECT | ||||
| GO:0004222 | metalloendopeptidase activity | 13 | 2.9 | 7.55 × 10⁻⁶ |
| GO:0004252 | serine-type endopeptidase activity | 19 | 4.3 | 1.56 × 10⁻⁵ |
| GO:0005201 | extracellular matrix structural constituent | 10 | 2.2 | 1.57 × 10⁻⁵ |
| GO:0042802 | identical protein binding | 32 | 7.2 | 6.18 × 10⁻⁴ |
| GO:0019901 | protein kinase binding | 19 | 4.3 | 0.0019 |
| GO:0005524 | ATP binding | 51 | 11.5 | 0.0021 |
| Target Proteins | Name of Drug | Mechanism of Action | Phase |
|---|---|---|---|
| CDK1 | aminopurvalanol-a | CDK inhibitor, tyrosine kinase inhibitor | Pre-clinical |
| BMS-265246 | CDK inhibitor | Pre-clinical | |
| CDK1-5-inhibitor | CDK inhibitor, glycogen synthase kinase inhibitor | Pre-clinical | |
| CGP-60474 | CDK inhibitor | Pre-clinical | |
| CGP-74514 | CDK inhibitor | Pre-clinical | |
| CHIR-99021 | glycogen synthase kinase inhibitor | Pre-clinical | |
| dinaciclib | CDK inhibitor | Phase 3 | |
| indirubin-3-monoxime | CDK inhibitor, glycogen synthase kinase inhibitor | Pre-clinical | |
| JNJ-7706621 | CDK inhibitor | Pre-clinical | |
| kenpaullone | CDK inhibitor, glycogen synthase kinase inhibitor | Pre-clinical | |
| olomoucine | CDK inhibitor | Pre-clinical | |
| PF-573228 | focal adhesion kinase inhibitor | Pre-clinical | |
| PHA-767491 | CDC inhibitor | Pre-clinical | |
| purvalanol-a | CDK inhibitor | Pre-clinical | |
| Ro-3306 | CDK inhibitor | Pre-clinical | |
| SU9516 | CDK inhibitor | Pre-clinical | |
| 1-azakenpaullone | glycogen synthase kinase inhibitor | Pre-clinical | |
| 8-hydroxy-DPAT | serotonin receptor agonist | Pre-clinical | |
| EGFR | afatinib | EGFR inhibitor | Launched |
| brigatinib | ALK tyrosine kinase receptor inhibitor, EGFR inhibitor | Launched | |
| erlotinib | EGFR inhibitor | Launched | |
| gefitinib | EGFR inhibitor | Launched | |
| icotinib | EGFR inhibitor | Launched | |
| lapatinib | EGFR inhibitor | Launched | |
| lidocaine | histamine receptor agonist | Launched | |
| olmutinib | EGFR inhibitor, Bruton’s tyrosine kinase (BTK) inhibitor | Launched | |
| osimertinib | EGFR inhibitor | Launched | |
| vandetanib | EGFR inhibitor, RET tyrosine kinase inhibitor, VEGFR inhibitor | Launched | |
| FYN | bosutinib | Abl kinase inhibitor, Bcr-Abl kinase inhibitor, src inhibitor | Launched |
| dasatinib | Bcr-Abl kinase inhibitor, ephrin inhibitor, KIT inhibitor, PDGFR tyrosine kinase receptor inhibitor, src inhibitor, tyrosine kinase inhibitor | Launched | |
| MYC | TWS-119 | glycogen synthase kinase inhibitor | Pre-clinical |
Publisher’s Note: MDPI stays neutral with regard to jurisdictional claims in published maps and institutional affiliations. |
© 2022 by the authors. Licensee MDPI, Basel, Switzerland. This article is an open access article distributed under the terms and conditions of the Creative Commons Attribution (CC BY) license (https://creativecommons.org/licenses/by/4.0/).
Share and Cite
Mosharaf, M.P.; Reza, M.S.; Gov, E.; Mahumud, R.A.; Mollah, M.N.H. Disclosing Potential Key Genes, Therapeutic Targets and Agents for Non-Small Cell Lung Cancer: Evidence from Integrative Bioinformatics Analysis. Vaccines 2022, 10, 771. https://0-doi-org.brum.beds.ac.uk/10.3390/vaccines10050771
Mosharaf MP, Reza MS, Gov E, Mahumud RA, Mollah MNH. Disclosing Potential Key Genes, Therapeutic Targets and Agents for Non-Small Cell Lung Cancer: Evidence from Integrative Bioinformatics Analysis. Vaccines. 2022; 10(5):771. https://0-doi-org.brum.beds.ac.uk/10.3390/vaccines10050771
Chicago/Turabian StyleMosharaf, Md. Parvez, Md. Selim Reza, Esra Gov, Rashidul Alam Mahumud, and Md. Nurul Haque Mollah. 2022. "Disclosing Potential Key Genes, Therapeutic Targets and Agents for Non-Small Cell Lung Cancer: Evidence from Integrative Bioinformatics Analysis" Vaccines 10, no. 5: 771. https://0-doi-org.brum.beds.ac.uk/10.3390/vaccines10050771