
Association of Transcriptomic Signatures of Inflammatory Response with Viral Control after Dendritic Cell-Based Therapeutic Vaccination in HIV-1 Infected Individuals
 ,
,  , , , , ,
Abstract
:1. Introduction
2. Materials and Methods
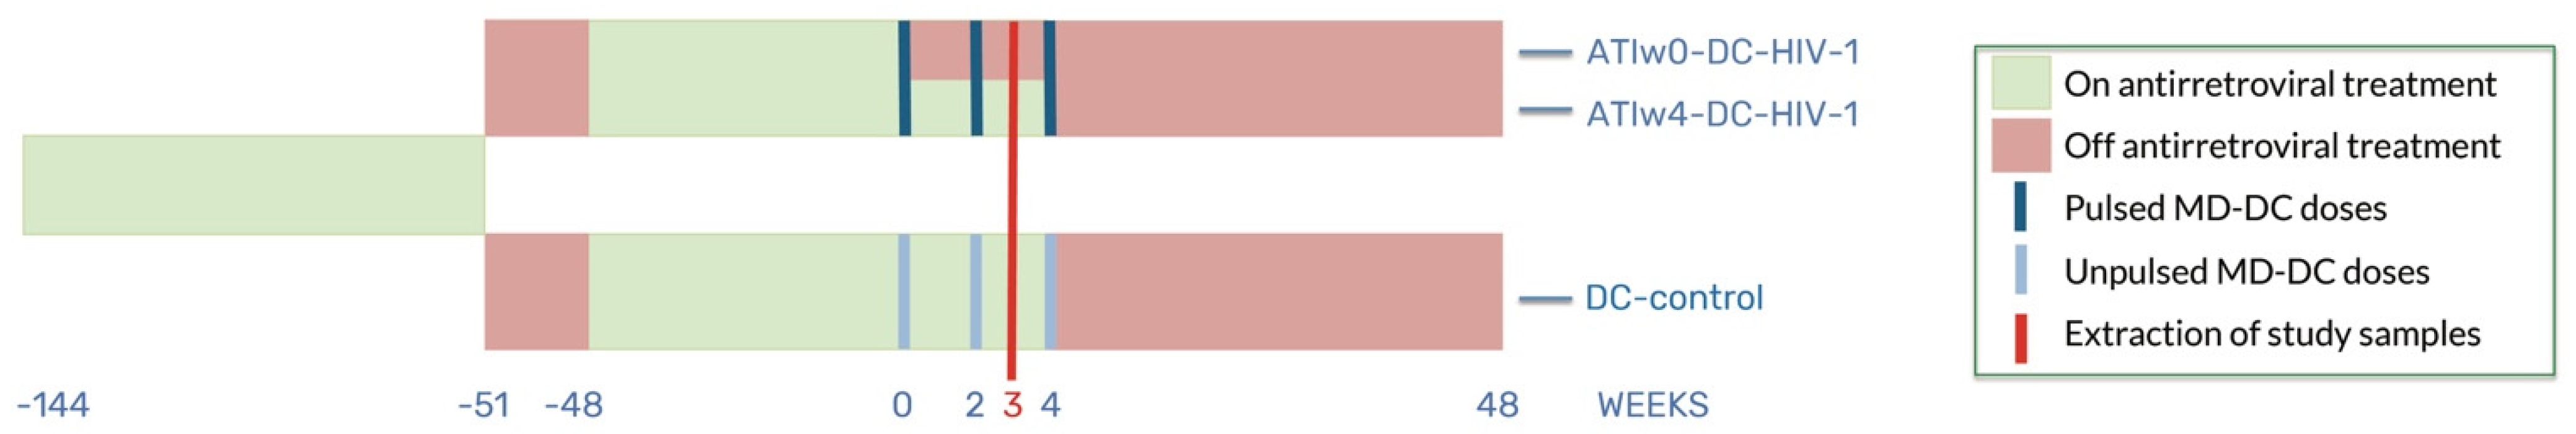
2.1. Study Subjects and Samples
2.2. mRNA Extraction, Quality Control, and Microarray Experiments
2.3. miRNA Extraction, Quality Control, and Microarray Experiments
2.4. Statistical Analysis
3. Results
3.1. Patients and Samples
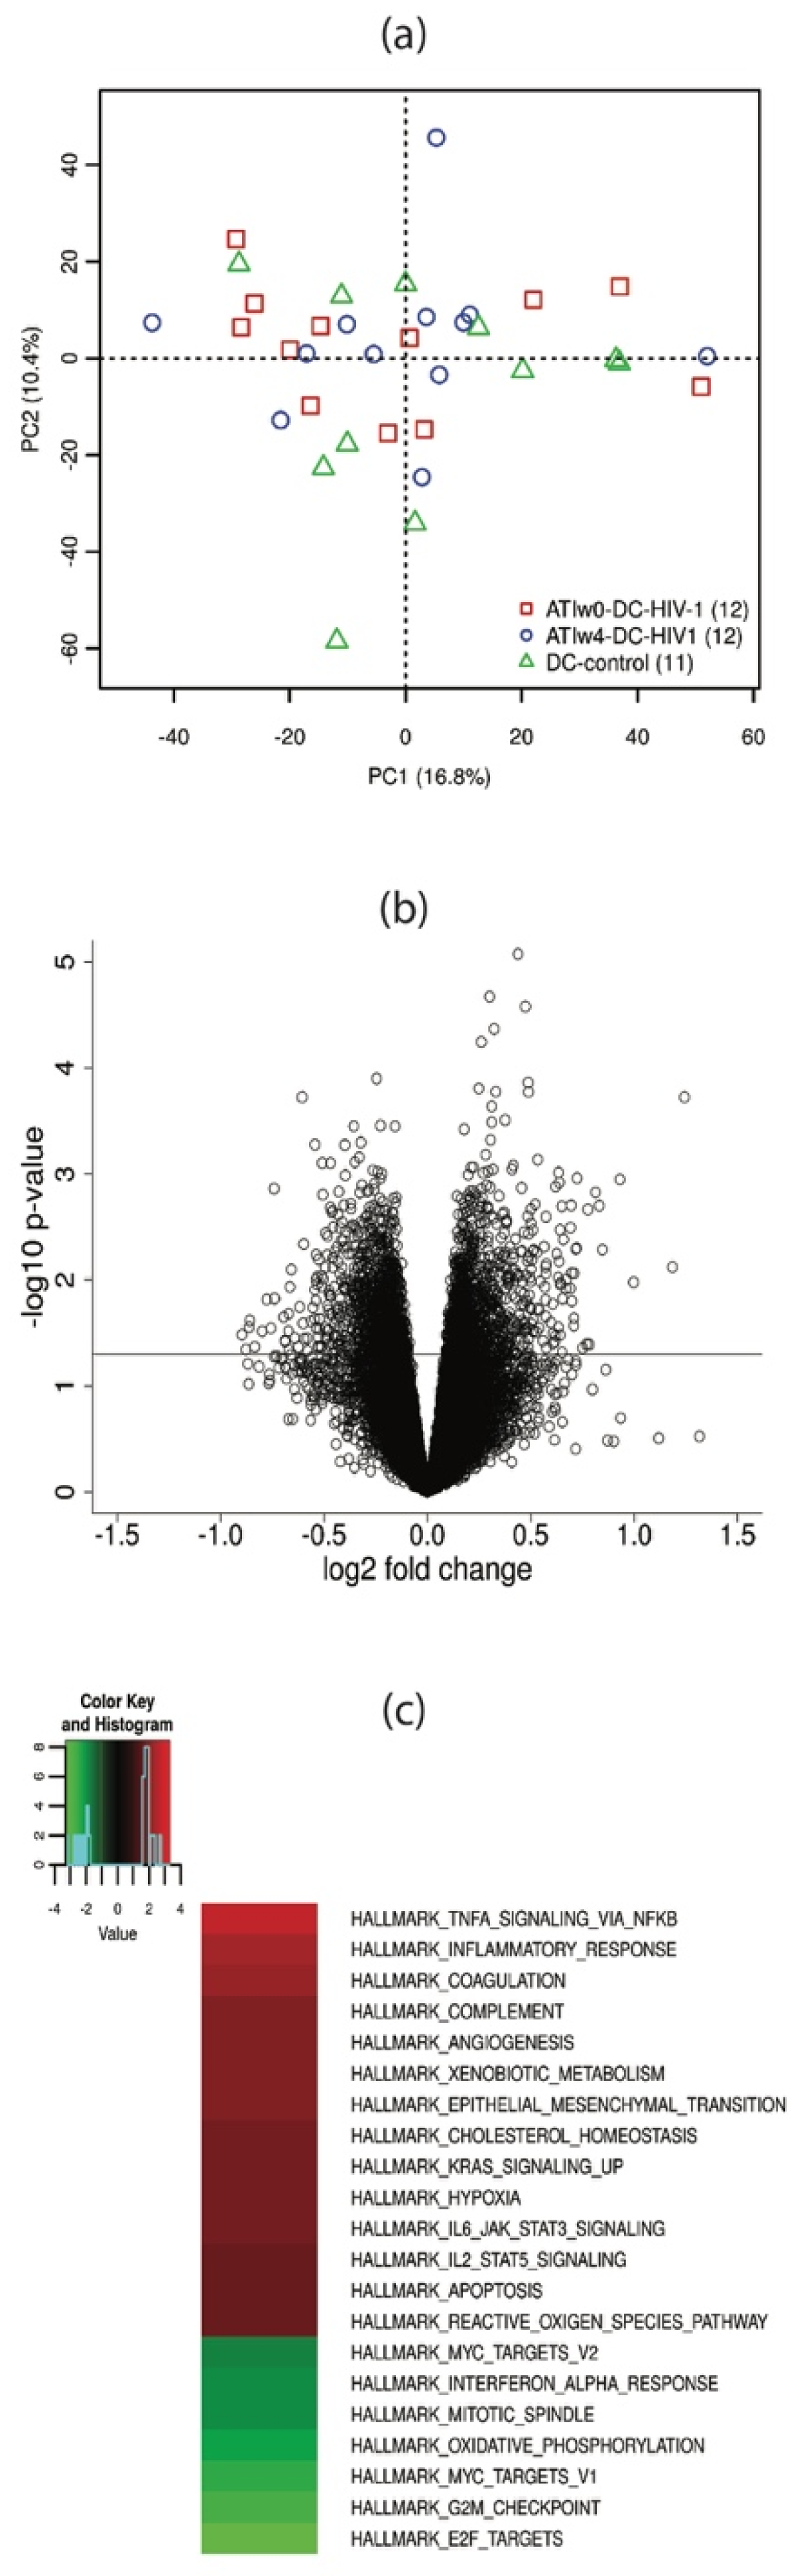
3.2. mRNA Analysis
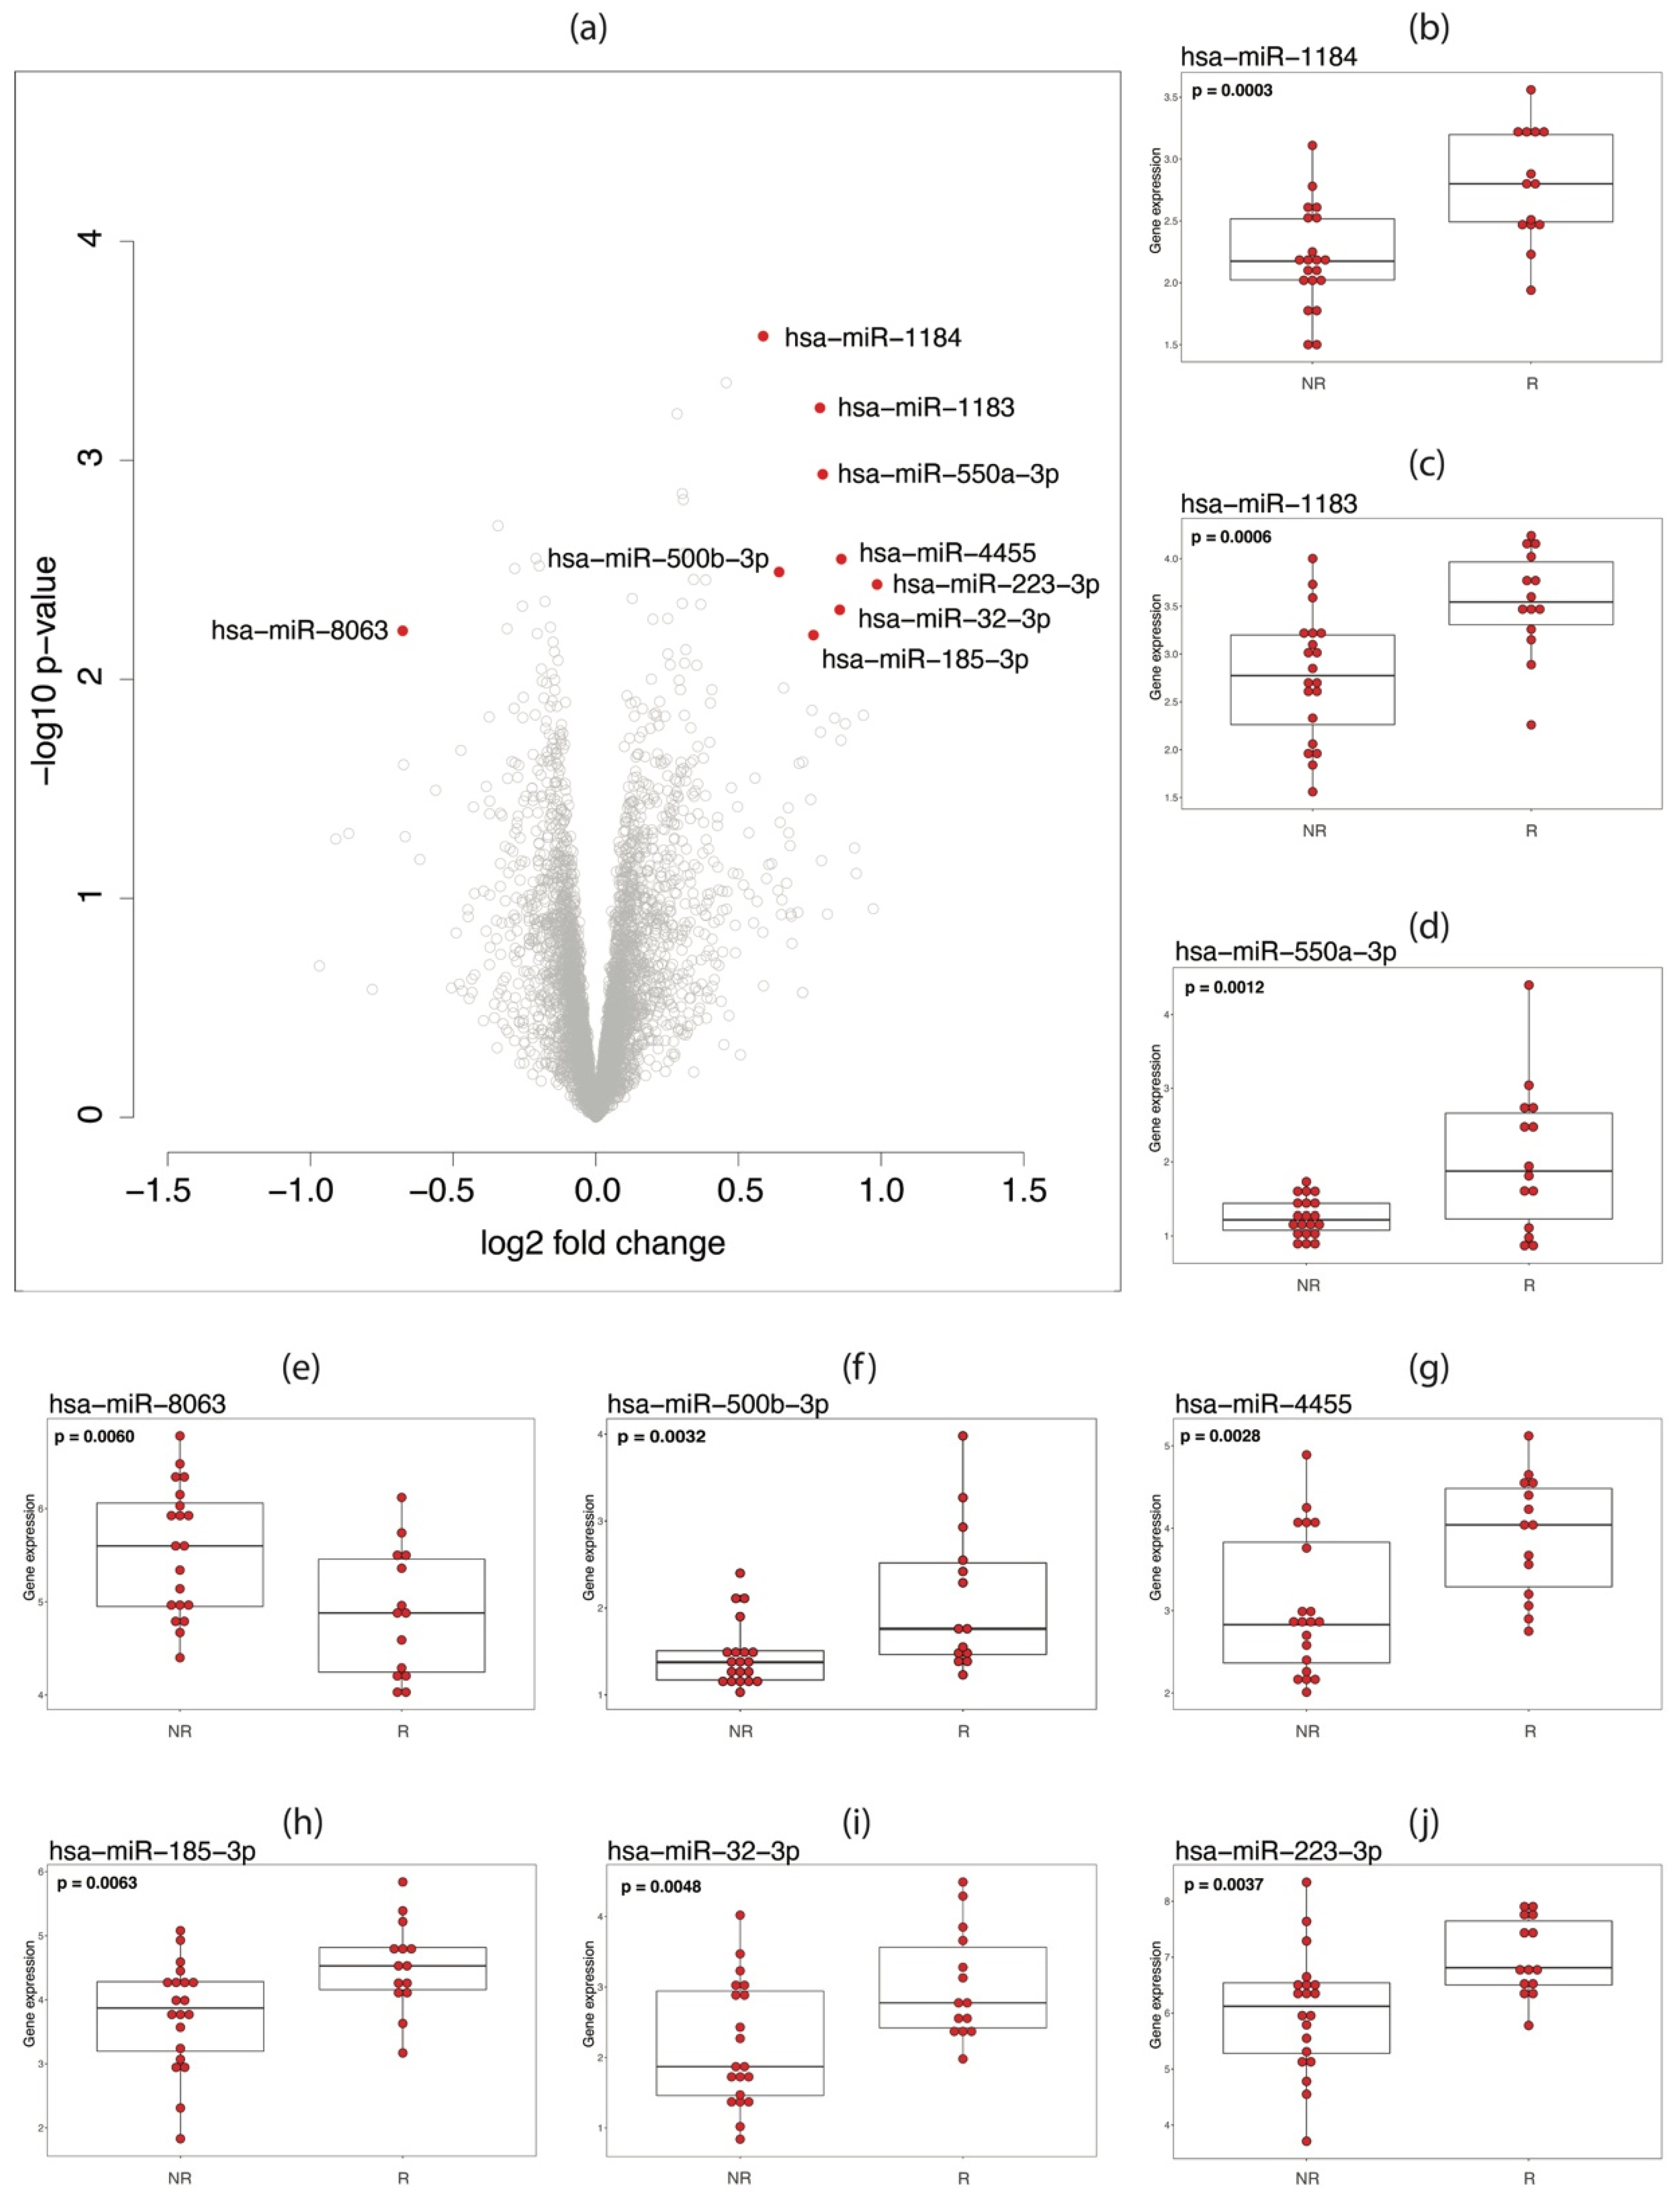
3.3. miRNA Analysis
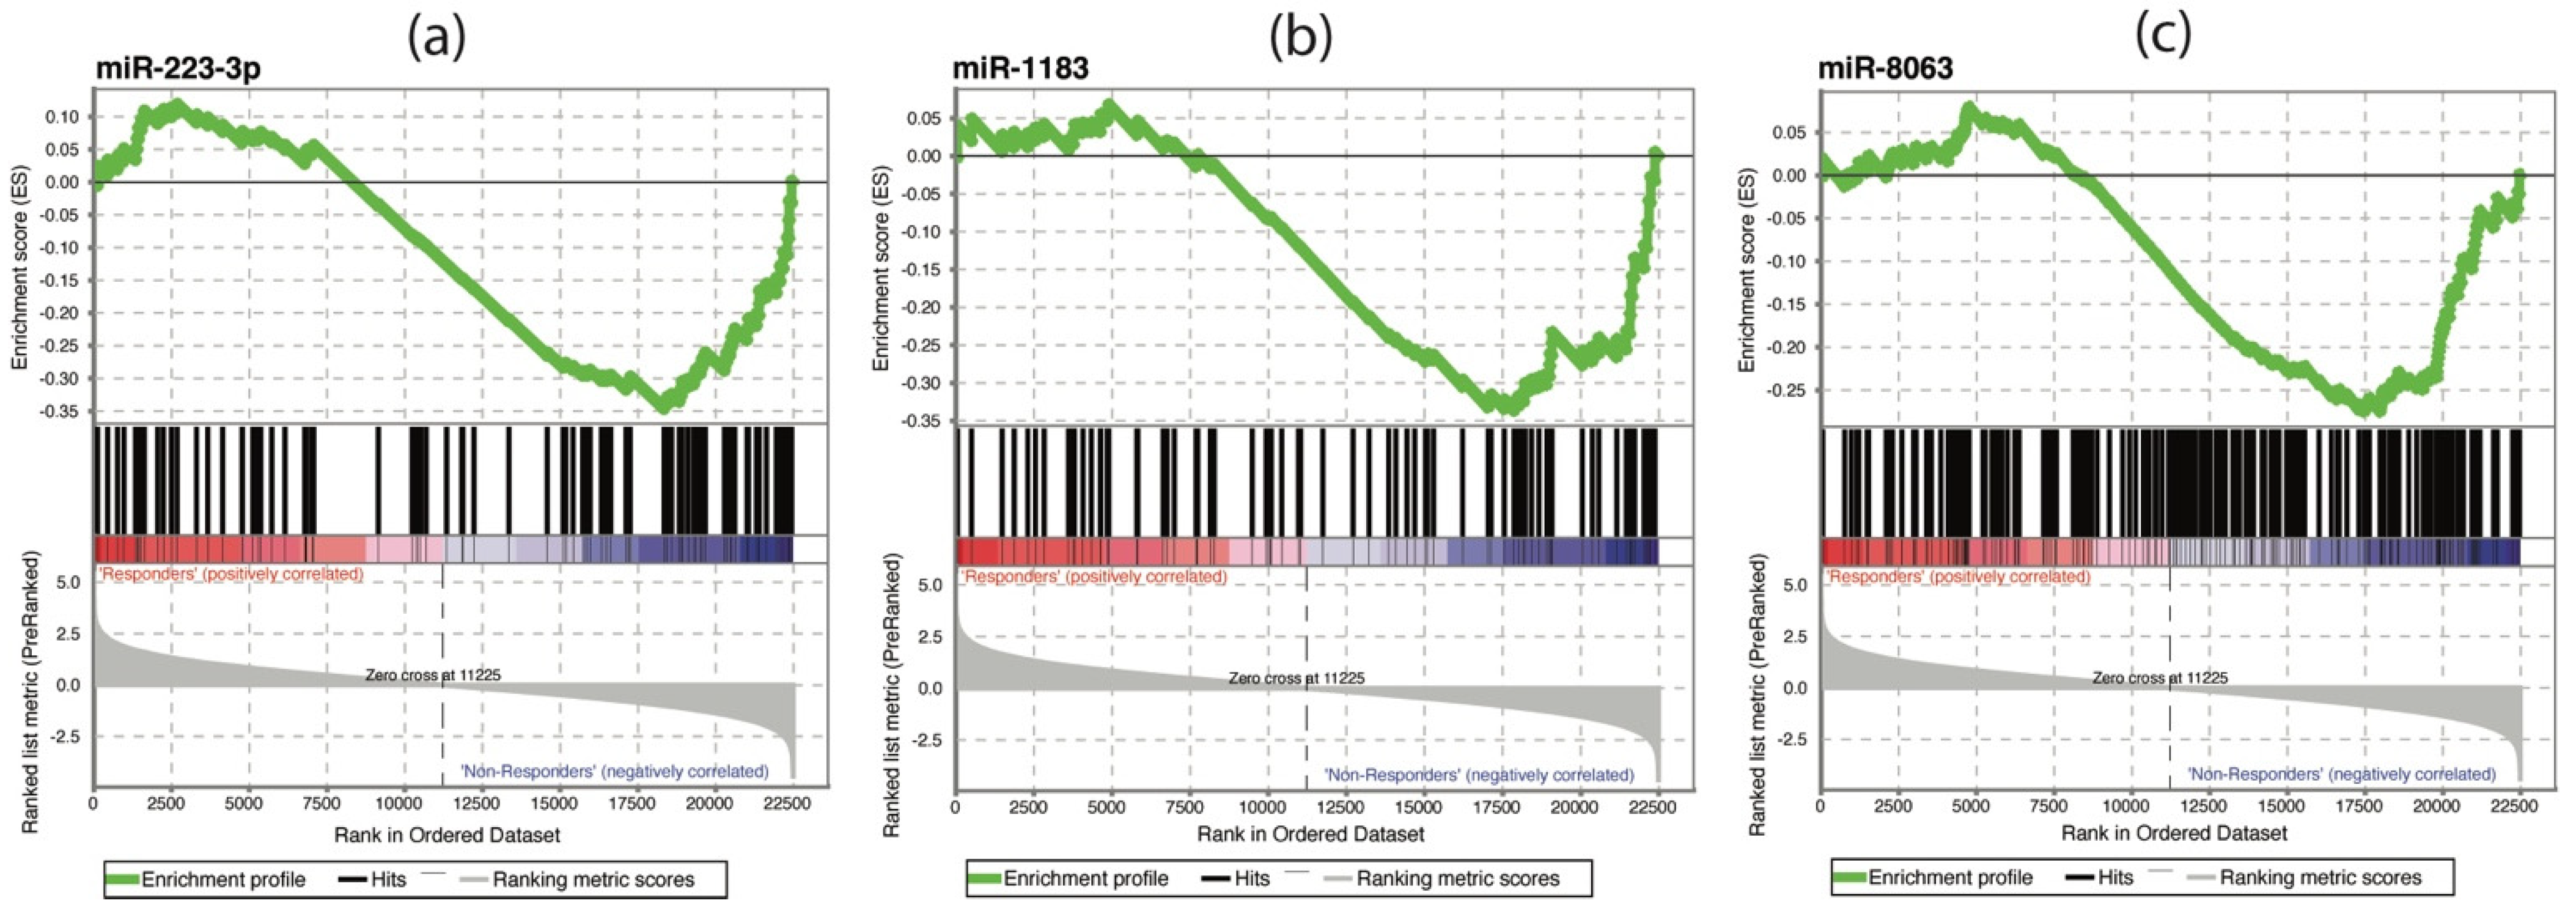
3.4. Combined mRNA—miRNA Analysis
4. Discussion
5. Conclusions
Supplementary Materials
Author Contributions
Funding
Institutional Review Board Statement
Informed Consent Statement
Data Availability Statement
Acknowledgments
Conflicts of Interest
References
- Leal, L.; Lucero, C.; Gatell, J.M.; Gallart, T.; Plana, M.; García, F. New challenges in therapeutic vaccines against HIV infection. Expert Rev. Vaccines 2017, 16, 587–600. [Google Scholar] [CrossRef] [PubMed]
- García, F.; Climent, N.; Guardo, A.C.; Gil, C.; León, A.; Autran, B.; Lifson, J.D.; Martínez-Picado, J.; Dalmau, J.; Clotet, B.; et al. A dendritic cell-based vaccine elicits T cell responses associated with control of HIV-1 replication. Sci. Transl. Med. 2013, 5, 166ra2. [Google Scholar] [CrossRef] [PubMed]
- Raeven, R.H.M.; van Riet, E.; Meiring, H.D.; Metz, B.; Kersten, G.F.A. Systems vaccinology and big data in the vaccine development chain. Immunology 2019, 156, 33–46. [Google Scholar] [CrossRef] [Green Version]
- Poland, G.A.; Ovsyannikova, I.G.; Kennedy, R.B. Personalized vaccinology: A review. Vaccine 2018, 36, 5350–5357. [Google Scholar] [CrossRef]
- Nakaya, H.I.; Wrammert, J.; Lee, E.K.; Racioppi, L.; Marie-Kunze, S.; Haining, W.N.; Means, A.R.; Kasturi, S.P.; Khan, N.; Li, G.M.; et al. Systems Biology of Seasonal Influenza Vaccination in Humans. Nat. Immunol. 2011, 12, 786–795. [Google Scholar] [CrossRef]
- Querec, T.D.; Akondy, R.S.; Lee, E.K.; Cao, W.; Nakaya, H.I.; Teuwen, D.; Pirani, A.; Gernert, K.; Deng, J.; Marzolf, B.; et al. Systems biology approach predicts immunogenicity of the yellow fever vaccine in humans. Nat. Immunol. 2009, 10, 116–125. [Google Scholar] [CrossRef] [Green Version]
- Fourati, S.; Cristescu, R.; Loboda, A.; Talla, A.; Filali, A.; Railkar, R.; Schaeffer, A.K.; Favre, D.; Gagnon, D.; Peretz, Y.; et al. Pre-vaccination inflammation and B-cell signalling predict age-related hyporesponse to hepatitis B vaccination. Nat. Commun. 2016, 7, 10369. [Google Scholar] [CrossRef]
- Huttner, A.; Combescure, C.; Grillet, S.; Haks, M.C.; Quinten, E. A dose-dependent plasma signature of the safety and immunogenicity of the rVSV-Ebola vaccine in Europe and Africa. Sci. Transl. Med. 2017, 9, eaaj1701. [Google Scholar] [CrossRef] [Green Version]
- de Goede, A.L.; Andeweg, A.C.; van den Ham, H.J.; Bijl, M.A.; Zaaraoui-Boutahar, F.; van IJcken, W.F.; Wilgenhof, S.; Aerts, J.L.; Gruters, R.A.; Osterhaus, A.D.; et al. DC immunotherapy in HIV-1 infection induces a major blood transcriptome shift. Vaccine 2015, 33, 2922–2929. [Google Scholar] [CrossRef] [PubMed]
- Costanzo, M.C.; Kim, D.; Creegan, M.; Lal, K.G.; Ake, J.A.; Currier, J.R.; Streeck, H.; Robb, M.L.; Michael, N.L.; Bolton, D.L.; et al. Transcriptomic signatures of NK cells suggest impaired responsiveness in HIV-1 infection and increased activity post-vaccination. Nat. Commun. 2018, 9, 1–16. [Google Scholar] [CrossRef] [PubMed] [Green Version]
- Thiébaut, R.; Hejblum, B.P.; Hocini, H.; Bonnabau, H.; Skinner, J.; Montes, M.; Lacabaratz, C.; Richert, L.; Palucka, K.; Banchereau, J.; et al. Gene Expression Signatures Associated with Immune and Virological Responses to Therapeutic Vaccination With Dendritic Cells in HIV-Infected Individuals. Front. Immunol. 2019, 10, 874. [Google Scholar] [CrossRef]
- Qi, Y.; Hu, H.; Guo, H.; Xu, P.; Shi, Z.; Huan, X.; Zhu, Z.; Zhou, M.; Cui, L. MicroRNA profiling in plasma of HIV-1 infected patients: Potential markers of infection and immune status. J. Public Health Emerg. 2017, 1, 65. [Google Scholar] [CrossRef]
- Biswas, S.; Haleyurgirisetty, M.; Lee, S.; Hewlett, I.; Devadas, K. Development and validation of plasma miRNA biomarker signature panel for the detection of early HIV-1 infection. EBioMedicine 2019, 43, 307–316. [Google Scholar] [CrossRef] [PubMed] [Green Version]
- Egaña-Gorroño, L.; Escribà, T.; Boulanger, N.; Guardo, A.C.; León, A.; Bargalló, M.E.; Garcia, F.; Gatell, J.M.; Plana, M.; Arnedo, M. HIV Controllers Consortium of the AIDS Spanish Network. Differential MicroRNA expression profile between stimulated PBMCs from HIV-1 infected elite controllers and viremic progressors. PLoS ONE 2014, 9, e106360. [Google Scholar] [CrossRef] [PubMed]
- Zhang, Z.N.; Xu, J.J.; Fu, Y.J.; Liu, J.; Jiang, Y.J.; Cui, H.L.; Zhao, B.; Sun, H.; He, Y.W.; Li, Q.J.; et al. Transcriptomic analysis of peripheral blood mononuclear cells in rapid progressors in early HIV infection identifies a signature closely correlated with disease progression. Clin. Chem. 2013, 59, 1175–1186. [Google Scholar] [CrossRef] [Green Version]
- Egaña-Gorroño, L.; Guardo, A.C.; Bargalló, M.E.; Planet, E.; Vilaplana, E.; Escribà, T.; Pérez, I.; Gatell, J.M.; Garcia, F.; Arnedo, M.; et al. MicroRNA profile in CD8+ T-lymphocytes from HIV-infected individuals: Relationship with antiviral immune response and disease progression. PLoS ONE 2016, 11, e0155245. [Google Scholar] [CrossRef] [PubMed]
- Dey, R.; Soni, K.; Saravanan, S.; Balakrishnan, P.; Kumar, V.; Boobalan, J.; Solomon, S.S.; Scaria, V.; Solomon, S.; Brahmachari, S.K.; et al. Anti-HIV microRNA expression in a novel Indian cohort. Sci. Rep. 2016, 6, 28279. [Google Scholar] [CrossRef] [Green Version]
- Munshi, S.U.; Panda, H.; Holla, P.; Rewari, B.B.; Jameel, S. MicroRNA-150 is a potential biomarker of HIV/AIDS disease progression and therapy. PLoS ONE 2014, 9, e95920. [Google Scholar] [CrossRef] [Green Version]
- Yahyaei, S.; Biasin, M.; Saulle, I.; Gnudi, F.; De Luca, M.; Tasca, K.I.; Trabattoni, D.; Lo Caputo, S.; Mazzotta, F.; Clerici, M. Identification of a Specific miRNA Profile in HIV-Exposed Seronegative Individuals. J. Acquir. Immune Defic. Syndr. 2016, 73, 11–19. [Google Scholar] [CrossRef] [Green Version]
- Eklund, A.C.; Szallasi, Z. Correction of technical bias in clinical microarray data improves concordance. Genome Biol. 2008, 9, R26. [Google Scholar] [CrossRef] [Green Version]
- Gentleman, R.C.; Carey, V.J.; Bates, D.M.; Bolstad, B.; Dettling, M.; Dudoit, S.; Ellis, B.; Gautier, L.; Ge, Y.; Gentry, J.; et al. Bioconductor: Open software development for computational biology and bioinformatics. Genome Biol. 2004, 5, R80. [Google Scholar] [CrossRef] [Green Version]
- Ritchie, M.E.; Phipson, B.; Wu, D.I.; Hu, Y.; Law, C.W.; Shi, W.; Smyth, G.K. Limma powers differential expression analyses for RNA-sequencing and microarray studies. Nucleic Acids Res. 2015, 43, e47. [Google Scholar] [CrossRef]
- Ru, Y.; Kechris, K.J.; Tabakoff, B.; Hoffman, P.; Radcliffe, R.A.; Bowler, R.; Mahaffey, S.; Rossi, S.; Calin, G.A.; Bemis, L.; et al. The multiMiR R package and database: Integration of microRNA-target interactions along with their disease and drug associations. Nucleic Acids Res. 2014, 42, e133. [Google Scholar] [CrossRef]
- da Conceicao, V.N.; Dyer, W.B.; Gandhi, K.; Gupta, P.; Saksena, N.K. Genome-wide analysis of primary peripheral blood mononuclear cells from HIV+ patients pre- and post- HAART show immune activation and inflammation the main drivers of host gene expression. Mol. Cell. Ther. 2014, 2, 11. [Google Scholar] [CrossRef] [Green Version]
- Massanella, M.; Singhania, A.; Beliakova-Bethell, N.; Pier, R.; Lada, S.M.; White, C.H.; Pérez-Santiago, J.; Blanco, J.; Richman, D.D.; Little, S.J.; et al. Differential Gene Expression in HIV-Infected Individuals Following ART. Antiviral Res. 2013, 100, 420–428. [Google Scholar] [CrossRef] [Green Version]
- Vahey, M.T.; Wang, Z.; Su, Z.; Nau, M.E.; Krambrink, A.; Skiest, D.J.; Margolis, D.M. CD4+ T-cell decline after the interruption of antiretroviral therapy in ACTG A5170 is predicted by differential expression of genes in the ras signaling pathway. AIDS Res. Hum. Retroviruses 2008, 24, 1047–1066. [Google Scholar] [CrossRef] [Green Version]
- Vasudevan, S.; Tong, Y.; Steitz, J.A. Switching from Repression to Activation: MicroRNAs Can Up-Regulate Translation. Science 2007, 318, 1931–1934. [Google Scholar] [CrossRef] [PubMed] [Green Version]
- Haneklaus, M.; Gerlic, M.; O’Neill LA, J.; Masters, S.L. MiR-223: Infection, inflammation and cancer. J. Intern. Med. 2013, 274, 215–226. [Google Scholar] [CrossRef] [PubMed]
- Aziz, F. The emerging role of miR-223 as novel potential diagnostic and therapeutic target for inflammatory disorders. Cell. Immunol. 2016, 303, 1–6. [Google Scholar] [CrossRef]
- Huang, J.; Wang, F.; Argyris, E.; Chen, K.; Liang, Z.; Tian, H.; Huang, W.; Squires, K.; Verlinghieri, G.; Zhang, H. Cellular microRNAs contribute to HIV-1 latency in resting primary CD4 + T lymphocytes. Nat. Med. 2007, 13, 1241–1247. [Google Scholar] [CrossRef] [PubMed]


Publisher’s Note: MDPI stays neutral with regard to jurisdictional claims in published maps and institutional affiliations. |
© 2021 by the authors. Licensee MDPI, Basel, Switzerland. This article is an open access article distributed under the terms and conditions of the Creative Commons Attribution (CC BY) license (https://creativecommons.org/licenses/by/4.0/).
Share and Cite
Fehér, C.; Pastor-lbáñez, R.; Leal, L.; Plana, M.; Arnedo, M.; van den Ham, H.-J.; Andeweg, A.C.; Gruters, R.A.; Díez-Fuertes, F.; Alcamí, J.; et al. Association of Transcriptomic Signatures of Inflammatory Response with Viral Control after Dendritic Cell-Based Therapeutic Vaccination in HIV-1 Infected Individuals. Vaccines 2021, 9, 799. https://0-doi-org.brum.beds.ac.uk/10.3390/vaccines9070799
Fehér C, Pastor-lbáñez R, Leal L, Plana M, Arnedo M, van den Ham H-J, Andeweg AC, Gruters RA, Díez-Fuertes F, Alcamí J, et al. Association of Transcriptomic Signatures of Inflammatory Response with Viral Control after Dendritic Cell-Based Therapeutic Vaccination in HIV-1 Infected Individuals. Vaccines. 2021; 9(7):799. https://0-doi-org.brum.beds.ac.uk/10.3390/vaccines9070799
Chicago/Turabian StyleFehér, Csaba, Roque Pastor-lbáñez, Lorna Leal, Montserrat Plana, Mireia Arnedo, Henk-Jan van den Ham, Arno C. Andeweg, Rob A. Gruters, Francisco Díez-Fuertes, José Alcamí, and et al. 2021. "Association of Transcriptomic Signatures of Inflammatory Response with Viral Control after Dendritic Cell-Based Therapeutic Vaccination in HIV-1 Infected Individuals" Vaccines 9, no. 7: 799. https://0-doi-org.brum.beds.ac.uk/10.3390/vaccines9070799