Article

Study on Friction in Automotive Shock Absorbers Part 2: Validation of Friction Simulations via Novel Single Friction Point Test Rigs

Automotive Engineering Group, Department of Mechanical Engineering TU Ilmenau, Ehrenbergstraße 15, 98693 Ilmenau, Germany
*
Author to whom correspondence should be addressed.
Submission received: 23 March 2021 / Revised: 23 April 2021 / Accepted: 11 May 2021 / Published: 13 May 2021
(This article belongs to the Special Issue Dynamics and Control of Automated Vehicles)

Abstract

:
The most important change in the transition from partial to high automation is that the vehicle can drive autonomously, without active human involvement. This fact increases the current requirements regarding ride comfort and dictates new challenges for automotive shock absorbers. There exist two common types of automotive shock absorbers with two friction types. The intended viscous friction dissipates the chassis’ vibrations, while the unwanted solid body friction is generated by the rubbing of the damper’s seals and guides during actuation. The latter so-called static friction impairs ride comfort and demands appropriate friction modeling for the control of adaptive or active suspension systems. In the current article, the simulation approach introduced in part 1 of this study is validated against a single friction point and full damper friction measurements. To achieve that, a friction measurement method with novel test rigs has been developed, which allows for reliable determination of the friction behavior of each single friction point, while appropriately resembling the operating conditions of the real damper. The subsequent presentation of a friction simulation using friction model parameters from different geometry shows the general applicability of the overall friction investigation methodology. Accordingly, the presented simulation and measurement approaches enable the investigation of dynamic friction in automotive shock absorbers with significantly increased development efficiency.

1. Introduction

Modern active and adaptive chassis setups enable manufacturers to achieve both a high comfort level and the potential for high driving dynamics, even on rough roads or fast-changing road conditions, and are relevant for automated driving [1]. The related chassis control algorithms require appropriate models to realistically describe the physical behavior of the contributing chassis components. In part 1 of this study, a simulation approach for modeling friction in automotive shock absorbers is introduced, aiming to contribute to the field of research into unwanted friction. A more detailed problem description as well as the state of research can also be found therein.
This article focuses on the validation of the simulation approach introduced in part 1 of this study. To achieve that, an appropriate experimental environment for single friction point measurements in automotive shock absorbers is required. Since common component-based friction measurement methods do not resemble the actual circumstances and operating conditions of the full shock absorber, novel single friction point test rigs have been designed and set up. These test rigs aim to record friction per single friction point as it occurs on the unit level, thus enabling the deep analysis of the influences on friction. This article presents:
  • the test rig concept and design implementation,
  • the validity of the measurement concept,
  • the validity of the simulation approach introduced in part 1 of this study by comparing full damper measurements with single friction point simulation,
  • investigations on friction model parameter transfer to varying geometry,
  • conclusions regarding the applicability of the simulation approach.

2. Reference Damper Introduction

The reference damper used for the test rig design and the subsequent investigations are the same as introduced in part 1 of this study. Accordingly, this section gives a brief summary of the second section of the aforementioned article. The reference shock absorber is a common series monotube damper intended for rear axle applications in compact cars. Its key dimensions are an 11 mm outer diameter rod and a 36 mm inner diameter tube. A partially simplified drawing is presented in Figure 1, showing an overview on the left, and magnified depictions on the right of the three single friction points: (A) rod guide assembly/rod, (B) piston/tube, and (C) floating piston/tube.
The rod guide assembly/rod friction point (A) separates the damper’s oil volume from the environment, mainly through the rubber oil seal (6) in contact with the rod (2), which is made from chrome-plated steel. The oil seal is supported by the static seal (7), another rubber part designed to transmit the damper’s inner static pressure to a mainly radial pre-tension force on the oil seal. The bronze-made bearing (3), coated with a friction-minimizing polytetrafluoroethylene (PTFE) layer, is located above the oil seal to support the lateral forces on the damper. The outer closing is the scraper (1) made from rubber, which prevents dirt from entering the rod guide assembly, and simultaneously ensures the lubrication of the bearing with oil that passed the oil seal or from an initial greasing. All parts of the rod guide assembly are mounted to the aluminum housing (4). The sealing against the tube (12) is ensured by a rubber O-ring (5), the fixation to the tube by a roll closing (series damper) or a screwed cap (take-apart damper), both not depicted in Figure 1 to maintain clarity.
The piston/tube friction point (B) prevents the oil from bypassing the piston’s bores and valve package (11) to ensure appropriate damping. It also acts as the second support for lateral forces applied to the damper. The piston seal is carried out as a PTFE band (10) mounted to the piston (9). Since the piston’s bores, together with the valve package, are generating a hydrodynamic damping force, which is overlaying the friction measurement, the valve package is generally not considered within this research.
The floating piston/tube friction point (C) seals the oil volume against the volume compensating and pressurized gas volume. This is achieved by a rubber O-ring (14), which is mounted to a glass-fiber-reinforced plastic floating piston (13) and seals against the tube (12). This pressure is transferred via the floating piston to the oil volume, thus creating a nominal operating pressure of 25 bar inside the damper.

3. Experimental Setup

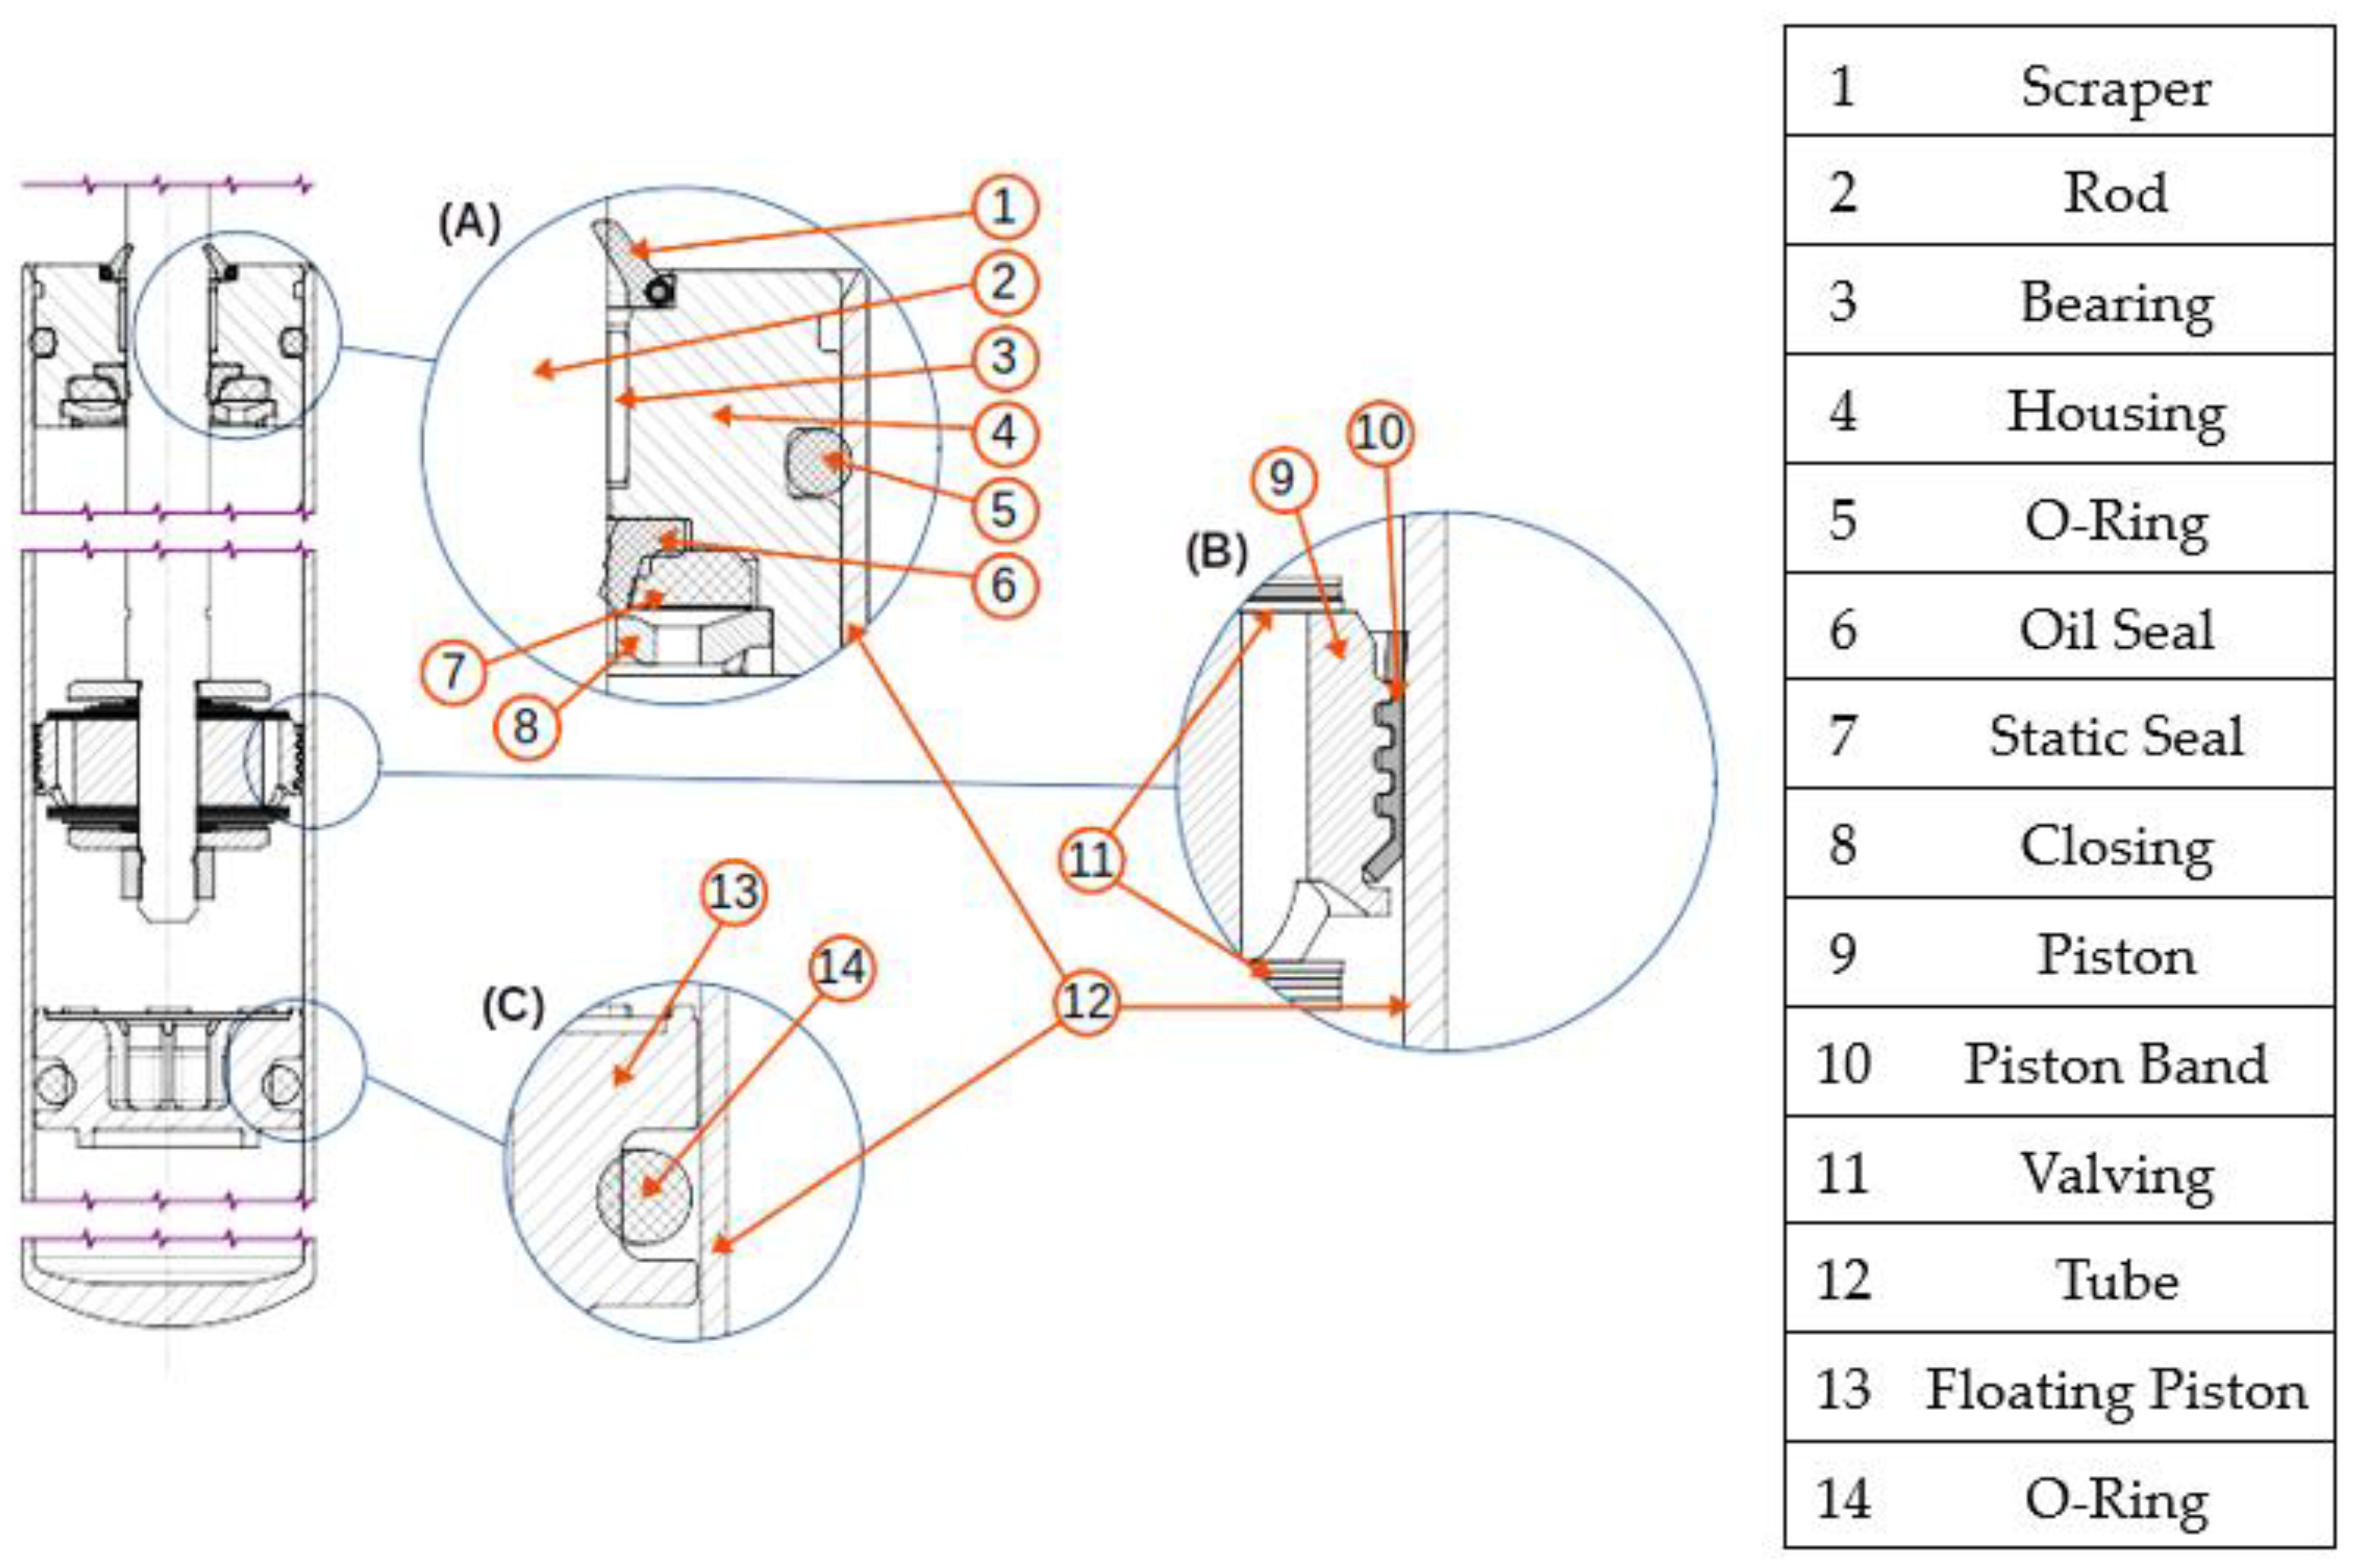
To determine the overall friction behavior of the reference damper, the respective contribution of each single friction point to the overall friction behavior has to be determined. To gather realistic data, probes and operating conditions during the related measurements have to resemble the real damper as closely as possible. Additionally, an easy exchangeability of all friction-related parts is important. Current damper friction measurement methods do not fulfill these necessary requirements because they focus on the whole damper without the possibility of separating each single friction point’s respective friction contribution. As a consequence, they are not suitable for the requirements of this work. Therefore, novel test rigs are developed, which allow the measurement and characterization of single friction points of the reference damper, namely, the rod guide assembly/rod friction point, the piston/tube friction point, and the floating piston/tube friction point.

3.1. Single Friction Point Test Rig 1–Rod Guide Assembly/Rod and Piston/Tube

The Single Friction Point Test Rig 1 (SFP1) is designed to enable the analysis of all directly actuated friction points of the reference damper. This test rig contains the working piston/tube friction point and the rod guide assembly/rod friction point (see Figure 1). From the above-mentioned global requirements, the following detailed requirements are derived.
  • Measurement of friction in the respective friction points under standard operation conditions (static operating pressure (typically 25 bar), degrees of freedom as in the original reference damper). This ensures comparability to overall damper friction measurements.
  • Measurement of friction at adjustable, stroke-independent pressure. This allows the investigation of static pressure-dependent friction behavior.
  • No outside influences on the friction-related probes. This also ensures comparability to overall damper friction measurements and leads to more realistic results.
  • Good accessibility/exchangeability of the related probes. This is necessary for appropriate and efficient probe handling.
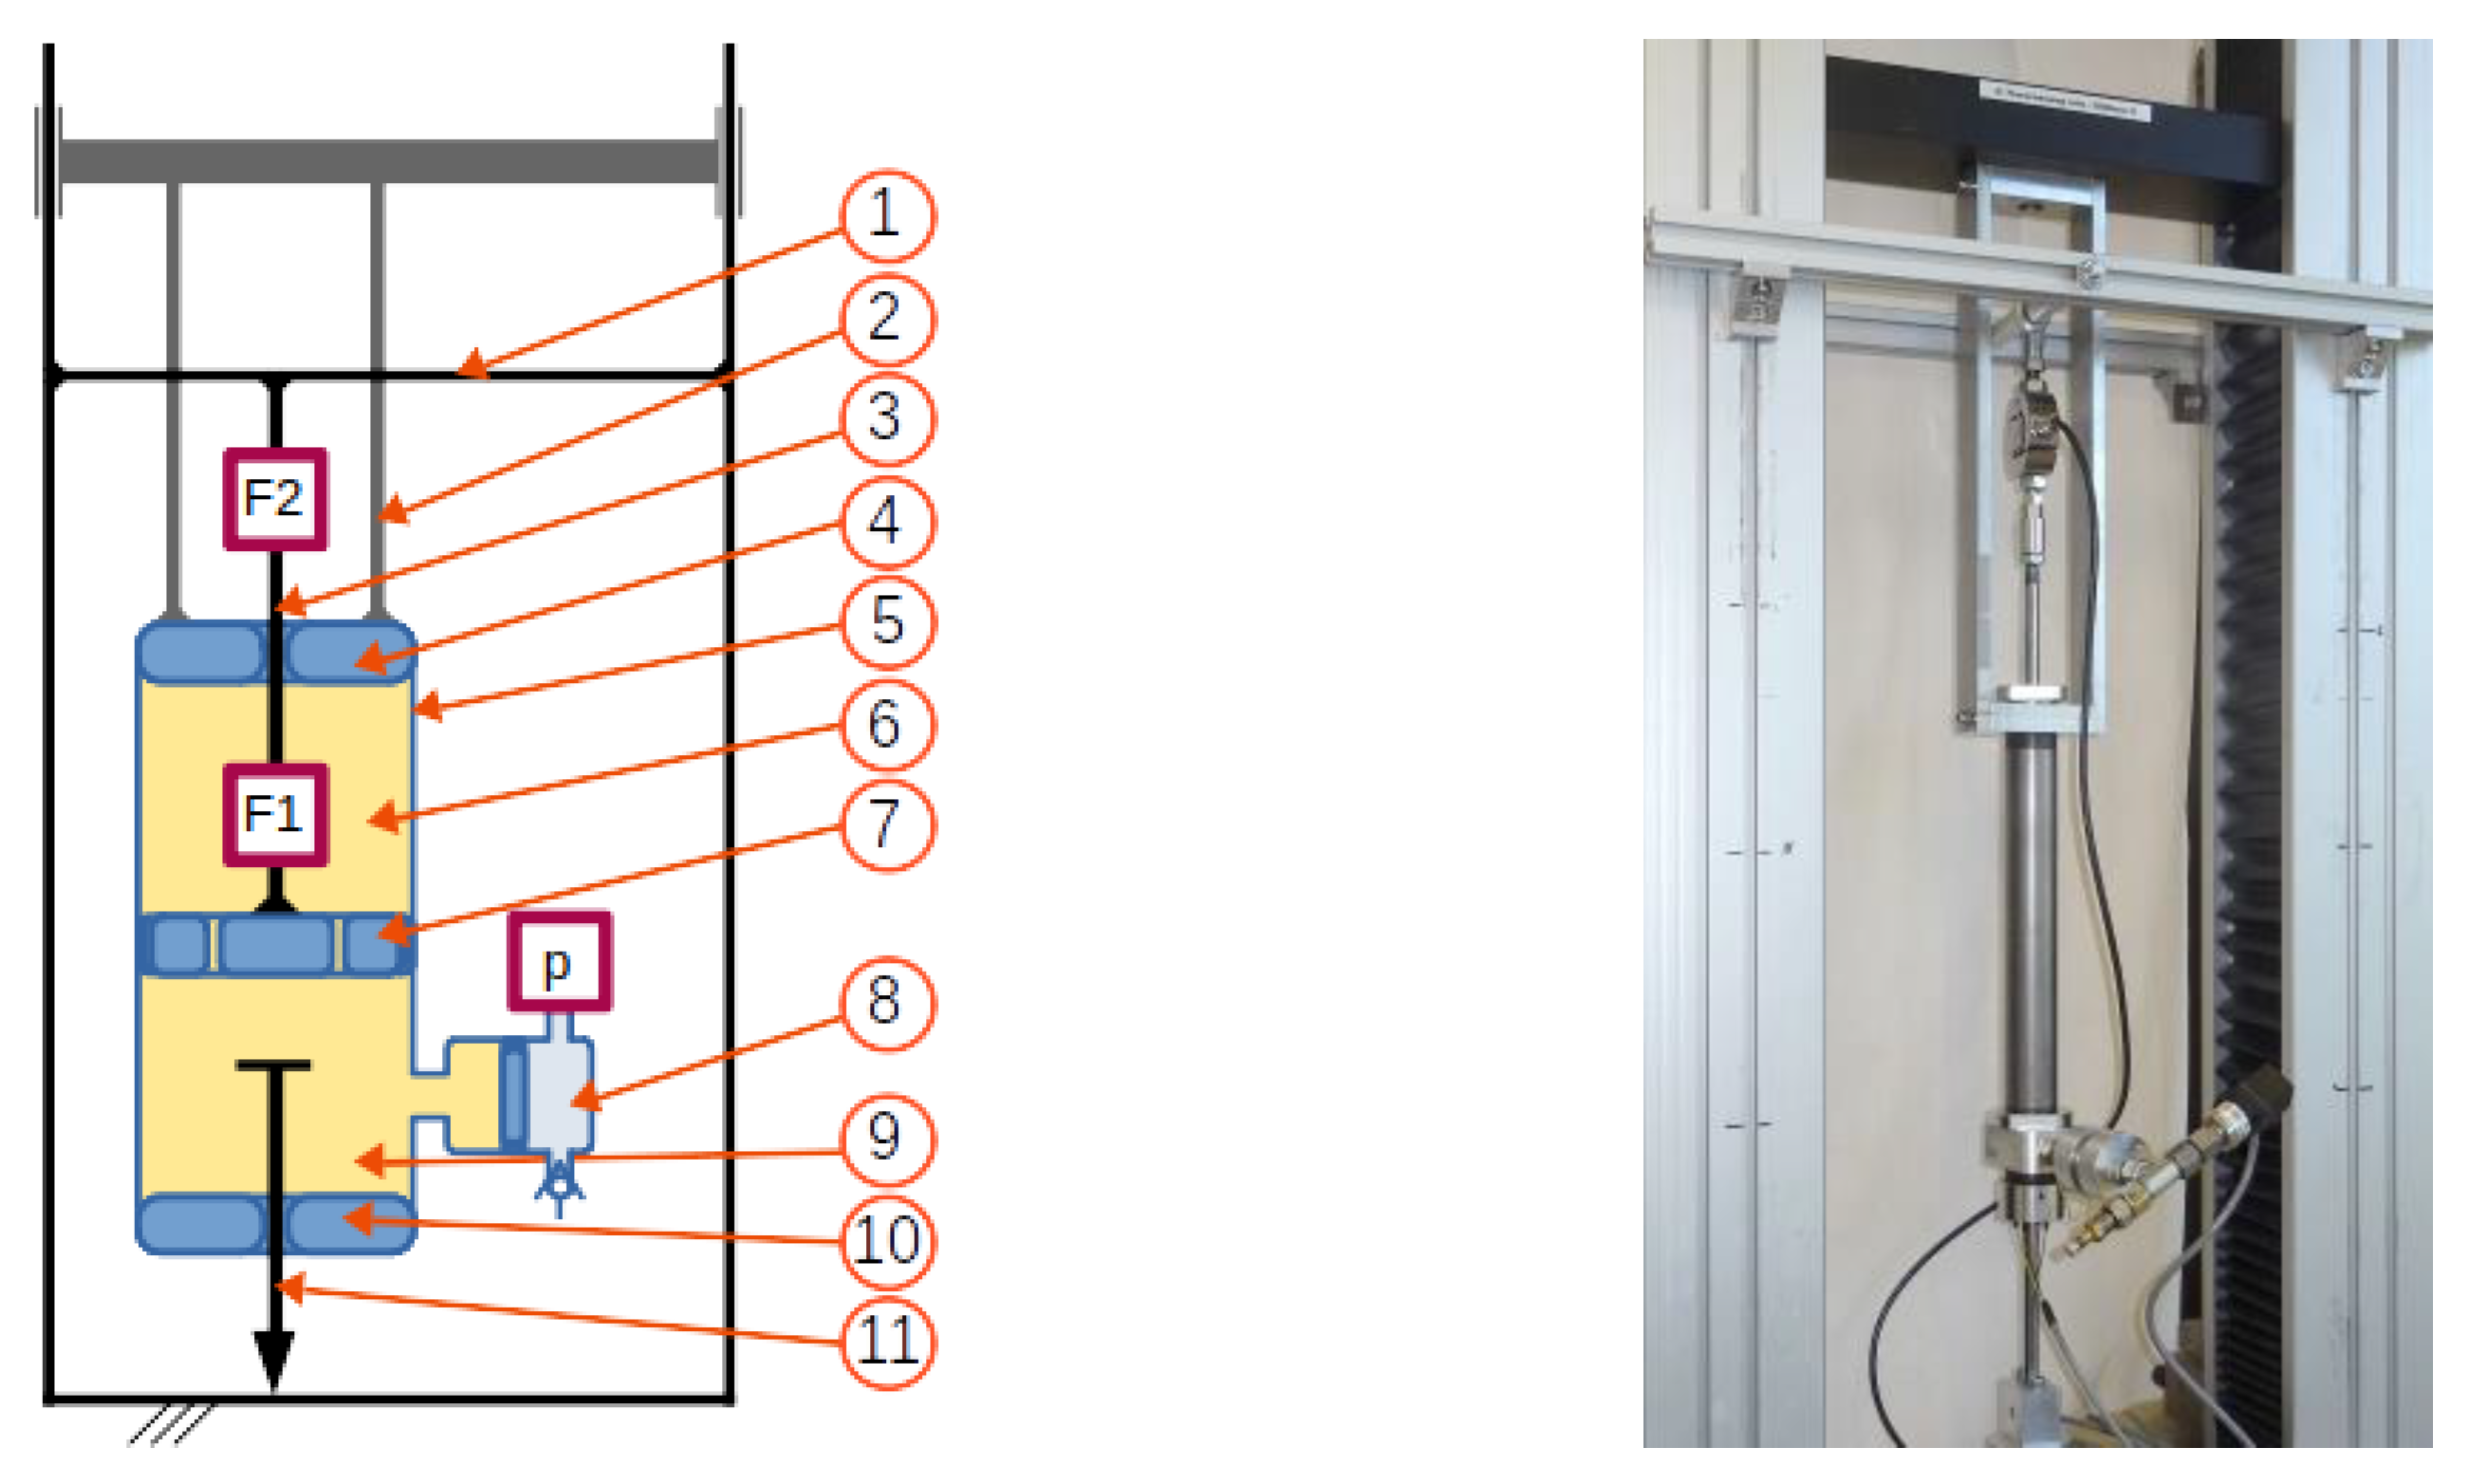
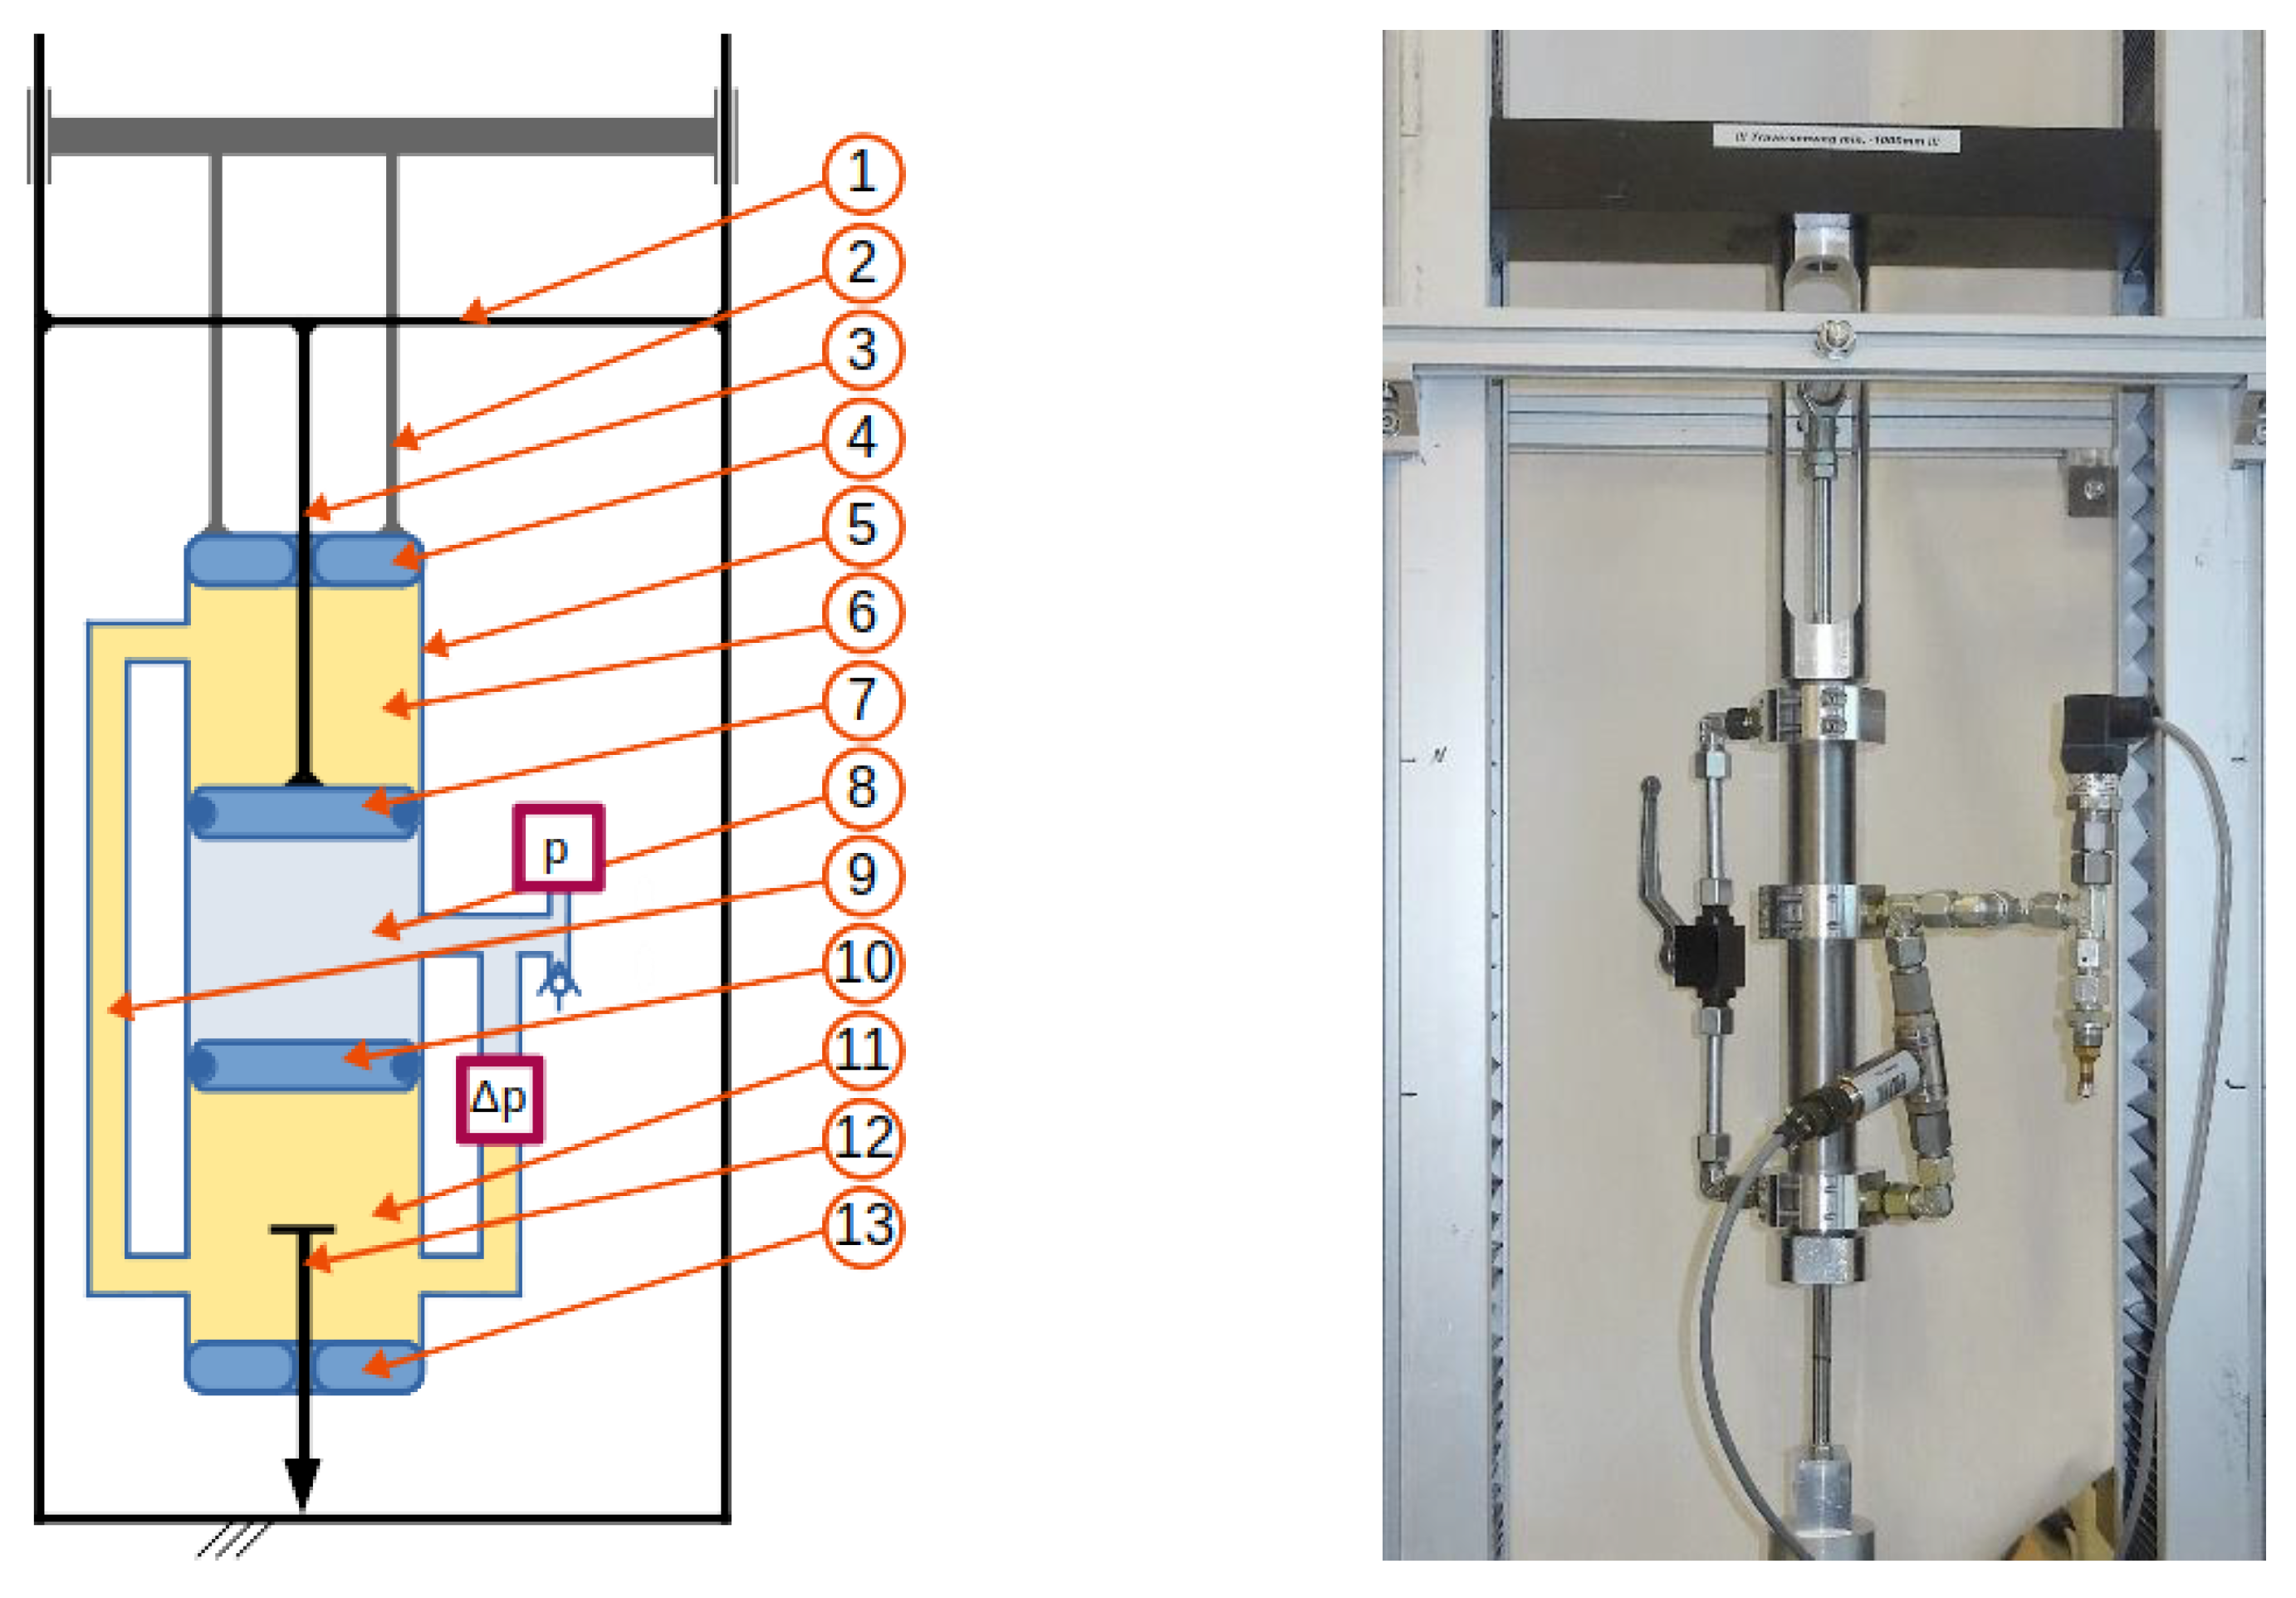
Figure 2 shows a single friction point test rig that is mounted to a tensile tester. The setup contains four friction-related probes, three of which can be transferred directly from the original damper: the rod (3), the rod guide assembly (4), and the piston (7). One, the tube (5), can be transferred with minor modifications. The actuation principle is reversed compared to the original damper, meaning that the rod is fixed to the tensile tester’s frame (1), and the tube is actuated by the tensile tester’s cross head (2). The resulting displacements stay the same: during the stroke, oil flows from the lower part of the tube (9) to the upper part (6), passing the piston’s bores on the way. The reversed actuation allows the avoidance of a compressible air volume for volume compensation of the in- and outgoing rod. Thus, one friction point (floating piston/tube) does not appear in this principle. The corresponding volume compensation is ensured by a secondary rod guide assembly (10)/rod (11) couple which brings the additional advantage of always having constant static pressure on the friction points, even while stroking, following the requirements mentioned above. To apply static operating pressure, a pressure accumulator (8) is added, which, however, does not influence the friction behavior further. The accumulator also ensures that the secondary rod (11) is always pressed out to the tensile tester’s frame (1), which means that no additional fastening is necessary.
There are four sensors included in this test setup, ensuring that the single friction point forces can be measured independently. The first sensor is the displacement sensor between the tensile tester and its cross head. The second is a small force sensor (F1) mounted between the rod probe (3) and the piston probe (7), measuring only the piston/tube friction. The third is another force sensor (F2) mounted between the rod probe (3) and the tensile tester’s frame (1), measuring both the rod guide assembly/rod friction and piston tube/friction. By subtracting the measurement of (F1) from the measurement of (F2) and by taring the static (F2) load caused by the rod push-out force because of static pressure from the pressure accumulator (8), the single friction point force at the rod guide assembly/rod contact can be calculated. Because of the high static pressure-induced load on (F2), this force sensor must be dimensioned for higher absolute forces than (F1). On nominal pressure, this push-out force exceeds about 238 N, which is one to two magnitudes higher than the expected friction force, and results in increased accuracy requirements for (F2). The fourth sensor is a static pressure sensor (p), which monitors possible leakages and ensures the correct static pressure before starting measurements.
Since the quantification of damper friction is generally inconsistent across the industry, a proper friction measurement sequence must be defined for this research, which captures and unifies the friction specification, but also fulfills the requirements for the desired support of the simulation setup from part 1 of this study (namely, friction model choice and parameterization) and validation. To achieve that, two sequences must be standardized: pre-conditioning and friction force recording.
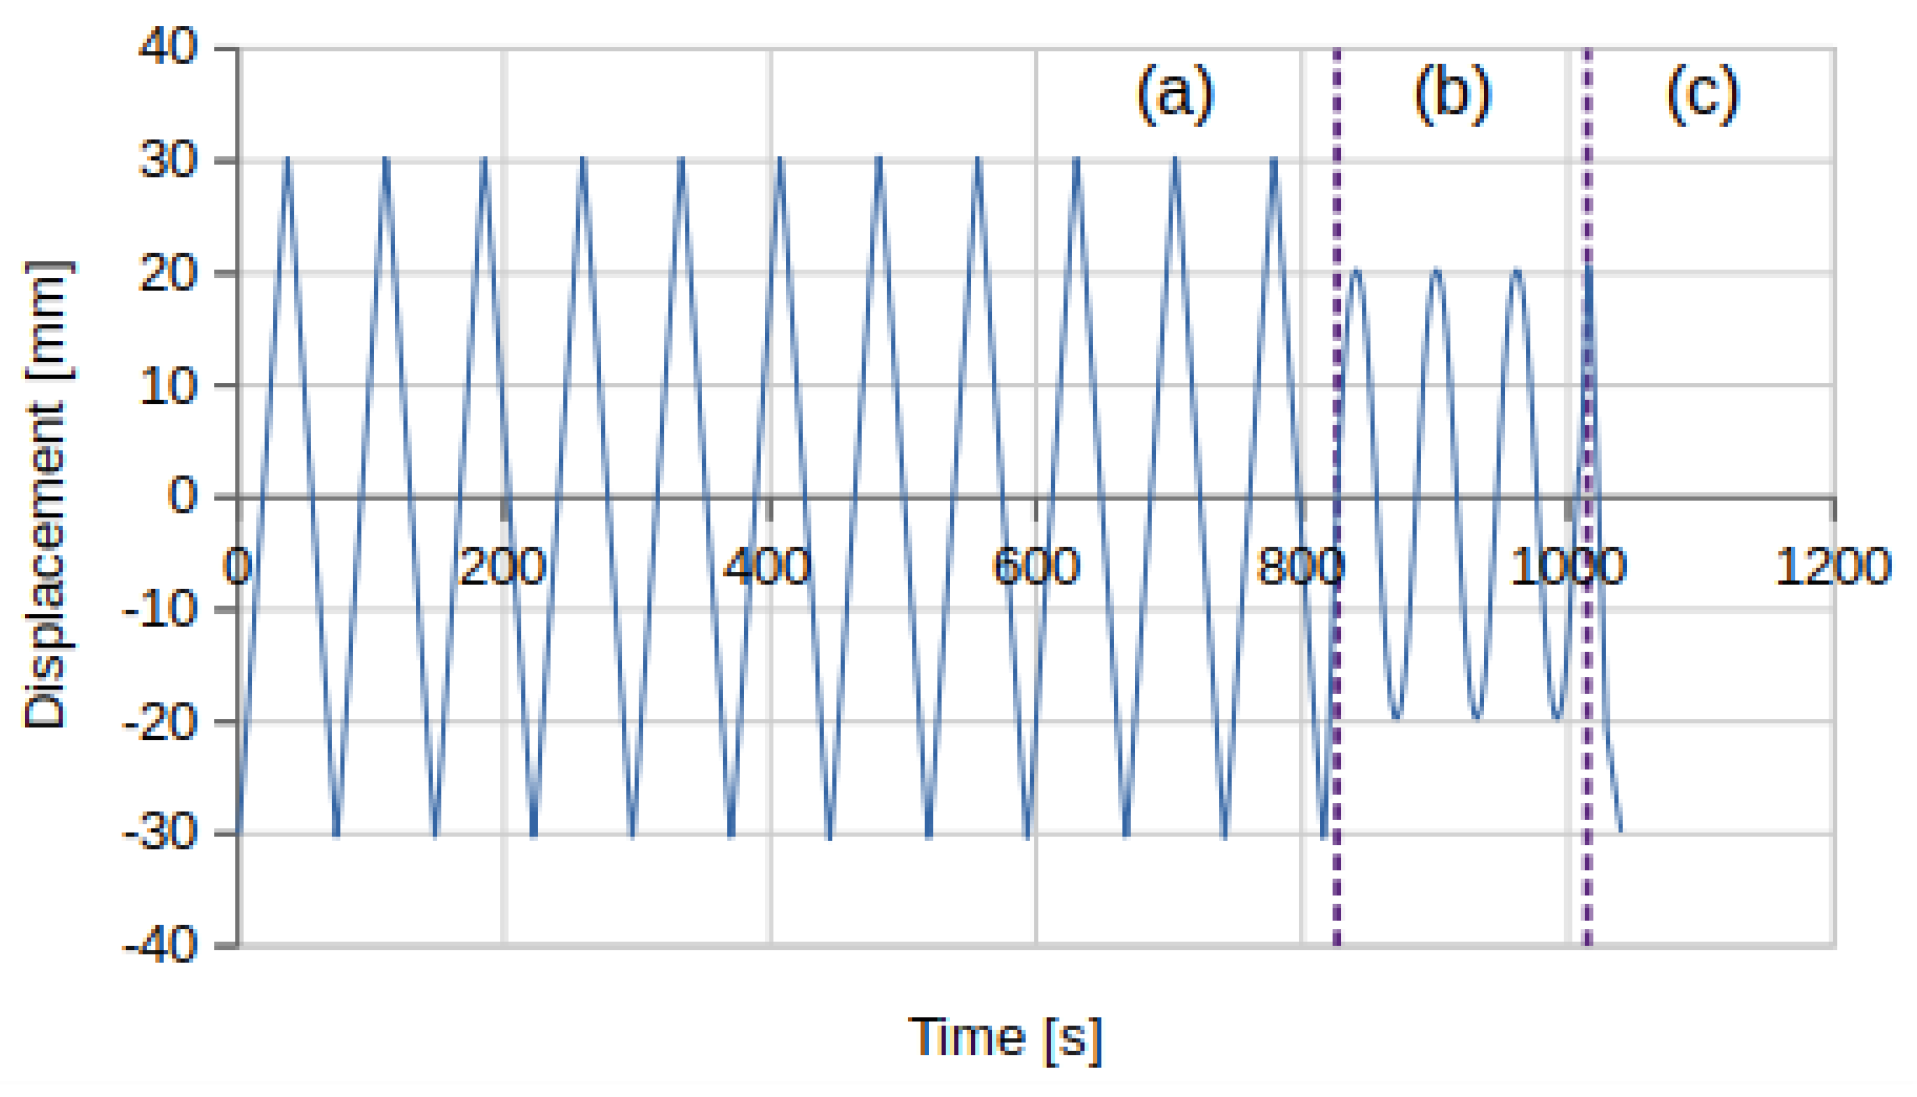
The pre-conditioning sequence is depicted in Figure 3a and consists of eleven triangle-shaped strokes with an amplitude of A ^ = 30   mm to ensure conditioned contact surfaces even outside the desired measurement amplitude. To be able to switch directly between pre-conditioning and friction recording, the pre-conditioning sequence is carried out on the same tensile tester.
The friction measurements are performed as follows. For typical friction tests, it is common to use triangle-shaped time-displacement sequences with long-lasting constant speed intervals, although sometimes sine-shaped sequences with much smoother turnaround points are also used. The advantage of triangle-shaped measurements is the very constant friction state around the midstroke, the typical analysis point of the friction measurement. This ensures reliable and easily analyzable friction measurements with a clear constant friction result at the chosen constant speed, but it produces no usable data close to the return points due to the uncertain acceleration behavior of the tensile test benches. Sine measurements, on the other hand, require more complex test rig motion control, but provide a larger actuation speed range and appropriate return point description, as required for dynamic friction model parameterizations. Because dynamic friction behavior and return point behavior is of interest to this study, a sine-shaped motion was chosen for the experiments within this research.
Given that a very low speed is still required to have a negligibly small fluid damping, the sine-shaped motion always remains at very low frequencies. The default period for friction recording as depicted in Figure 3b is T = 60   s , which equals f 0.01667   s 1 and provides, together with an amplitude of A ^ = 20   mm , a maximum speed of v m a x 2.094   mm / s . Three strokes are recorded, whereas only the last one is analyzed, while the previous two strokes show the required repeatability. The presented amplitude of A ^ = 20   mm represents a sliding distance for all friction points that forces the seal into gross sliding. With this amplitude, also, no contacting area of the counterpart at minimum displacement is in contact with the seal at maximum displacement. The achieved maximum speed is within the range of maximum speeds of common OEM friction measurement specifications, and constitutes a good compromise of the demand of investigating all relevant friction mechanisms on the one hand, while keeping fluid damping negligible on the other.
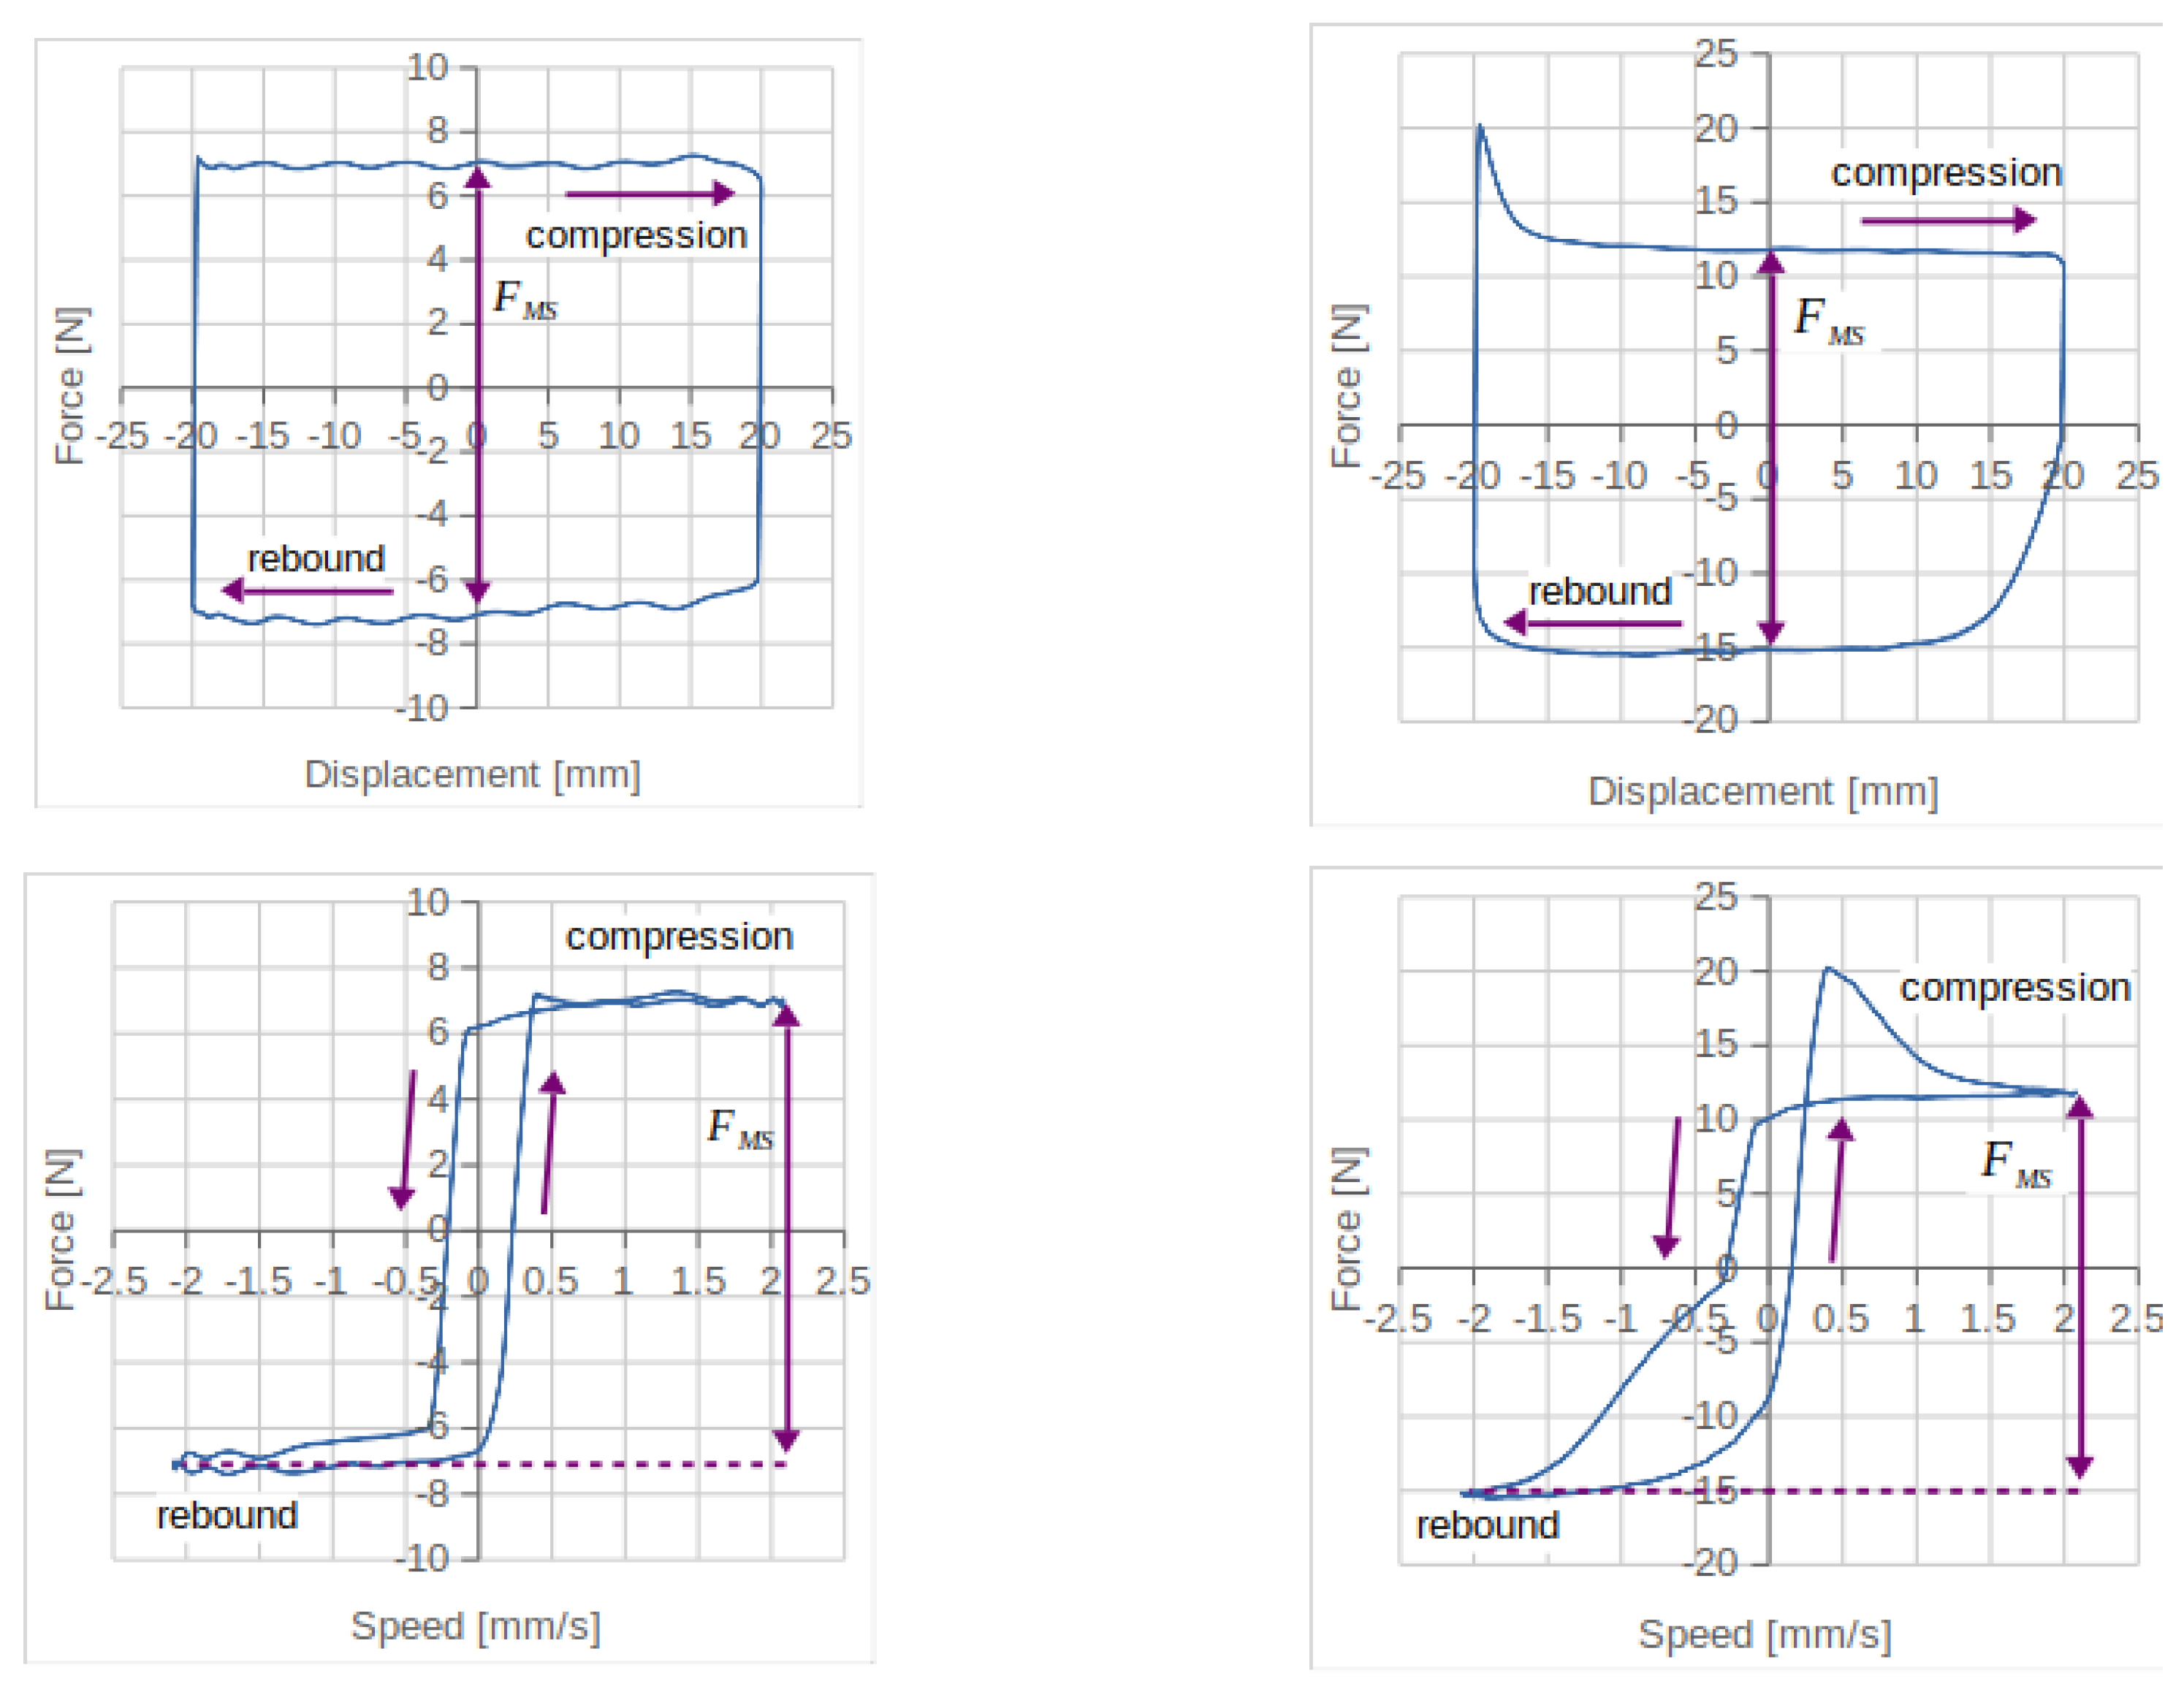
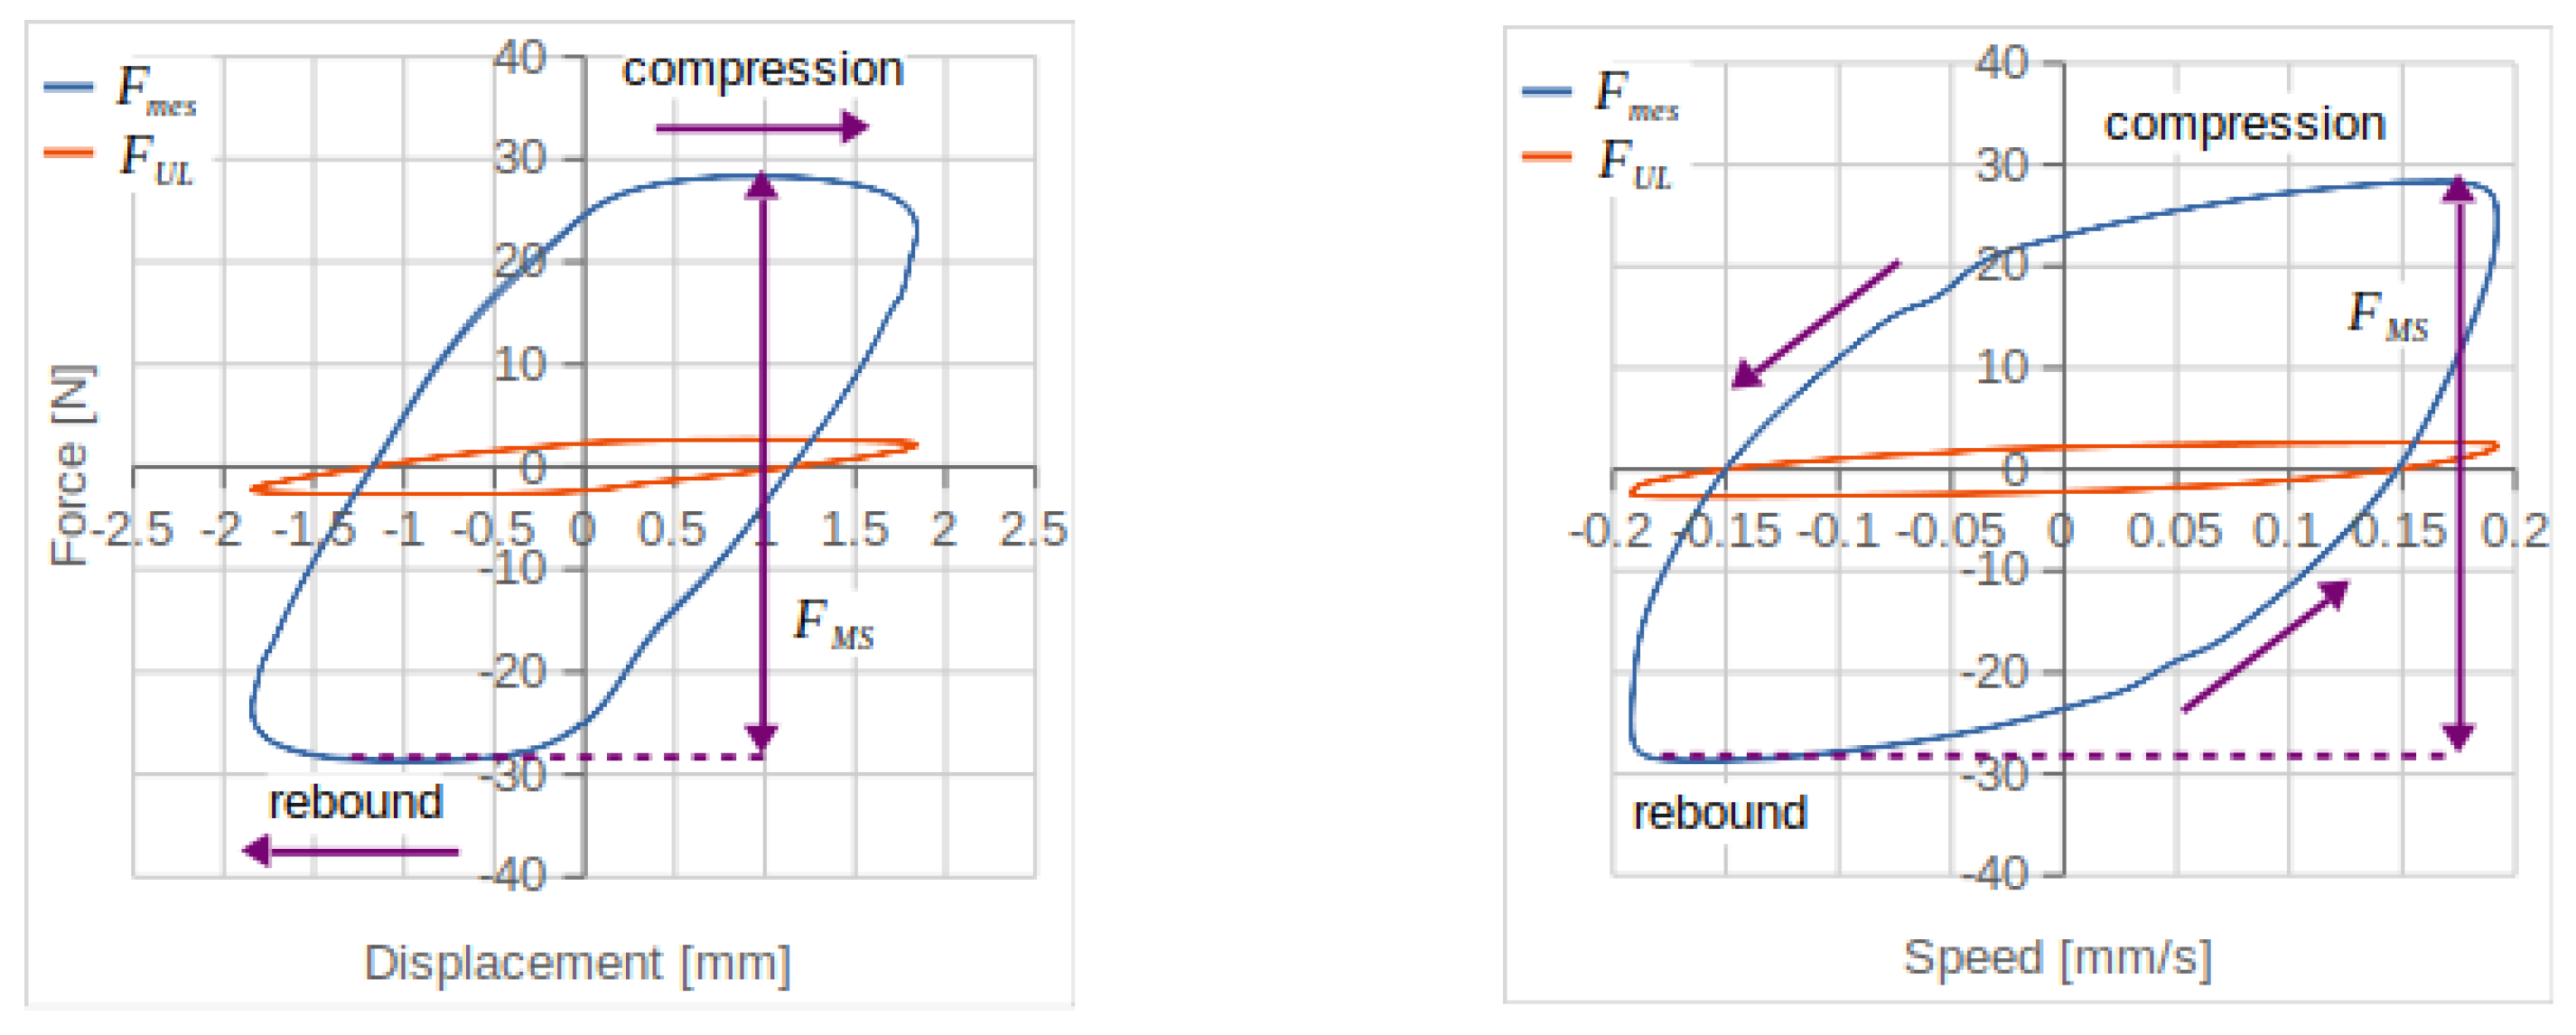
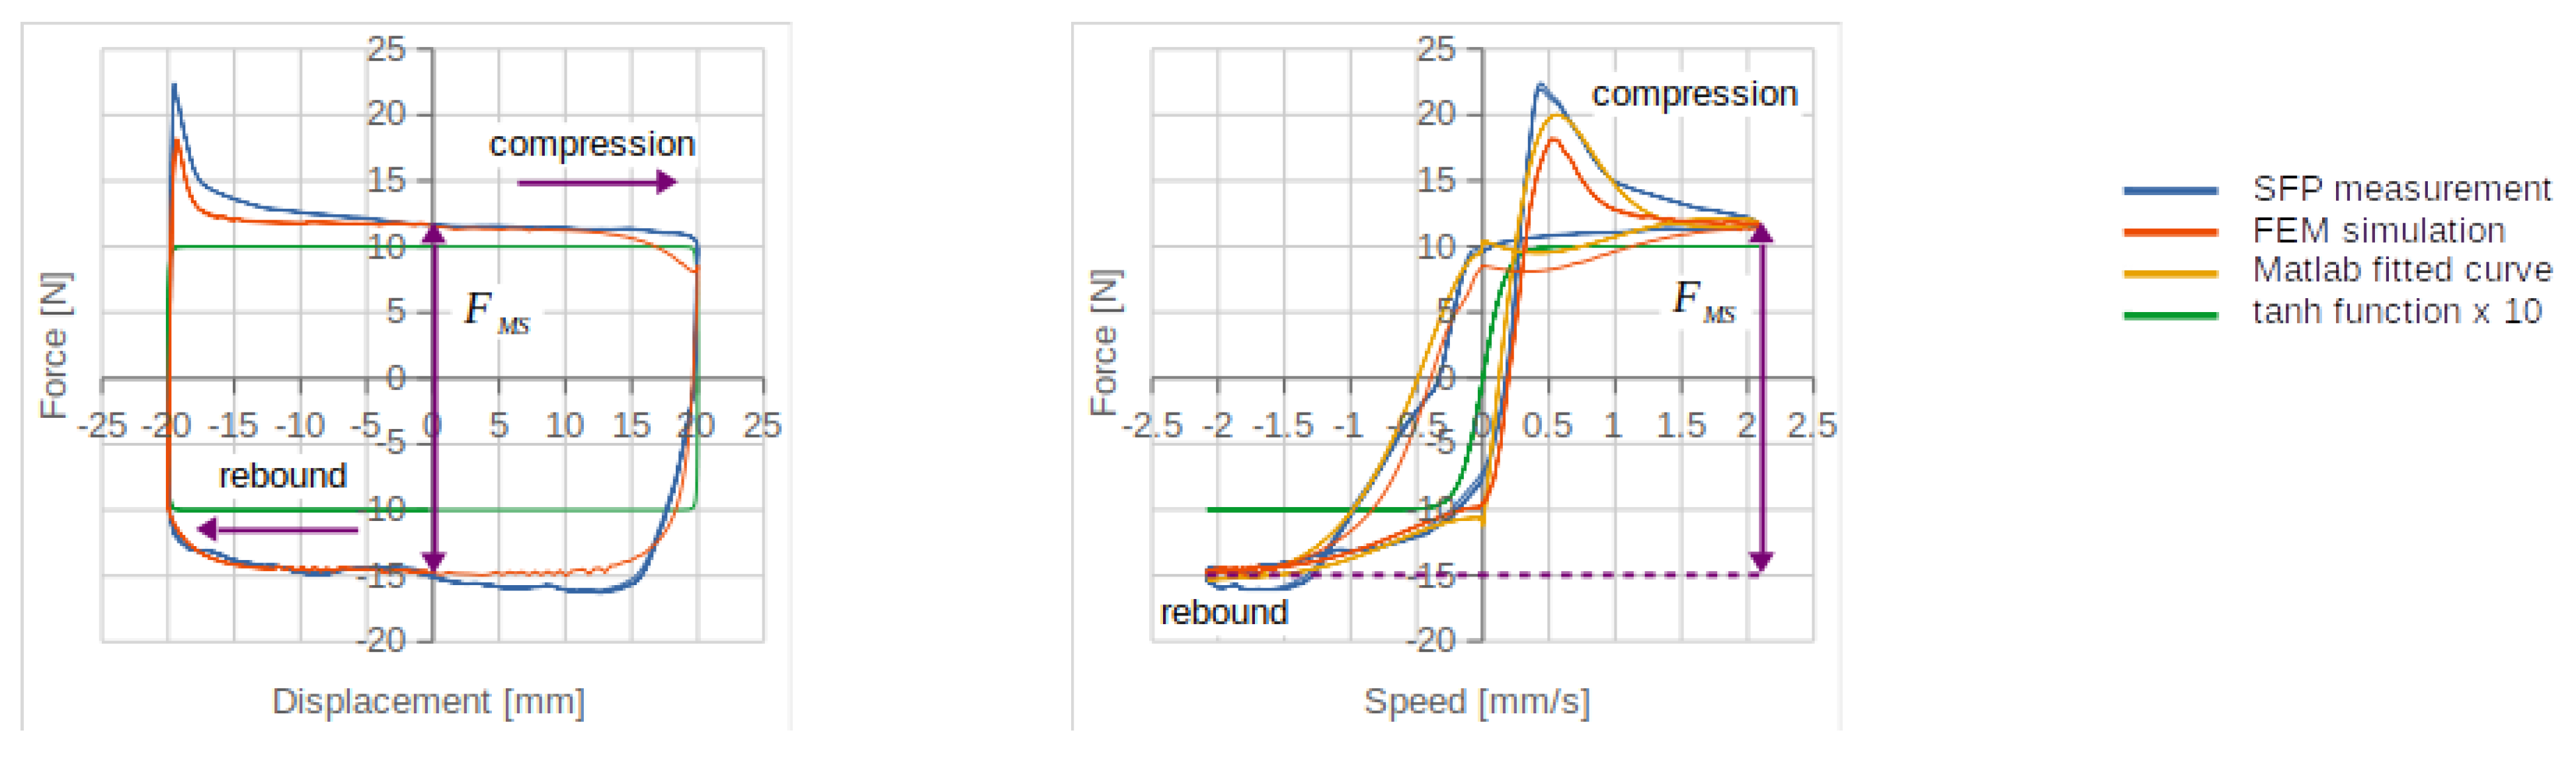
Representative force-displacement and force-speed graphs of the single friction points covered by SFP1 are shown in Figure 4 (left (piston/tube) and right (rod guide assembly/rod)). Depicted are both the second and the third cycle of the above-mentioned friction recording sequence, respectively. No deviations between both cycles are visible, thus demonstrating the reproducibility and constancy of the recording cycle, and the functioning of the pre-conditioning sequence as required. The characterizing friction force definition follows the common definition for damper friction, and is defined as the sum of the absolute forces at midstroke. Certain remarkable properties of the respective friction behavior are:
  • nearly rectangular force-displacement behavior of the piston/tube friction point, showing constant friction force over a wide speed range,
  • nearly point-symmetric force–speed behavior of the piston/tube friction point, showing a symmetrical pre-sliding hysteresis [2,3], but no further significant friction effects as described in part 1 of this study.
  • a significant overshoot at the rod guide assembly/rod friction point at the return point from rebound to compression, indicating significant non-reversible friction characteristics [2,3] for the compression, but not for the rebound direction,
  • asymmetric pre-sliding hysteresis for the rod guide assembly/rod friction point, with an abruptly changing slope very near to the virtual zero-force line.

3.2. Single Friction Point Test Rig 2–Floating Piston/Tube

The third friction point in a typical monotube damper like the reference damper is the floating piston/tube contact. The main difference to the friction points mentioned in SFP1 is the indirect actuation of the floating piston. This part’s movement is driven by the pressure difference between the tube and the pressure chamber and not directly by the rod. One central requirement to this test rig is to use this indirect actuation as well as the SFP1 to ensure equal movement behavior, and consequently, to ensure equal friction behavior of the floating piston both in reality and in the test rig. The other basic requirements are equal to the requirements of SFP1, as mentioned above.
The final working principle to meet these requirements is depicted in Figure 5. This Single Friction Point Test Rig 2 (SFP2) is mounted to a tensile tester as well as SFP1. The actuation is transferred by the link between the tensile tester’s cross head (2) and the tube (5) as well as the actuation of SFP1. However, the actuation principle is not reversing the displacement direction. The description below shows that in this setup, the floating piston moves towards the air volume if the test rig’s cross head (2) moves downward, similar to the compression stage of the real damper. The counterpart to the moving cross head (2) and tube (5) is a rod (3) fixed to the test rig’s frame (1). If the cross head moves downward, the displacement piston (7) linked to the rod (3) decreases the volume of the upper oil chamber (6), which causes the oil to flow through the connection pipe (9) to the lower oil chamber (11). The corresponding rod volume is compensated by the secondary rod (12). Both rods are sealed by standard rod guide assemblies (4, 13). The change of oil volume in both oil chambers forces the probe’s floating piston (10) to move up (relatively to the tube) together with the pressurized air chamber (8). The friction generated between the floating piston and the tube leads to a pressure difference between the lower oil chamber (11) and the air chamber (8), which is recorded by the pressure difference sensor (Δp). The static pressure sensor (p) is merely observing operation pressure to ensure that the test rig works as intended and without any leakage.
By taking the tube diameter d into account (in this case 36 mm), the floating piston’s friction F f r i c   F P can be directly calculated from the pressure difference p d i f f using the following equation:
F f r i c   F P = p d i f f π d 2 4
That means, for the reference damper geometry used for this research:
1 m b a r 0.102 N
It has to be considered that on a unit level, the friction directly occurring at the floating piston is transferred to the measurable friction force at the rod by a hydraulic transmission, driven by the ratio of the square diameter of the rod and the tube. Hence, with the reference damper’s geometry (11 mm rod and 36 mm tube), there is an amplification factor of:
a m p = A t u b e A r o d 10.71
which is composed from the tube diameter A t u b e and the rod diameter A r o d . The connection pipe (9) is mounted to the tube, where the lower mounting point is also used to connect the oil side of the pressure difference sensor. Because of the air volume inside the tube, there is no need for an external pressure accumulator, as with SFP1.
The pre-conditioning and friction recording sequences for SFP2 are similar to the sequences of SFP1, except for the respective amplitudes, which had to be adjusted to the actually occurring displacements in the real damper. Due to the hydraulic transmission, the actual displacement amplitude of the floating piston during the reference damper friction test is just A ^ F P   a c t 1.85   mm . The pre-conditioning sequence is therefore adjusted to an amplitude of A ^ F P   p r e = 20   mm . The resulting representative force-displacement graphs and force-speed graphs are depicted in Figure 6.
The friction force F m e s is calculated from the recorded difference pressure data according to Equations (1) and (2). To illustrate the resulting friction contribution of the floating piston/tube friction point to the overall friction at unit level, the unit level friction contribution F U L is included in the diagram, as calculated following Equation (3). To allow comparisons to the SFP1 results while taking into account that SFP2 is not reversing the actuation direction, the displacement, speed and force values are inverted. All graphs show the second and third cycles of the friction recording sequence, thus proving the reliability and reproducibility of the measurement sequence.
The force-displacement graph in Figure 6 shows a distinct parallelogram shape. This results in the absence of a constant force plateau at the midstroke, reducing the usefulness of the midstroke position to measure friction. Given that a relatively constant force plateau is reached later in both the rebound and compression directions, the characterizing friction F M S is defined as the difference between these two plateaus. The force-speed graph in Figure 6 forms an ellipsoidal shape, in which neither a force plateau nor any matching of acceleration and deceleration graphs is observed. This implies that the pre-sliding range is not properly left, and gross sliding is not reached during these measurements.

3.3. Measurement Concept Validation

Even if the single friction point test rigs were designed to be comparable to the real reference damper, it has to be proven that their individual measurement results represent the friction behavior of the respective friction points in the damper on the unit level. To achieve that, the friction in one set of friction-related components according to the friction points (A), (B) and (C) in Figure 1 was measured in two ways. First, all the components were measured together in a take-apart reference damper. Second, all components were inserted into their single friction point test rigs and their individual component friction was measured individually. Afterward, the friction graphs of the single friction points were super-positioned to evaluate the deviations compared to the unit level measurement. The raw force records of the take-apart damper were pressure-corrected to compensate for the general force increase during compression due to the decreasing gas volume. All pre-conditioning and measurement sequences are performed as introduced above.
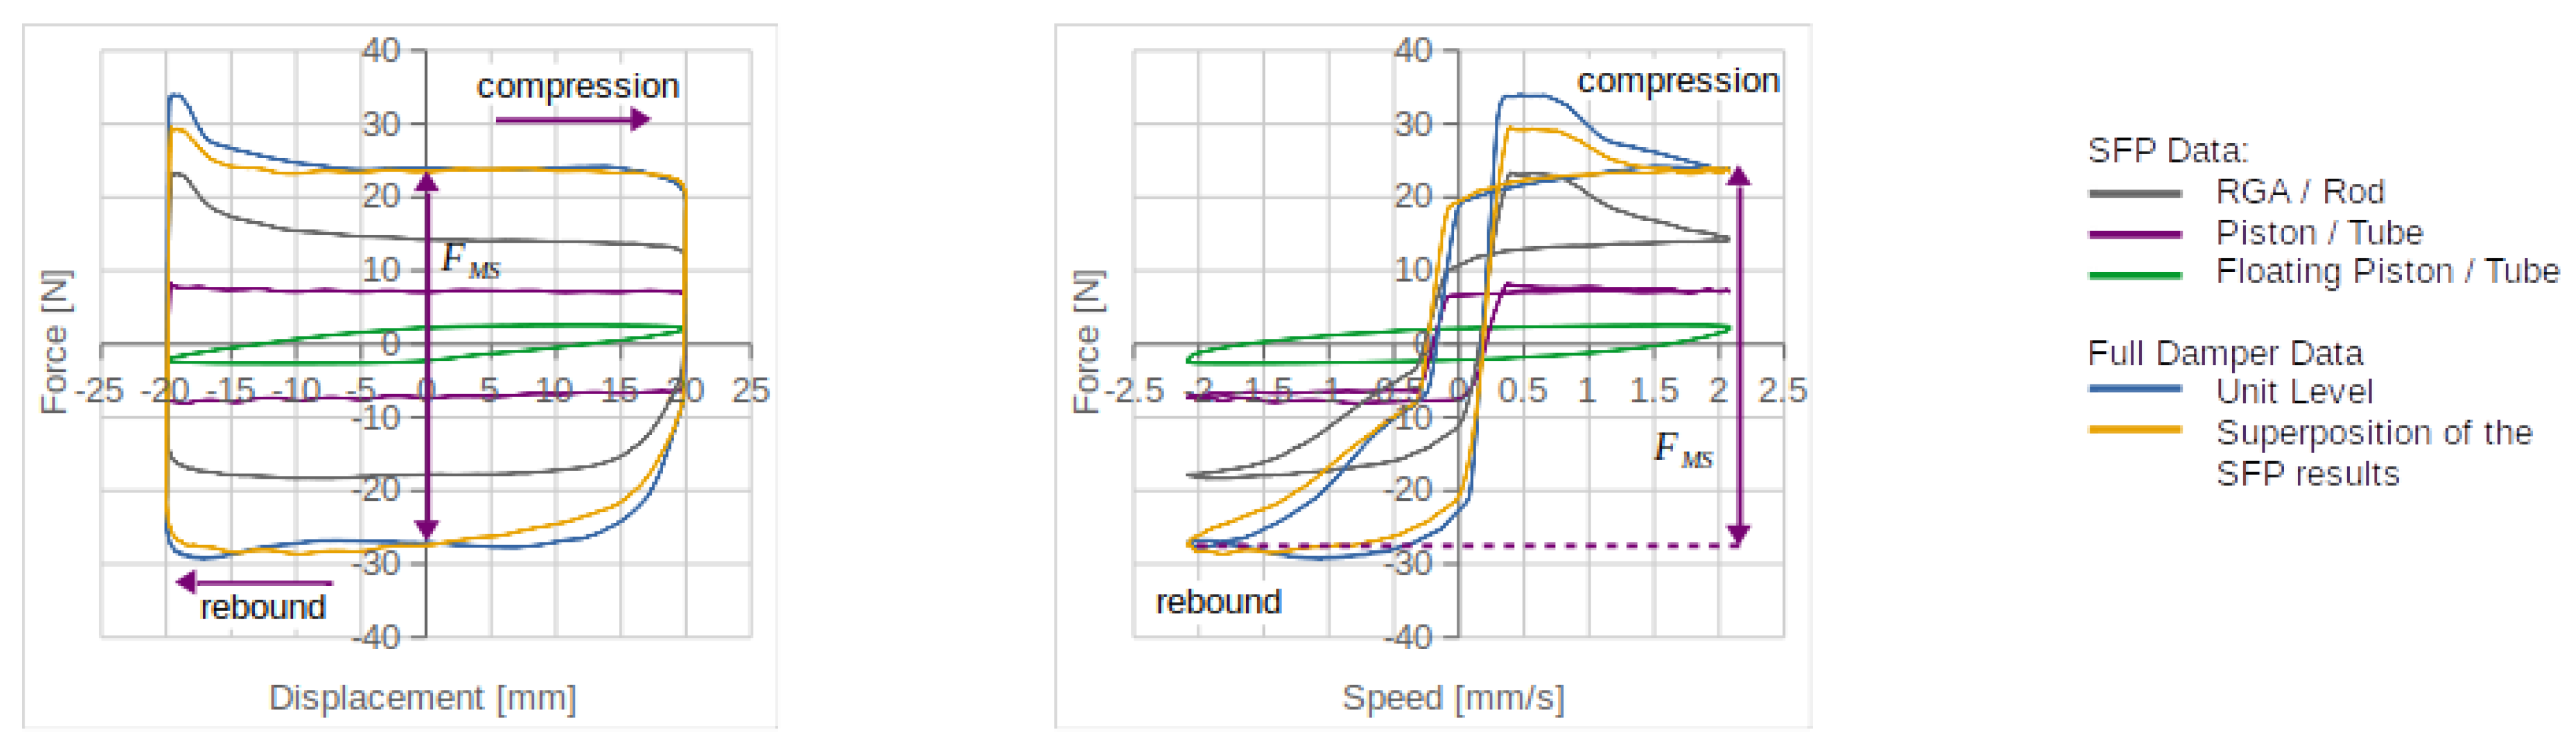
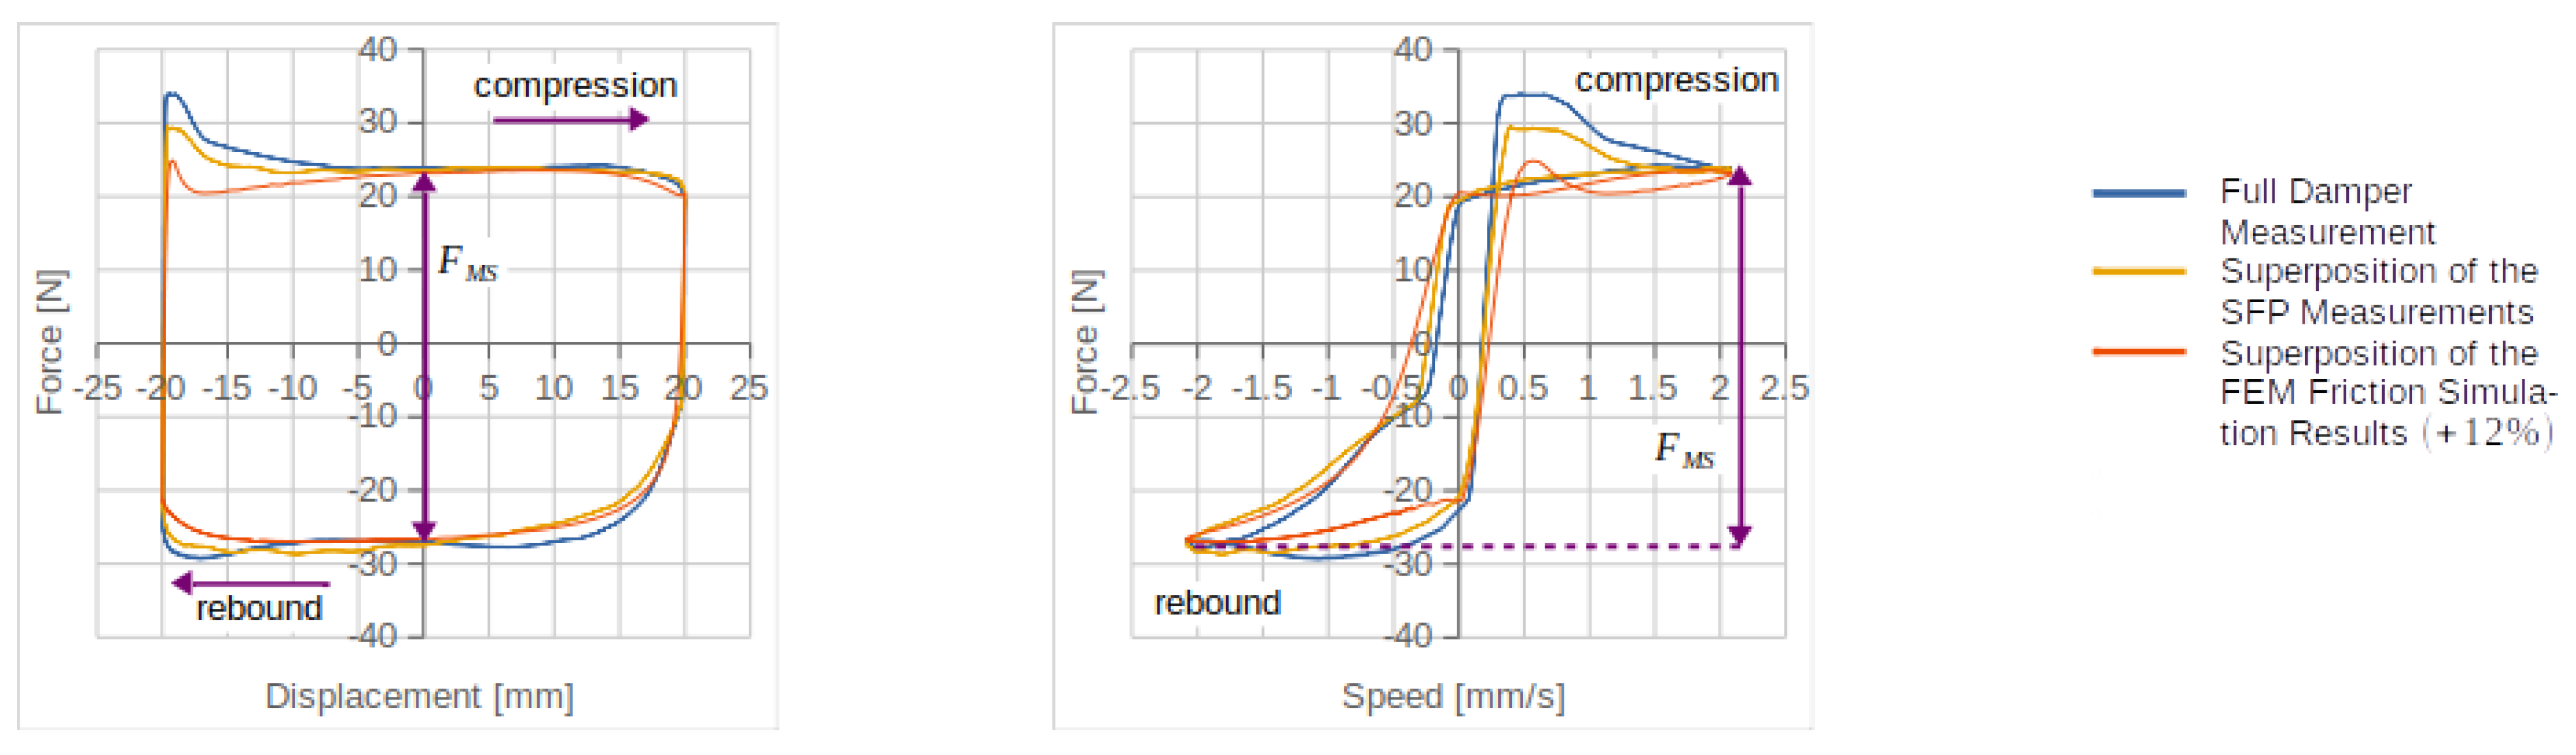
The results of all measurements and the super-positioned friction graph are shown in Figure 7. In general, the superposition graph matches the full reference damper graph quite well, especially the midstroke friction force F M S , as the key comparison parameter, which matches perfectly. The most significant deviation concerns the significantly lowered overshoot after the rebound-compression turn-around of the super-positioned graph, which shows an 8.7 pps decreased peak force related to F M S 
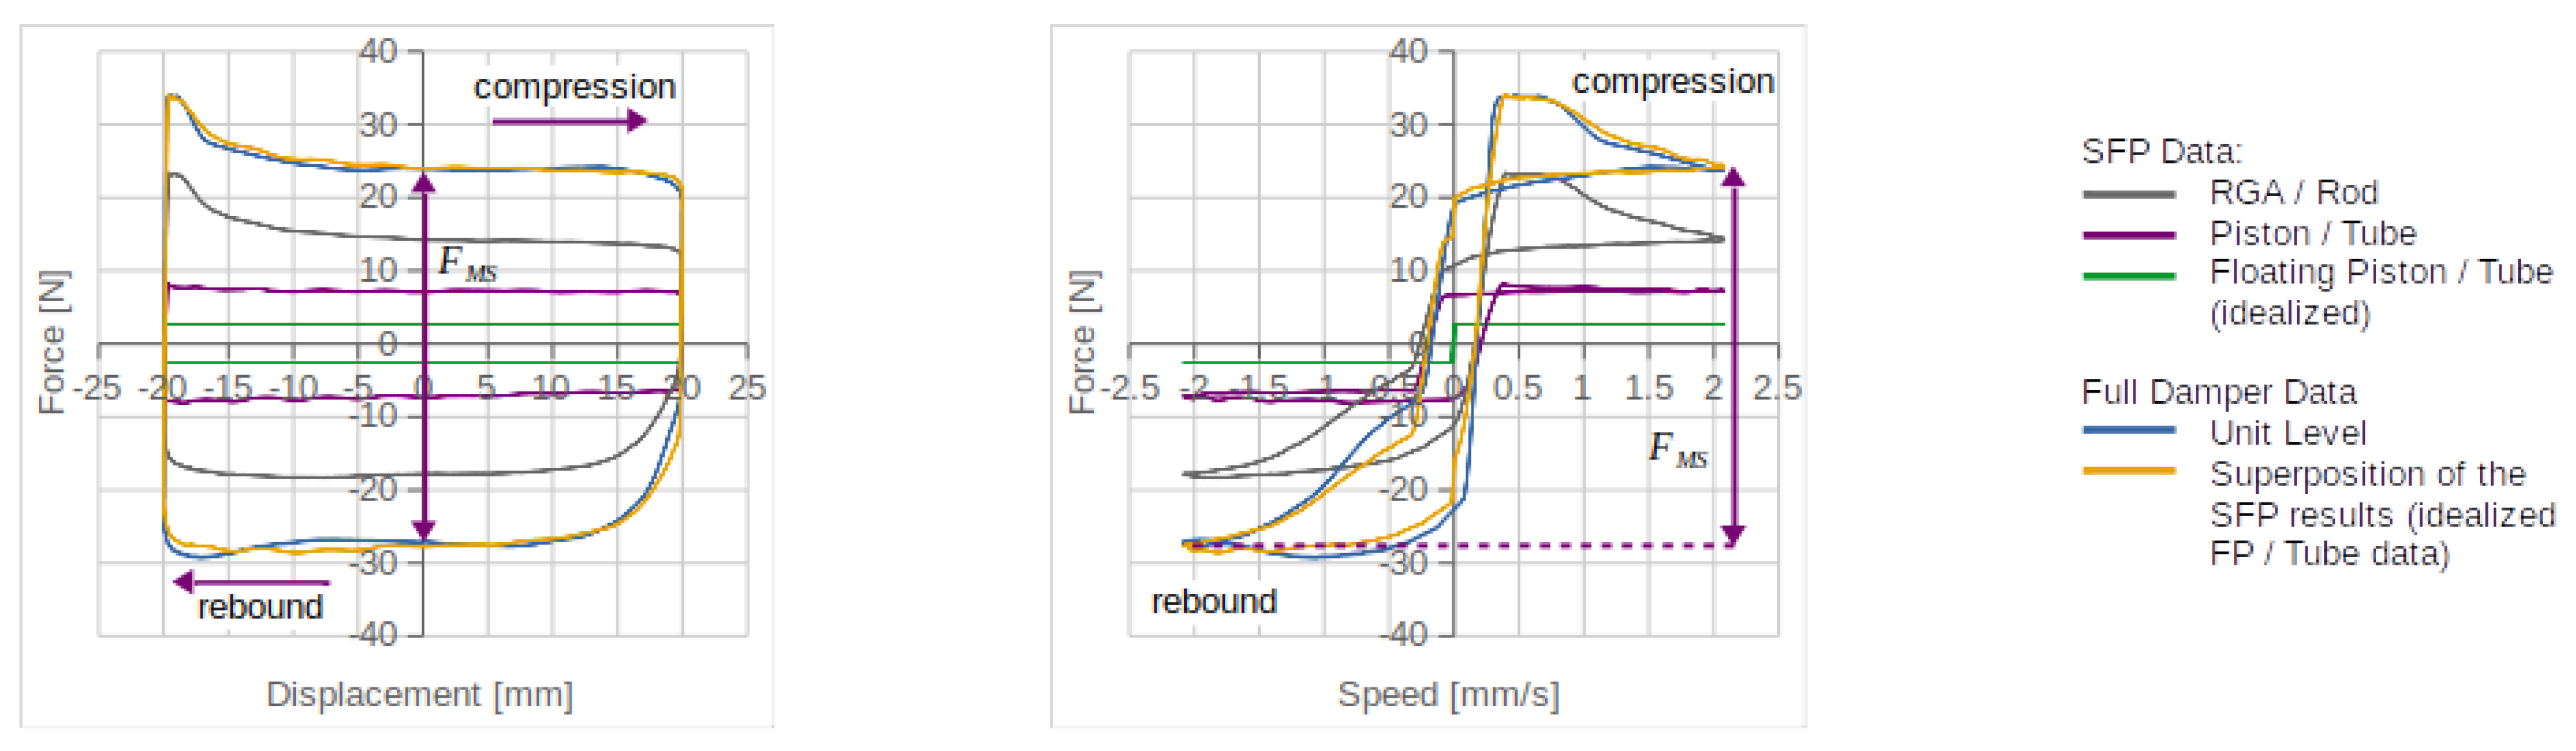
, compared to the full damper measurements. This overshoot peak decrease is caused by the slow force response of the floating piston/tube graph to the movement direction change. This can be further visualized by replacing this single friction point graph with a fictional idealized floating piston/tube friction graph, as shown in Figure 8. This floating piston/tube friction is assumed to show perfect Coulomb behavior, with only a very steep ramp added at the turnaround points. The resulting super-positioned graph is almost perfectly coincident with the full reference damper graph, even in the sections shortly after the turnaround points.
The reason for this deviating friction behavior of the floating piston/tube friction point is to be found in the design of SFP2. Assumptions that are made in the concept, but that are not perfectly implemented, are oil and gas flow, which is frictionless and free of any resistance, and a perfectly incompressible oil volume. Both of these influences are minimized as far as reasonably possible by the design and assembly sequence. An additional change to the oil volume could be caused by the movement of the seal in the displacement piston while stroking, which is already minimized by the application of an X-ring in the smallest possible groove in this actuation piston. However, the characteristic behavior of the floating piston/tube contact is still causing the deviations shown in Figure 7, even if they are significantly less pronounced through the measures taken. Nevertheless, the idealized behavior presented in Figure 8, i.e., the total absence of pre-sliding hysteresis, other transient friction phenomena, or the O-ring rolling in the floating piston’s groove, is not realistic either, and will never be fulfilled in practice. It is therefore assumed that the actual friction behavior of the floating piston/tube contact will show at least some of this delaying behavior, which leaves the question as to the causes of the remaining small deviations between the full damper friction curve and the superposition of all single friction point results open to further investigations. The SFP2 design’s advantages clearly outweigh this uncertainty, especially if the concept-driven weaknesses are minimized as described. The remaining deviations of the super-positioned graph to the full damper friction graph are acceptable, given that most of the graph’s sections, especially the midstroke friction section, show extraordinary coincidence. Thus, all three single friction points can be measured and analyzed as intended, with previously unmatched precision and similarity to the full damper behavior.

4. Simulation Approach Validation

4.1. Comparison of Unit Level Measurements and Superpositioned Single Friction Point Simulations

As already shown in the section above, separating the overall damper friction into the respective contributions of the single friction points is valid. This section follows the same approach and compares the superposition of the three FEM single friction point simulations from part 1 of this study with the above-mentioned unit-level measurements. It should be noted that the FEM simulations and their friction model parameters are based on single friction point measurements that contain different friction-related parts than the unit-level measurement, namely, a different piston and piston band, a different rod guide assembly with the related oil seal/static seal/scraper combination, and a different floating piston and O-ring. Both qualitative and quantitative deviations are therefore expected, mainly because of geometry deviations, but also because of various other uncertainties such as misalignments through the mounting process, differing lubrication states, differing seal material, and surface properties. However, to prove the overall applicability of the friction simulation method, these deviations should be sufficiently small.
The results of the superposition of all three single friction point FEM simulations, as compared to the superposition of all three single friction point measurements and to the full damper friction measurement, are shown in Figure 9. Since the midstroke friction of the super-positioned FEM data is too low compared to the measured data, Figure 9 shows the FEM friction graph amplified by 12%, which enables the matching of midstroke friction and thus a better qualitative comparison. This quantitative friction deviation is acceptably low, especially considering the above-mentioned uncertainties. In contrast, the qualitative deviations are quite large, especially during the acceleration phase after the rebound-compression turnaround. At this point, the expected significant overshoot peak is only very small, namely, only 2.7% above F M S , instead of the expected 20.6% above F M S from the full damper measurement. The most likely reason for this behavior is the unknown motion behavior of the floating piston/tube friction point in SFP2, as already discussed. Given that the LuGre parameterization is aiming for perfect reproduction of this uncertain friction behavior, the characteristics and uncertainties of the SFP2 measurements are also transferred to the FEM friction simulation, in which the LuGre parameter set is applied.
To prove this assumption, the contribution of the floating piston/tube FEM friction simulation is replaced by an artificial and idealized Coulomb-like friction behavior, coincident to the data presented in Figure 8. The change in friction behavior is as expected; while the accuracy of the midstroke friction is not altered, the qualitative friction behavior shows a much better match. The remaining deviations match the expectations from the findings about the qualitative deviations of the FEM friction graphs compared to the SFP friction graphs of part 1 of this study. Because of the no less underestimated tangential contact stiffness and tangential contact damping, the width of the pre-sliding hysteresis in Figure 10 is slightly smaller compared to the friction simulation shown in Figure 9, and the height of the overshoot peak after the rebound-compression turn-around is still significantly, but much less pronouncedly, lower than in the full damper measurement (−7.4 pps compared to the previous −17.9 pps decreased peak force related to F M S ).
In summary, the friction simulation methodology introduced in part 1 of this study proves to be sufficiently robust against small variations in geometry and material data as they occur when replacing similar parts. The resulting quantitative deviation is within the acceptable measurement deviation and is therefore sufficiently small. The qualitative deviations mainly result from the uncertainties of SFP2 and the already discussed underestimation of tangential contact stiffness and tangential contact damping, which is caused by the imperfect separability of microscopic and macroscopic seal deformation due to friction.

4.2. Friction Model Parameter Transfer to Different Geometry

This section demonstrates the transferability of the friction model parameters to a target geometry that is different from the source geometry originally used for the parameter estimation. Since all friction model parameters describe the microscopic properties of the friction contact of the source geometry, these properties must be similar between the source geometry and the target geometry. For this test, the reference damper’s rod guide assembly/rod friction point is exchanged with a rod guide assembly/rod paring that shows an increased outer rod diameter and inner rod guide assembly diameter of 14 mm. This rod guide assembly’s design principle remains the same as for the reference design, while all applied material is the same as for the reference setup. Consequently, the microscopic properties in the friction contact of the 14 mm setup can be assumed to be similar to the reference geometry, thus allowing for the transfer of the reference (source) friction model parameter set to the 14 mm (target) geometry.
The geometry of the simulation setup is abstracted from the real target geometry and is subsequently discretized following the pre-processing methodology introduced in part 1 of this study. The resulting mesh is depicted in Figure 11 (left). In comparison to the source geometry (Figure 11 center and right), it becomes apparent that the scraper’s contact geometry is quite similar, even if the back sides of the scrapers are differently shaped. The contact zone of the target oil seal shows initial penetration only between the lower seal lip and the rod (A), while the source oil seal shows additional initial penetration of the center lip (B). Consequently, the contact zone of the source and the target oil seal/rod contact is expected to be shaped differently. The application of the material models, the contact modeling, the friction modeling, and the boundary conditions remain similar to the reference setup, as do the solver settings. The applied friction model parameter set consists of the LuGre parameters of the source rod guide assembly rod contact and the source inverse normal force sensitivity (see part 1 of this study).
The resulting equivalent stress distribution is depicted in Figure 12 just after mounting (left panel) and after an additional 30 min of standstill to ensure proper material relaxation. Generally, the scraper behavior was observed to be similar as compared to the source setup from part 1 of this study; the highest equivalent stress level occurs near the contact zone (A) and the material relaxation is best visible by comparing this area (A) and through the increase of the blue shaded area of the scraper (B). While the contact area remains almost unchanged during the relaxation phase (+0.1%), the contact normal force decreases significantly (−23.9%). In contrast, the behavior of the oil seal/rod coupling of the target setup differs from the source setup more significantly because of the initially non-penetrating center lip of the oil seal (see Figure 11). Since the static seal and the oil seal experience further deformation during the relaxation phase, this center lip comes into contact, which can be noticed by the slightly increased equivalent stress level near this seal lip contact (C), and by the even larger increase of the contact area (+45.6%) during the relaxation phase as compared to the source setup. The equivalent stress level of the target oil seal and static seal is decreasing during the relaxation phase similar to the source setup, as expected, which is best visible at the contact zones and by the more pronounced blue shading within the less deformed parts of the seals. Due to the ongoing static seal deformation and the static operating pressure of 25 bar, the contact normal force also increases slightly during the relaxation phase (+3.4%), which is counter-intuitive, but possible, as already discussed in part 1 of this study.
To put the changes in the contact normal forces during the relaxation phase in relation to the previously investigated FEM setups, Figure 13 compares all of them in one diagram. While the target scraper behaves as expected, with almost zero difference to its source equivalent, the increase in contact normal force during the relaxation phase of the target oil seal/rod contact is unique for all friction contacts within this study.
The friction simulation results from the target rod guide assembly/rod FEM setup compared to the respective target SFP measurements are shown in Figure 14. These target SFP measurements are easily obtainable, since the tube diameter remains the same for both the target and source rod guide assembly/rod coupling. Consequently, the existing single friction point test rig SFP1 can be used for the target friction measurement by simply replacing the rod and the rod guide assembly. The pre-conditioning sequence and the friction recording sequence remain identical to the reference damper, as does the investigation of only cycles two and three of the three recorded friction cycles. The qualitative shape of the force-displacement and the force-speed graphs in Figure 14 are similar to the reference SFP1 graphs in Figure 4. The quantitative characteristics are similar as well, e.g., the pre-sliding hysteresis width, the width of the overshoot peak shortly after the rebound-compression turnaround, and the generation of an almost constant friction level at the midstroke. Only the height of the mentioned overshoot peak is significantly higher at the target rod guide assembly/rod friction point (7.7 pps higher force peak deviation to midstroke friction, compared to the source measurement). The midstroke friction F M S of the target friction measurement of the rod guide assembly/rod friction point is almost equal to the equivalent source measurement (−0.74%), which is of course within the measurement uncertainty.
The following conclusions can be drawn from the presented simulation and measurement results.
  • While expecting larger target friction, considering the larger contact area (+8.9%) [4], and contact normal force (+13.1%) compared to the source simulation, respectively, the measured friction of source and target setups is practically identical.
  • In contrast, the target friction simulated with the dynamic friction model applied to the contact zones of a FEM setup matches the target measurement with high accuracy (−1.5% F M S ).
  • Thus, simply implementing normal force sensitivity to a LuGre model without determining actual deformation via FEM is not sufficient for this complex kind of friction simulation, since normal force determination in FEM, especially on round geometry, is sensitive to discretization errors (see part 1 of this study).
  • Consequently, it has been proven that the friction simulation methodology introduced within part 1 of this study allows for a friction model parameter transfer to different geometry, under the assumption that the microscopic material behavior and lubrication state are similar.

5. Conclusions

While part 1 of this study showed a simulation approach for friction in automotive shock absorbers, this article illustrates the validity of this approach by comparing it against an established reliable measurement method. Therefore, both the measurement method and the simulation approach prove to be suitable to address the challenges which come up while working on predicting friction in automotive shock absorbers for their optimized application in adaptive and active suspension systems, especially for automated driving. Since both the simulation and the experimental approach are quite generally applicable, further consequences of the validation studies are given here.
  • The proposed friction investigation method is capable of determining the dynamic friction behavior of components with one or more single friction points, which can be clearly different from each other regarding their geometry, applied materials, lubrication state etc.
  • The developed friction prediction method is capable of determining the dynamic friction behavior of such components during all design stages, even without full-component prototypes or under not experimentally representable boundary conditions, with remarkably small computational effort.
  • The possibility of micro-scale friction parameters to macro-scale property changes like different geometry or material allows for the application of this method to all sliding part pairings where friction is relevant, be it inside or outside the field of automotive engineering.

Author Contributions

Supervision, K.A.; everything else, L.H. All authors have read and agreed to the published version of the manuscript.

Funding

This research received no external funding.

Institutional Review Board Statement

Not applicable.

Informed Consent Statement

Not applicable.

Acknowledgments

We acknowledge support for the publication costs by the Open Access Publication Fund of the Technische Universität Ilmenau.

Conflicts of Interest

The authors declare no conflict of interest.

References

  1. Shyrokau, B.; Wang, D.; Savitski, D.; Hoepping, K.; Ivanov, V. Vehicle Motion Control with Subsystem Prioritization. Int. J. Mechatron. 2015, 30, 297–315. [Google Scholar] [CrossRef]
  2. Al-Bender, F. Fundamentals of Friction Modeling; Department of Mechanical Engineering, Division PMA Katholieke Universiteit Leuven: Leuven, Belgium, 2010. [Google Scholar]
  3. Wojewoda, J.; Stefanski, A.; Wiercigroch, M.; Kapitaniak, T. Hysteretic Effects of Dry Friction: Modelling and Experimental Studies. Philos. Trans. R. Soc. A Math. Phys. Eng. Sci. 2008, 366, 747–765. [Google Scholar] [CrossRef] [PubMed]
  4. Heipl, O.P. Experimentelle und Numerische Modellbildung zur Bestimmung der Reibkraft translatorischer Dichtungen. Ph.D. Dissertation, Fakultät für Maschinenwesen, RWTH Aachen, Aachen, Germany, 2013. [Google Scholar]
Figure 1. Reference damper overview with details of the single friction points (A) rod guide assembly/rod; (B) piston/tube; (C) floating piston/tube.
Vehicles 03 00013 g001
Figure 2. Principle (left) and actual setup (right) of the Single Friction Point Test Rig 1: rod guide assembly/rod and piston/tube. (1) frame; (2) actuation; (3) rod; (4) rod guide assembly; (5) tube; (6) upper oil volume; (7) piston; (8) pressure accumulator; (9) lower oil volume; (10) secondary rod guide assembly; (11) secondary rod
Vehicles 03 00013 g002
Figure 3. Complete time-displacement progress of pre-conditioning sequence (a), friction recording sequence (b) and return to initial position (c).
Vehicles 03 00013 g003
Figure 4. Representative force-displacement graphs (top) and force-speed graphs (bottom) of the single friction points piston/tube (left) and rod guide assembly/rod (right).
Vehicles 03 00013 g004
Figure 5. Principle (left) and actual setup (right) of the Single Friction Point Test Rig 2: floating piston/tube. (1) frame; (2) actuation; (3) rod; (4) rod guide assembly; (5) tube; (6) upper oil volume; (7) displacement piston; (8) gas volume; (9) connection pipe; (10) floating piston; (11) lower oil volume; (12) secondary rod; (13) secondary rod guide assembly
Vehicles 03 00013 g005
Figure 6. Representative force-displacement graph (left) and force-speed graph (right) of the single friction point floating piston/tube; with F m e s showing measured friction and F U L showing the unit level friction contribution.
Vehicles 03 00013 g006
Figure 7. Comparison of the force displacement graphs (left) and the force speed graphs (right) of the take-apart full damper friction measurement and the superposition of the three single friction point measurements at the rod guide assembly/rod, piston/tube, and floating piston/tube.
Vehicles 03 00013 g007
Figure 8. Comparison of the force displacement graphs (left) and the force speed graphs (right) of the take-apart full damper friction measurement and the superposition of the single friction point measurements of the rod guide assembly/rod and piston/tube, and a fictional idealized floating piston/tube graph.
Vehicles 03 00013 g008
Figure 9. Comparison of the force displacement graphs (left) and the force speed graphs (right) of the full take-apart damper friction measurement, the superposition of the SFP measurements, and the super-positioned FEM friction simulation results; floating piston/tube friction contribution with regard to Equation (3).
Vehicles 03 00013 g009
Figure 10. Comparison of the force displacement graphs (left) and the force speed graphs (right) of the full take-apart damper friction measurement, the superposition of the SFP measurements with idealized floating piston/tube data, and the super-positioned FEM friction simulation results.
Vehicles 03 00013 g010
Figure 11. Mesh overview of the target rod diameter geometry (left); comparison of mesh details of the source (center) and the target geometry (right) with the related lips of the oil seal in contact with the rod (A) and (B).
Vehicles 03 00013 g011
Figure 12. Comparison of the equivalent stress distribution of the target rod guide assembly/rod FEM setup, divided into the scraper/rod contact (top) and the oil seal/rod contact (bottom), before (left) and after (right) material relaxation time with the resulting contact areas A S R   ;   A OR and the circumferential scraper/rod and oil seal/rod contact normal forces F N   S R   ;   F N   OR . (A) showing decreasing maximum equivalent stress during relaxation; (B) showing increasing low-stress area during relaxation; (C) showing the center lip of the oil seal coming into contact with the rod during relaxation.
Vehicles 03 00013 g012
Figure 13. Contact normal force change (in percentage) during the material relaxation phase, depicted for each seal/counterpart FEM contact.
Vehicles 03 00013 g013
Figure 14. Comparison of the force displacement graphs (left) and the force speed graphs (right) of the 14 mm target rod FEM simulation and SFP measurement of the friction behavior of the rod guide assembly/rod single friction point.
Vehicles 03 00013 g014
Publisher’s Note: MDPI stays neutral with regard to jurisdictional claims in published maps and institutional affiliations.

