Article

Difference Thresholds for the Perception of Sinusoidal Vertical Stimuli of Whole-Body Vibrations in Ranges of Amplitude and Frequency Relevant to Ride Comfort

1
Institute of Vehicle System Technology, Karlsruhe Institute of Technology, 76131 Karlsruhe, Germany
2
Dr. Ing. h.c. F. Porsche AG, 71287 Weissach, Germany
*
Author to whom correspondence should be addressed.
Submission received: 5 March 2020 / Revised: 30 May 2020 / Accepted: 1 June 2020 / Published: 3 June 2020
(This article belongs to the Special Issue Human Response to Vibration)

Abstract

:
Minor differences in the vibration characteristics of a vehicle may greatly influence the comfort experienced by the driver. Therefore, such characteristics are significant in the process of vehicle development. In this experimental study, just-noticeable differences were determined for sinusoidal vertical whole-body vibrations at the frequencies 1.3 Hz and 6.0 Hz, and for the vibration amplitudes 0.2 m/s², 0.5 m/s² and 1.2 m/s². The stimulation set up was realised using a test rig constituting a seating position similar to that in a real vehicle environment. A transformed one-up-three-down method, in conjunction with a two-interval forced choice procedure, was used to determine difference thresholds, in accordance with Weber’s Law, for 14 test subjects. Median relative difference thresholds in the range of 6.7% to 11.0% were observed, and were examined for statistical significance (α < 0.05) and practical importance on amplitude and frequency, with respect to this law. The results showed a frequency-dependence at the lowest vibration amplitude and an amplitude-dependence for both frequencies from a statistical point of view. However, the amplitude-dependence at 6.0 Hz was considered as negligible for practical use.

1. Introduction

In developing the vibration characteristics of cars, promising vehicle variants are evaluated against criteria and objects regarding various aspects, including ride comfort (vibration-induced discomfort up to 30 Hz, see B1 in Appendix B for additional information). In order to allow important vehicle conditions to be defined at an early stage of development, studies are carried out first on the basis of digital prototypes. In this way, real prototypes can be developed and advanced at a high level close to series production. In a later pre-series phase, potential vehicle states are studied extensively on bench tests and on road tests, in which boundary conditions (temperature, excitation, etc.) are varied. Differences in the vibration characteristics of a vehicle may be slight. Consequently, a robust, objective analysis requires knowledge of the connections between characteristic quantities, which can be measured and calculated objectively, on the one hand, and subjectively, on the other.

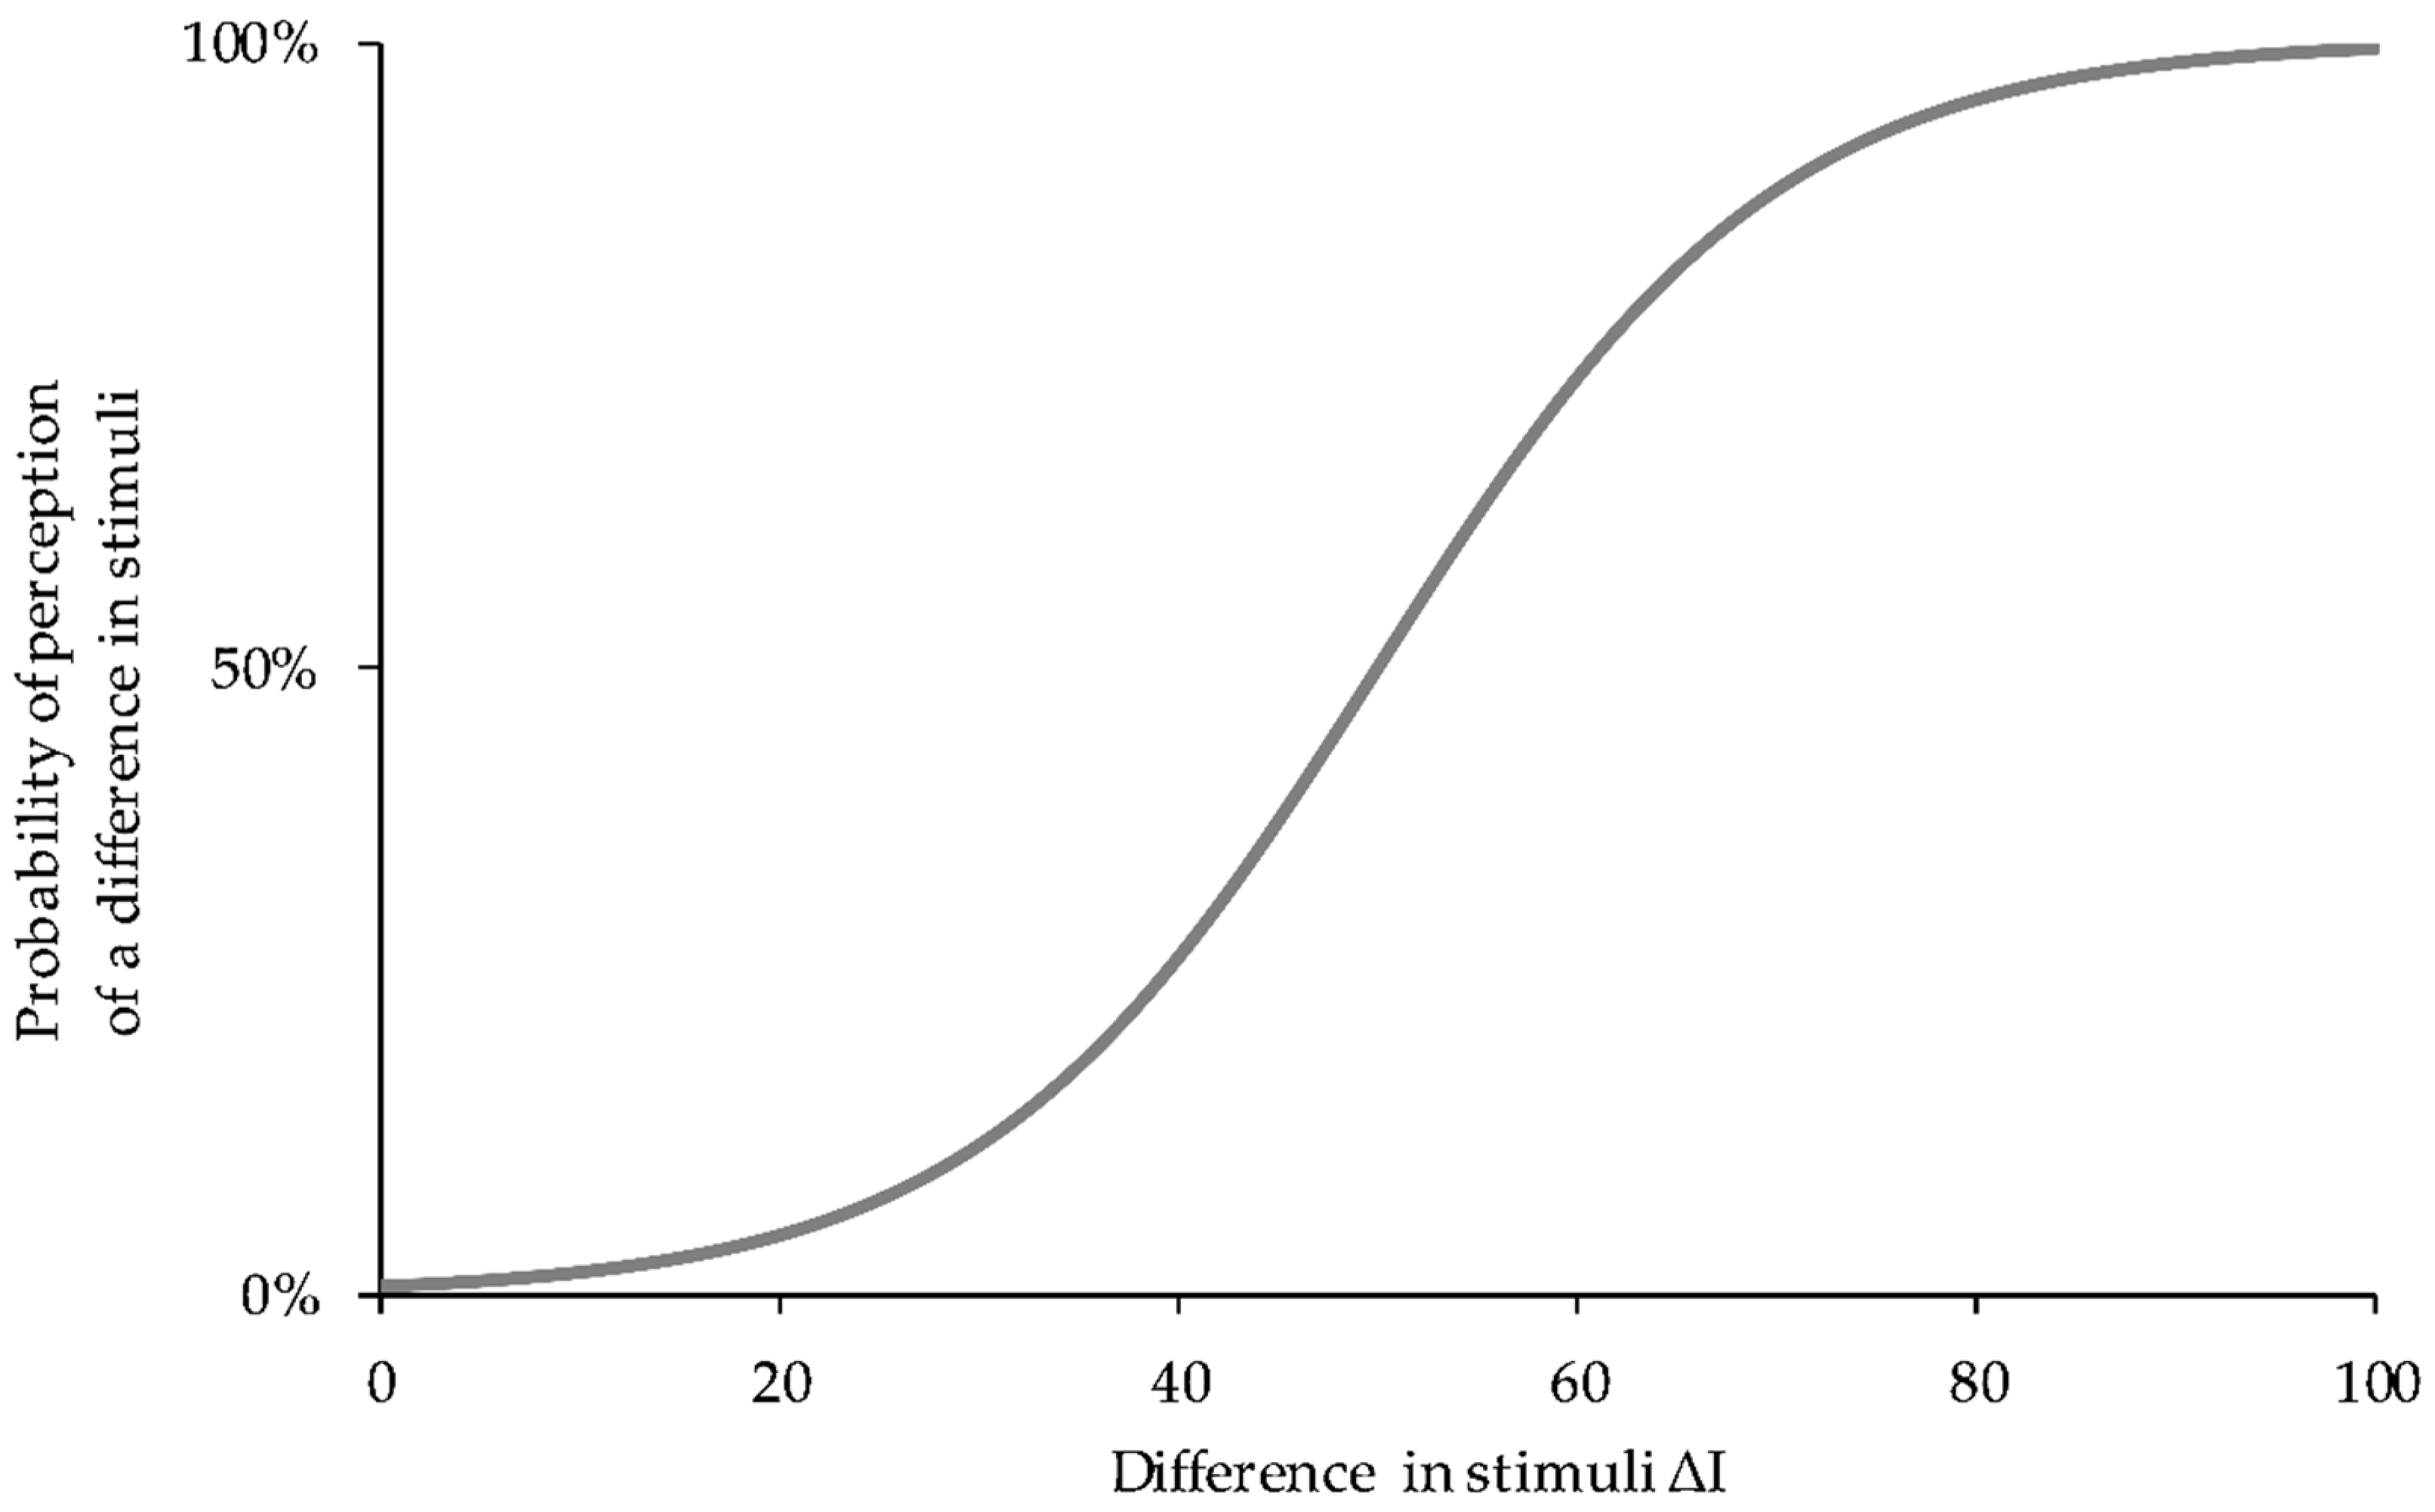
1.1. Basic Principles

The approach developed by the physiologist Ernst Heinrich Weber (1795–1878) can be used to describe differences in perception objectively:
constant = Δ I I
This approach implies that the just-noticeable difference between a change in stimulus, ΔI, is in a constant relation to the initial stimulus, I. Studies have shown that this law can be extended to most senses unless the initial stimulus is too close to a perception threshold [1,2,3]. Pütter [4] also pointed out that the approach was valid for an interval of mean intensities of stimuli, but not so for very weak or very strong stimuli.
The relation between a physical stimulus and human perception can be described by a psychometric function (Appendix A, Figure A1). As a function of the process selected for threshold determination, the function proper or the intensity of the stimulus can be determined for a desired probability of perception (convergence level). Both classical procedures and modern adaptive procedures can be used for this purpose. The classical procedures of threshold determination include the method of limits, the method of adjustment and the method of constant stimuli. Classical procedures are very time-consuming, on the one hand, and easy to see through by the test subject, on the other hand. Besides the time aspect, habituation or expectation errors may additionally influence the result, which is why classical procedures generally are considered inefficient. Modern adaptive procedures allow the increment step of stimuli (as a function of the response of the test subject) to be adapted in such a way that stimuli can be presented in the vicinity of the desired threshold. Procedures like Bekesy’s tracking method, the PEST (parameter estimation by sequential testing) method or the (transformed) up-down method therefore allow precise and efficient threshold determination, and the possibility of combining procedures in addition permits adaptation and habituation effects to be minimised. For further information, see [1].
Studies with test subjects generate data sets, which can be checked for significant differences by means of statistical tests (such as hypotheses tests). In this case, a formulated question is translated into two complementary hypotheses: the null hypothesis, H0, and the alternative hypothesis, H1. Later definition of a hypothesis is always associated with the risk of a wrong decision. As a matter of principle, type I errors (α-risk), which lead to a wrong decision favouring H1, and type II errors (β-risk), which favour H0 in a wrong decision, are distinguished in this case (schematic overview, see Table A4). The significance level, α, indicates the probability of a formulated alternative hypothesis, H1, being wrongly assumed. The statistical power (1-β) indicates the probability of a binary hypothesis test deciding the feasibility of an alternative hypothesis, H1. In research, defined limits of 0.05 for α and 0.80 for 1-β have become established. Information about practical significance, however, cannot be derived from the α/β-constellation [5]; thus, an explanation of the practical importance of statistically significant results makes additional calculation of the effect size for existing data sets meaningful. The effect size in this case refers to the calculation of the degree of difference, i.e., the magnitude and direction of a difference between two distributions. More information on this point is contained in [6].
The vibrations induced by the roadway are transmitted to the driver through the seat, the steering wheel and the footwell. From a physiological point of view, the driver senses vibration, for instance, from the surface sensitivity of the skin (mechanical receptors) or the vestibular organ, which serves for the postural equilibrium of the human body. Four groups of mechanical receptors (see Appendix ATable A1 for additional information) are present in different layers of the skin (partly also in organs), responding in individual frequency bands to pressure (Merkel, 0.4 Hz to 3 Hz), velocity (Meissner, 3 Hz to 35 Hz; Ruffini, 80 Hz to 500 Hz) and acceleration (Paccini, 35 Hz to 500 Hz) [7,8], and differ in the speed of adaptation, stimulus detection and size of the receptor field. The vestibular organ, located in the human inner ear, is responsible for the sense of balance for the human body in motion or at rest. The organs contained in it carry hair cells responding to motion or changes in motion. The macula organ, among other things, detects linear accelerations, while the system of semi-circular ducts is able to perceive rotary accelerations. For further information, see [1].

1.2. Previous Studies

The purpose of the following section is to provide a brief overview of relevant studies, contributing to the objective evaluation of just-noticeable differences of sinusoidal whole-body vibrations. Table 1 provides information regarding stimuli (amplitude and frequency), psychophysical testing method, test setup, test subjects and results for each study.
Morioka and Griffin [9] determined difference thresholds at 5 Hz and 20 Hz, with amplitude levels of 0.1 m/s² and 0.5 m/s², on a rigid wooden surface (electrodynamic shaker). The results showed that increased amplitude levels tend to reduce thresholds, however, not in a statistically significant way. The median relative difference thresholds of about 10% (8.1–12.3%) established in this study applied irrespective of frequency and amplitude, thus confirming the approach according to Weber.
Bellmann et al. [10,11,12] detected difference thresholds above the perception threshold at 0.063 m/s² in a frequency range between 5 Hz and 50 Hz. The test setup consisted of a wooden chair connected to a vibrating platform excited by an electrodynamic shaker. The data sets resulted in difference thresholds of approximately 19% across all selected reference points. The approach according to Weber could similarly be confirmed in this study.
Baumann et al. [13] also used the test setup of [11], but added a driver’s seat. Difference thresholds were determined for a frequency range from 12.5 Hz to 80 Hz at an amplitude level of 0.1 m/s². According to Baumann et al. [13], the result of approximately 20% was comparable, across all selected reference points, with the findings in Bellmann et al. [11].
Matsumoto et al. [14] also used an electrodynamic shaker to determine difference thresholds at an amplitude level of 0.7 m/s² for frequencies between 4 Hz and 80 Hz. Evaluations indicated threshold levels between 5.2% and 6.5%. The results indicated that changes in amplitudes were better perceived at 4 Hz rather than at higher frequencies. However, this series of studies did not confer to Weber’s approach.
Forta et al. [15] investigated a frequency range between 2.5 Hz and 315 Hz at amplitude levels of 0.05 m/s², 0.2 m/s² and 0.8 m/s². The study used an electrodynamic shaker with a rigid seat made of wood as a test setup. The relative difference thresholds thus determined covered a range between 9.5% and 20.3%. Especially at the frequencies 2.5 Hz and 315 Hz, the results were dependent on the vibration amplitude. A significant effect of frequency was observed for lower and higher vibration amplitudes. Therefore, the approach according to Weber could not be applied for these boundary conditions.

1.3. Motivation

In the vibration design of vehicles, vehicle modifications during the vehicle development process are evaluated regarding the predefined comfort development objectives. Virtual and real prototypes are hence evaluated on whole-vehicle test benches (e.g., 4-poster), by using simplified substitute loads (e.g., harmonic excitation), among other things, to predict the vibration behaviour in real driving conditions. In addition to real road excitations, real prototypes are tested on special testing grounds that also consider harmonic short-wave excitations. In order to get an indication which vehicle modification could affect the discomfort behaviour the least for these special boundary conditions (harmonic excitation), it is necessary to understand the relationship between objectively calculable and measurable parameters, and the subjective perceptions. To evaluate these differences in the vibration of a vehicle, findings about difference thresholds determined for sinusoidal vibrations are advantageous and can consequently be considered as requisite minimum thresholds, acknowledging that the differences in vibration perceived by vehicle occupants in real driving conditions could significantly differ. The reasons for this are various: presence of vibrations at other frequencies, type of excitation (harmonic, transient, random), type of car seat, sensory inputs or cognitive effects, etc.
Regarding difference thresholds determined for sinusoidal vertical whole-body vibration, previous studies (see Section 1.2) investigated a broad range of frequencies and amplitudes, nevertheless, no findings have so far emerged regarding difference thresholds in the area of vehicle body movement (roughly up to 2 Hz). With regards to the sensitivity of a driver’s body in the range of approximately 6 Hz [16], only studies by Bellmann et al. [10,12] have so far furnished information about difference thresholds, though for an amplitude level close to the threshold of perception. As described in Section 1.1, the validity of Weber’s law was not ensured in this case. Consequently, an additional study of different amplitude levels was still missing for this elementary frequency.
Moreover, previous studies mainly showed investigations on the surfaces of plates of electrodynamic shakers (Matsumoto et al. [14]), rigid chairs (Bellmann et al. [10,11,12]) or ergonomically shaped wooden surfaces (Forta et al. [15]). In this way, test subjects assumed a posture clearly different from that in a vehicle. As VDI 2057-1 [16] states that the transmission of vibrations to the human body and their effect is a function of body posture, a test setup was selected for this study in which the test subjects were in a seating posture more comparable to that in a real vehicle.
This series of studies was therefore aimed at determining just-noticeable differences in vertical sinusoidal vibrations experienced by seated test subjects at the frequencies 1.3 Hz and 6.0 Hz, and at amplitudes from 0.2 m/s² to 1.2 m/s², relevant to ride comfort, investigating the effect of amplitude and frequency of vertical sinusoidal whole-body vibrations. As per the findings in a comparable previous study [15], it was hypothesised that the difference thresholds would depend on both amplitude and frequency of vibration.

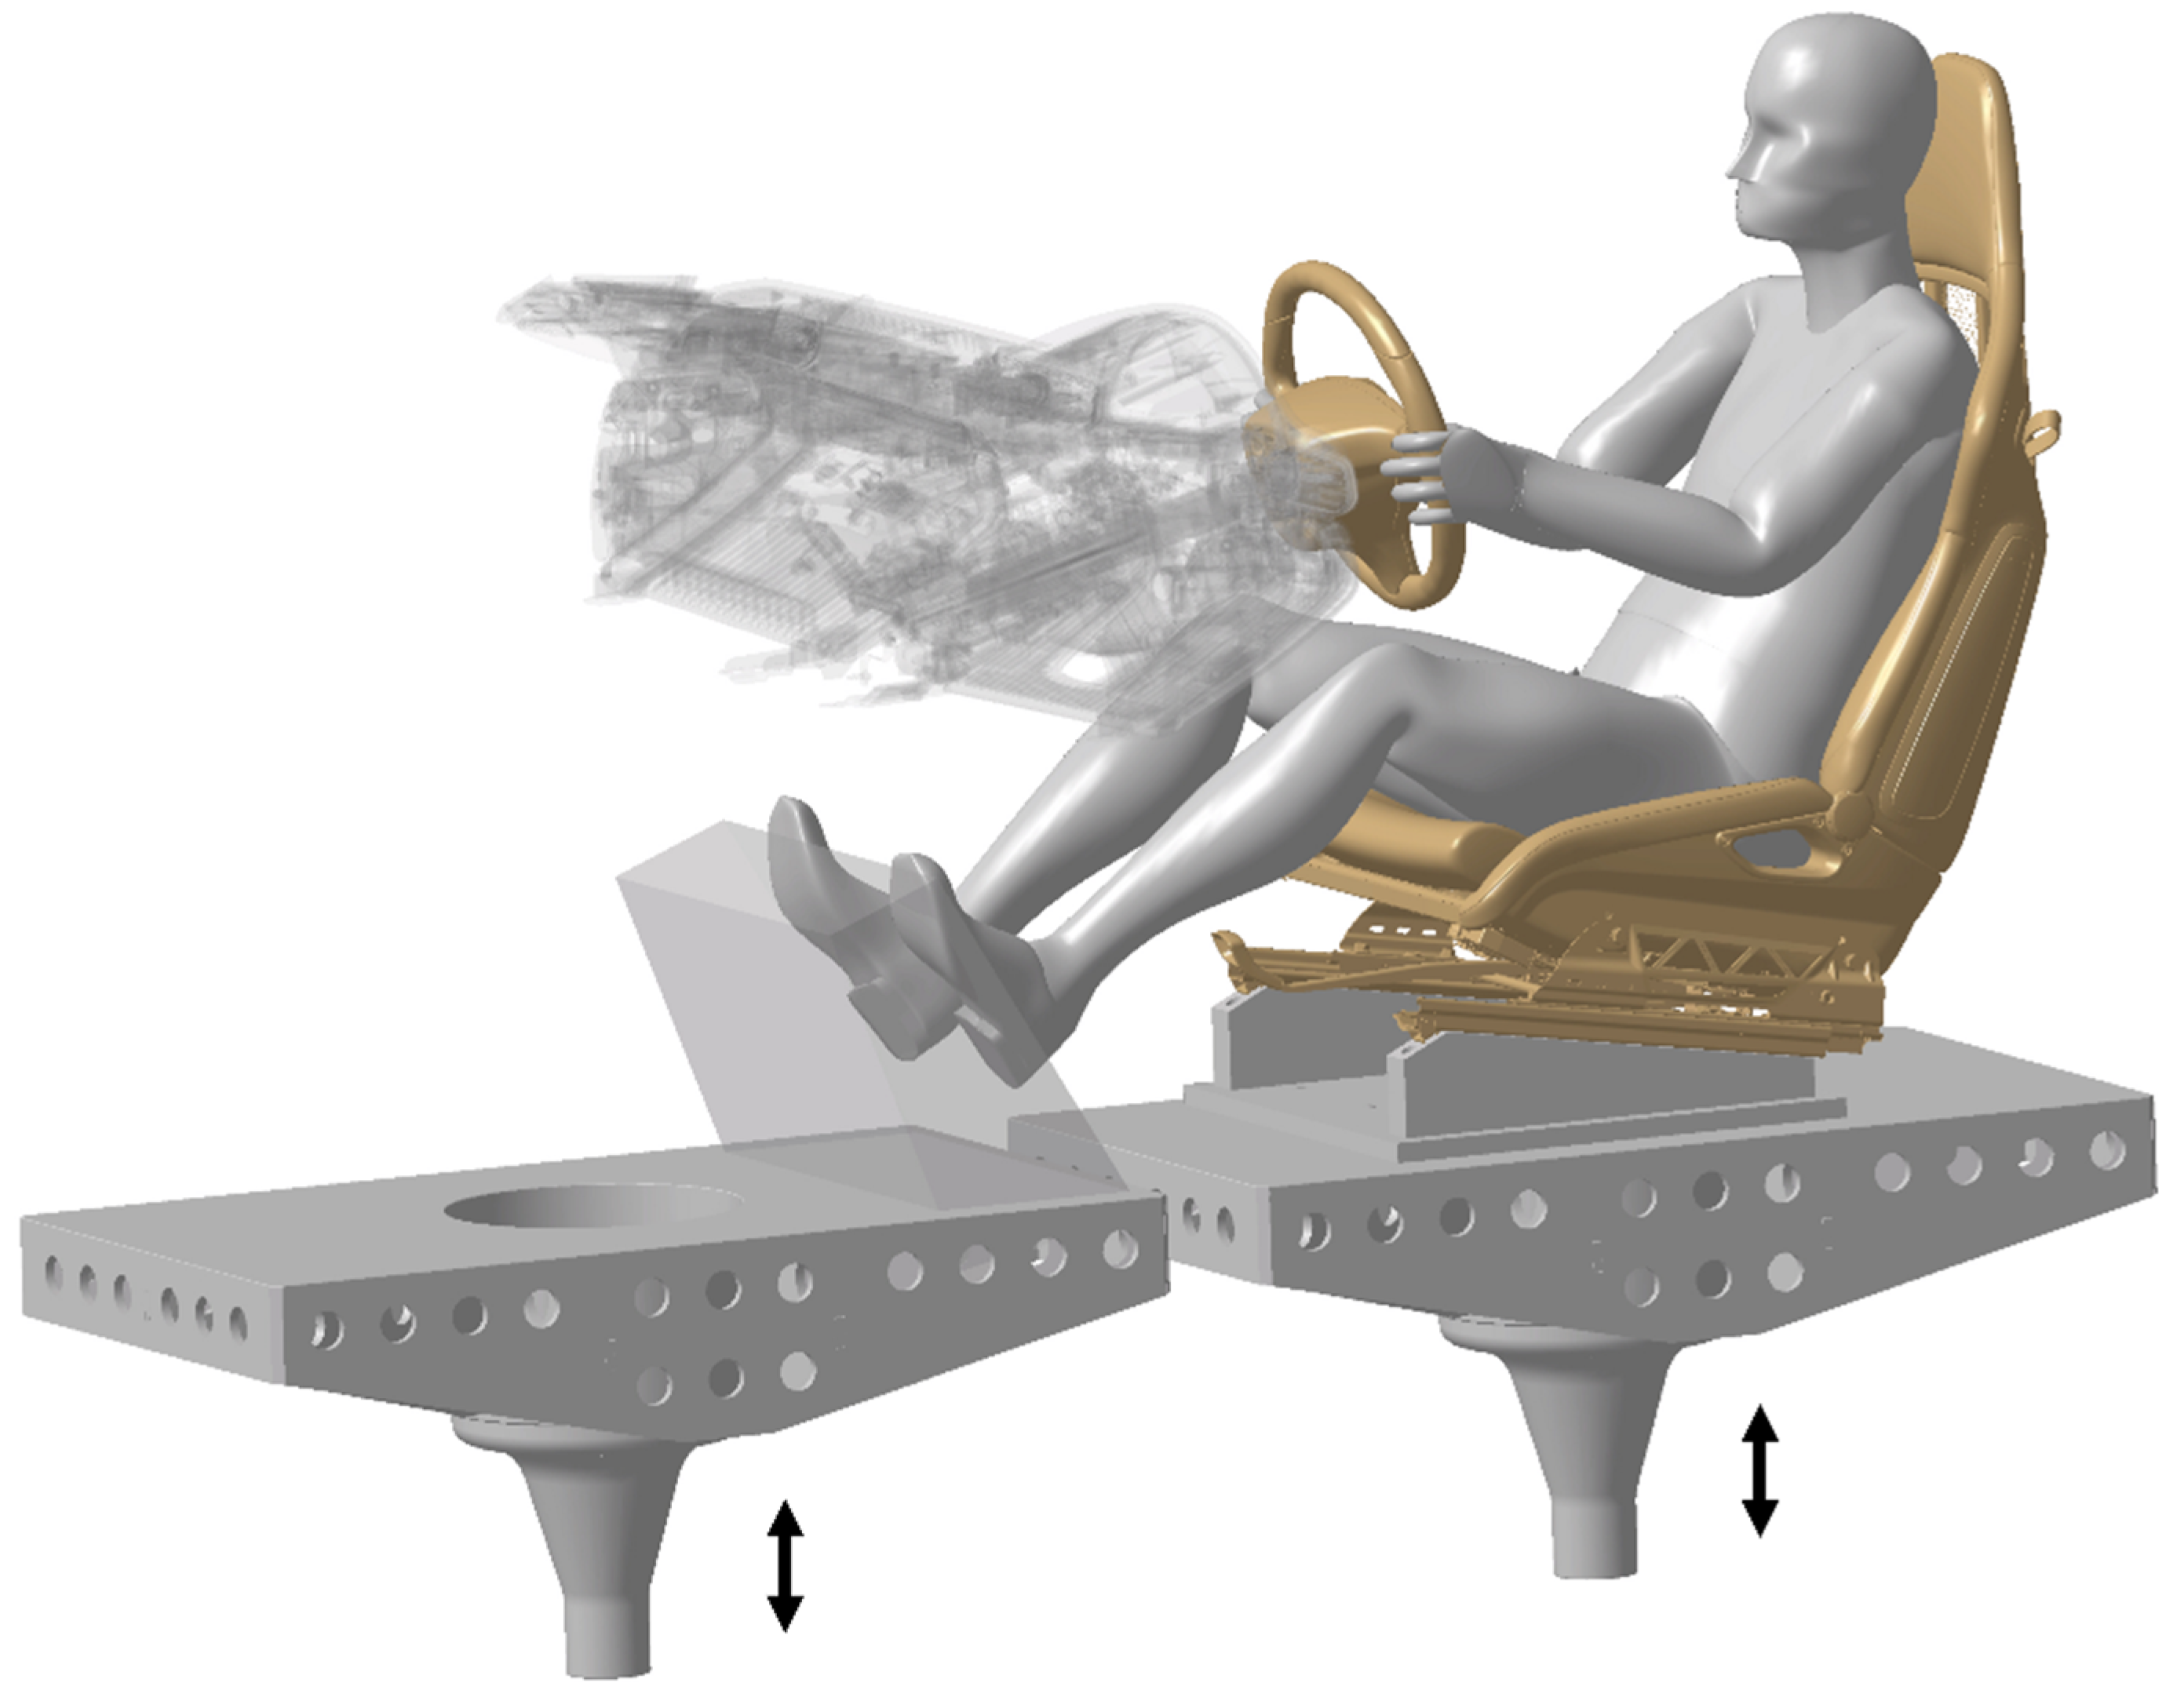
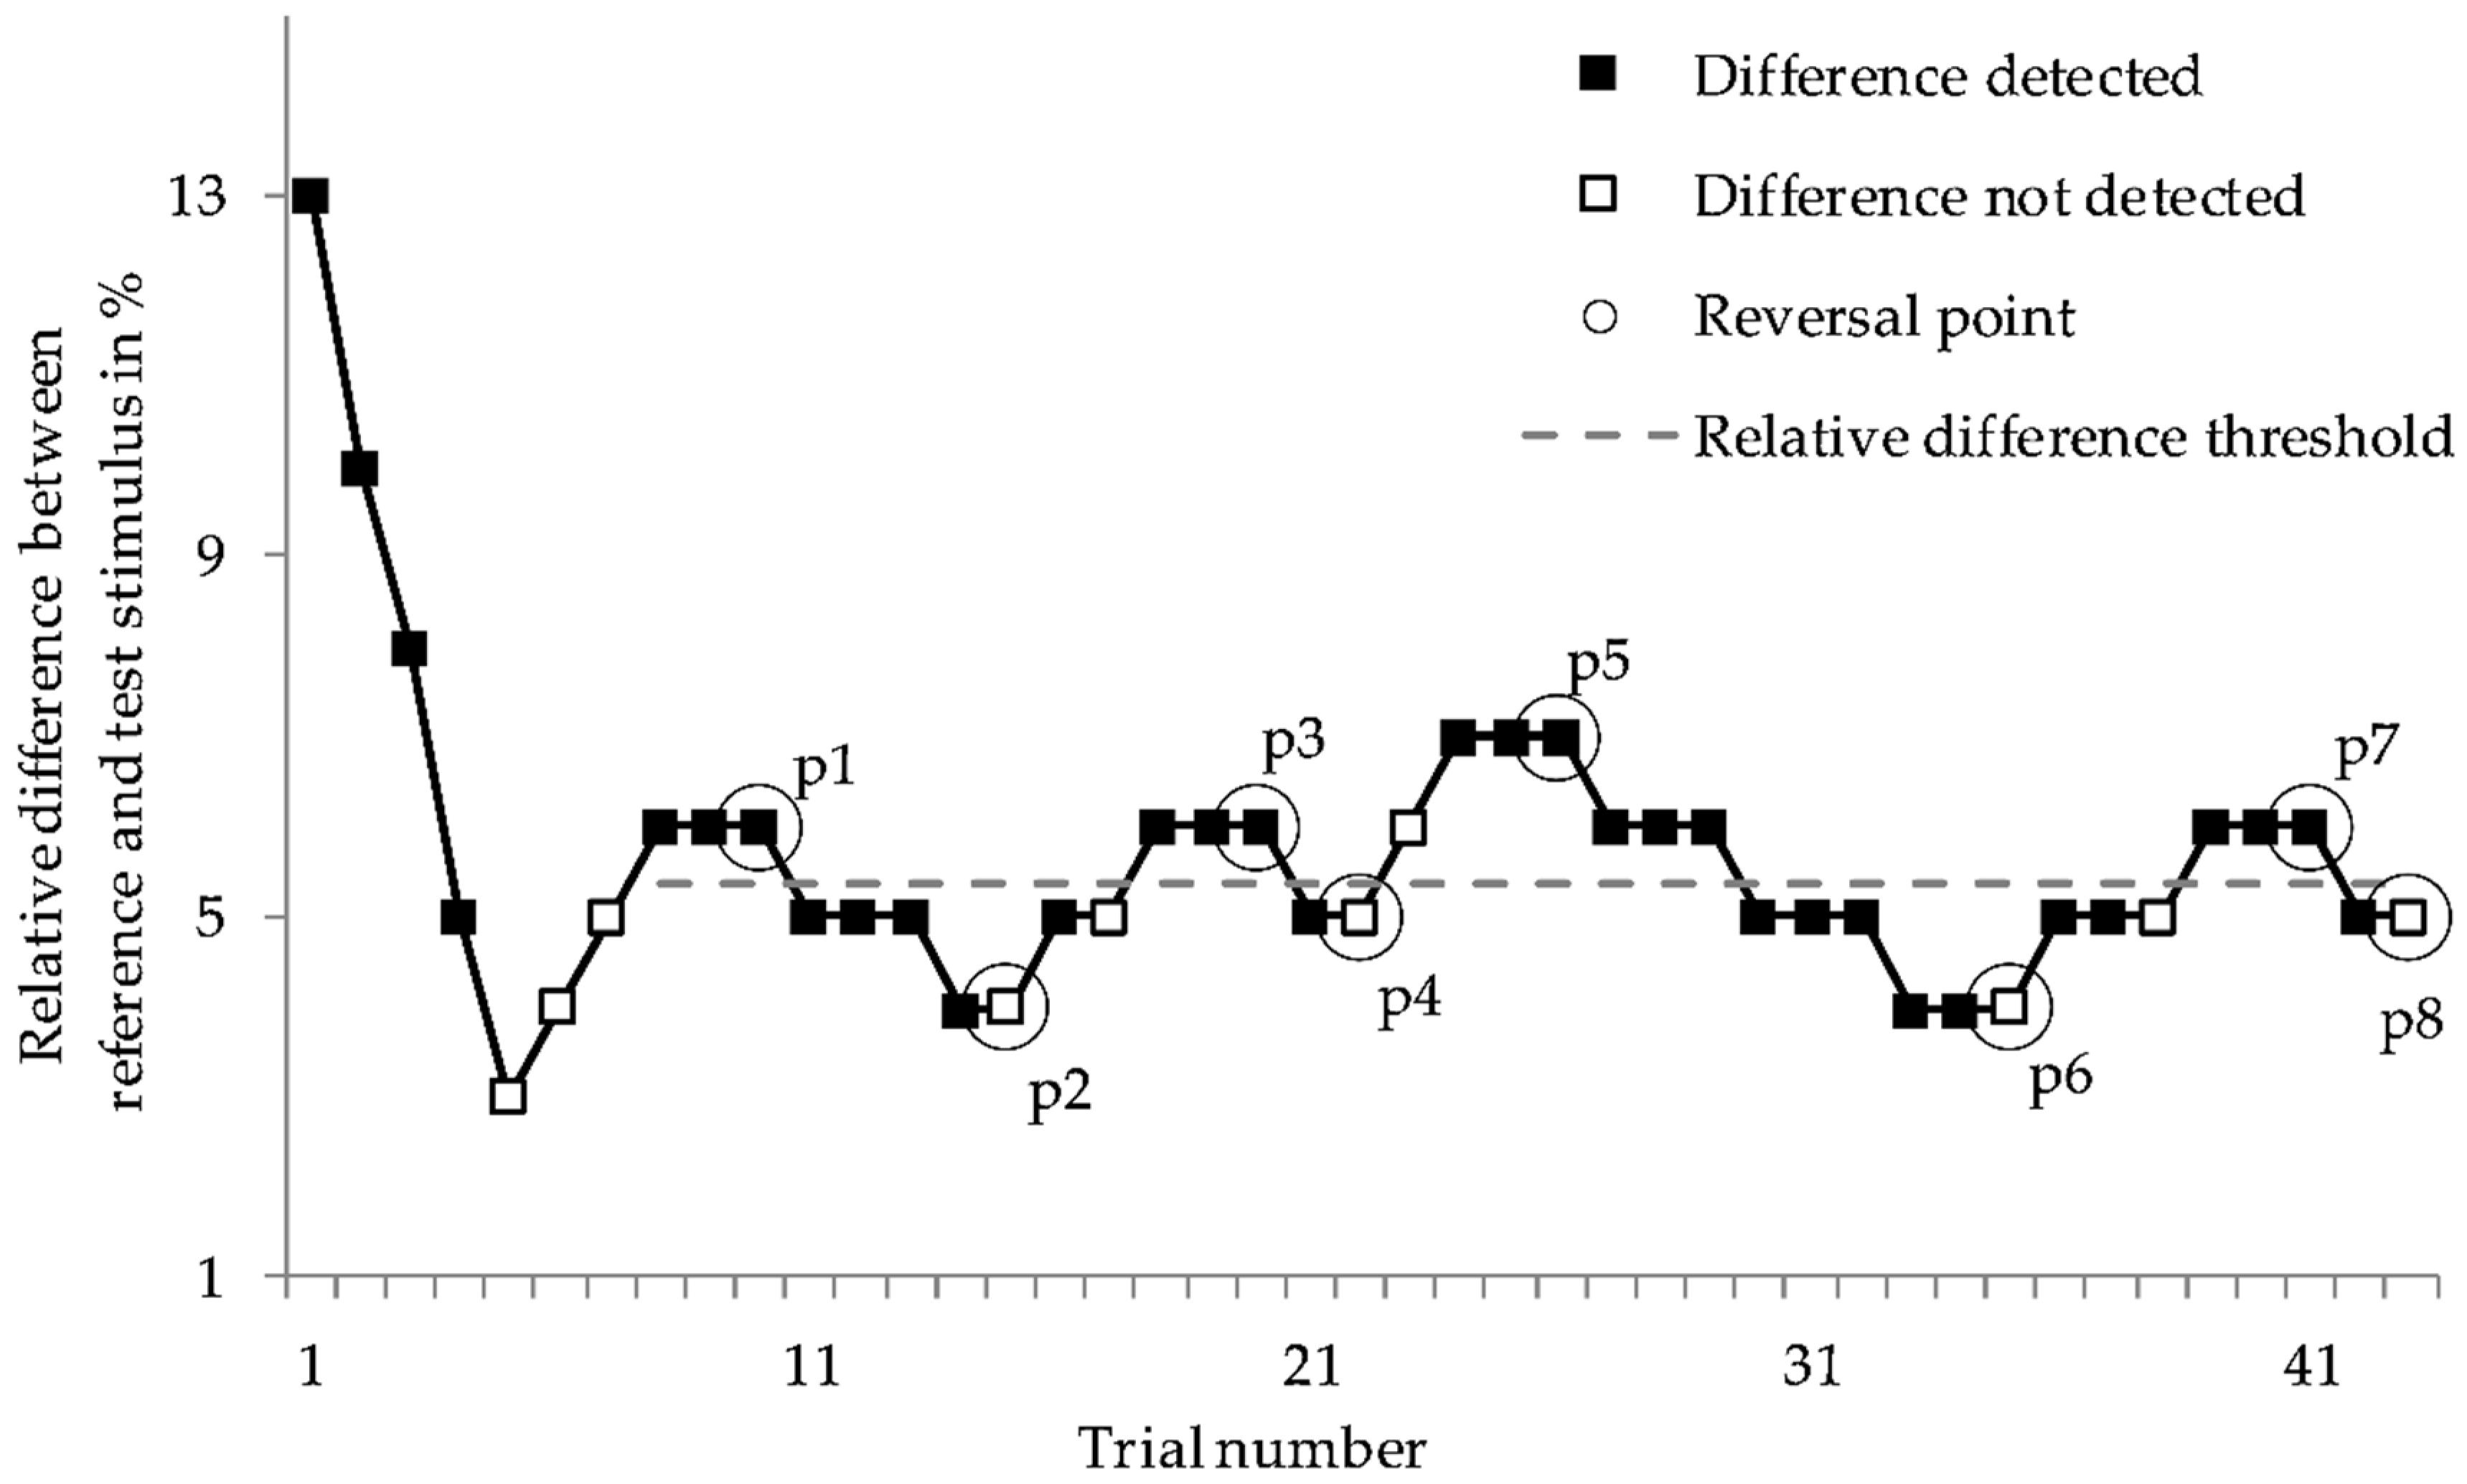
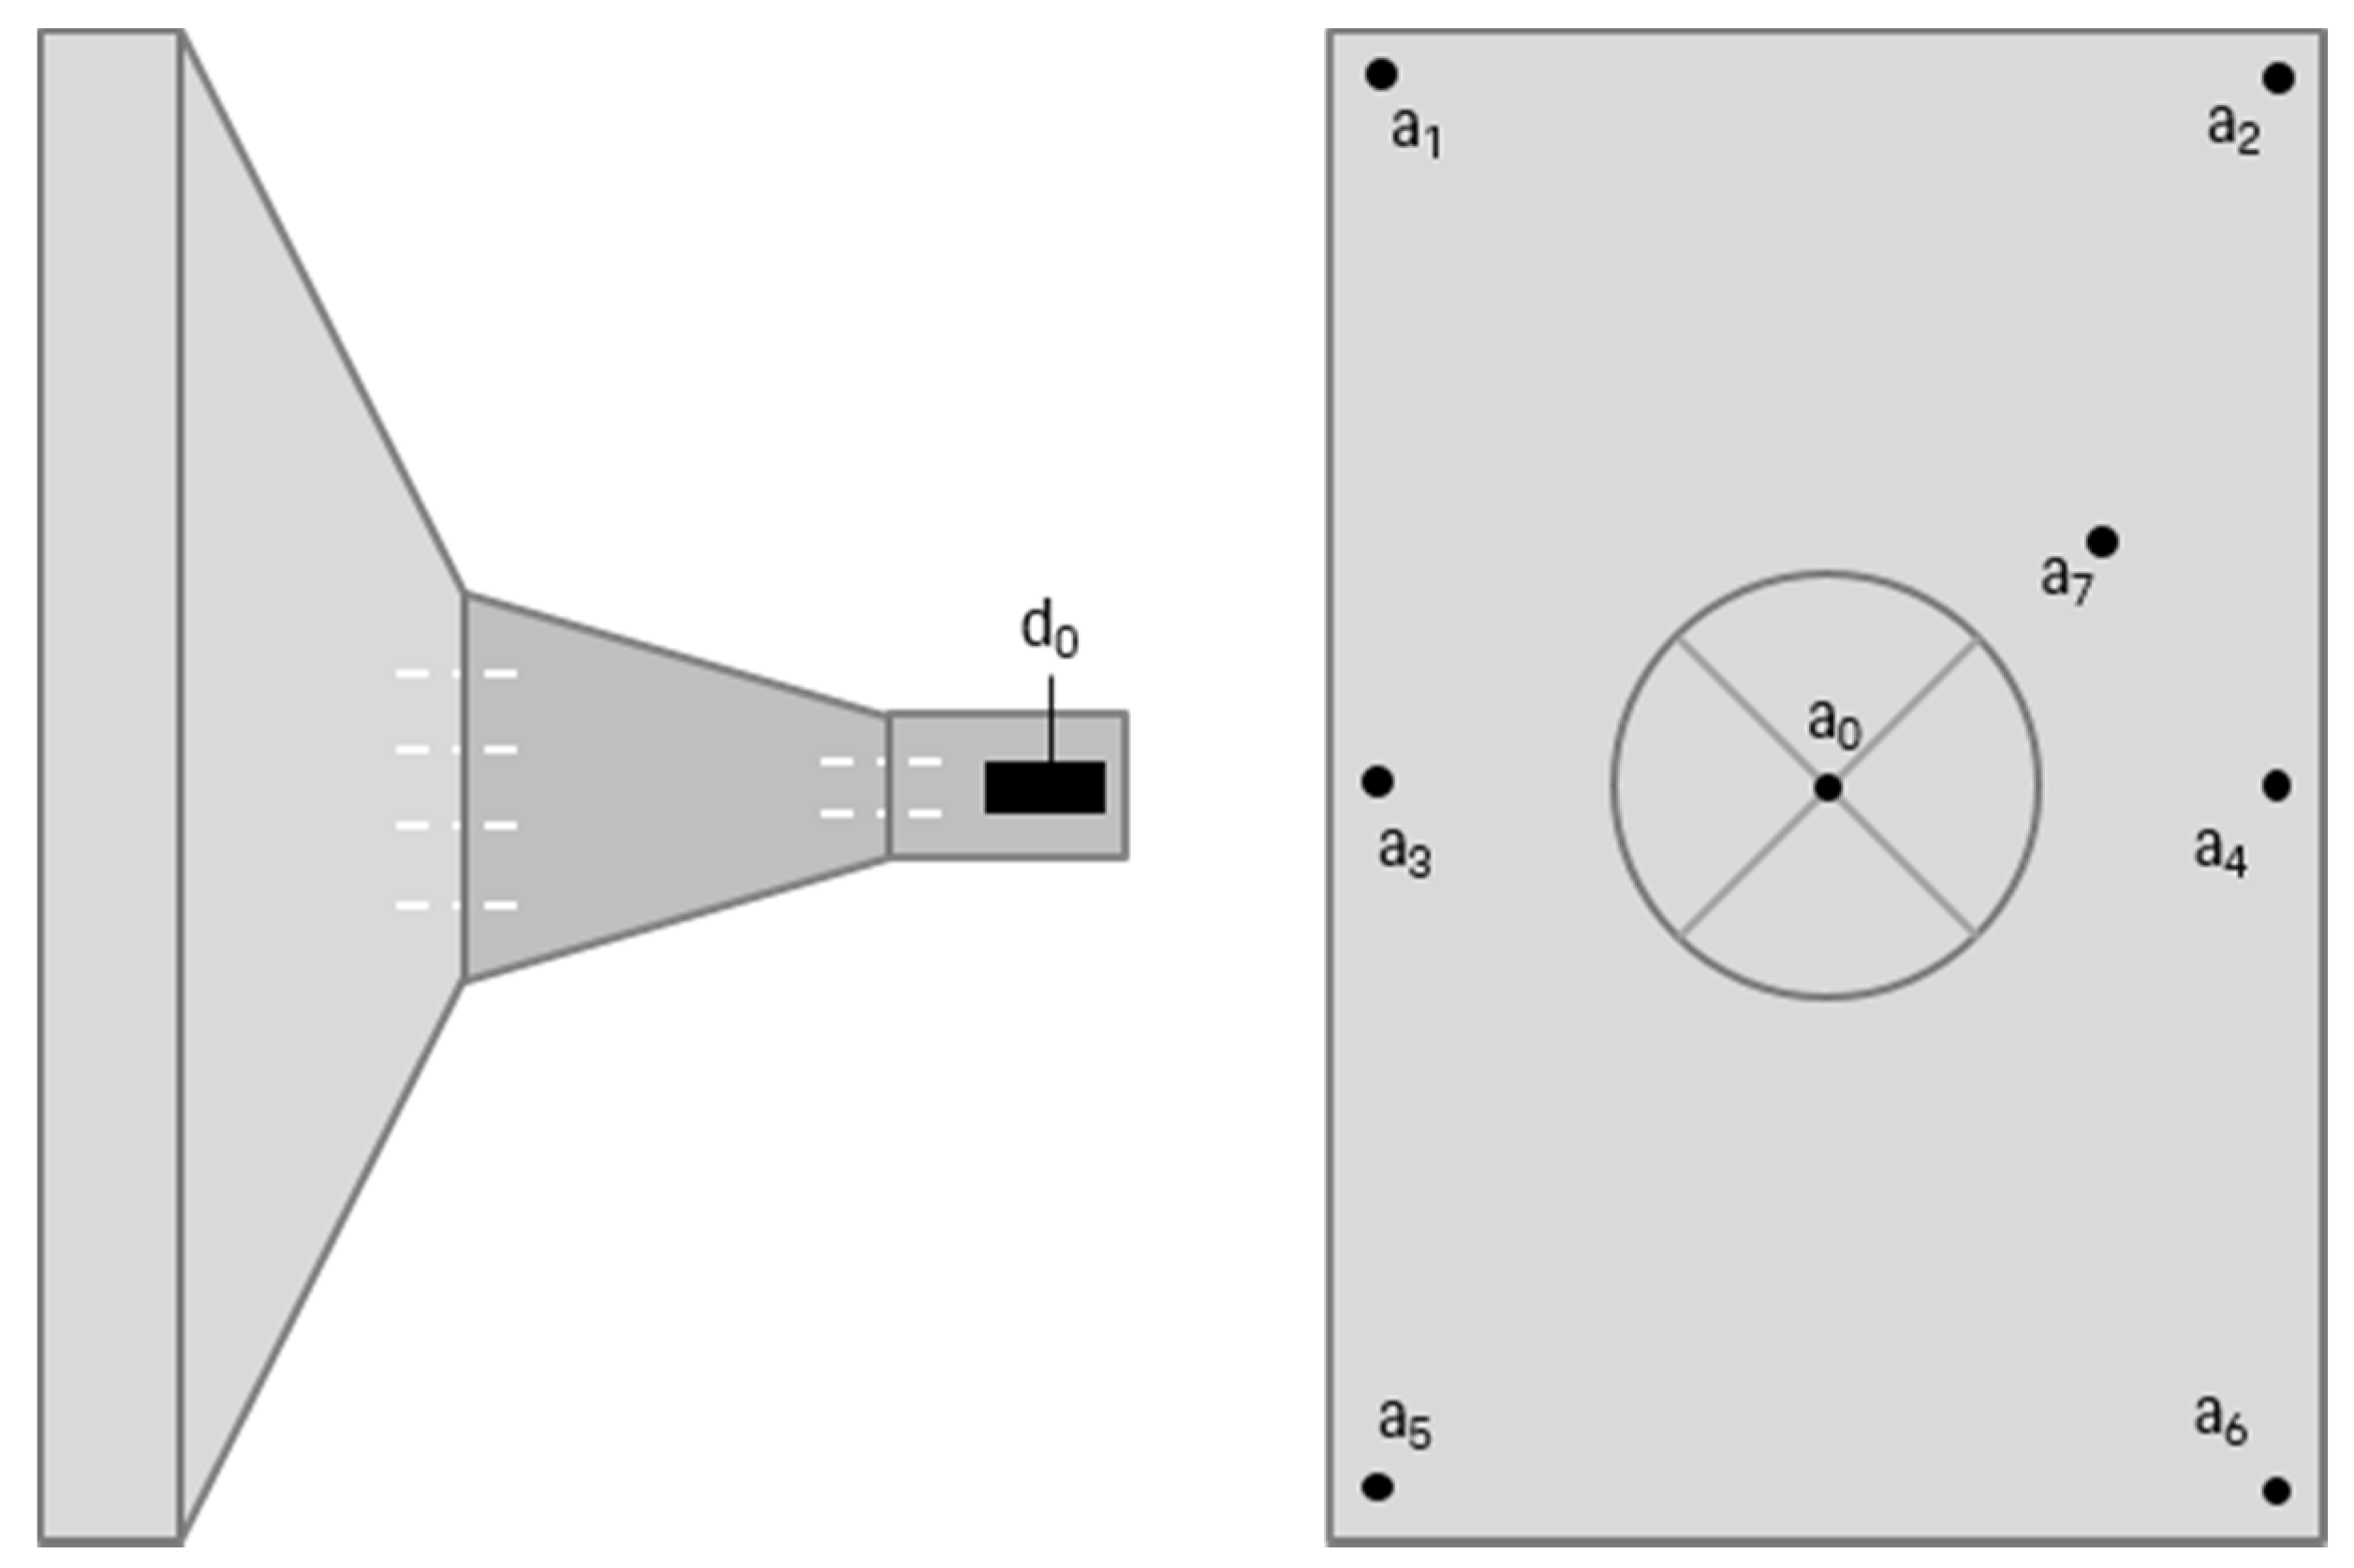
2. Test Environment and Methodology

Figure 1 shows a ride comfort simulator on which both real signals actually measured (ride on a rough road surface) and purely synthetic signals can be played.
Two vibrating platforms connected with separately controllable vertical z-axis servohydraulic cylinders model the comfort interfaces, i.e., seat and footwell. These cylinders were controlled and managed by means of the Remote Parameter Control process from the manufacturer MTS [17]. Moreover, an instrument panel complete with a steering wheel was utilised which was rigidly connected to the environment. The sports bucket seat (without seat cushion so as to subtract the influence of seat isolation) was made of fibreglass and carbon-reinforced polymer with a surface made of carbon. The amplitudes of vibrations observed on the platform were considered to be comparable due to its rigid body design. Moreover, the first eigenmode was located at frequencies greater than 30 Hz. Data were recorded with 6000 samples/s by means of the DataRec4 modules from the Heim Zodiac Company. Acceleration data from the test setup were acquired along the vibration transfer path from the center of the platform to the driver seat or the footrest, by means of acceleration sensors of the 4507B type (Brüel & Kjær). The associated vertical displacements of the oscillating platforms were recorded by means of induction-type displacement transducers (integrated system sensors), which were considered as reference sensors (see Figure A2 for a schematic overview of the sensor positions).
Difference thresholds were determined for sinusoidal vertical whole-body vibrations at the frequencies 1.3 Hz and 6.0 Hz, and for the vibration amplitudes (root mean square value, r.m.s.) 0.2 m/s², 0.5 m/s² and 1.2 m/s². For safety reasons, the amplitude of 1.2 m/s² was considered only at 6 Hz.
Those were determined employing a 2-interval-force choice (2 IFC) procedure and a transformed 1-up/3-down method for an adaptive step increment of up to 1% (r.m.s.). The resultant convergence level of the psychometric function was 79.4% [18] and was thus comparable to the procedures in [9] and in [15]. In addition, the guessing rate of the 2 IFC procedure was taken into account, which yielded to a modified detection probability level of 58.8% [19]. Figure 2 shows an example of the determination of relative difference threshold by the process described above.
After an accommodation phase (e.g., trial number 1–7, Figure 2), when three consecutive correct responses were given (e.g., trial number 8–10, Figure 2), the amplitudes were scaled back by one step increment. When an incorrect response was given, the amplitude was increased by one step (e.g., trial number 15, Figure 2). From the last eight reversal points the relative difference threshold (Weber fraction, Figure 2) was determined for each test subject as defined in Equation (2):
Relative   difference   threshold = i = 1 N = 8 ( T i R i R i ) · 1 N · 100
where N is the number of reversal points (i.e., 8), and Ti and Ri are the measured accelerations of the test and reference stimuli at the reversals, respectively. Reversal point p defines the peaks or troughs in subject responses (Figure 2).
In paired comparison, 14 test subjects (see B2 Appendix B for additional information) were presented a reference stimulus and a test stimulus in a random order, and were asked to identify the stimulus with the higher amplitude level (only the test stimulus was modified). The lengths of the reference and test stimuli, respectively, were designed for the duration of 4 s as used in [9] (Morioka and Griffin), with a rise and decay time of around one period. The interval between the reference and the test stimuli was 2 s in this study. The stimulus at 6 Hz was transmitted only through the seat-platform, and at 1.3 Hz through the seat-platform as well as through the footwell-platform (in-phase-motion, see B3 in Appendix B for additional information).
An acoustic signal (interior noise of a comfort vehicle) recorded on a real roadway was additionally played back (72 dB(A), Figure A3) through headphones (Sennheiser HD25) while the vibration was transmitted, on the one hand to mask test rig noise, and on the other hand, to model a real vehicle acoustic environment. The sound played back was independent of the vibration generated during the test. Other additional sensory inputs, like visual inputs, were not considered in this study.
The investigation was conducted in five sessions (=five stimuli) over a period of five days. Each experimental session took about 25 min; a test session with five trials included. All subjects were exposed to the five stimuli, however, a maximum of two sessions were run consecutively for each subject in one day to reduce fatigue-effects. A break of 5 min between the two sessions was thought out to recover the senses.

3. Results

For statistical evaluation (the software SPSS and G* Power were used for statistical analysis) of the data (at least one data set was not normally distributed, Shapiro–Wilk: p < 0.05), the Wilcoxon signed-rank test was selected. In paired comparisons, this test studied whether the central trends of the dependent data sets were different. As the number of paired comparisons increased, so did the probability of making a wrong decision (α-error cumulation). To compensate for the type I error inflation, the resultant significance level p of each paired comparison was adjusted by means of the Bonferroni procedure (padj = p × 6, number of paired comparisons = 6) in such a way that it was compared with the established significance level of α = 0.05. The approach according to Cohen [20] was taken into account in interpreting the effect size. For further information, see [21] (Bühner and Ziegler).

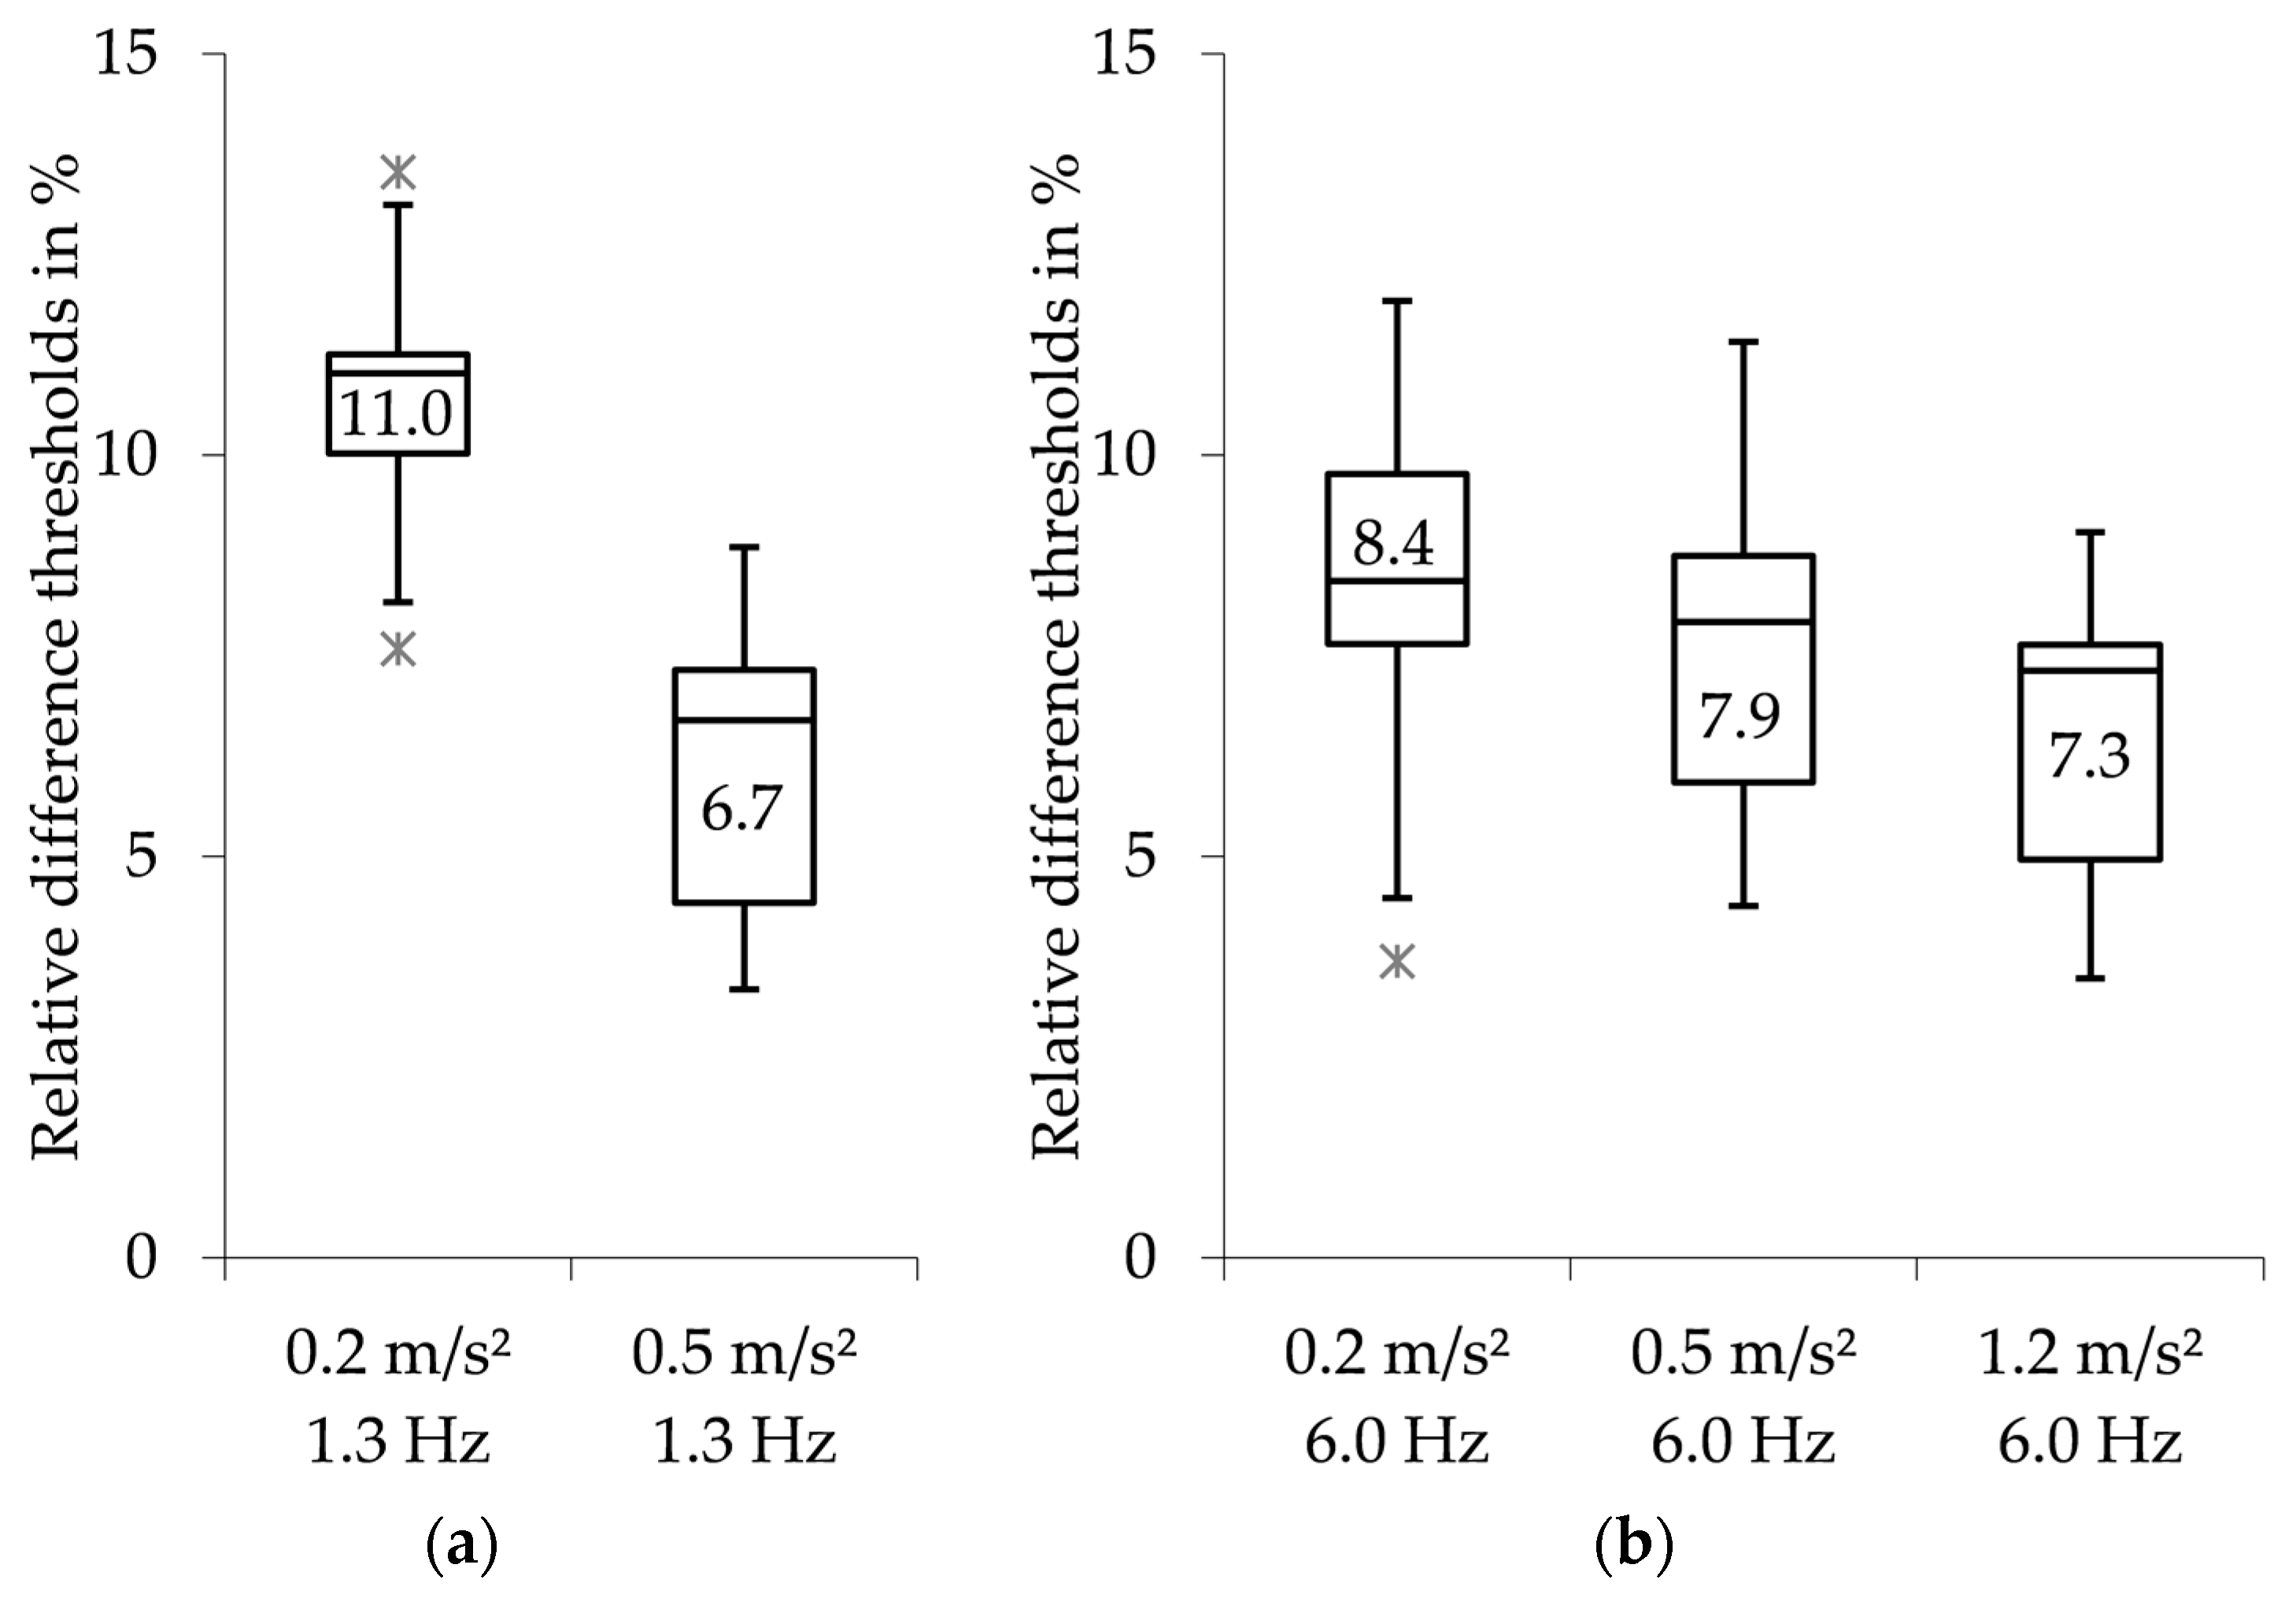
3.1. Effect of Amplitude

Figure 3a,b (box plot) show the relative difference thresholds determined (see Appendix ATable A2 for additional information), plotted against the amplitude for the frequencies of 1.3 Hz and 6.0 Hz. The median values varied between 6.7% and 11.0% at 1.3 Hz, and between 7.3% and 8.4% at 6.0 Hz. Table 2 shows the derived statistical parameters of the paired comparisons.
At 1.3 Hz (paired comparison 1, Table 2), the relative difference threshold was reduced significantly (p < 0.01) from 11.0% (0.2 m/s²) to 6.7% (0.5 m/s²), while the amplitude level rose. The resulting effect size according to Cohen [20] was >1.0, corresponding to a large effect.
At 6.0 Hz, successive increases in amplitude (0.2 m/s² → 0.5 m/s², as well as 0.5 m/s² → 1.2 m/s², (see Figure 3b)) exhibit a trend towards a reduction in relative difference thresholds, however, the difference is not significant (p > 0.05 for paired comparisons 2 and 3, Table 2). However, if there was a clear increase in amplitude (0.2 m/s² → 1.2 m/s², Figure 3b), the relative difference thresholds were significantly reduced, from 8.4% (0.2 m/s²) to 7.3% (1.2 m/s²), to a significant extent (p < 0.05, Table 2). The resulting effect size according to Cohen [20] was >0.8, corresponding to a large effect.

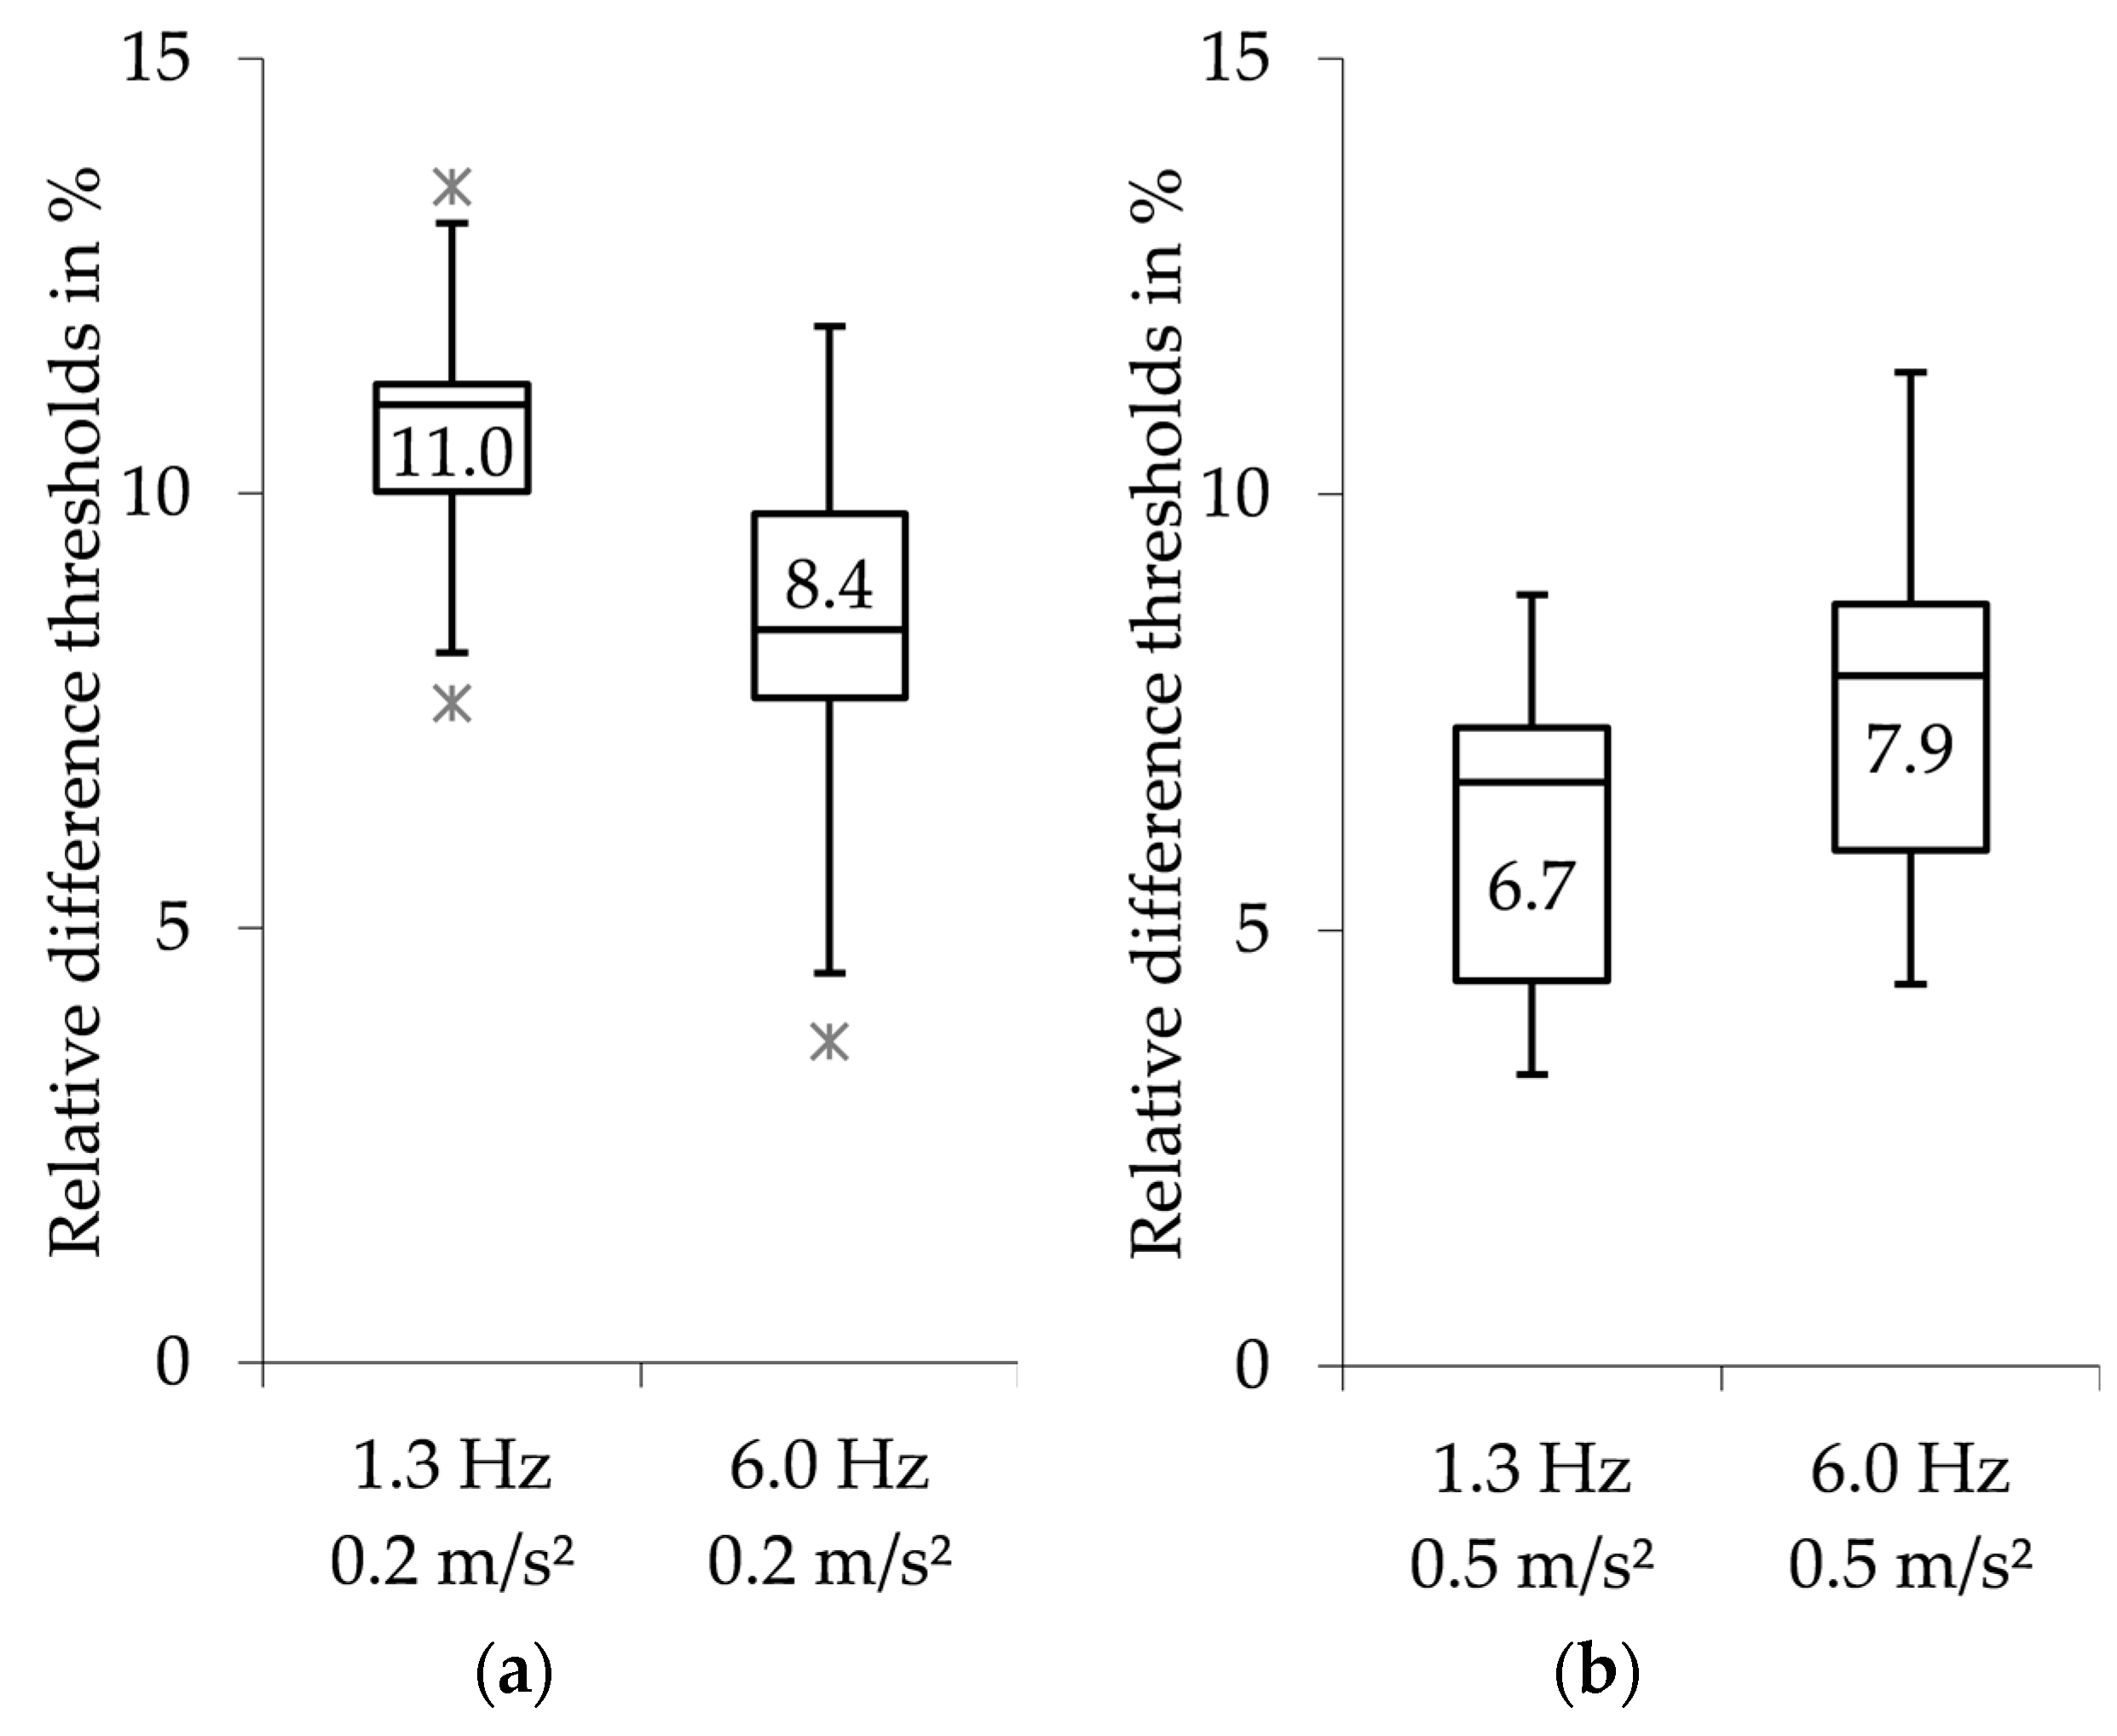
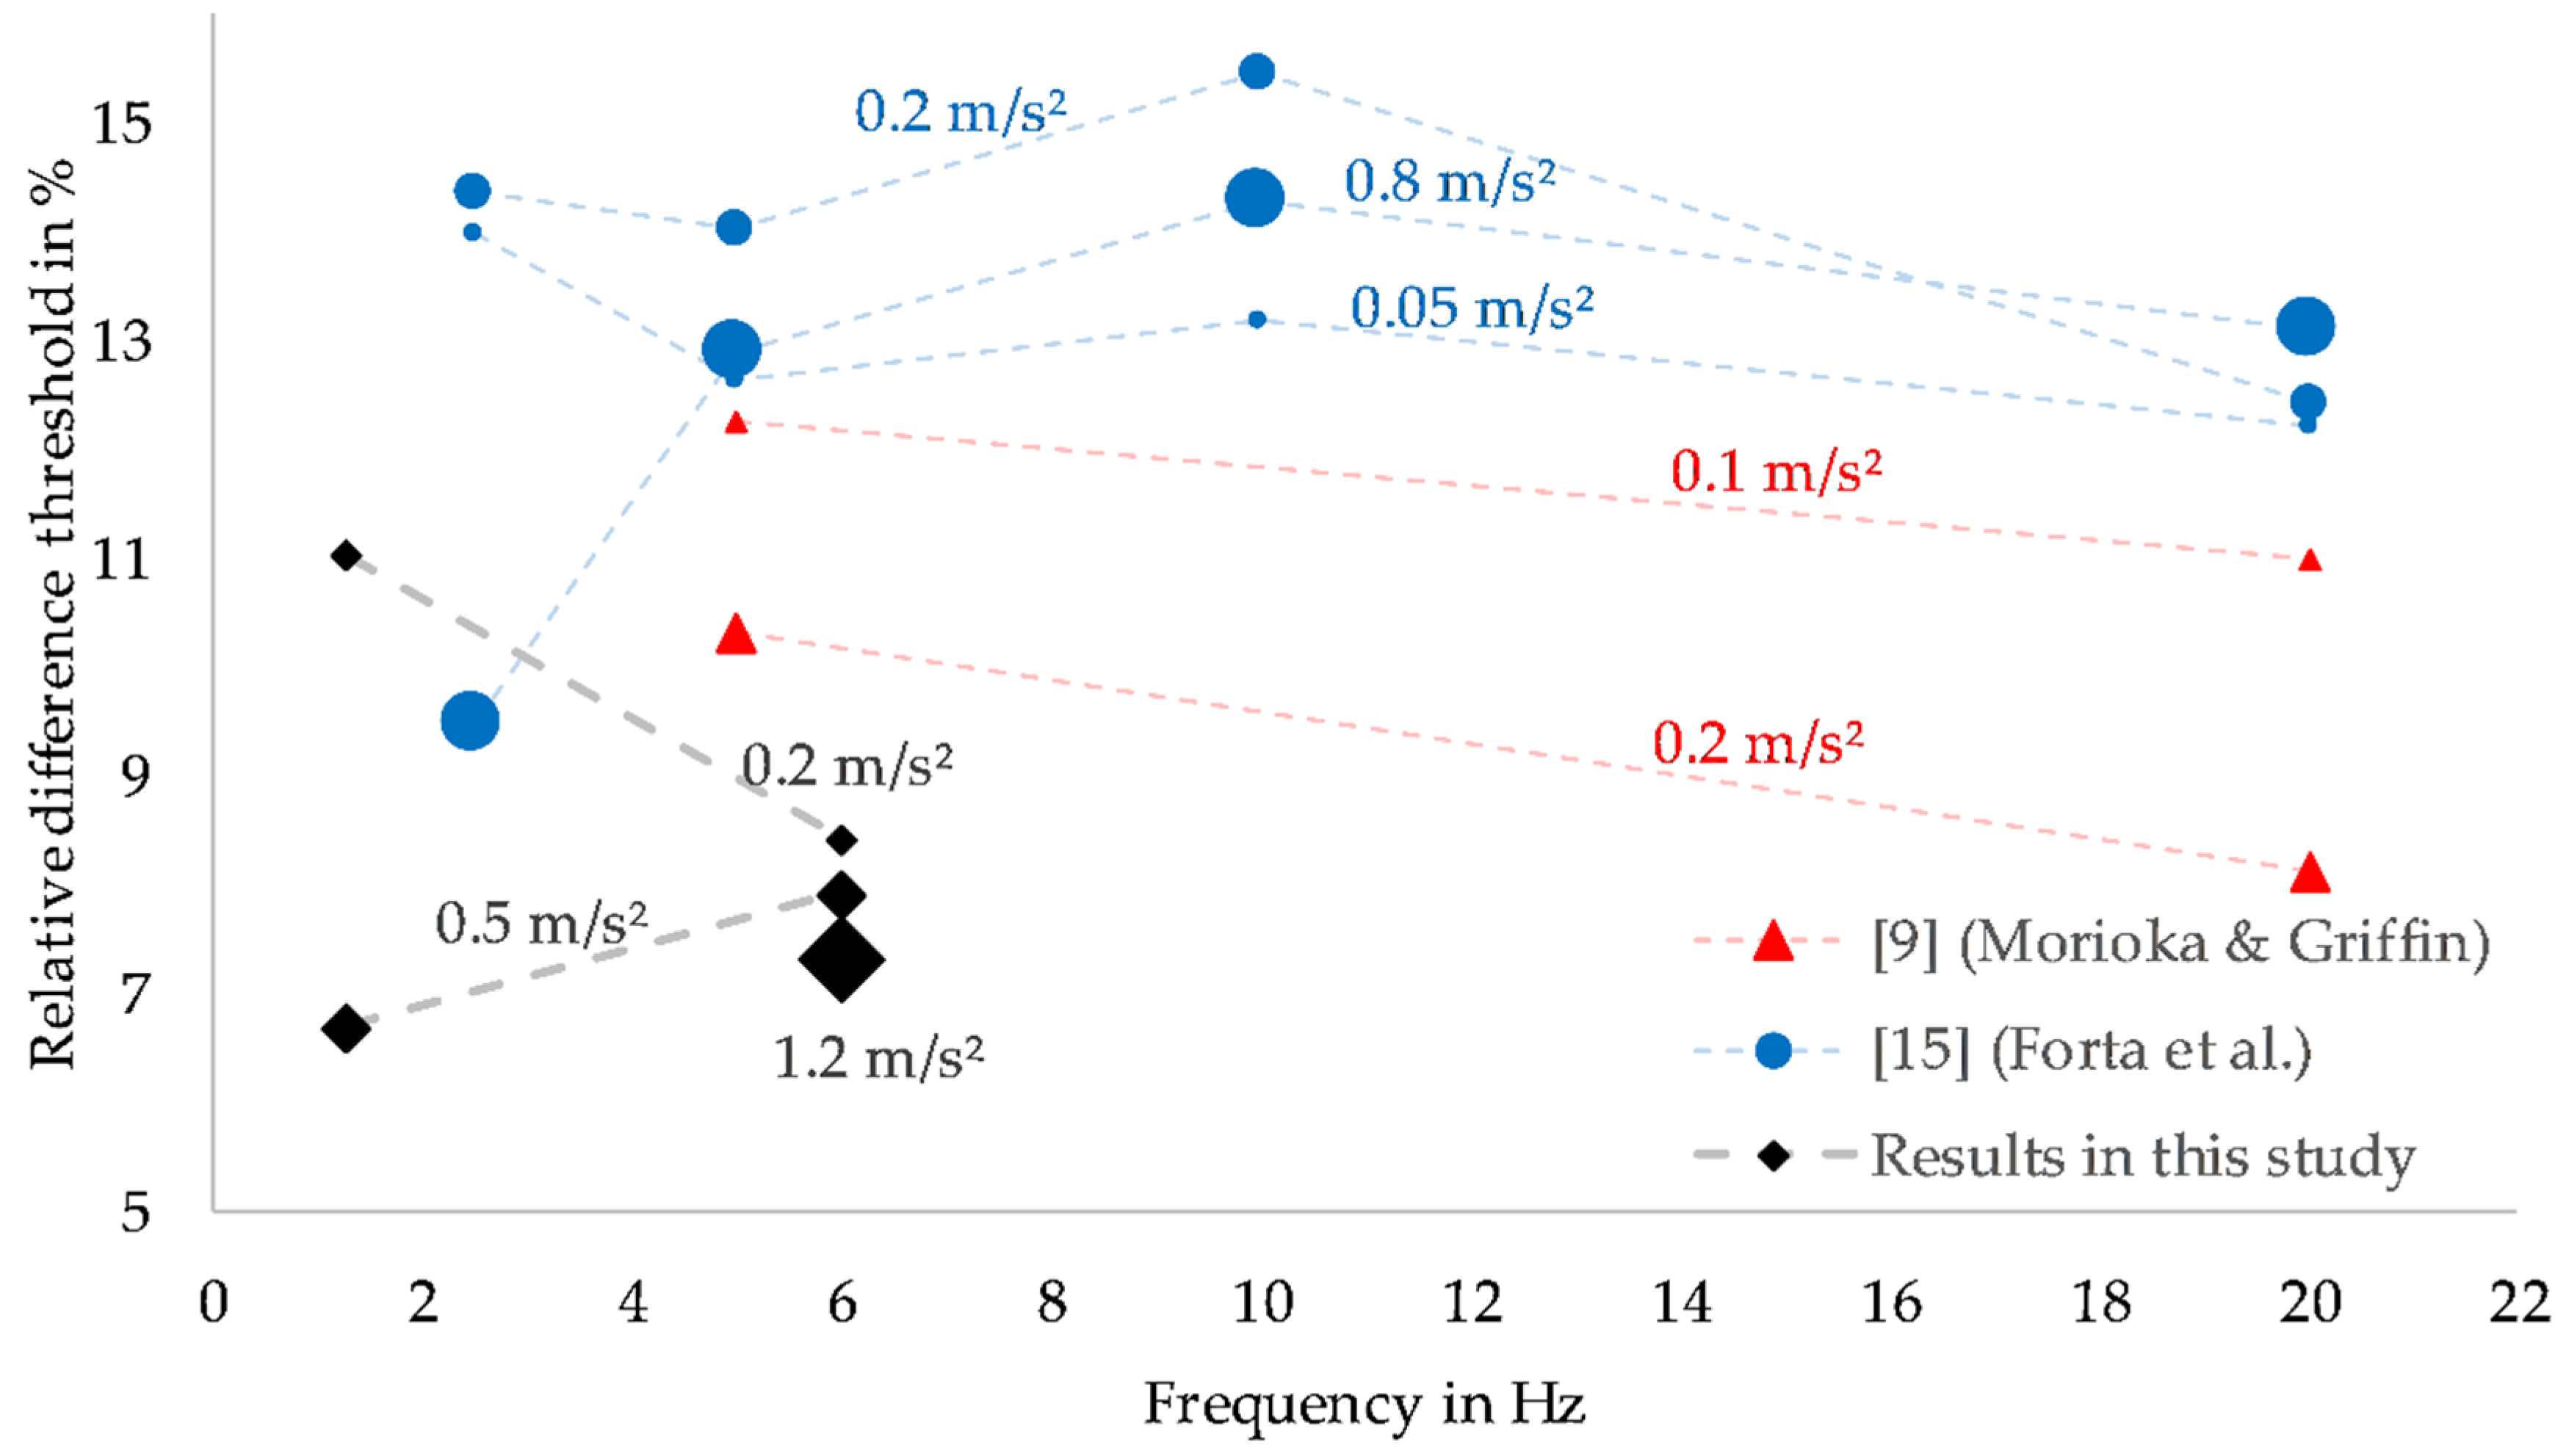
3.2. Effect of Frequency

Figure 4a,b (box plot) show the relative difference thresholds determined plotted over the frequency for the amplitude levels of 0.2 m/s² and 0.5 m/s². The median values varied between 11.0% and 8.4% at 0.2 m/s², and between 6.7% and 7.9% at 0.5 m/s². Table 3 shows the derived statistical parameters of the paired comparisons.
At 0.2 m/s², the relative difference threshold decreased significantly from 11.0% (1.3 Hz) to 8.4% (6.0 Hz), as the frequency increased. The resultant effect size according to Cohen [20] was >1.0, corresponding to a large effect (paired comparison 5, Table 3).
On the other hand, at 0.5 m/s² (Figure 4b), the relative difference threshold increased with frequency from 6.7% (1.3 Hz) to 7.9% (6 Hz), however, the difference is not significant (p > 0.05, Table 3).

4. Discussion

In the following section, the results of this study are discussed and compared with results of previous studies (see Table 1).
Bellmann et al. [10,11,12] investigated relative difference thresholds in the perception threshold range at 0.063 m/s², for frequencies between 5 Hz and 80 Hz. Baumann et al. [13] extended those studies by additional investigations at an amplitude level of 0.1 m/s². The relative difference thresholds were in the range between 19% and 20%, showing a standard deviation of approximately 6% (0.5 dB).
Bellmann et al. [10,11,12] explained these deviations from the results in [9] (Morioka and Griffin) by the different procedures of threshold determination. In their case, the procedure converged in a 70.7% level of a psychometric function, and not, as in [9] (Morioka & Griffin), [15] (Forta et al.), and this investigation too, a 79.4% level. A further view (see B4 Appendix B) of that matter showed corrected (without taking into account the lapsus rate) probabilities (convergence level) of 58.8% in a 2 AFC test, and 56.1% in a 3 AFC test. Hence, it was not possible to explain the differences between Morioka and Griffin [9] and Forta et al. [15], relative to Bellmann et al. [10,11,12] and Baumann et al. [13], as being due to different methodological approaches, as the different possible replies (2 AFC and 3 AFC, respectively) made the two rectified convergence levels comparable.
On the other hand, Forta et al. [15] explained the difference relative to Bellmann et al. [10,11,12] via their test setup. The test subjects in [10,11,12] (Bellmann et al.) experienced vibrations on a rigid chair made of wood. The feet and parts of the back were subjected to additional excitation. Under these conditions, a more sensitive perception (or change in perception, respectively), due to a larger contact area of the skin, could be expected, but the results by Bellmann et al. [10,11,12] and Baumann et al. [13] portrayed the opposite characteristics. Therefore, any influence of the test setup remains questionable, and could be investigated in further studies.
However, there may be another decisive parameter influencing threshold levels, namely the choice of suitable increment steps (resolution) of the stimuli produced. Bellmann et al. and Baumann et al., in [10,11,12,13], used an increment step of 0.5 dB (5.9%) and, unlike Morioka and Griffin [9] and Forta et al. [15], an increment step of 0.25 dB (2.9%), larger by a factor of two. True, larger increment steps cause the procedure to occur within a foreseeable time frame, but this makes the quality of the results suffer. This aspect therefore could explain the greater variance in data sets and, consequently, the higher relative difference thresholds in general.
The lowest relative difference thresholds, of 5.2% to 6.5% (0.7 m/s²), were determined by Matsumoto et al. [14]. The general differences relative to previous studies, and the results outlined in Section 3, could be explained by an alternative method of threshold determination. That study used the “method of limits” procedure, which was referenced to a 50% level of a psychometric function.
Morioka and Griffin [9] determined difference thresholds in the range between 8.1% and 12.3% for the frequencies 5 Hz and 20 Hz, and the amplitude levels 0.1 m/s² and 0.5 m/s² (Figure 5). These results were not significantly different in direct comparison. Therefore, median relative difference thresholds of about 10% have been derived by [9].
Forta et al. [15] stated relative difference thresholds for the amplitude levels 0.05 m/s², 0.2 m/s² and 0.8 m/s², and for frequencies between 2.5 Hz and 315 Hz. The determined median relative thresholds seemed to be dependent on the frequency at the lowest and highest amplitude. In addition, they were dependent on the amplitude at the lowest and highest frequencies. However, the results were “broadly similar to those obtained with more restricted ranges of vibration frequency and magnitude” [15], and hence comparable with the results by Morioka and Griffin [9].
The relative difference thresholds determined within this study at 6 Hz (see Section 3.1) showed slightly lower levels than the relative difference thresholds studied by Morioka and Griffin [9] and Forta et al. [15] at 5 Hz (Figure 5). This fact could be attributed to the increment steps used in the threshold determination process. Large increment steps (= low resolution) resulted in the inability to determine precisely any thresholds. This may explain the slightly higher relative difference thresholds in [9] and [15] (increment step = 2.92%), compared to this study (increment step = 1%). Another factor could be the different seating condition used in this study. Due to a larger contact area of skin, subjects could be more sensitive to changes in perception. Regarding the different test subjects, this may be another factor that caused the different thresholds determined in Section 3. Furthermore, in this study, the recorded interior noise from a comfortable vehicle when crossing a section of rough road surface was played back to the subjects, and not a white noise, as used in previous studies [9,15]. This different frequency characteristic could be a further factor that may have influenced determination of vibration thresholds. Experimental work by Stamm et al. [22] or Merchel et al. [23] referred to this aspect, or rather to an interaction between vibration and acoustics, as underpinning the thesis described above.
The studies conducted at 6 Hz (see Section 3.1) indicated relative difference thresholds between 7.3% and 8.4%. Raising the amplitude level resulted in a significant difference, from a statistical point of view (Table 2), but this was negligible from a practical point of view, because of the slight difference of 1.1% (difference between 8.4% and 7.3%). On account of this, a relative difference threshold of about 8% (mean value, averaging the relative difference thresholds from Section 3.1 at 6 Hz) for vibrations at 6 Hz can be considered as the requisite minimum threshold for specific applications in vehicle development processes.
The relative difference thresholds determined at 1.3 Hz (see Section 3.1) were dependent on the vibration amplitude. Raising the amplitude level from 0.2 m/s² to 0.5 m/s² reduced the median relative difference threshold significantly, from 11.0% to 6.7% (Table 2). The approach according to Weber therefore cannot be applied to this comparison. The studies by Forta et al. [15] also exhibited this characteristic at a frequency of 2.5 Hz. In that investigation, the median relative difference threshold was reduced significantly to 9.5%, with an increase in amplitude level from 0.2 m/s² to 0.8 m/s².
Considering the results of [9,15], the conclusion must be that the approach according to Weber is tenable for frequencies relevant to vibration-induced discomfort above 5 Hz only, for a mean vibration amplitude (e.g., 0.1 m/s² and 0.5 m/s² in [9]; 0.05 m/s² and 0.2 m/s² in [15], and 0.2 m/s² and 0.5 m/s² in this study). However, this approach does not work for frequencies relevant to vehicle body movements at ≤2.5 Hz (considering the results of [15]). Possible reasons may be found in regard to different human sensory organs (receptors), which are relevant to human perceptions of vibration.
Jones and Ledermann [7] showed that mechanical receptors have individual ranges of sensitivity. For instance, the Merkel sensory cell has a sensitivity range of up to 3 Hz, while the Meissner sensory cell has a sensitivity range above 3 Hz. Moreover, Valko et al. [24] showed the dominant participation in perception of the vestibular system, for vibrations in the frequency range <2 Hz.
The significant, important dependence on amplitude observed at 1.3 Hz (Table 2, paired comparison 1) can thus be explained in the results discussed by Valko et al. [24] by the additional sensitivity of the vestibular system. It is to be assumed that the perceptive activity of the vestibular system can be ensured only by an excitation amplitude of sufficient (see B5 in Appendix B for additional information) magnitude, and information about that excitation is transmitted only from that point on. In particular, vibrations of the vehicle body can meet the boundary conditions described above as a result of high motion amplitudes.
Moreover, a change in frequency from 1.3 Hz to 6.0 Hz, at a low amplitude level of 0.2 m/s², also results in a significant reduction of the relative difference threshold (Table 3, paired comparison 5). In principle, this could be explained by the fact that, for the frequency range under study, different (mechanical) receptors make different contributions to overall perception. Experimental work by Gescheider et al. [25,26] referred to this aspect, conforming to the thesis described above.

5. Summary and Conclusions

Relative difference thresholds for the frequencies 1.3 Hz and 6.0 Hz were determined for amplitude levels of vibration 0.2 m/s², 0.5 m/s² and 1.2 m/s², on the basis of 14 subjects. It was observed that median relative difference thresholds determined at 1.3 Hz (see Section 3.1) were dependent on the vibration amplitude. Raising the vibration amplitude from a lower to a higher amplitude reduced the median relative difference threshold significantly, from 11.0% to 6.7%. Consequently, the vibration experienced for an amplitude of 0.5 m/s² at 1.3 Hz, which also belongs to the frequency range relevant to vehicle body movements, required a reduction of the reference stimulus by at least 6.7%, in order to perceive lower vibration-discomfort. Furthermore, it was proved that a vibration acceleration of 0.2 m/s² at 1.3 Hz required changes of at least 11.0% if a difference was to be subjectively perceived.
At the frequency of 6 Hz, which also belongs to the frequency range sensitive to the human whole-body vibrations (VDI 2057-1 [16]), a relative difference threshold of about 8% can be applicable to the stimuli used in this study.
Fundamentally, it must be stated that, as per the findings in comparable previous studies [9,15] and the results of this study, the approach according to Weber can be argued for as it pertains to a frequency range related to ride comfort (up to 30 Hz) beyond 5 Hz only, for a mean vibration amplitude.

Author Contributions

Conceptualization, M.F. and F.G.; methodology, M.F.; software, M.F.; validation, M.F., T.D. and M.L.; formal analysis, M.F.; investigation, M.F.; writing—original draft preparation, M.F.; writing—review and editing, T.D., M.L. and F.G.; visualization, M.F.; supervision, F.G.; project administration, M.F.; All authors have read and agreed to the published version of the manuscript.

Funding

This research was funded by Dr. Ing. H.c. F. Porsche AG within a cooperative project with Karlsruhe Institute of Technology (KIT), Institute of Vehicle System Technology.

Acknowledgments

We acknowledge the support by the KIT-Publication Fund of the Karlsruhe Institute of Technology. We are grateful to the NVH-Department of Dr. Ing. H.c. F. Porsche AG for supporting this work in collaboration with the Institute of Vehicle System Technology of the Karlsruhe Institute of Technology (KIT). The authors thank Mr. A. Winandi from the Karlsruhe Institute of Technology for valuable input regarding data analysis, and the staff of International Communication from the Karlsruhe Institute of Technology for their support in editing the English version of the manuscript.

Conflicts of Interest

The authors declare no conflict of interest. M.F., T.D. and M.L. are from Dr. Ing. h.c. F. Porsche AG, the company had no role in the design of the study; in the collection, analyses, or interpretation of data; in the writing of the manuscript, and in the decision to publish the results.

Appendix A. Diagrams and Tables

Figure A1. Typical plot of psychometric function.
Vibration 03 00010 g0a1
Figure A2. Schematic overview of the sensor positions (displacement d0, acceleration ax).
Vibration 03 00010 g0a2
Figure A3. Characteristic of the acoustic signal played back to the subjects (extract).
Vibration 03 00010 g0a3
Table A1. List of vibration receptors and their classification [8].
Sensory CellsResponse to Optimum Frequency RangeOccurring in Skin Layer
Merkel cellpressure0.3–5 HzUpper skin layer
Meissner cellSlight contact
(speed)
3–40 HzMiddle skin layer
Ruffini cellStretching of skin
(speed)
14–400 HzMiddle skin layer
Paccini cellFast vibrations
(acceleration)
40–500 HzLower skin layer
Table A2. Overview of relative difference thresholds determined in this study (%).
Frequency1.3 Hz1.3 Hz6 Hz6 Hz6 Hz
Amplitude0.2 m/s²0.5 m/s²0.2 m/s²0.5 m/s²1.2 m/s²
Mean10.76.28.47.66.5
Standard deviation1.51.92.21.91.9
Median value11.06.78.47.97.3
Upper quartile10.04.47.75.95.0
Lower quartile11.37.39.88.77.6
IQR1.22.92.12.82.7
Table A3. Interpretation of effect sized according to Cohen [20] from Lenhard and Lenhard [27].
dInterpretation acc. to Cohen [20]
<0Negative effect
0.0No effect
0.1
0.2Minor effect
0.3
0.4
0.5Average effect
0.6
0.7
0.8Major effect
0.9
≥1.0
Table A4. Type I and type II errors in statistical decisions [6].
Statistical DecisionApplicable to the Population:
Null Hypothesis H0Alternative Hypothesis H1
Decision in favour of H0Correct decisionWrong decision (type II error)
Decision in favour of H1Wrong decision (type I error)Correct decision

Appendix B

B1: This study considers especially vibration-induced discomfort with a frequency range <10 Hz of whole-body vibrations experienced with particularly high sensitivity [16]. In vehicle development, NVH-phenomena, such as vehicle body motion or Freeway-Hop, make a significant contribution to perception of whole-body vibrations <10 Hz.
B2: A total of 14 male experts from Dr. Ing. H.c. F. Porsche AG, very experienced in subjective rating of ride comfort. All subjects were aged between 25 and 50 years with a stature from 165 cm to 195 cm, weighing between 65 kg and 100 kg. All participants were healthy and without any existing complaints (e.g., discomfort in the area of the backbone).
B3: Entrekin et al. investigated in [28] the effect of the difference in phase of vertical vibrations acting on the seat and acting on the floor. They concluded that most subjects prefer in-phase motion at frequencies below 5 Hz.
Experiments preceding the current study confirmed this effect for a stimulus acting at 1.3 Hz. The stimulus acting not in phase, between the seating and the footwell, irritated the subjects so much that just-noticeable differences in stimuli with an amplitude of 0.5 m/s² were not identified. The measure taken was to present the analogue stimulus (in phase) additionally through the foot platform for the study conducted at 1.3 Hz.
B4: According to the approach by Treutwein [19], a distinction must be made between a corrected and an uncorrected probability; the potential answers (such as 2 or 3) were taken into account in this case.
B5: It is generally known that receptors (sensory cells) transform physical or chemical stimuli into a receptor potential only beyond a certain intensity (greater sensory threshold; signal transduction); further information about the characteristics and functions of receptors are contained in [29].

References

  1. Goldstein, E.B. Wahrnehmungspsychologie, 9th ed.; Springer: Berlin/Heidelberg, Germany, 2015; ISBN 978-38274018925. [Google Scholar]
  2. Engen, T. Psycohophysics. In Experimental Psychology, 3rd ed.; Kling, J.W., Ed.; Holt, Rinehart and Winston, Inc.: New York, NY, USA, 1972; pp. 1–46. ISBN 978-0030028069. [Google Scholar]
  3. Gescheider, G.A. Psychophysics: Method and Theory; Erlbaum, L., Ed.; Halsted Press: Hillsdale, NJ, USA, 1976. [Google Scholar]
  4. Pütter, A. Studien zur Theorie der Reizvorgänge. Pflügers Arch. Gesamte Physiol. Menschen Tiere 1918, 171, 201–261. [Google Scholar] [CrossRef]
  5. Nuzzo, R. Scientific method: Statistical errors. Nature 2014, 506, 150–152. [Google Scholar] [CrossRef] [PubMed] [Green Version]
  6. Bortz, J. Statistik Für Human- und Sozialwissenschaftler, 6th ed.; Springer: Berlin/Heidelberg, Germany, 2005. [Google Scholar] [CrossRef]
  7. Jones, L.A.; Lederman, S.J. Human Hand Function; Oxford University Press (OUP): New, York, NY, USA, 2006. [Google Scholar]
  8. Goldstein, E.B. Wahrnehmungspsychologie, 4th ed.; Springer: Berlin/Heidelberg, Germany, 2015. [Google Scholar]
  9. Morioka, M.; Griffin, M. Difference thresholds for intensity perception of whole-body vertical vibration: Effect of frequency and magnitude. J. Acoust. Soc. Am. 2000, 107, 620–624. [Google Scholar] [CrossRef] [PubMed] [Green Version]
  10. Bellmann, M.A. Perception of Whole-Body Vibrations: From Basic Experiments to Effects of Seat and Steering-Wheel Vibrations on the Passenger’s Comfort Inside Vehicles. Ph.D. Thesis, Uni Oldenburg, Shaker Verlag GmbH, Oldenburg, Germany, 2002. [Google Scholar]
  11. Bellmann, M.A.; Mellert, V.; Reckhardt, C.; Remmers, H. Basic Experiments on the Perception of vertical Whole-Body Vibrations; Fortschritte der Akustik, DAGA: Hamburg, Germany, 2001; pp. 494–495. [Google Scholar]
  12. Bellmann, M.A.; Remmers, H. Grundlegende Experimente Der Wahrnehmung Von Vertikalen Ganzkörperschwingungen; VDI-Berichte Nr. 1821; Tagungsband: Darmstadt, Germany, 2004; pp. 251–270. [Google Scholar]
  13. Baumann, I.; Bellmann, M.A.; Mellert, V.; Weber, H. Wahrnehmungs- und Unterschiedsschwellen Von Vibrationen Auf Einem Kraftfahrzeugsitz; Fortschritte der Akustik, DAGA: Hamburg, Germany, 2001; pp. 292–293. ISBN 3-9804568-9-7. [Google Scholar]
  14. Matsumoto, Y.; Maeda, S.; Oji, Y. Influence of Frequency on Difference Thresholds for Magnitude of Vertical Sinusoidal Whole-Body Vibration. Ind. Health 2002, 40, 313–319. [Google Scholar] [CrossRef] [PubMed] [Green Version]
  15. Forta, N.G.; Morioka, M.; Griffin, M. Difference thresholds for the perception of whole-body vertical vibration: Dependence on the frequency and magnitude of vibration. Ergonmics 2009, 52, 1305–1310. [Google Scholar] [CrossRef] [PubMed]
  16. VDI 2057-1. Einwirkungen Mechanischer Schwingungen auf Den Menschen; Verein Deutscher Ingenieure, Beuth Verlag GmbH: Berlin, Germany, 2002.
  17. MTS. RPC Pro Software. Available online: http://www.mts.com (accessed on 1 February 2020).
  18. Levitt, H. Transformed Up-Down Methods in Psychoacoustics. J. Acoust. Soc. Am. 1971, 49, 467–477. [Google Scholar] [CrossRef]
  19. Treutwein, B. Adaptive psychophysical procedures. Vis. Res. 1995, 35, 2503–2522. [Google Scholar] [CrossRef]
  20. Cohen, J. Statistical Power Analysis for the Behavioral Sciences, 2nd ed.; Lawrence Erlbaum Associates: Hillsdale, NJ, USA, 1988. [Google Scholar]
  21. Bühner, M.; Ziegler, M. Statistik für Psychologen und Sozialwissenschaftler; Pearson Studium: München, Germany, 2009; Volume 1, ISBN 978-3-8273-7274-1. [Google Scholar]
  22. Stamm, M.; Altonsoy, E.; Merchel, S. Frequenzwahrnehmung von Ganzkörperschwingungen im Vergleich zur auditiven Wahrenhmung I. In Proceedings of the DAGA 2010—36th German Annual Conference on Acoustics, Berlin, Germany, 18 March 2010; pp. 868–876. [Google Scholar]
  23. Merchel, S.; Leppin, A.; Altinsoy, E. Multisensorische Interaktion im Fahrzeug: Audio-Taktile Intensitätswahrnehmung. In Proceedings of the DAGA 2010—36th German Annual Conference on Acoustics, Berlin, Germany, 18 March 2010; pp. 871–872. [Google Scholar]
  24. Valko, Y.; Lewis, R.F.; Priesol, A.J.; Merfeld, D.M. Vestibular labyrinth contributions to human whole-body motion discrimination. J. Neurosci. 2012, 32, 13537–13542. [Google Scholar] [CrossRef] [PubMed] [Green Version]
  25. Gescheider, A.; Bolanowski, S.; Hardick, K. The frequency selectivity of information-processing channels in the tactile sensory system. Somatosens. Mot. Res. 2001, 18, 191–201. [Google Scholar] [CrossRef] [PubMed]
  26. Gescheider, G.A.; Bolanowski, S.J.; Pope, J.V.; Verrillo, R.T. A four-channel analysis of the tactile sensitivity of the fingertip: Frequency selectivity, spatial summation, and temporal summation. Somatosens. Mot. Res. 2002, 19, 114–124. [Google Scholar] [CrossRef] [PubMed]
  27. Lenhard, W.; Lenhard, A. Berechnung von Effektstärken. Psychometrica: Dettelbach, Germany, 2016. Available online: https://www.psychometrica.de (accessed on 1 February 2020). [CrossRef]
  28. Entrekin, R.; Suggs, C.W.; Abrams, C.F. Differential Vibration of the Feet and Trunk of Humans. Proc. Sixth Congr. Int. Ergon. Assoc. 1976, 20, 61–65. [Google Scholar] [CrossRef]
  29. Schmidt, R.F.; Lang, F.; Heckmann, M. Physiologie des Menschen, 31st ed.; Springer: Berlin/Heidelberg, Germany, 2010. [Google Scholar] [CrossRef]
Figure 1. Test apparatus with two z-axis vibrating platforms at the comfort interfaces of seat (right) and footwell (left).
Vibration 03 00010 g001
Figure 2. Typical curve for determining a relative difference threshold associated with a reference stimulus by means of the transformed 3-down/1-up method.
Vibration 03 00010 g002
Figure 3. (a) Relative difference thresholds at 1.3 Hz: effect of amplitude, (b) Relative difference thresholds at 6.0 Hz: effect of amplitude. The line in the box shows the median value of the distribution additionally indicated as a numerical value. The outliers were defined as larger than 1.5 times the interquartile range (IQR).
Vibration 03 00010 g003
Figure 4. (a) Relative difference thresholds at 0.2 m/s²: effect of frequency, (b) Relative difference thresholds at 0.5 m/s²: effect of frequency. The line in the box shows the median value of the distribution additionally indicated as a numerical value. The outliers were defined as larger than 1.5 times the interquartile range (IQR).
Vibration 03 00010 g004
Figure 5. Comparison of results (median relative difference thresholds) previously studied (extract up to 20 Hz) and currently study.
Vibration 03 00010 g005
Table 1. Overview of relevant studies contributing to the objective evaluation of just-noticeable differences of sinusoidal whole-body vibrations (AFC: alternative forced choice, IFC: interval forced choice)
Publication[9][10,11,12][13][14][15]
Year2000from 2001200120032010
Frequency5, 20 Hz4–80 Hz12.5–80 Hz4–80 Hz2.5–315 Hz
Amplitude0.1, 0.5 m/s²0.063 m/s²
(96 dB)
0.1 m/s²
(100 dB)
0.7 m/s²0.05, 0.2,
0.8 m/s²
Inquiry technique2 AFC
1 up–3 down
3 AFC
1 up–2 down
3 AFC
1 up–2 down
method of limits2 IFC
1 up–3 down
Convergence79.4%70.7%70.7%50.0%79.4%
Increment step2.9%
0.25 dB
5.9%
0.5 dB
5.9%
0.5 dB
2.9%
0.25 dB
2.9%
0.25 dB
Test subjects128–16101612
Result8.1–12.3%~19%~20%5.2–6.5%9.5–20.3%
Table 2. Statistical parameters: effect of amplitude.
No.f
Hz
Paired Comparison
m/s²
Statistical PowerSignificance
padj
Effect Size
d
Interpretation
acc. to Cohen [20]
11.30.2 ↔ 0.5>0.8<0.01>1.0Large
26.00.2 ↔ 0.5<0.8>0.05--
36.00.5 ↔ 1.2<0.8>0.05--
46.00.2 ↔ 1.2<0.8<0.05>0.8Large
Table 3. Statistical parameters: effect of frequency.
No.a
m/s²
Paired Comparison
Hz
Statistical PowerSignificance
padj
Effect Size
d
Interpretation
acc. to Cohen [20]
50.21.3 ↔ 6.0<0.8<0.05>1.0Large
60.51.3 ↔ 6.0<0.8>0.05--

