Correlation of Short Pitch Rail Corrugation with Railway Wheel-Track Resonance at Low Frequencies of Excitation


Department of Mechanical and Industrial Engineering Technology, University of Johannesburg, Level 7, John Orr Building, 47 Nind Street, Doornfontein, Johannesburg 2092, South Africa
*
Author to whom correspondence should be addressed.
Vibration 2020, 3(4), 491-520; https://0-doi-org.brum.beds.ac.uk/10.3390/vibration3040031
Submission received: 14 August 2020
/
Revised: 28 October 2020
/
Accepted: 28 October 2020
/
Published: 8 December 2020
Abstract
:As much as there has been a significant increase in the development of railway systems in recent years, one of the significant drawbacks on this mode of transport is ground-borne vibrations and noise emanating from vehicle-track interaction in service. This greatly affects the ecology and physical surroundings of the railway track. Experimental tests and Finite Element modal and complex eigenvalue analysis are conducted to investigate the dynamics of a traction wheelset and rail track. This is done to establish the correlation between the short pitch rail corrugation in the Belfast to Steelpoort railway line, in the Limpopo Province of South Africa, with railway wheel-tract resonance at low frequencies of excitation. A 3D Finite Element Method (FEM) and complex eigenvalue analysis are used to validate the resonance modes of the wheelset and rail track obtained through experimental modal analysis. Mode shapes are determined for natural frequencies that match the excitation frequency induced by short pitch rail corrugation. The results show that based on average train speeds around track curves, the excitation frequency induced by corrugation matches (quite reasonably) natural frequencies of the wheelset. Whilst the wheelset FEM results are in better agreement, they rather prove the correlation to occur at 100 Hz. In a previous study by the authors, at the average speeds per track curve, the corrugation excitation frequency was found to be 108 Hz. The current study goes further by investigating natural frequencies of rail tracks. Moreover, mode shapes of a traction wheelset and rail tracks are also investigated, and the results are presented herein.
1. Introduction
Effects of ground-borne vibration and its impact on the railway track and the ecology in the physical surroundings of the track are noted in the railway line in the Limpopo Province of South Africa. A short pitch periodic waviness (known as rail corrugation) with wavelengths ranging between 58 and 90 mm exists on the running surface of rail track curves in the track between Belfast and Steelpoort, in the Limpopo Province of South Africa. Short pitch rail corrugation in this line formed only on tracks with concrete sleepers. Over two decades back Grassie and Kalousek [1,2] put much effort in studying, classifying, and categorising rail corrugation, where they classified it into six types. All six types of rail corrugation are due to different dynamics and manifest themselves in different ways on the running surface of the rails. Two common mechanisms responsible for initiation and development of corrugation on rails are a damage mechanism and a wavelength fixing mechanism. A damage mechanism encompasses different irregularities that may give rise to the formation of corrugation on rails, and the most common one widely known is wear. Plastic bending, Rolling Contact Fatigue (RCF), and plastic flow are other examples of damage mechanisms [3]. These damage mechanisms may arise from different track irregularities such as rail welds. Improper rail welding can cause fluctuation of wheel-rail dynamic loads during running of wheels on the rail, which gives rise to RCF impacts [4,5]. The wavelength fixing mechanism is responsible for fixing corrugation wavelengths and their position on a rail head [3]. The wavelength fixing mechanism is any form of resonance on a wheel-rail or vehicle-track system, which is responsible for fixing corrugation on rails [6]. The most common wavelength fixing mechanism for different types of rail corrugations is a P2-resonance [2]. A P2-resonance is a resonance of an unsprang mass making contact with (and exciting) the track stiffness [1]. After it has been fixed on the running surface of the rails, corrugation causes high levels of vibration [7], at a frequency that is a function of the corrugation wavelengths and train speeds [1]. Wheel-rail vibrations are highly sensitive to irregularities, such that a scratch on either the wheel or rail may cause strong contact vibration between the two [8]. The problem of rail corrugation has impacted the railway industry globally for many years [1]. The recent literature indicates that a permanent cure for corrugation on rails has not been found [3], however, in practical terms it is currently being removed by grinding [8], hence there is a strong need for reliable models describing this phenomenon.
In the recent modelling work, Oyarzabal, et al. [9] used MSC Nastran and Matlab (2011) to calculate the tendency of corrugation growth for three types of rail tracks, i.e., two types of slab tracks (referred to as STEDEF and AFTRAV), and a ballasted track. The difference between the two types of slab tracks studied lies in the sleepers. The results showed that the AFTRAV track works better from the corrugation point of view. This type of track (AFTRAV) has sleepers that cannot be separated from the slab. This study [9] also found that the rail corrugation formation is more associated with the inner wheel of the leading axle, hence corrugation forms (mostly) on the running surface of the low rail [10,11]. In addition to rail dampers, a variety of solutions to rail corrugation have been proposed, including lubrication of the running surface of the low rail and the wheel tread [11]. The top of surface friction modifiers also prove to play a vital role in wheel-rail contact [8,12] and inclusion of their effect in some of the rail corrugation modelling work is noted [13]. Moreover, the wheel-rail contact-borne wear and its effect on developing corrugation on rails is also considered [14].
With the working hypothesis that rail corrugation development and sustainment is associated with the friction-induced wheel-rail resonances, the last few years (mostly from the year 2011) saw researchers in the rail corrugation and train wheel squeal space paying more attention to studying the effects of rail vibration dampers on rail corrugation, vibration, and noise [15,16,17,18,19]. However, the short pitch rail corrugation as formed in the Belfast to Steelpoort track is attributed to low frequency vibrations [10,20,21,22]. The outcomes by Ho, et al. [15] are supported by the findings by Qian, et al. [7], conducted on one of the metro railway lines (Shenzhen metro line) in China, where a short pitch rail corrugation had been a problem in the railway infrastructure. No new corrugation was found on rails after the rail vibration absorbers were installed. Here vibration absorbers were installed on a concrete supported track with no ballast. The Belfast to Steelpoort railway line is a conventional track structure with different layers of a ballast [10,20,21,22]. Most of the track curves on this line are supported on concrete sleepers.
The locomotive class that predominantly operated on the line was a D39 200 [10], which was later (around the year 2016) replaced by the class D44. Firstly, the resonance frequencies of a D39 200 wheelset that operated on the line were correlated to corrugation frequencies around track curves. This correlation was found to be stronger for wheelsets underneath loaded train moving from Steelpoort to offload Ferrochrome at Belfast. Experimental modal analysis was conducted to obtain the point Frequency Response Functions (FRFs) of the D39 200 wheelset [10]. Rail corrugation frequency on track curves was obtained by measuring train speeds and corrugation wavelengths. The vibration frequency of 108 Hz corresponds to a short pitch rail corrugation. FEM is used to study the mode shapes of the D39 200 wheelset and those of the rail track to investigate how the wheelset and rail tracks respond to vibration at a frequency range that corresponds to short pitch rail corrugation. This work is conducted to investigate the association of wheel-rail vibration frequencies with rail corrugation, and also to investigate the D39 200 vibration modes associated with the vibration frequency that correlates to short pitch rail corrugation on the Belfast to Steelpoort railway line. In the present study, vibration modes and mode shapes for wheels of a traction wheelset and rail tracks affected by short pitch rail corrugation are presented. The present study also validates (through Finite Element Analysis (FEA)) the resonance frequencies established through modal analysis in the previous study [10].
The importance of conducting the current study is linked to the financial benefits that may be realised by the railway company that operates trains in the affected railway line. This is given that the frequency of unscheduled train and track components change out will be reduced. Train and track components generally experience lose mountings and ultimately dislocate during excessive vibration, thereby warranting frequent unscheduled maintenance. The ecology will also be saved as there will be less vibration by the trees and fences closer to the rail track. The challenges to implement the practical solution may only be the budget and that it would be time consuming to capture the problem at its entirety, given that a practical solution will only be effective if implemented on wheels and also on track components. This makes it difficult to optimise the solution, as every component of a wheelset-track system has to be damped and given time for trials and inspections.
2. Materials and Methods
Three methods are presented in this study. An analytical method was used to calculate a corrugation frequency on each track curve by the use of train speeds and an average wavelength of corrugation on each track curve. For the second method, resonance frequencies of a wheelset and rail track were obtained through Experimental modal analysis. Lastly, vibration modes of a D39 200 wheelset and track were investigated through FEM.
2.1. Analytical Calculation of Corrugation Frequency
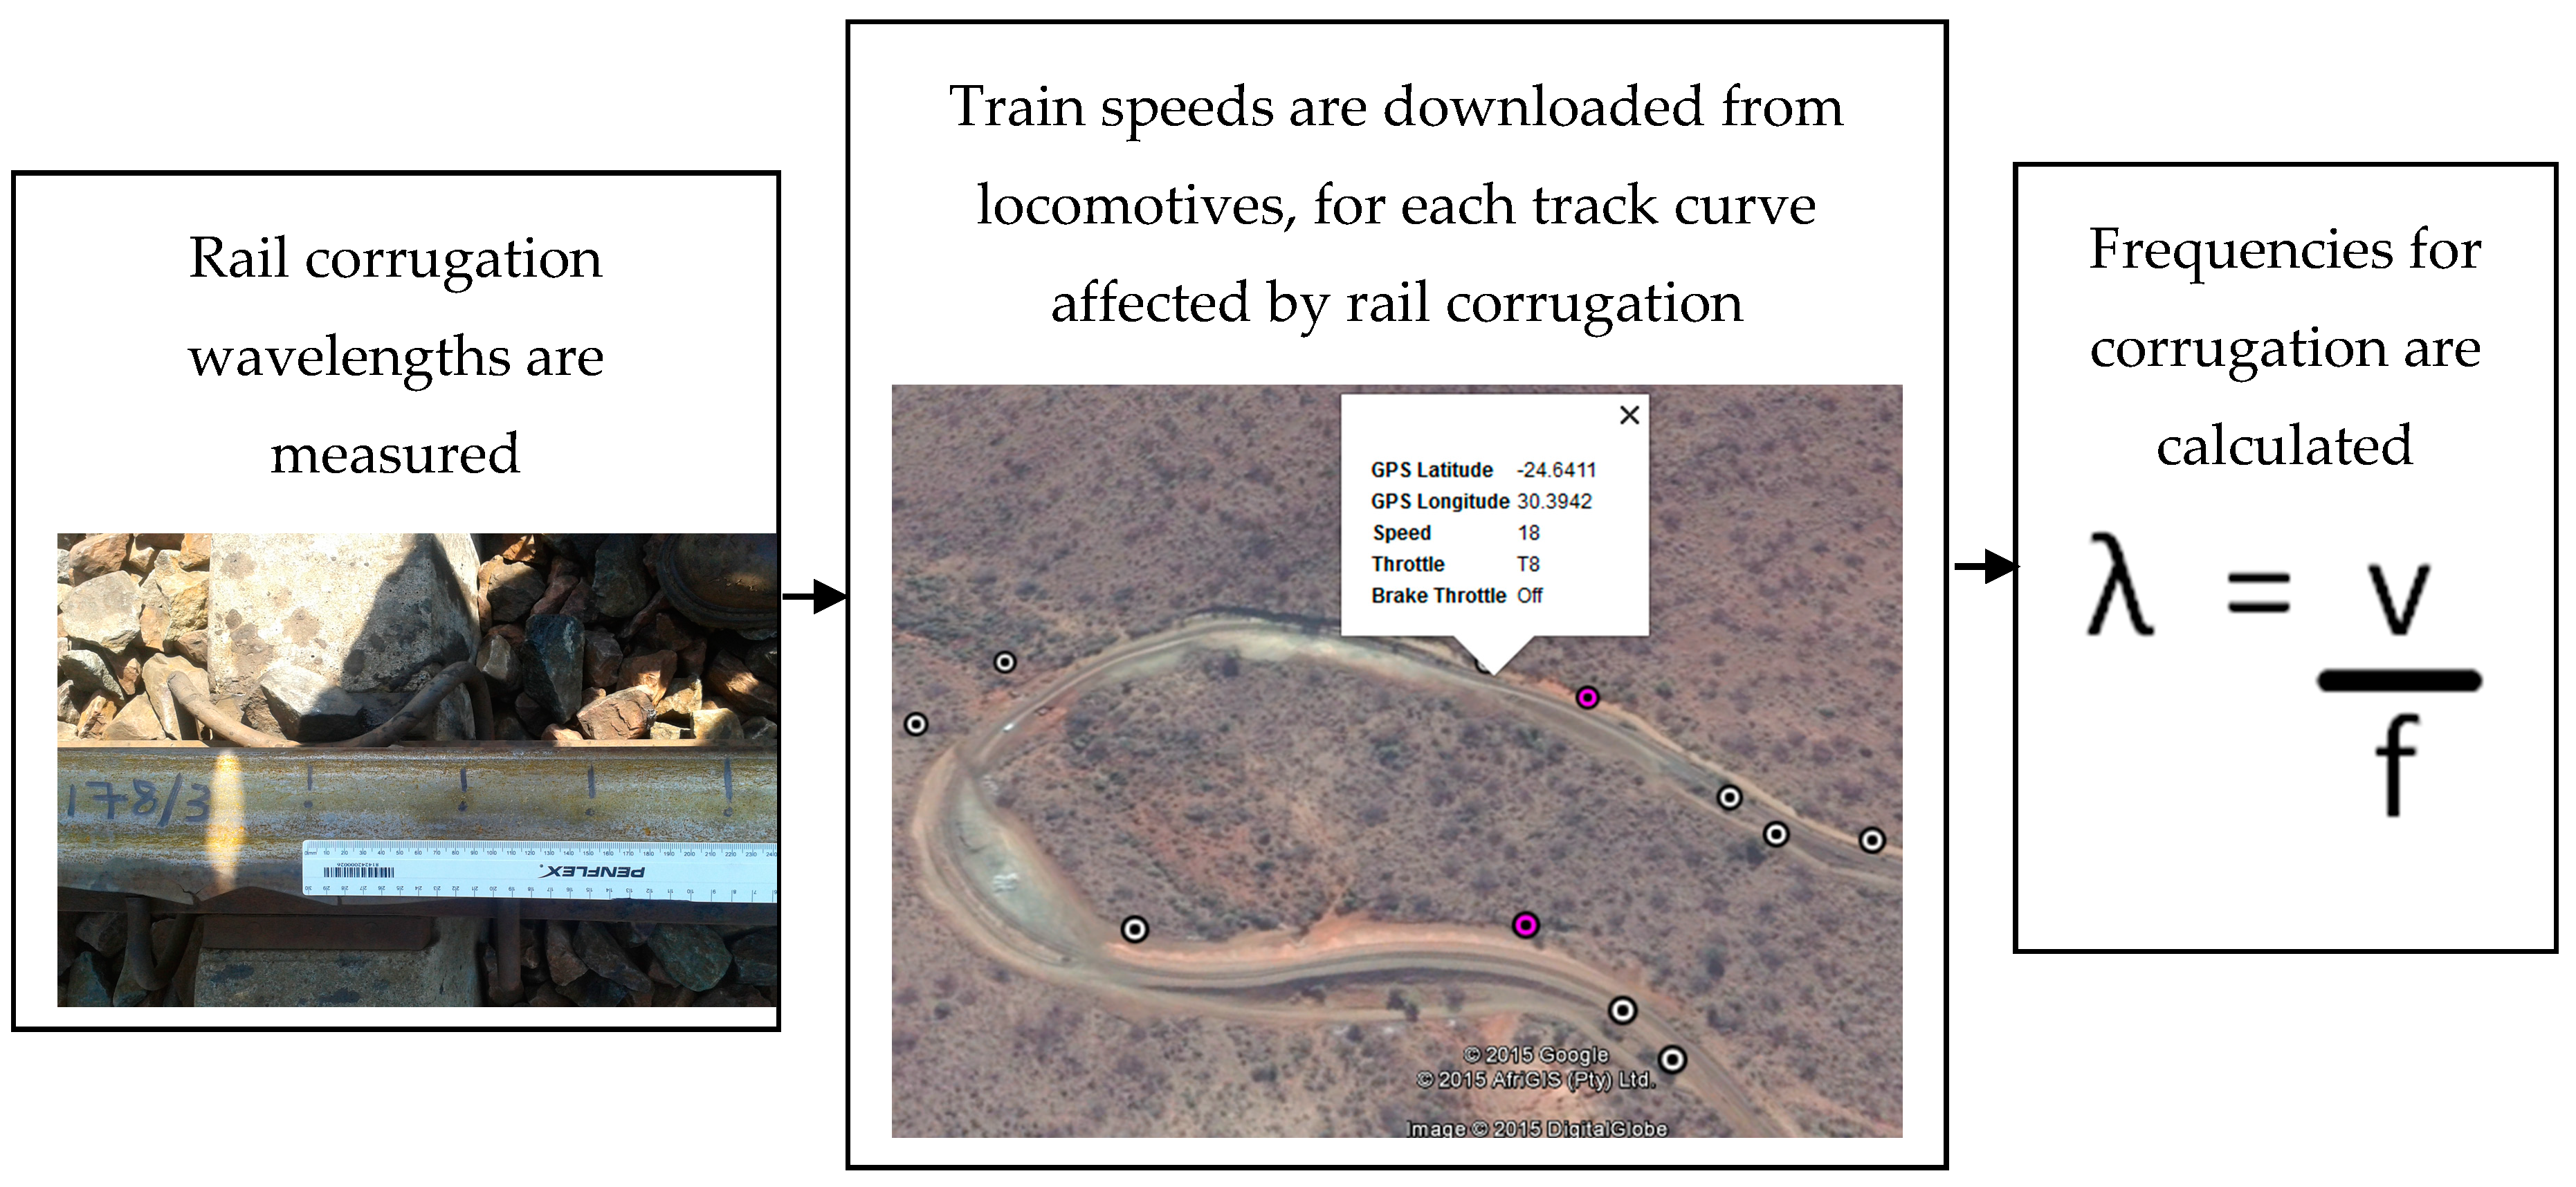
Figure 1 illustrates the method used to calculate corrugation wavelengths.
Train speeds were downloaded from a locomotive Black Box. The data was downloaded from 13 locomotives amongst the fleet that operated on the railway line. A Black Box is an electronic device that records and stores data for different parameters during a train trip. Google Earth Pro® software (version 7.3) was used to establish the locations at which the data were recorded by the black box and also the direction in which the train was travelling. This way train speeds are easily and accurately located on the correct track curves. Locomotives record data every minute, hence in some instances, the download happens at the beginning of the curve and in some at the end, however the assumption is that the average speed is the same throughout the curve.
Corrugation wavelengths were measured with a 300 mm long ruler. The running surface of the rail was first cleaned and wiped for clear visibility of corrugation peaks. Corrugation peaks were marked at the centre of each peak. Complete wavelengths were measured on a peak-alley-peak sequence to complete a wavelength. An average wavelength was calculated from the data. Wavelengths were measure in the middle of each track curve. Together with train speeds, average wavelengths per track curve were used to calculate a corrugation frequency.
With respect to the number of samples used to estimate the average wavelengths; 11 track curves were selected amongst a total of 27 track curves. Only the heavily corrugated track curves were included. The light and heavily corrugated curves were differentiated based on visual inspection. Fifteen corrugation wavelengths were measured on each track curve, after which the average wavelength was calculated for each track curve. The average wavelength for a track curve was calculated by summing up the wavelengths, divided by the number of complete waves (15).
With respect to the number of samples used to estimate the average train speeds, the speeds data were downloaded from each of the thirteen locomotives for a trip when it was running loaded and empty on each track curve. Speeds were measured for 13 locomotives on each track curve. However, 15 data points were obtained, given that 2 of the 13 locomotives were measured twice for the trips when they were running loaded and empty. The average speed around each track curve was ultimately calculated by summing up train speeds from 15 trips, divided by 15.
2.2. Experimental Modal Analysis on the Traction Wheelset
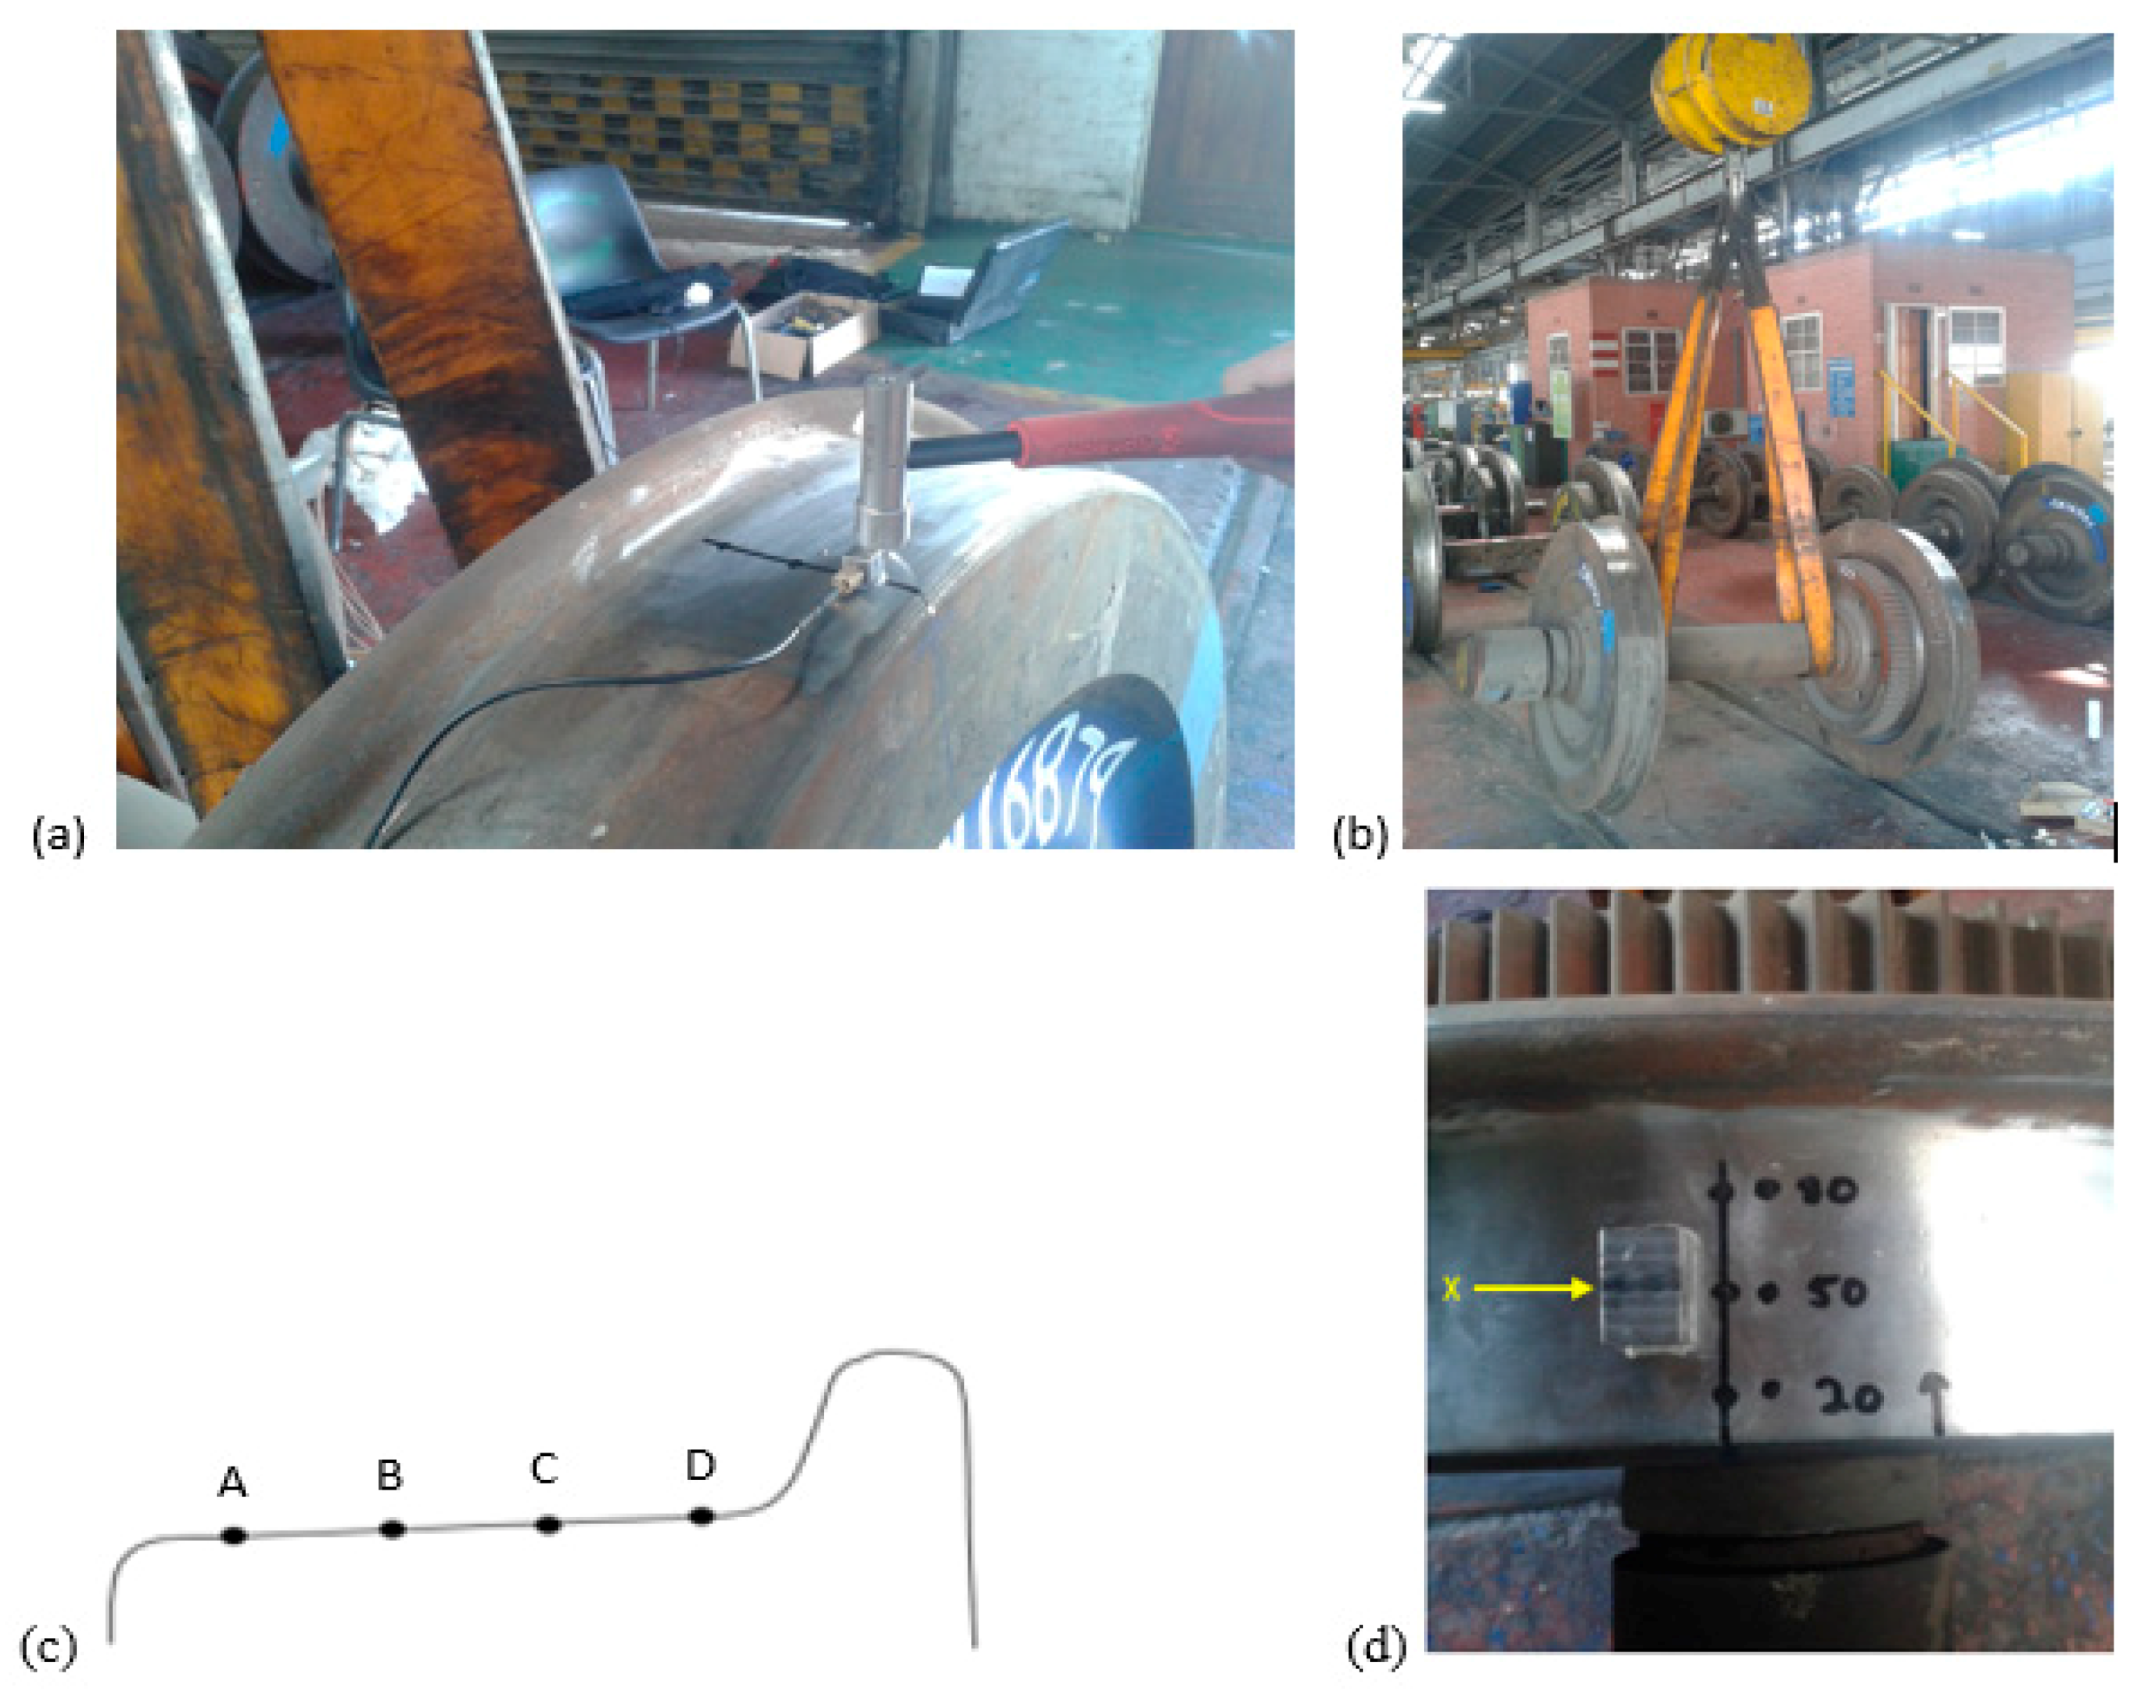
Figure 2 shows an experimental setup, where the wheelset was cleaned, marked, and suspended from the ground. Accelerometer and a steel block were stuck on the profiles of each wheel. The scheme of the experiment is found in Appendix E.
A wheelset already used by a locomotive was utilised for the experiments. Both the gear and non-gear side wheels were tested. The wheel profile was cleaned using a die grinder and wiped. The wheel circumference was measured and accurately divided into four quarters using a tape measure and a marker. The wheelset was freely suspended on an overhead crane using sling ropes. Figure 2c shows points on which the accelerometer was moved after impacts from a point to the next counting from point A to D.
The distance between each point from points A to D in Figure 2c is 30 mm. Excitation was applied in the radial direction (downwards towards the ground on the wheel profile), axial direction (on the outer part of the wheel rim), and in the circumferential direction. A steel block with a negligibly small mass (approximate dimensions: 30 mm × 10 mm × 30 mm) was stuck on the top of the wheel profile, in-between the excitation points B and C of Figure 2c, leaving a distance of approximately 5 mm away from the two points. The block was stuck to apply circumferential excitation. Figure 2d shows a better view of the position on which the steel block was stuck. Excitations were applied in the direction “X”.
The equipment used for the experiment at a sample rate of 2 kHz:
- PXI0-4472 dynamic signal acquisition module for sound and vibration (Manufactured by Signal Express, Cary, NC, USA),
- Modal hammer model 2302 manufactured by Endevco®, (New York, NY, USA)
- Isotron® triaxial accelerometer model 65, small size, 10 cubic millimeters, 5 g, (Isando, South Africa)
- LabView Signal Express® software (2016).
The accelerometer was moved closer to the excitation point (approximately 5–7 mm from the excitation point) every time when the excitation point and/or direction of excitation was changed. About 30 averages were used to better define a single FRF.
2.3. Finite Element Modal Analysis of the Wheelset
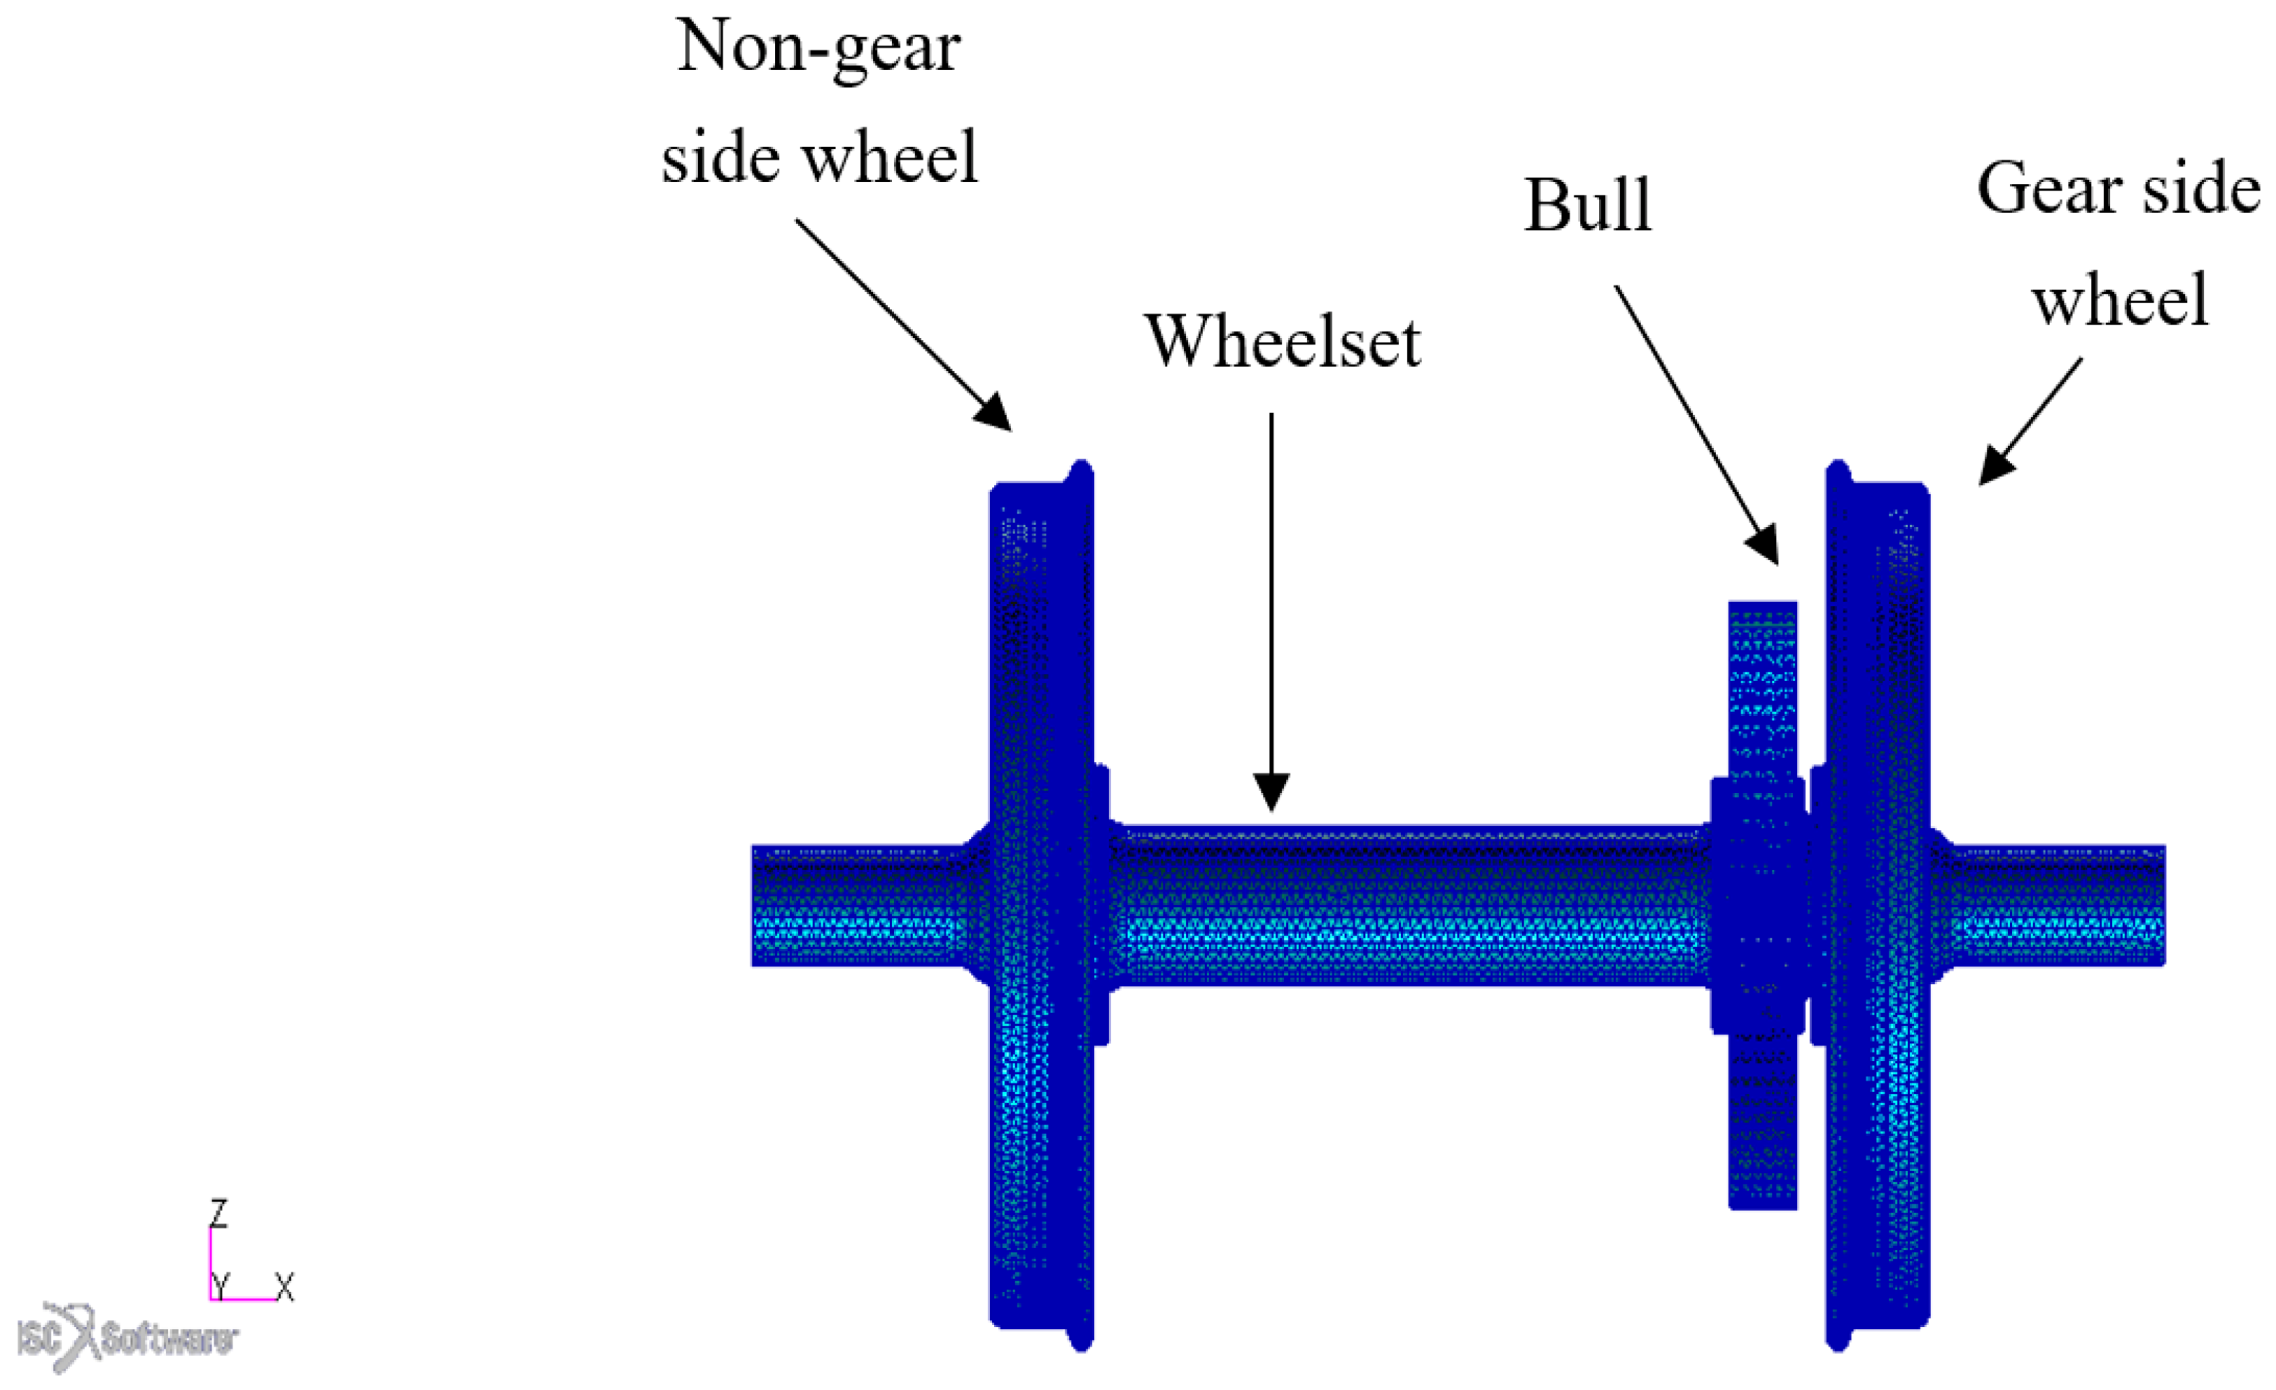
Modal analysis was conducted on a Finite Element Analysis (FEA) software Patran/Nastran. A 3D FEM of the D39 200 locomotive traction wheelset was developed as shown in Figure 3.
The traction wheelset model in Figure 3 includes the bull gear mounted on the axle. The mesh details for the FEM are populated in Table 1. Tet10 solid elements were used on all solids of the wheelset model to ensure better contact definition. The element nodes were equivalenced to 0.1 mm to ensure better alignment of the nodes on created contacts, and also to get rid of unnecessary nodes in the model. Table 2 shows mesh convergence for the wheelset model. Mesh convergence was measured on the first bending mode only, for all mesh sizes.
The bull gear was modelled to accurate dimensions with teeth profile. For accurate comparison of the results to those of a freely suspended wheelset, in the FEA model, the coupling between the bull gear and traction motor pinion is not modelled. The gear case is also not modelled. The traction wheelset and bull gear material properties used in the model are populated in Table 3.
For the FEA model, the properties of steel used for the model are similar to those of a D44 locomotive class. To attain accurate FEA modal analysis; under Boundary Conditions (BC), the model was neither constrained nor loaded in all Degrees Of Freedom (DOF). Vibration frequency is set to a range of 0–500 Hz to capture the vibration modes that correspond to a short pitch corrugation on rails.
A total number of 16 vibration modes are captured, which include the first 6 rigid body modes. Hence the vibration mode number 7 is in principle the first bending mode of vibration, which occurs in the longitudinal direction according to the experimental results. For the purpose of this study, only FRFs for the lateral response are reported, given that the circumferential and longitudinal FRFs showed no close association with the corrugation frequency. Only six modes are presented (one in the results and five in the Appendix A), which occur in the lateral direction. The only modes showing a clear activity were selected for reporting.
2.4. Experimental Modal Analysis on Rails
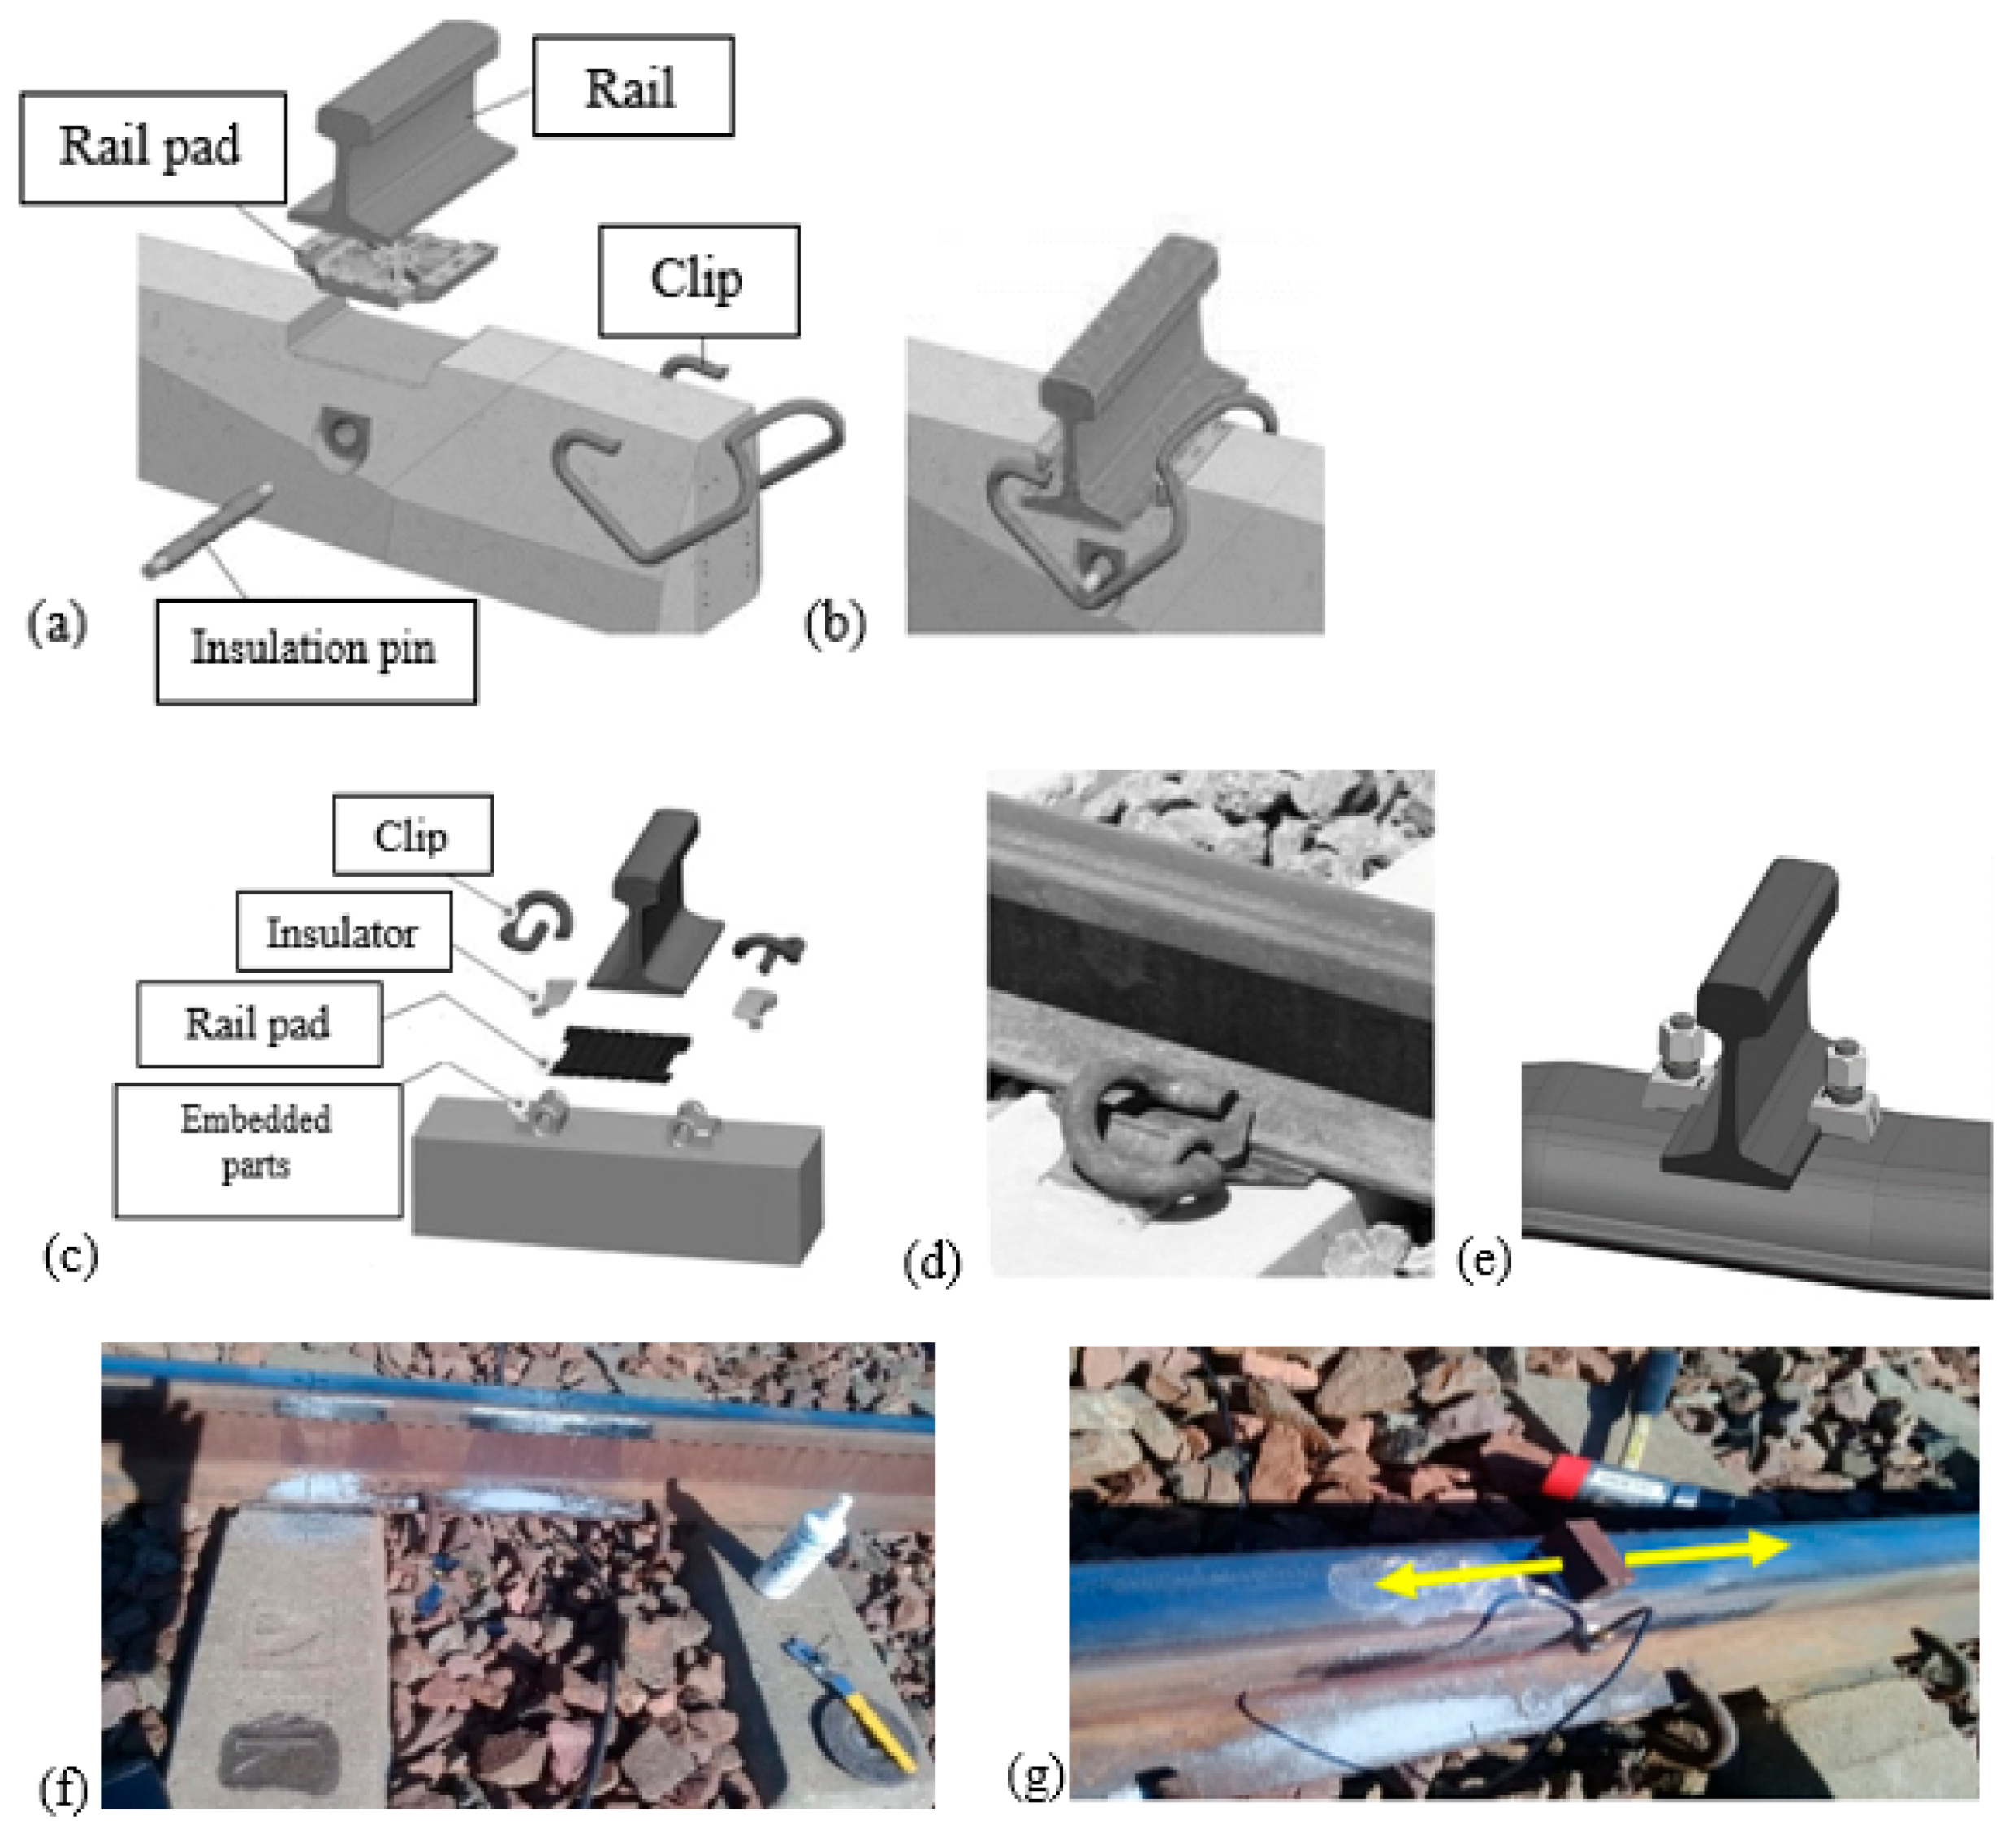
Experimental modal analysis was conducted to study the response of rails supported on steel and concrete sleepers. In terms of rails on concrete sleepers, the analysis was conducted on rails fixed on both the FY-type and the PY-type concrete sleepers. This means the experiment was conducted on three track curves. The difference between the sleeper types and their respective fastening systems are shown in Figure 4. This figure (Figure 4) also shows how the rail was cleaned and prepared for modal analysis.
As seen in Figure 4a, the FY-type concrete sleeper has space designed for a High-Density Polyethylene (HDPE) rail pad. The FISTclip fastening system consisting of the clip and insulation pin is used to apply the vertical clamping force between rail, pad, and sleeper. The insulation pin and the space designed for the rail pad also constrain lateral displacement of the fastening system components. Figure 4c,d show the exploded and assembled views of the PY-type concrete sleeper (respectively), and the rail fastening system applicable to it. As seen in Figure 4c, the rail pad sits on top of the PY-type concrete sleeper. The lateral displacement of the fastening system components in this case is constrained by parts of the fastening system, embedded on the sleeper as seen in Figure 4d. These embedded parts are also used to fix the e-clips. The e-clips are used to apply the vertical clamping force on the rail, pads, and the sleeper. The insulator is used to insulate the contact between the rail and e-clip. This ultimately prevents rail and/or e-clip material wear during possible displacements.
Figure 4e shows the steel sleeper fastening system. As seen in Figure 4e, the steel sleeper fastening system is of a simpler form than that of the concrete sleepers. If the applied torque is adequate on the nuts, the rail-sleeper contact stiffness will be adequate, such that the system can easily respond as a unit to dynamic loads. No rail pad is used in the rail-sleeper contact point. On all three track curves, the procedure followed for the experiment was cleaning and wiping of the running surface of the rail using a wheel grinder and measuring and marking the centre distance between two sleepers and the centre point of the rail part that is resting on top of the sleeper. Modal analysis equipment was powered by a petrol generator and the following equipment was used:
- LabView Signal Express® software (2016), installed to capture, store and compute the measured data,
- PXI0-4472 dynamic signal acquisition module for sound and vibration,
- Modal hammer, model 2302 manufactured by Endevco®,
- Isotron® triaxial accelerometer, model 65, small size, 10 cubic millimeters, 5 g,
- Battery bank, (Manufactured by First National Battery, Benoni, South Africa),
- Uninterrupted Power Supply (UPS). (Manufactured by Nashua, Sunninghill, South Africa).
After the equipment was set up, the rail was excited using an impact hammer to excite the rail mid-span and on top of sleeper point. The accelerometer was stuck on the field side of the crown of the rail as seen in Figure 4g. The impacts were applied as close as possible to the accelerometer in all three directions on the rail crown; vertical downwards, horizontal on the field side of the rail crown and longitudinal. For the longitudinal excitation, the impacts were applied on the surface of the steel block seen in Figure 4g in the direction of the yellow arrows. A high-strength glue was used to stick the steel block on the rail running surface. The mass of the steel block is small enough not to add a lot of mass on the rail crown. The dimensions of the steel block are approximately 30 mm × 10 mm × 30 mm. The image of the steel block is found in Figure 4g. For each of the three track curves, components of the track that are above the ballast and the orientation of the accelerometer are as outlined in Appendix B. The accelerometer orientation remained the same for both positions, i.e., mid-span and on top of sleeper point. The accelerometer was moved closer to the excitation point every time when the excitation point and/or direction was changed. A total of 30 averages were used to better define a single FRF. FRFs were measured on both positions (mid-span and on top of sleeper point).
2.5. FEA Complex Eigenvalue Analysis on Rail Track with Steel Sleepers
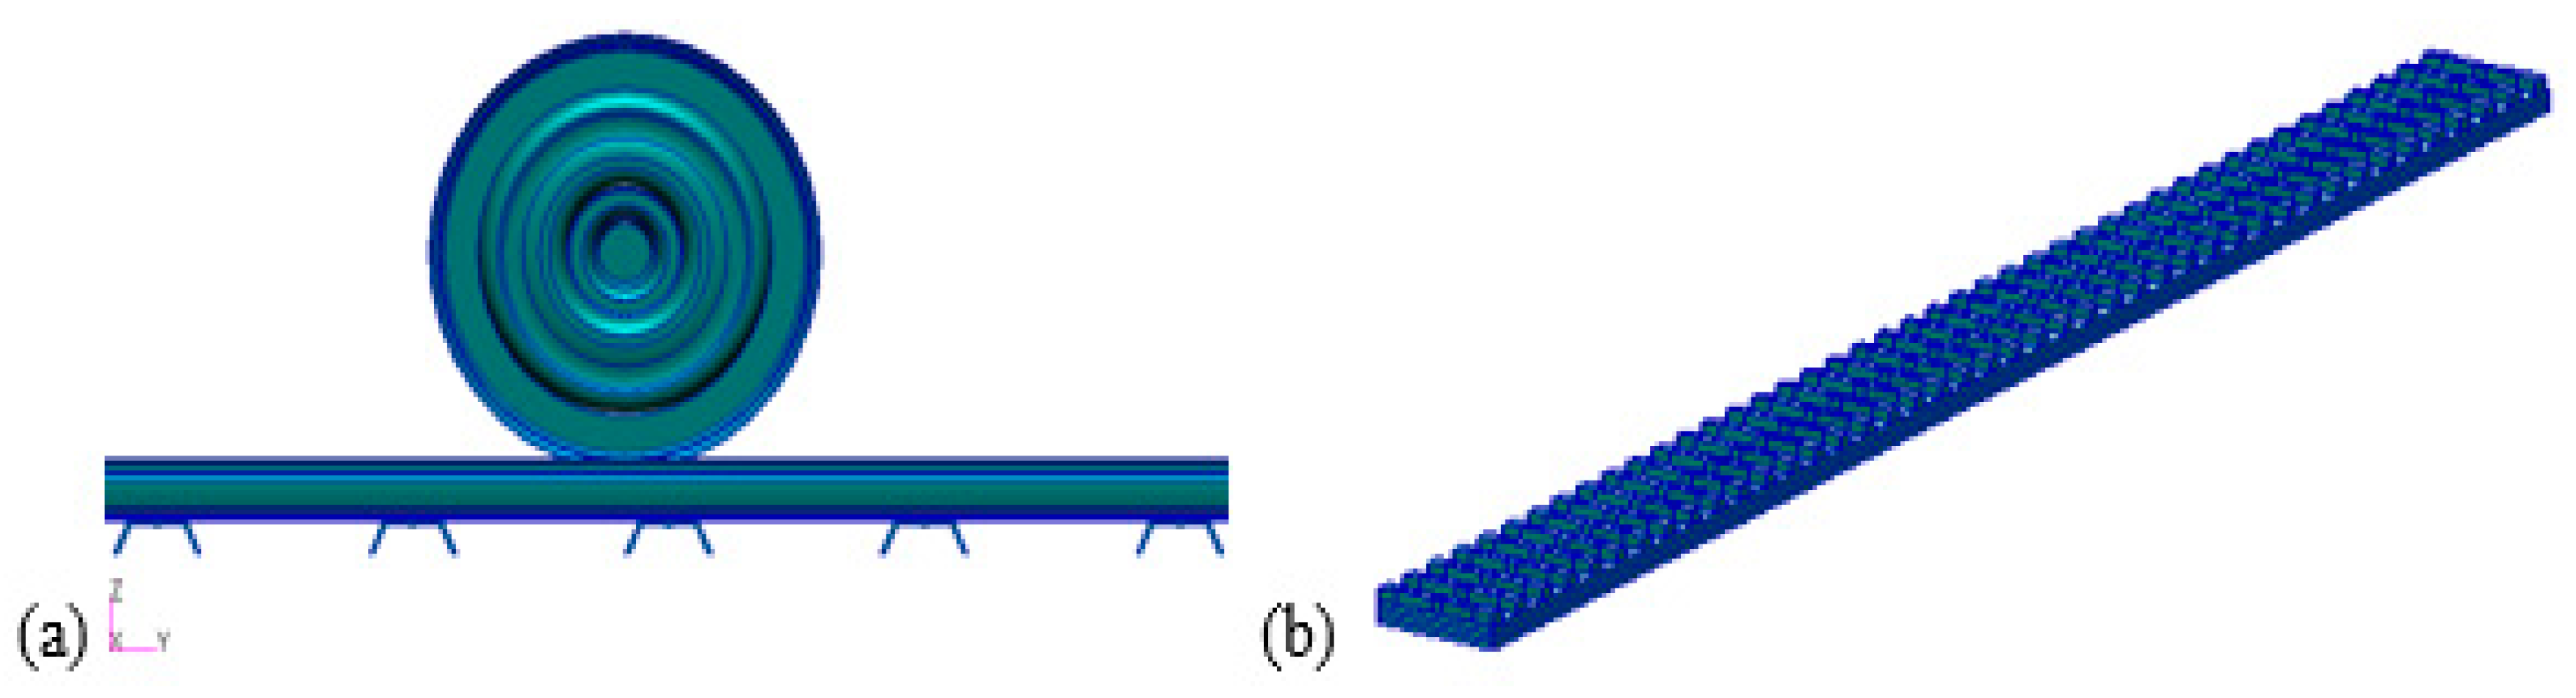
Complex eigenvalue analysis was conducted to obtain mode shapes and frequencies for rail tracks. Two rail track models were developed for investigation of mode shapes and displacements, i.e., the steel and concrete sleeper track models. Figure 5 shows the steel sleeper model and the ballast used in the model. The same ballast was used to model tracks with both types (steel and concrete) of sleepers.
The model in Figure 5 has 30 m long rails and a sleeper bay of 700 mm in the Y-direction; which makes 43 steel sleepers. The D39 200 locomotive wheelset is modelled at a centre distance from rail ends. Table 4 shows details of the mesh used in the FEM for rail track with steel sleepers.
The element nodes were equivalenced to 0.1 mm. Table 5 shows mesh convergence for the steel sleeper track model. Similar to the model of a suspended wheelset, the mesh size for the wheelset used in this model is an element Global Edge Length of 3 mm. Given that with an automated mesher, there was no much activity on all other FEMs of the model, except the sleepers and rail, mesh convergence was conducted for the rail. Mesh convergence was measured on the bending mode occurring at 108 Hz only, for all mesh sizes.
The sleepers are 5 mm thick, hence an element Global Edge Length of 3 mm was used on them for solid meshing. Materials are understood to be isotropic and the material properties allocated to each FEM solid are populated in Table 6.
Three solids were developed in FEA to represent the track ballast. The ballast was divided into three layers i.e., top, middle, and bottom. The top layer ballast was modelled as less stiff than the middle. The bottom ballast was modelled as the stiffest of the three ballast layers. To model the ballast, a volume of 30 m length and same width as that of sleepers was developed. The volume was divided into three layers of the same thickness i.e., 150 mm, which yields the total height of 450 mm for the entire ballast. Table 7 shows details of the mesh used in the ballast FEM.
The same mesh type and size was used for both ballast FEMs of steel and concrete sleepered tracks. The same mesh element size and nodes were used for all three ballast layers, which provided ease of mesh optimisation. The element nodes were equivalenced to the tolerance of 0.1 mm between all layers. The ballast material was treated as isotropic, and the material properties allocated to the ballast FEM are populated in Table 8.
The ballast material properties used were found from Aikawa [23], and the change in magnitude for different parameters of properties was established following the Zakeri and Mosayebi method to achieve different stiffness between layers [24]. Two contacts were created for the ballast layers; contact for bottom face of the top ballast with the top face of the middle ballast; and the bottom face of the middle ballast with top face of the bottom ballast. Contacts created for deformable bodies are found in Table 9. For complex eigenvalue analysis, the ballast is the only FEM on which constrains are applied. Table 9 also shows the loads and boundary conditions applied on the ballast.
Only the nodes on the bottom face of the bottom ballast were fixed for translation in all degrees of freedom. The same nodes were fixed for rotation in all degrees of freedom. The ballast was treated as a structure erected above ground, not partially buried, hence the nodes on the side faces of the ballast were not constrained.
2.6. FEA Complex Eigenvalue Analysis for Rail Track with Concrete Sleepers
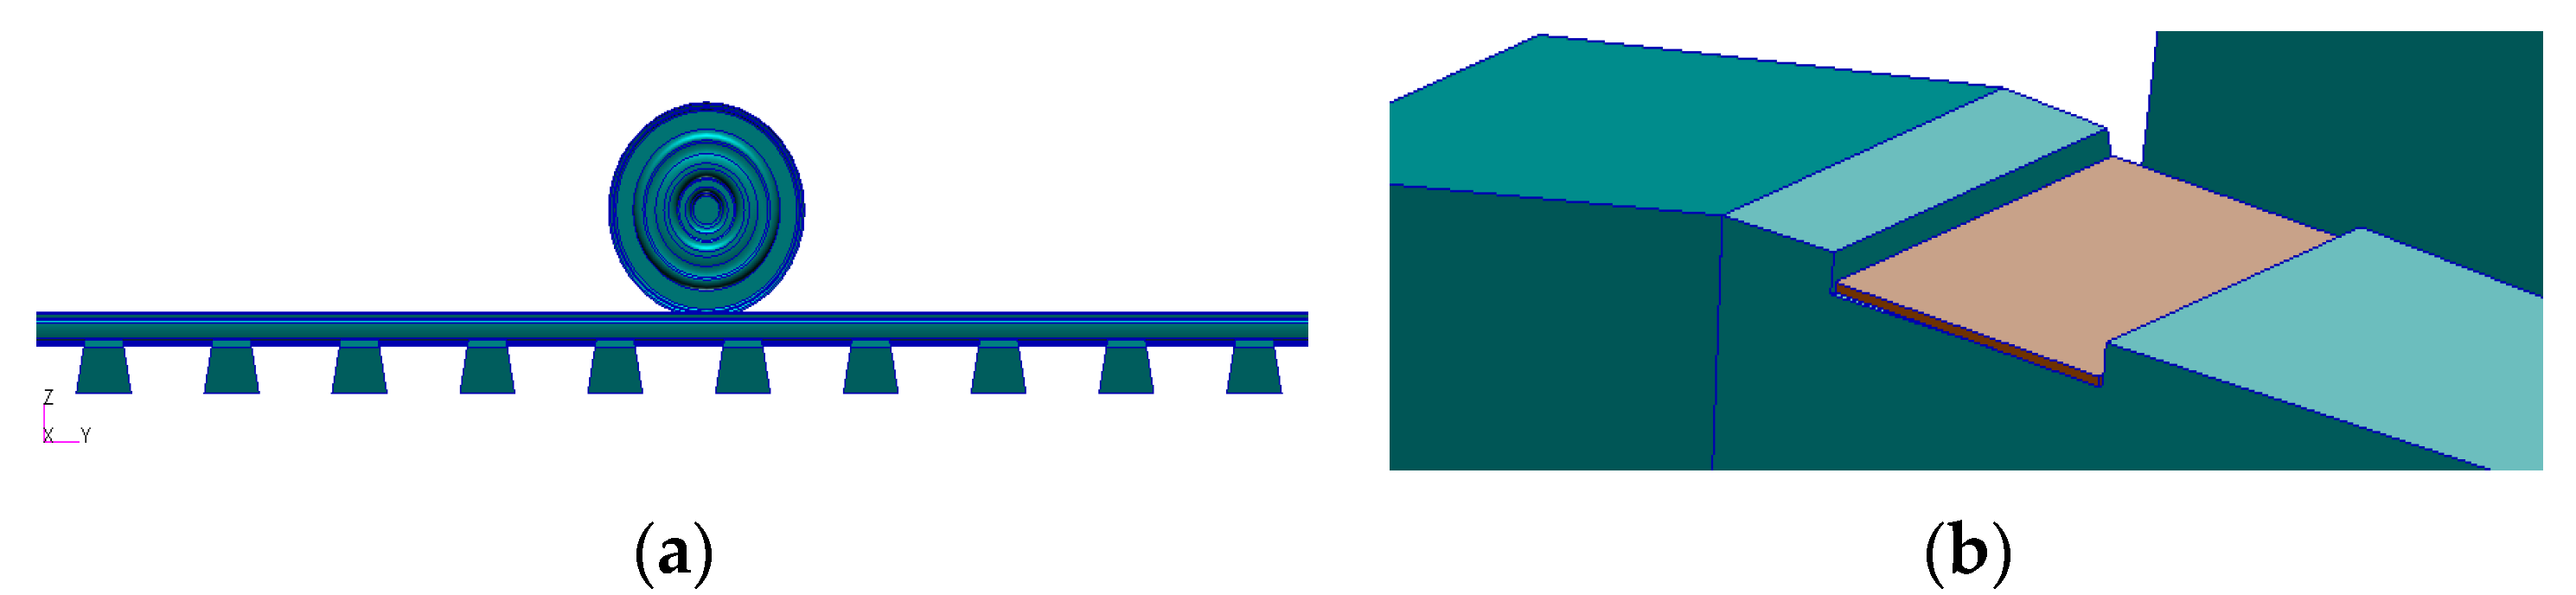
Figure 6 shows how the rail track with concrete sleepers was modelled. Only the rail track with the FY-type concrete sleeper is modelled. The model in Figure 6 has 30 m long rails and a sleeper bay of 700 mm in the Y-direction; which makes 43 concrete sleepers. The D39 200 locomotive wheelset is modelled at a centre distance from rail ends.
The same mesh details as those of the rail track model with steel sleepers were used. Material properties of the model are populated in Table 10.
Properties of the traction wheelset are the same as those of the wheelset used in all modelling work. Mesh convergence was only conducted on the rail FEM, given that other FEMs showed no much activity when the automated mesher was used. The wheelset mesh used is the same as that used in all other models. Sleepers are large solid concrete blocks, on which the element Global Edge Length of 200 mm was used to save running time. Table 11 shows mesh convergence for the rail track model with concrete sleepers. Mesh convergence was measured on the bending mode occurring at 108 Hz only, for all mesh sizes.
The same ballast used for the rail track model with steel sleepers is used for the track model with concrete sleepers. The contacts and constrains for the ballast are also the same.
3. Results
The results are outlined in the following order; calculation of corrugation frequencies, D39 200 traction wheelset experimental modal analysis, FEA modal analysis results for the wheelset, the experimental modal analysis on rail track, and the FEA complex eigenvalue analysis results on rail track.
3.1. Results for Corrugation Frequencies
In this paper, in the tables, the term “test point” refers to a track curve for which a corrugation frequency was calculated. Test point may be referred to as “Tp” in some of the figures. Only 11 of the 27 track curves were used for calculation of corrugation frequencies due to a clear visibility of corrugation peaks on the running surface of those rail track curves. Equation (1) was used to calculate a corrugation frequency around each track curve and these corrugation frequencies associated with loaded and empty trains are populated in Table 12.
In Table 12, the train speeds populated for loaded and empty trains are used to calculate corrugation frequencies associated with loaded and empty trains. It is shown in [10] that the higher the train speeds around track curves, the longer the corrugation wavelengths. It is noted in Table 12 that there is at least one outlier (on Test Point 18) in terms of data for measured wavelengths. This is given that a few different factors may affect formation of a complete wavelength for corrugation; these include normal train speeds around a track curve.
3.2. Results for a Class D39 200 Traction Wheelset Modal analysis
Modal analysis results for the traction wheelset are presented for vibration response of the wheels in the lateral direction. No interesting resonance modes were excited for response of the wheels in the longitudinal and circumferential directions, besides the first resonance modes in the longitudinal direction that occurs at 87 Hz [10], in the longitudinal direction for both wheels. The results are presented for the response of both the gear side and the non-gear side wheels for the lateral direction only. Figure 7 shows the point FRF for the gear side and non-gear side wheels in the lateral direction.
In Figure 7, the accelerance on the Y-axis represents the acceleration per unit force and the X-axis represents the frequency at which the accelerance occurs. The narrow peaks of the FRF represent resonance vibration of the wheel at a given frequency. The ditches represent the anti-resonance of the wheel vibration. At anti-resonance the wheel does not vibrate with the highest vibration amplitude, and the case is otherwise with vibration at resonance. The vibration frequency window captured is at a frequency range of 0–500 Hz; interesting resonance modes and anti-resonance vibration are noted in a frequency range of 10–460 Hz. This frequency range corresponds to a short pitch corrugation frequency.
During vibration of the wheels it is noted in Figure 7 that, in the lateral direction, the second bending vibration mode of the wheels occurs at 108.5 Hz and the first torsional mode at 181.3 Hz. The second torsional mode occurs at 285 Hz and the second torsion at 408 Hz. In Figure 7, the resonance mode occurring at a frequency of 360 Hz is heavily damped, and hence not considered in the investigation. The damping of the FRF is noted by a broader peak, which is not very narrow on the tip. There also proves not to be much activity on the vibration mode at 360 Hz given a slow acceleration of the response per the unit force applied, whilst the wheel is noted to vibrate at antiresonance around same frequency.
Given that the train speeds are found to be generally slightly higher for empty trains, corrugation frequencies associated with empty trains are also slightly higher. In general, Steelpoort is lower in altitude (755 m), whilst Belfast is much higher (2025 m). This implies that the trains are mostly in traction mode on steeper gradients, hauling a load from Steelpoort, and the case is otherwise after they offload at Belfast travelling back to the loading point.
In the next section, the excited vibration modes of wheels in Figure 7 are correlated with corrugation frequencies around track curves.
3.3. Results for Correlation of Wheelset Resonance Modes to Corrugation Frequencies
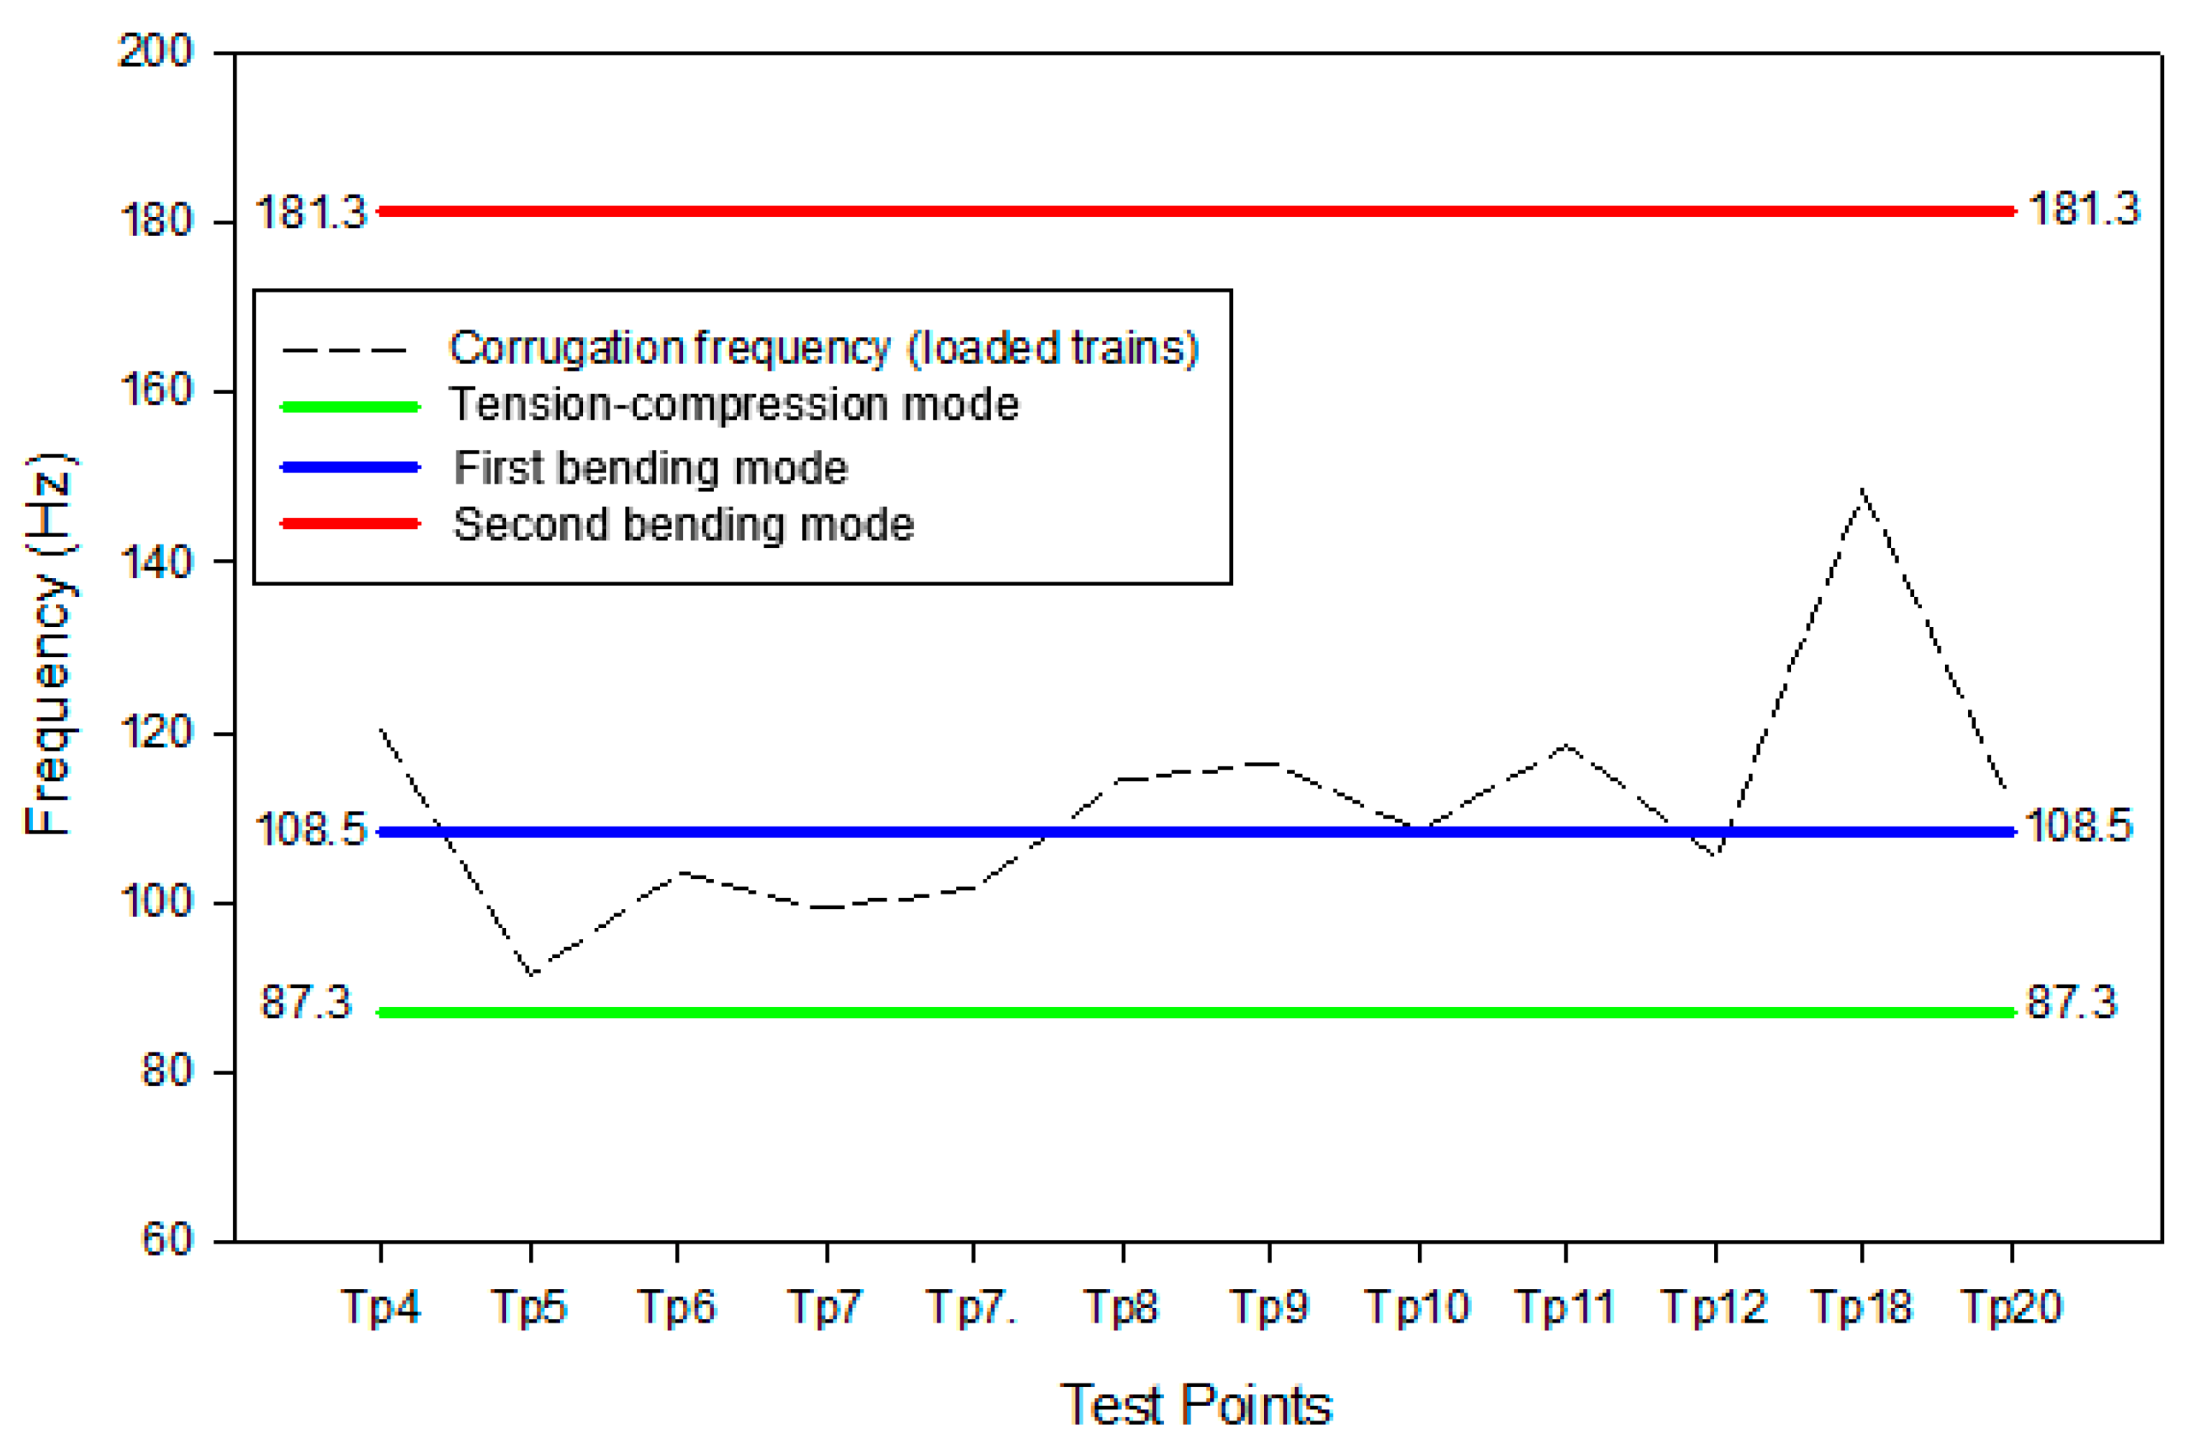
The natural frequencies of the wheelset were matched with corrugation frequencies for each of the 11 track curves tested to establish correlation between the two. It was found that the lateral bending vibration mode of the wheelset has a close correlation with corrugation frequencies on track curves at 108 Hz. This correlation was found (through the Spearman’s correlation statistical test) to be stronger especially for corrugation frequencies associated with loaded trains traveling on the track curves [10,25]. Figure 8 shows correlation of the wheelset natural frequencies to rail corrugation frequencies associated with loaded trains.
Barber and Ciavarella [25] suggest that the short pitch (30–80 mm wavelengths) rail corrugation corresponds to a low vibration frequency range of 50–300 Hz. Hence, from the wheelset point FRFs, to better understand the correlation of the wheelset natural frequencies to corrugation frequencies only frequencies of the first three vibration modes were used.
Evident in Figure 8 is that rail corrugation in the Belfast to Steelpoort railway line is not associated with the torsional mode of the wheels. This is given that the torsional resonance mode of the wheels does not match any of the frequencies of corrugation on track curves in the same line. The wavelength fixing mechanism for rail corrugation in the Belfast to Steelpoort railway line is the bending mode of the wheels, particularly the (lateral) first bending mode of the wheels. This is noted in Figure 8 by the trend of corrugation frequencies on track curves lying much closer to the second bending resonance mode of the wheels. Rail corrugation on track curve 5 is more associated with the tension-compression mode of the wheels.
3.4. Results for Finite Element Modelling of the Traction Wheelset
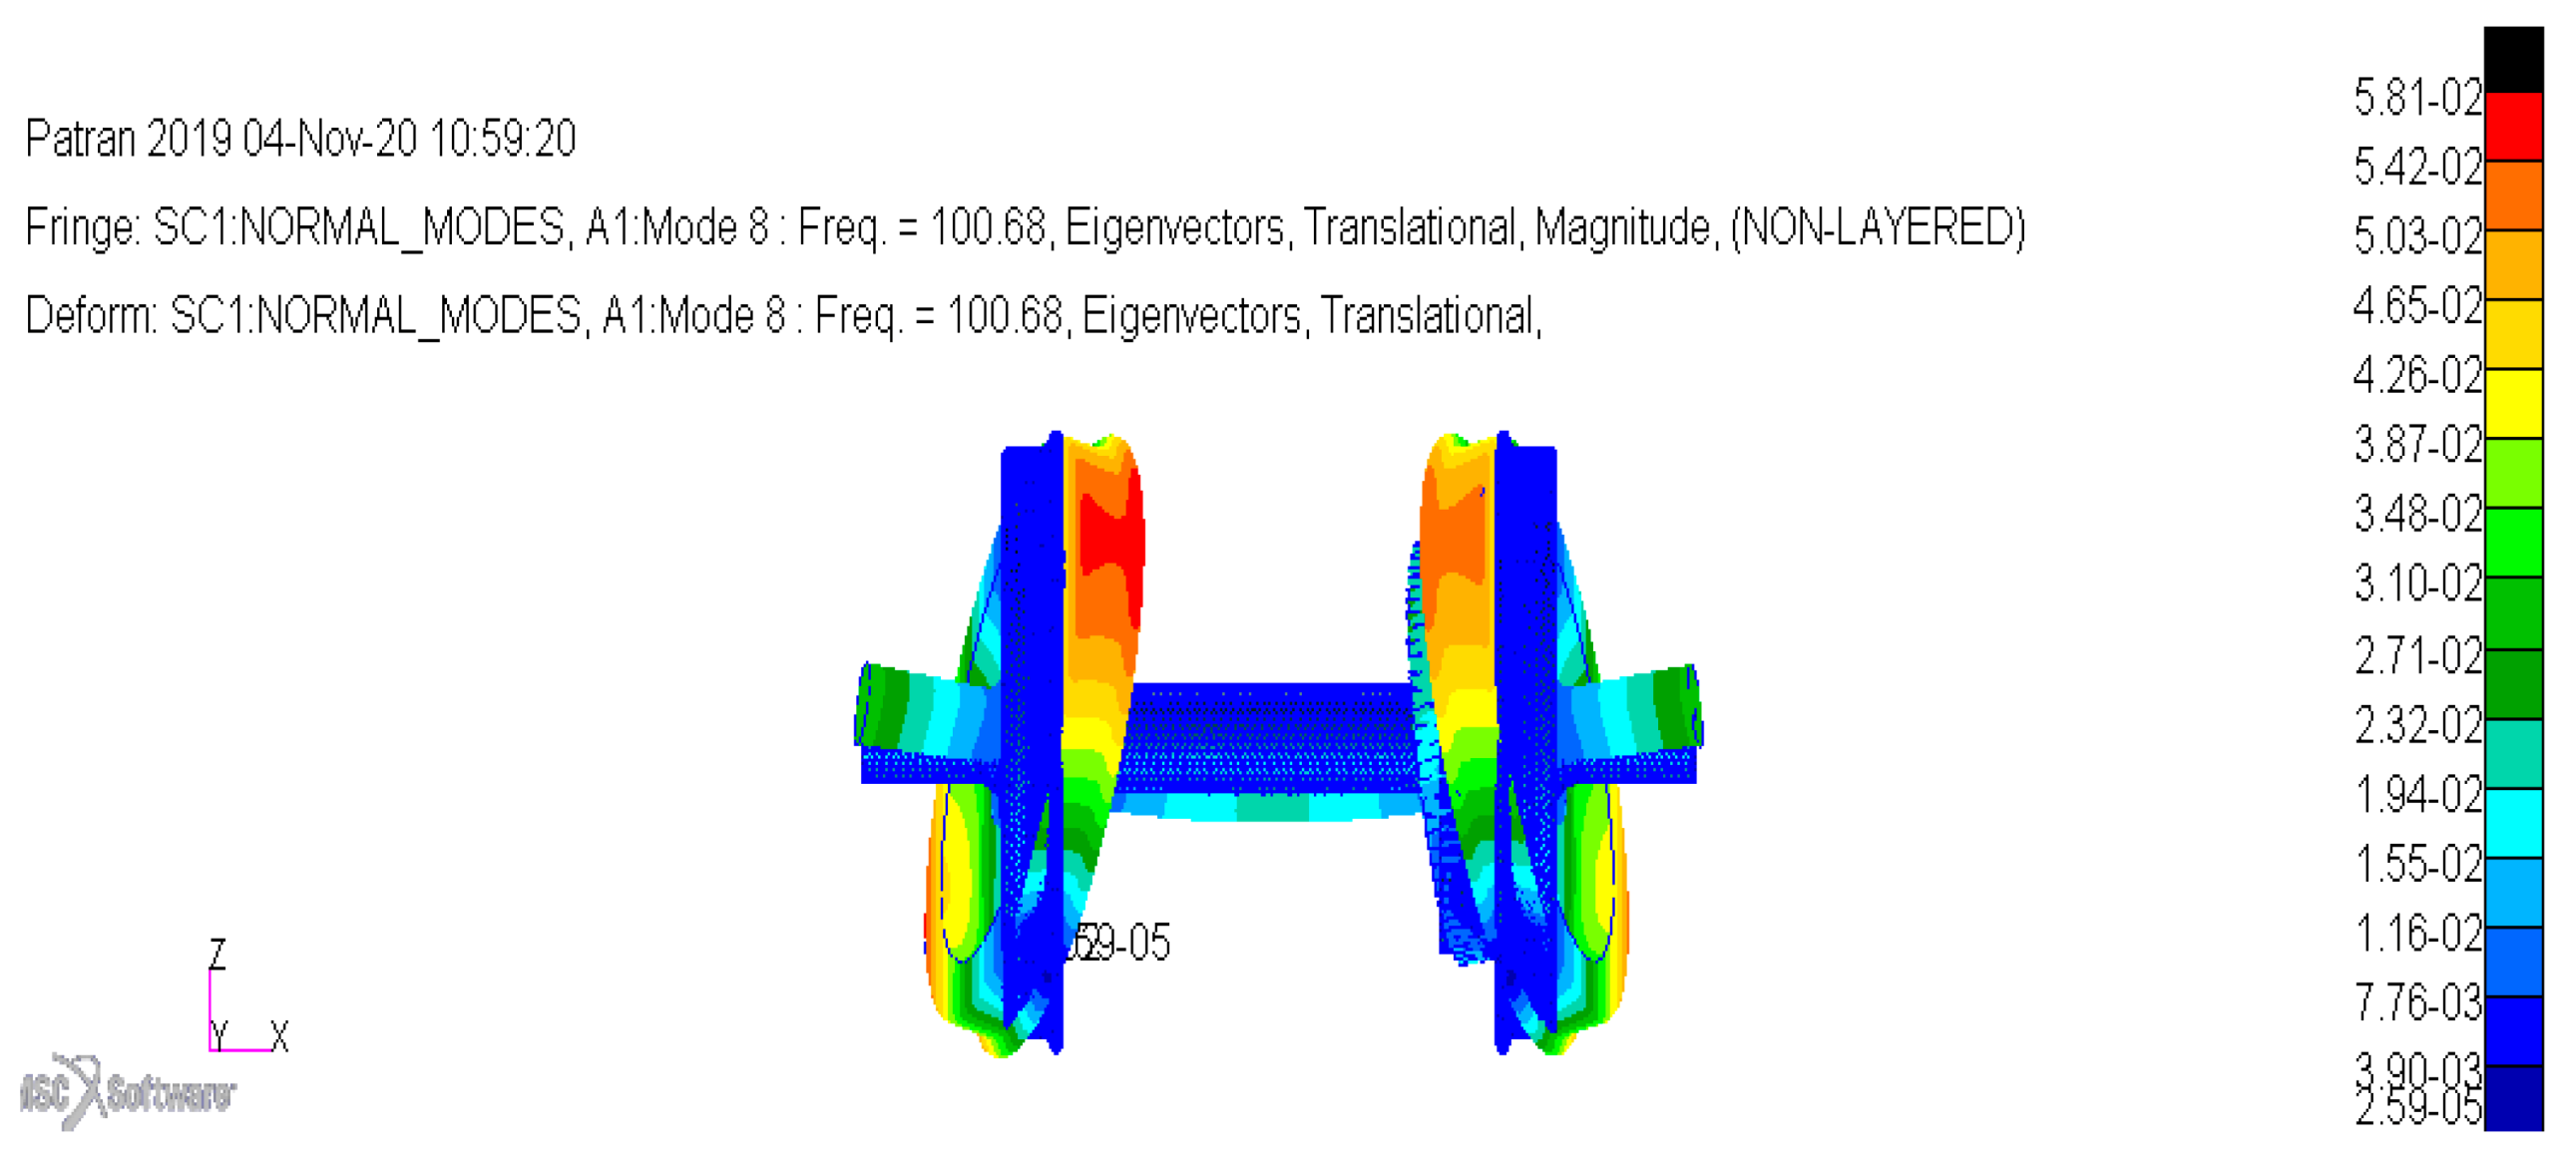
Figure 9 shows the wheelset FEM results for modal analysis conducted to determine the mode shape at the resonance frequency of 108 Hz seen in Figure 7 and Figure 8. The other reason for this exercise was to validate the resonance frequencies of the D39 200 wheelset, which were found from experimental modal analysis.
The wheelset model results in Figure 9 show the deformed and undeformed shapes. The legend in the figure presents displacements with the units in meters. For normalization, a generalized modal mass is equal to unity. The colour coding in the legend correspond to the colours in the deformed shape of the model results. It is noted in Figure 9 that the nodes of the wheelset situated around the light blue colour of the deformed shape displace the least, with the smallest displacement being 0.0259 mm. This displacement is experienced by node 801,634. The nodes situated around the green and yellow colour experience average displacement, whilst the modes around the orange, red, and black colours experience the larger displacement. The largest displacement experienced is of 58.1 mm, which occurs at note 980,310.
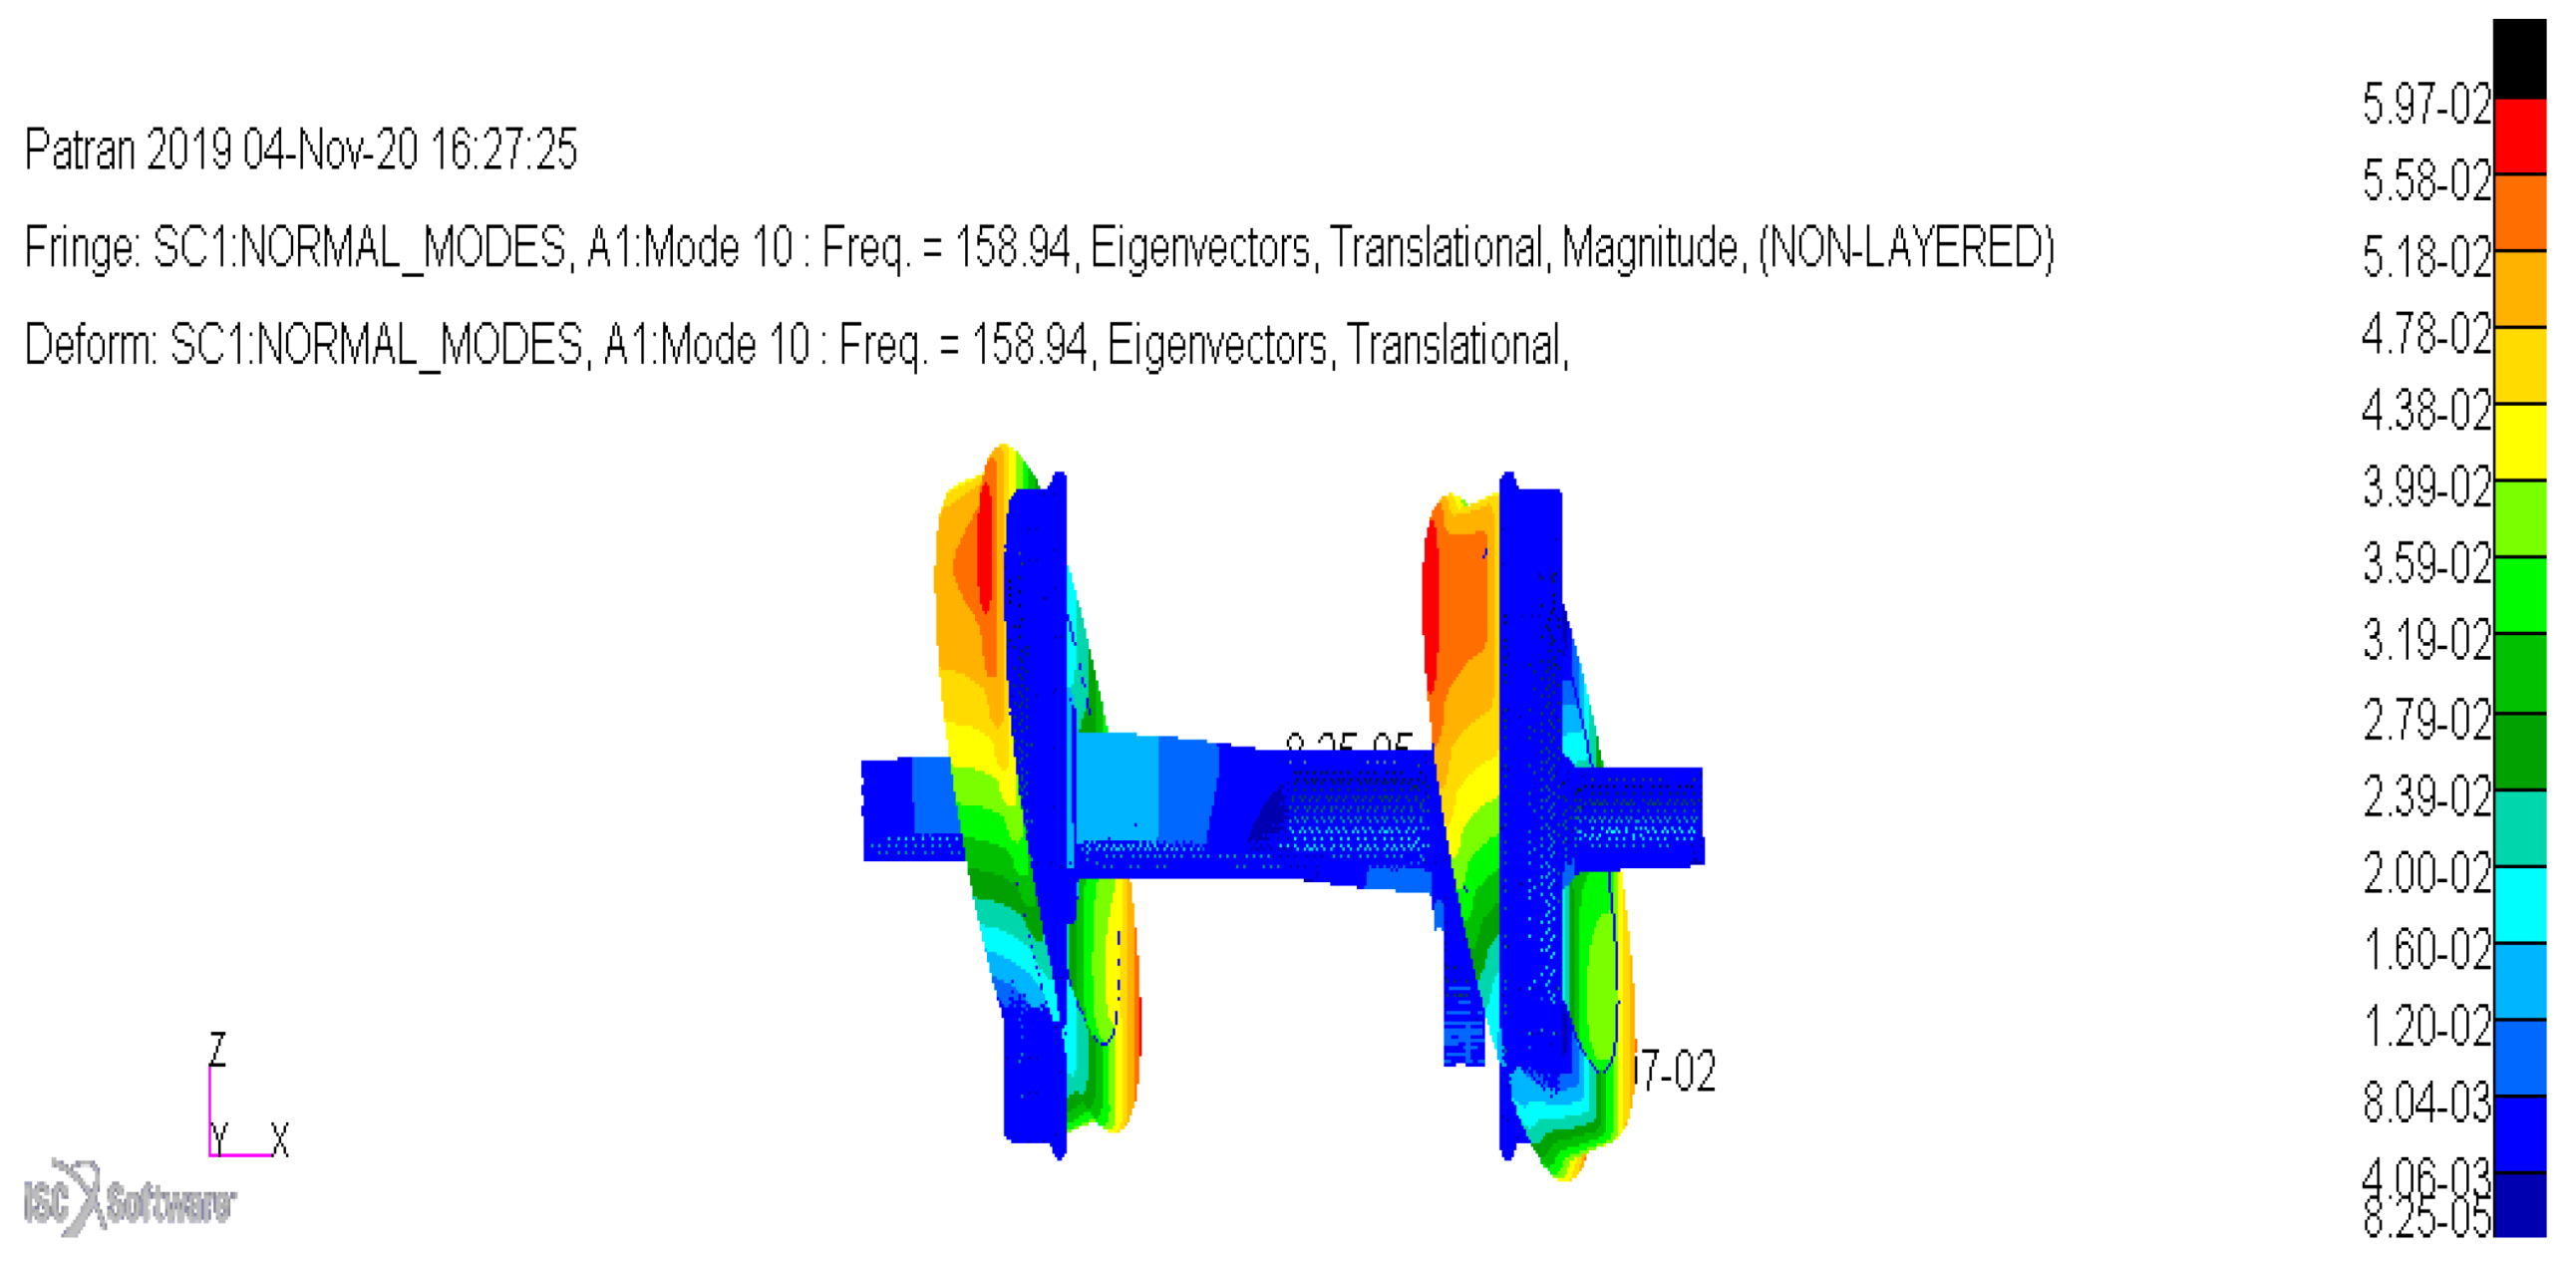
The mode shape in Figure 9 is bending along the axle. Evident in Figure 9 is that during motion of a wheelset, the mode of the wheelset closely corresponding to corrugation frequency of 108 Hz has no complex mode shape. As seen in Figure 7, the resonance modes of importance in testing the wheelset is the modes associated with the formation of corrugation on rails, which is found to be the bending mode as seen in Figure 9. It is further noted in Appendix A that the wheelset goes on a third bending mode at a frequency of 158.94 Hz. This frequency (158.94 Hz) is much higher than 108 Hz and hence it is not found to be closely associated with the corrugation frequency. The same applies to frequencies higher than 158.9 Hz.
Table 13 shows the difference in frequencies obtained experimentally and through FEA.
A percentage error of 7.77% is seen in Table 13. Both the FEM simulations and experiments depend in some cases on many parameters such as material properties, boundary conditions, some assumptions made by FEA if not specified, and the environment in which experiments are conducted etcetera. For this reason, a good equivalence of results from the first try is quite often rare. Nonetheless, as seen in Section 2.3, mesh optimisation was conducted in FEA to obtain reasonably close results to optimum accuracy.
3.5. Results for Modal Analysis on Rails
Figure 10 shows comparison of FRFs for the vertical vibration response measured mid-span. The response is measured from rails laying on FY-type concrete and on steel sleepers.
Evident from Figure 10 is that mid-span the vertical vibration of rail on steel sleepers is more damped than that of the rail laying on FY-type concrete sleepers. No resonance mode is identified from the mid-span response of rail supported on steel sleepers. One resonance mode occurs at a frequency of 425 Hz, from the response of rail laying on FY-type concrete sleepers. Mid-span, the rail laying on concrete sleepers vibrates with more accelerance (vertically) than that laying on steel sleepers, for most of the vibration response period. It is only in the frequency range of 25–122 Hz that the accelerance is less for the rail laying on FY-type concrete sleepers.
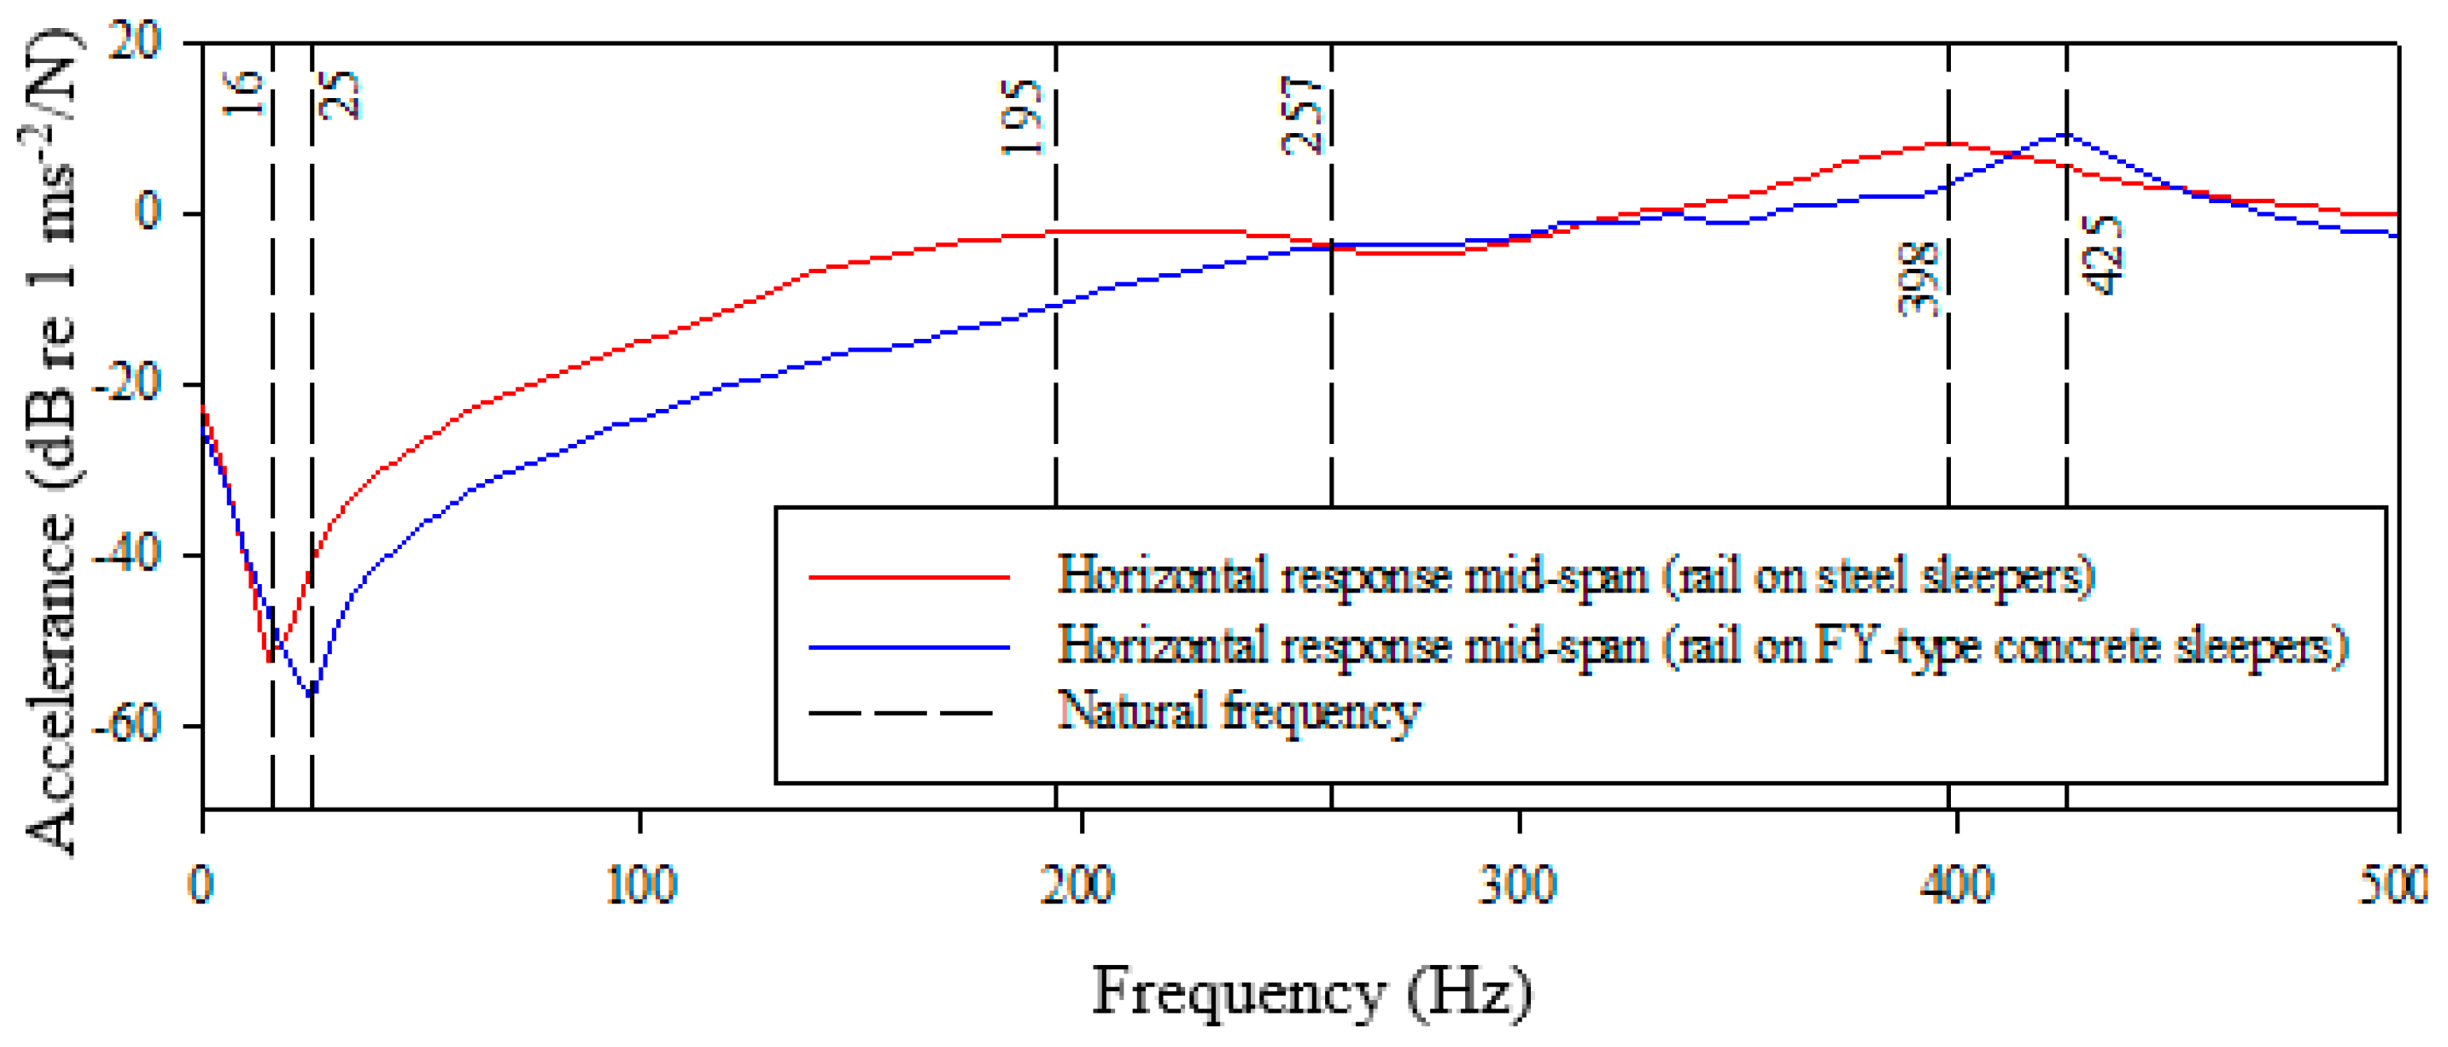
No activity of interest occurs from the vertical mid-span vibration of the rail laying on steel sleepers. In the vertical direction, no resonance mode was found to match the corrugation frequency in the Belfast to Steelpoort railway line, for both rails laying on concrete and steel sleepers. Figure 11 shows comparison of FRFs for the horizontal vibration response measured mid-span. The response is measured from rails laying on FY-type concrete and on steel sleepers.
Evident from Figure 11 is that in the horizontal direction, mid-span, the rails on FY-type concrete and on steel sleepers respond in somewhat a similar manner. Two resonance modes are identified in the horizontal direction from a mid-span vibration of the rail laying on steel sleepers. One resonance mode, which is more damped than the other, occurs at a frequency of 195 Hz, whilst the other occurs at 398 Hz. One resonance mode is identified in the horizontal direction, mid-span, from response of the rail laying on FY-type concrete sleepers. This resonance mode occurs at 425 Hz. In the horizontal direction, mid-span, the rail on steel sleepers vibrates with more accelerance in the low frequency range of 16–257 Hz.
No resonance mode is found to match the corrugation frequency in the Belfast to Steelpoort railway line. The closest resonance mode to the corrugation frequency in this railway line occurs from response of rail on steel sleepers, at 195 Hz in the horizontal direction. Figure 12 shows comparison of FRFs for the vertical vibration response measured on top of sleeper point. The response is measured from rails laying on FY-type concrete and on steel sleepers.
Evident from Figure 12 is that similar to the response measured mid-span, in the vertical direction, on top of sleeper point, there is not much activity from the response of rail laying on steel sleepers. The FRF for vertical response of rail on steel sleepers, on top of sleeper point, is much flatter than that of rail laying on FY-type concrete sleepers. One resonance mode occurs at 190 Hz in the vertical direction, from response of rail laying on FY-type concrete sleeper point. An antiresonance occurs from response of rail laying on FY-type concrete sleepers at a frequency of 272 Hz.
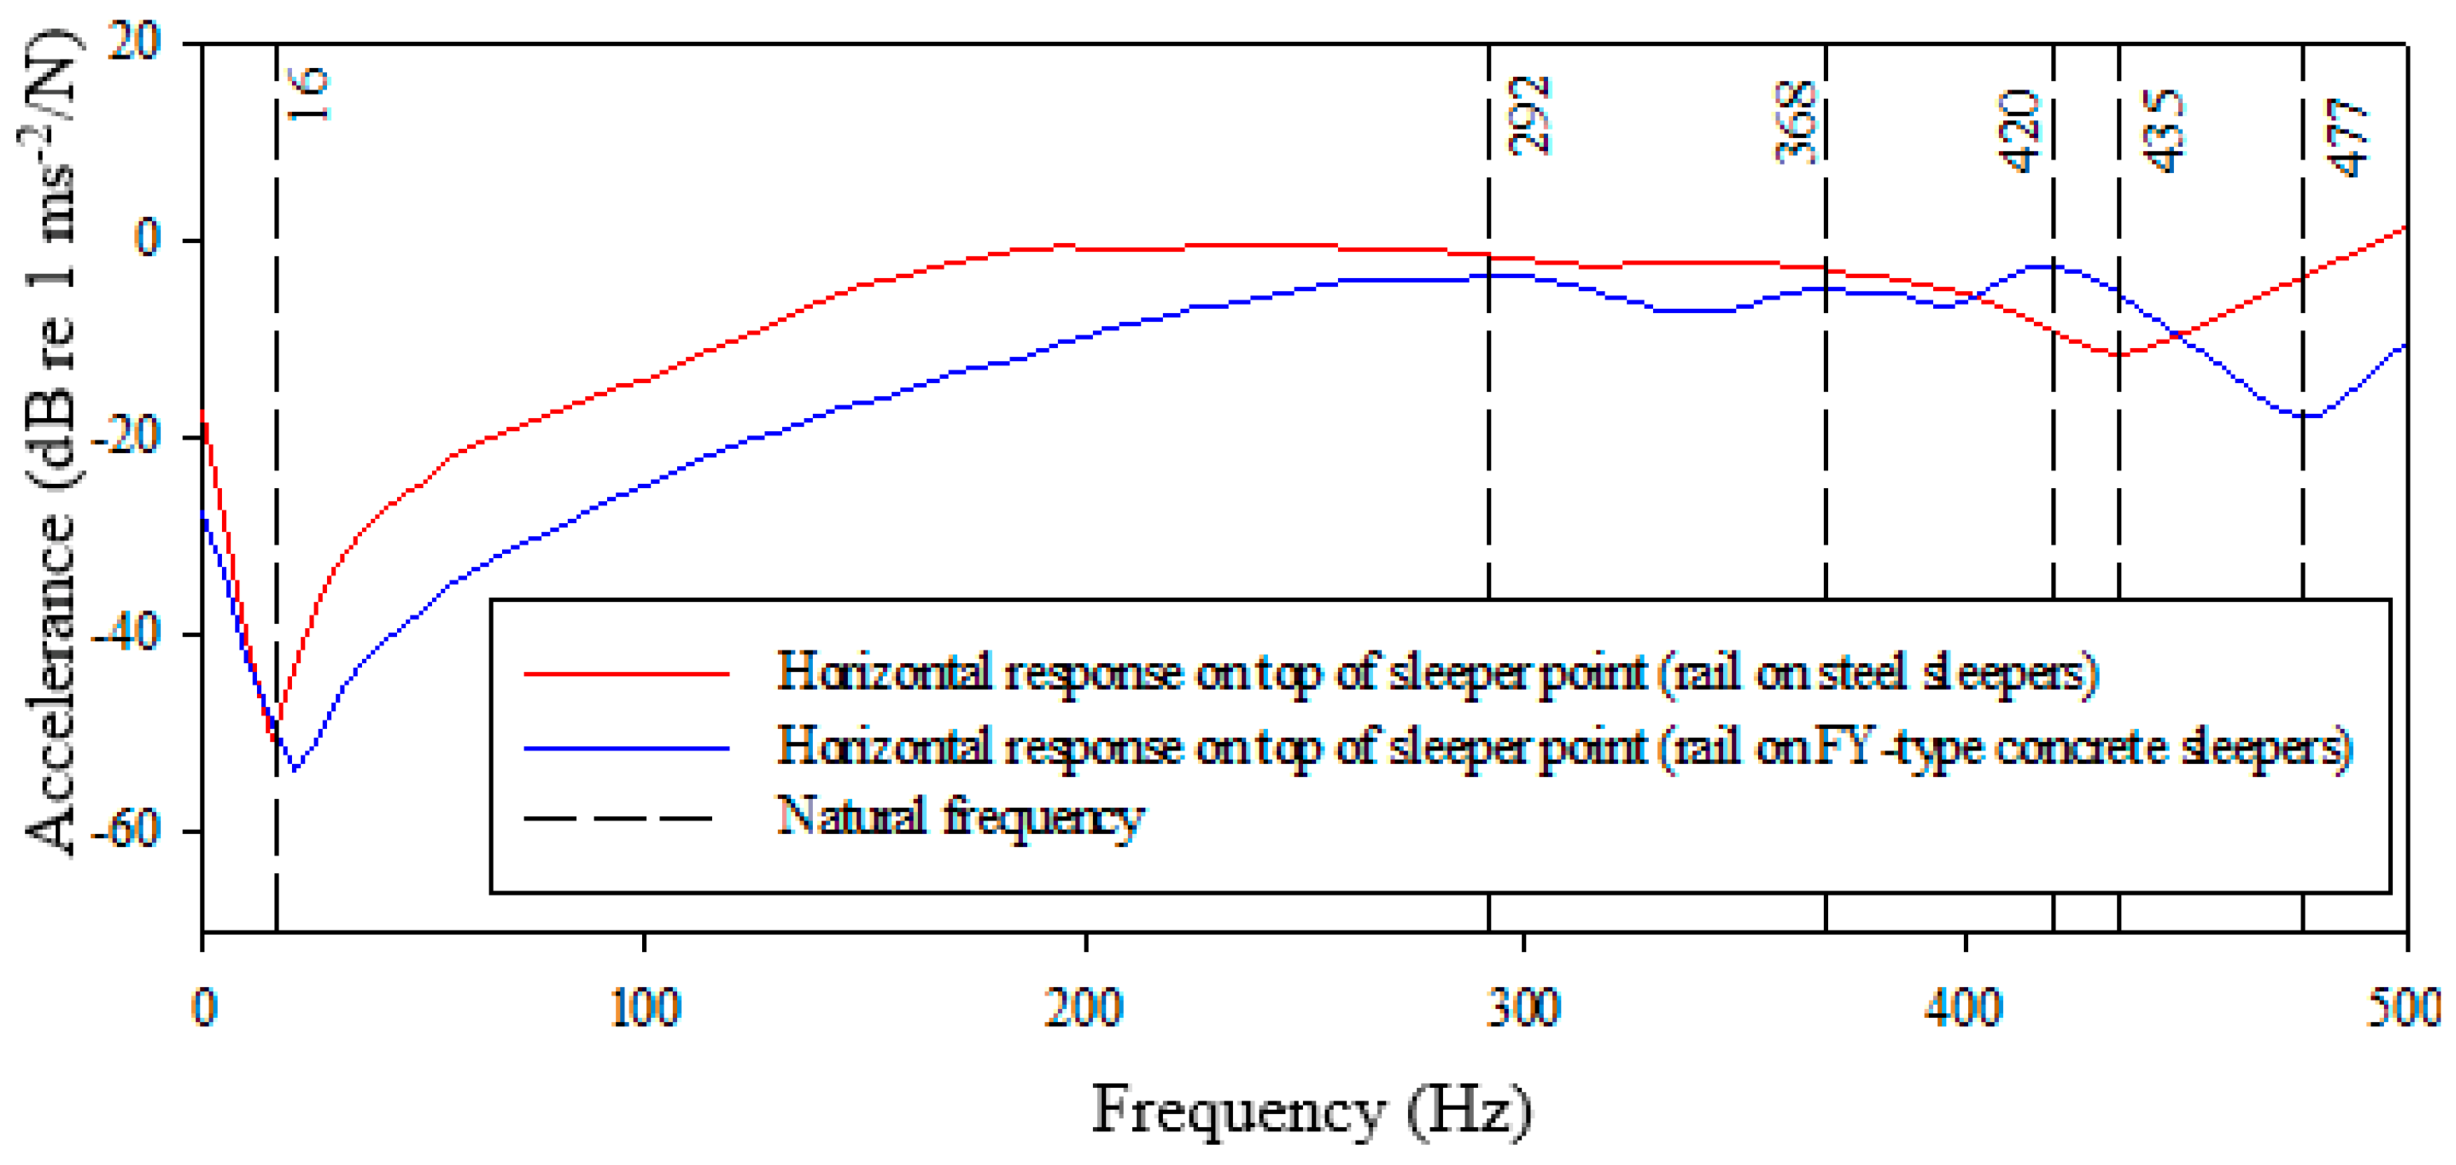
On top of sleeper point, the rail laying on steel sleepers responds to vibration with more accelerance than that laying on FY-type concrete sleepers, for the entire response period of 0–500 Hz. No resonance mode is found to match the corrugation frequency in the Belfast to Steelpoort railway line. The closest resonance mode to the corrugation frequency in the Belfast to Steelpoort railway line occurs at 190 Hz in the vertical direction, from rail laying on top of FY-type concrete sleepers. Figure 13 shows comparison of FRFs for the horizontal vibration response measured on top of sleeper point. The response is measured from rails laying on FY-type concrete and on steel sleepers.
Evident from Figure 13 is that on top of sleeper point, in the horizontal direction, more activity occurs from the response of rail laying on FY-type concrete sleepers. No resonance mode is identified in the horizontal direction on top of steel sleeper point; instead, one antiresonance is identified at 435 Hz. On the contrary, three resonance modes are identified from rail response in the horizontal direction on top of the FY-type concrete sleepers. The three resonance modes occur at 292 Hz, 368 Hz, and 420 Hz. One antiresonance occurs from response of rail laying on FY-type concrete sleepers in the horizontal direction, on top of sleeper point at 477 Hz.
No resonance mode is found to match the corrugation frequency in the Belfast to Steelpoort railway line. The first vibration mode occurs at 292 Hz from response of rail laying on top of FY-type concrete sleepers. Similar to the vertical response, the rail laying on steel sleepers responds with higher accelerance for most of the response period.
3.6. Results for Modal Analysis on Sleepers
Excitations were applied on the rail crown, whilst the response was measured directly on the sleepers. Vertical excitations were applied on the running surface of the rail, directly on top of sleeper point. Horizontal excitations were applied on the field side of the rail crown, directly on top of sleeper point. Figure 14 shows comparison of FRFs for the vertical vibration response measured on sleepers. The response is measured from steel, FY-type, and PY-type concrete sleepers.
Evident in Figure 14 is that the response of sleepers is less pronounced than that of wheels in the frequency range of 0–500 Hz. In the vertical direction, sleepers respond in a similar manner as compared to the rail. At the beginning of the vibration period, one or two resonance modes occur, whereafter the sleepers vibrate at no resonance. The steel sleeper has a more damped response in the vertical direction, than the concrete sleepers. This is evident in particular for the response in the frequency range of 97–00 Hz. In this frequency range the response of a steel sleeper is much flatter than that of the concrete sleepers, with no identified resonance modes. The steel sleeper responds with a higher accelerance than concrete sleepers, for the entire response period.
The first resonance mode occurs at a frequency of 80 Hz for steel and FY-type concrete sleepers, whilst it occurs at 150 Hz for the PY-type concrete sleeper. The second resonance mode for the FY-type sleeper occurs at 196 Hz. The FY-type concrete sleeper vibrates with a higher accelerance than the PY-type from beginning of vibration to 319 Hz. The PY-type concrete sleeper only vibrates at higher accelerance than the FY-type in the frequency range of 319–500 Hz. No resonance mode is found to match the corrugation frequency in Belfast to Steelpoort railway line. The closest resonance mode to corrugation frequency occurs at 80 Hz from response of steel and FY-type concrete sleepers. Figure 15 shows comparison of FRFs for the vertical horizontal response measured on sleepers. The response is measured from steel, FY-type, and PY-type concrete sleepers.
Evident form Figure 15 is that in the horizontal direction more activity occurs from response of steel sleepers than the other two types of concrete sleepers. Similar to the vertical direction, in the horizontal direction, the vibration of sleepers reaches peak time at different frequencies. This is the time from the beginning of vibration to the first highest peak, whereafter the FRF starts to take a different shape of response. The peak time for response of concrete sleepers occurs around 75 Hz, whilst that of steel sleepers occurs at 120 Hz. In the frequency range of 120–500 Hz, more resonance modes are identified from response of steel sleepers, than from that of concrete sleepers. The steel sleeper resonance modes are identified at frequencies of 160 Hz, 235 Hz, 330 Hz, and 445 Hz. These resonance modes are damped, with broad and flat FRF peaks.
One damped resonance mode is identified at 370 Hz from response of the PY-type concrete sleeper. The FY-type concrete sleeper also vibrates with a damped resonance mode at this frequency (370 Hz), whilst the steel sleeper vibrates with antiresonance. The second resonance mode for the FY-type concrete sleeper occurs at 415 Hz. In the horizontal direction, the steel sleeper vibrates with a higher accelerance than the concrete sleepers, for the entire response period of 0–500 Hz. The PY-type concrete sleeper vibrates with a higher accelerance than the FY-type in the frequency range of 0–235 Hz. No resonance mode is found to occur at a corrugation frequency in the Belfast to Steelpoort railway line.
3.7. Results for Finite Element Modelling for Rail Tracks
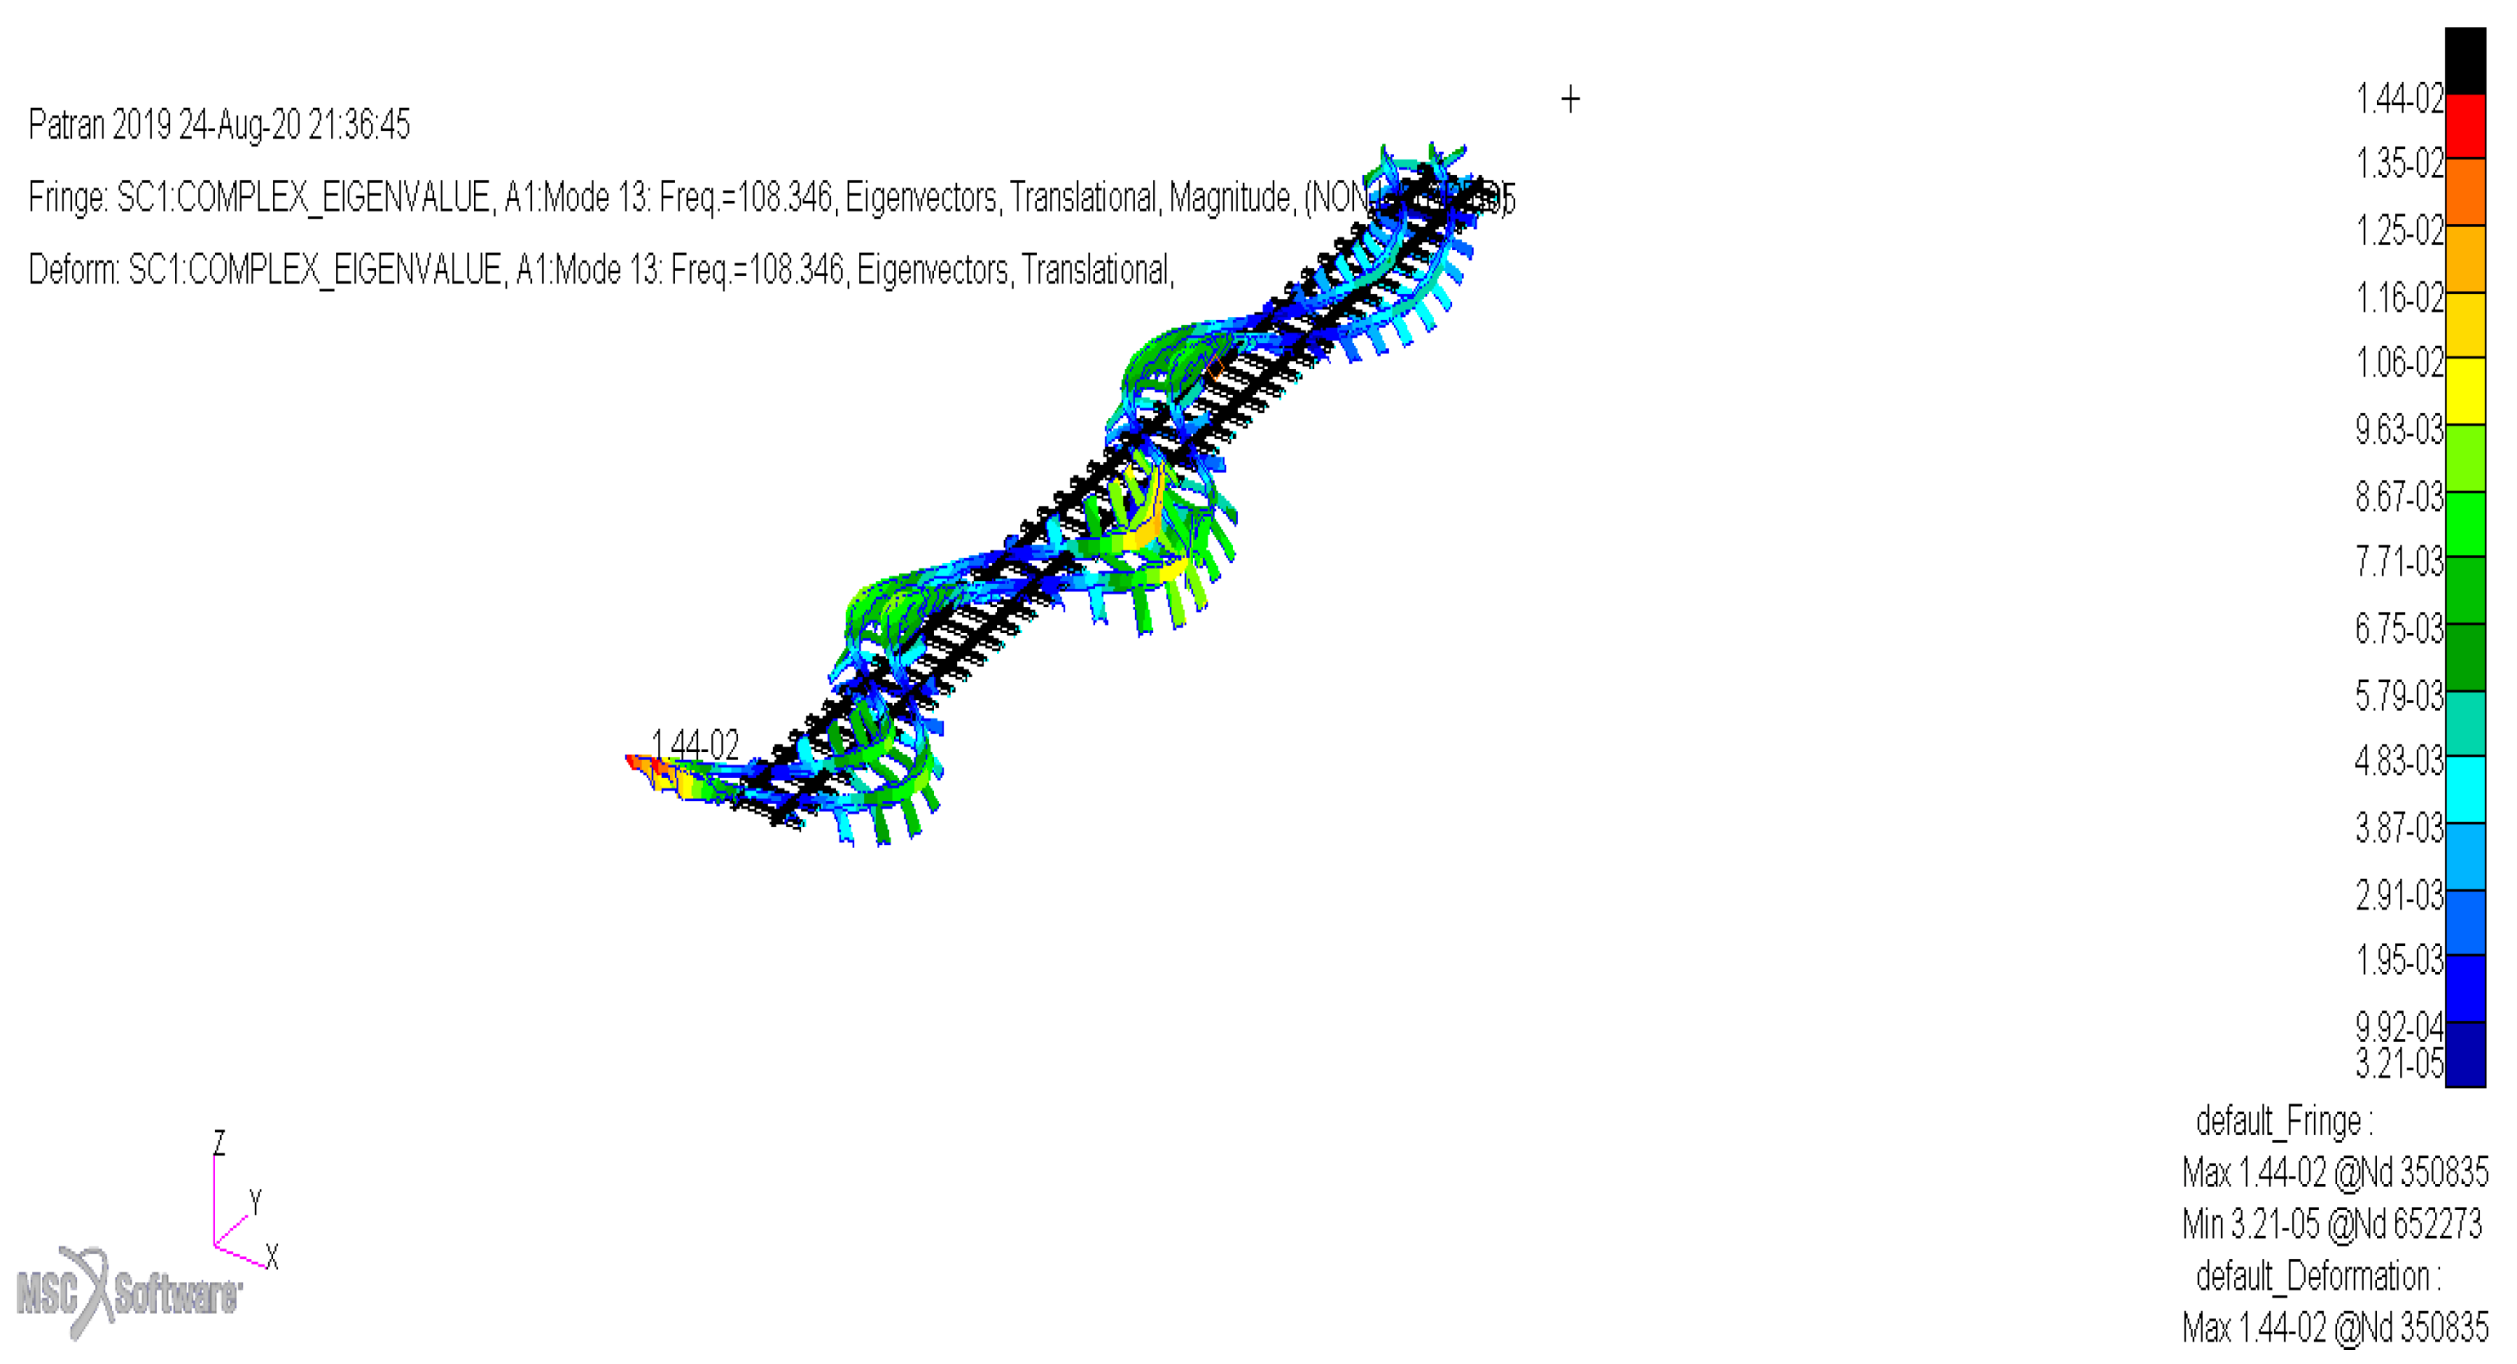
Figure 16 shows complex eigenvalue analysis results for the railway track model with steel sleepers at 108 Hz.
The rail track model results in Figure 16 show the deformed and undeformed shapes. For the rail track models the legend in the figure presents displacements with the units in meters. For normalization, a generalized modal mass is equal to unity. The colour coding in the legend correspond to the colours in the deformed shape of the model results. It is noted in Figure 16 that the nodes of the rail track situated around the black, red, orange, and yellow colours experience the largest displacement, with the maximum displacement of 14.4 mm occurring at node 1,061,561. The nodes situated around the green to blue colours experience average to least displacement, with the smallest displacement being 0.962 mm.
Figure 16 shows the bending mode of the rail track with steel sleepers at a frequency of 108 Hz. It is seen in Figure 16 that at 108 Hz the rail on steel sleepers vibrates with a bending mode in the horizontal direction. At this mode, the ballast remains at its original position, whilst the sleepers take the shape of the rail as they are joined together. The wheelset at this mode also takes a complicated shape as it is glued to the rails to avoid dislocation during vibration. Figure 17 shows a clearer view of this vibration mode for sleepers and rail.
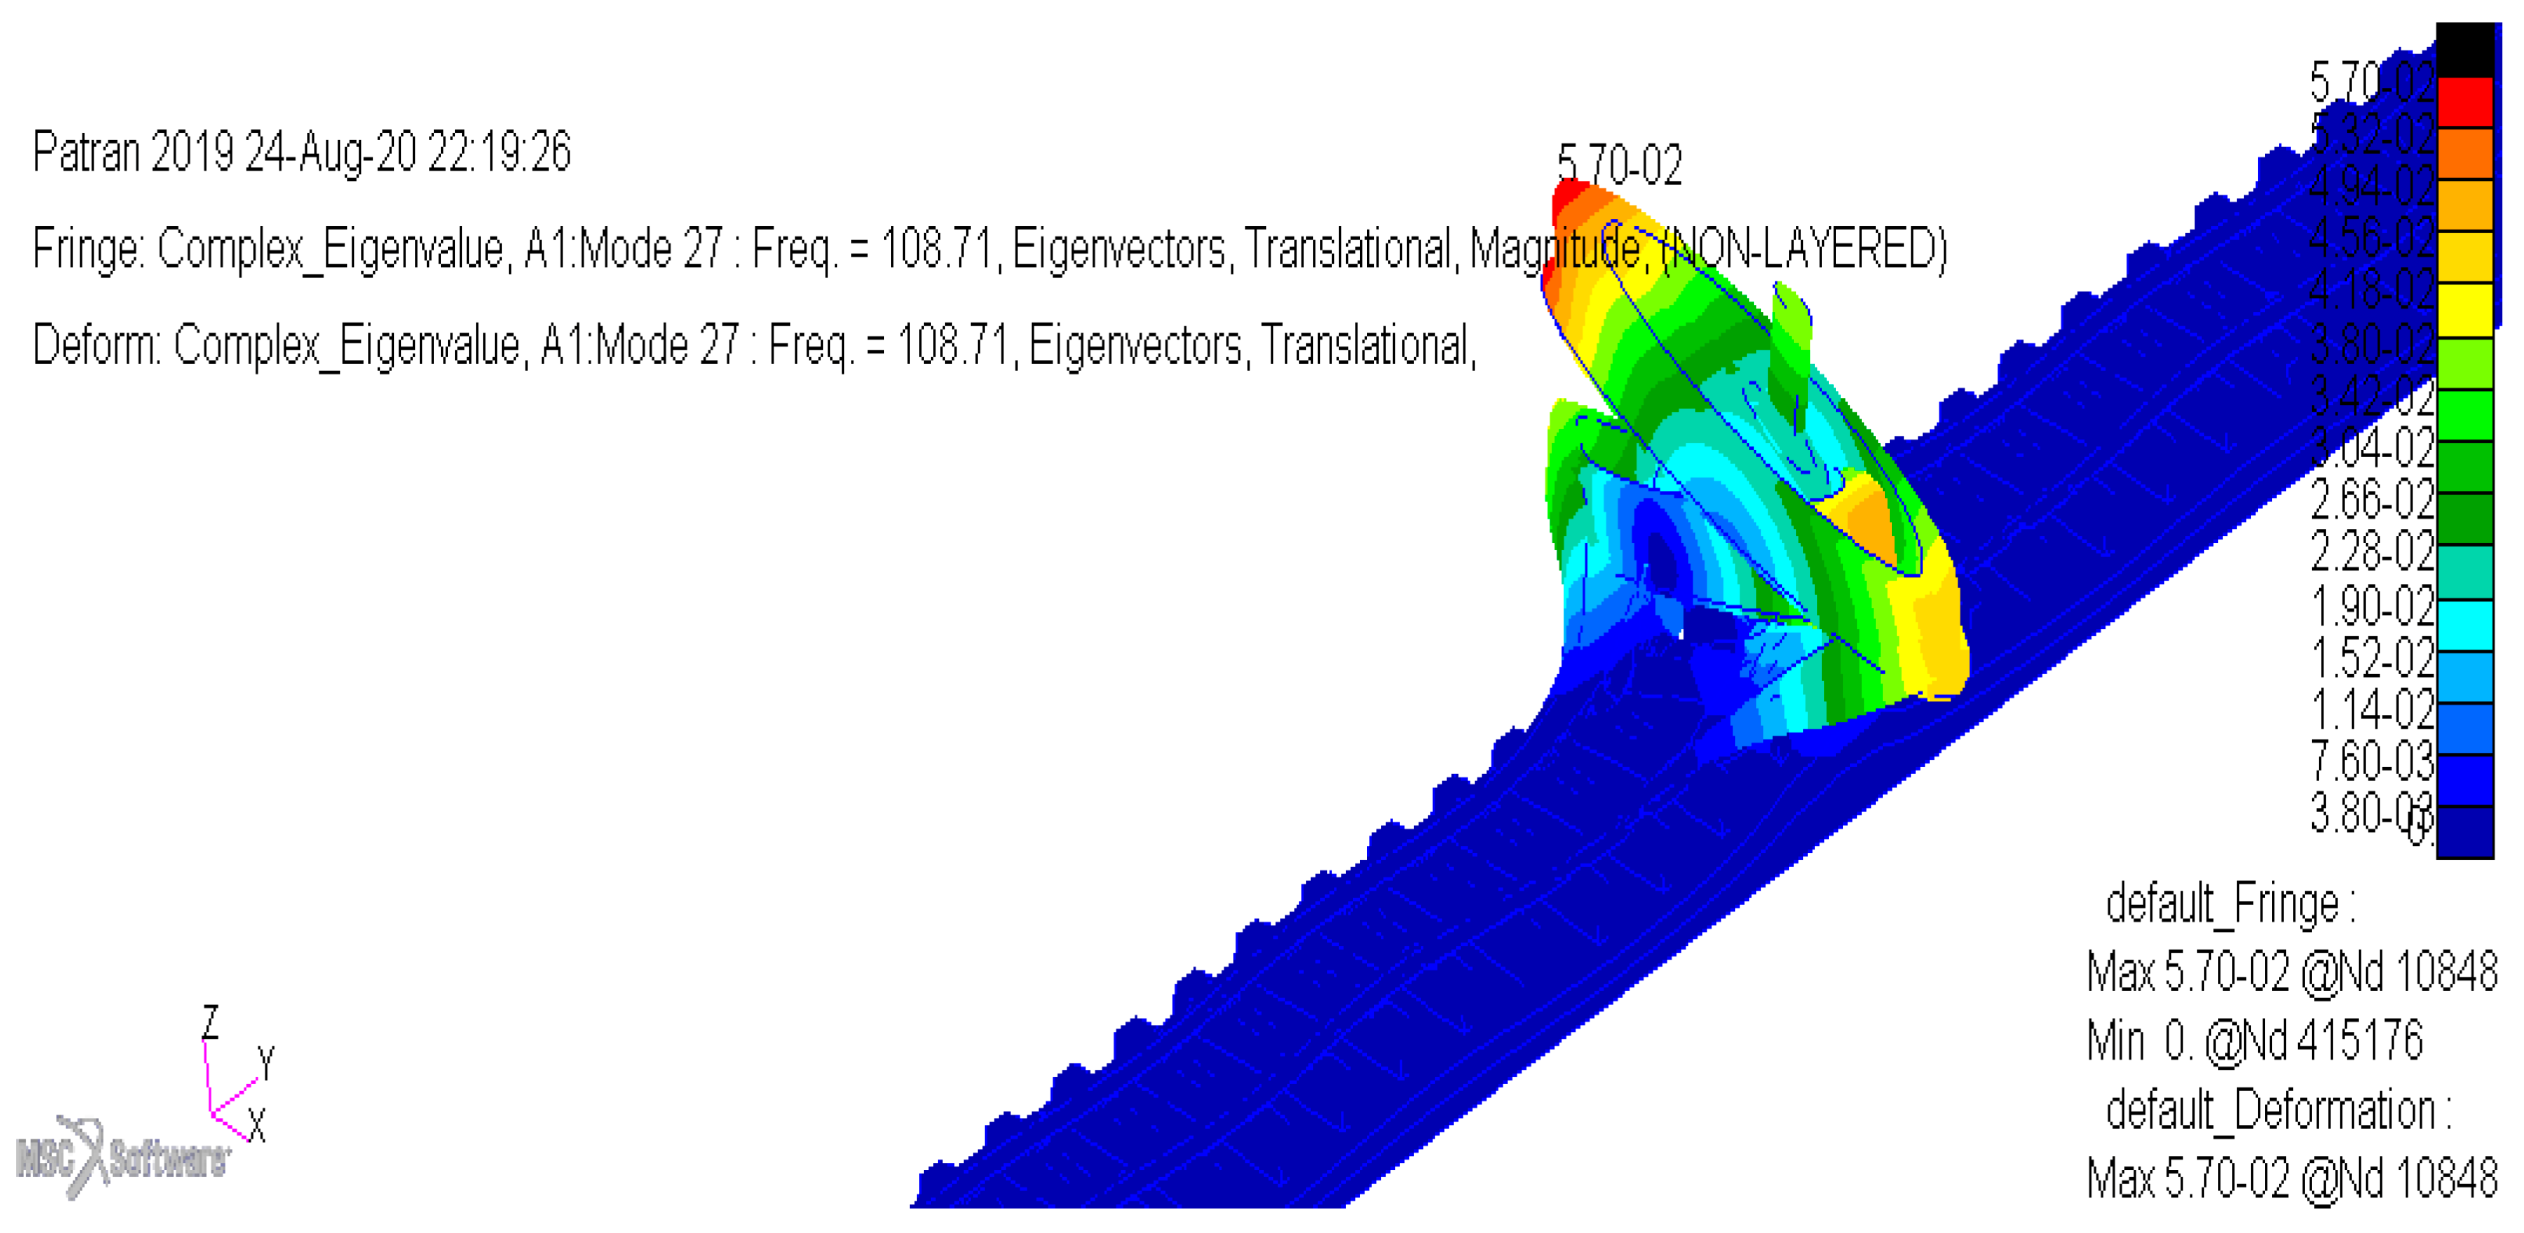
It is seen in Figure 17 that the rail track displacement is at its highest in the middle, where the traction wheelset is modelled. It is also clear from this figure that at 108 Hz, the rail merely bends horizontally without any displacement vertically and or attempting to twist the track. The rest of the mode shapes at different frequencies are found in Appendix C. Figure 18 shows complex eigenvalue analysis results for the railway track model with concrete sleepers at 108 Hz.
As seen in Figure 18, contrary to the rail track model with steel sleepers, the rail track with concrete sleepers shows no vibration modes in the horizontal direction. The rail track with concrete sleepers shows a vertical bending mode at 108 Hz, with a minimum displacement of 3.8 mm. In the middle of the track, the wheelset-rail system shows a complex vibration mode. This is given that the wheelset is glued to the rails, hence the rails follow the wheelset displacement. More resonance modes that showed some clear activity occur in frequencies lower than 108 Hz are found in Appendix D.
4. Results Discussion
In an attempt to reduce negative effects on the railway track and the ecology around it in the Limpopo Province of South Africa, this study analyses the behaviour of the D39 200 locomotive wheelset and rail tracks on steel and concrete sleepers. The investigation is conducted for a frequency range of 0–500 Hz, which corresponds to short pitch rail corrugation. This was done by experimentally determining the natural frequencies of the D39 200 locomotive wheelset and rail tracks to investigate the resonance modes and mode shapes that are associated with corrugation frequency of 108 Hz. The FEM is used to validate experimental modal analysis performed on the wheelset and mode shapes of the wheelset are studied from the wheelset and track models. We show in Figure 8 that the second bending mode of the wheelset that occurs at 108 Hz matches corrugation frequencies (reasonably closer) on track curves 10, 12, and 20 (Tp10, Tp12 and Tp20). We observe that it is also very close to corrugation frequencies for most of the other track curves than any other resonance mode of the wheelset. Corrugation frequencies are calculated twice for Tp7 to validate repeatability of the results. This was done by measuring corrugation wavelengths in the beginning and in the middle of a track curve whilst using the same average train speeds.
Vibration modes of the traction wheelset obtained through experimental modal analysis are validated with an FEA model. A percentage difference of about 7.77% is observed on the vibration mode frequencies obtained through experimental and FEA approaches (see Table 13). The first bending mode shape occurs at the frequency of 100.68 Hz. The frequency of 100.68 Hz is the closest to the first bending mode of 108 Hz found through experimental modal analysis. This vibration mode tends to bend the wheelset axle towards and away from the ground whilst turning the wheels sideways along the vertical axis reference. This resonance mode is found to be associated with the development of corrugation on rails in the Belfast to Steelpoort rail track. The last bending mode identified in the frequency range of a short pitch corrugation occurs at 158.94 Hz and this is found in Appendix A.
As seen in Figure 10, Figure 11, Figure 12, Figure 13, Figure 14 and Figure 15, response FRFs for rails and sleepers are not as pronounced as those for the traction wheelset (see Figure 7). The reason for this is explained by Thompson [26], to be due to the fact that the wheel is a finite and lightly damped structure. On the other hand, the rail is an infinite continuous body, which as a result, it easily works as a waveguide, allowing one or more waves to spread away and sideways (along the rail length) from the point of excitation. Thus, the rail presents one or two resonance modes, after which it works as a waveguide. Generally, vibration of rail track is more damped than that of wheels.
With respect to the response of rails, the rail laying on concrete sleepers vibrate with more resonance modes both vertically and horizontally, than rail on steel sleepers, except mid-span in the horizontal direction (see Figure 10, Figure 11, Figure 12 and Figure 13). Even though these resonance modes are not close enough to the corrugation frequency of 108 Hz, this finding is in line with the fact that corrugation on the line does not exist on rails with steel sleepers. Contrary to that, the rail on steel sleepers vibrate with higher accelerance than that on concrete sleepers, except in the vertical direction mid-span. Even though this acceleration of vibration per unit force cannot be directly linked to corrugation formation, the difference in it can be explained by the fact that there is a difference in mass between rails laying on these types of sleepers. The rail on concrete sleepers weighs 57 kg/m, whilst that on steel sleepers weighs 48 kg/m. It is generally understood that the heavier the structure, the lesser it can vibrate. Rail response FRFs show that vibration by rail on steel sleepers is more damped than that of rail on concrete sleepers, except in the horizontal direction mid-span. This damping is noted by much flatter FRFs than those for rail on concrete sleepers.
With respect to vibration response of sleepers, vibration of steel sleepers is more damped in the vertical but not as damped in the horizontal direction than that of concrete sleepers. This can be seen in Figure 14 where the FRF is flat for steel sleepers in the vertical direction, and Figure 15 where a few resonance modes are identified for same sleepers in the horizontal. This is validated by the FEA complex eigenvalue analysis results for track with steel sleepers in Figure 16 and Figure 17, where a mode shape at 108 Hz shows a horizontal displacement. Similar to the response of rails, accelerance is higher for steel sleepers than that of concrete sleepers.
In terms of response of concrete sleepers, a few resonance modes are identified vertically and horizontally. Experimentally, no resonance mode was excited on rails and sleepers at 108 Hz, however the complex eigenvalue analysis excited the resonance mode that matches the corrugation frequency at 108 Hz, for both track with steel and concrete sleepers (see Figure 16, Figure 17 and Figure 18). The complex eigenvalue analysis results show that contrary to the rail track with steel sleepers, the rail track with concrete sleepers has a resonance mode in the vertical direction at 108 Hz. This is noted by the bending mode of rails in the vertical direction with complete waves, giving a mode that Garcia [27] refers to as a “rail vibration” mode. This (rail track with concrete sleepers) is the rail track on which corrugation formed. It is generally accepted that corrugation on rails is linked with vertical vibration [27] and increasing the vertical clamping force of rail fasteners reduces corrugation formation [28].
5. Implications, Conclusions, and Recommendations
The findings in this study will be useful to train wheels design engineers and also to railway engineers. Train wheels design engineers may utilise findings in this work to look at designing train wheelsets that will not give rise to short pitch rail corrugation through excessive lateral vibrations. Railway engineers may utilise findings in this work to look at different mechanisms that may be affected on railway train wheels to ultimately suppress excessive vibration, which may lead to wheel and rail damage and also give rise to rail corrugation. These mechanisms should aim at suppressing the vertical dynamics of the rail track with concrete sleepers, more particularly at 108 Hz. Modal and complex eigenvalue analysis methodology can be used by railway engineers to test the structural characteristics of wheels and tracks for a variety of purposes.
Wheel-rail vibration models have been developed to study association of wheels and rail dynamics to short pitch corrugation in the Belfast to Steelpoort railway line. Traction wheelset vibration modes have been correlated with corrugation frequencies. For the D39 200 locomotive traction wheelset, a first bending mode of vibration that occurs at 108 Hz is found to be closely associated with the formation of corrugation on rails in the railway line. A mode shape occurring at 100 Hz described in the results section (see Figure 9) is experienced by the traction wheelset, whereas the vertically bending mode shape for track with concrete sleepers and horizontally bending track with steel sleepers are found at 108 Hz.
To protect the environment around the excessively vibrating rail track, it is of importance to employ measures to damp wheel-rail resonance modes at a frequency range of 0–108 Hz which corresponds to a short pitch corrugation. This can be done at a design stage of the wheels, where shape, mass, and stiffness of the wheels can be altered to achieve adequate lateral damping. For wheels that are already manufactured, train wheels vibration dampers may be looked into, to eliminate excessive lateral vibration of the wheels. Train wheel dampers will require tuning to absorb resonance frequencies of interest, depending on the type and frequency of corrugation on rails.
In terms of vibration damping for rail track with concrete sleepers, it is recommended that field trials be conducted to install and monitor different types of rail fastening systems that can increase the vertical clamping force of fasteners to adequate levels. Also, different rail pads may form part of the trial, to ascertain the best suitable rail pad to prevent vibration that may be linked to formation of rail corrugation in the railway line.
Author Contributions
B.M.B. conceived the idea, developed the theory and performed computations. D.V.V.K. verified the analytical methods. B.M.B. planned and developed experiments. D.V.V.K. verified the experimental results. B.M.B. and D.V.V.K. discussed the results, B.M.B. wrote the manuscript. Both B.M.B. and D.V.V.K. contributed in the final manuscript. D.V.V.K. supervised the project. All authors have read and agreed to the published version of the manuscript.
Funding
This research received no external funding.
Conflicts of Interest
The authors declare no conflict of interest.
Appendix A. Mode Shapes for D39 200 Locomotive Class Wheelset Vibration Response
Figure A1.
Mode at 158.94 Hz.

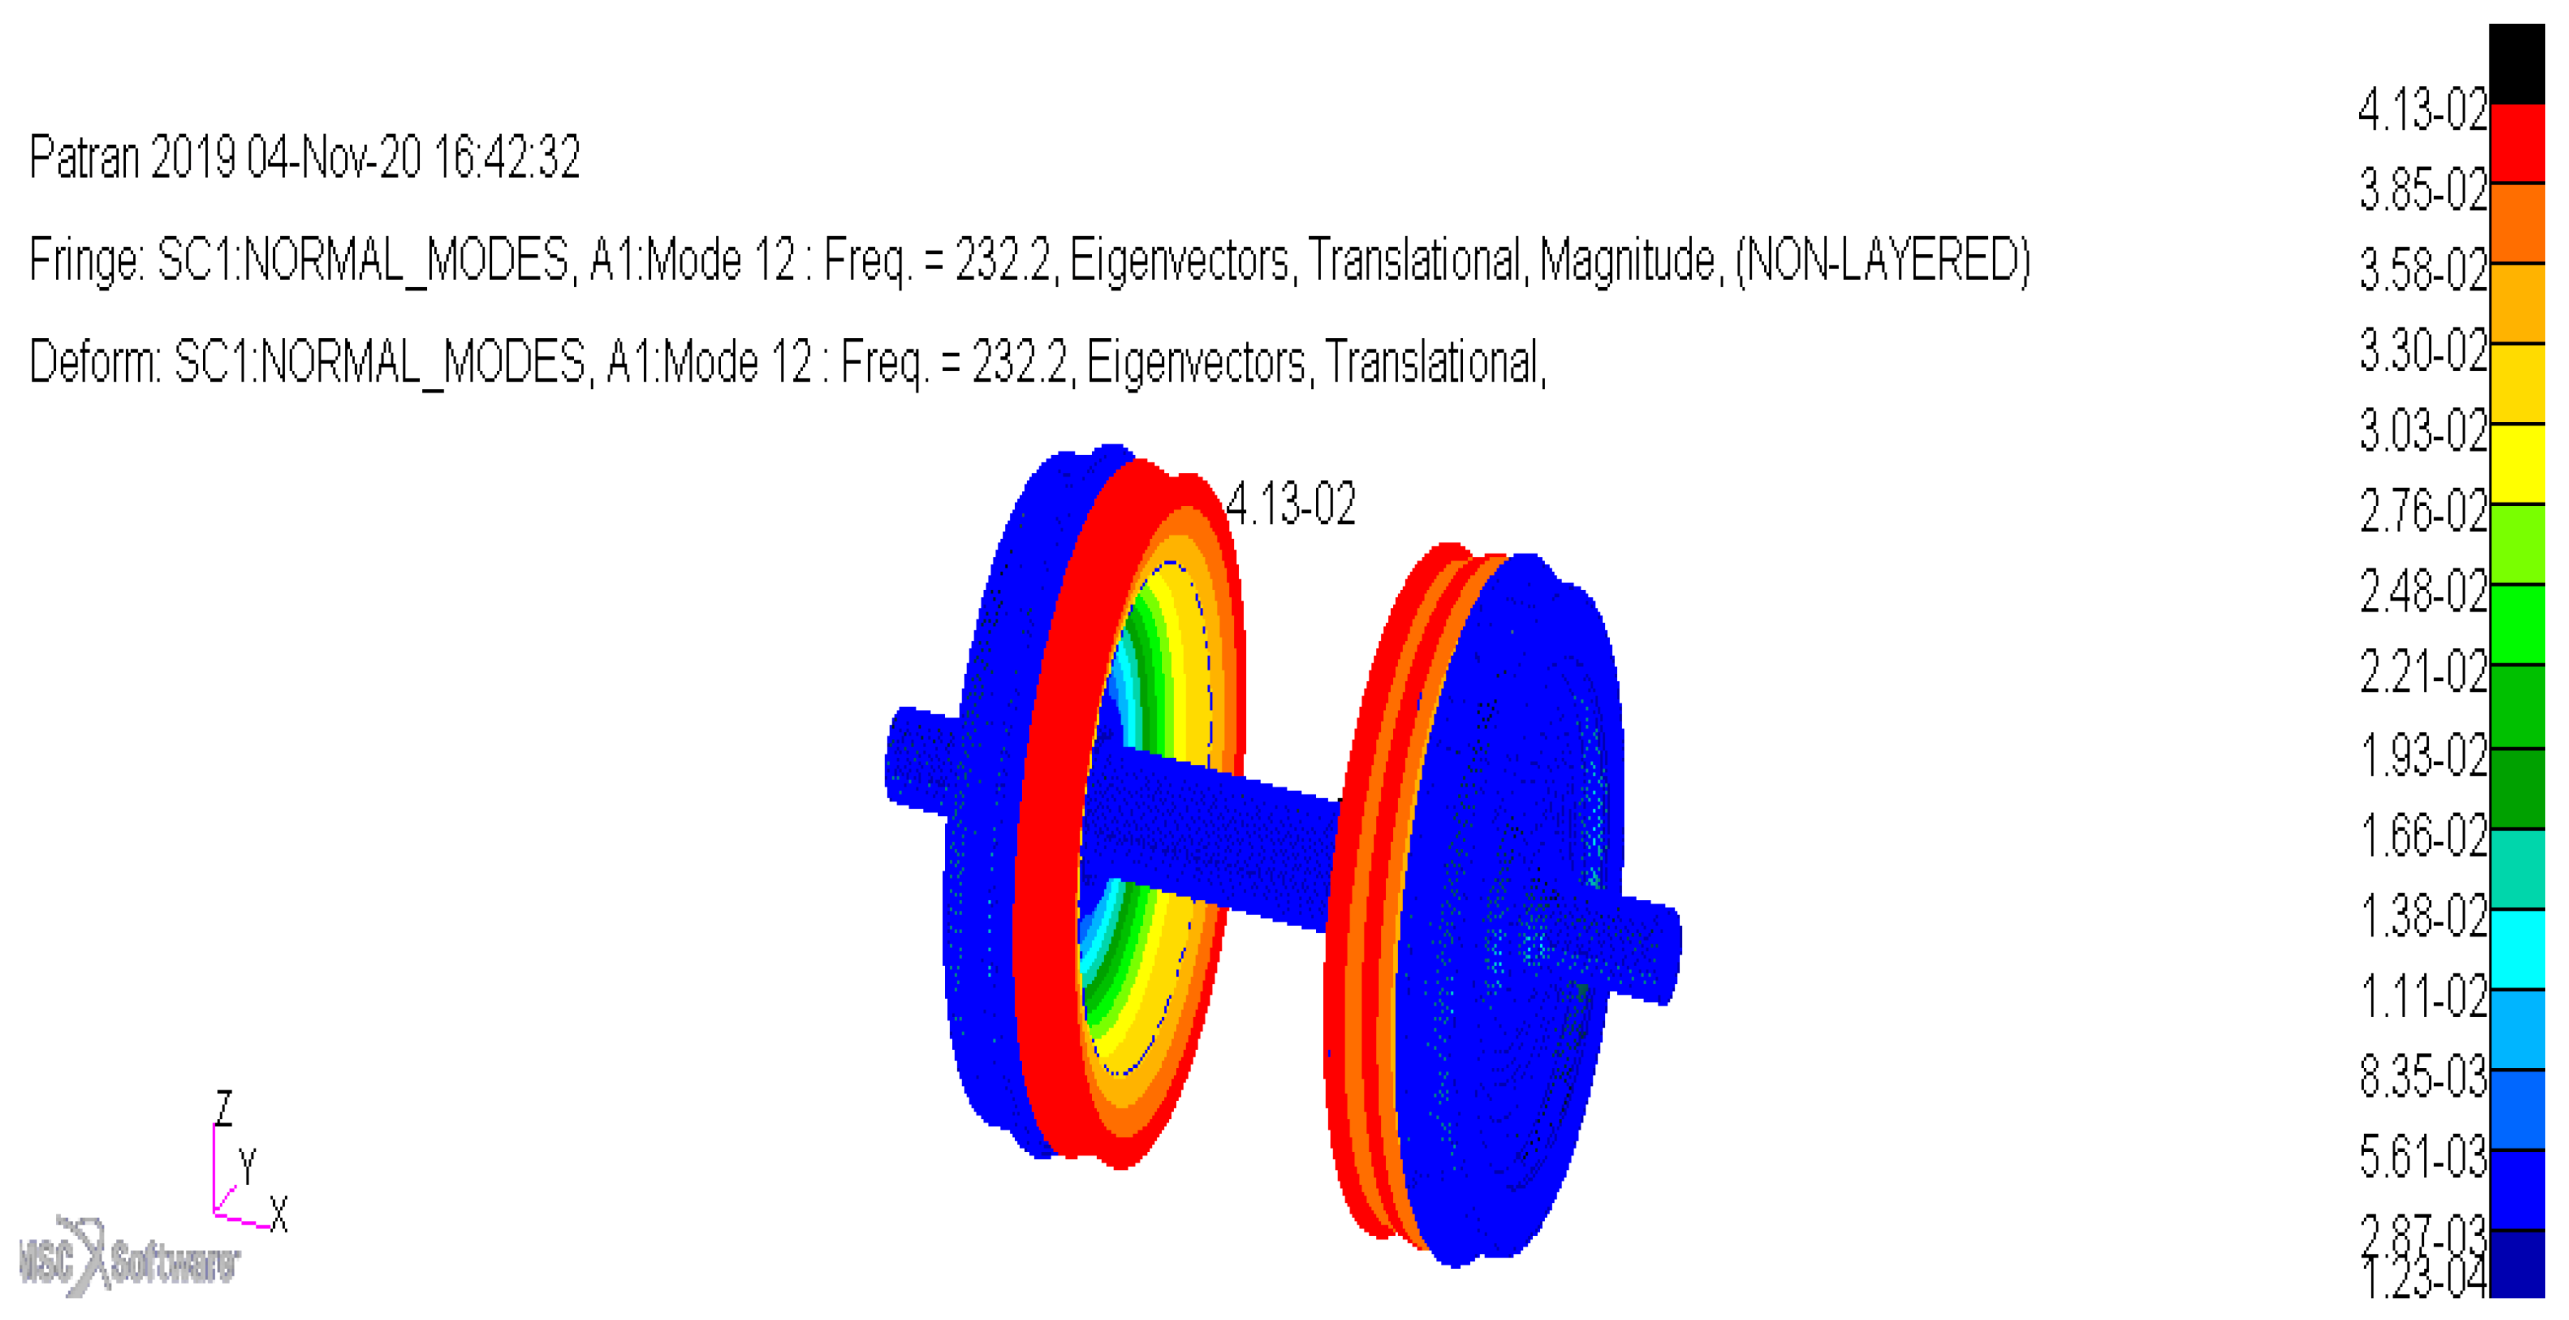
Figure A2.
Mode at 232.2 Hz.

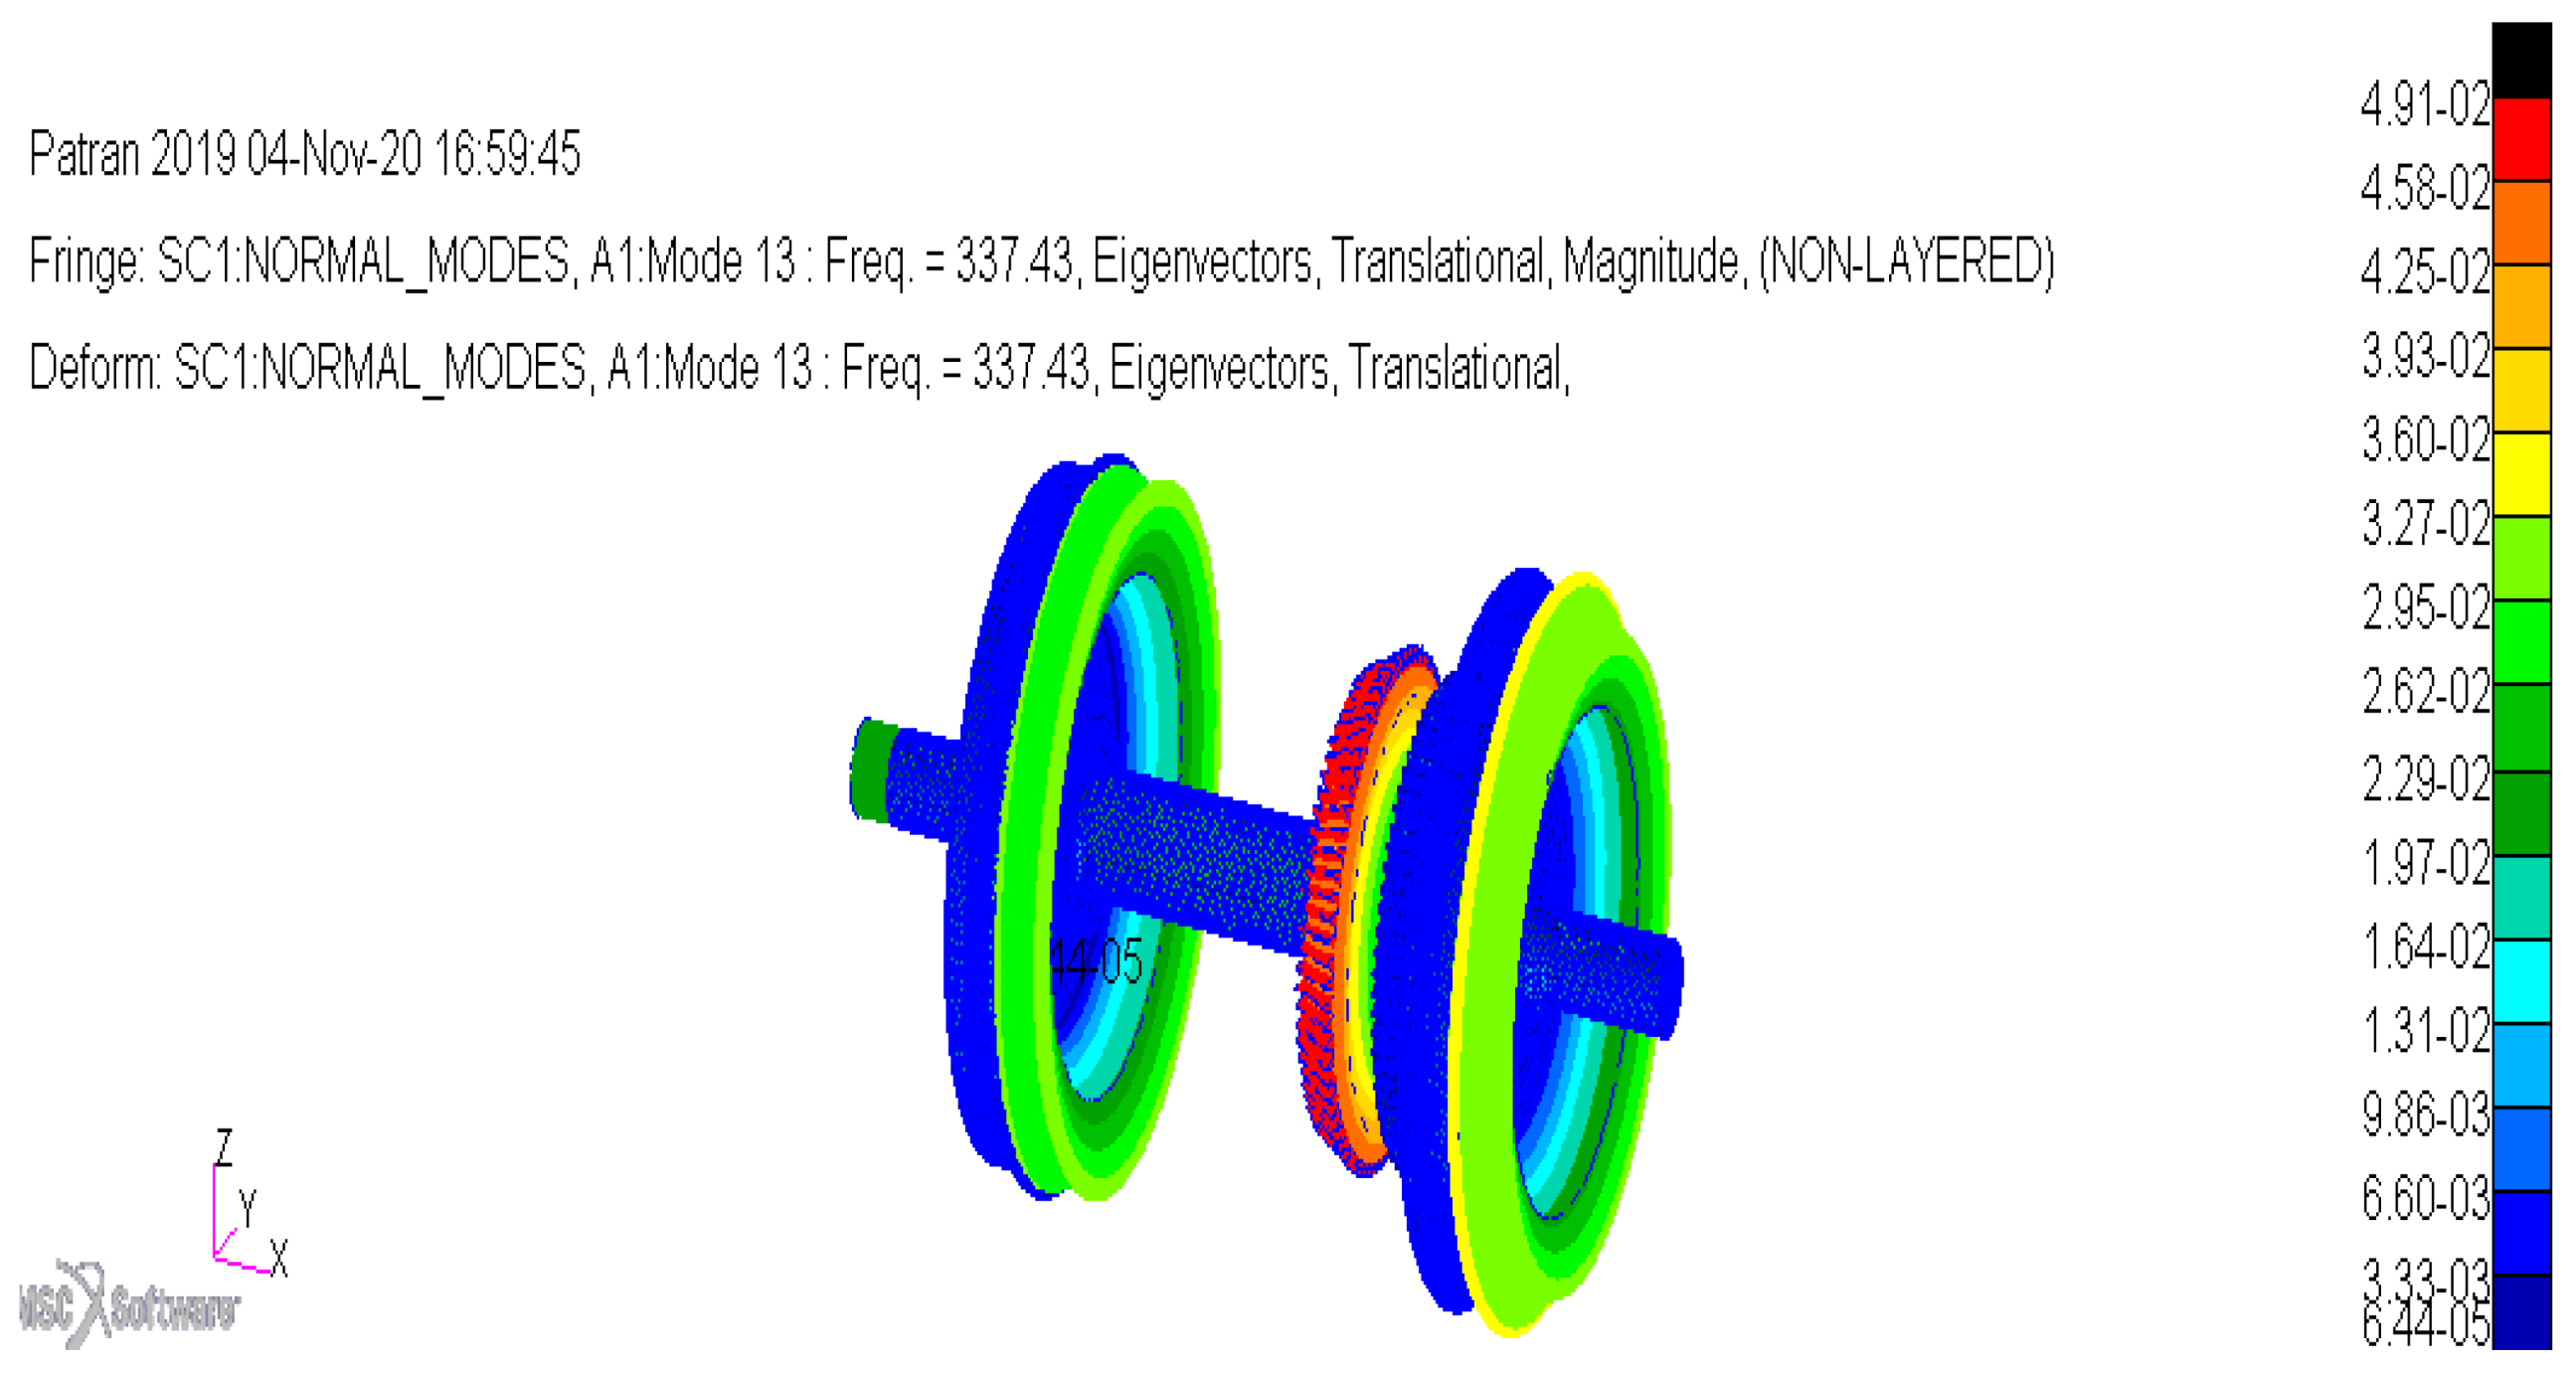
Figure A3.
Mode at 337.43 Hz.

Figure A4.
Mode at 374.49 Hz.

Figure A5.
Mode at 497.57 Hz.

Appendix B

Table A1.
Track Components that are Above the Ballast and the Orientation of the Accelerometer during Experimental Modal analysis.
Table A1.
Track Components that are Above the Ballast and the Orientation of the Accelerometer during Experimental Modal analysis.
| Accelerometer Orientation and Track Components | |
|---|---|
| Track kilometer point | 178/3 |
| Sleeper type | FY-type concrete sleeper |
| Fastening system | FISTclip |
| Rail pad | HDPE |
| Rail mass | 57 kg/m |
| Accelerometer orientation |
|
| Track kilometer point | 181/6 |
| Sleeper type | Steel sleeper |
| Fastening system | Bolt |
| Rail pad | Not applicable |
| Rail mass | 48 kg/m |
| Accelerometer orientation |
|
| Track kilometer point | 187/13 |
| Sleeper type | PY-type concrete sleeper |
| Fastening system | eClip |
| Rail pad | Hytrel/6358 |
| Rail mass | 57 kg/m |
| Accelerometer orientation |
|
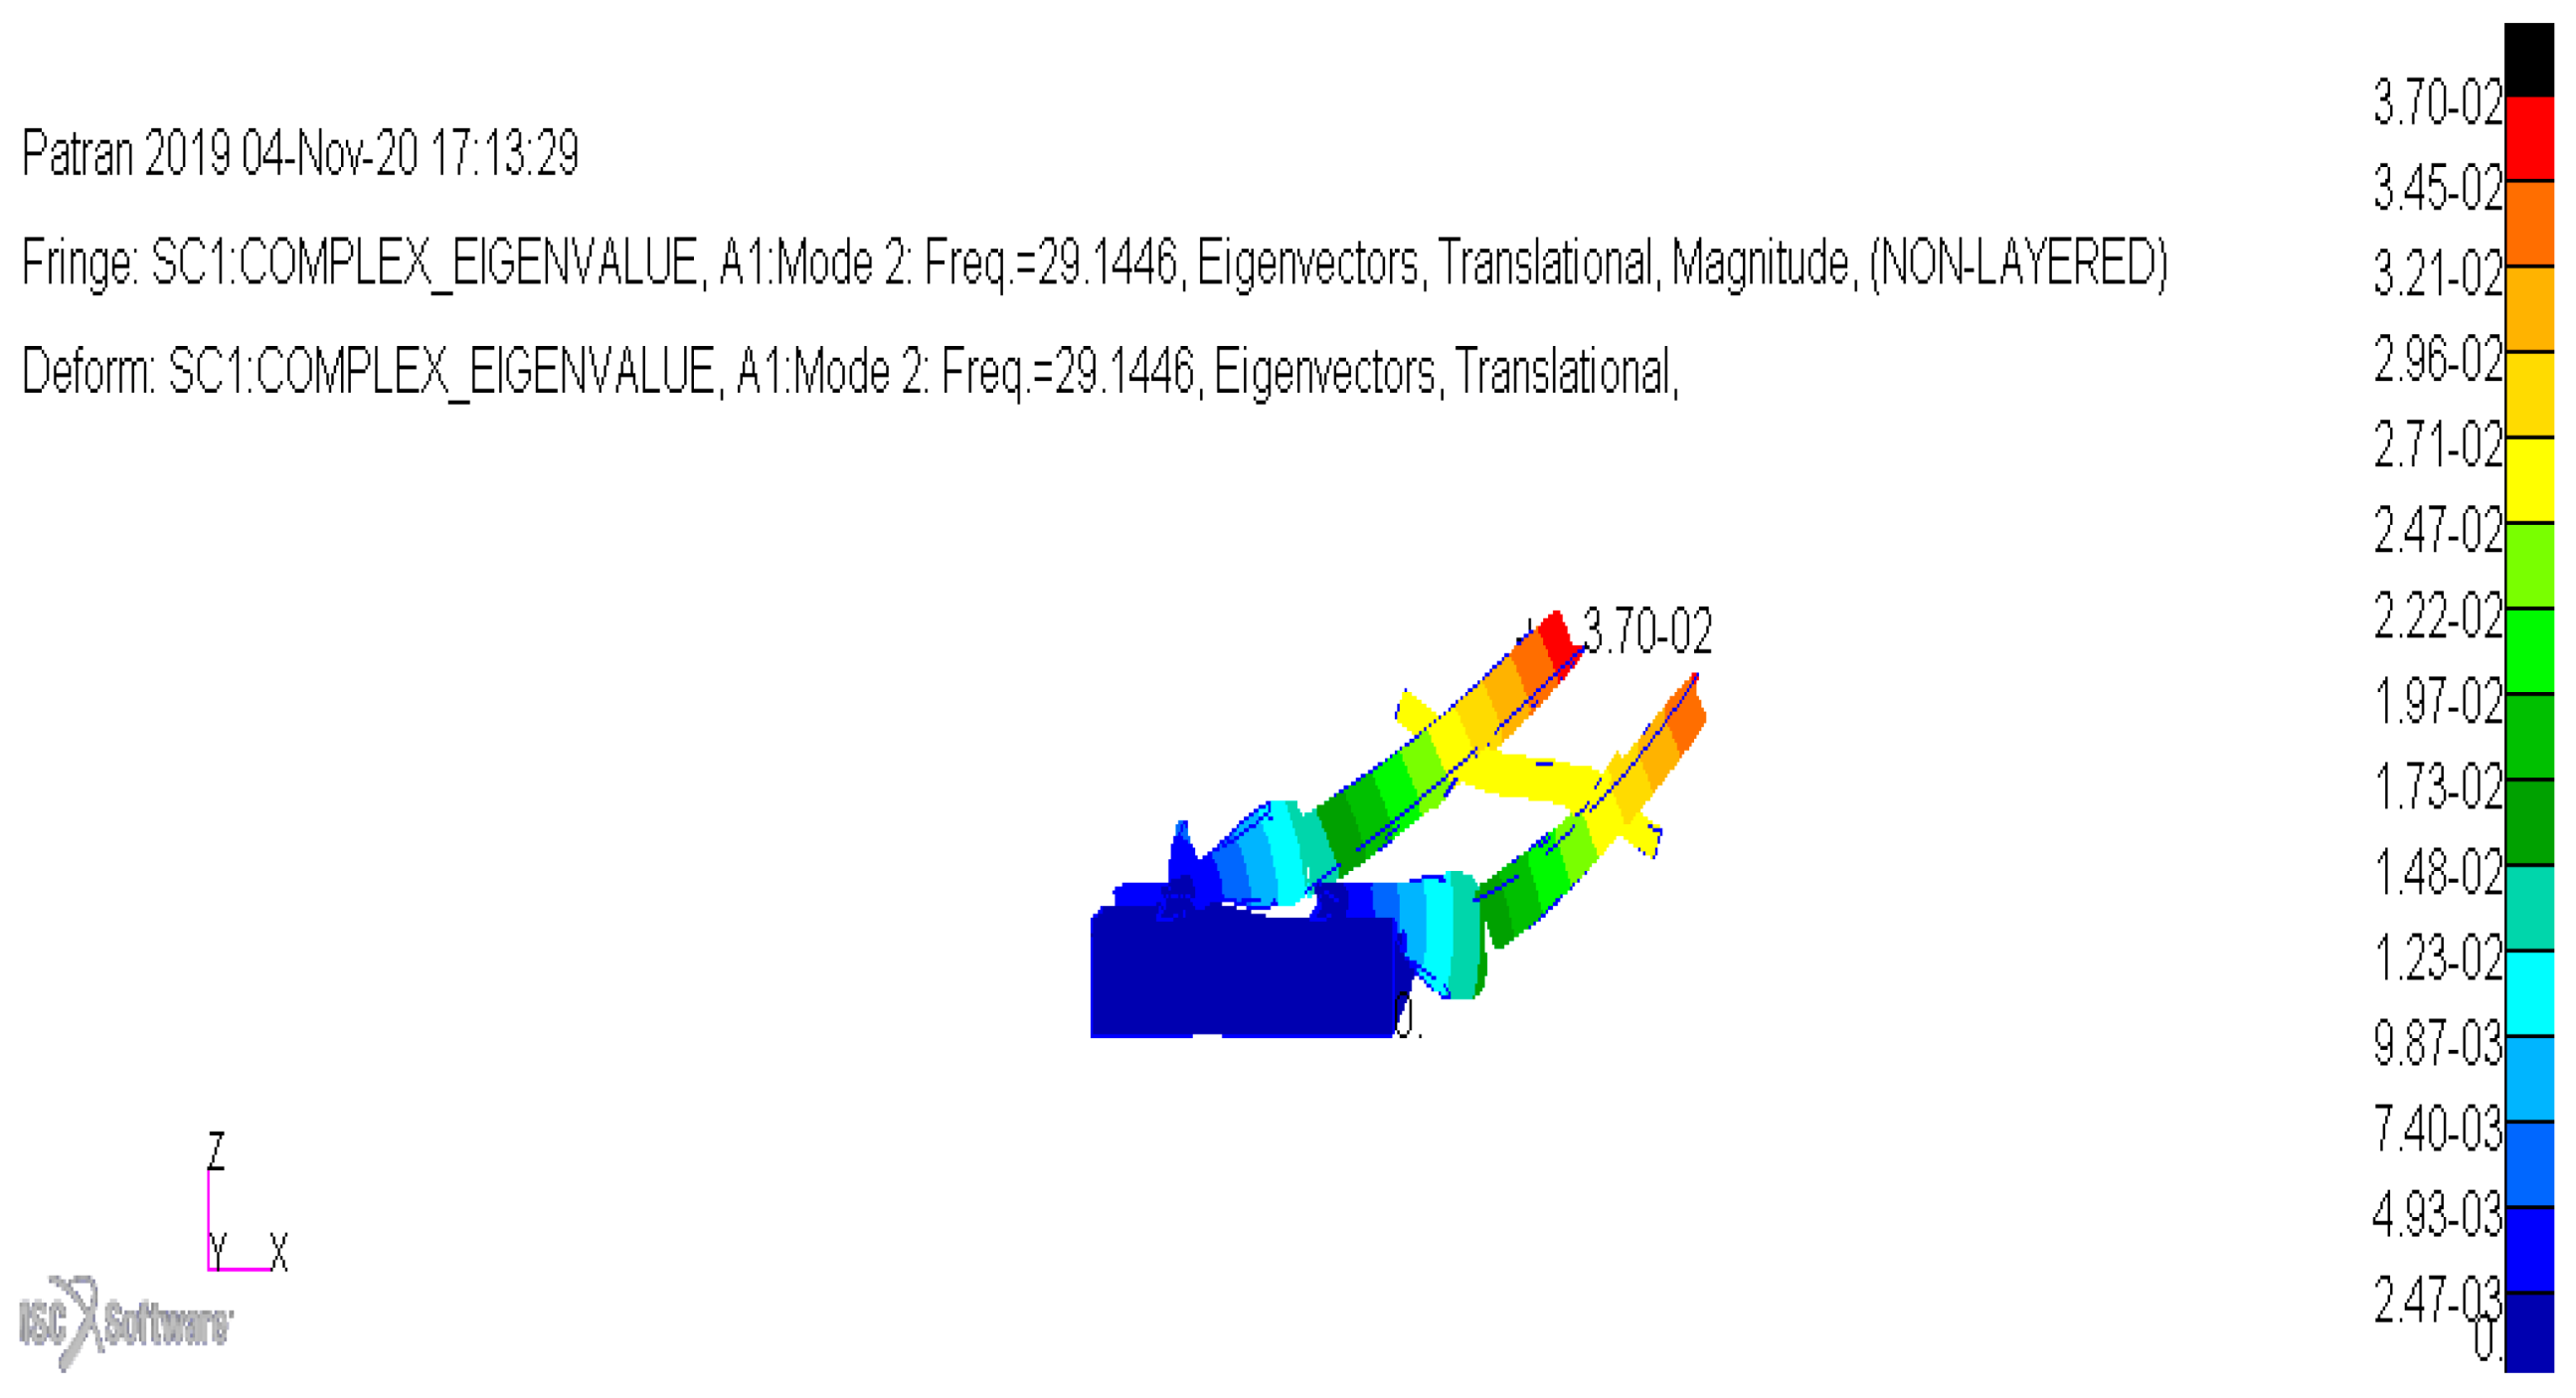
Appendix C. Other Mode Shapes for Rail Track with Steel Sleepers
Figure A6.
Mode at 29.1446 Hz.

Figure A7.
Mode at 40.5072 Hz.

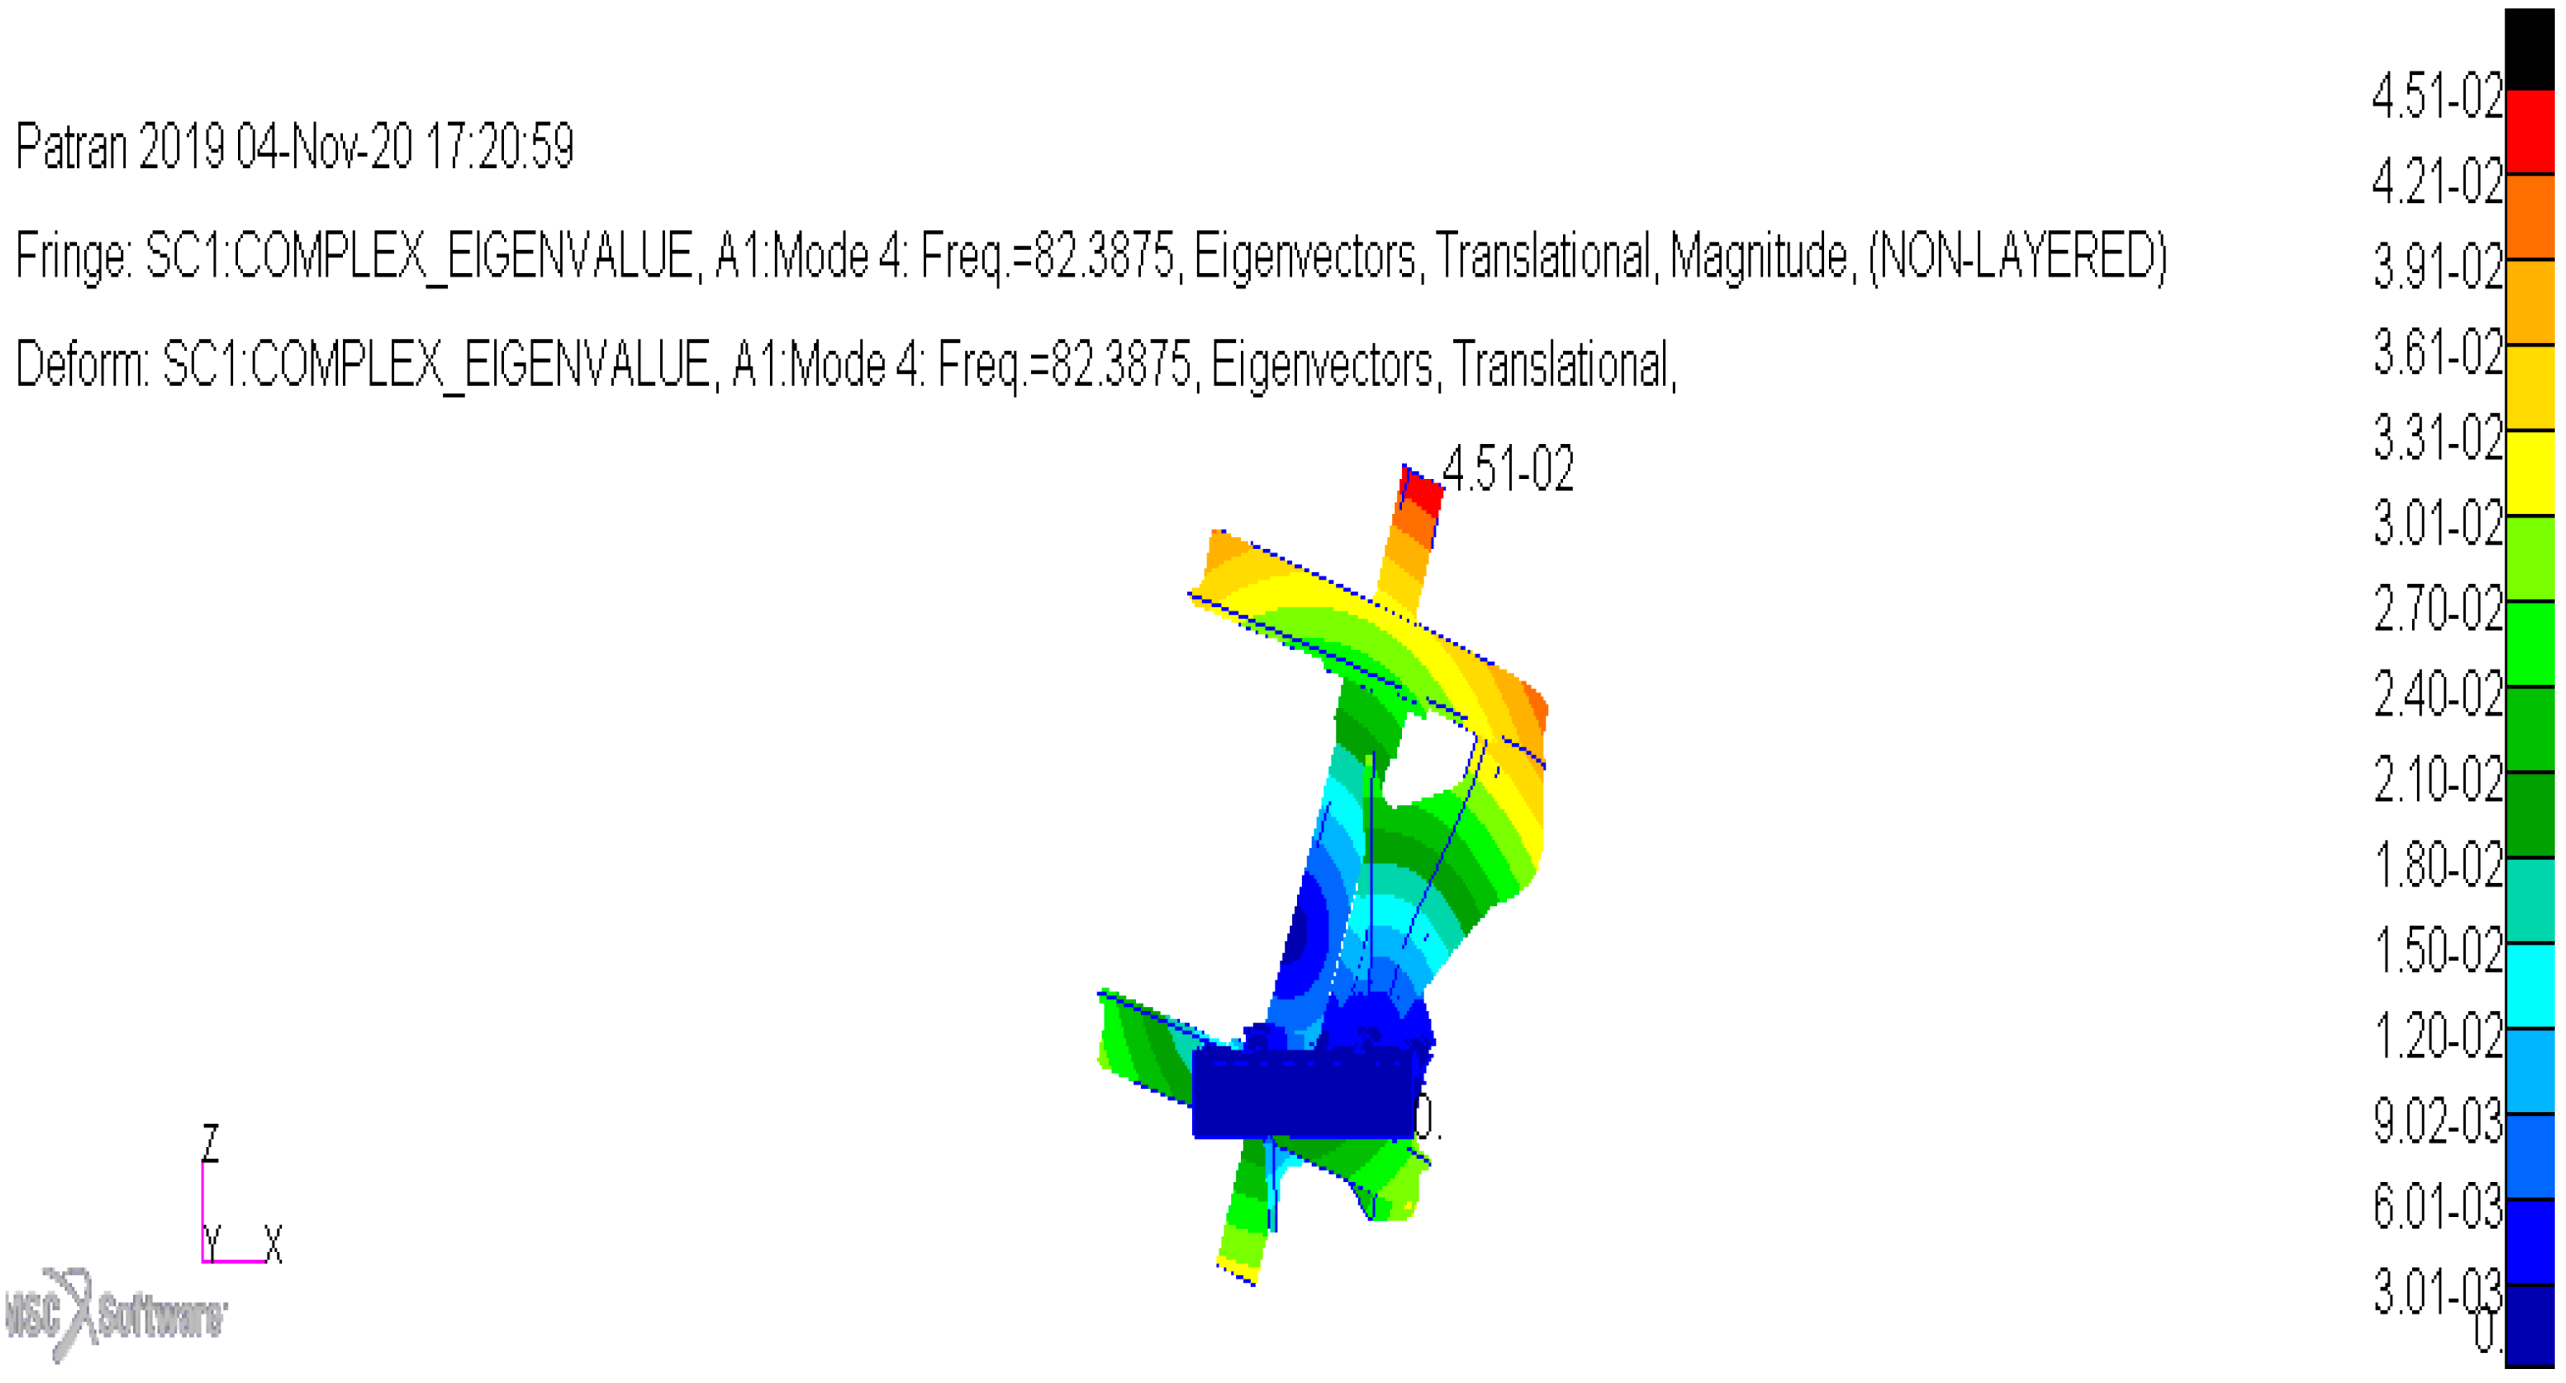
Figure A8.
Mode at 82.3875 Hz.

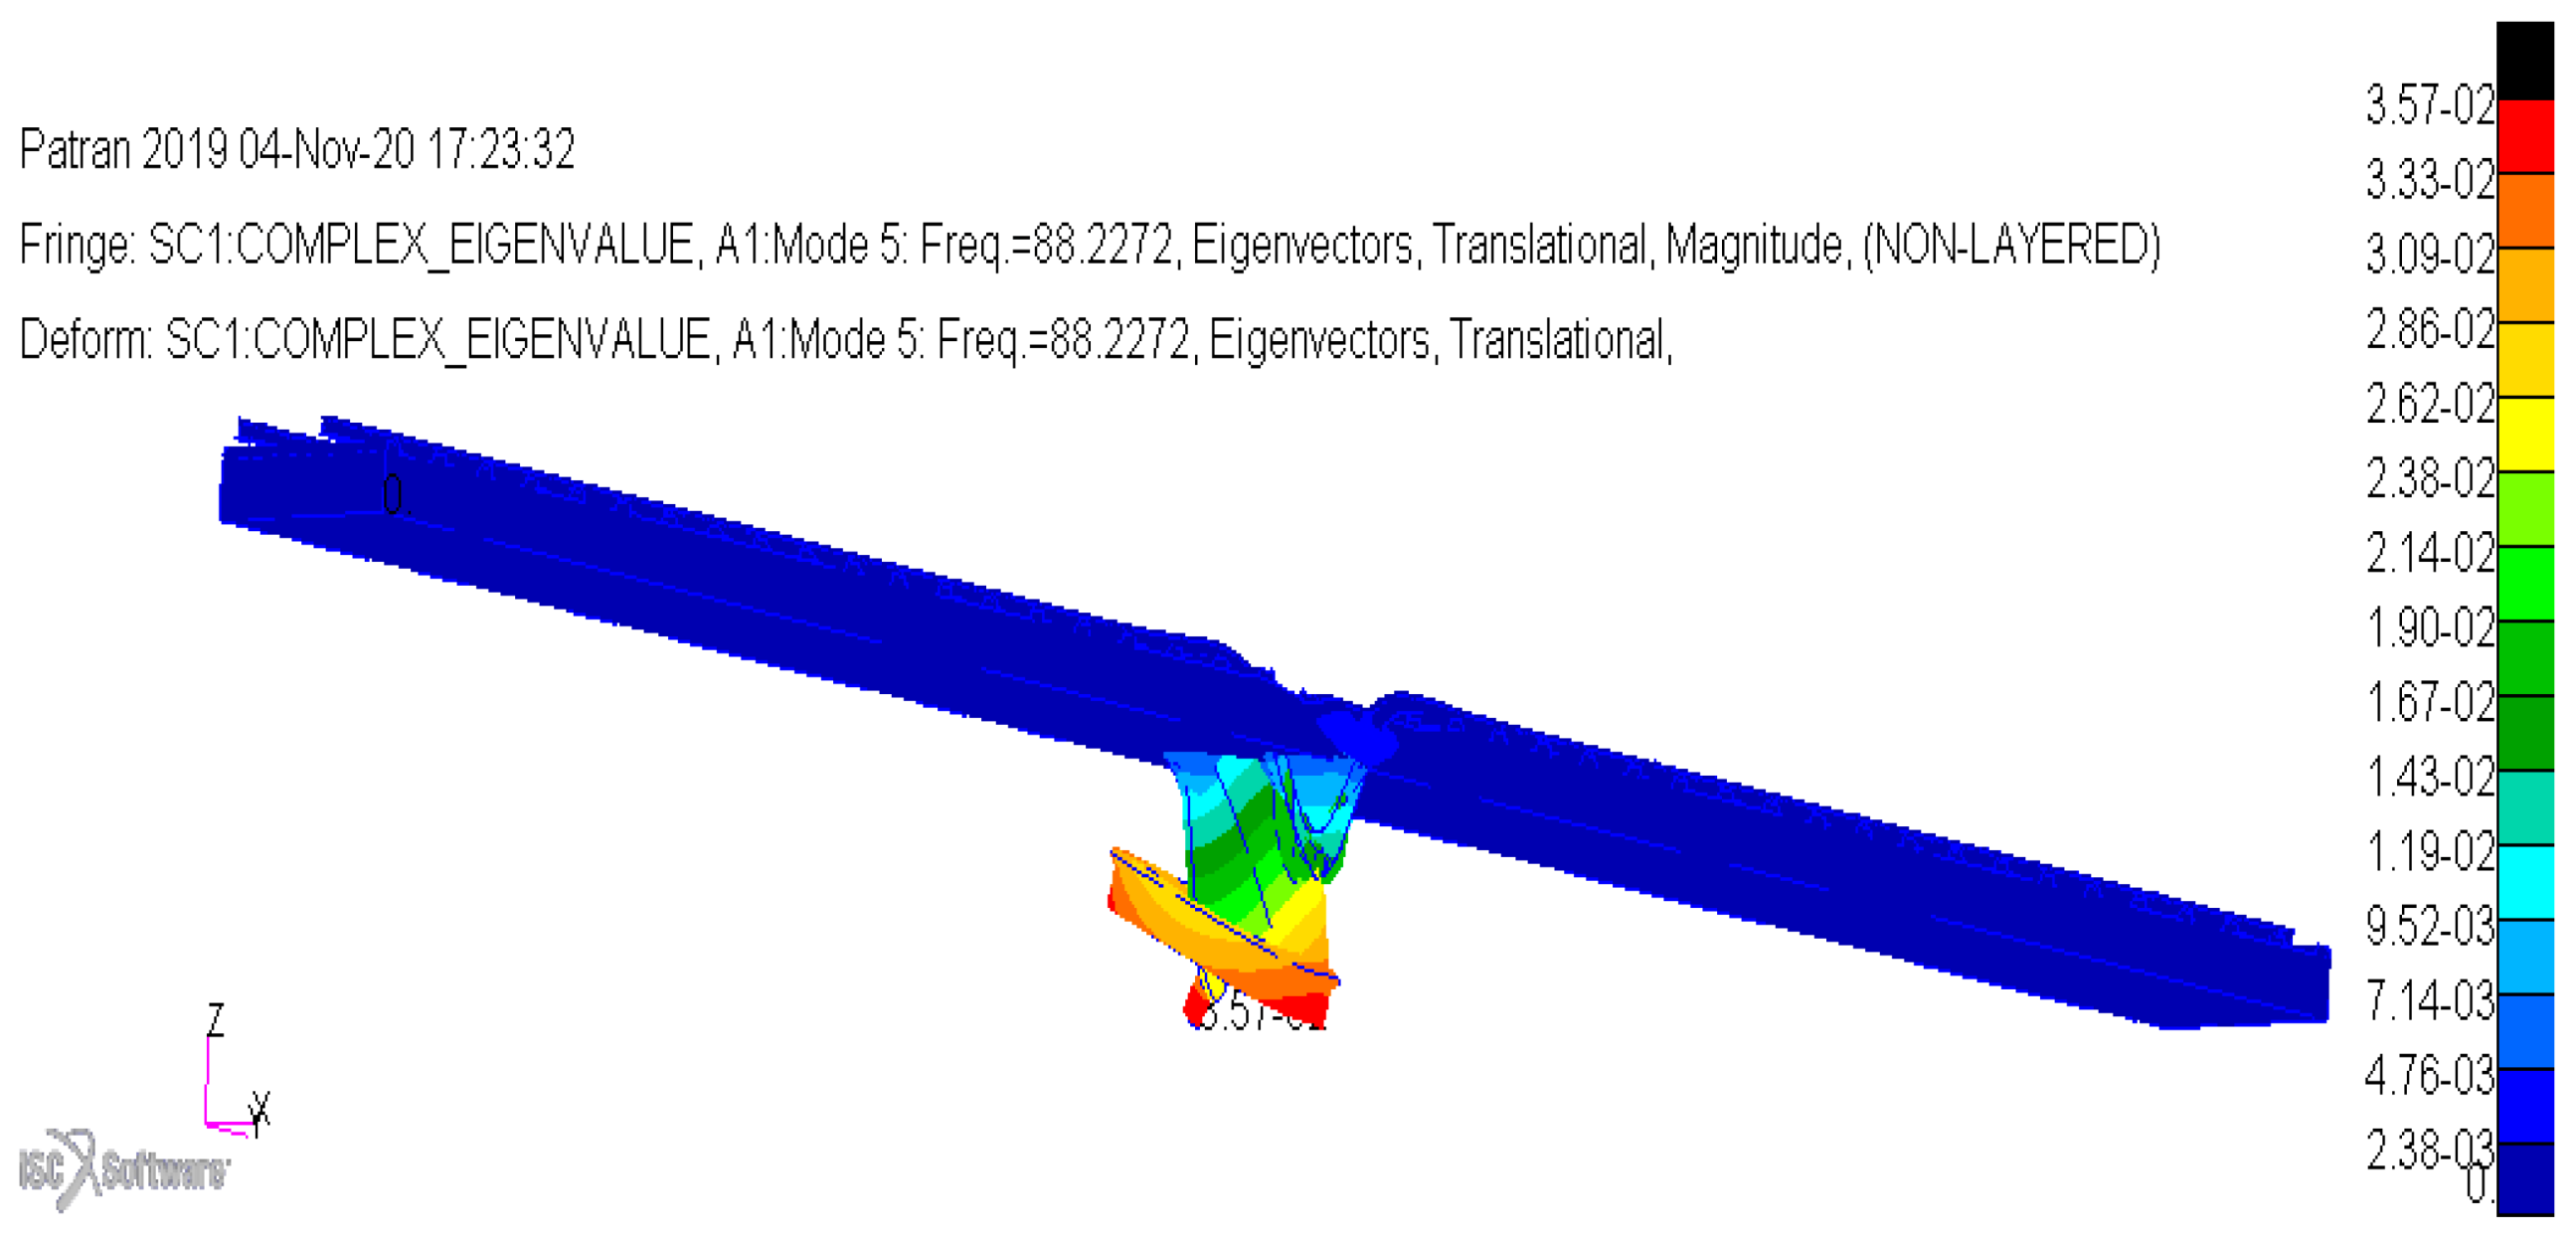
Figure A9.
Mode at 88.2272 Hz.

Appendix D. Other Mode Shapes for Rail Track with Concrete Sleepers
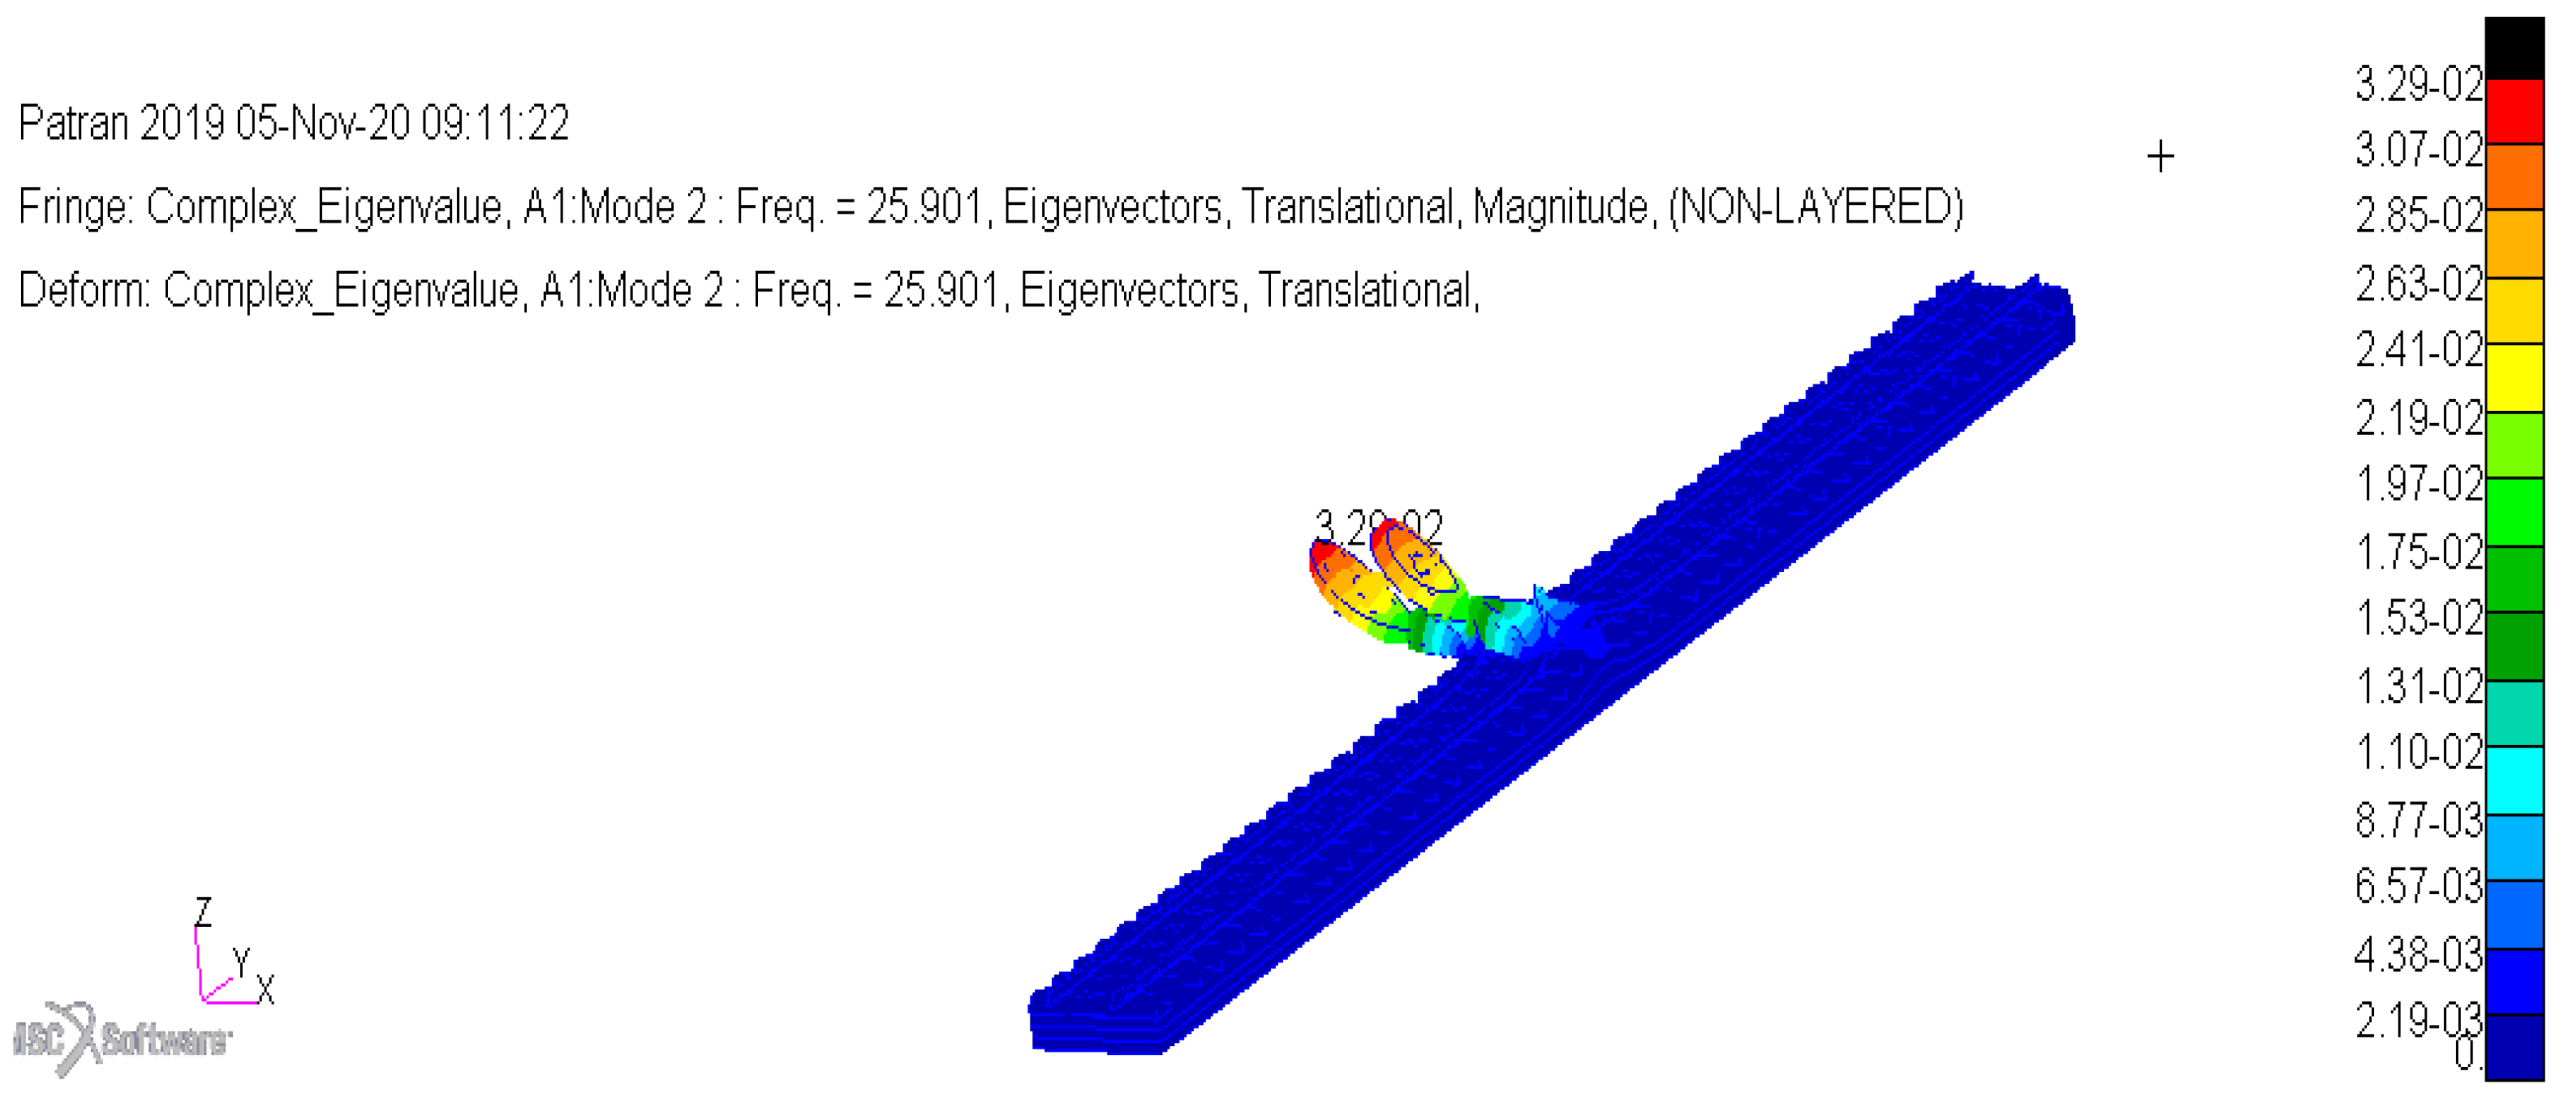
Figure A10.
Mode at 25.901 Hz.

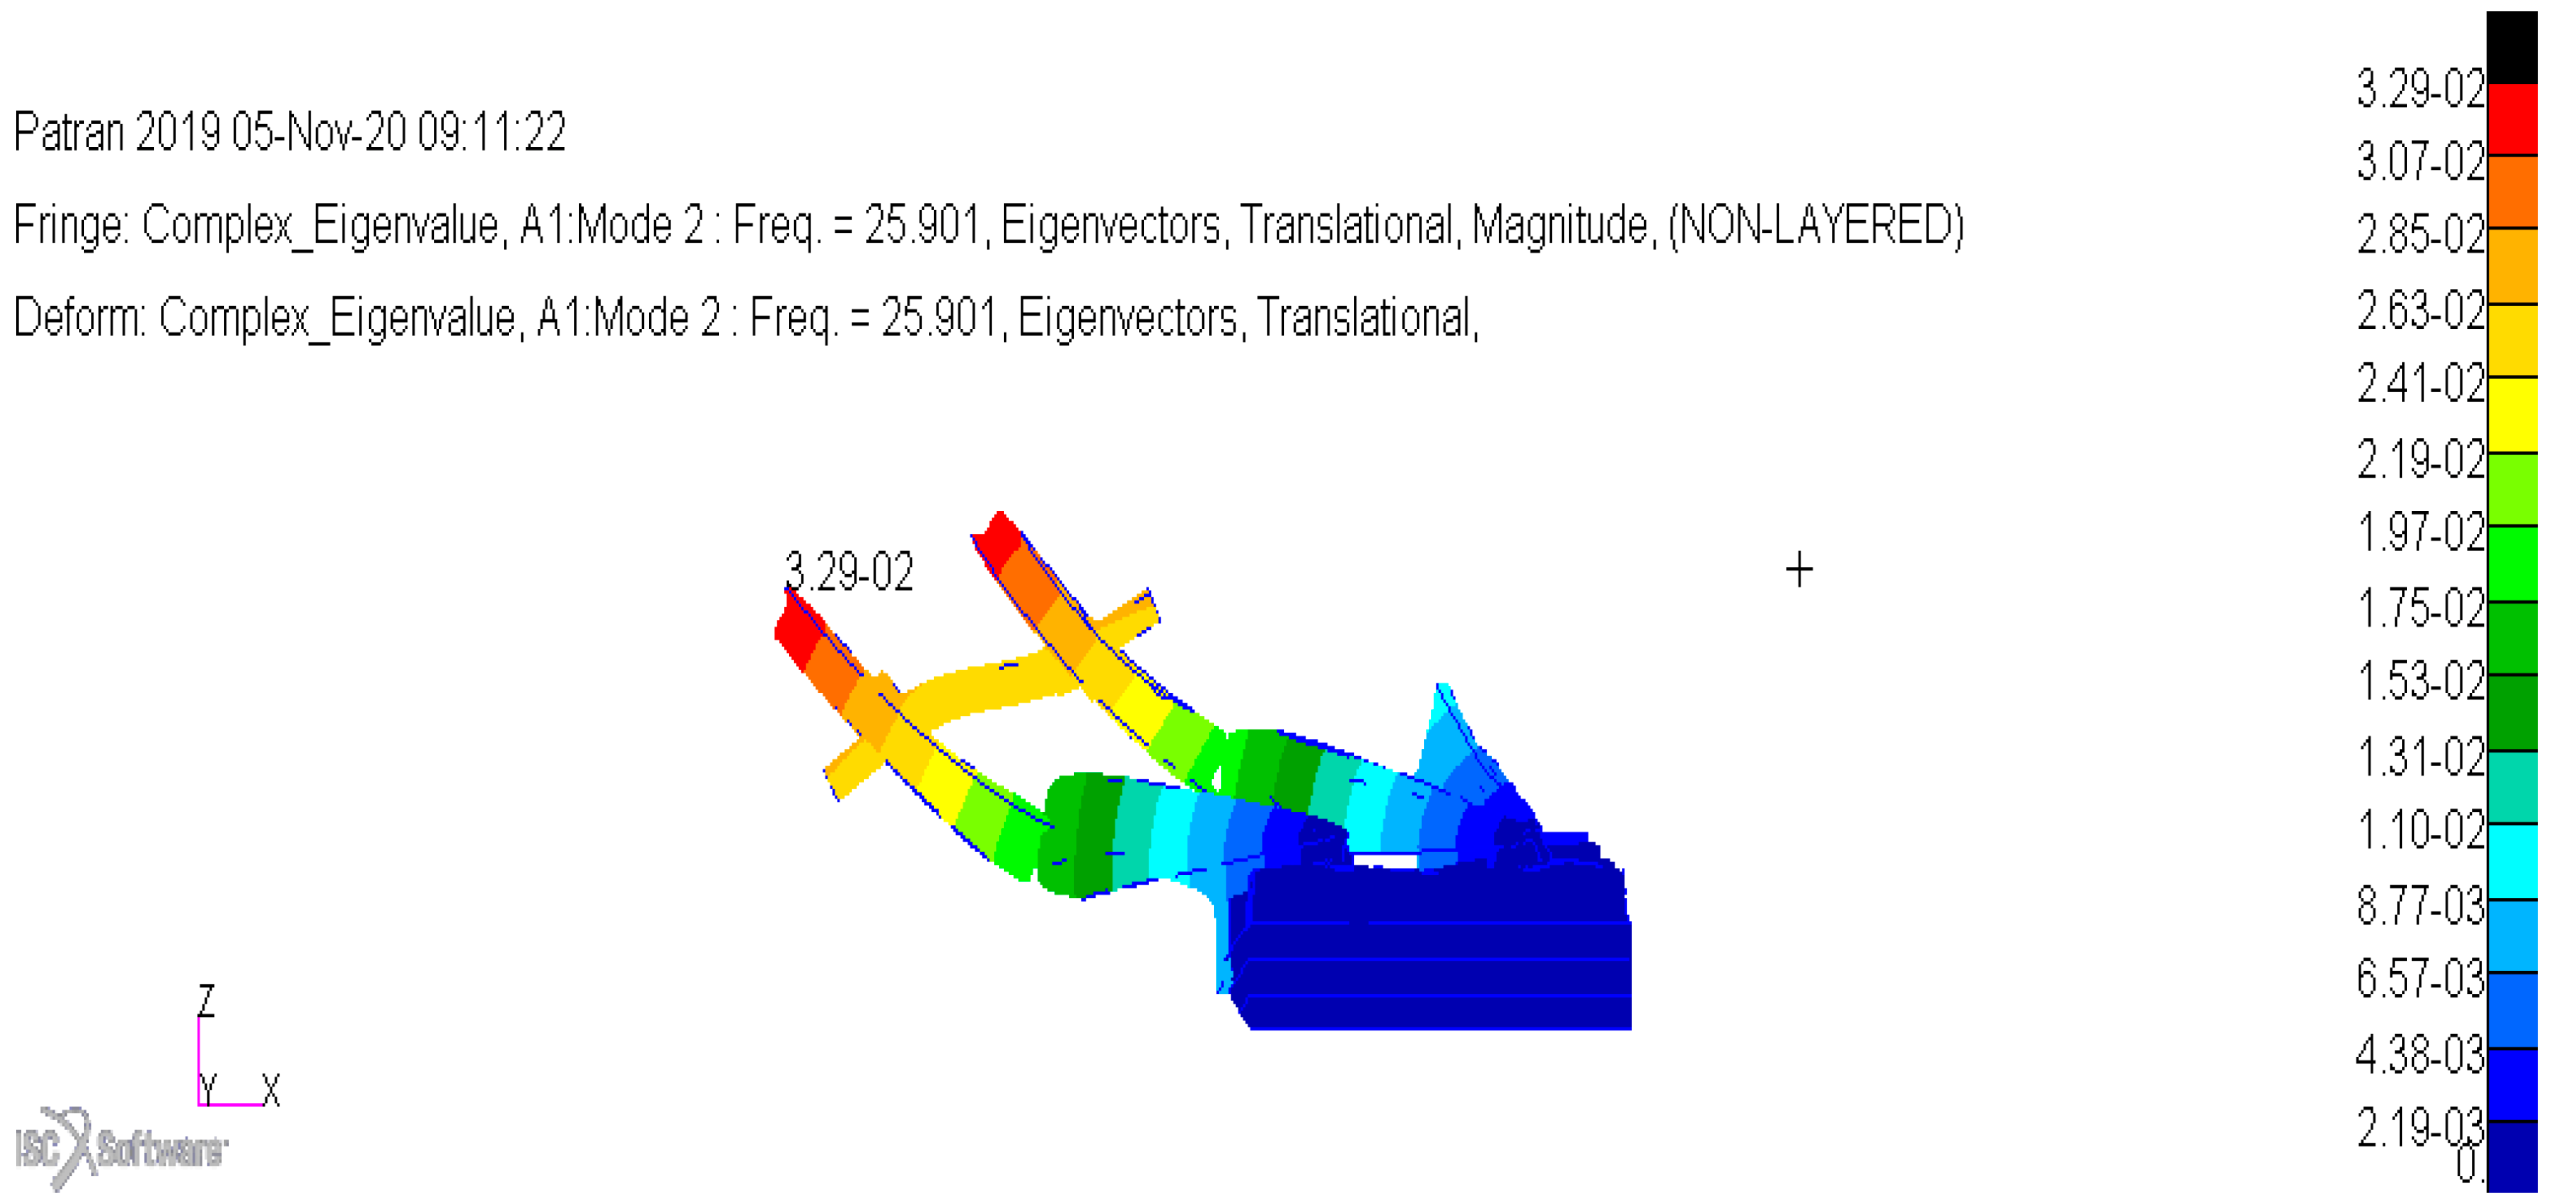
Figure A11.
Other view of mode at 25.901 Hz.

Figure A12.
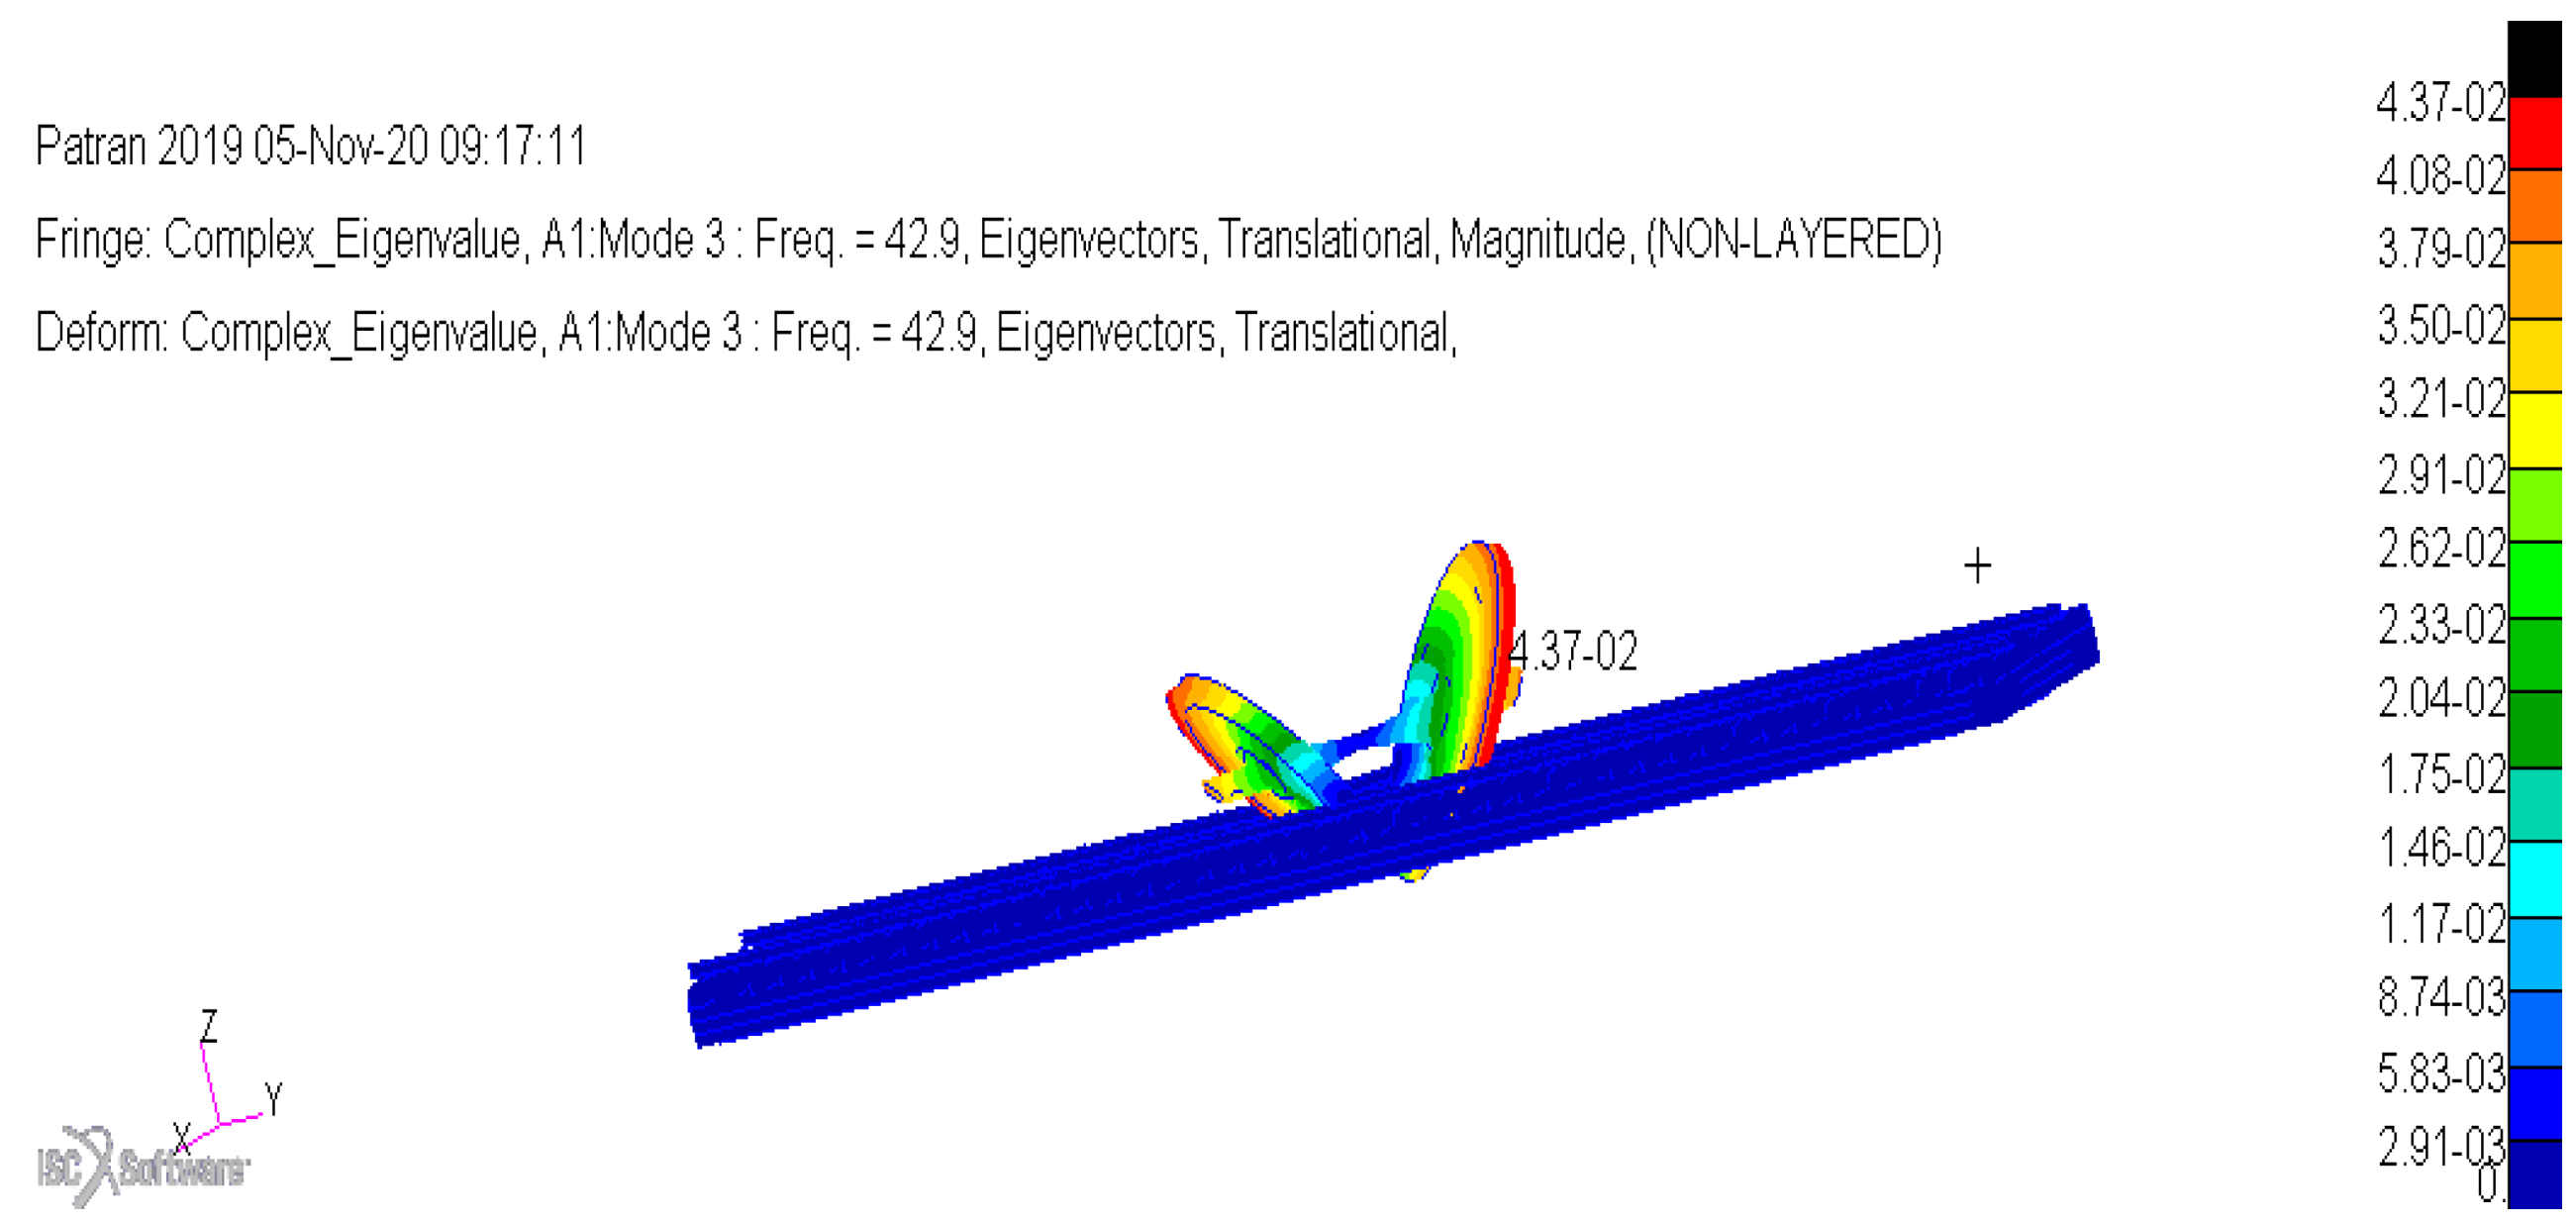
Mode at 42.9 Hz.

Figure A13.
Mode at 42.9 Hz.

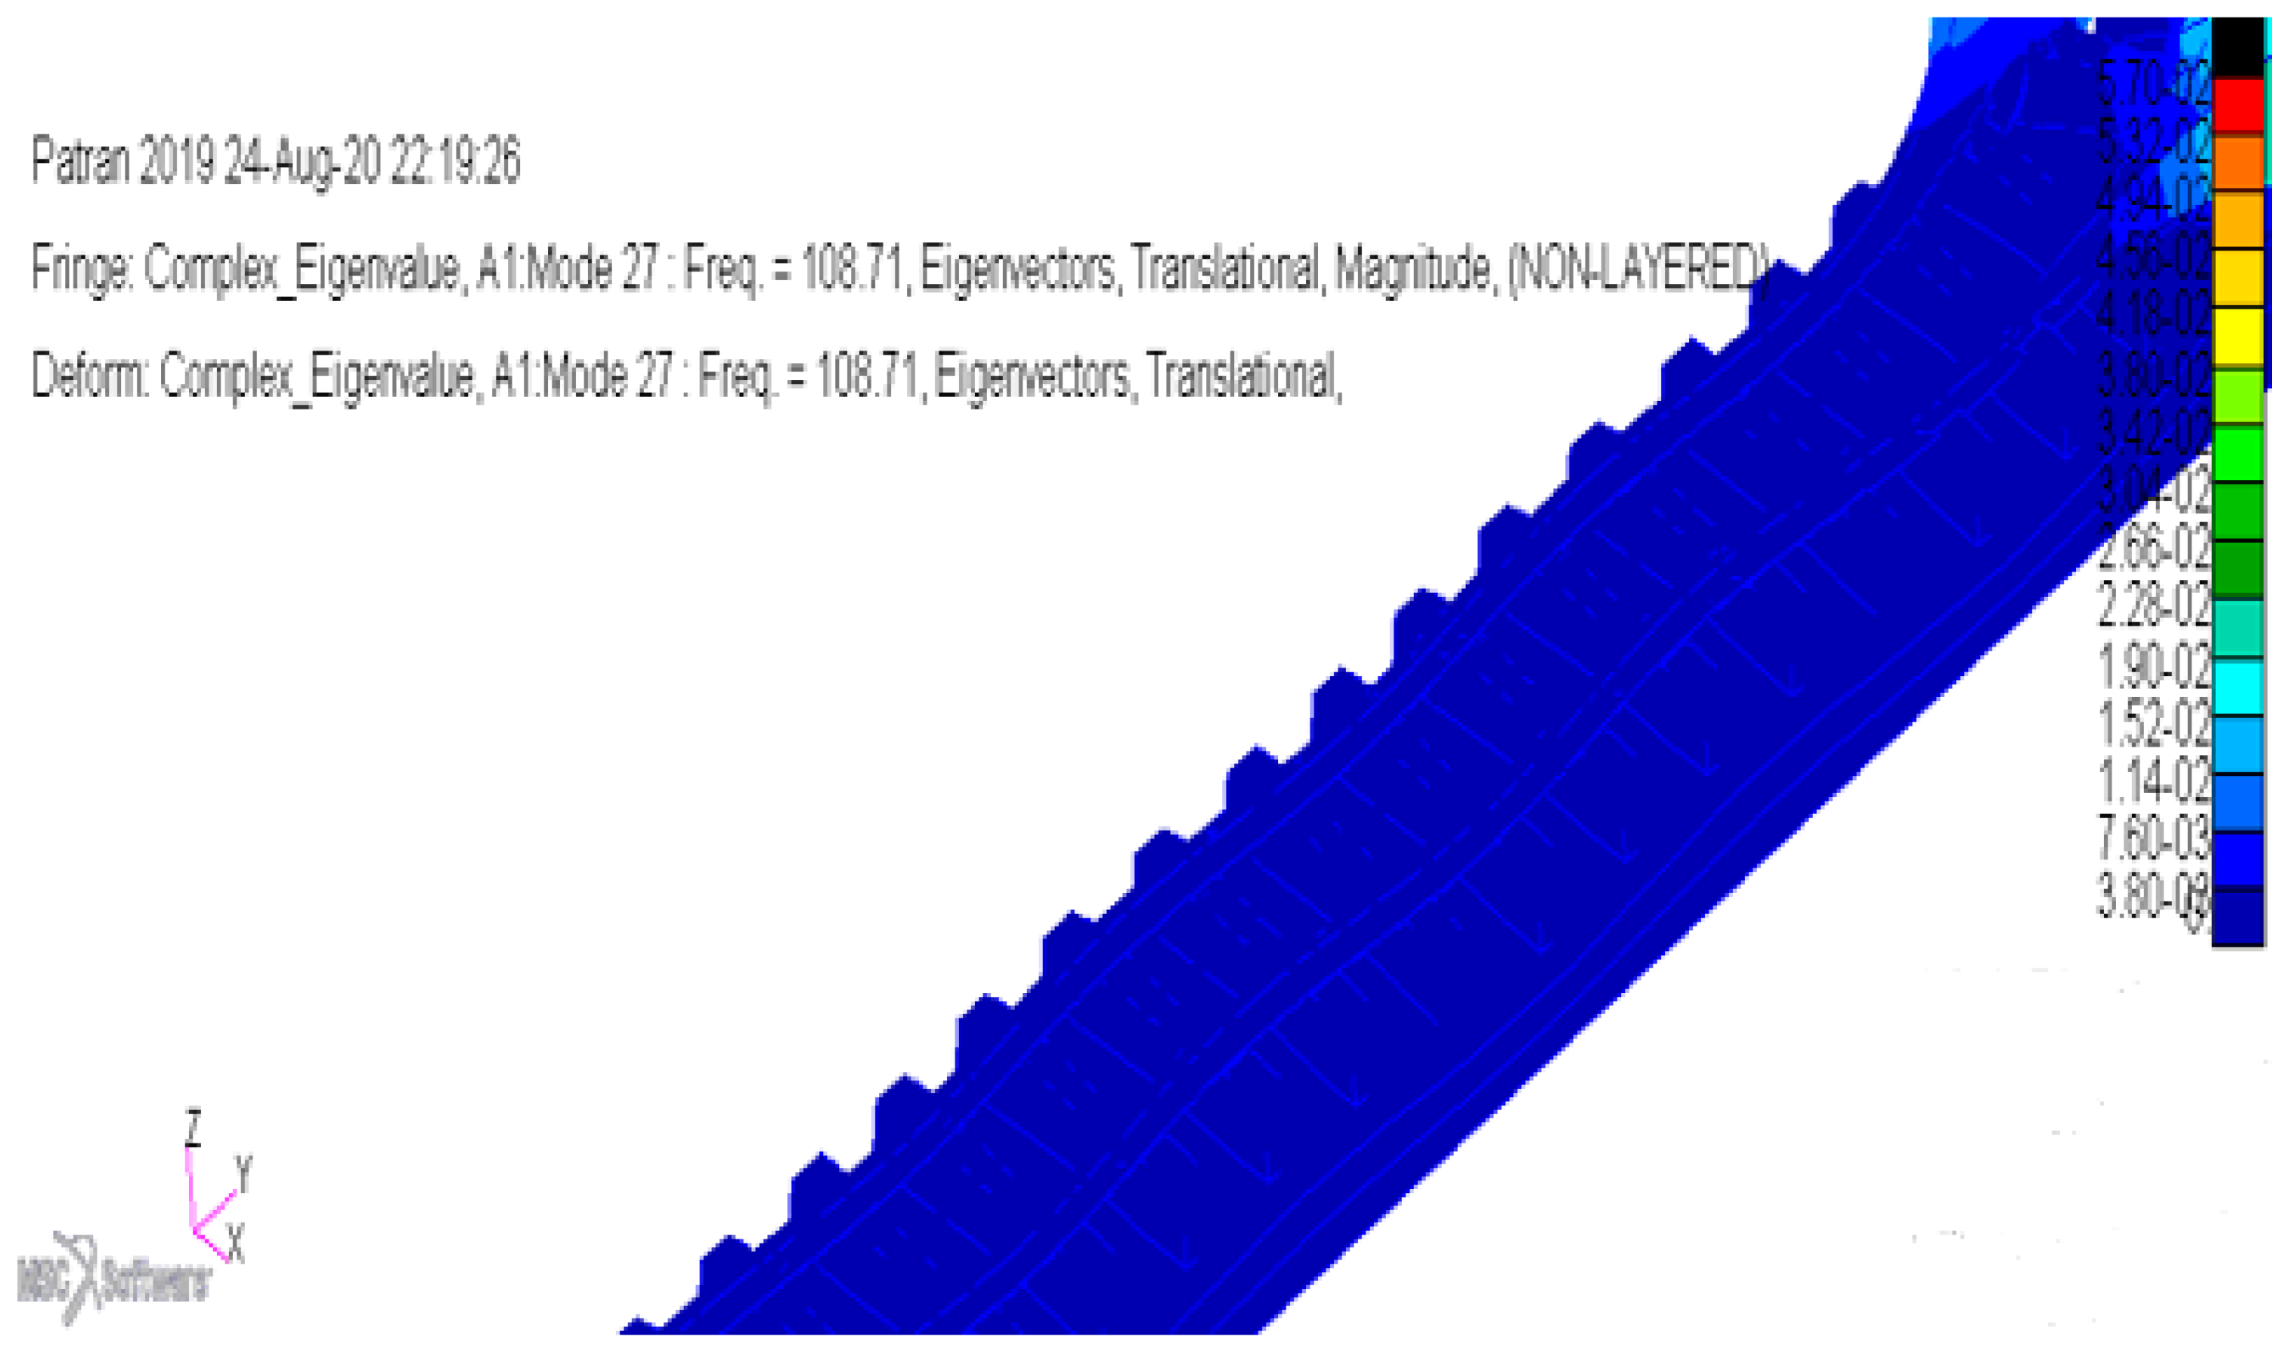
Figure A14.
Mode at 108.71 Hz.

Appendix E. Scheme for Experimental Modal Analysis on the Traction Wheelset
Figure A15.
Experimental modal analysis scheme.

References
- Grassie, S.L.; Kalousek, J. Rail corrugation: Characteristics, causes and treatments. Part F J. Rail Rapid Transit 1993, 207, 57–68. [Google Scholar] [CrossRef]
- Grassie, S.L.; Kalousek, J. Rail corrugation: Causes and cures. IRJ Wheel Rail Technol. 2000, 40, 24–26. [Google Scholar]
- Grassie, S.L. Rail corrugation: Characteristics, causes and treatments. Part F Rail Rapid Transit 2009, 223, 1–16. [Google Scholar] [CrossRef]
- Correa, N.; Vadillo, E.G.; Blanco-Lorenzo, J. On the non-proportionality between wheel/rail forces and speeed during train passage over specific welds. Sound Vib. 2017, 413, 79–100. [Google Scholar] [CrossRef]
- Ekberg, A.; Kabo, E.; Nielsen, J.C.; Lunder, R. Subsurface initiated rolling contact fatigue of railway wheels as generated by rail corrugation. J. Solids Struct. 2007, 44, 7975–7987. [Google Scholar] [CrossRef] [Green Version]
- International Heavy Haul Association. Guidelines to Best Practices for Heavy Haul Railway Operations Handbook: Wheel and Rail Interface Issues; International Heavy Haul Association: Virginia Beach, VA, USA, 2001. [Google Scholar]
- Qian, W.J.; Wu, Y.F.; Chen, G.X.; Ouyang, H. Experimental and analytical studies of the effects of a rail vibration absorber on suppressing short pitch rail corrugation. J. Vibroeng. 2016, 18, 1133–1144. [Google Scholar]
- Eadie, D.T.; Kalousek, J.; Chiddick, K.C. The role of high positive friction modifier in the control of short pitch corrugations and related phenomena. Wear 2000, 253, 185–192. [Google Scholar] [CrossRef]
- Oyarzabal, O.; Correa, N.; Vadillo, E.G.; Santamaria, J.; Gomez, J. Modelling rail corrugation with specific-track parameters focusing on ballasted track and slab track. Vehycle Syst. Dyn. 2011, 49, 1733–1748. [Google Scholar] [CrossRef]
- Balekwa, B.M. Corrugation Wavelength Fixing Mechanism and Its Relation to Train and Track Geometry Parameters. Master’s Thesis, University of Johannesburg, Johannesburg, South Africa, 2017. [Google Scholar]
- Ishida, M.; Takumi, B.; Iida, K.; Ishida, H.; Auki, F. Effect of moderating friction of wheel/rail interface on vehicle/track dynamic behaviour. Wear 2008, 265, 1497–1503. [Google Scholar] [CrossRef]
- Arias-Cuevas, O.; Li, Z.; Lewis, R.; Gallardo-Hernandez, E.A. Rolling-sliding laboratory test of friction modifiers in dry and wet wheel-rail contacts. Wear 2010, 268, 543–551. [Google Scholar]
- Daniel, W.J.T.; Cheng, C.Y.; Meehan, P.A. Modelling the effect of friction modifiers on rail corrugation in cornering. Veh. Syst. Dyn. 2008, 46, 845–866. [Google Scholar] [CrossRef]
- Bellette, P.A.; Meehan, P.A.; Daniel, W.J.T. Contact induced wear filtering and its influence on corrugation growth. Wear 2010, 268, 1320–1328. [Google Scholar] [CrossRef]
- Wang, A.; Li, Y.; Zhang, Z.; Wang, Z.; Dong, G.; Liu, J. Effects of tuned slab damper on low frequency ground vibration levels on metro systems. In Noise and Vibration Mitigation for Rail Transportation Systems; Anderson, D., Etienne Gautiere, P., Iida, M., Nelson, J.T., Thompson, D.J., Tielkes, T., Towers, D.A., de Vos, P., Nielsen, J.C.O., Eds.; Springer: Berlin/Heidelberg, Germany, 2018; pp. 533–545. [Google Scholar]
- Ho, W.; Cai, T.; Wong, B. Analytical study on railway corrugation growth control by tuned mass damper. In Proceedings of the 21st International Congress on Sound and Vibration, Beijing, China, 13–17 July 2014; pp. 1–7. [Google Scholar]
- Liu, L.; Shao, W. Design and dynamic response analysis of rail with constrained damped dynamic vibration absorber. Procedia Eng. 2011, 15, 4983–4987. [Google Scholar] [CrossRef]
- Chen, J.; Liu, W.; Sun, X. Effects of tuned rail damper on track dynamic characteristics optimization. In Proceedings of the International Conference on Structural Dynamics, Rome, Italy, 10–13 September 2017; pp. 1616–1622. [Google Scholar]
- Torward, M.; Thompson, D. Laboratory methods for testing the performance of acoustic rail dampers. In Proceedings of the Acoustics 2012 Nantes Conference, Nantes, France, 23–27 April 2012. [Google Scholar]
- Balekwa, B.; Kallon, D.; Mashamba, A.; Dube, P. Application of modal analysis to establish the wavelength fixing mechanism for rail corrugation. In Proceedings of the 11th South African Conference of Computational and Applied Mechanics, Vanderbijlpark, South Africa, 17–19 September 2018; pp. 212–223. [Google Scholar]
- Balekwa, B.; Kallon, D.V.V.; Fourie, D.J. Vertical and horizontal vibration response for corrugated track curves supported on steel and PY-type concrete sleepers. In Proceedings of the Open Innovations Conference, Cape Town, South Africa, 2–4 October 2019; pp. 474–482. [Google Scholar]
- Balekwa, B.; Kallon, D.V.V.; Fourie, D.J. Vibration response for class D44 and D39 200 locomotive wheelsets due to dynamic loads excitation. In Proceedings of the Open Innovations Conference, Cape Town, South Africa, 2–4 October 2019; pp. 418–421. [Google Scholar]
- Aikawa, A. Determination of dynamic ballast characteristics under transient impact loading. Electron. J. Struct. Eng. 2013, 1, 17–34. [Google Scholar]
- Zakeri, A.J.; Mosayebi, S.A. Study of ballast layer stiffness in railway tracks. Gradevinar 2016, 4, 311–318. [Google Scholar] [CrossRef] [Green Version]
- Ciavarella, M.; Barber, J. Influence of longitudinal creepage and wheel inertia on short pitch corrugation: A resonance-free mechanism to explain the roaring rail phenomenon. Part J J. Eng. Tribol. 2008, 222, 171–181. [Google Scholar] [CrossRef]
- Thompson, D.J. Railway Noise and Vibration. Mechanisms, Modelling and Means of Control; Elsevier: Southampton, UK, 2009. [Google Scholar]
- Garcia, O.A. Numerical and Experimental Analysis of the Vertical Dynamic Behaviour of a Railway Track. Master’s Thesis, Delft University of Technology, Delft, Switzerland, 24 April 2014. [Google Scholar]
- Chen, G.X.; Cui, X.L.; Qian, W.J. Investigation into rail corrugation in high-speed railway tracks from the viewpoint of the frictional self-excited vibration of a wheel-rail system. J. Mod. Transp. 2016, 24, 124–131. [Google Scholar] [CrossRef] [Green Version]
Figure 1.
Illustration of the analytical method to determine corrugation frequencies per track curve.
Figure 1.
Illustration of the analytical method to determine corrugation frequencies per track curve.

Figure 2.
(a) Modal analysis on wheel profile. (b) Suspended wheelset prepared for modal analysis. (c) Wheel profile locations where accelerometer was stuck. (d) Steel block stuck on wheel profile for circumferential excitation.
Figure 2.
(a) Modal analysis on wheel profile. (b) Suspended wheelset prepared for modal analysis. (c) Wheel profile locations where accelerometer was stuck. (d) Steel block stuck on wheel profile for circumferential excitation.

Figure 3.
Finite Element Analysis (FE)A model for a D39200 locomotive class wheelset.

Figure 4.
(a) Exploded view of the FY-type concrete sleeper with a FISTclip rail fastening system. (b) assembled view of the FY-type concrete sleeper with a FISTclip rail fastening system. (c) Exploded view of the PY-type concrete sleeper with an e-clip rail fastening system. (d) Assembled view of the PY-type concrete sleeper with an e-clip rail fastening system. (e) Rail on steel sleeper with its fastening system. (f) Mid-span and on top of sleeper point rail preparation. (g) Accelerometer and impact hammer.

Figure 5.
(a) Rail track model with steel sleepers; (b) ballast underneath sleepers.

Figure 6.
Concrete sleeper track. (a) Rail track model with concrete sleepers; (b) rail pad (coloured in brown) on a concrete sleeper.
Figure 6.
Concrete sleeper track. (a) Rail track model with concrete sleepers; (b) rail pad (coloured in brown) on a concrete sleeper.

Figure 7.
Point Frequency Response Functions (FRFs) for the gear and non-gear side wheels for response of wheels in the lateral direction.
Figure 7.
Point Frequency Response Functions (FRFs) for the gear and non-gear side wheels for response of wheels in the lateral direction.

Figure 8.
Correlation of wheelset natural frequencies to corrugation frequencies for track curves.

Figure 9.
D39 200 wheelset FEM results.

Figure 10.
Comparison of FRFs for rail vibration response, rails are laying on FY-Type concrete and on steel sleepers. Vibration measured in the vertical direction mid-span.
Figure 10.
Comparison of FRFs for rail vibration response, rails are laying on FY-Type concrete and on steel sleepers. Vibration measured in the vertical direction mid-span.

Figure 11.
Comparison of FRFs for rail vibration response, rails are laying on FY-Type concrete and on steel sleepers. Vibration measured in the horizontal direction mid-span.
Figure 11.
Comparison of FRFs for rail vibration response, rails are laying on FY-Type concrete and on steel sleepers. Vibration measured in the horizontal direction mid-span.

Figure 12.
Comparison of FRFs for rail vibration response, rails are laying on FY-Type concrete and on steel sleepers. Vibration measured in the vertical direction on top of sleeper point.
Figure 12.
Comparison of FRFs for rail vibration response, rails are laying on FY-Type concrete and on steel sleepers. Vibration measured in the vertical direction on top of sleeper point.

Figure 13.
Comparison of FRFs for rail vibration response, rails are laying on FY-Type concrete and on steel sleepers. Vibration measured in the horizontal direction on top of sleeper point.
Figure 13.
Comparison of FRFs for rail vibration response, rails are laying on FY-Type concrete and on steel sleepers. Vibration measured in the horizontal direction on top of sleeper point.

Figure 14.
Comparison of FRFs for vibration response of sleepers. Vibration measured in the vertical direction, on the top face of sleeper, by the field side of the rail.
Figure 14.
Comparison of FRFs for vibration response of sleepers. Vibration measured in the vertical direction, on the top face of sleeper, by the field side of the rail.

Figure 15.
Comparison of FRFs for vibration response of sleepers. Vibration measured in the horizontal direction, on the top face of sleeper, by the field side of the rail.
Figure 15.
Comparison of FRFs for vibration response of sleepers. Vibration measured in the horizontal direction, on the top face of sleeper, by the field side of the rail.

Figure 16.
Bending mode for rail track with steel sleepers and ballast.

Figure 17.
Bending mode for rail track with steel sleepers, no ballast.

Figure 18.
Bending mode for rail track with concrete sleepers.

Table 1.
Mesh details for wheelset FEM.
| Mesh Item | Mesh Details |
|---|---|
| Mesh type | Solid |
| Element type | Tetrahedron |
| Mesher | TetMesh |
| Topology | Tet 10 |
Table 2.
Mesh convergence for wheelset model.
| Element Global Edge Length (mm) | Number of Nodes | Maximum Displacement (mm) |
|---|---|---|
| 250 | 48,188 | 42.3 |
| 50 | 182,346 | 43.8 |
| 10 | 763,491 | 54.7 |
| 5 | 823,157 | 57.3 |
| 4 | 834,568 | 57.7 |
| 3.5 | 869,498 | 58.1 |
| 3 | 905,567 | 58.1 |
Table 3.
Material properties of the FEA model.
| Material | Young’s Modulus (GPa) | Density (kg/m3) | Poisson’s Ratio |
|---|---|---|---|
| Steel | 210 | 7850 | 0.3 |
Table 4.
Mesh details for rail track FEM with steel sleepers.
| Mesh Item | Mesh Details |
|---|---|
| Mesh type | Solid |
| Element type | Tetrahedron |
| Mesher | TetMesh |
| Topology | Tet 10 |
Table 5.
Mesh convergence for the rail FEM in the rail track model with steel sleepers.
| Element Global Edge Length (mm) | Number of Nodes | Maximum Displacement (mm) |
|---|---|---|
| 170 | 68,156 | 7.8 |
| 50 | 134,872 | 10.9 |
| 30 | 202,658 | 11.6 |
| 10 | 327,956 | 12.9 |
| 5 | 449,676 | 13.7 |
| 4.5 | 449,853 | 14.4 |
| 4 | 449,981 | 14.4 |
Table 6.
Material properties for FEMs on rail track model with steel sleepers.
| FEM Solid | Material | Density (kg/m3) | Young’s Modulus (GPa) | Poisson’s Ratio | Shear Modulus (GPa) |
|---|---|---|---|---|---|
| Axle | Steel | 7850 | 210 | 0.3 | |
| Wheel | Steel | 7850 | 210 | 0.3 | |
| Rail | Steel | 7800 | 210 | 0.3 | |
| Sleeper | Steel | 7870 | 205 | 0.29 | 80 |
Table 7.
Mesh details for rail track FEM with steel sleepers.
| Mesh Item | Mesh Details |
|---|---|
| Mesh type | Solid |
| Element type | Tetrahedron |
| Mesher | TetMesh |
| Topology | Tet 10 |
Table 8.
Material properties for ballast FEM.
| FEM Solid | Material | Density (kg/m3) | Young’s Modulus (MPa) | Poisson’s Ratio | Structural Damping |
|---|---|---|---|---|---|
| Top layer ballast | Stones | 2500 | 256 | 0.2 | 0.01 |
| Middle layer ballast | Stones | 2600 | 276 | 0.2 | 0.01 |
| Bottom layer ballast | Stones | 2700 | 300 | 0.2 | 0.01 |
Table 9.
Contacts, loads and boundary conditions for rail track model on steel sleepers.
| Geometry (In Contact) | Geometry (In Contact with) | Contact | Fix Translation | Fix Rotation |
|---|---|---|---|---|
| Top layer ballast | Middle layer ballast | Glue | ||
| Middle layer ballast | Bottom layer ballast | Glue | ||
| Bottom layer ballast | 0, 0, 0 | 0, 0, 0 |
Table 10.
Material properties for FEMs on rail track model with concrete sleepers.
| FEM Solid | Material | Density (kg/m3) | Young’s Modulus (GPa) | Poisson’s Ratio |
|---|---|---|---|---|
| Axle | Steel | 7850 | 210 | 0.3 |
| Wheel | Steel | 7850 | 210 | 0.3 |
| Rail | Steel | 7800 | 210 | 0.3 |
| Pad | Rubber | 1300 | 0.08 | 0.45 |
| Sleeper | Concrete | 2400 | 36.406 | 0.2 |
Table 11.
Mesh convergence for the rail FEM in the rail track model with concrete sleepers.
| Element Global Edge Length (mm) | Number of Nodes | Maximum Displacement (mm) |
|---|---|---|
| 190 | 73,224 | 16.4 |
| 50 | 151,421 | 23.1 |
| 30 | 223,687 | 28.6 |
| 10 | 346,872 | 34.2 |
| 5 | 483,277 | 51.8 |
| 4.5 | 572,183 | 57.6 |
| 4 | 581,186 | 57.0 |
Table 12.
Calculated corrugation frequencies per track curve.
| Corrugation Frequencies Per Track Curve | ||||||
|---|---|---|---|---|---|---|
| Test Point | Track Kilometer Point | Average Wavelength (m) | Average Loaded Trains’ Speeds (m/s) | Average Empty Trains’ Speeds (m/s) | Corrugation Frequency Associated with Loaded Trains (Hz) | Corrugation Frequency Associated with Empty Trains (Hz) |
| 4 | 165/8 | 0.09 | 10.83 | 13.33 | 120.37 | 148.15 |
| 5 | 169/3 | 0.082 | 7.5 | 10 | 91.46 | 121.95 |
| 6 | 172/14 | 0.086 | 8.89 | 10.56 | 103.36 | 122.74 |
| 7 | 178/3 | 0.084 | 8.33 | 10.83 | 99.21 | 128.97 |
| 7 | 178/3 | 0.082 | 8.33 | 10.83 | 101.63 | 132.11 |
| 8 | 181/13 | 0.068 | 7.78 | 11.39 | 114.38 | 167.48 |
| 9 | 183/3 | 0.074 | 8.61 | 10.28 | 116.37 | 138.89 |
| 10 | 183/7 | 0.082 | 8.89 | 7.78 | 108.4 | 94.85 |
| 11 | 184/4 | 0.068 | 8.06 | 9.17 | 118.46 | 134.8 |
| 12 | 184/13 | 0.082 | 8.61 | 8.06 | 105.01 | 98.24 |
| 18 | 215/15 | 0.058 | 8.61 | 9.17 | 148.47 | 158.05 |
| 20 | 216/18 | 0.077 | 8.61 | 9.17 | 111.83 | 119.05 |
Table 13.
Difference between experimental and FEA frequencies for first bending mode.
| Firs Bending Mode Experimental Frequency (Hz). | First Bending Mode FEA Frequency (Hz). | Difference in Frequencies (Hz) | Percentage Error (%) |
|---|---|---|---|
| 108.5 | 100.68 | 7.82 | 7.77 |
Publisher’s Note: MDPI stays neutral with regard to jurisdictional claims in published maps and institutional affiliations. |
© 2020 by the authors. Licensee MDPI, Basel, Switzerland. This article is an open access article distributed under the terms and conditions of the Creative Commons Attribution (CC BY) license (http://creativecommons.org/licenses/by/4.0/).
Share and Cite
MDPI and ACS Style
Balekwa, B.M.; Kallon, D.V.V. Correlation of Short Pitch Rail Corrugation with Railway Wheel-Track Resonance at Low Frequencies of Excitation. Vibration 2020, 3, 491-520. https://0-doi-org.brum.beds.ac.uk/10.3390/vibration3040031
AMA Style
Balekwa BM, Kallon DVV. Correlation of Short Pitch Rail Corrugation with Railway Wheel-Track Resonance at Low Frequencies of Excitation. Vibration. 2020; 3(4):491-520. https://0-doi-org.brum.beds.ac.uk/10.3390/vibration3040031
Chicago/Turabian StyleBalekwa, Bingo Masiza, and Daramy Vandi Von Kallon. 2020. "Correlation of Short Pitch Rail Corrugation with Railway Wheel-Track Resonance at Low Frequencies of Excitation" Vibration 3, no. 4: 491-520. https://0-doi-org.brum.beds.ac.uk/10.3390/vibration3040031