Article

Simulation of Torsional Vibration of Driven Railway Wheelsets Respecting the Drive Control Response on the Vibration Excitation in the Wheel-Rail Contact Point

1
Chair for Railway Vehicle Technology, Institute of Machine Components, University of Stuttgart, 70569 Stuttgart, Germany
2
Institute of System Dynamics and Mechatronics, University of Applied Sciences Bielefeld, 33619 Bielefeld, Germany
3
German Centre for Rail Traffic Research, 01219 Dresden, Germany
*
Author to whom correspondence should be addressed.
Submission received: 2 November 2020 / Revised: 12 December 2020 / Accepted: 23 December 2020 / Published: 25 December 2020
(This article belongs to the Special Issue Railway Dynamics and Maintenance)

Abstract

:
For the stability verification of railway wheelsets in Germany, dynamic torsional stresses must be respected as they affect the axle and press fit stability of a wheelset. These dynamic stresses are applied to a wheelset by torsional vibration. However, dynamic stresses cannot be predicted by calculation, and so time-consuming and cost-intensive test runs are performed to measure the maximum dynamic stresses. Therefore, this article deals with the setup of a simulation model that shall enable the simulative prediction of maximum dynamic torsional stresses. This model respects that vibration excitation originates from the wheel-rail contact point and that the vibration energy input comes from a high-frequency drive train control. The first results show successful simulation of vibration excitation and correlations between adhesion change and maximum dynamic stresses.

1. Introduction

For the stability verification of railway wheelsets, axle and press fit stability must be verified. The major input parameters are maximum torsional and maximum bending stresses. These stresses are derived from vehicle weight and traction/braking forces. Additionally, in Germany since 2010 when wheel disk rotations were found, dynamic torsional stresses of driven wheelsets must be considered for verification. Wheel disk rotations were assumed to be a result of temporary press fit failure due to too high dynamic torsional stresses. As they are classified as a dangerous event, they had to be reported to the national railway authority [1]. In the following, wheel disk rotations were examined in test ride measurements. These measurements revealed torsional vibration of the whole wheelset with oscillation amplitudes multiple-times higher than the maximum torsional stresses considered for stability verification calculations. However, no accident and no change of wheel gauge was ever found as the result of a wheel disk rotation. Still, from that time on, torsional stresses applied to wheelset axles and press fit by torsional vibration must be respected in the approval of new wheelsets. Furthermore, the wheel disk rotations on wheelsets which have been verified without considering torsional vibration before 2010 are only accepted by the regulatory authority under additional safety precautions [1]. This detailed consideration of torsional vibration in the verification process is a German specialty, not known to be practiced by other regulatory authorities. More details about the verification procedure for railway axles in Germany can be found in [2].
Today, in dimensioning newly constructed wheelsets against wheel disk rotation and against axle failure, the maximum dynamic torsional stress is required. As there has been no calculation method established so far to predict these stresses, they are determined experimentally on test ride measurements [3,4,5]. For each and every new or rebuilt vehicle class the same extensive measurements have to be conducted—this is the case as soon as the mechanical drive train or the drive control is modified. These measurements are time- and cost-intensive and their results are not always as definite as they need to be. Therefore, a reliable calculation method predicting the maximum torsional stresses is highly desired by manufacturers, operators and regulatory authority. In the past ten years, several attempts at simulating torsional vibration are documented. Some calculations focused on the prediction of maximum oscillation amplitudes, whereas others focused on describing the physical phenomenon itself. Amplitude prediction attempts prepared for the German verification process are the attempts of Vogel [6], Schneider [7], Weinhardt [8] and of Yu/Breuer [9]. Further investigations on the physics of torsional vibration are documented by Liu et al. [10], Konowrocki and Szolc [11], Xu et al. [12] and Meierhofer et al. [13]. In general, the phenomenon of torsional vibration of railway vehicle axles is firstly found to be documented by Körner [14] in the late 80s, when first vehicles with three-phase drive have been developed.

1.1. Vogel’s Law

Vogel’s law describes dynamic torque as a function of slippage considering physical parameters of the wheelset. Equation (1) gives the named dependence of dynamic torque M t , mass inertia of a wheelset wheel J W , torsional eigenfrequency f , wheel disk radius r W and slippage v s .
M t = 2 π   J W   f r w v s
Some measurement results show accordance with Vogel’s law, still, only for small slippages. At a certain range of slippage (typically at approximately 1 km/h) measurement results start to deviate from Vogel’s law. In that case Vogel’s law proofed to be more conservative than measurement results [13]. A general definition of the slippage range where Vogel’s law is valid, could not be found in literature.

1.2. Simulation Model of Schneider

The simulation model of Schneider is a four-mass model of the mechanical drive train including drive control with integrated slip control. In this model, torsional vibration is excited in the wheel-rail contact point by different changes of the wheel-rail adhesion conditions. Wheel-rail adhesion is described by an adhesion characteristic, which was derived from measurements [7].
This model was built up on basis of an electric double-deck multiple unit train. Model validation was accomplished by means of measurements on the mentioned multiple unit train. However, neither information on the transferability to other vehicle classes is given nor any general outcome on the pre-condition torsional vibration.

1.3. Simulation Model of Weinhardt

Additionally, Weinhardt built up a model of the mechanical drive train including a drive control with integrated slip control. In contrast to Schneider, Weinhardt not only took one wheel-rail adhesion characteristic but also derived a novel model of adhesion characteristic behavior especially for those instants of time, where torsional vibration occurs. He introduced a so-called dynamic adhesion gradient which changes with the frequency of torsional vibration [8].
Quantities of the dynamic adhesion gradients were derived from measurements conducted with a four-axle high speed electric locomotive. For calculation of the maximum dynamic torsional stress, Weinhardt included Vogel’s law into his model. Consequently, he successfully retrieved similar maximum dynamic torsional stresses from his model as measured on the according test rides. Still, information on the transferability of this model to other vehicle classes is not given in detail. It is said, that for simulation of other vehicles, parameters of the dynamic adhesion gradient model must be assumed or derived separately.

1.4. Simulation Model of Yu and Breuer

Yu and Breuer consider the physics of undamped swing up of torsional vibration leading to a limit cycle. For oscillation amplitudes of this limit cycle they take the energy balance to derive the maximum oscillation amplitude from the amount of energy existing in the system. The amount of energy that could be added into the system is estimated by the energy supplied by slide friction in the wheel-rail contact point and by energy absorption capacity of the wheelset [9].
Therefore, this model demands as precondition a conservative or representative wheel-rail adhesion characteristic. Similarly to Schneider, this characteristic is derived from measurements. Furthermore, the damping rates of the wheelset, of the mechanical drive train and of the drive control are necessary input parameters for the model of Yu and Breuer.
For four vehicle classes Breuer and Yu documented the results of their simulation and compared them to the results of measurements. Simulation results reach the magnitude of measured maximum oscillation amplitudes for all the four vehicle classes. Furthermore, they also conform with Vogel’s law for small slippages. For one of the four, simulation results are according to measurement results. For the other three, simulation results are slightly more conservative than the measurement results. In addition, Meierhofer et al. [13] verified the model of Yu and Breuer by means of an exact time-simulation and state it to be a viable prediction method for maximum dynamic torque.
For transferability to other vehicle classes, the authors point out the importance to use a representative adhesion characteristic and to use representative damping rate values for wheelset, mechanical drive train and drive control.

1.5. Motivation of the Model at Hand

Predicting the maximum torsional vibration amplitudes for German axle verification process proofed challenging in the past ten years. However, a lot of experiences on test conditions, which are affecting torsional vibration, have been made by the authors so far. These experiences shall be remodeled by the work at hand to serve more definite test conditions as a first step. Based on the results of this work, as a second step, the model shall be advanced to become a prediction tool for maximum dynamic torque or help to establish one of the already existing attempts toward an alternative for the wheelset certification process in Germany.
In fact, observed pre-conditions of torsional vibration conform with the findings of Liu et al. [10] and Xu et al. [12], which are that torsional vibration is generated by operating a driven wheelset beyond the rail-wheel adhesion limit. Additionally, the findings of Konowrocki and Szolc [11] that the drive train architecture affects the propagation of torsional vibration, conform with measurement experiences. Beyond that, torsional vibration appeared to occur with various kinds of tested railway vehicles so far: with locomotives as well as multiple unit trains, vehicles with electrical power systems, vehicles with combustion power systems, and with high speed as well as low speed trains. One major feature that all these vehicle types have in common is a drive control with integrated wheel slip control. As drive and slip controls of modern railway vehicles enable operation close to the adhesion limit, they tolerate wheel slip. The occurrence of small wheel slippages is observed to be a major pre-condition of torsional vibration as documented by Trimpe and Salander [2]. In their article, Trimpe and Salander specifically document measured wheel-rail adhesion conditions occurring at torsional vibration events. These measurements are different from the ones of Polach documented in [15]. Here, Polach measures general wheel-rail adhesion conditions without the occurrence of torsional vibrations. He conducted his measurements to validate a model describing the general wheel-rail adhesion conditions. He developed the named model based on his work on the FASTSIM algorithm [16,17]. Consequently, the authors investigate the excitation of torsional vibration assuming its origination from slip induced friction in the wheel-rail contact point all enabled by drive and slip control. This investigation will also help to identify the effectiveness of torsional vibration detection that manufacturers include in modern drive controls in order to passively damp the vibration.
Hence, for the work at hand, wheel-rail contact as well as drive and slip control shall be implemented realistically. As drive and slip controls usually are the secret know-how of manufacturers, it is difficult to find one sufficiently documented. For this reason, the well-documented drive and slip control of Schwartz [18] is used. Schwartz implemented his model in the FORTRAN based simulation environment NETASIM [18]. In the article at hand the model of Schwartz is reworked with state-of-the-art software tools to enable investigations on the physical origination conditions of torsional vibration of wheelset axles. As known from the measurements documented in [2], frequent changes of the wheel-rail adhesion conditions from strong to poor or vice versa lead to torsional vibration. With the original model of Schwartz, such adhesion changes cannot be implemented. It only allows changing the wheel-rail adhesion coefficient. Furthermore, it uses a simplified, rather static wheel-rail adhesion characteristic, which is independent of the overall vehicle velocity [18]. Still, the wheel-rail adhesion characteristic depends on the overall vehicle velocity as proofed by Polach’s measurements [15]. Additionally, from Polach’s measurements it is known that strong and poor wheel-rail adhesion conditions are not only described by different wheel-rail adhesion coefficients but also by a significantly different wheel-rail adhesion characteristic process. Covering this more realistic description of the wheel-rail contact demanded reworking Schwartz model with state-of-the-art software.
The overall model implementation is set up in a multibody simulation (MBS) environment. As drive and slip control could not be integrated in the MBS environment, they are implemented externally in a numerical computing environment and linked to the MBS model via co-simulation. Modeling in an MBS environment gives high flexibility to implement different mechanical drive train setups or adding degrees of freedom to the model. It also allows further investigations on how torsional vibration can be damped by adding damping elements to the mechanical drive train assembly as suggested by Konowrocki and Szolc [11]. Additionally, from measurement experience it is known that different drive concepts, which feature different torsional stiffness and damping, are prone to different torsional vibrations. In the same way, the implementation of drive and slip control in a numerical computing environment enables a flexible exchange of different control setups.
Consequently, reworking Schwartz’s model and adding a more realistic implementation of the wheel-rail contact point enables the investigation of how drive and slip controls may indirectly force torsional vibration of the wheelset when they strive for high wheel-rail adhesion utilization.
The next section documents the detailed setup of this overall model implementation. Section 3 contains the model validation and in Section 4 first investigation results on torsional vibration are presented. Finally, Section 5 concludes this article.

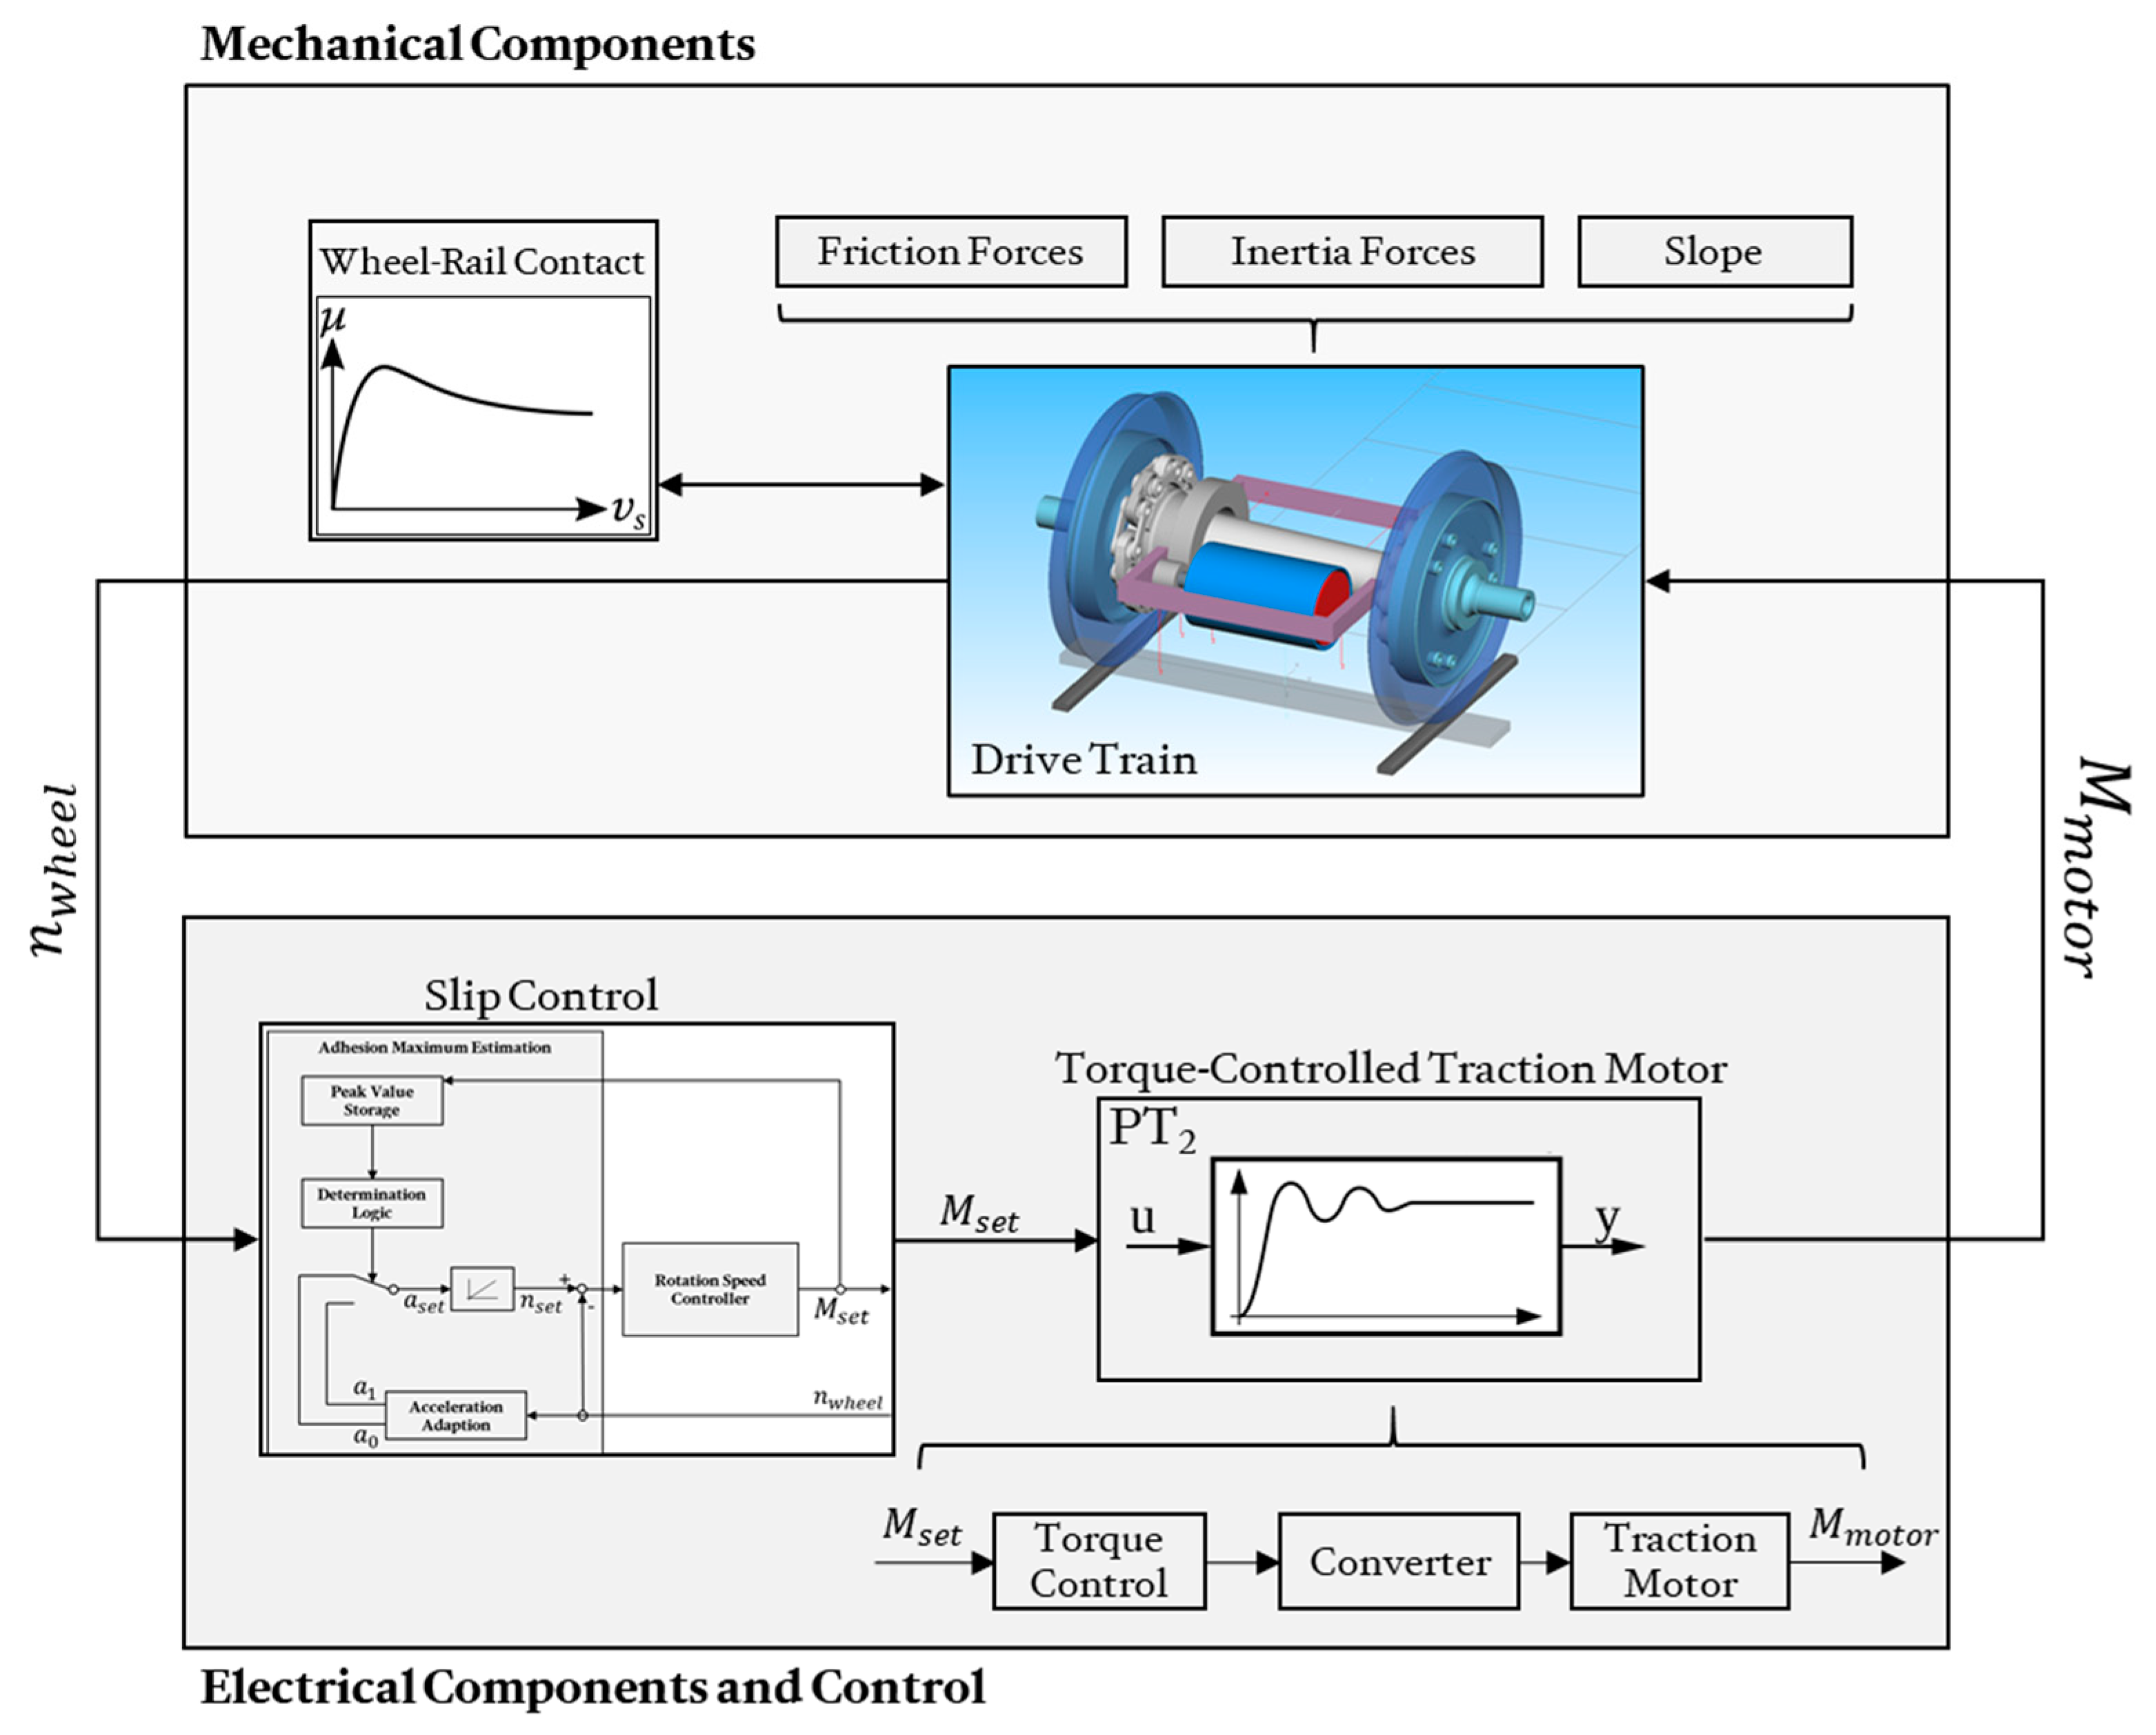
2. Simulation Model Setup

The model setup is based on the thesis of Schwartz [18]. In his work he developed the slip control of the first German three-phase traction drive locomotive, the class 120 locomotive. He documented the setup of his model including the mechanical drive train, the wheel-rail contact as well as the drive with its control. Using his drive and slip control, the belonging mechanical drive train is implemented newly. For simulation of the adhesion conditions in the wheel-rail contact point the well-established method of Polach is used. Furthermore, the model structure is modularized so that by an appropriate replacement of model parts also other railway vehicles can be modeled. Therefore, the model is grouped into substructures comprising mechanical components on the one hand and electrical components on the other hand. The mechanical components are:
  • The mechanical drive train;
  • The wheel-rail contact;
  • Friction and inertia forces of the train set.
The electrical components are:
  • The traction motor,
  • The torque control of the traction motor,
  • A wheel slip control.
In Figure 1, these substructures as well as their linkage are schematically depicted.

2.1. Mechanical Model

The mechanical model comprises the torque transmitting components of the mechanical drive train, the wheel-rail contact as well as the friction and inertia forces resulting from the train set.

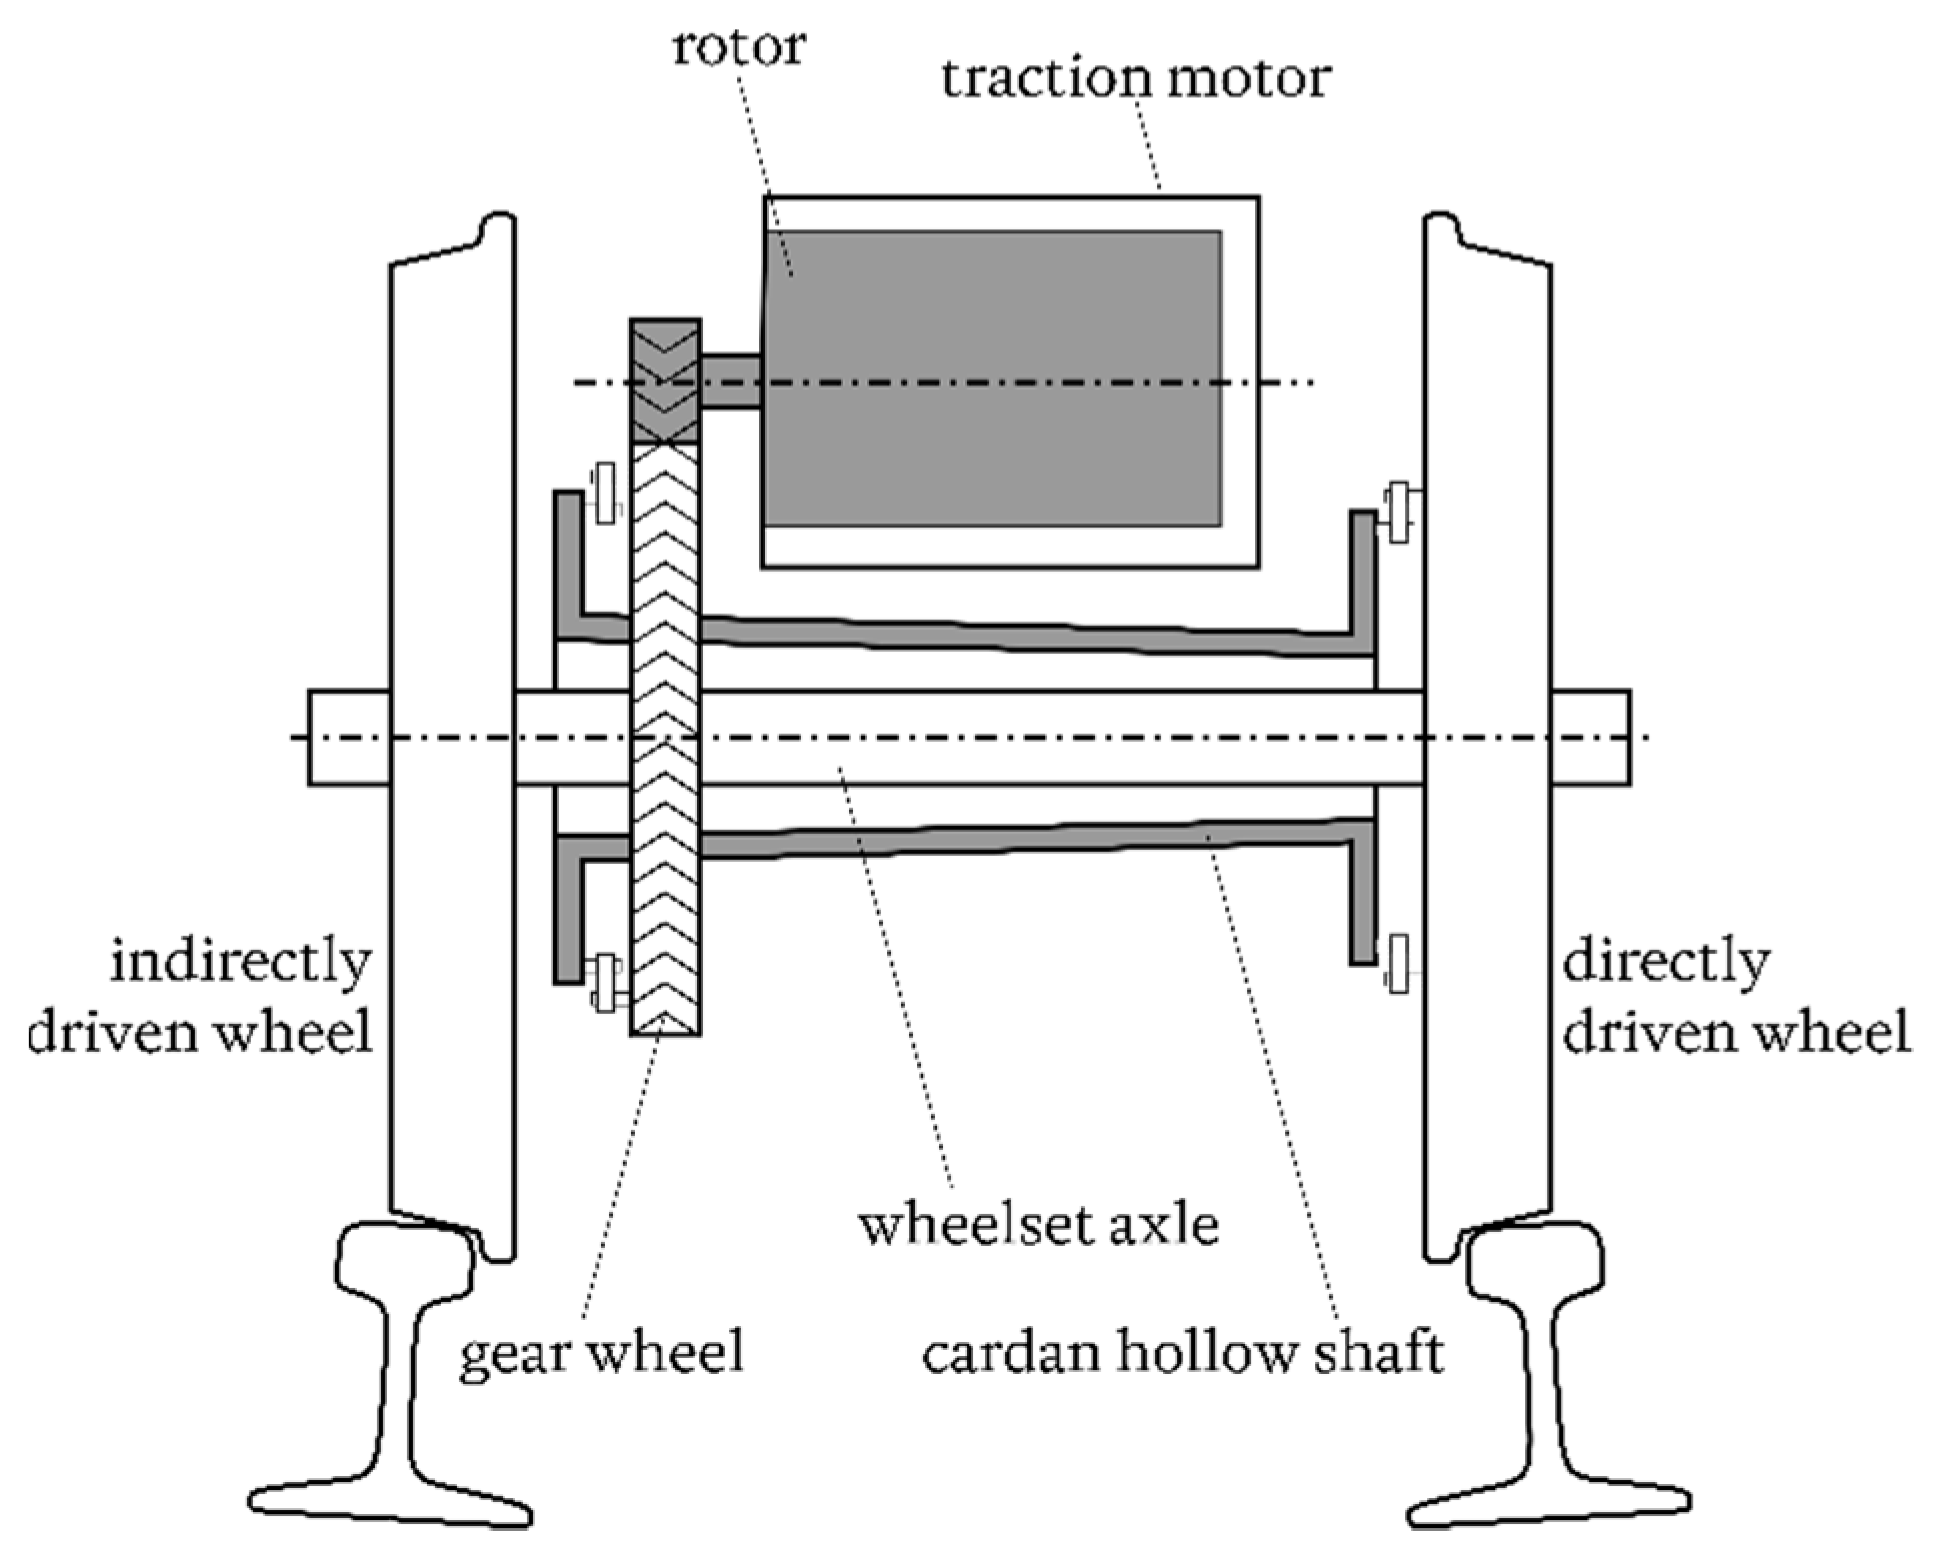
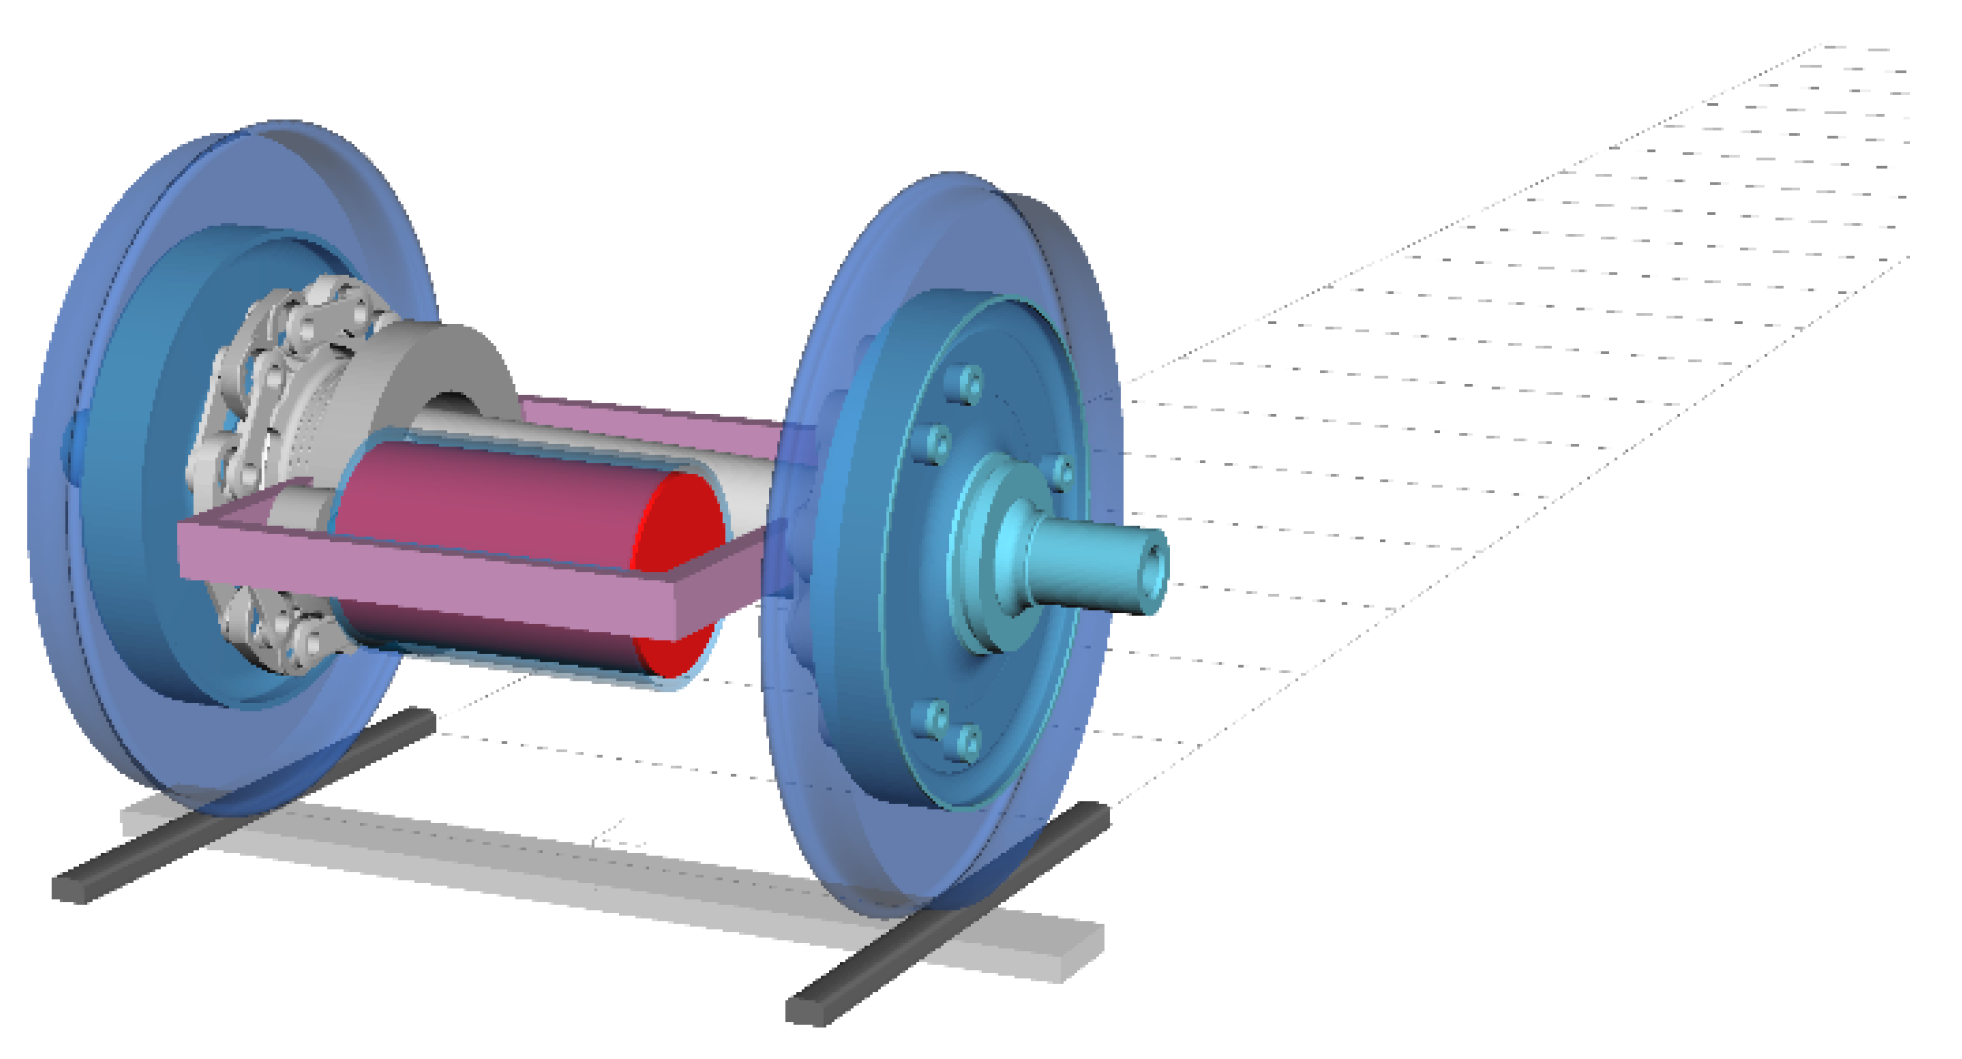
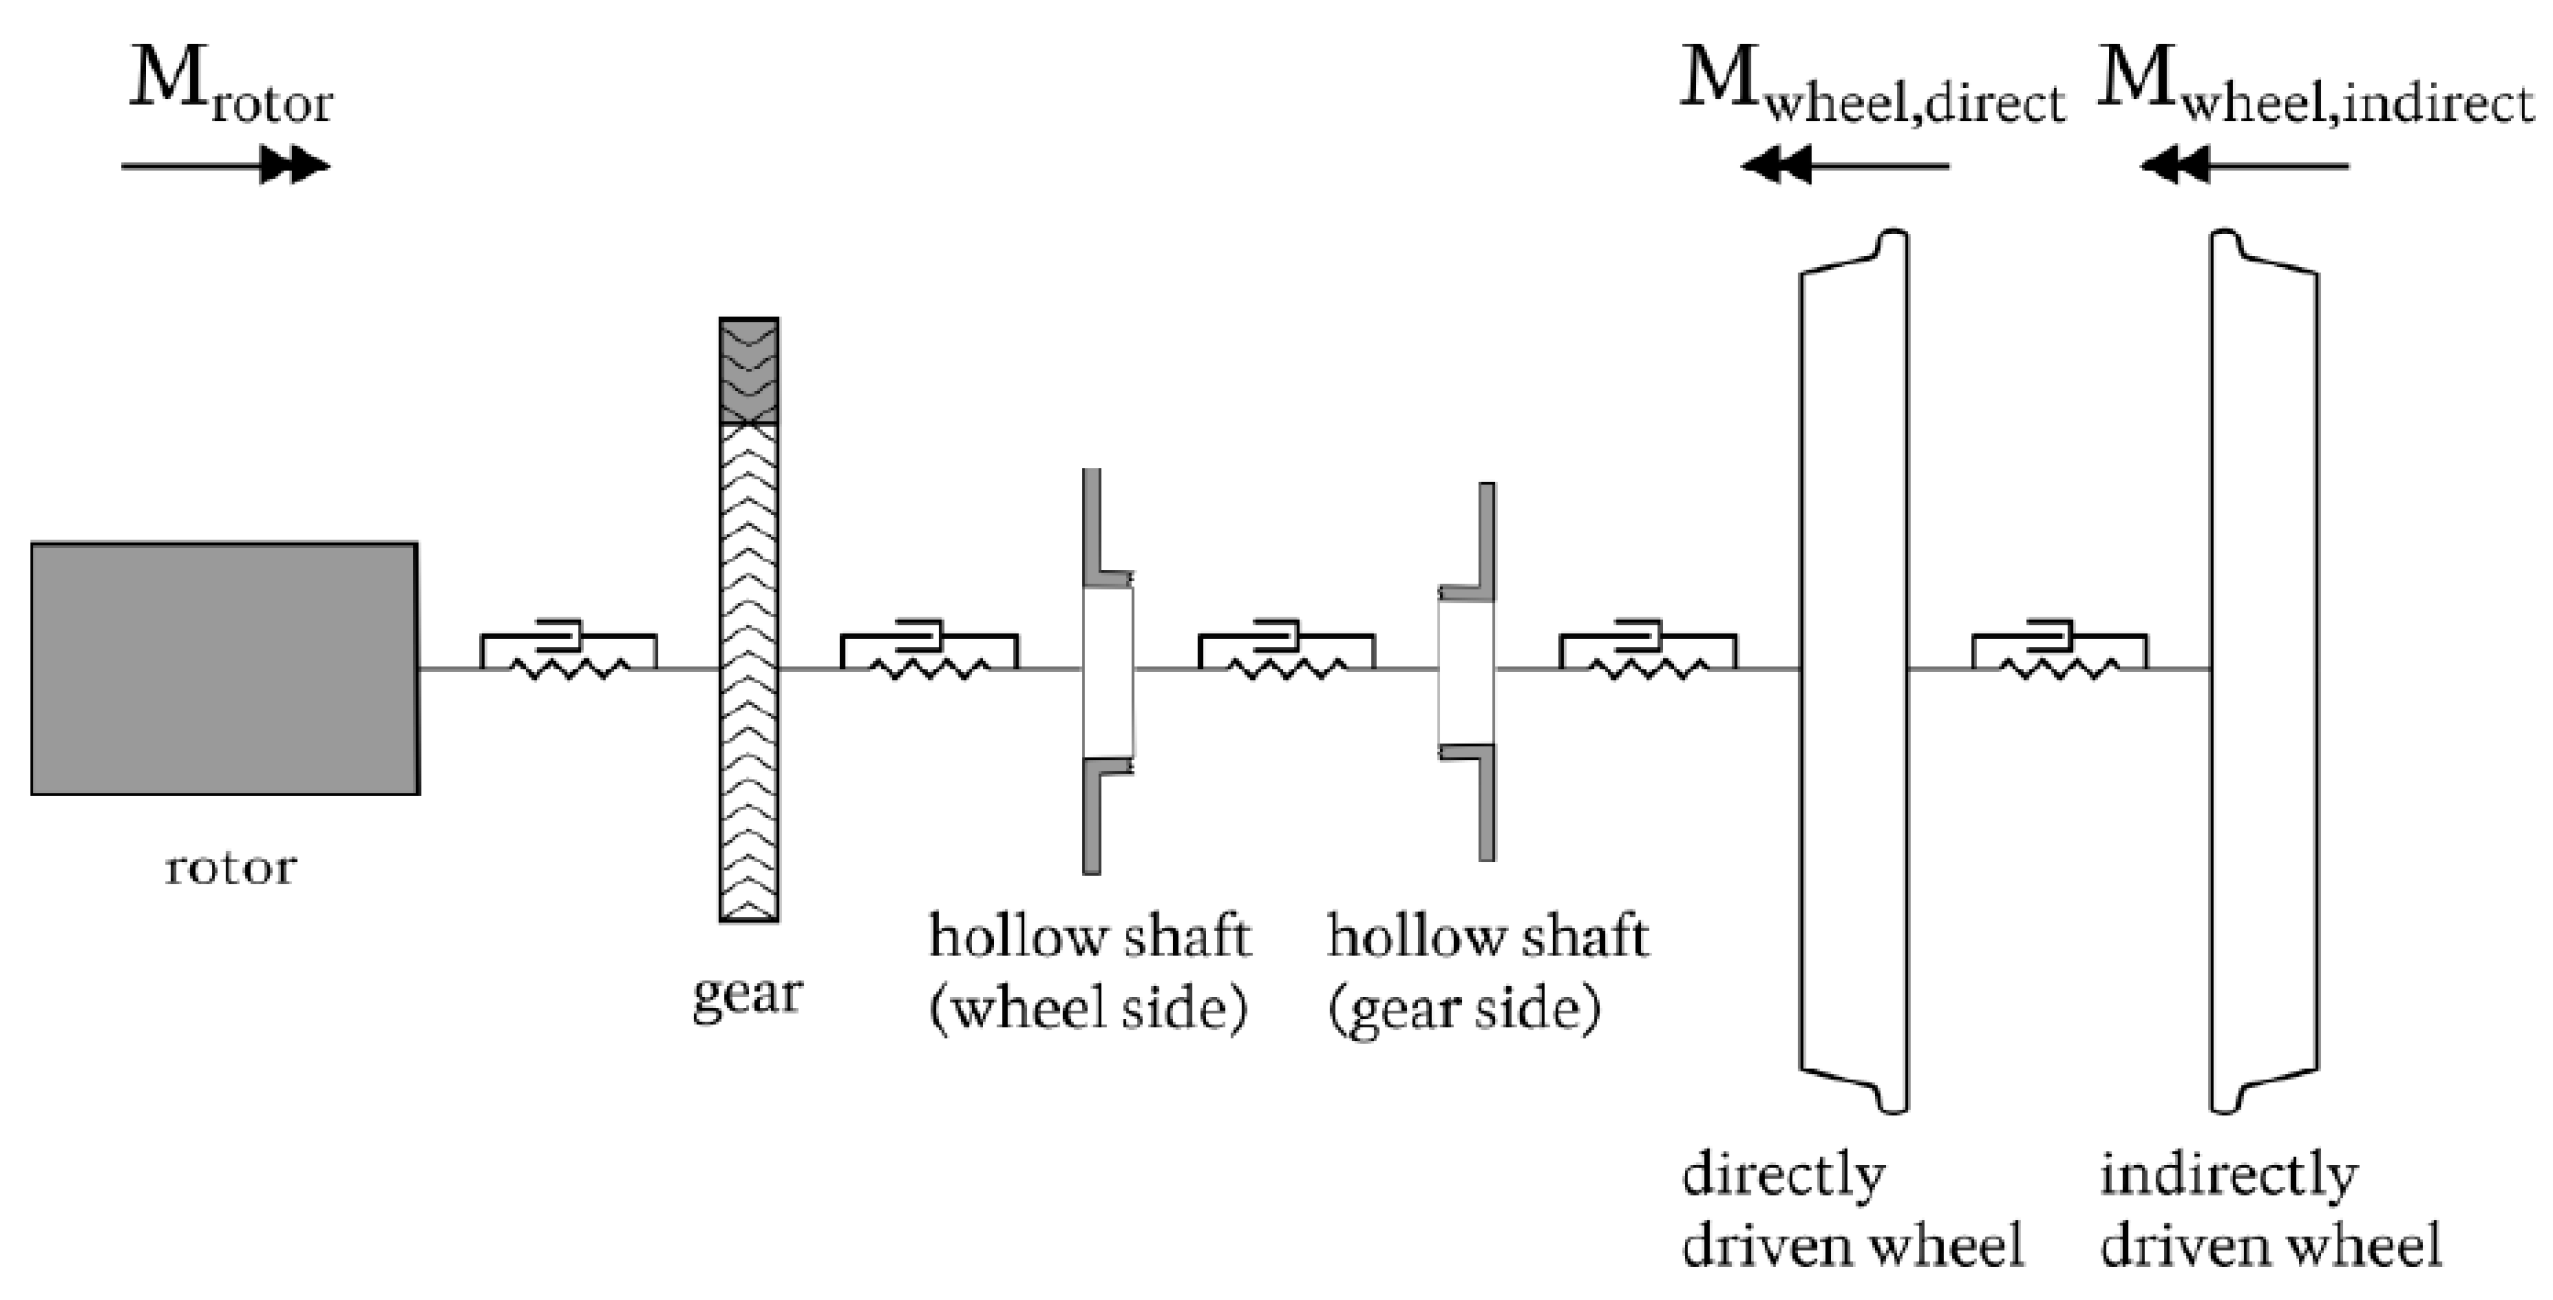
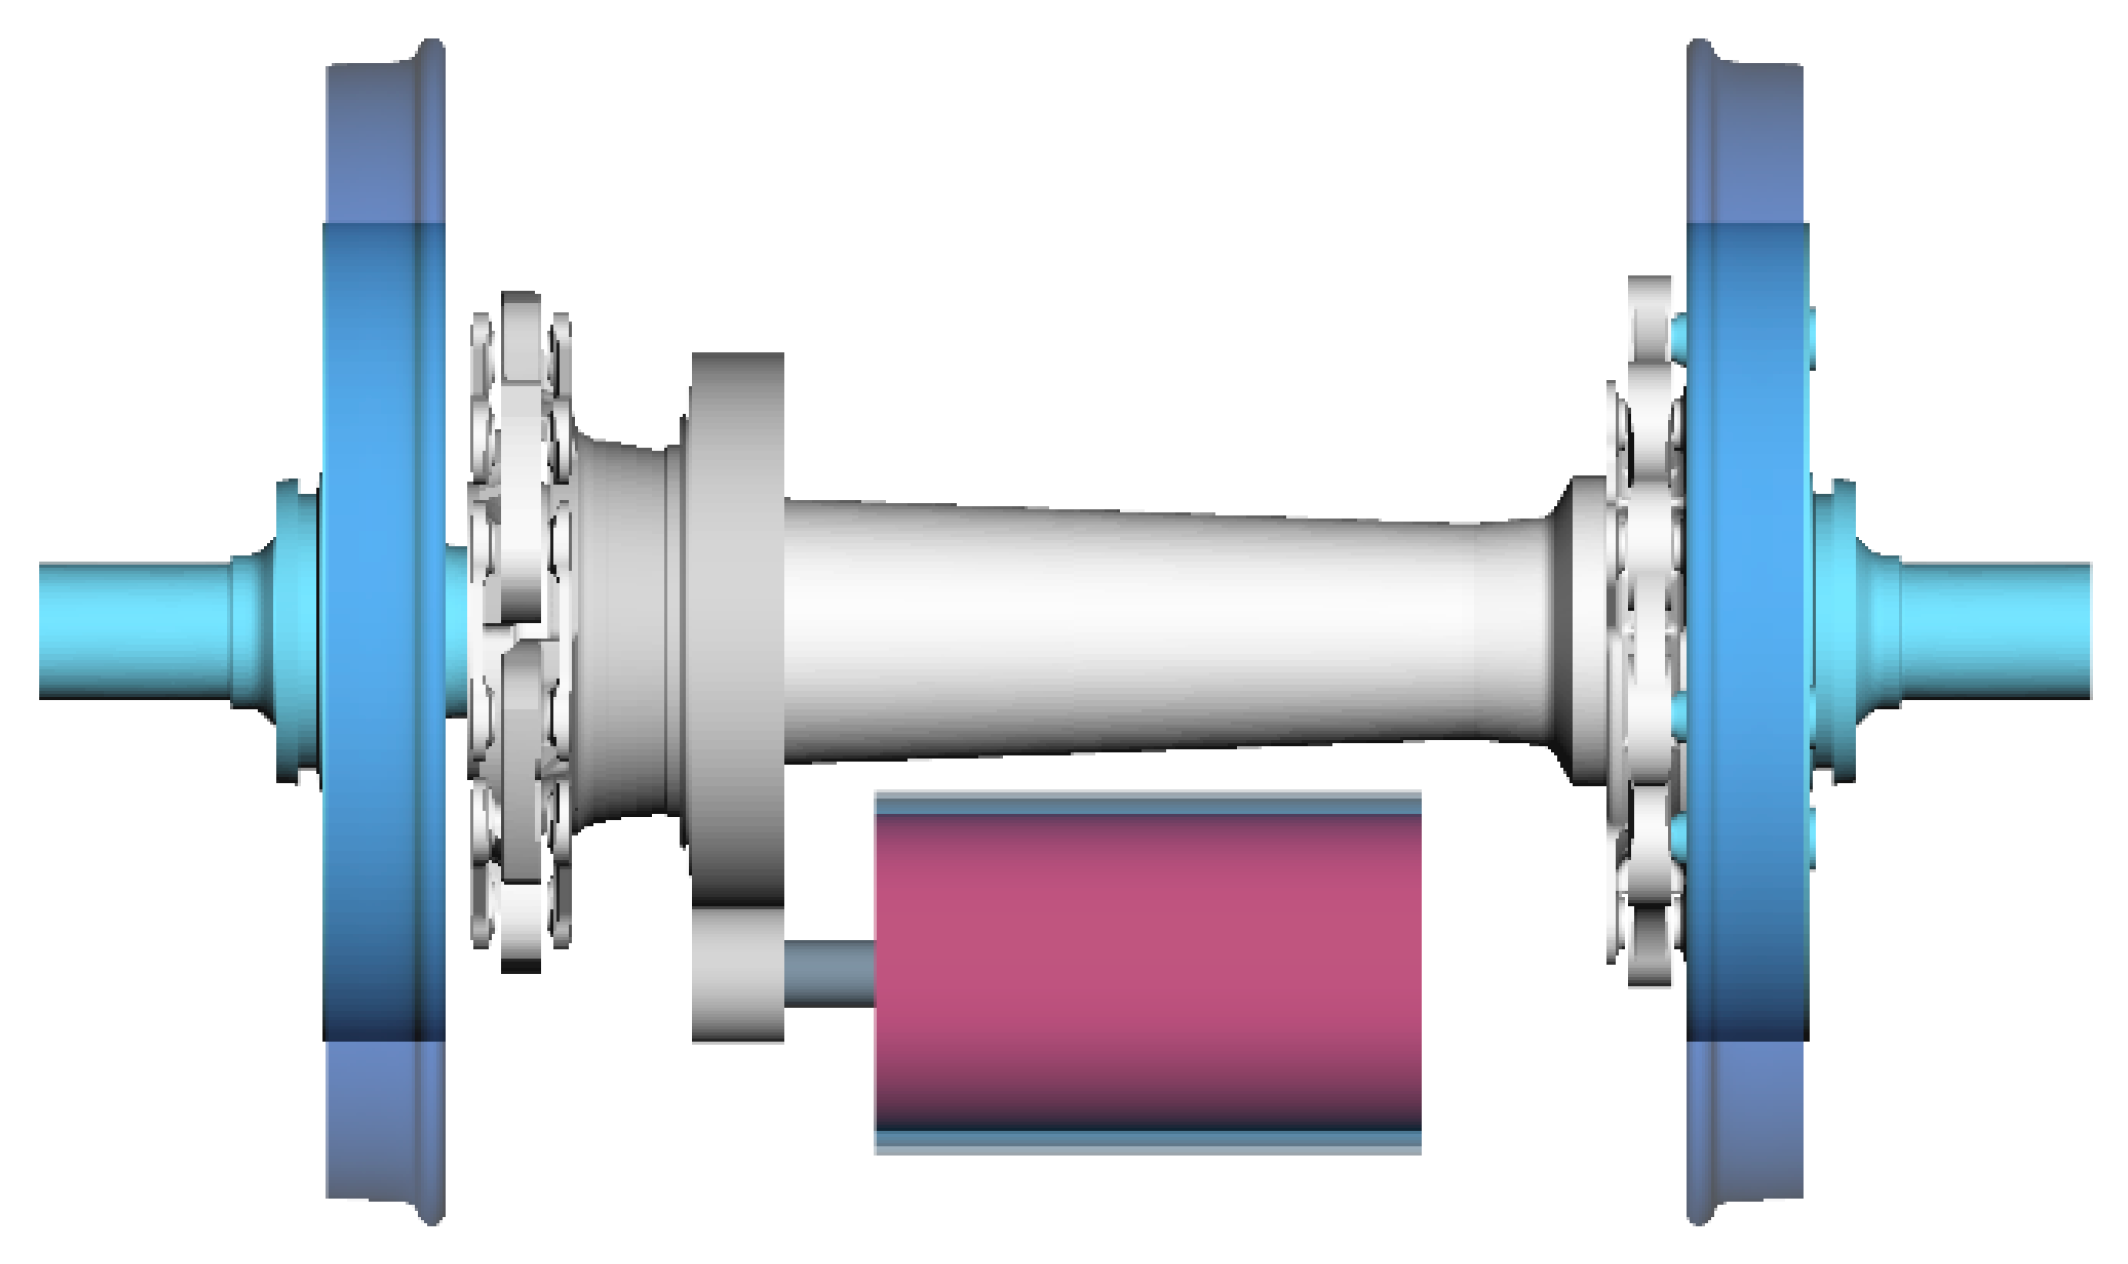
2.1.1. Mechanical Drive Train

For the mechanical drive train, according to Schwartz, the drive train of the German class 120 is modeled. Figure 2 sketches class 120’s hollow shaft drive train setup. Here, the traction motor drives the gear wheel that is attached onto the cardan hollow shaft. By this, the hollow shaft is driven to transmit torque by its coupling onto the directly driven wheel (right wheel in Figure 2). Finally, via the wheelset axle the directly driven wheel drives the indirectly driven wheel (left wheel in Figure 2).
Mechanical characteristics, such as component masses and moments of inertia, are implemented in an MBS model. These characteristics are joined with the geometry of the drive train components as shown in Figure 3. This quarter model of class 120’s drive system is enabled to move along the track in longitudinal direction and to move freely in the vertical direction.
All drive train components feature rotational degrees of freedom between each other. They are coupled by torsional spring and damper elements. The MBS model considers masses and moments of inertia of:
  • Rotor;
  • Gear wheels;
  • Coupling;
  • Hollow shaft;
  • Wheelset axle;
  • Both wheels.
Furthermore, the torsional stiffness and damping are considered of:
  • Gear;
  • Coupling;
  • Hollow shaft;
  • Wheelset axle.
Here, also the transmission ratio of the single-stage gear is included in the model. Figure 4 gives an overview of the described mechanical characteristics of the MBS model setup.
Numerical values for the torsional stiffness and torsional damping used for the MBS model are chosen in accordance to Schwartz [18]. They are listed in Table 1. Their mechanical connection is sketched by the authors in Figure 4.

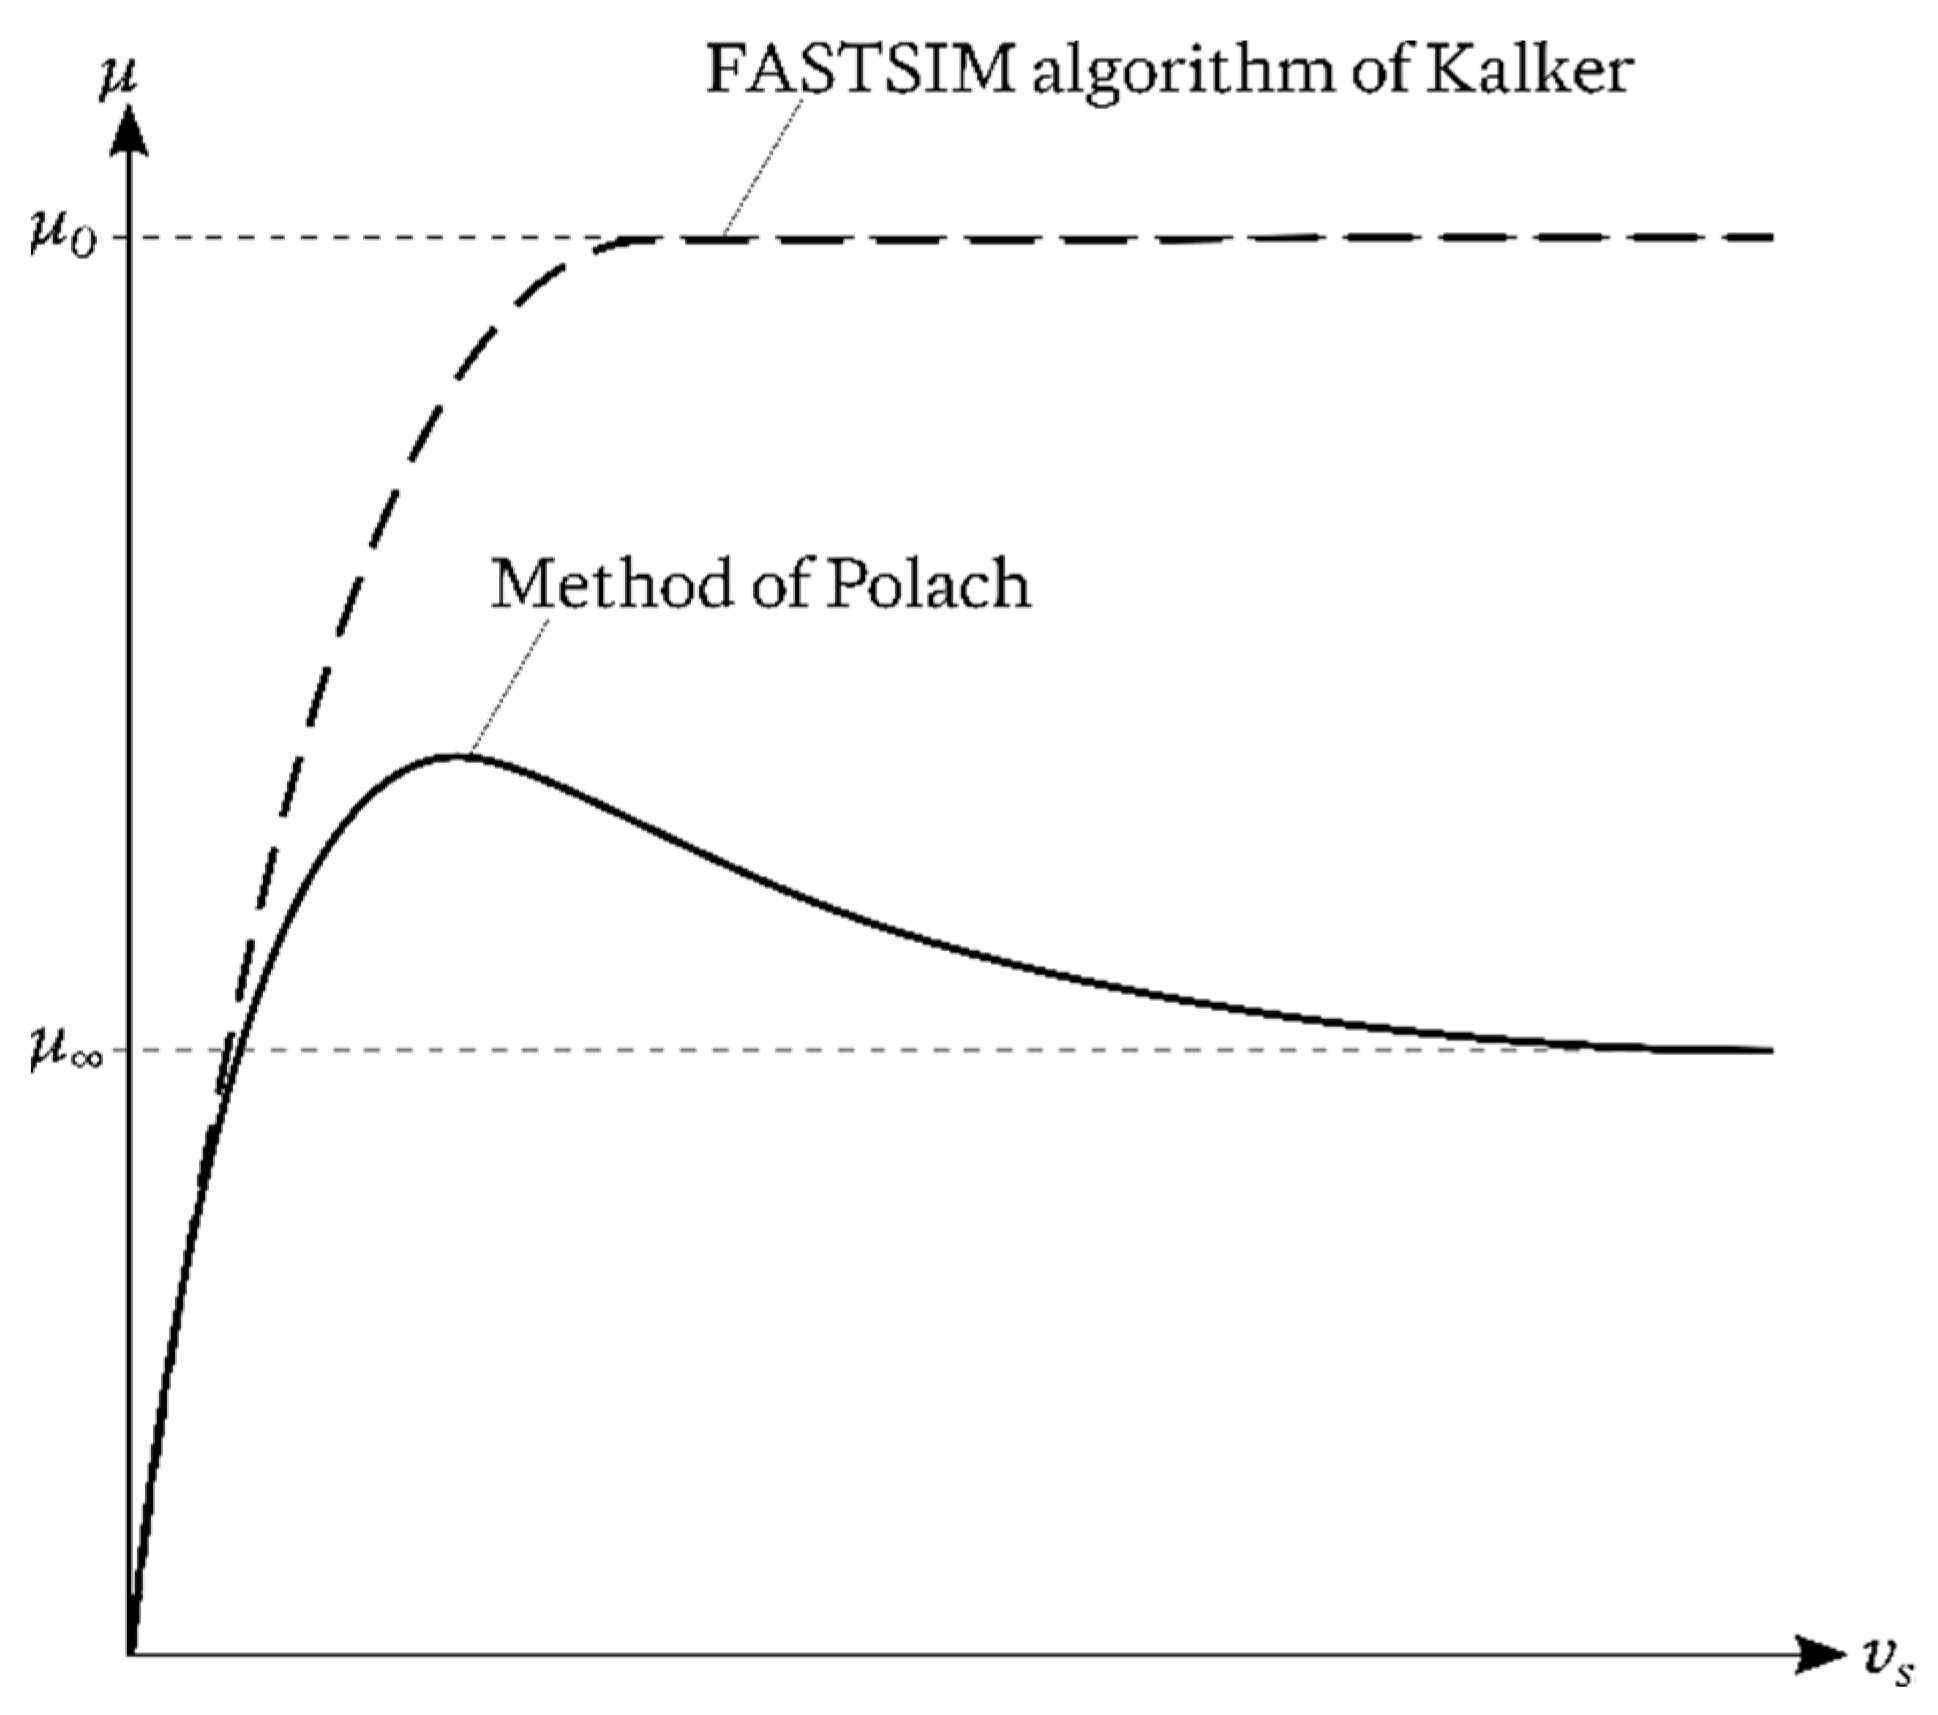
2.1.2. Wheel-Rail Contact

Whereas modeling of the mechanical drive train is accomplished in accordance with Schwartz, the modeling of the wheel-rail contact is accomplished with state-of-the-art method of Polach. This is because the rather simplistic implementation of the wheel-rail contact of Schwartz does not enable frequent changes of the wheel-rail adhesion conditions. Such frequent changes are assumed to cause torsional vibration [2] and shall therefore be sufficiently modeled by the MBS model at hand.
In general, the maximum transmissible traction forces between wheel and rail are described by the wheel-rail adhesion coefficient as a function of the relative velocity between wheel and rail. The process of the wheel-rail adhesion coefficient as a function of the named relative velocity and its peak value depend on
  • The rail conditions (dry, wet, dirty, etc.);
  • The overall vehicle speed;
  • Material properties;
  • The relative position between wheel and rail;
  • Further operational quantities (e.g., rail temperature).
The implementation of all these influences is covered by the method of Polach, which is verified by measurements [15]. The analytical description of the tangential forces in the wheel-rail contact point F considering the named influences is given by Equation (2).
F = 2 Q μ π ( k A ε 1 + ( k A ε ) 2 + a r c t a n ( k s ε ) ) , k s k A 1
Here, Q is the wheel load, μ the wheel-rail adhesion coefficient and k A and k s weighting factors. The gradient of tangential stress in the adhesion area ε is depending on the relative velocity between wheel and rail v s and the contact ellipse in the wheel-rail contact described by its half-axes a and b . Equation (3) gives the correlation between the gradient of tangential stress ε and the named quantities.
ε = 2 3 C π a 2 b Q μ v s
In the simulation, the contact ellipse, respectively its half axes a and b , as well as the relative velocity v s and the wheel load Q are directly provided by the MBS model. Additionally, the wheel-rail adhesion coefficient μ is determined by the MBS model. Generally, in numerical simulations, the wheel-rail adhesion coefficient is calculated by the FASTSIM algorithm of Kalker as it provides the required calculation performance [17]. However, in the MBS model at hand the method of Polach is used [15]. In contrast to the FASTSIM algorithm, it also implements a decrease of the wheel-rail adhesion coefficient for higher relative velocities, which is assumed to be highly relevant for the occurrence of torsional vibration. Figure 5 illustrates the described difference between the two wheel-rail contact implementation methods.
In the simulation, the wheel-rail adhesion coefficient μ can be influenced by various factors as given by Equation (4) [19].
μ = μ 0 · C 1 ( s , y r ) · C 2 ( y w ) · C 3 ( A , B ) · C 4 ( | v r e l | ) · C 5 ( | σ | )
Here, C 1 is an input function scaling the wheel-rail adhesion coefficient depending on the longitudinal and lateral position of the wheel-rail contact point on the rail surface. With input function C 2 the wheel-rail adhesion coefficient is scaled depending on the lateral position of the wheel-rail contact point on the wheel surface. With C 3 the Polach coefficients A and B are included in the calculation of the wheel-rail adhesion coefficient. Equation (5) gives the correlation of these two coefficients in dependence of the relative velocity v s [19].
C 3 ( A , B ) = ( 1 A ) · e B · | v s | + A
Generally, A represents the ratio of the wheel-rail adhesion coefficient at infinity μ and the maximum wheel-rail adhesion coefficient μ 0 . B affects the exponential friction decrease. With input function C 4 the wheel-rail adhesion coefficient is scaled depending on the magnitude of the tangential contact relative velocities between wheel and rail. With input function C 5 the wheel-rail adhesion coefficient is scaled depending on the magnitude of the creepages in longitudinal and lateral direction [19].

2.1.3. Friction and Inertia Forces of the Train Set

Traction forces applied to a train set are opposed by its friction and inertia forces. The latter are not represented in the MBS model by modeling all vehicles of an investigated train set. Moreover, rolling and air resistance are included into the quarter model of class 120’s drive system by Equations (6) and (7) according to Schwartz’s model [18]. These equations conform with basis works such as Sachs [20] or Filipovic [21]. Equation (6) describes the rolling resistance in dependence of the total train set mass [18].
F r o l l = m t r a i n · g · k r o l l
Here, the amplification factor k r o l l = 1.5   ×   10 3 is used. Similarly, Equation (7) describes the air resistance in dependence of the total train set mass.
F a i r = m t r a i n · g · k a i r
Here, the amplification factor k a i r depends on the class of train set. The following two factors are used for cargo and for passenger trains [18]:
  • k a i r , c a r g o = 0.25   ×   10 6 ( km h ) 2 for cargo trains,
  • k a i r , p a s s e n g e r = 0.33   ×   10 6 ( km h ) 2 for passenger trains.
In contrast to Schwartz, the grade resistance of a slopy track is not respected by an equation such as Equation (6) or Equation (7). Moreover, the slope resistance can directly be modeled in the MBS model by adding slope to the modeled track. Additionally, inertia forces that originate from the train set are simply represented by an additional element added to the MBS model.

2.2. Model of the Electrical Components

The model of the electrical components consists of the torque-controlled traction motor and the slip control. Both substructures are described in the following two sections.

2.2.1. Torque-Controlled Traction Motor

As torsional vibration is assumed to be enabled by high frequency torque control of modern three-phase traction drives, the torque control needs to be modeled realistically. Here, the simplified torque control model of Schwartz proofed to serve realistic results by occurrence of torsional vibration [18]. He models the torque-controlled traction motor by a PT2 element. By choosing appropriate time constants and an appropriate damping rate the control behavior of the traction motor can be simulated realistically. For the traction drive of the German class 120 locomotive Schwartz derived the PT2 element as documented by Equation (8) [18].
G ( s ) = 1 1 + s T I + s 2 T I T e r s
Here, T e r s = 3.75   ms and T I = 2 · T e r s = 7.5   ms are the time constants and D = 1 2 is the damping rate.

2.2.2. Slip Control

The main objective of the slip control is to prevent states of high relative velocities between wheel and rail and to recondition states of no slip. However, the introduction of three-phase current technology on locomotives disclosed the possibility of systematical operation with small slip. In fact, operation with small slip enables significantly higher traction transmission between wheel and rail than operation with almost no slip. Such a slip control is the one documented by Schwartz. In the simulation model at hand, it is implemented in accordance with [18].
The named control consists of two major components: first is the adhesion maximum estimation, second is the rotation speed controller. The essential input quantity for both components is the rotation speed measured by the traction motor. Based on the change of this rotation speed as a function of time, the adhesion maximum estimation determines, if the actual operation point is located left of the adhesion maximum or right of it (see the curve of the method of Polach in Figure 5). With it, the adhesion maximum estimation allows the rotation speed controller to further increase the rotation speed or to decrease it instead. Additionally, an increase in rotation speed is only being released if the set value has not yet been reached.
The block diagram of Figure 6 illustrates the described interaction of the slip control components. It also illustrates that the adhesion maximum estimation consists of an acceleration adaption, a determination logic and a peak value storage.
The acceleration adaption determines the actual vehicle acceleration a on basis of the change of the rotation speed as function of time. Upon this vehicle acceleration the acceleration adaption defines two possible acceleration set values by adding or subtracting the absolute acceleration change Δ a . Equation (9) gives the two resulting acceleration set points a 1 and a 0 .
a 1 , 0 = a   ±   Δ a
The determination logic then decides, if the rotation speed controller must use set value a 1 or set value a 0 . The basis for this decision is the deviation Δ M of the motor torque set value M s e t from the temporary peak value M m a x saved by the peak value storage. Each time a well-defined value of deviation is exceeded, the determination logic switches from a 1 to a 0 or vice versa.
With the mechanism described, the adhesion maximum is permanently passed through, at first by triggering relative velocities right of the adhesion maximum and then by triggering relative velocities left of the adhesion maximum and so on. This operation around the adhesion maximum is executed by the rotation speed controller. Consisting of a P element it amplifies the acceleration set value in consideration of the amplification factor k P into the motor torque set value.
Numerical values for all the introduced well-defined parameters used by the slip control are chosen as proposed by Schwartz [18]. These values are listed in Table 2.

2.3. Overall Model Implementation

Combined execution of the substructure models of mechanical and electrical components is accomplished by a co-simulation. The mechanical model is set up with the MBS software Simpack, the electrical components torque control and slip control are implemented in MATLAB/Simulink. Both substructures are linked by a co-simulation interface. According to Figure 1 the mechanical components’ substructure in Simpack transfers the actual revolutions per minute to the electrical components’ substructure in MATLAB/Simulink. On the contrary, the electrical components’ substructure in MATLAB/Simulink transfers the motor torque set value to the mechanical components’ substructure in Simpack.

3. Simulation Model Verification

Model validation shall ensure sufficient conformity with the actual system. Even though the scope of work is the investigation of torsional vibration, the fundamental model validation needs to be conducted for self-oscillation and control behavior as well as the wheel-rail contact. A direct validation of the model at hand on basis of measurements—especially the validation of the wheel-rail contact—is challenging and has not been accomplished yet. Still, planning of test ride measurements using measurement wheelsets is currently ongoing. In the following, verification of the model at hand based on the partly validated model of Schwartz is documented.
Schwartz already verified his model in terms of control behavior on the actual control behavior of a German class 120 locomotive by conduction of a stability analysis [18]. Finally, Buscher validated the drive and slip control of Schwartz on test ride measurements [22] with good accordance of simulation results and measurement data.
For verification of the model at hand the well-documented simulation results of Schwartz are matched by using the same input parameters as he used. Here, the self-oscillation behavior of the mechanical drive train is verified by conduction of a modal analysis and the control behavior is verified in the time domain. Finally, resulting wheel-rail adhesion characteristics of the model at hand (by using the Polach method) are compared to the characteristic Schwartz used.

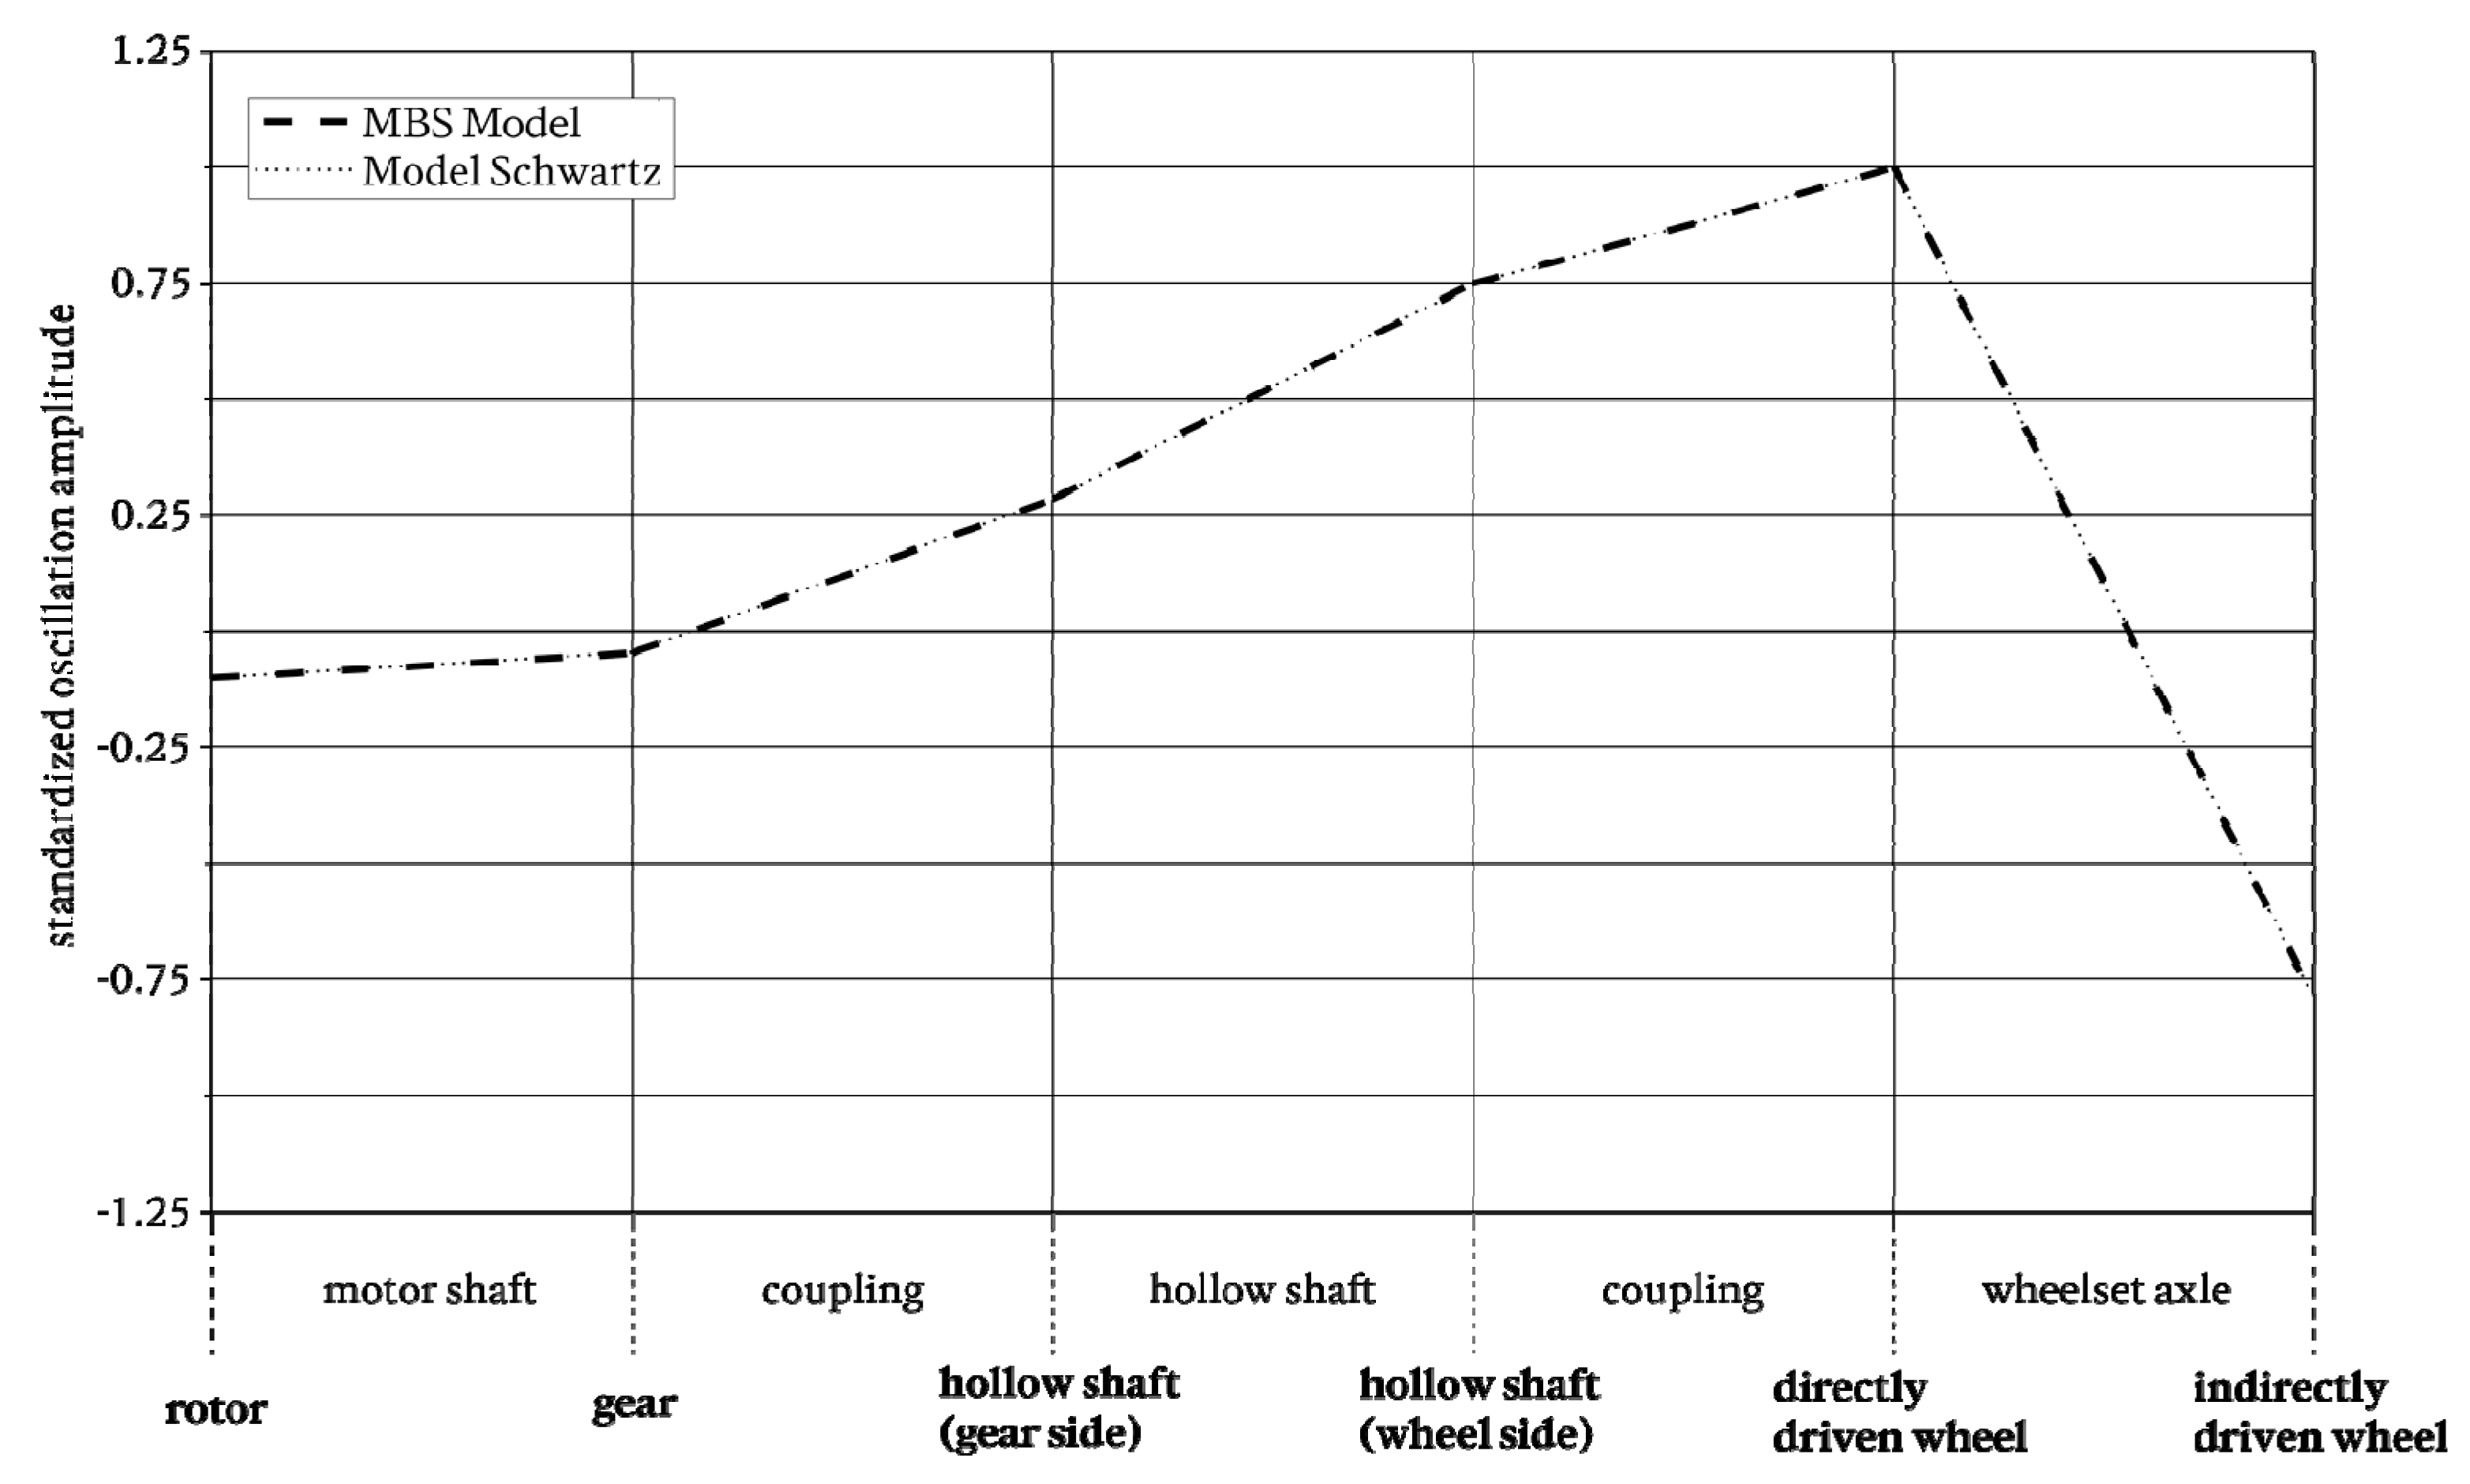
3.1. Verification of the Mechanical Drive Train (Modal Analysis)

Verification of the mechanical drive train substructure and functionality according to Schwartz is accomplished by performing a modal analysis. Resulting eigenmodes and eigenvalues are verified on basis of the documented eigenmodes and eigenvalues of Schwartz [18]. Here, only rotary oscillations are considered. The wheel-rail contact is not included into this modal analysis as the levitating mechanical drive train of Figure 7 shows.
Results of the modal analysis are listed in Table 3. As expected by using the same torsional stiffnesses, the same torsional damping rates and the same moments of inertia, the resulting eigenmodes and eigenvalues are the same as documented by Schwartz [18]. Disregarding rounding differences, the eigenfrequency values of all six eigenmodes are matching the values of Schwartz exactly.
The second eigenmode with the eigenfrequency f 2 = 21.28   Hz is an oscillation mode, at which oscillation of the whole mechanical drive train is excited. As further discussed by Schwartz, this eigenmode can directly be damped by an appropriate implementation of the drive control [18]. The third eigenmode with the eigenfrequency f 3 = 50.76   Hz is the relevant one for torsional vibration of the wheelset. This is illustrated by the depicted oscillation amplitudes of the mechanical drive train in Figure 8. Here, the displacement directions of the two wheelset wheels are contrary to each other so that the nodal point is located at the wheelset axle. Furthermore, Figure 8 shows very small oscillation amplitudes of rotor and motor shaft. This means that torsional vibration of the wheelset does not propagate to the traction motor so that it cannot be detected by controlled quantities of the motor. Consequently, it cannot actively be damped by the drive control. Still, manufacturers use to integrate a vibration detection in today’s drive controls to prevent swinging-up of oscillation amplitudes by reducing traction forces ahead of time.

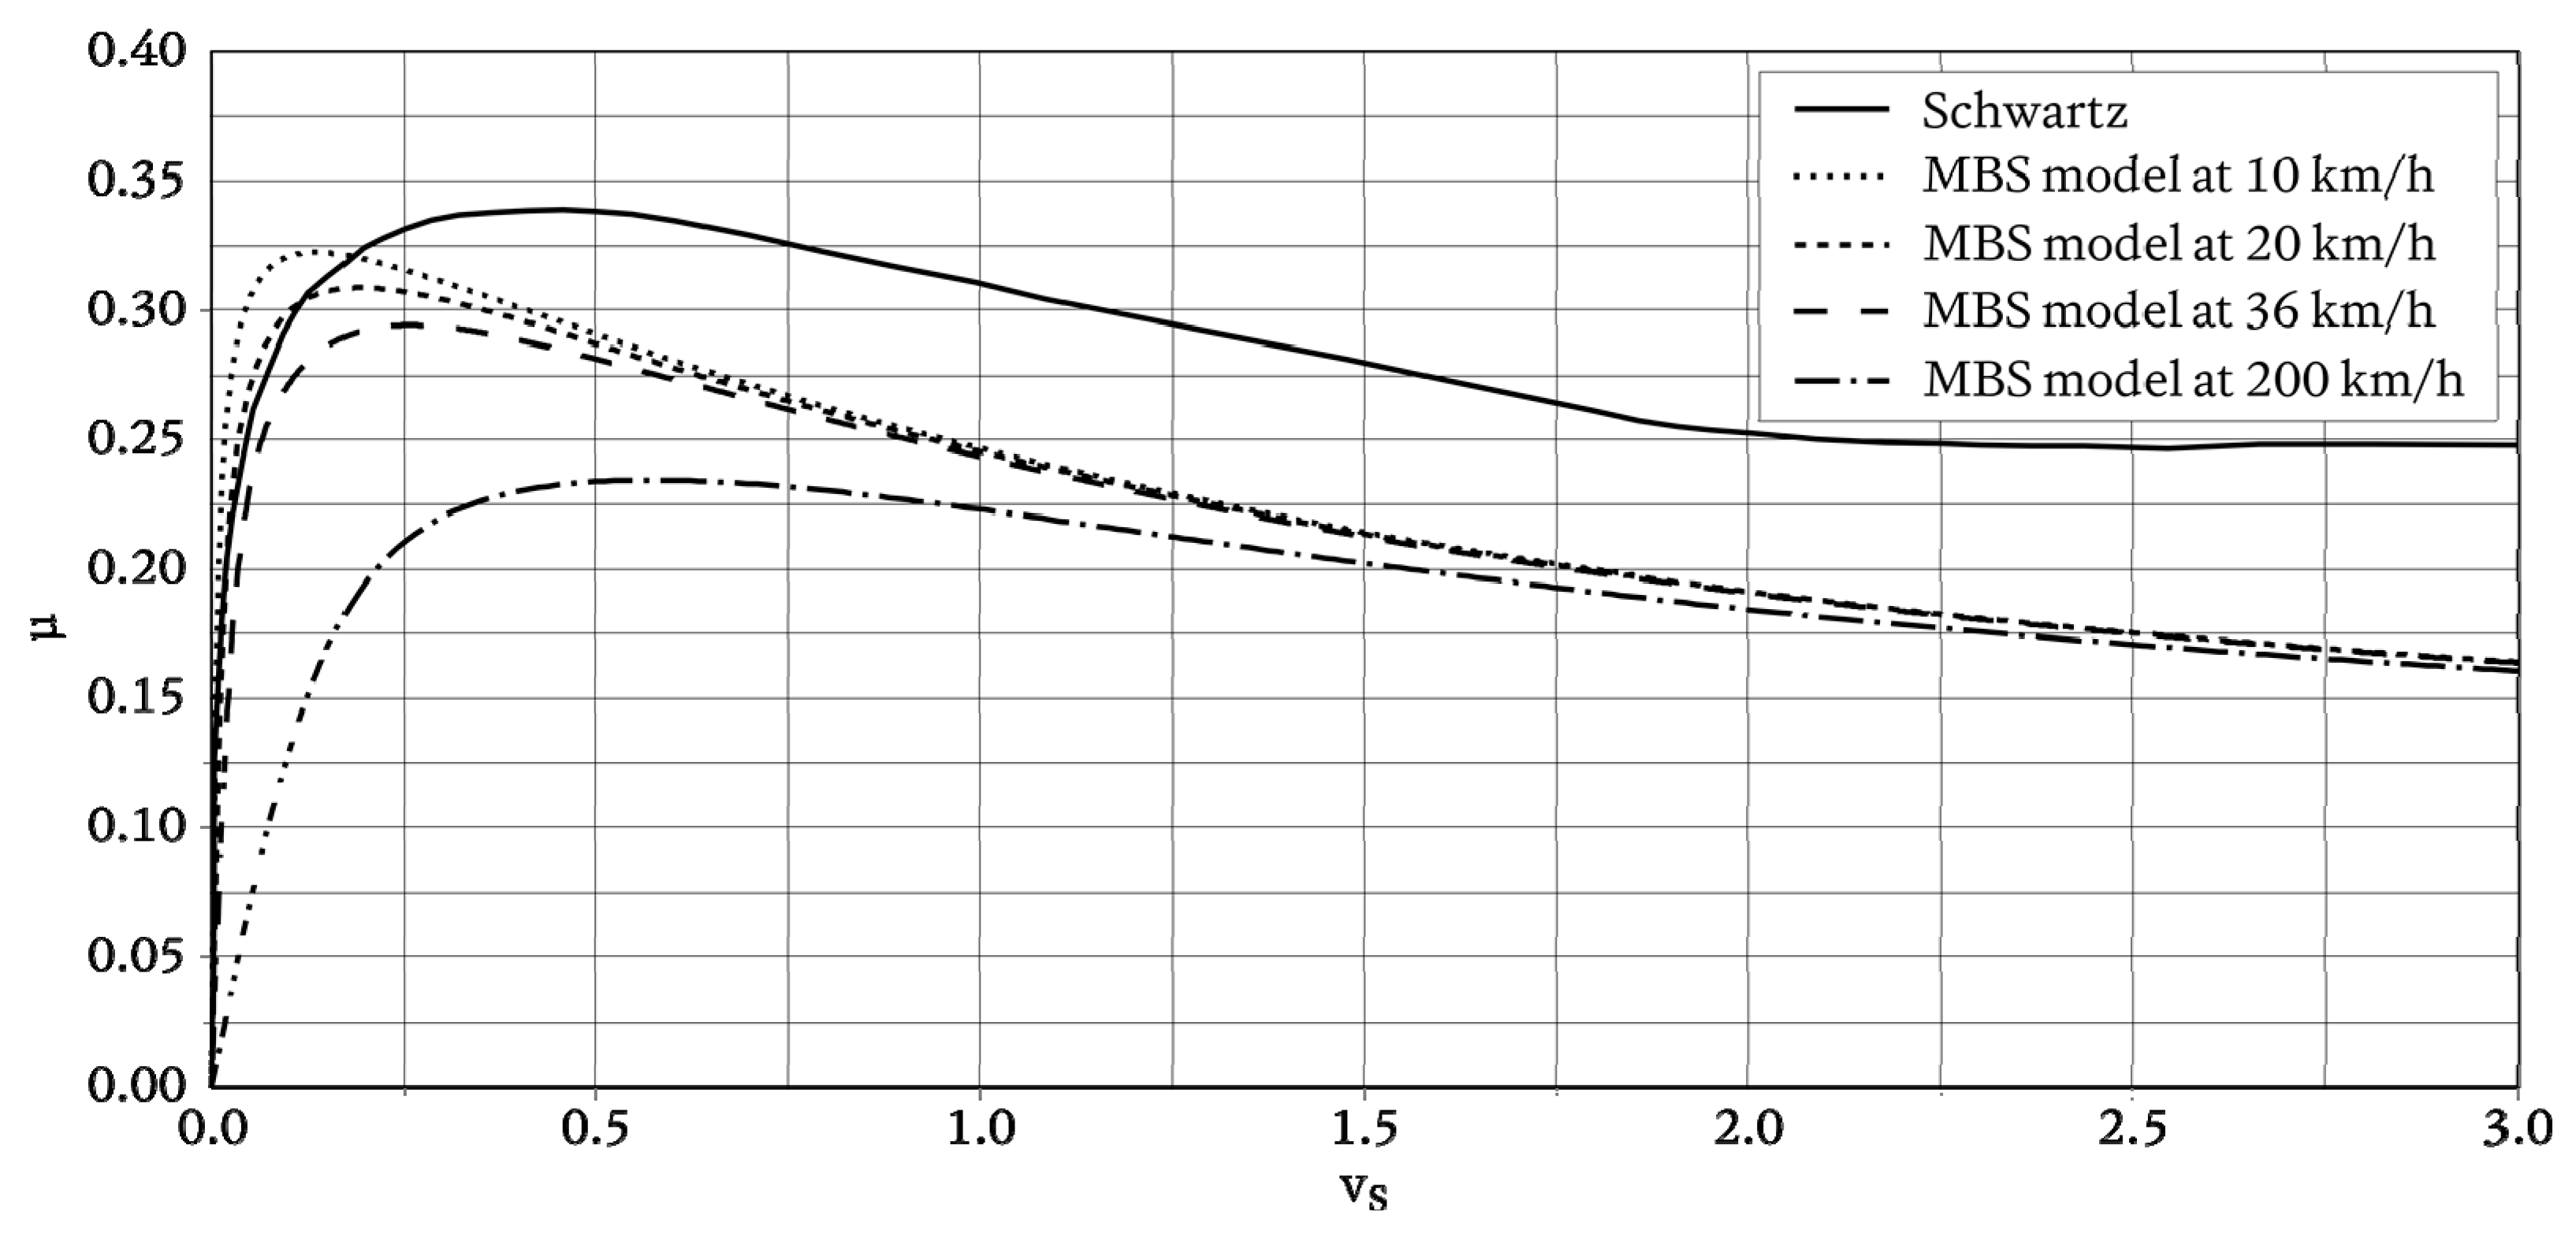
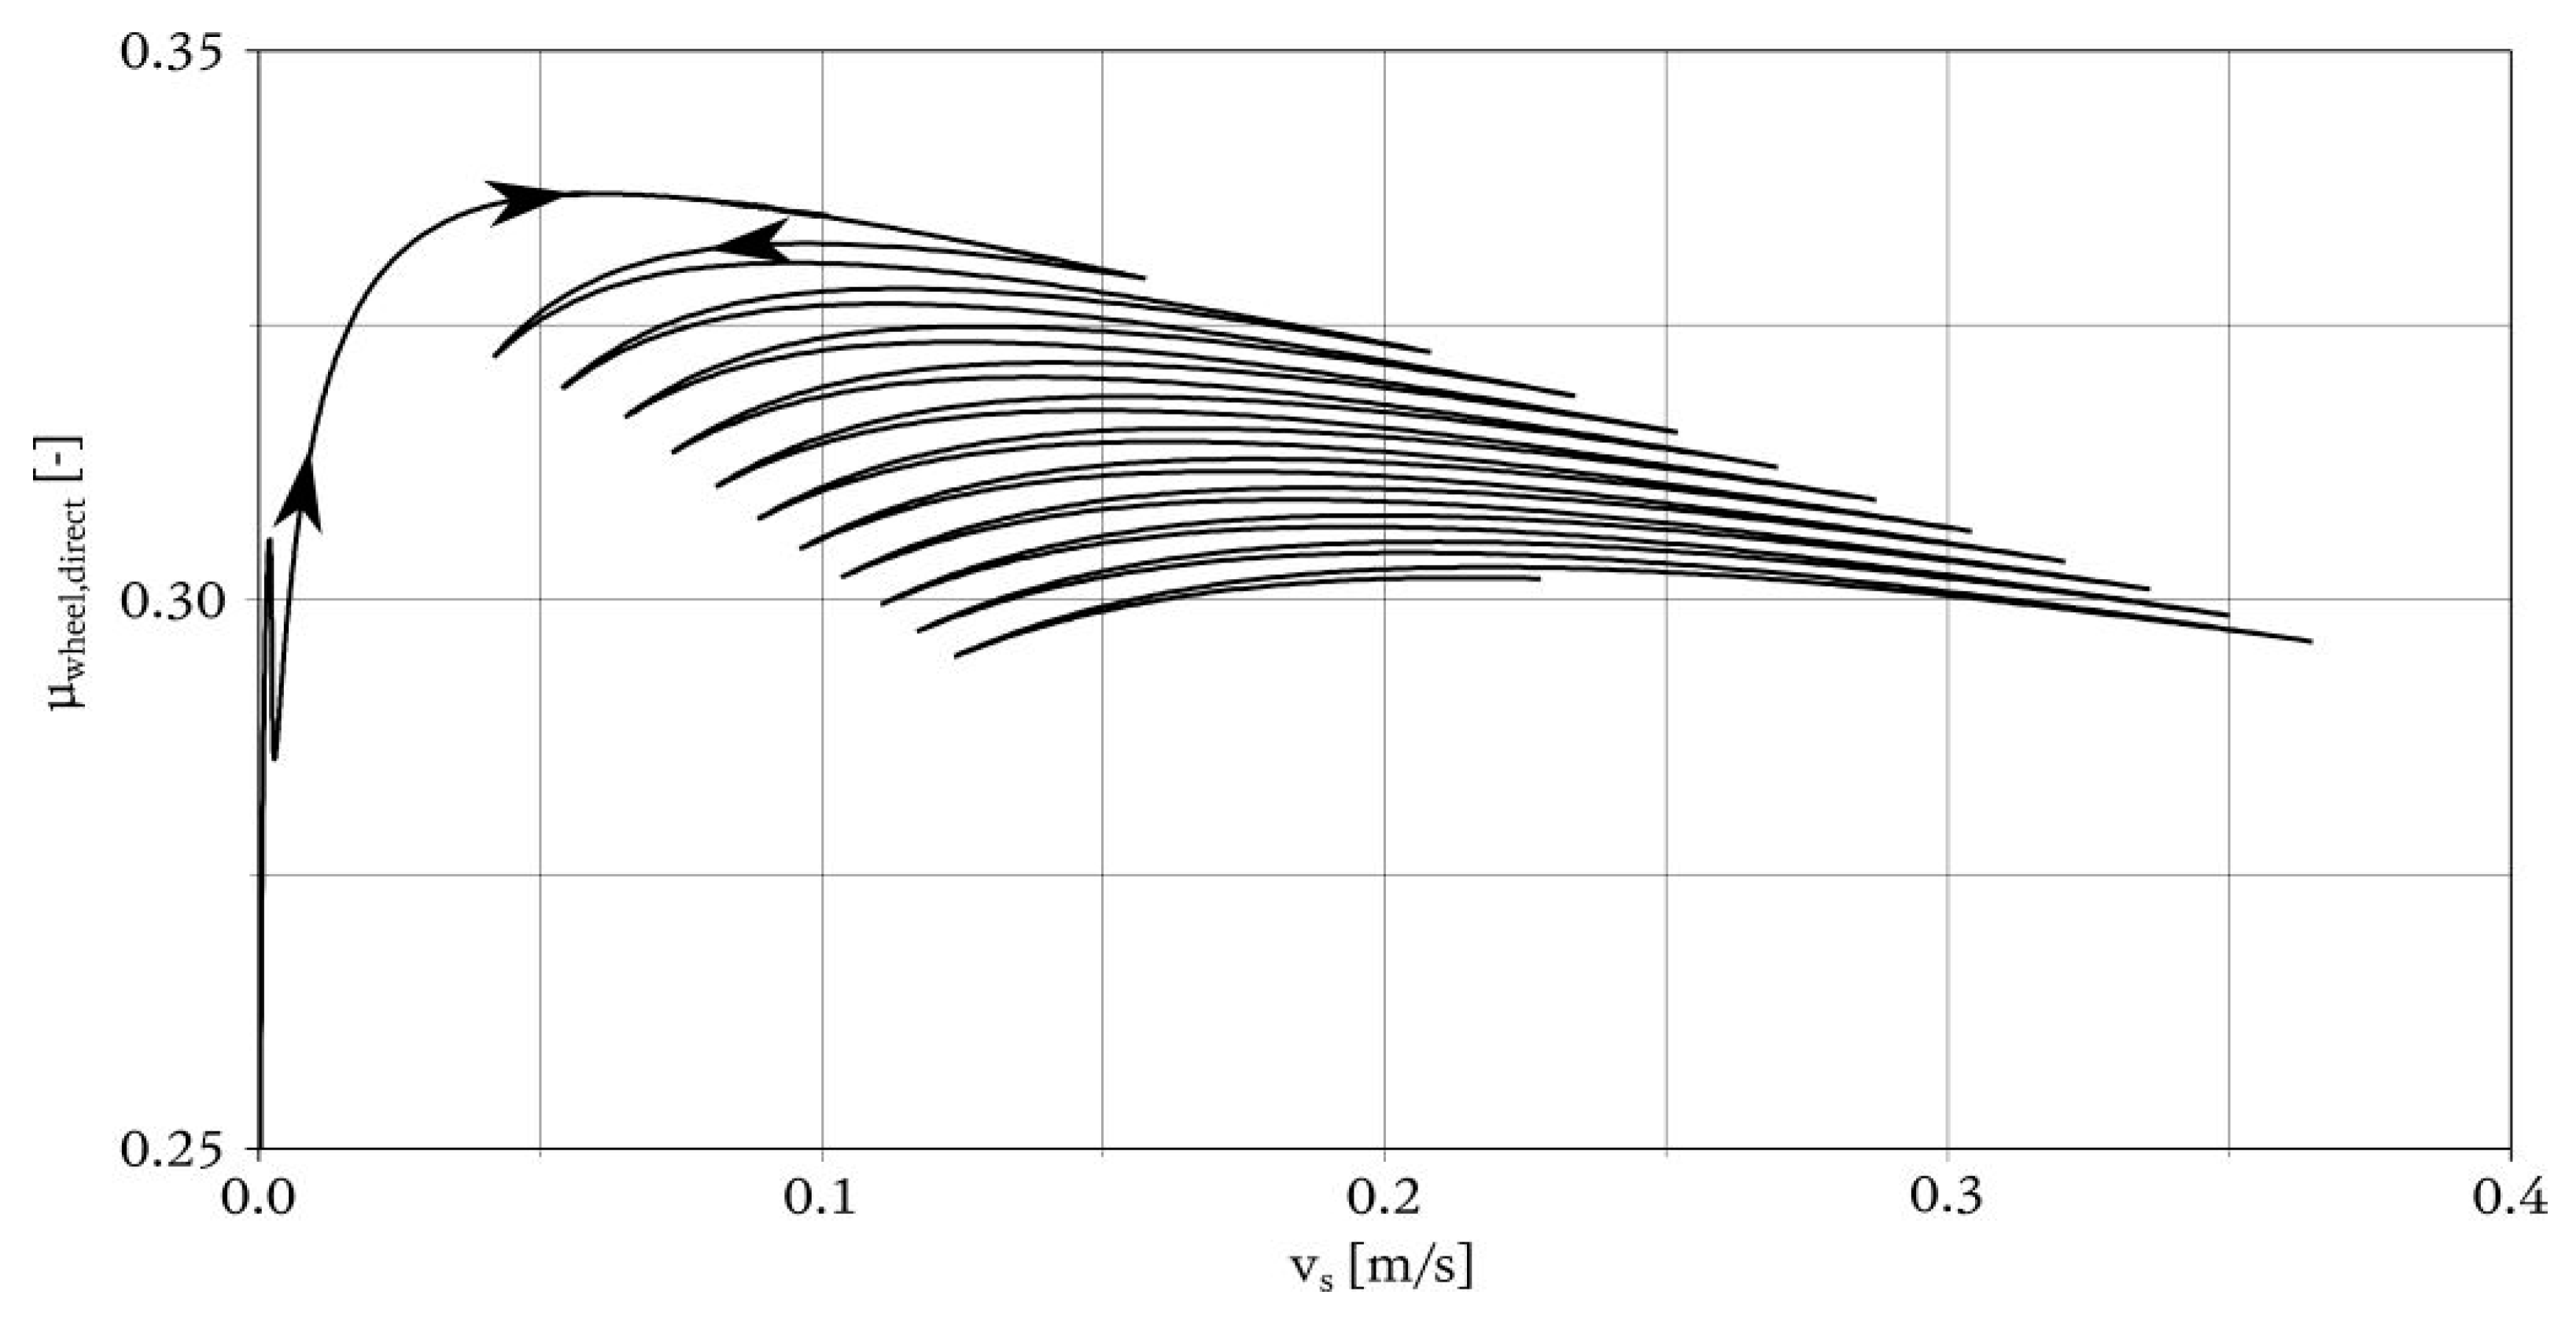
3.2. Comparison of the Wheel-Rail Contact Implementation

Schwartz includes a static wheel-rail adhesion characteristic into his model on a tabularly basis. With this kind of wheel-rail contact implementation Schwartz realized stochastic and static changes of the wheel-rail adhesion coefficient. Stochastic changes simulate changes of wheel-rail adhesion conditions, static changes simulate variation of the wheel-rail adhesion characteristic originating from the overall vehicle velocity. For comparison, Schwartz’s wheel-rail adhesion characteristic is reproduced with the model at hand by choosing appropriate values for parameters μ 0 , A , B , k A and k s for the method of Polach. The simulation of wheel-rail adhesion changes by stochastic variation of the wheel-rail adhesion coefficient is not reproduced as changes of the wheel-rail adhesion conditions are more realistically implemented by an appropriate application of the method of Polach.
For reproduction of the static wheel-rail adhesion characteristic of Schwartz the maximum wheel-rail adhesion coefficient μ 0 , the weighting factors k A and k s as well as Polach coefficients A and B are varied to reproduce the wheel-rail adhesion characteristic of Schwartz. Furthermore, simulations with the model at hand are performed for various overall vehicle velocities. For which overall vehicle velocity the presented wheel-rail adhesion characteristic of Schwartz is representative is not documented in [18]. Based on its maximum wheel-rail adhesion coefficient of μ m a x = 0.34 the wheel-rail adhesion characteristic is assumed to be representative for small overall vehicle velocities close to halt ( v s 0   km / h ). In Figure 9, the wheel-rail adhesion characteristic documented by Schwartz is depicted as well as characteristics retrieved from the MBS model at different overall vehicle velocities of 10, 20, 36 and 200 km/h. For all of the latter characteristics, numerical values for μ 0 = 0.36 , k A = 0.72 , k s = 0.36 , A = 0.38 and B = 0.7   s / m were chosen according to the validation measurements of Polach at an overall vehicle velocity of 36 km/h on a dry track [15].
As a result, for none of the simulated overall vehicle velocities the wheel-rail adhesion characteristic used by Schwartz could be matched. However, it is striking, that the qualitive process of the retrieved characteristic at a vehicle speed of 200 km/h is very similar to the one used by Schwartz. Still, no reason could be found for this similarity. Consequently, the implementation of the wheel-rail contact proofed different from the implementation of Schwartz for the whole range of overall vehicle velocities. Deviations of MBS simulation results from the simulation results of Schwartz presented in the following section originate from this different wheel-rail contact implementation. As Polach validated his general description of the wheel-rail adhesion on test ride measurements, the wheel-rail adhesion characteristics of MBS model depicted in Figure 9 are assumed to be more realistic than the one of Schwartz. Still, they need to be validated by test ride measurements.

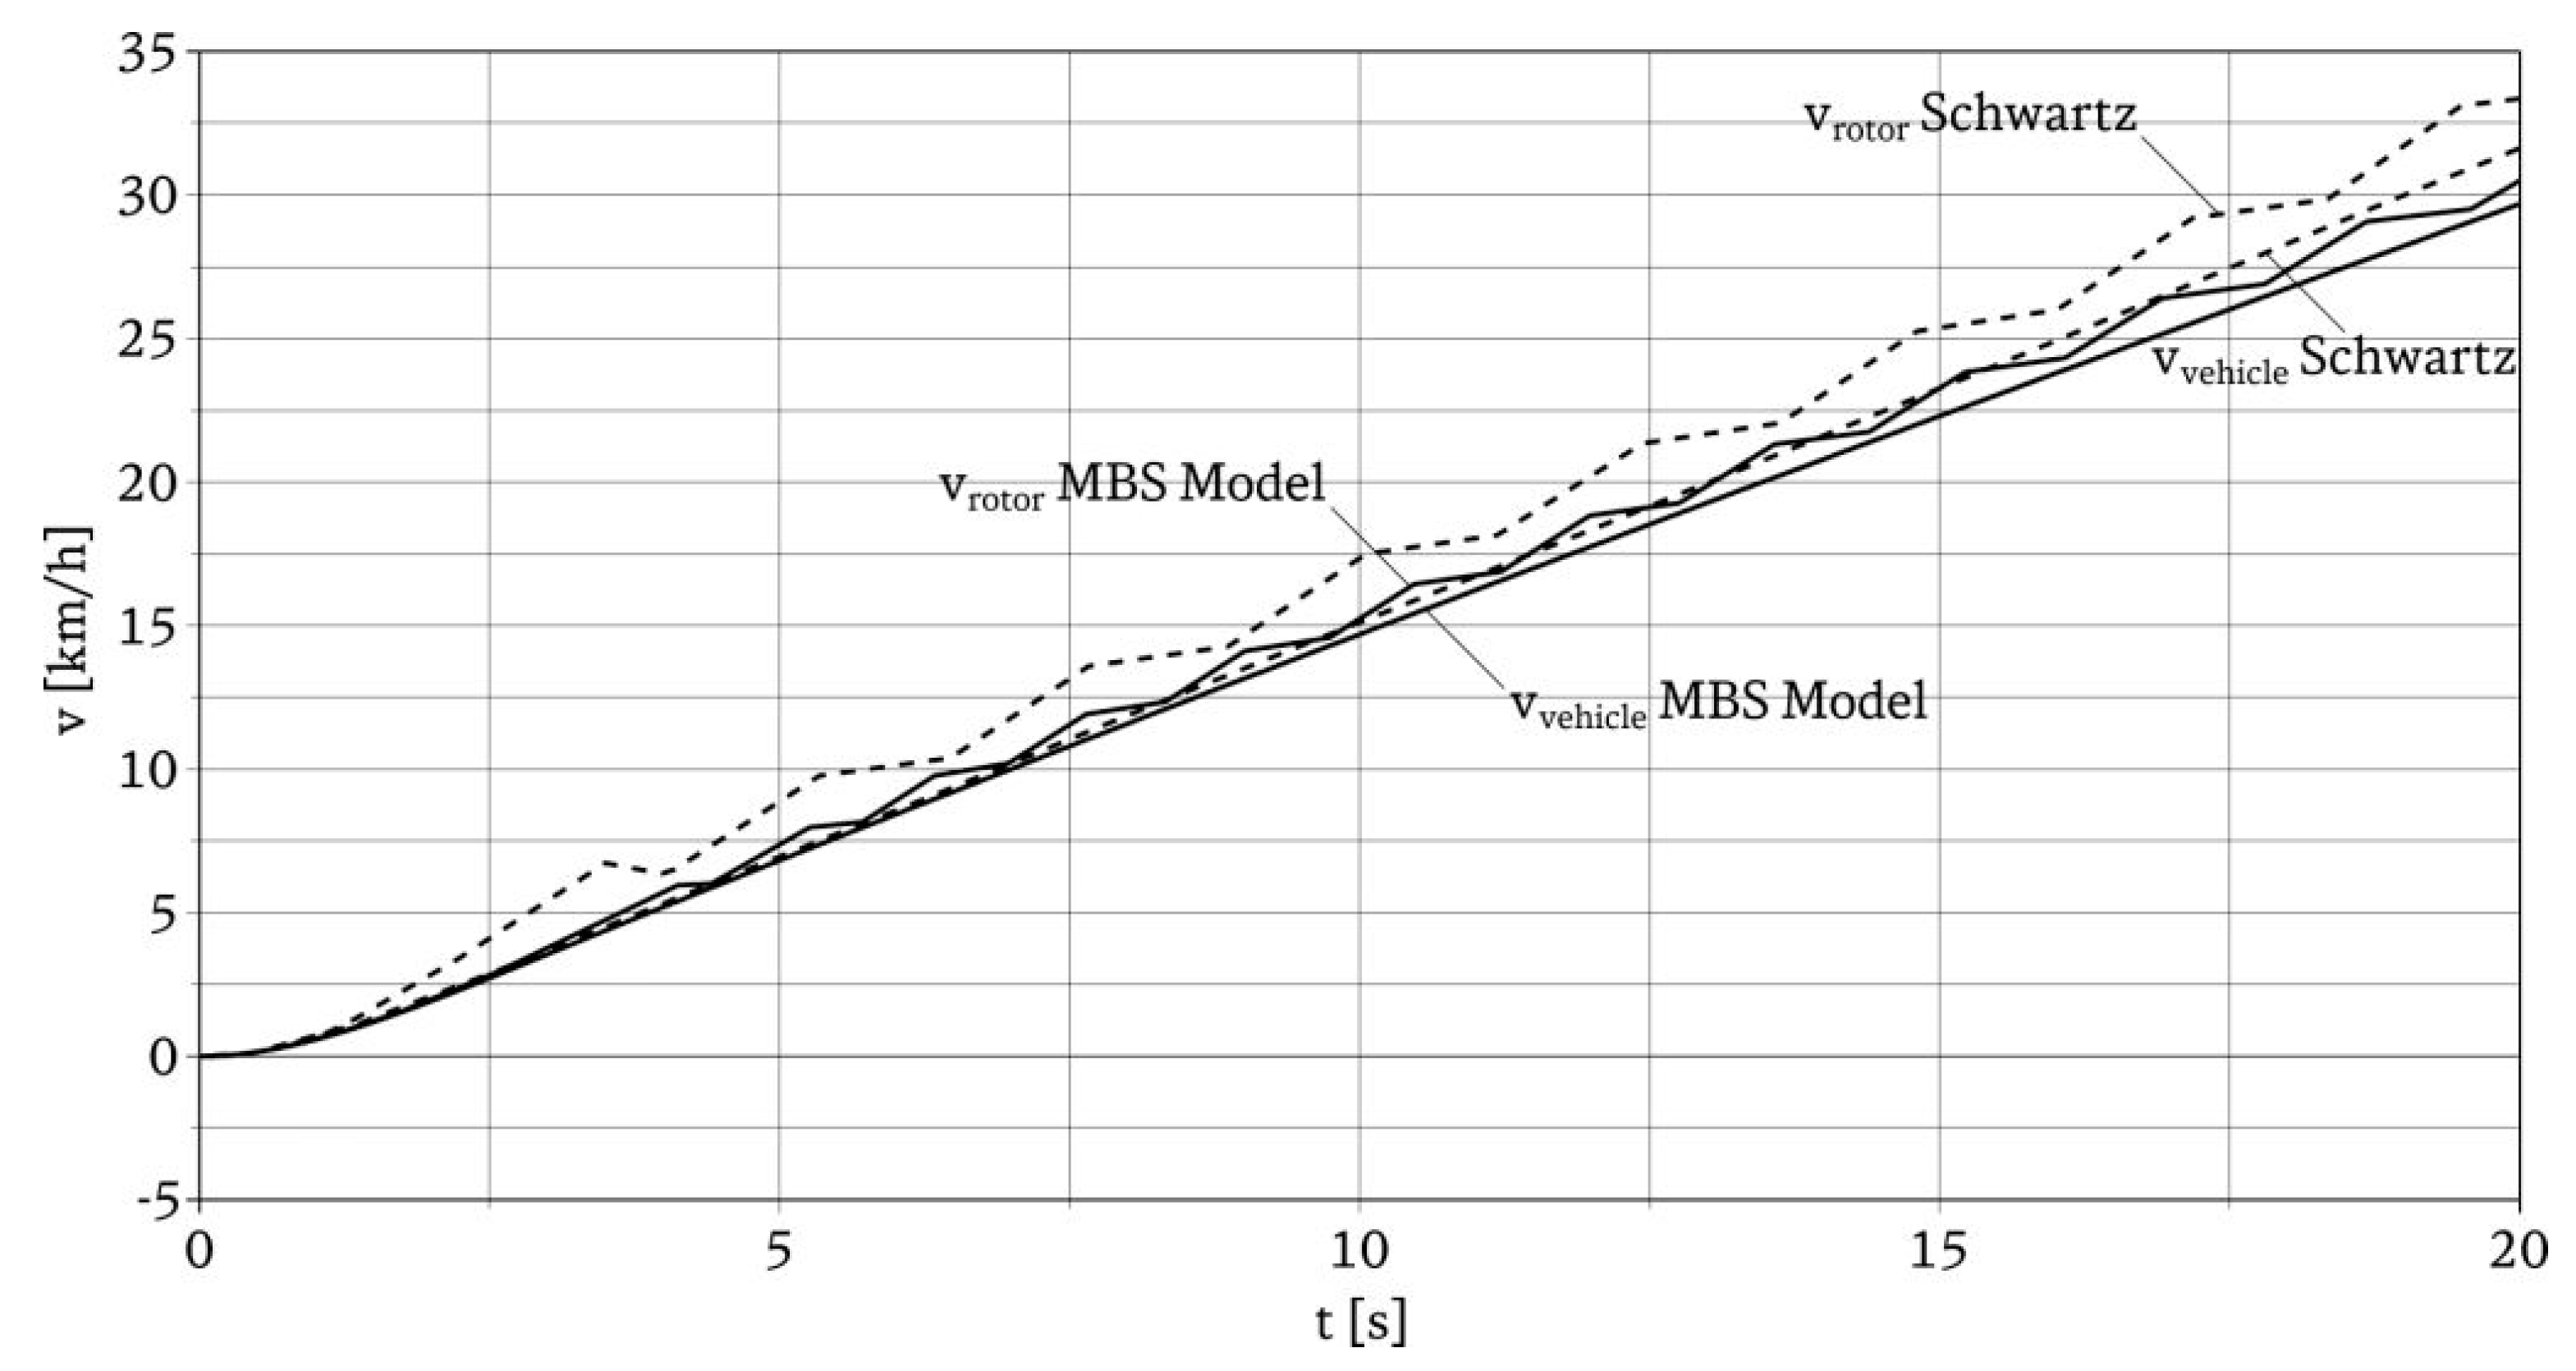
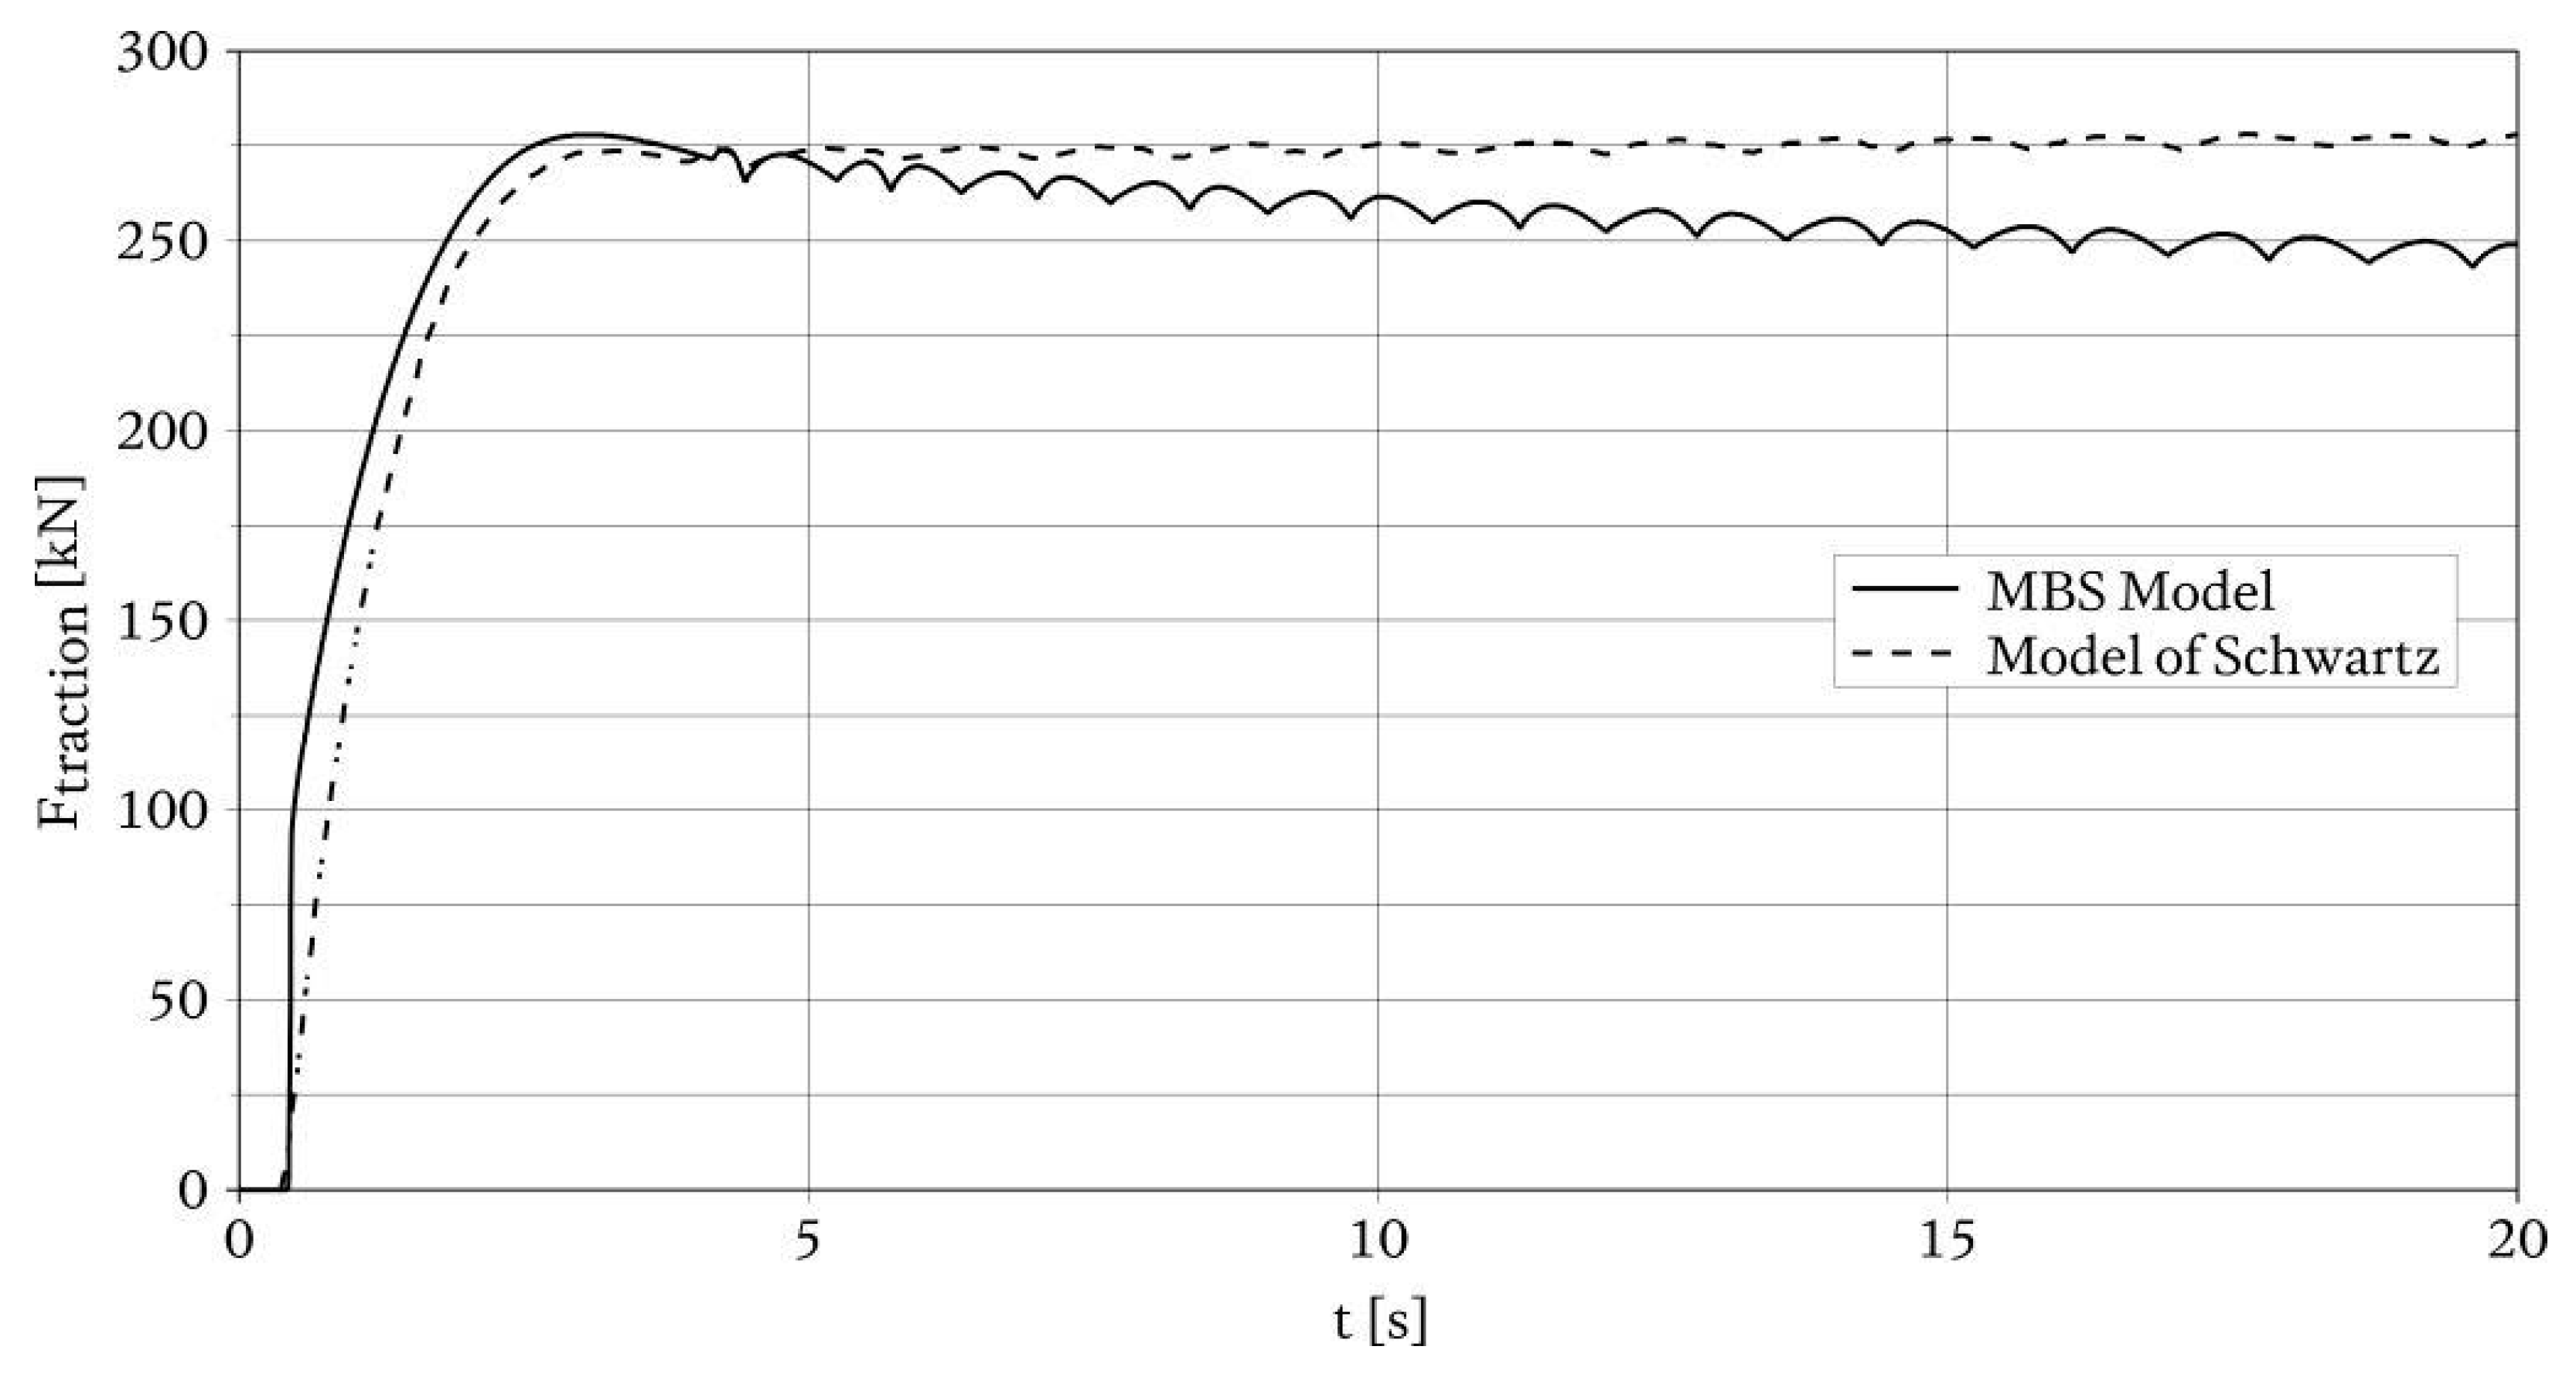
3.3. Verification of the Overall Model

For verification of the overall simulation model an acceleration process is simulated in the time domain. To enable comparison with the simulation results of Schwartz, the acceleration process is simulated according to Schwartz for a 500 ton passenger train starting from halt with full traction [18]. In [18] the passenger train reaches an overall vehicle velocity of 31 km/h after 20 s. Figure 10 proves that also, by the corresponding simulation with the model at hand, the 500 ton passenger train reaches almost 30 km/h after 20 s. This slight deviation of the overall vehicle velocities is founded in the different wheel-rail contact implementation of Schwartz and the model at hand. Still, the qualitative processes of rotor rotation speed and overall vehicle velocity are qualitatively showing accordance to Schwartz’s results [18]. Thus, the rotation speed of the rotor processes cascaded and slightly above the process of the overall vehicle velocity as shown by Figure 10.
The cascaded process of the rotor speed originates from the functionality of the slip control, which is triggering constantly passing through the adhesion maximum from smaller relative velocities to higher ones and vice versa. Figure 11 gives the process of the wheel-rail adhesion coefficient as a function of the relative velocity between wheel and rail. Here, the zig-zag-like process of the characteristic illustrates the operation around the adhesion maximum. Furthermore, the decrease of the adhesion maximum depends on the overall vehicle velocity. This decrease originates from the used wheel-rail contact implementation method, which is the method of Polach with its vehicle speed dependent wheel-rail adhesion characteristics depicted in Figure 9.
The decrease of the maximum wheel-rail adhesion coefficient in dependence of the overall vehicle velocity also involves a decrease in the transmissible traction forces on the rail. Therefore, also in Figure 12 the maximum transmitted tangential forces are decreasing over the simulation time with increasing overall vehicle velocity. The cascaded process of the tangential forces originates from the functionality of the slip control, again.
According to Schwartz, the maximum traction set value applied by the drive is given with 300 kN. The transmitted traction forces on the rail for the whole four axle locomotive are about 280 kN at most. These 280 kN are also documented as totally transmitted traction forces by Schwartz for the described simulation of an acceleration process of a 500 ton passenger train [18].
Deviations between the depicted simulation results of the model at hand and the model of Schwartz are solely originating from the different wheel-rail contact implementation. At this point, results of the MBS model are assumed to be more realistic than the results of Schwartz as the wheel-rail contact implementation is assumed to be more realistic.
Having presented the functionality of the model at hand in accordance to the partly validated model of Schwartz, in the following section, first investigations on torsional vibration are conducted by changing the wheel-rail adhesion conditions during the running simulation. Results of these investigations are presented in the next section.

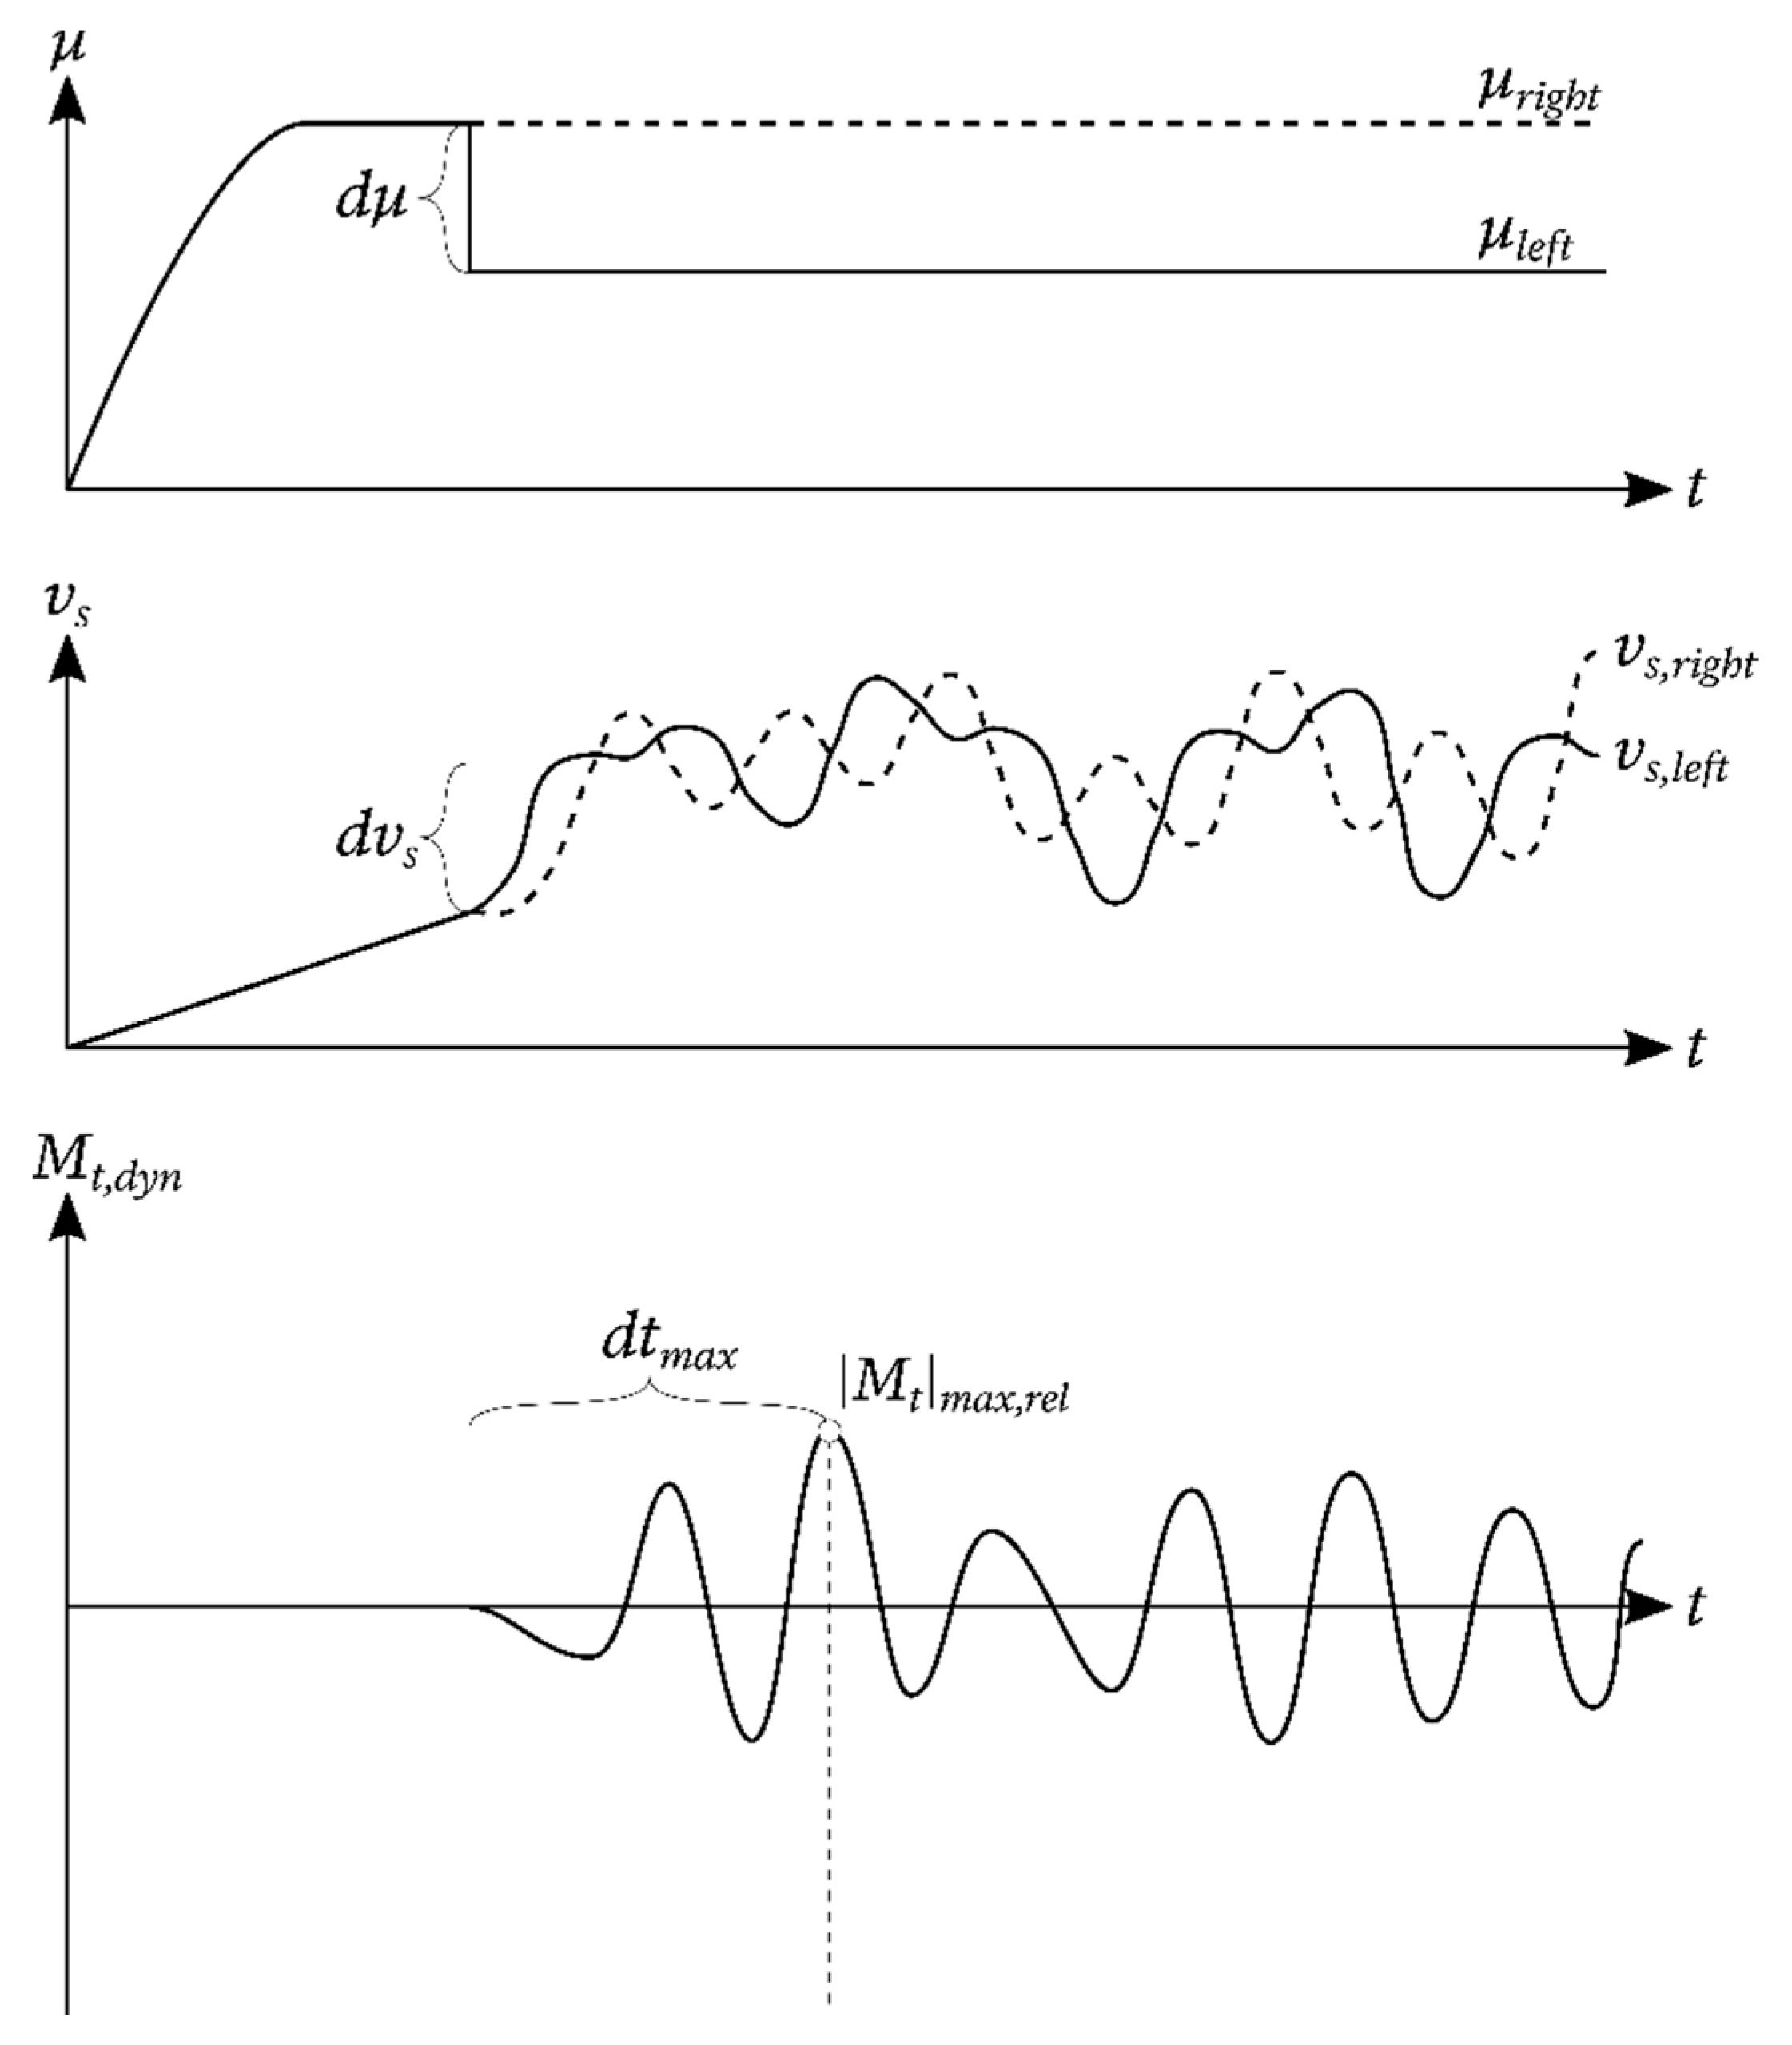
4. Results on Torsional Vibration

In the first investigations on torsional vibration the aim is to realistically remodel initiation conditions and by this qualitatively reproduce measurement results documented in [2]. In the named measurements it was found that torsional vibration swings up with a certain ratio of adhesion condition change and slippage change. Additionally, the swinging-up process was found to happen within a characteristic duration. In the named measurements torsional vibration was practically provoked by spraying water onto the rails in intervals. This way of changing the wheel-rail adhesion conditions is not special to the measurements documented in [2], it is generally used on torsional test rides. Typically, torsional vibration begins just by the time water spraying begins. Therefore, the start of water spraying is assumed as a unit step of the dynamic wheel-rail adhesion coefficient that describes the wheel-rail adhesion conditions. The found correlations of the swinging-up process of [2] are further assumed as the resulting step response. In simulations the unit step of the dynamic wheel-rail adhesion coefficient can be directly applied as shown by the top plot of Figure 13. To keep first investigations simple and prohibit superposition effects, only the dynamic wheel-rail adhesion coefficient of the indirectly driven wheelset wheel is changed. This change is applied in different simulations but always at the same time. In each simulation, the dynamic wheel-rail adhesion coefficient decrease is applied 5% higher, starting with a decrease of 5% and terminating with a decrease of 100%. According to the measurements of [2] the change of slippage dvs for every decrease of the dynamic wheel-rail adhesion coefficient is analyzed as shown in the middle plot of Figure 13. Furthermore, also the duration from the adhesion change to the first relative maximum of dynamic torque is analyzed as shown in the bottom plot of Figure 13.
In Figure 14 and Figure 15, the analysis results are plotted. Figure 14 shows the absolute change of the dynamic wheel-rail adhesion coefficient plotted against die change of slippage dvs, Figure 15 shows the dynamic torque value Mt of the first relative maximum plotted against the belonging swinging-up duration dtmax. Both plots show qualitative conformity with the dependencies of wheel-rail adhesion conditions and swinging-up of torsional vibration found in measurements [5]:
  • Figure 14 shows a similar linear dependency between the decrease of the dynamic wheel-rail adhesion coefficient and the change of slippage.
  • Figure 15 shows, that the swinging-up process of dynamic torque happens within a characteristic duration.
Besides this qualitatively conformity of the described simulations with the measurements documented in [5], the further process of dynamic torque is more complex than the process until it reaches its first relative maximum. As is also shown in Figure 13, the first relative maximum of dynamic torque is not necessarily its only and absolute maximum. Several relative maxima may follow, even with significantly higher oscillation amplitudes. Unfortunately, results of the presented first simulations do not allow investigating the absolute maximum of dynamic torque that results from a single drop of dynamic wheel-rail adhesion coefficient. A further, direct comparison of the simulation results presented in Figure 14 and Figure 15 with measurement data is not possible, as measurement torsional vibration measurement data of a class 120 locomotive is not available to the authors.

5. Conclusions

In this article, the set-up of a simulation tool to investigate the general physical conditions of the torsional vibration of railway wheelset axles is introduced. Wheel-rail adhesion conditions and dynamics of the mechanical drive train are modeled in the multibody simulation software Simpack. For estimation of the dynamic wheel-rail adhesion coefficient of the wheel-rail contact point the method of Polach is used. For simulation of the drive control, an openly documented drive control was set up with the software Simulink and embedded into the Simpack model via co-simulation. Similarly, it is possible to investigate the interaction of physical conditions in the wheel-rail contact point and drive control at various adhesion conditions.
Results on the simulations of the first set of adhesion conditions show qualitative accordance with measurement results. However, based on these first simulation results, conclusions on the maximum dynamic torque are not possible to be made. Additionally, performing test ride measurements is mandatory to validate the simulation model—especially for validation of the wheel-rail contact implementation.
With the simulation model fully validated, further research can be carried out on the possible superposition or reinforcement effects that finally lead to maximum dynamic torque, and thus to the highest torsional stresses of a wheelset axle. Furthermore, it shall be investigated, if the working point on the wheel-rail adhesion characteristic has an influence on the swinging-up process and maximum dynamic torque. When this influence turns out to be true, it shall be investigated if the drive control can help to indirectly prevent the swinging-up of the torsional vibration.

Author Contributions

F.T. and S.L. conducted the implementation and verification of the introduced simulation model. R.N. and C.S. supervised and reviewed the work. All authors have read and agreed to the published version of the manuscript.

Funding

This research received no external funding.

Data Availability Statement

No new research data were created or analyzed in this study. Presented diagrams show results generated in the verification process of the simulation model. These data are available on request.

Conflicts of Interest

The authors declare no conflict of interest.

References

  1. Eisenbahn-Bundesamt Bericht des Eisenbahn-Bundesamts—Berichtsjahr 2010: Gemäß Artikel 18 der Richtlinie Über Eisenbahnsicherheit in der Gemeinschaft (Richtlinie 2004/49/EG, Sicherheitsrichtlinie über die Tätigkeit als Sicherheitsbehörde). Available online: https://www.eba.bund.de/SharedDocs/Downloads/DE/Allgemeines/Sicherheitsberichte/sicherheitsbericht_2010.pdf?__blob=publicationFile&v=3 (accessed on 25 December 2020).
  2. Trimpe, F.; Salander, C. Wheel-rail adhesion during torsional vibration of driven railway wheelsets. Veh. Syst. Dyn. 2020, 2020, 1–15. [Google Scholar] [CrossRef]
  3. DIN Deutsches Institut für Normung e.V. DIN Taschenbuch 491/1—Schienenfahrzeuge 1—Radsätze; Beuth Verlag GmbH: Berlin, Germany, 2013. [Google Scholar]
  4. Friedrich, S.; Traupe, M. Dynamic Torsional Loads on Wheelsets—Recent Findings for the Assessment; DB Systemtechnik GmbH: Milan, Italy, 2014; Available online: http://esistc24.mecc.polimi.it/Milan_2014/Torsional_Loads.pdf (accessed on 25 December 2020).
  5. Saur, F.; Weber, J.; Schlecht, B. Selbsterregte Radsatz-Torsionsschwingungen von Schienenfahrzeugen mit Hoher Kraftschlussausnutzung, HTWG Sommerkolloquium. 2017. Available online: https://promotionskolleg.htwg-konstanz.de/wp-content/uploads/2017/07/Sommerkolloquium2017_FelixSaur.pdf (accessed on 25 December 2020).
  6. Trimpe, F.; Friedrich, S.; Traupe, M. Untersuchung der Gleitgeschwindigkeit während dynamischer Torsionsbelastungen von Radsatzwellen. In Proceedings of the 17 Internationale Schienenfahrzeugtagung, Dresden, Germany, 11 February 2020; pp. 61–63. [Google Scholar]
  7. Schneider, R. Rollierschwingungen von Radsätzen; Ein neuer integrierter und systematischer Ansatz. In Proceedings of the 13 Internationale Schienenfahrzeugtagung, Dresden, Germany, 26 February 2014; pp. 50–52. [Google Scholar]
  8. Weinhardt, M. Torsionsschwingung in Radsätzen—Fakten und Thesen zur Anregung durch den Rad/Schiene-Kraftschluss. In Proceedings of the 15 Internationale Schienenfahrzeugtagung, Dresden, Germany, 1–3 March 2017; pp. 49–51. [Google Scholar]
  9. Yu, M.; Breuer, W. Energy based approach to evaluate self oscillations of wheelsets caused by adhesion characteristics. ZEVrail 2018, 142, 164–172. [Google Scholar]
  10. Liu, J.; Zhao, H.; Zhai, W. Mechanism of self-excited torsional vibration of locomotive driving system. Front. Mech. Eng. China 2010, 5, 465–469. [Google Scholar] [CrossRef]
  11. Konowrocki, R.; Szolc, T. An Analysis of the Self-Excited Torsional Vibrations of the Electromechanical Drive System. Vib. Phys. Syst. 2016, 27, 187–194. [Google Scholar]
  12. Xu, K.; Zeng, J.; Wei, L. An analysis of the self-excited torsional vibration of high-speed train drive system. J. Mech. Sci. Technol. 2019, 33, 1149–1158. [Google Scholar] [CrossRef]
  13. Meierhofer, A.; Bernsteiner, C.; Müller, G.; Semrad, F.; Weber, F.-J.; Rosenberger, M.; Six, K. Prediction of Maximum Torsional Wheel-Set Axle Vibrations Considering Non-linear Adhesion Characteristics. In Proceedings of the IAVSD 2019: Advances in Dynamics of Vehicles on Roads and Tracks, Gothenburg, Sweden, 12–16 August 2019; pp. 970–976. [Google Scholar]
  14. Körner, E. Reibschwingungen Eines Elektrischen Triebfahrzeuges an der Haftwertgrenze. Ph.D. Thesis, Graz University of Technology, Graz, Austria, 1988. [Google Scholar]
  15. Polach, O. Creep forces in simulations of traction vehicles running on adhesion limit. Wear 2005, 258, 992–1000. [Google Scholar] [CrossRef]
  16. Polach, O. A Fast Wheel-Rail Forces Calculation Computer Code. Veh. Syst. Dyn. 1999, 33, 728–739. [Google Scholar] [CrossRef]
  17. Kalker, J.J. A Fast Algorithm for the Theory of Rolling Contact. Veh. Syst. Dyn. 1982, 11, 1–13. [Google Scholar] [CrossRef]
  18. Schwartz, H.J. Regelung der Radsatzdrehzahl zur Maximalen Kraftschlußausnutzung bei Elektrischen Triebfahrzeugen; VDI-Verlag GmbH: Düsseldorf, Germany, 1992. [Google Scholar]
  19. Dassault Systèmes Simulia Corp. Simpack 2021: Simulia User Assistance; Dassault Systèmes: Vélizy-Villacoublay Cedex, France, 2020. [Google Scholar]
  20. Sachs, K. Elektrische Triebfahrzeuge; Kommissionsverlag Huber & Co: Frauenfeld, Switzerland, 1953. [Google Scholar]
  21. Filipovic, Z. Elektrische Bahnen, Grundlagen, Triebfahrzeuge, Stromversorgung; Springer: Berlin/Heidelberg, Germany, 2015. [Google Scholar]
  22. Buscher, M. Radschlupfregelung zur Maximalen Kraftschlussausnutzung bei Elektrischen Traktionsantrieben; Verlag Shaker: Aachen, Germany, 1995. [Google Scholar]
Figure 1. Overview of the model’s substructures.
Vibration 04 00003 g001
Figure 2. Assembly of the hollow shaft drive train of the German class 120 locomotive.
Vibration 04 00003 g002
Figure 3. Graphical visualization of the MBS drive train model.
Vibration 04 00003 g003
Figure 4. Schematic depiction of the mechanical characteristics of the MBS drive train model setup.
Vibration 04 00003 g004
Figure 5. Schematic wheel-rail adhesion characteristics of the FASTSIM algorithm of Kalker and the method of Polach.
Vibration 04 00003 g005
Figure 6. Block diagram of the implemented slip control of Schwartz [18].
Vibration 04 00003 g006
Figure 7. Levitating mechanical drive train model as it is used for modal analysis in the MBS environment.
Vibration 04 00003 g007
Figure 8. Standardized oscillation amplitudes of the mechanical drive train components for the third eigenmode with the eigenfrequency f 3 = 50.76   Hz .
Vibration 04 00003 g008
Figure 9. Illustration of the wheel-rail adhesion characteristics of the model of Schwartz [18] and of the MBS model at hand at overall vehicle velocities of 10, 20, 36 and 200 km/h.
Vibration 04 00003 g009
Figure 10. Process of rotor and overall vehicle speed as a function of simulated time. The rotor rotation speeds are converted into a translative velocity by considering gear ratio and wheel radius.
Vibration 04 00003 g010
Figure 11. Process of wheel-rail adhesion coefficient as function of the relative velocity between wheel and rail.
Vibration 04 00003 g011
Figure 12. Transmitted tangential forces in the wheel-rail contact as a function of simulated time.
Vibration 04 00003 g012
Figure 13. Schematic process of wheel-rail adhesion coefficient, slippage and dynamic torque, when adhesion conditions of the left wheel change instantly.
Vibration 04 00003 g013
Figure 14. Change of wheel-rail adhesion coefficient plotted against the initiated change of slippage.
Vibration 04 00003 g014
Figure 15. Dynamic torque plotted against the swinging-up duration of the first occurring, relative maximum of dynamic torque.
Vibration 04 00003 g015
Table 1. Numerical values for torsional stiffnesses and torsional damping rates of rotating masses given by Schwartz [18].
Mechanical Drive Train PartTorsional StiffnessTorsional Damping Rate
Motor Shaft88.12 × 106 Nm920.30 Nm s
Coupling (Gear Side)15.10 × 10⁶ Nm4730.80 Nm s
Hollow Shaft10.10 × 106 Nm105.50 Nm s
Coupling (Wheel Side)15.70 × 10⁶ Nm11,731.40 Nm s
Wheelset Axle7.06 × 106 Nm73.70 Nm s
Table 2. Numerical values used for the slip control.
ParameterNumerical Value
Δ a 0.275   m s 2
Δ M 100 Nm
k P 13.3 kNm s
Table 3. Comparison of the eigenfrequencies of Schwartz’s model [18] and the multibody simulation (MBS) model.
ifi [Hz]
SchwartzMBS
100
221.321.28
350.850.76
4181.8181.77
5238.3238.28
6307.2307.24
Publisher’s Note: MDPI stays neutral with regard to jurisdictional claims in published maps and institutional affiliations.

