Observed Trends of Climate and River Discharge in Mongolia’s Selenga Sub-Basin of the Lake Baikal Basin

 ,
, 
 ,
,  , , , and
Abstract
:1. Introduction
2. Materials and Methods
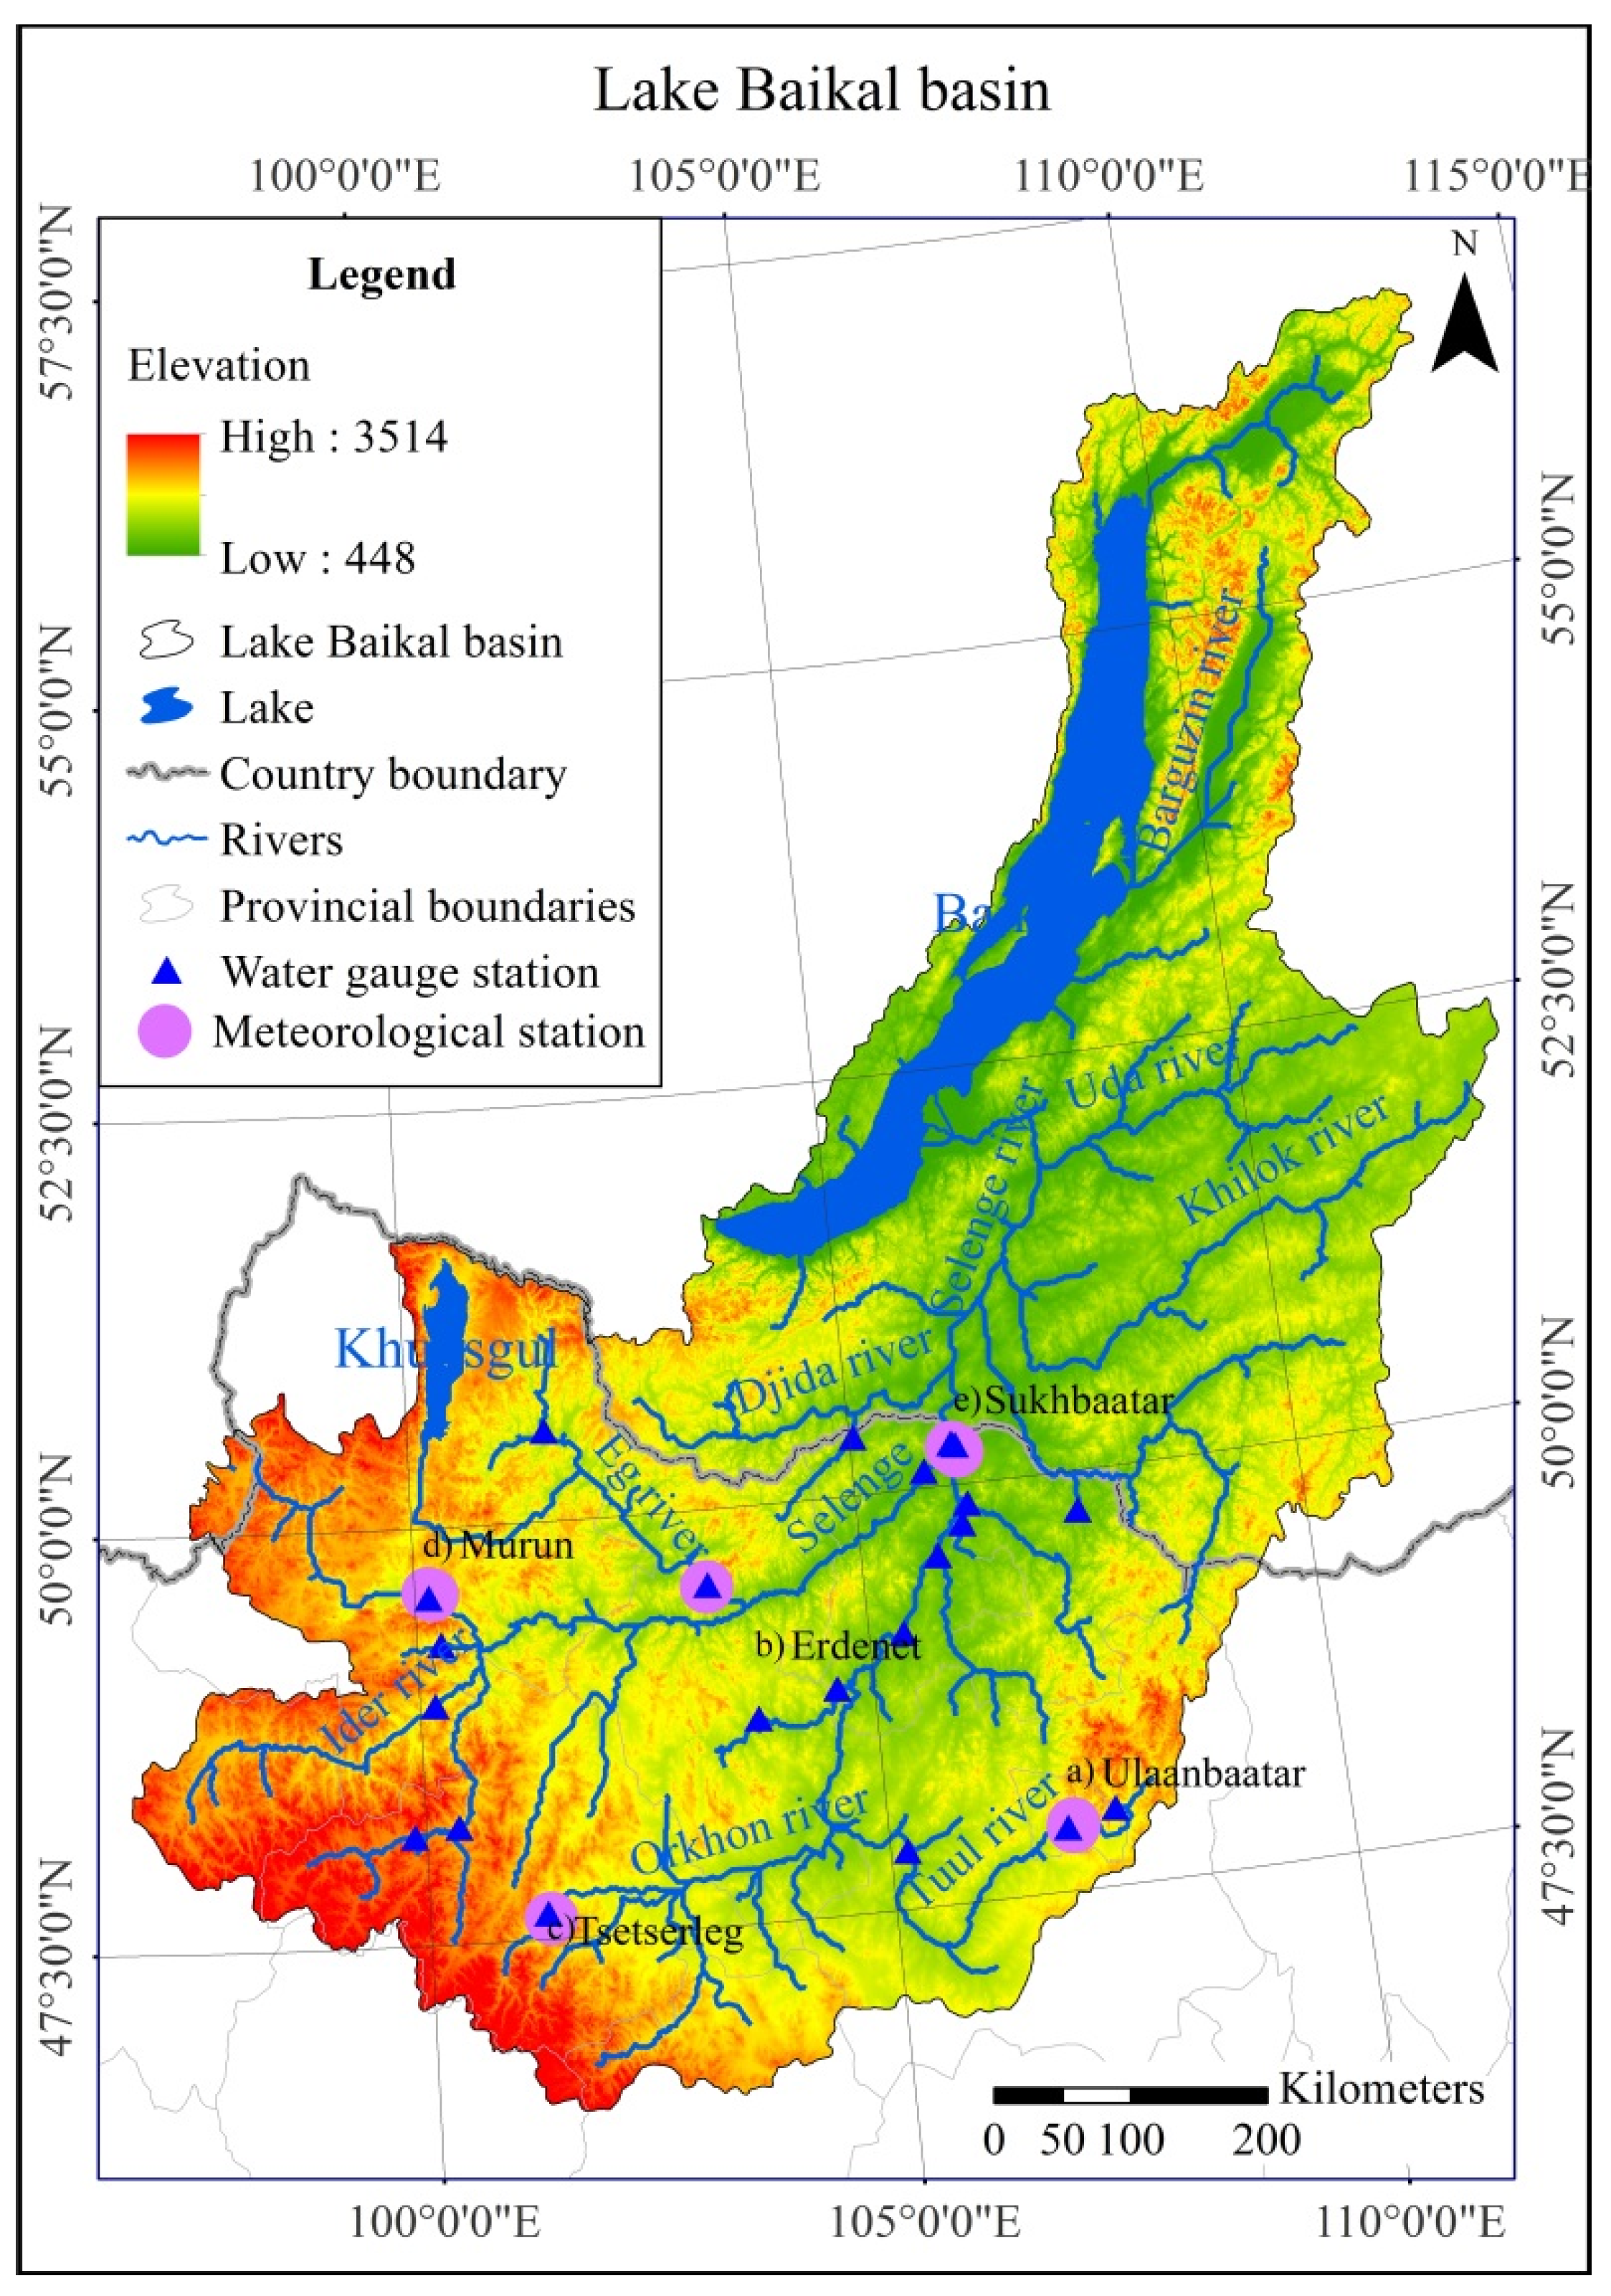
2.1. Study Area
2.2. Data Sources
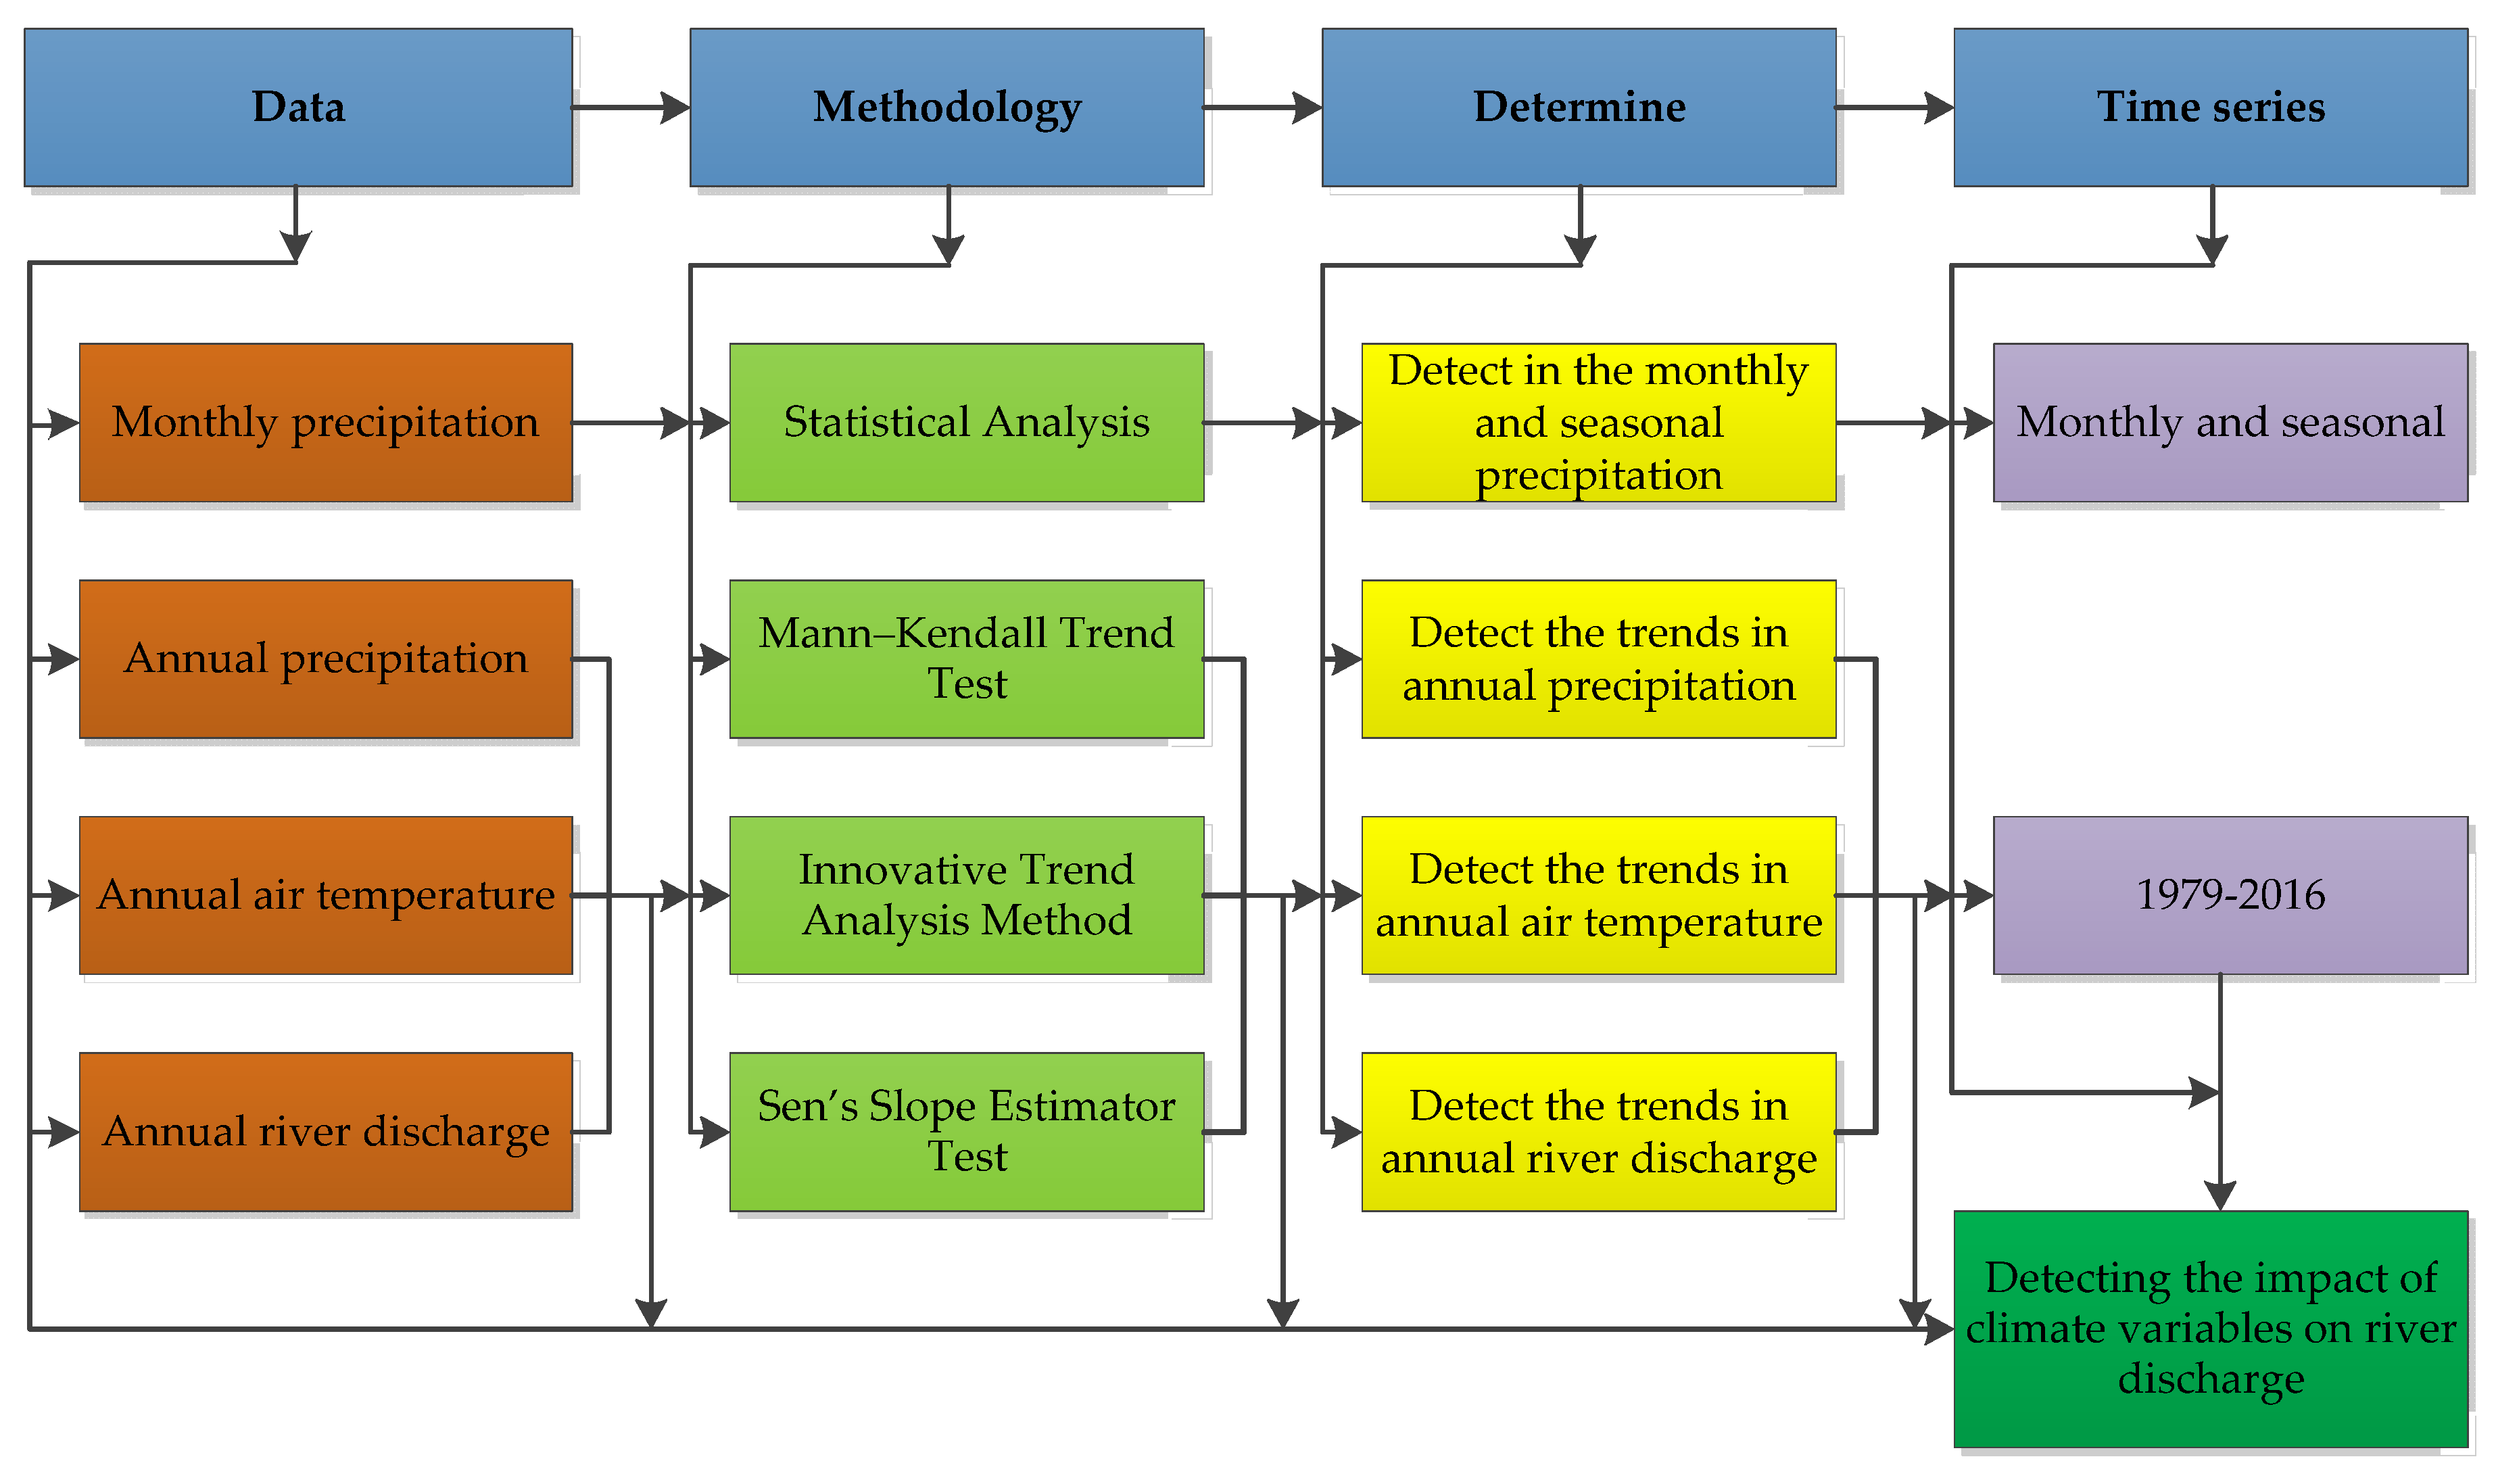
2.3. Methods
2.3.1. Mann-Kendall Trend Test
2.3.2. Innovative Trend Analysis Method (ITAM)
2.3.3. Sen’s Slope Estimator Test
3. Results
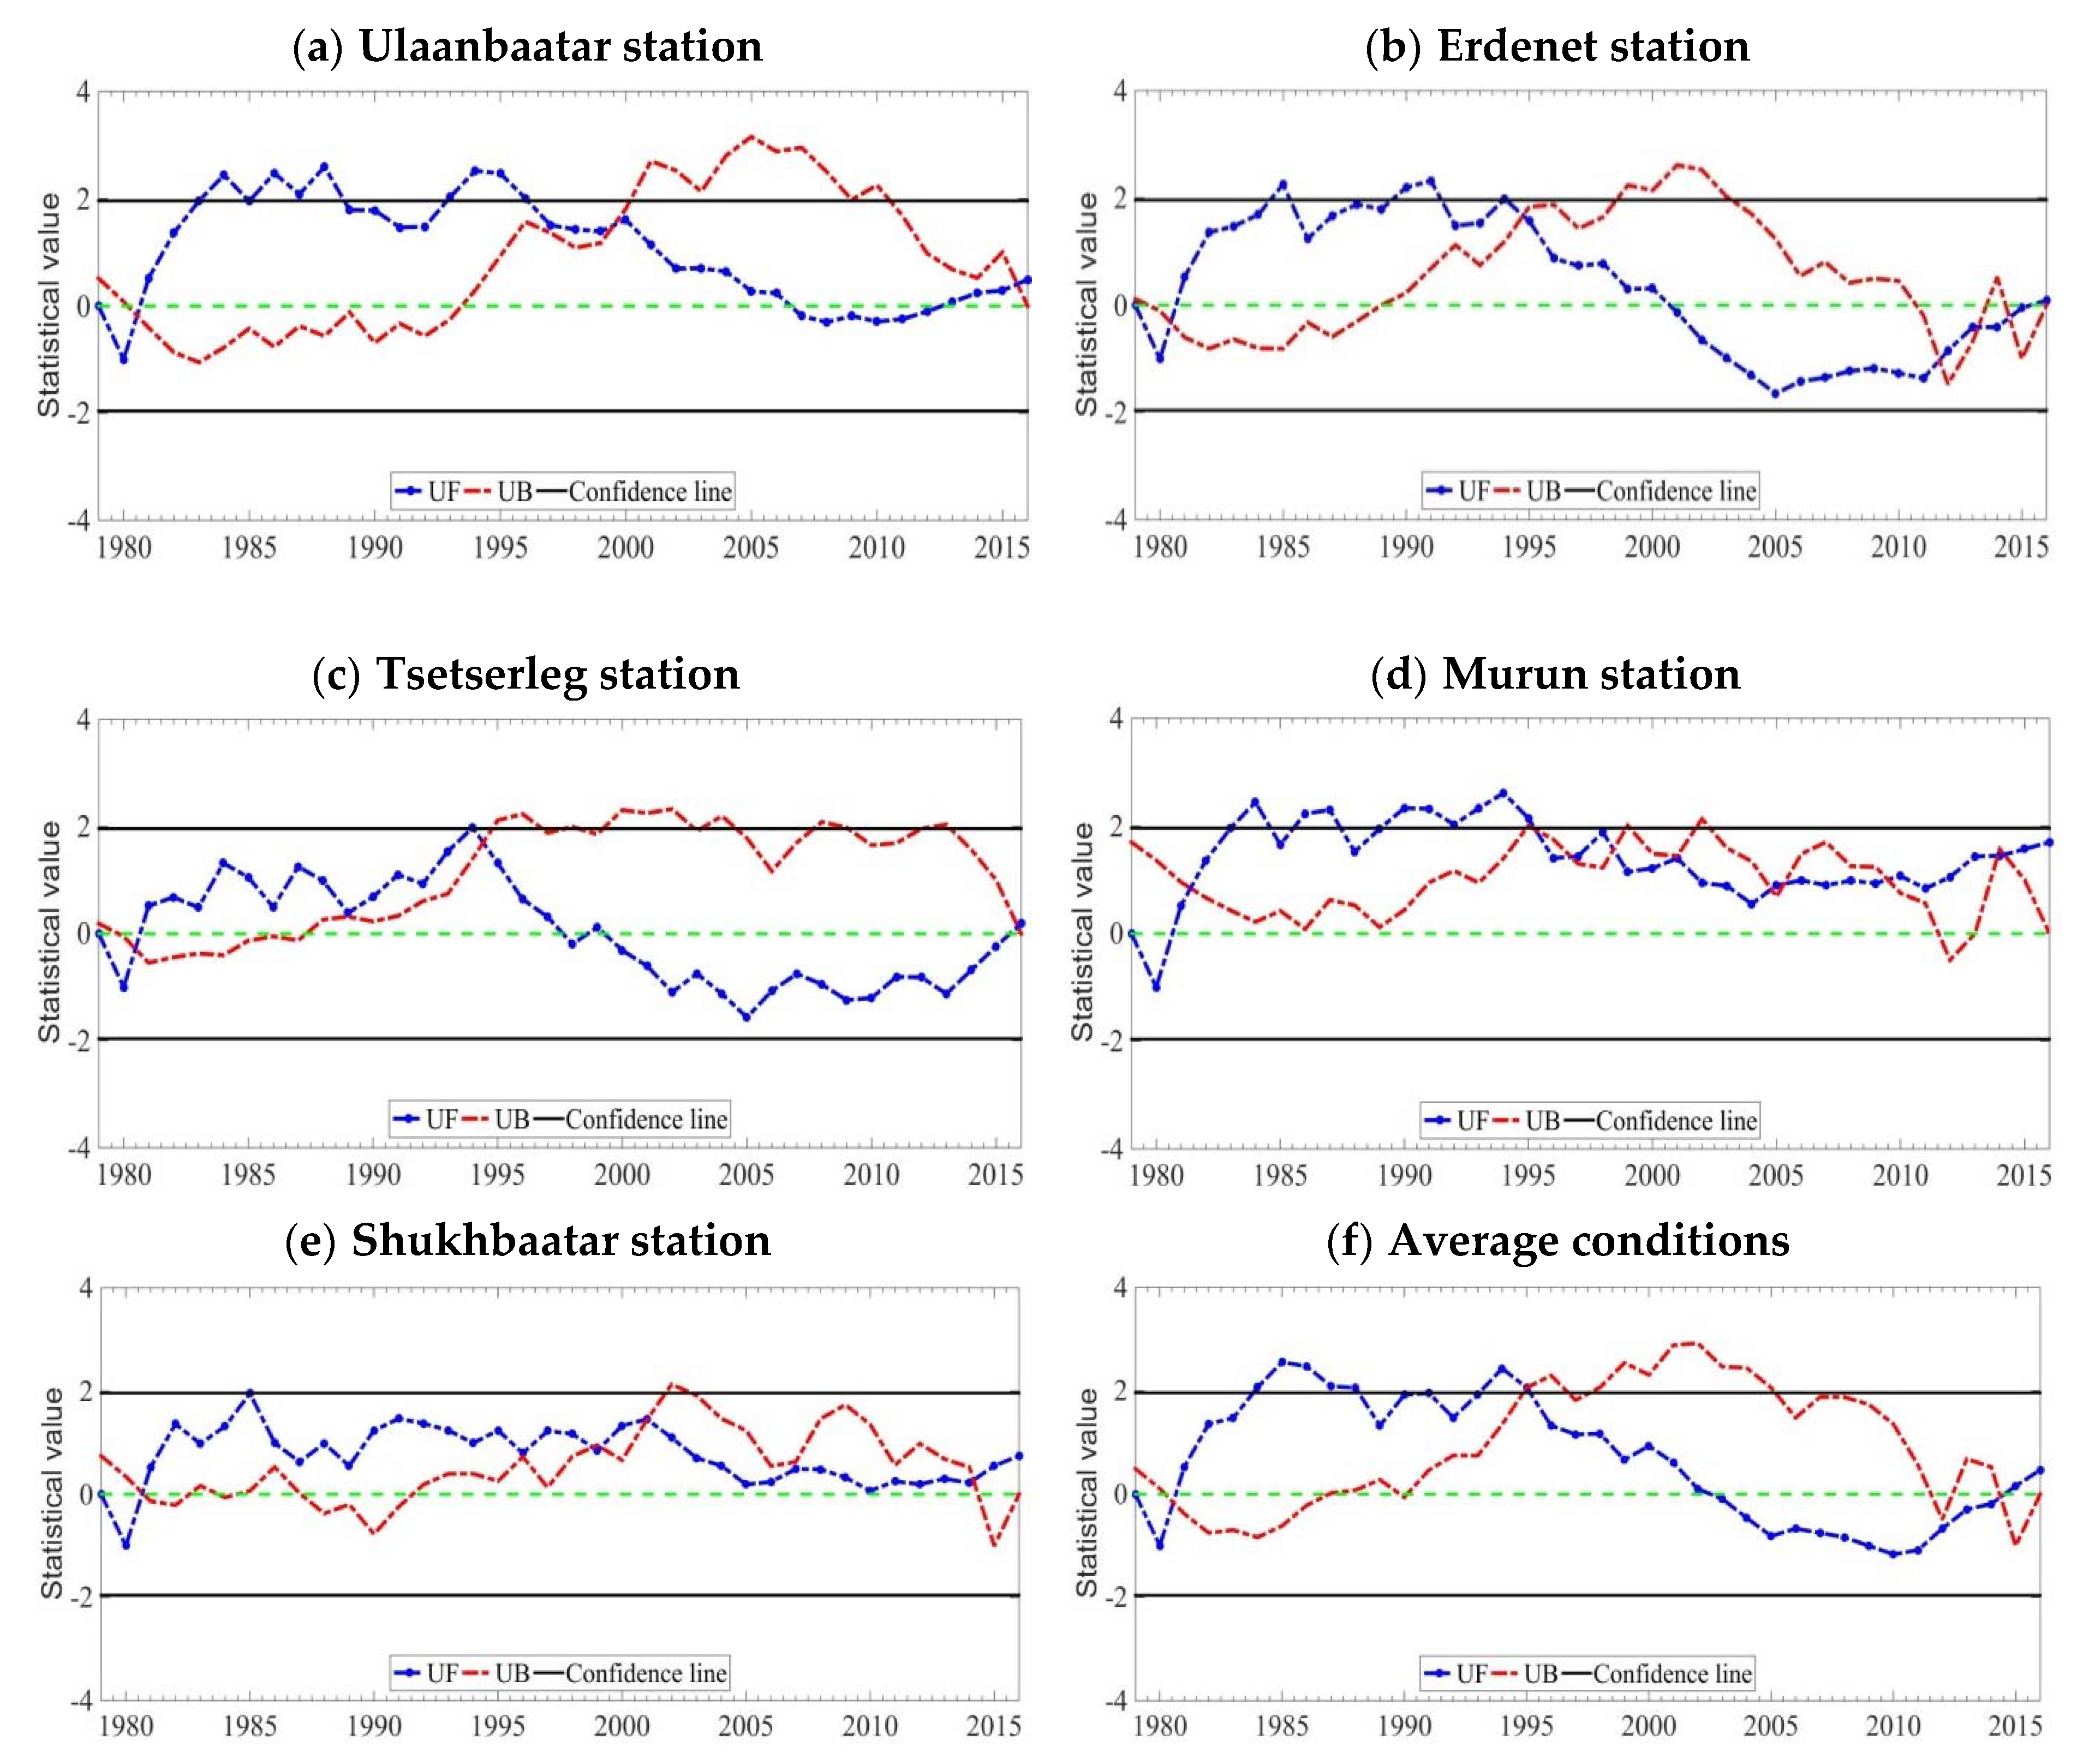
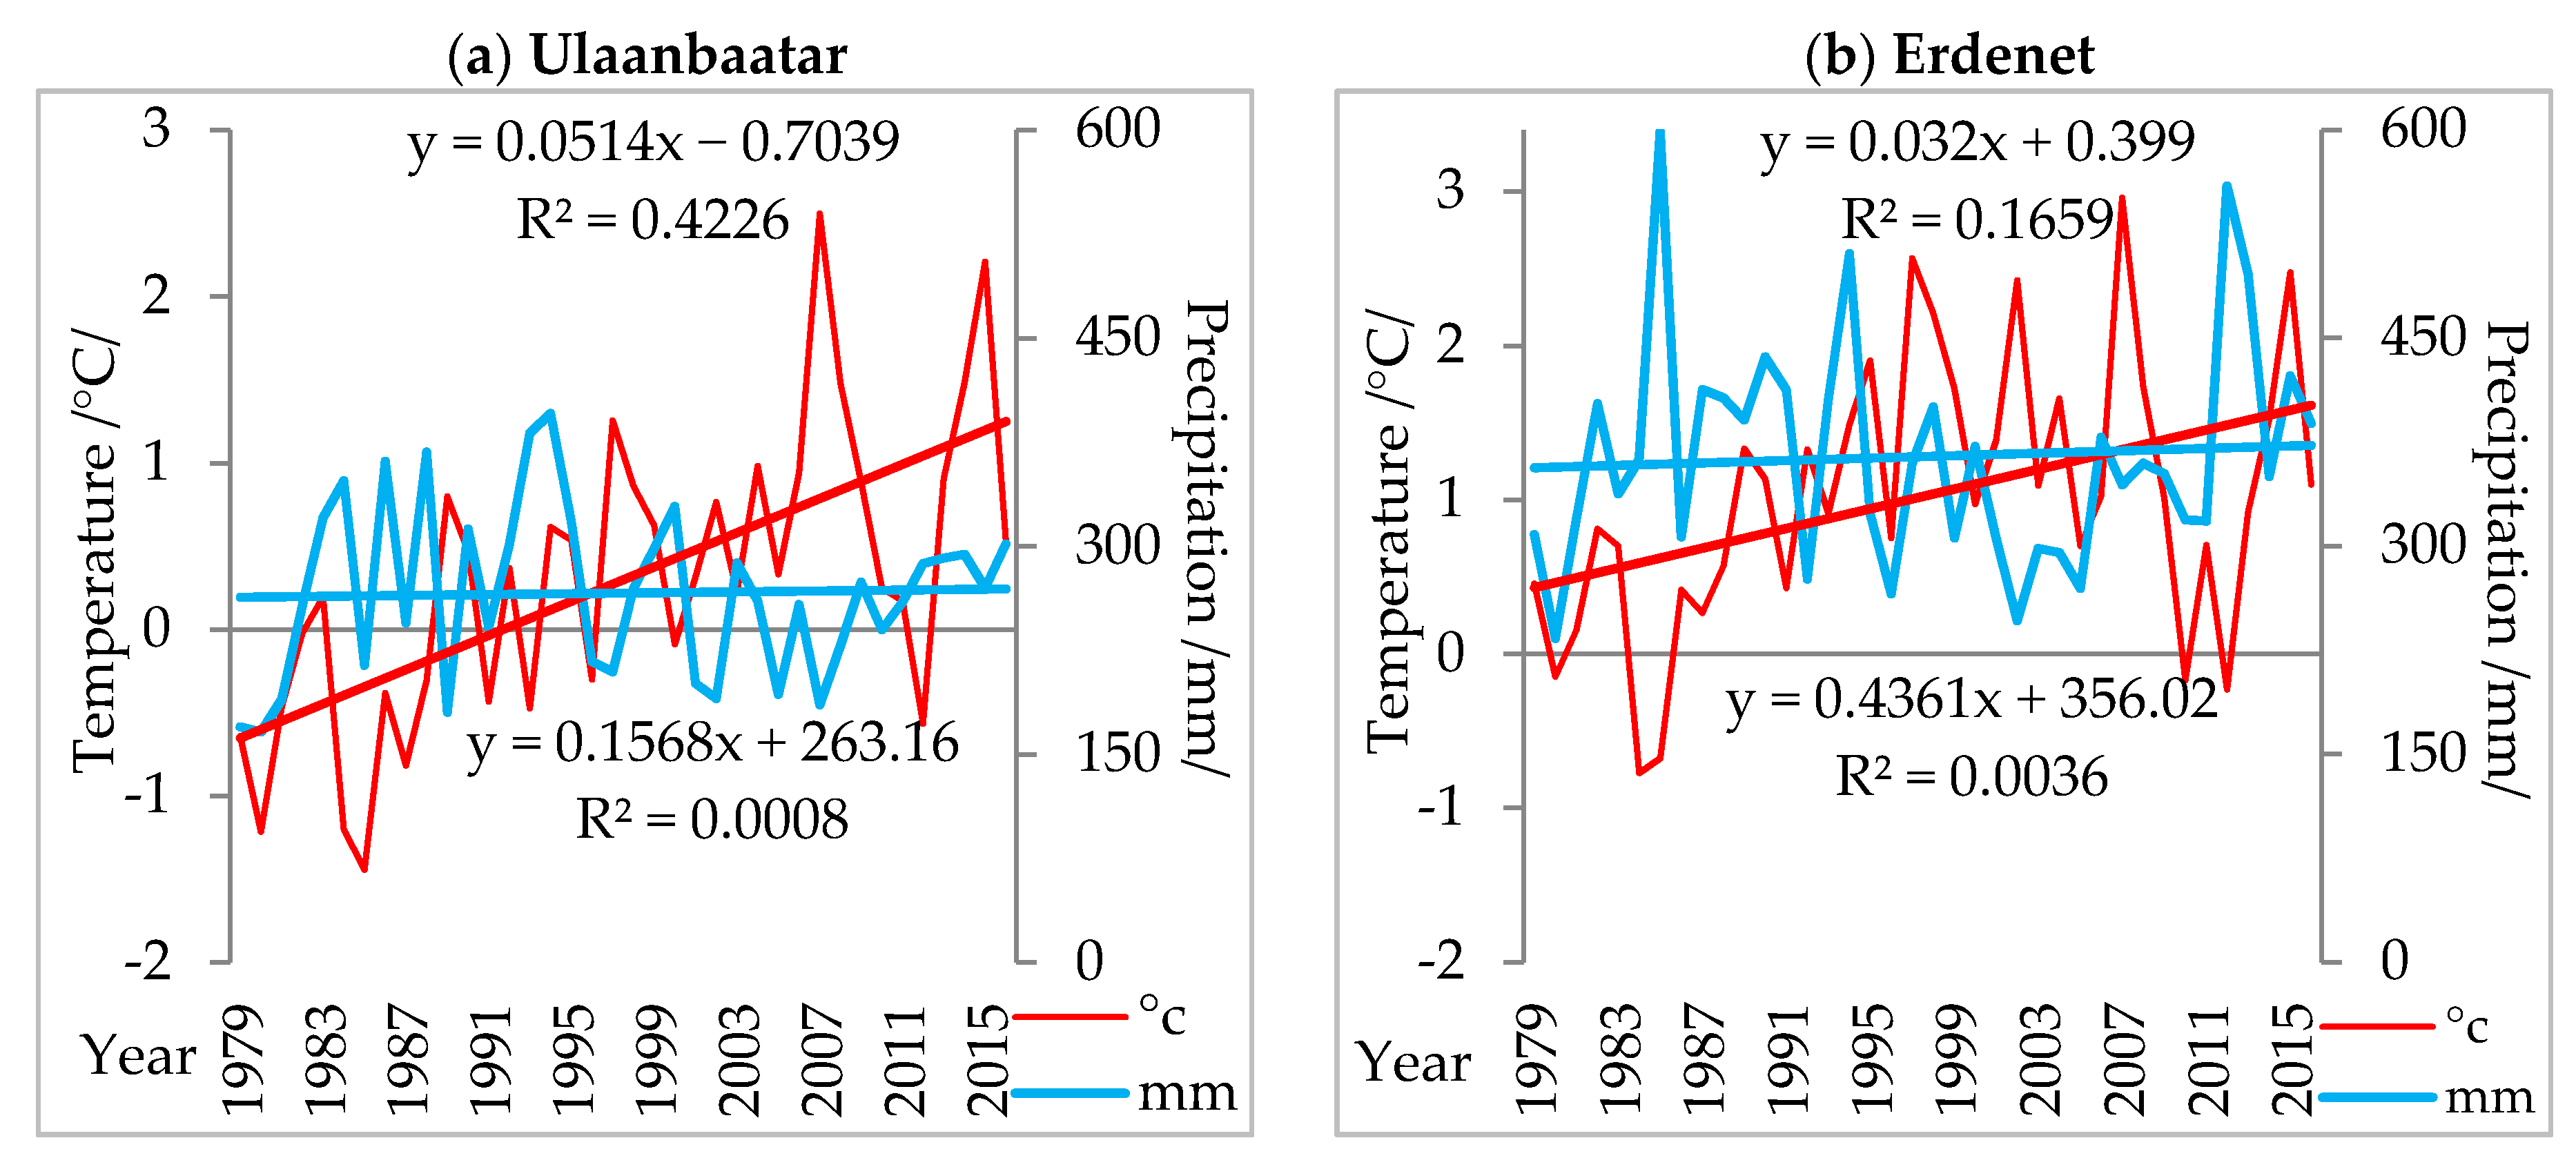
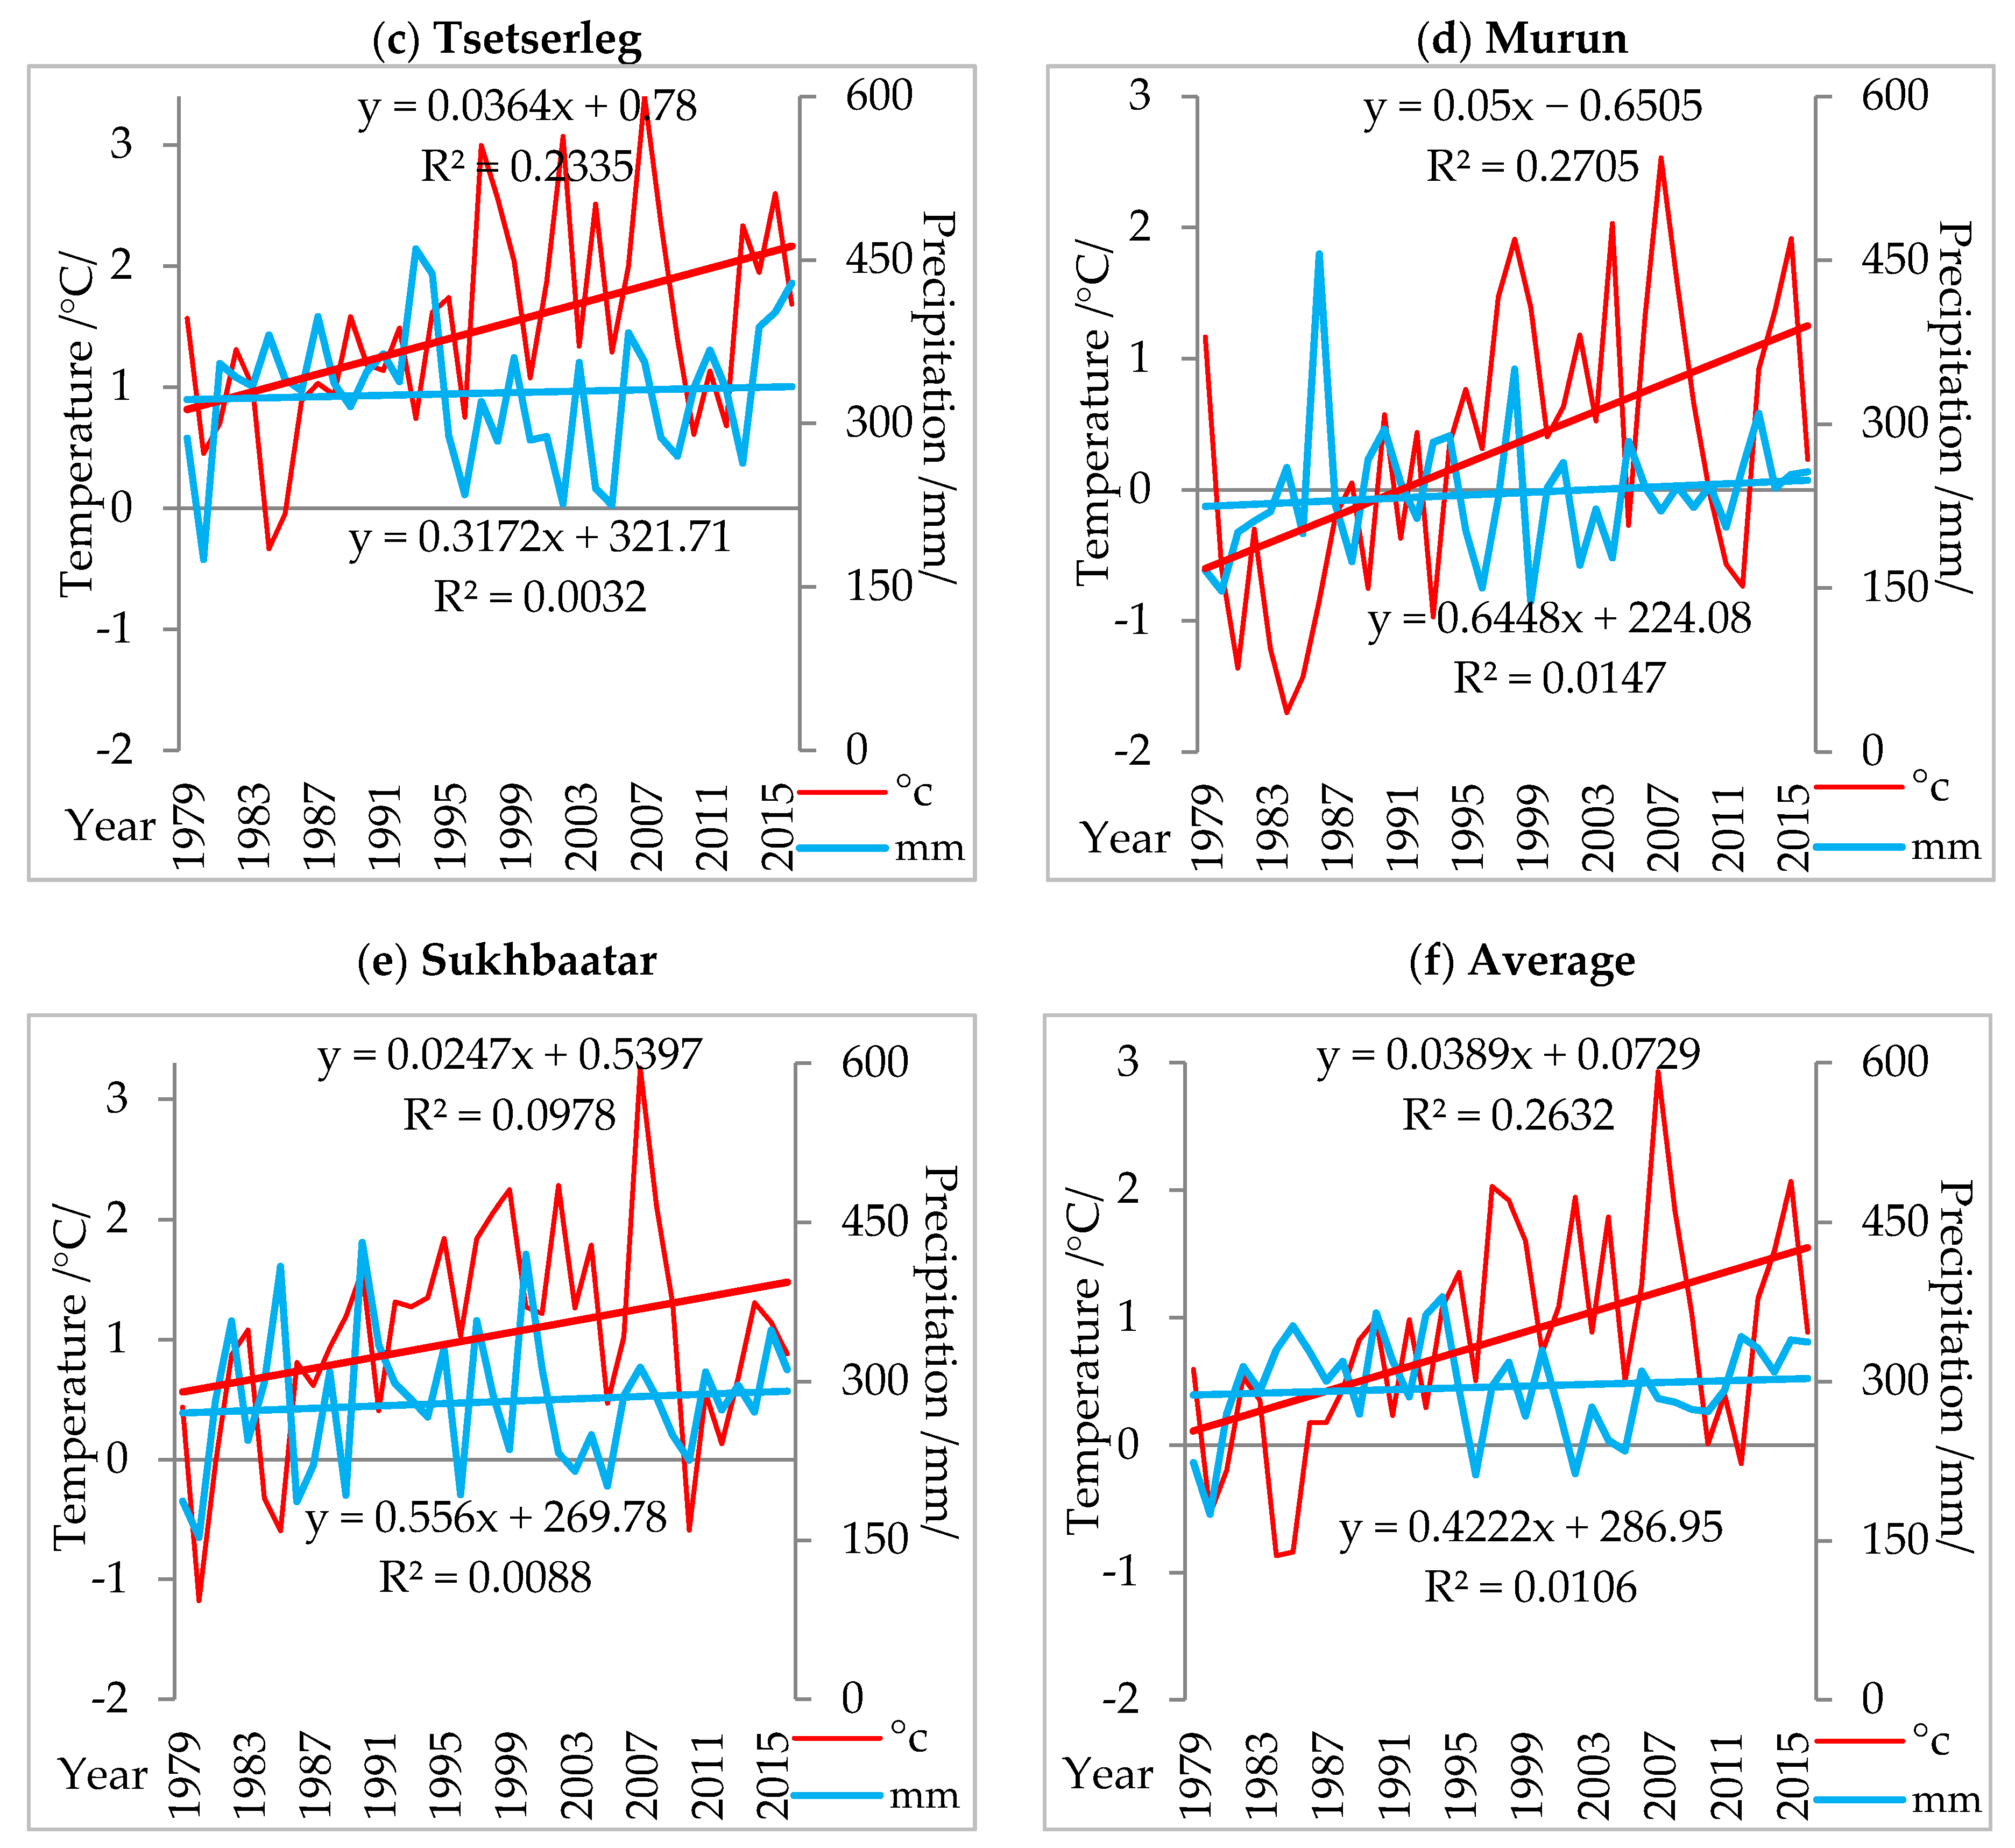
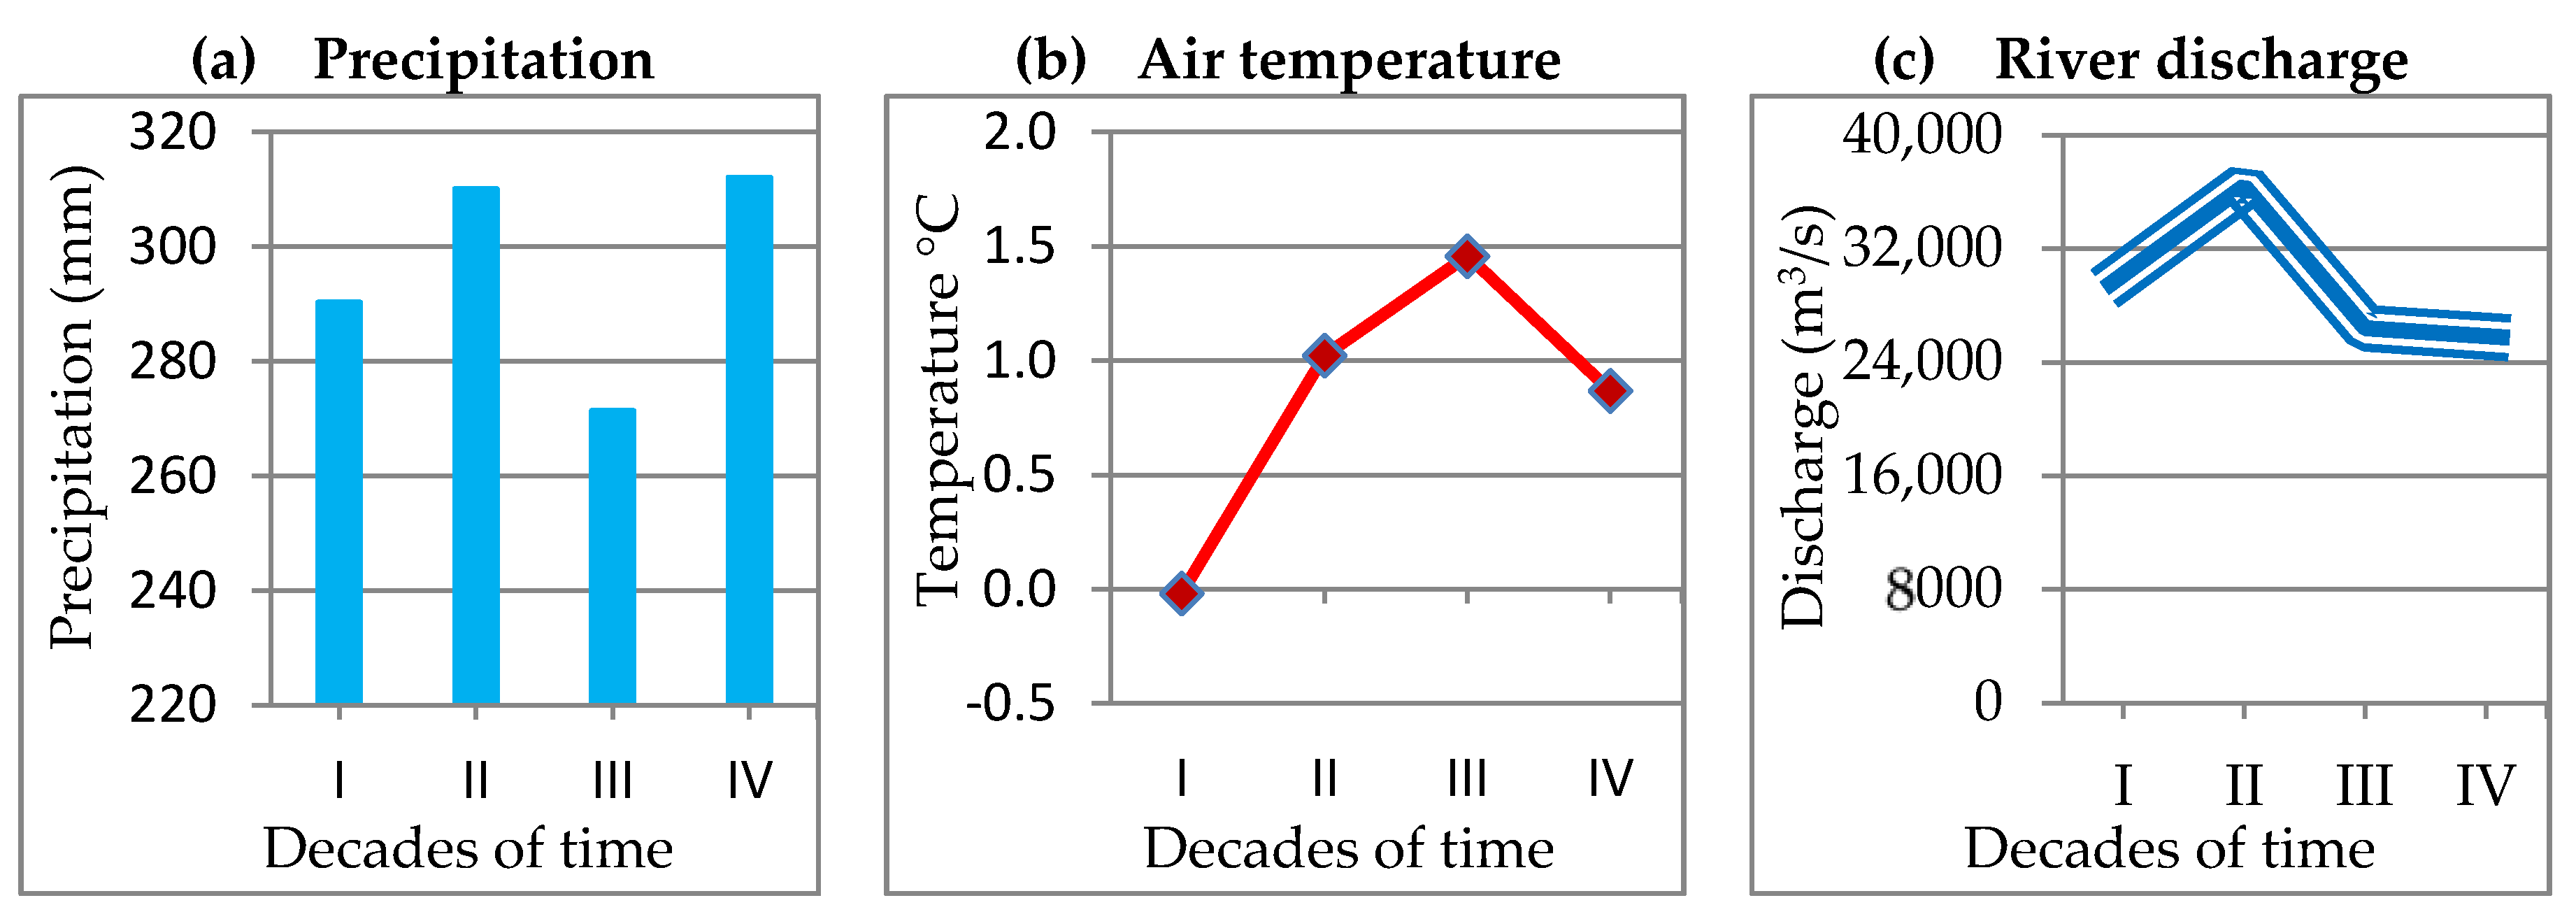
3.1. Analysis of Precipitation
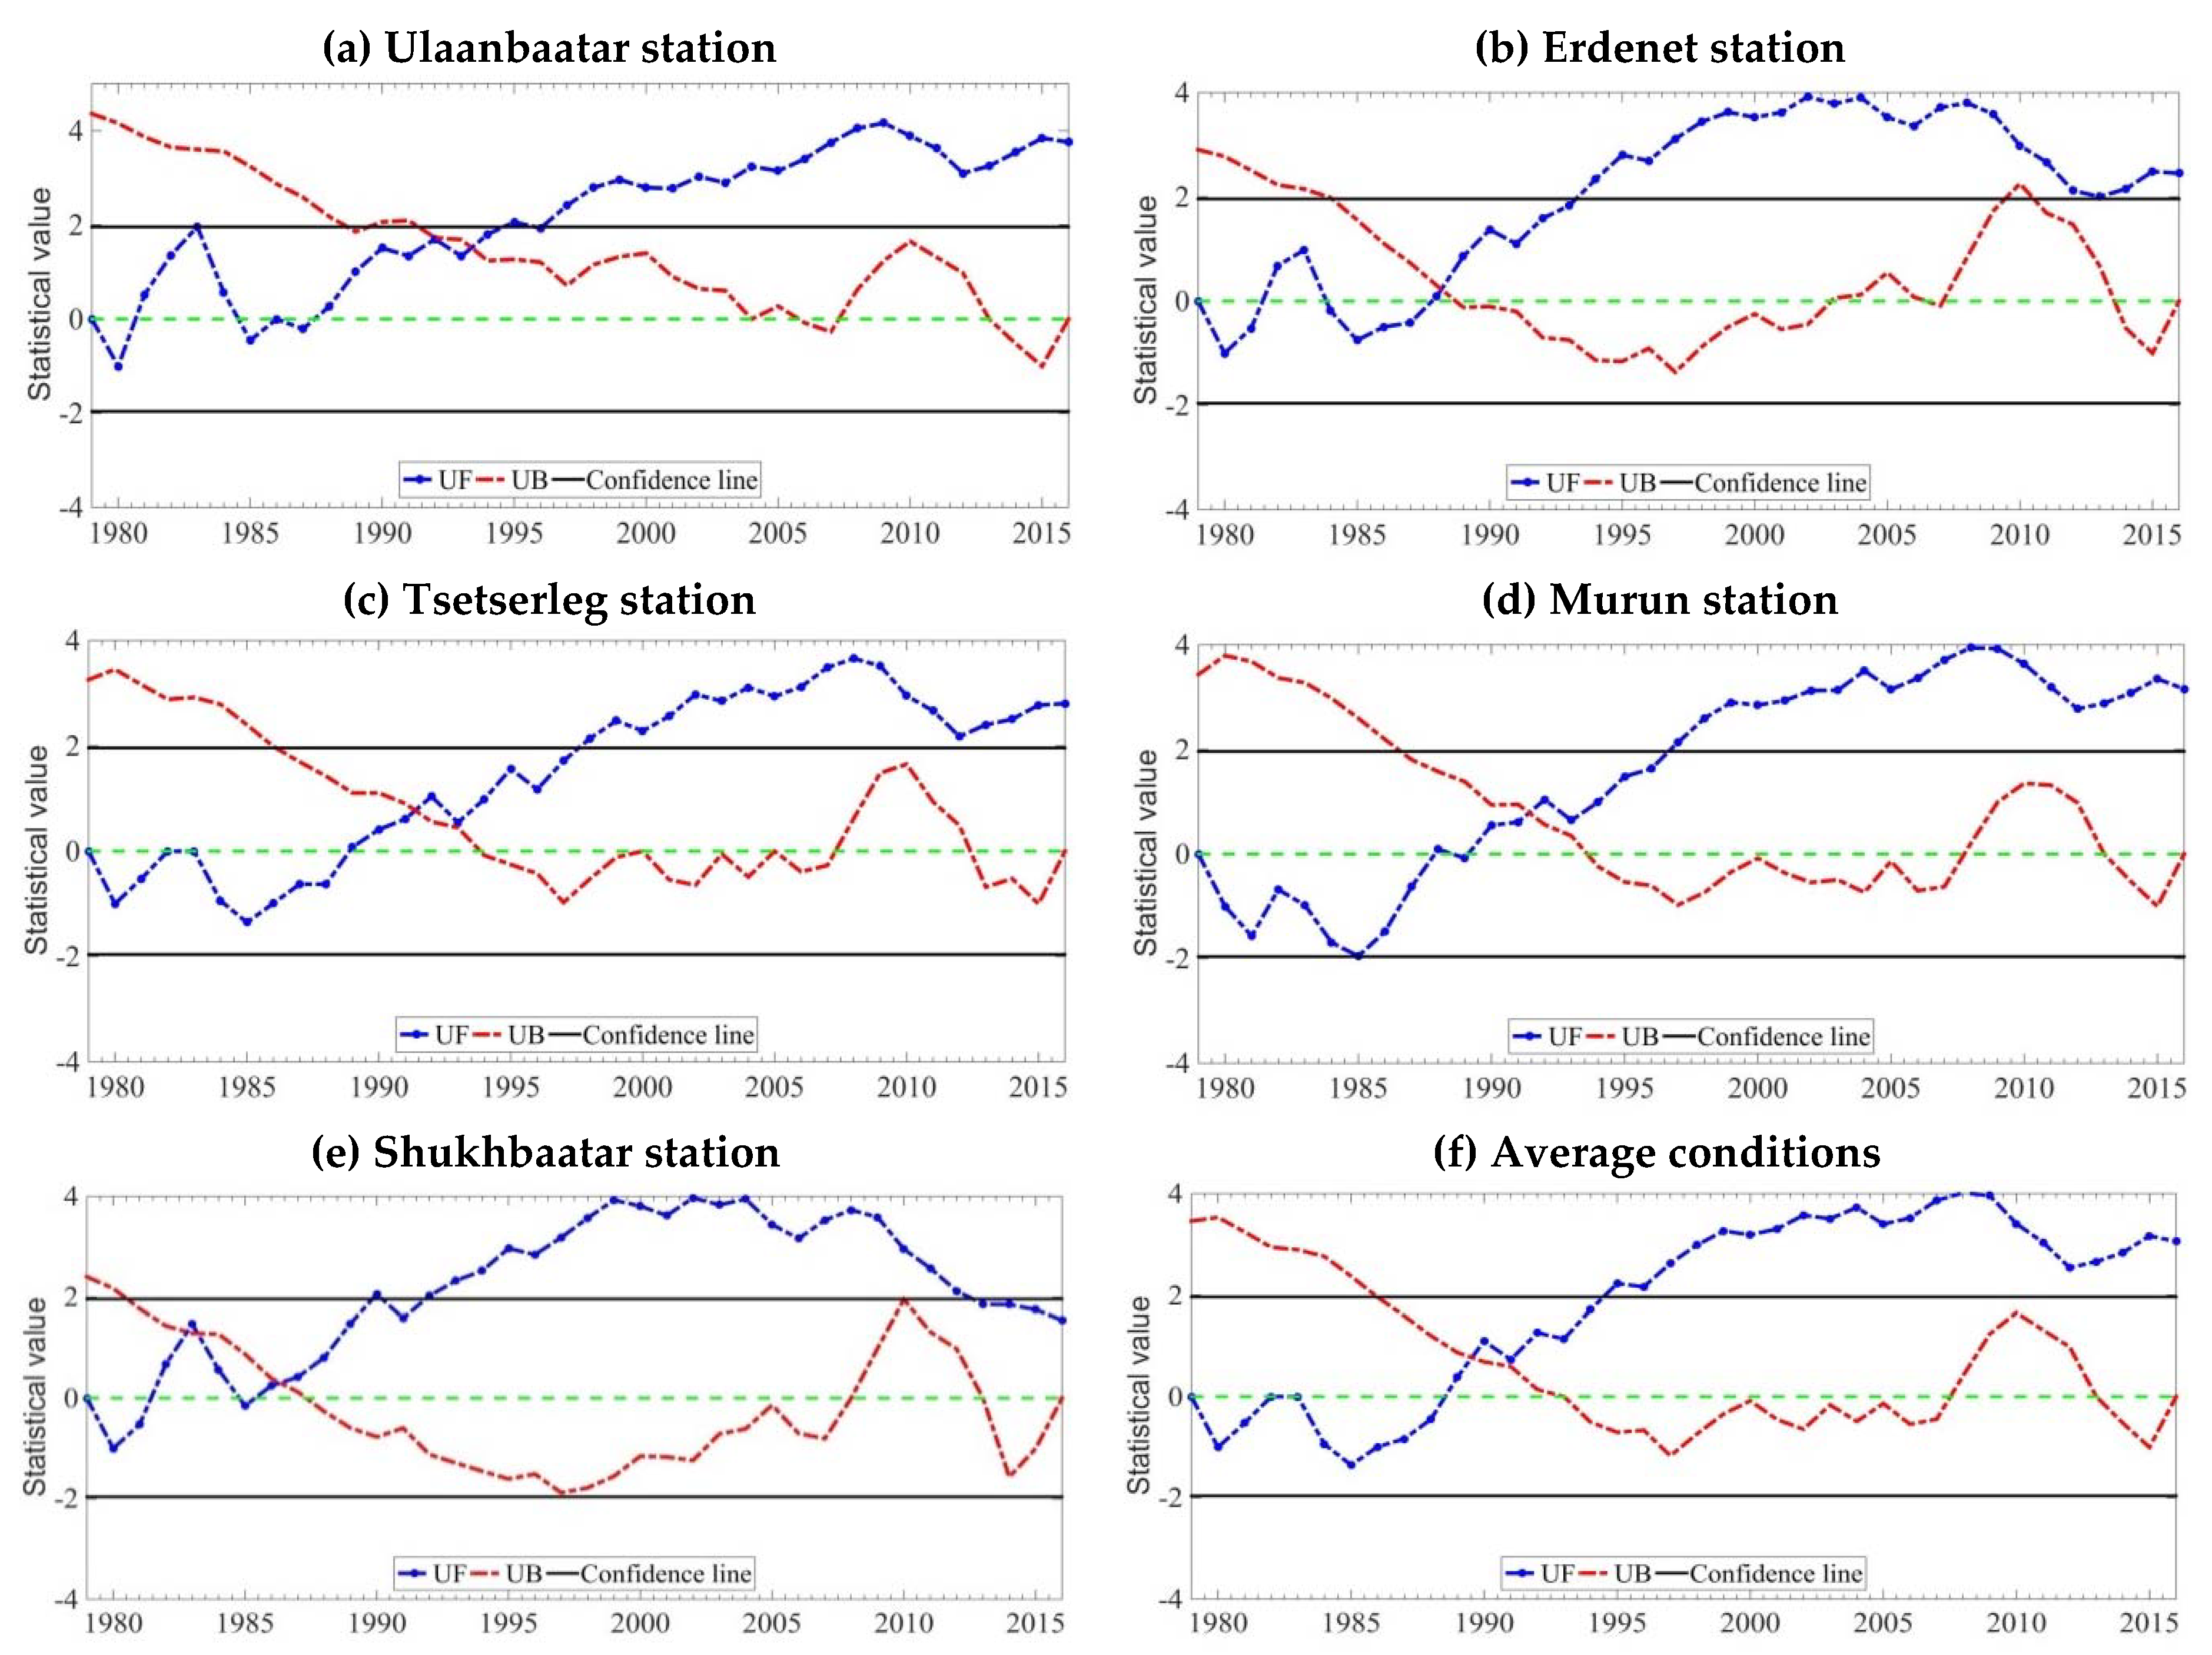
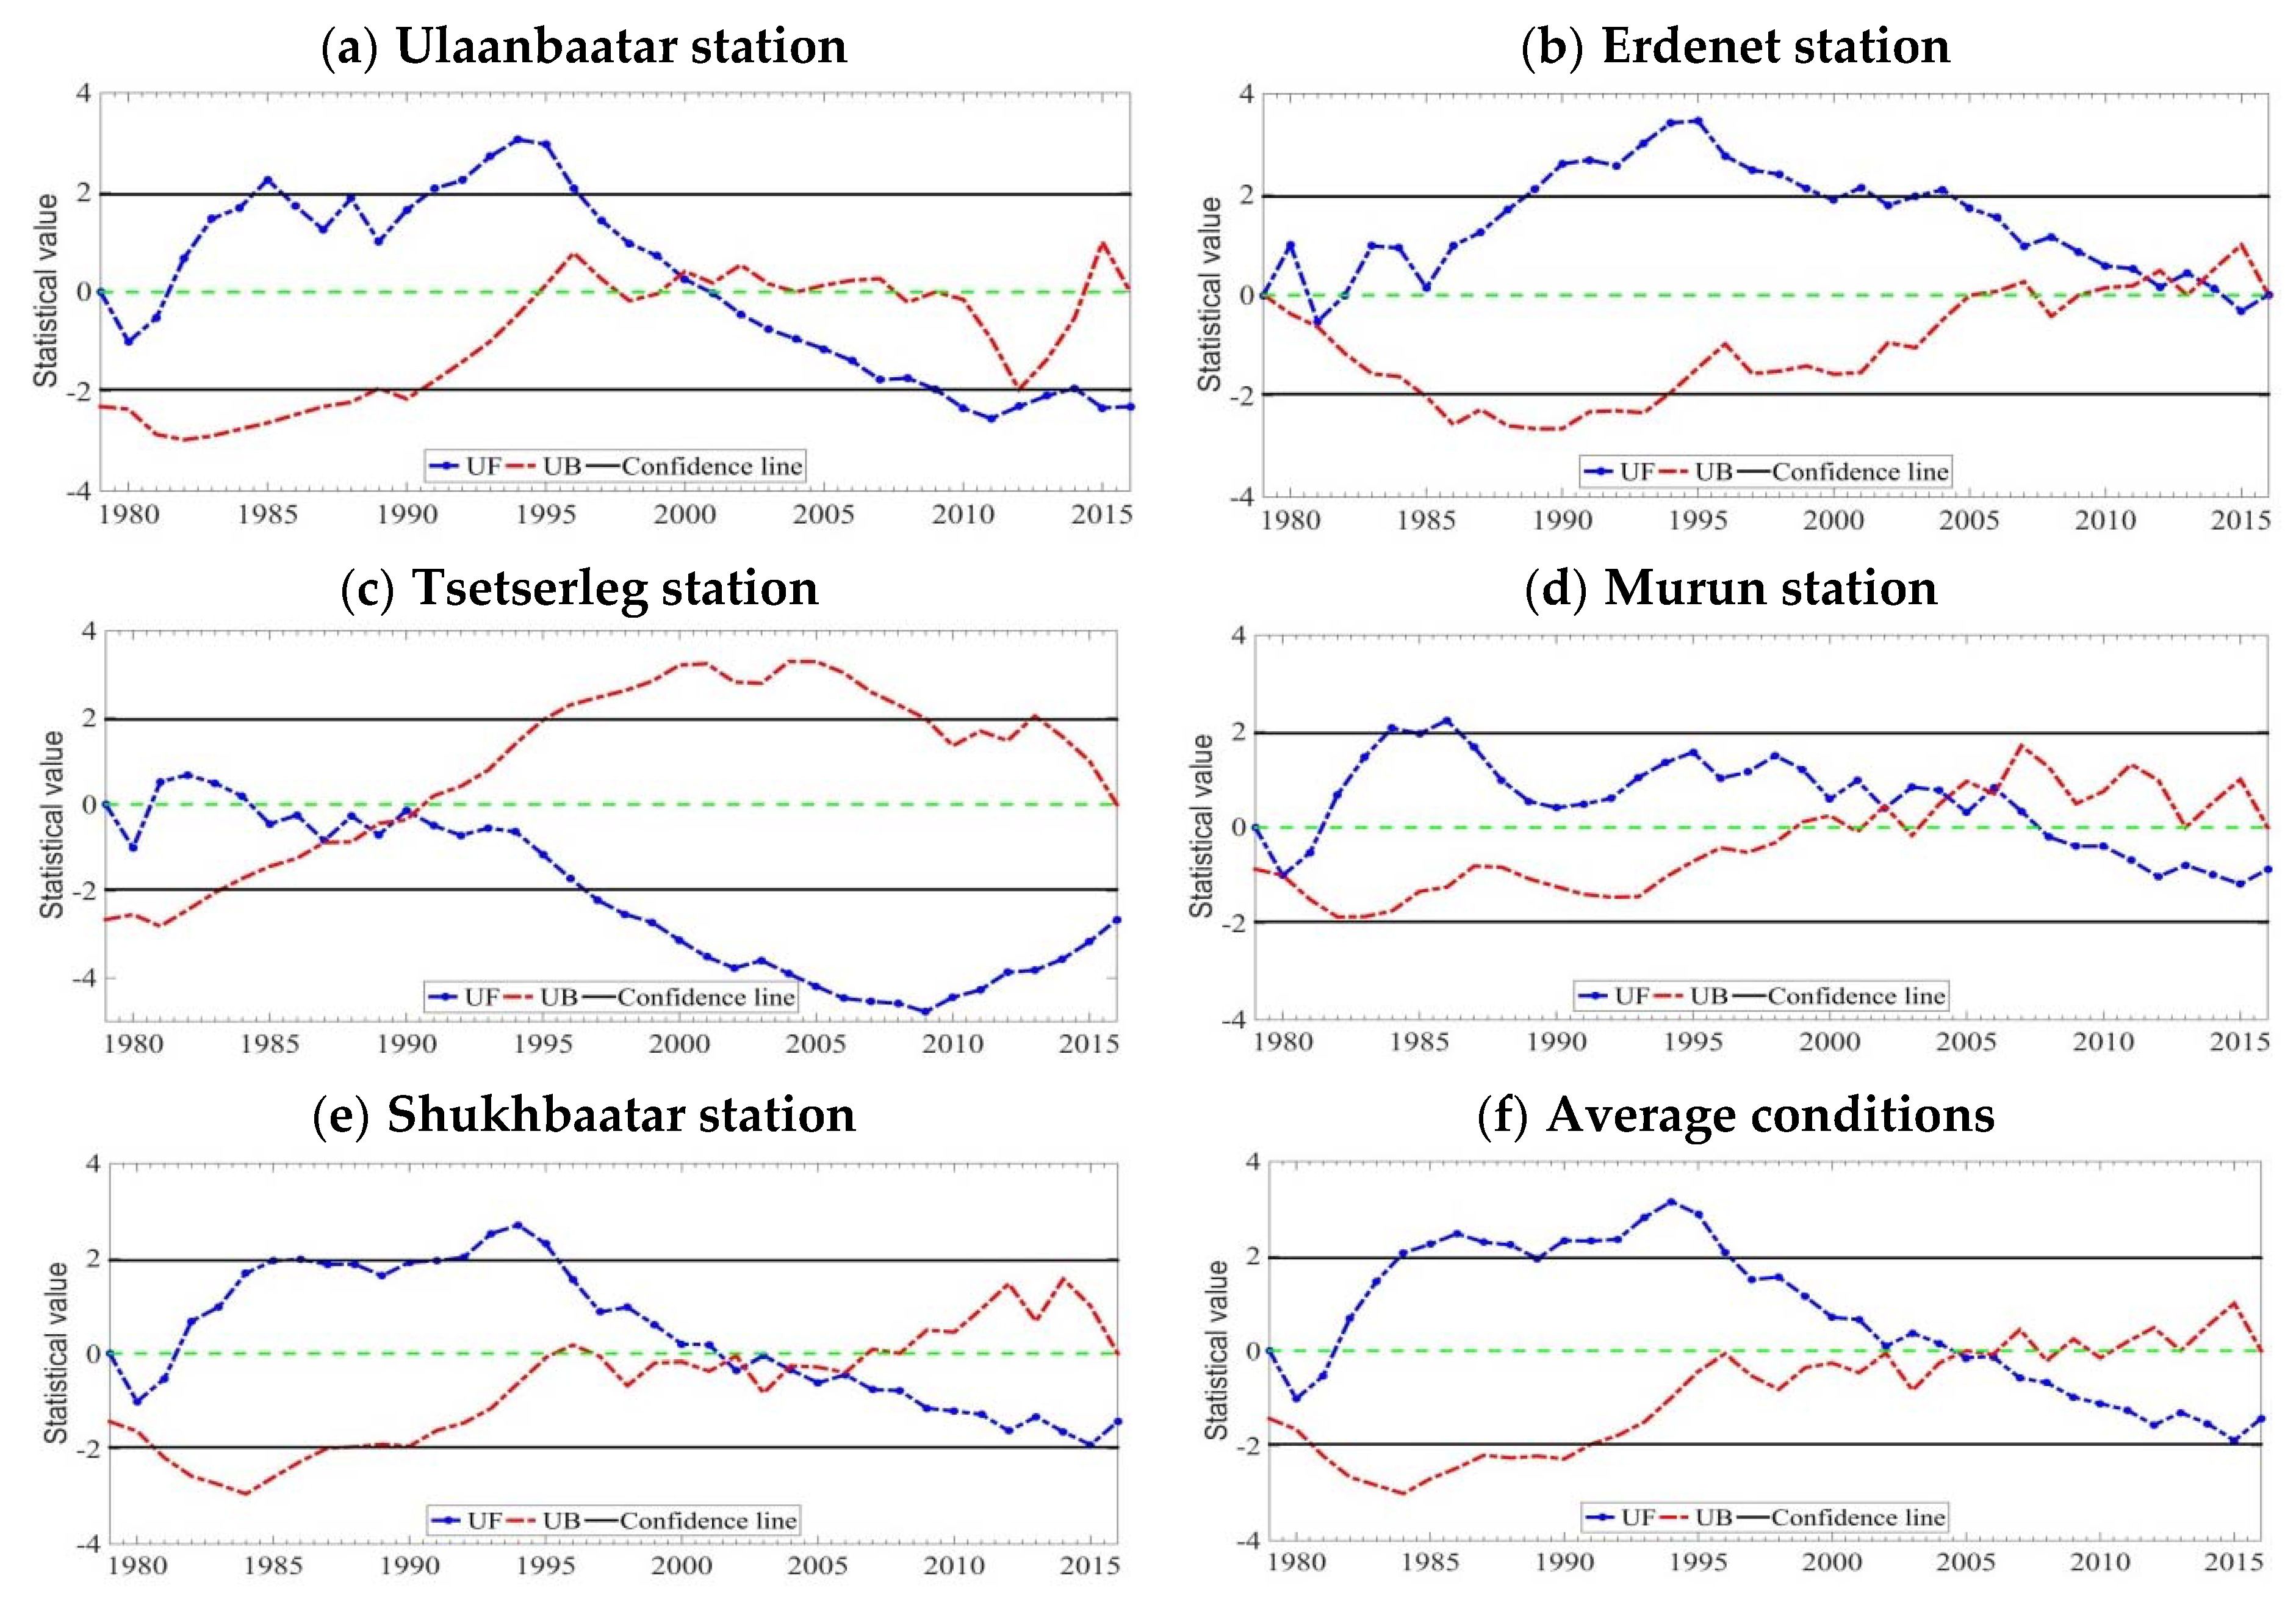
3.2. Analysis of Air Temperature
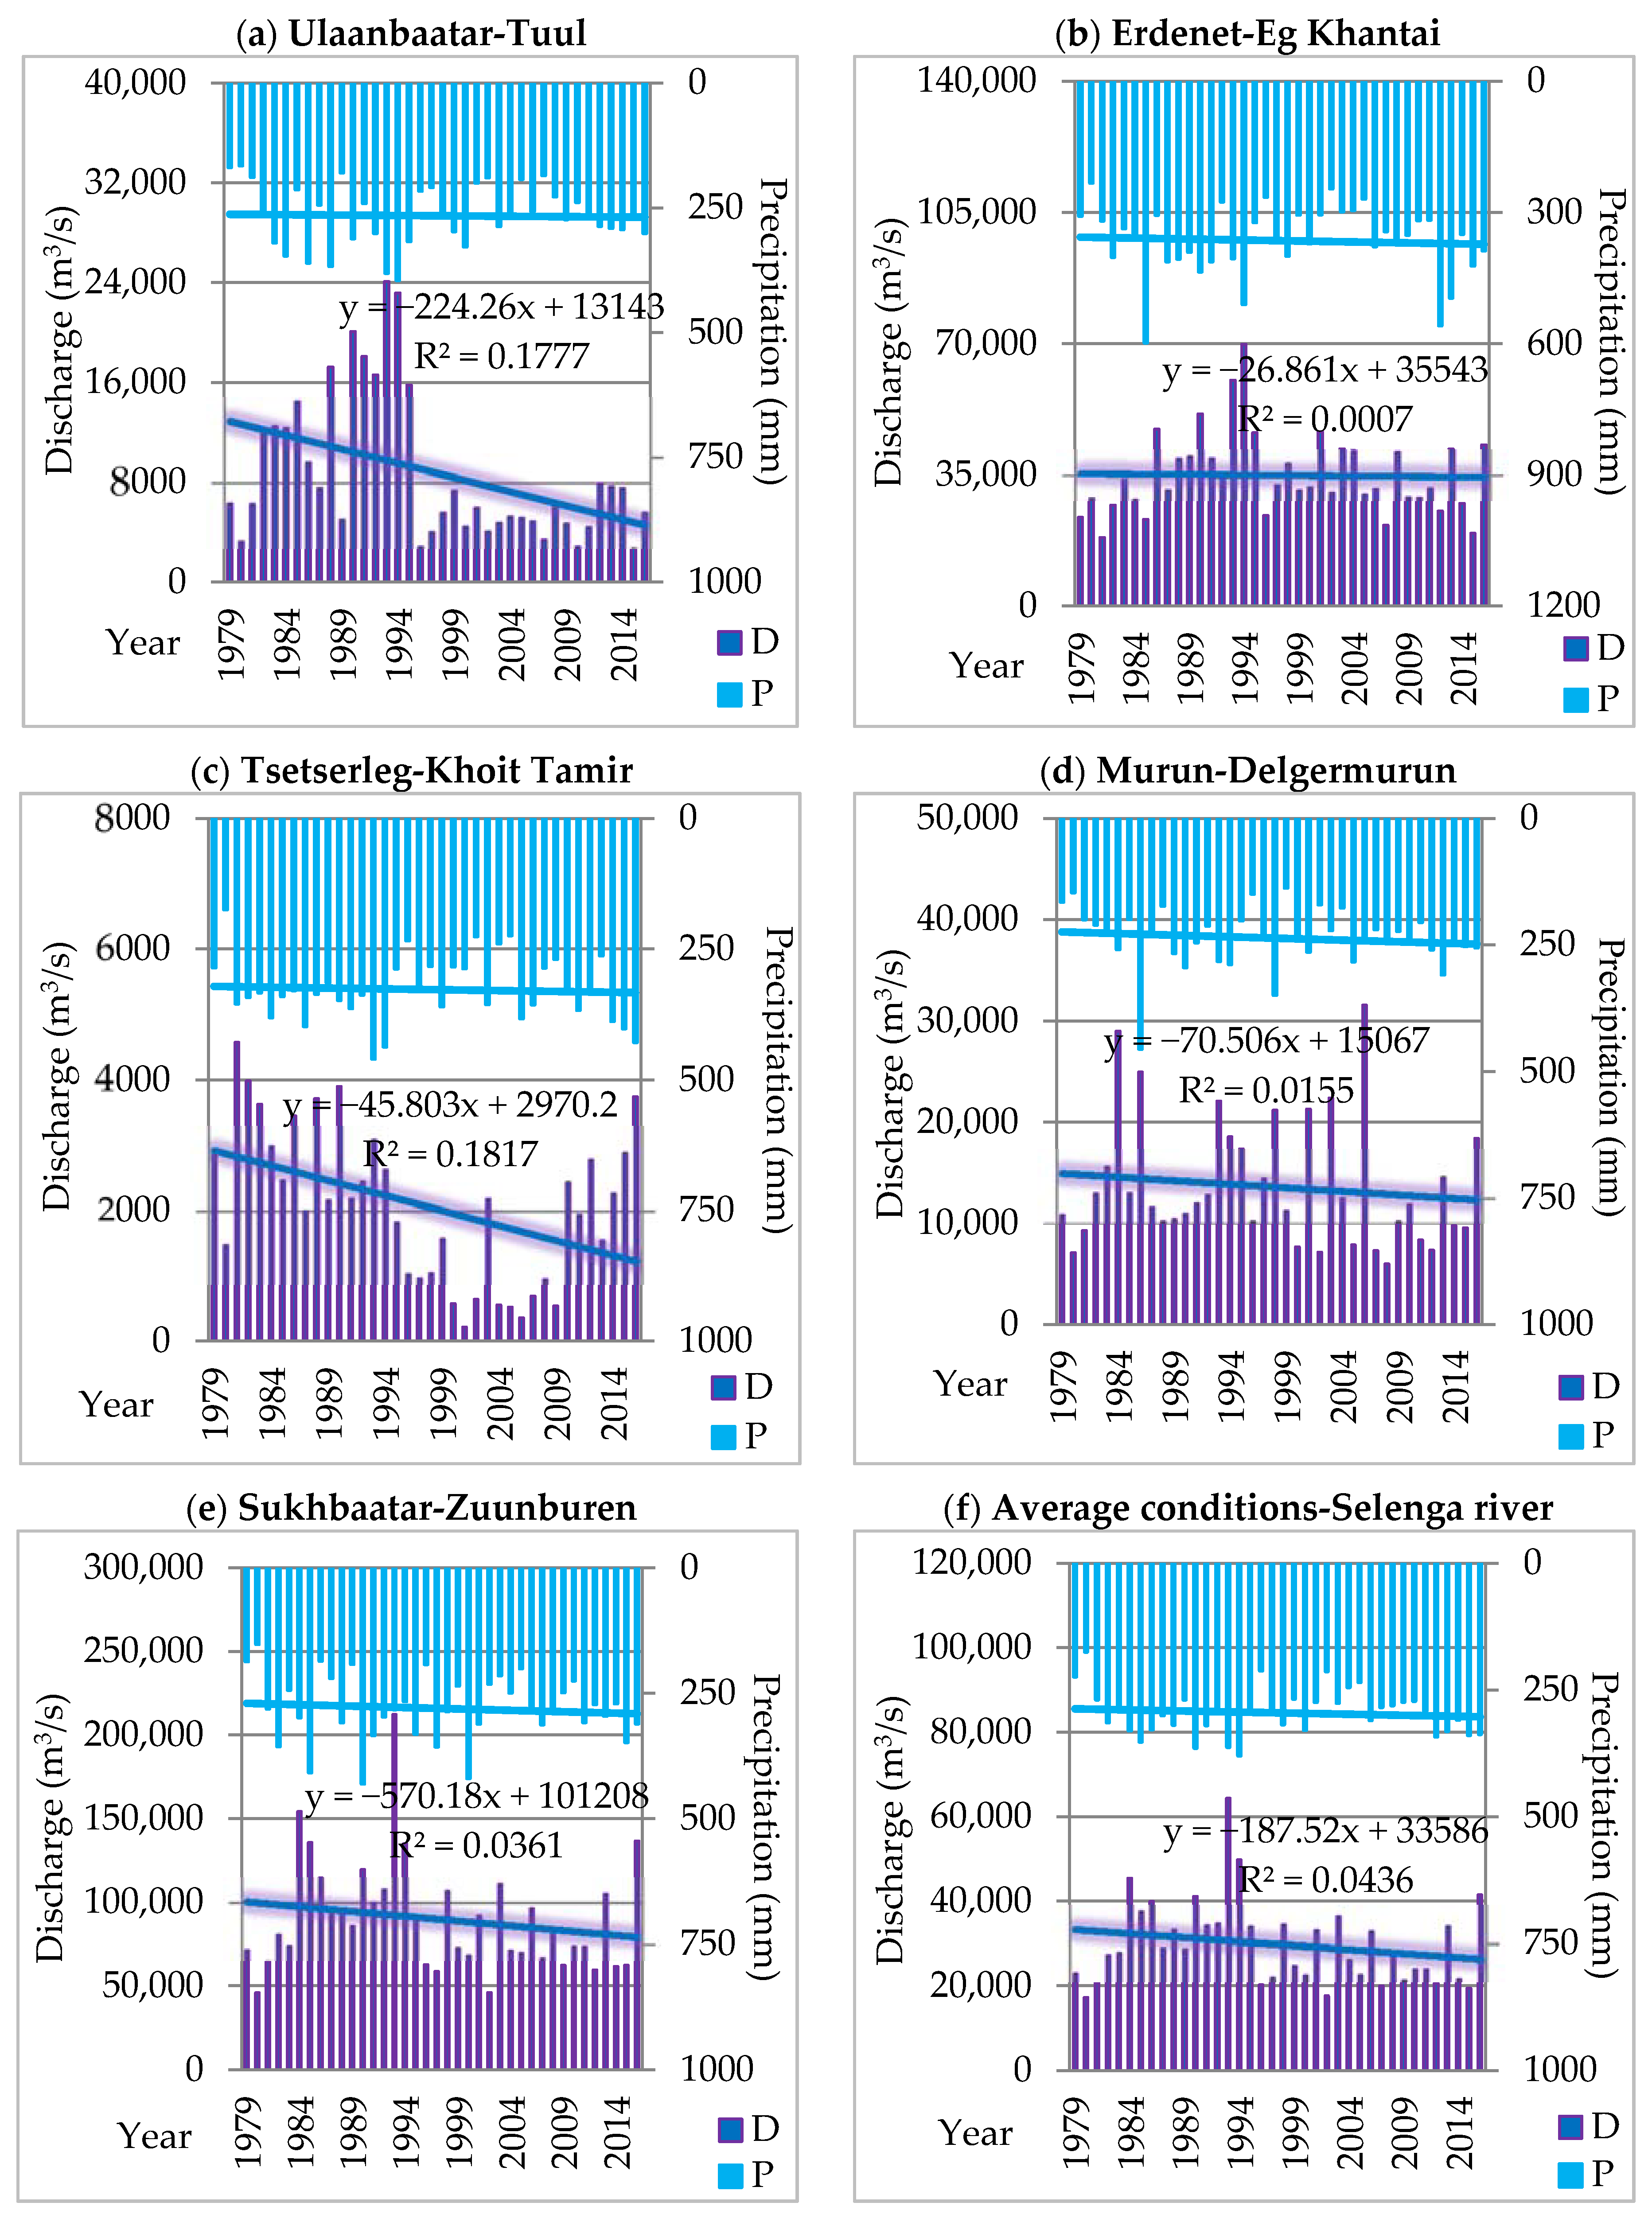
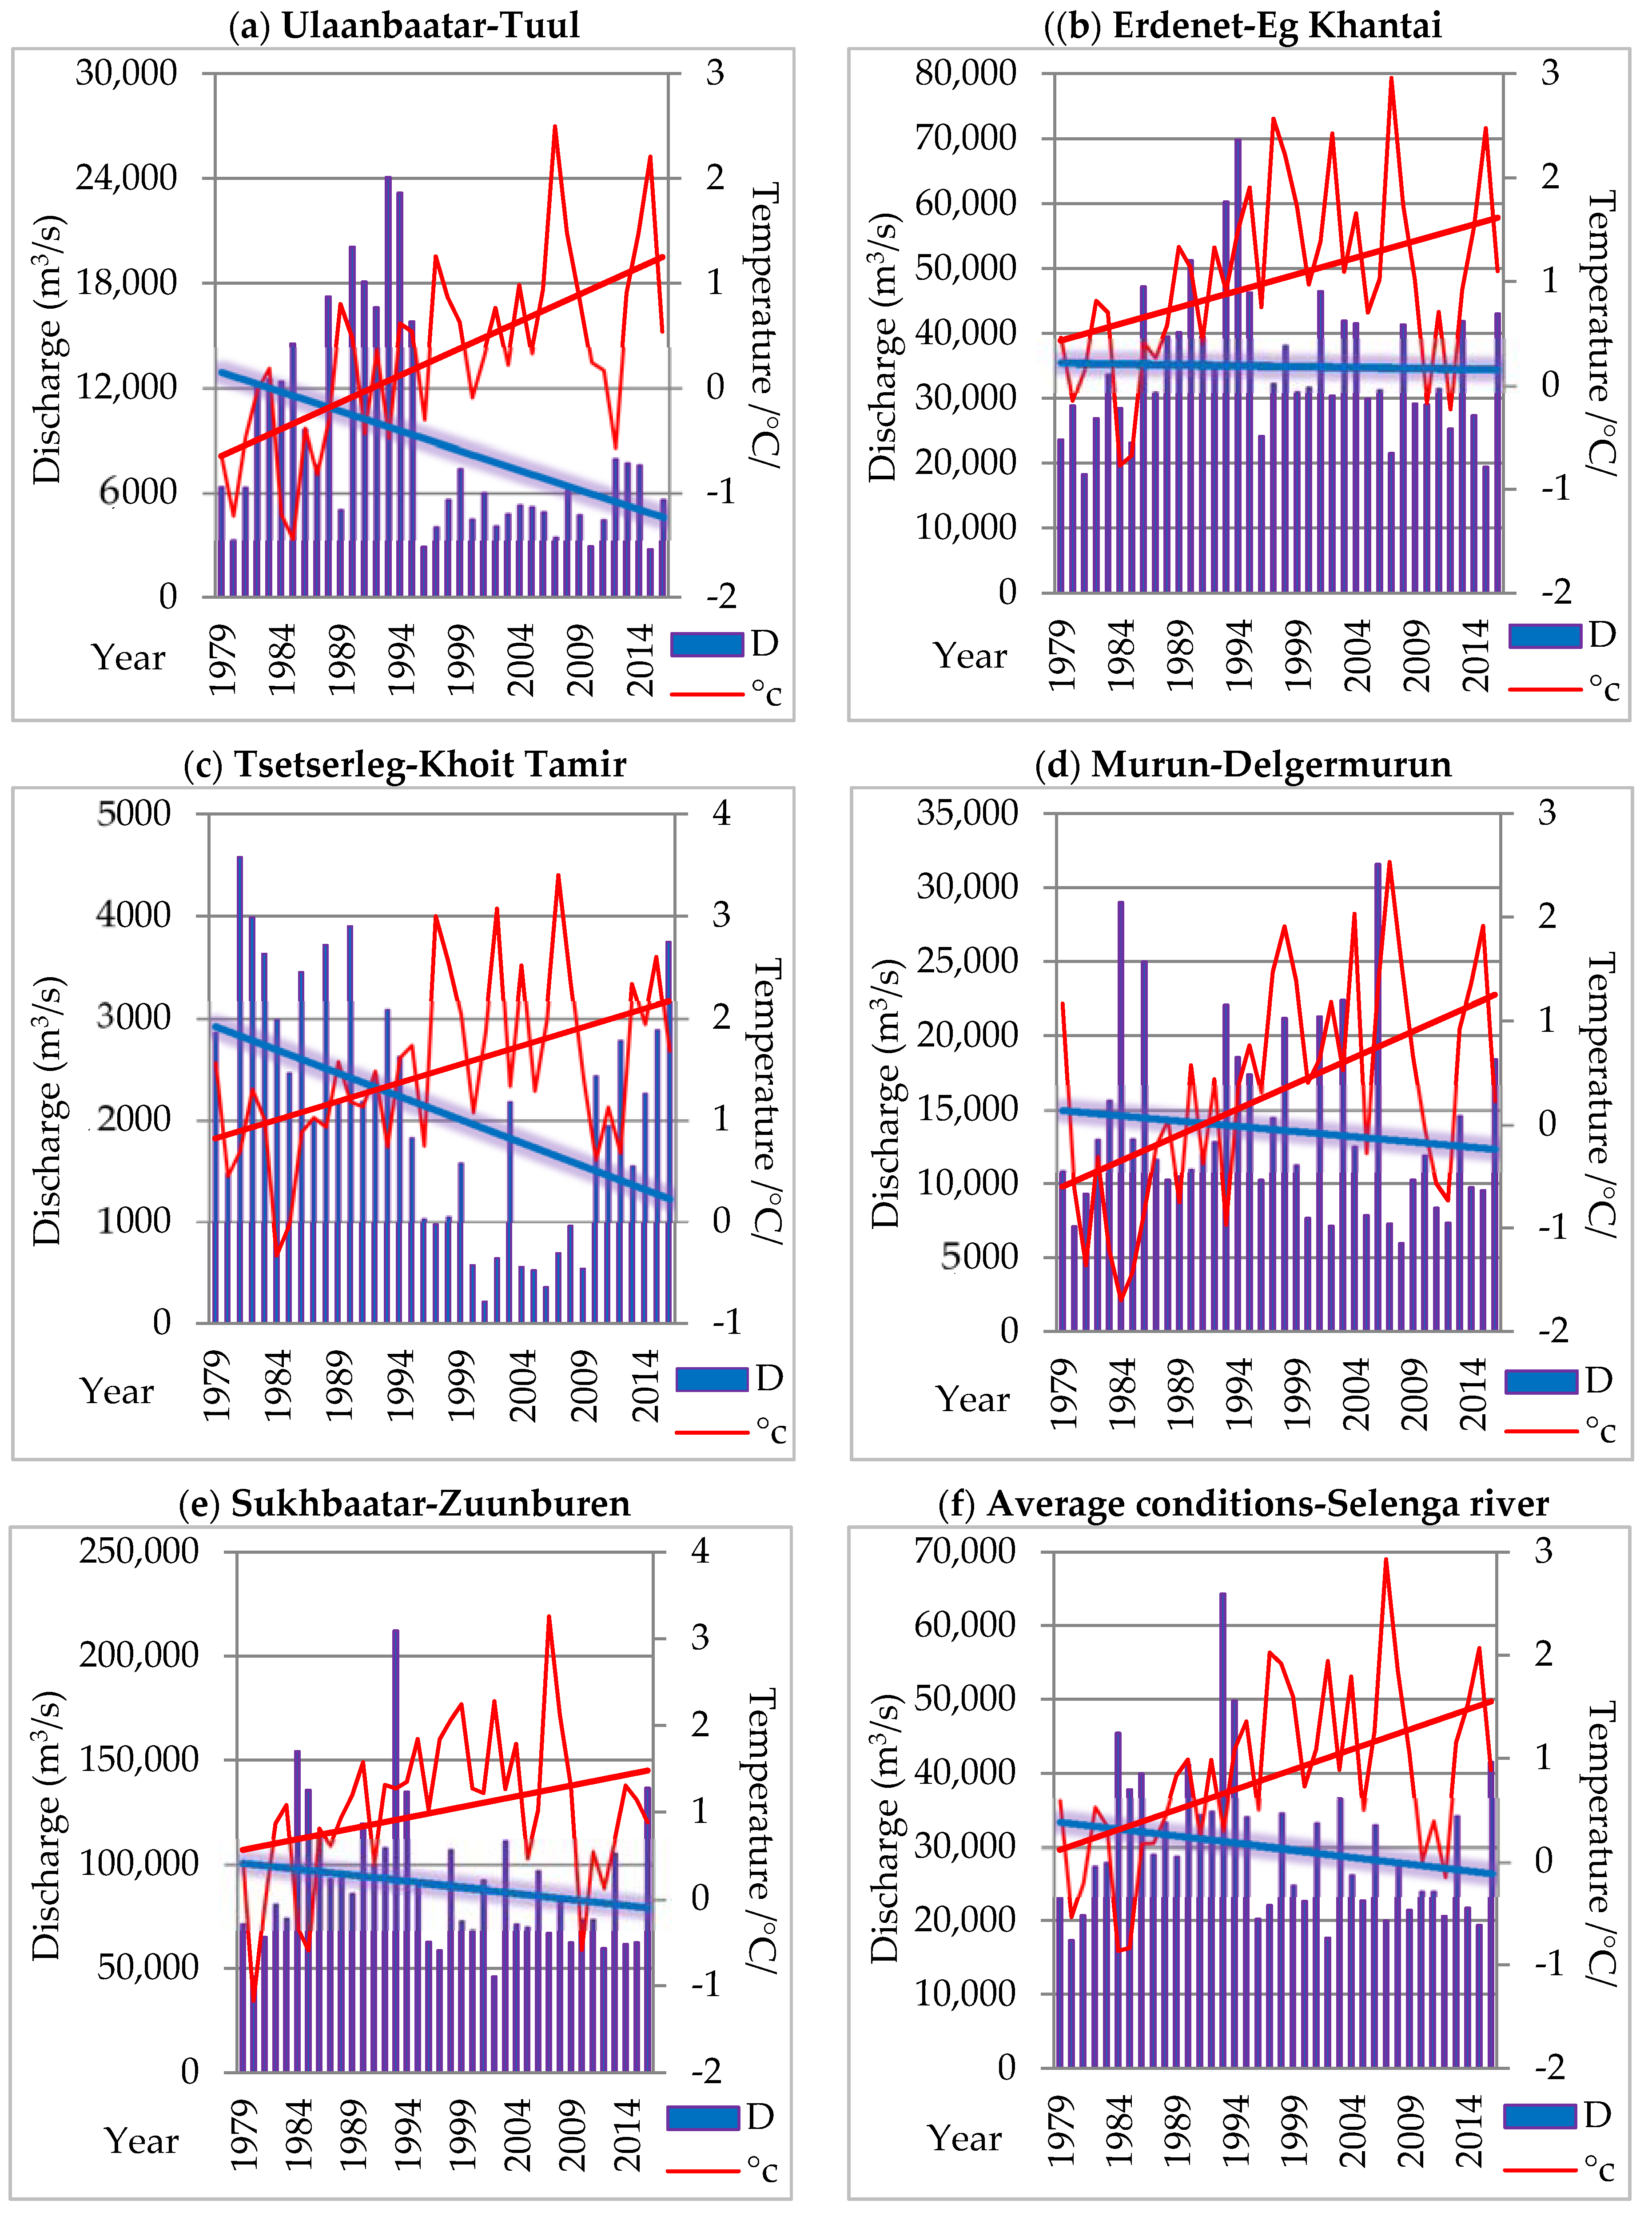
3.3. Analysis of River Discharge
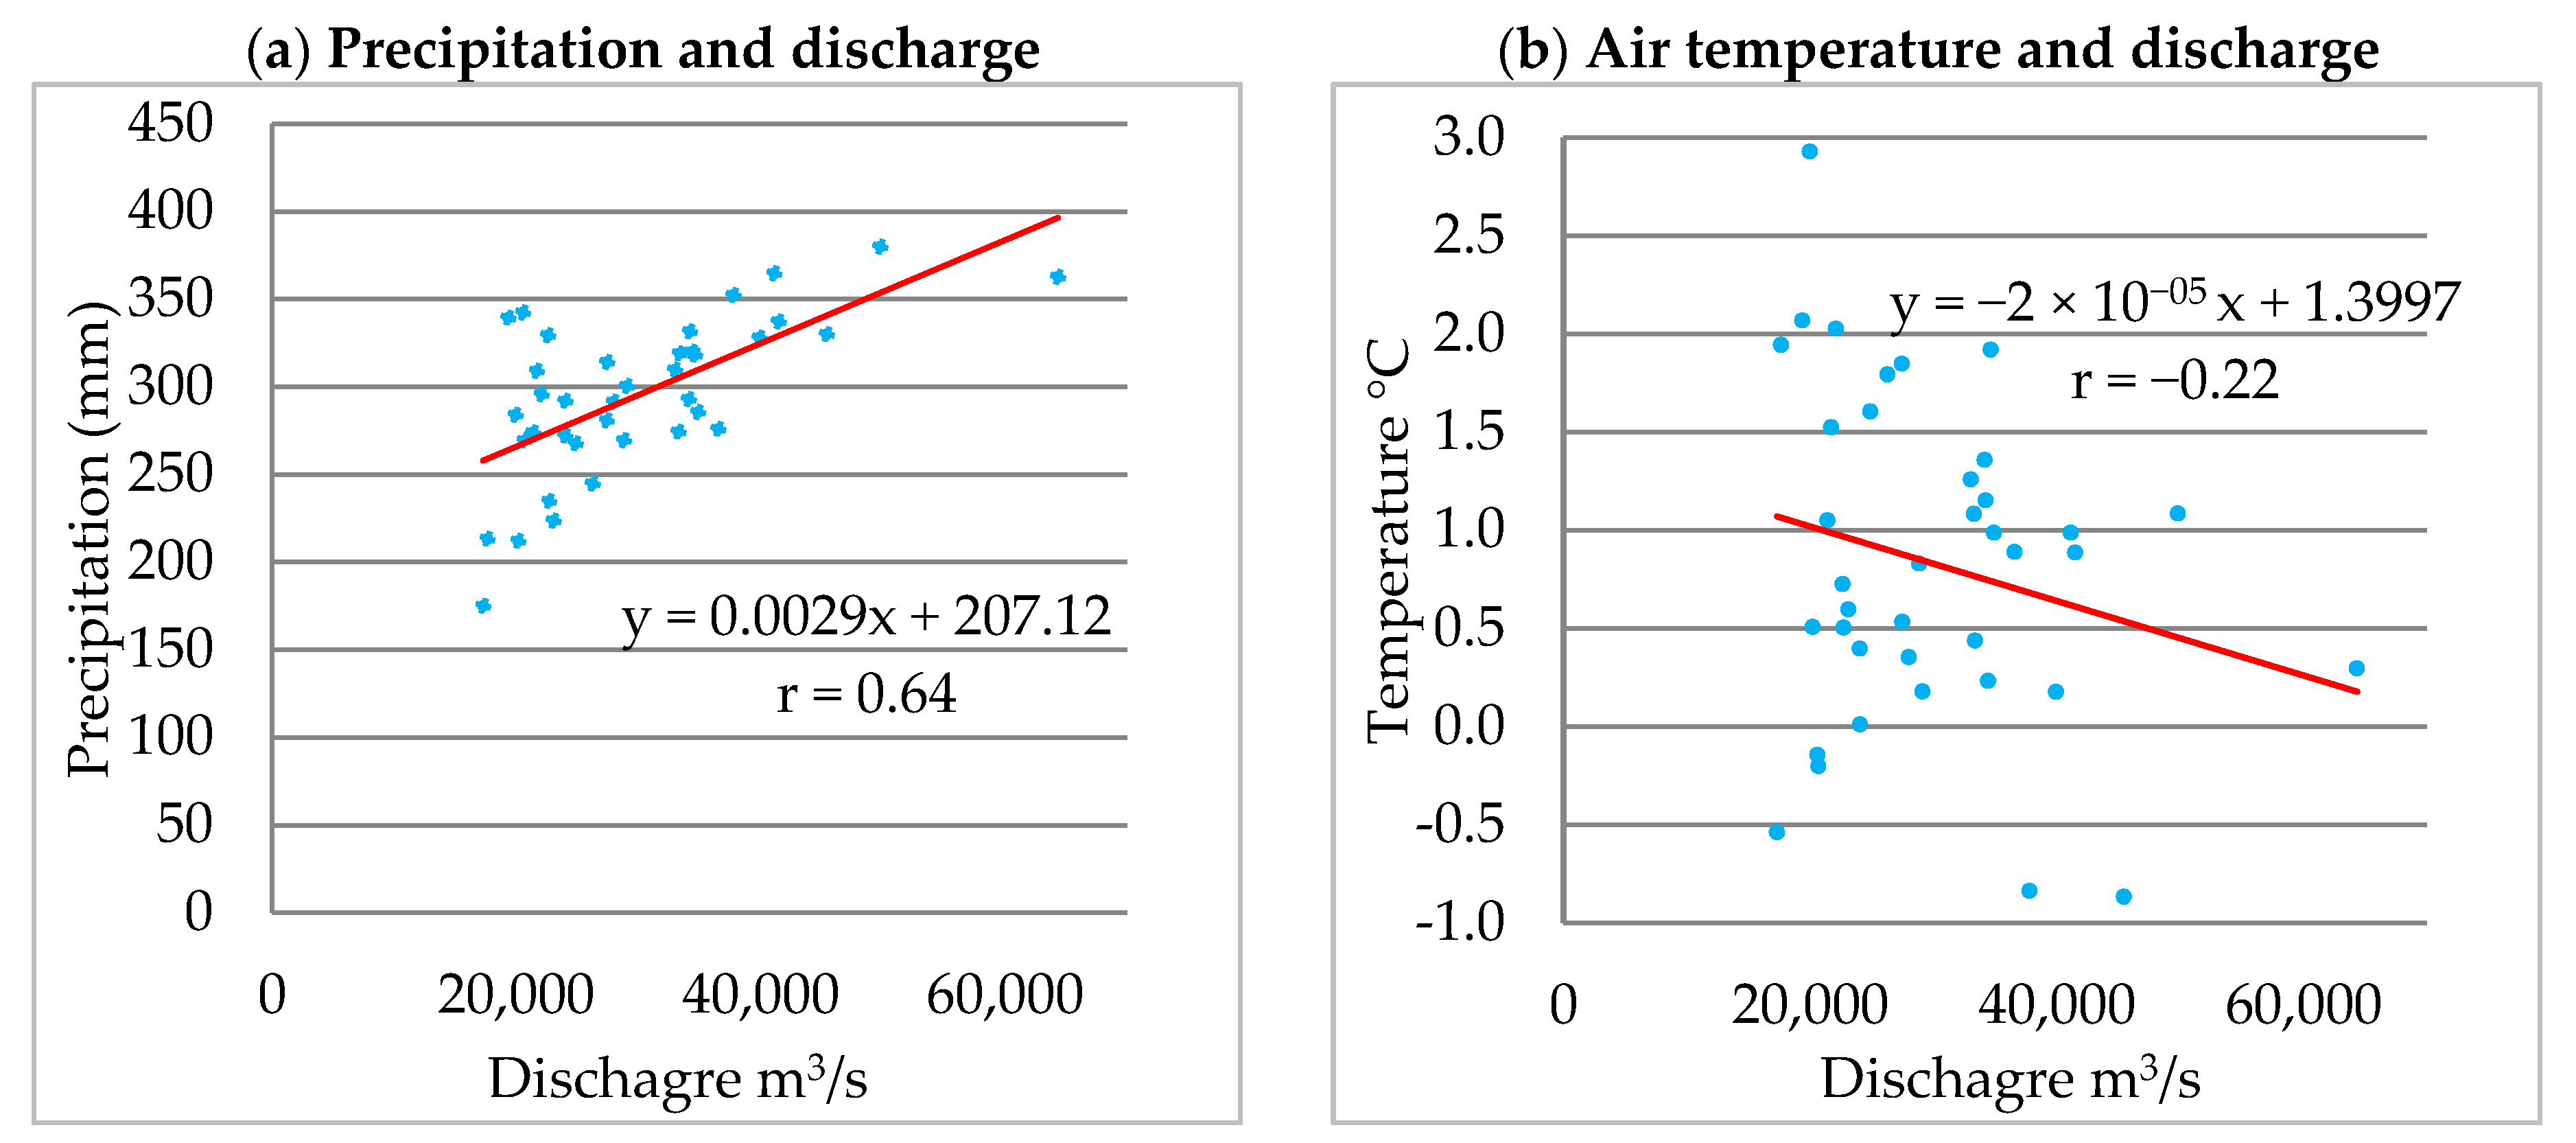
3.4. Relationship of Climate and River Discharge
4. Discussion
5. Conclusions
Author Contributions
Funding
Acknowledgments
Conflicts of Interest
References
- Palmate, S.S.; Pandey, A.; Kumar, D.; Pandey, R.P.; Mishra, S.K. Climate change impact on forest cover and vegetation in Betwa Basin, India. Appl. Water Sci. 2017, 7, 103–114. [Google Scholar] [CrossRef]
- Malsy, M.; Aus der Beek, T.; Eisner, S.; Flörke, M. Climate change impacts on Central Asian water resources. Adv. Geosci. 2012, 32, 77–83. [Google Scholar] [CrossRef]
- Malsy, M.; Flörke, M.; Borchardt, D. What drives the water quality changes in the Selenga Basin: Climate change or socio-economic development? Reg. Environ. Chang. 2017, 17, 1977–1989. [Google Scholar] [CrossRef]
- Kayet, N.; Pathak, K.; Chakrabarty, A.; Sahoo, S. Spatial impact of land use/land cover change on surface temperature distribution in Saranda Forest, Jharkhand. Model. Earth Syst. Environ. 2016, 2, 127. [Google Scholar] [CrossRef]
- Zhuo, L.; Han, D.; Dai, Q. Exploration of empirical relationship between surface soil temperature and surface soil moisture over two catchments of contrasting climates and land covers. Arabian J. Geosci. 2017, 10, 410. [Google Scholar] [CrossRef]
- Wang, G.; Zhang, J.; Li, X.; Bao, Z.; Liu, Y.; Liu, C.; He, R.; Luo, J. Investigating causes of changes in runoff using hydrological simulation approach. Appl. Water Sci. 2017, 7, 2245–2253. [Google Scholar] [CrossRef]
- Walling, D.E.; Fang, D. Recent trends in the suspended sediment loads of the world’s rivers. Glob. Planet. Chang. 2003, 39, 111–126. [Google Scholar] [CrossRef]
- Ma, X.; Yasunari, T.; Ohata, T.; Natsagdorj, L.; Davaa, G.; Oyunbaatar, D. Hydrological regime analysis of the Selenge River basin, Mongolia. Hydrol. Process. 2003, 17, 2929–2945. [Google Scholar] [CrossRef]
- Fang, J.; Bai, Y.; Wu, J. Towards a better understanding of landscape patterns and ecosystem processes of the Mongolian Plateau. Landsc. Ecol. 2015, 30, 1573–1578. [Google Scholar] [CrossRef]
- Törnqvist, R.; Jarsjö, J.; Pietroń, J.; Bring, A.; Rogberg, P.; Asokan, S.M.; Destouni, G. Evolution of the hydro-climate system in the Lake Baikal basin. J. Hydrol. 2014, 519, 1953–1962. [Google Scholar] [CrossRef]
- Karthe, D.; Chalov, S.; Moreido, V.; Pashkina, M.; Romanchenko, A.; Batbayar, G.; Kalugin, A.; Westphal, K.; Malsy, M.; Flörke, M. Assessment of runoff, water and sediment quality in the Selenga River basin aided by a web-based geoservice. Water Resour. 2017, 44, 399–416. [Google Scholar] [CrossRef]
- Kasimov, N.; Karthe, D.; Chalov, S. Environmental change in the Selenga River—Lake Baikal Basin. Reg. Environ. Chang. 2017, 17, 1945–1949. [Google Scholar] [CrossRef] [Green Version]
- Troitskaya, E.; Blinov, V.; Ivanov, V.; Zhdanov, A.; Gnatovsky, R.; Sutyrina, E.; Shimaraev, M. Cyclonic circulation and upwelling in Lake Baikal. Aquat. Sci. 2015, 77, 171–182. [Google Scholar] [CrossRef]
- United Nations Development Programme (UNDP). Chapter I. General Characteristics of Lake Baikal Basin. In State of the Environment Report. The Lake Baikal Basin 2012–2013; United Nations Development Programme: New York, NY, USA, 2013. [Google Scholar]
- Moore, M.V.; Hampton, S.E.; Izmest’eva, L.R.; Silow, E.A.; Peshkova, E.V.; Pavlov, B.K. Climate Change and the World’s “Sacred Sea”—Lake Baikal, Siberia. BioScience 2009, 59, 405–417. [Google Scholar] [CrossRef]
- United Nations Educational, Scientific and Cultural Organization (UNESCO). Convention Concerning the Protection of the World Cultural and Natural Heritage; Report; United Nations Educational, Scientific and Cultural Organization: Paris, France, 1996; Available online: http://whc.unesco.org/archive/repcom96.htm#754 (accessed on 10 March 1997).
- Sharma, K.P.; Moore, B.; Vorosmarty, C.J. Anthropogenic, Climatic, and Hydrologic Trends in the Kosi Basin, Himalaya. Clim. Chang. 2000, 47, 141–165. [Google Scholar] [CrossRef]
- Déry, S.J.; Wood, E.F. Decreasing river discharge in northern Canada. Geophys. Res. Lett. 2005, 32. [Google Scholar] [CrossRef] [Green Version]
- McClelland, J.W.; Déry, S.J.; Peterson, B.J.; Holmes, R.M.; Wood, E.F. A pan-arctic evaluation of changes in river discharge during the latter half of the 20th century. Geophys. Res. Lett. 2006, 33. [Google Scholar] [CrossRef] [Green Version]
- Asfaw, A.; Simane, B.; Hassen, A.; Bantider, A. Variability and time series trend analysis of rainfall and temperature in northcentral Ethiopia: A case study in Woleka sub-basin. Weather Clim. Extremes 2018, 19, 29–41. [Google Scholar] [CrossRef]
- Gedefaw, M.; Yan, D.; Wang, H.; Qin, T.; Girma, A.; Abiyu, A.; Batsuren, D. Innovative Trend Analysis of Annual and Seasonal Rainfall Variability in Amhara Regional State, Ethiopia. Atmosphere 2018, 9, 326. [Google Scholar] [CrossRef]
- Wu, L.; Wang, S.; Bai, X.; Luo, W.; Tian, Y.; Zeng, C.; Luo, G.; He, S. Quantitative assessment of the impacts of climate change and human activities on runoff change in a typical karst watershed, SW China. Sci. Total Environ. 2017, 601–602, 1449–1465. [Google Scholar] [CrossRef] [PubMed]
- Ma, X.; He, Y.; Xu, J.; van Noordwijk, M.; Lu, X. Spatial and temporal variation in rainfall erosivity in a Himalayan watershed. CATENA 2014, 121, 248–259. [Google Scholar] [CrossRef]
- Wu, H.S.; Liu, D.F.; Chang, J.X.; Zhang, H.X.; Huang, Q. Impacts of climate change and human activities on runoff in Weihe Basin based on Budyko hypothesis. IOP Conf. Ser. Earth Environ. Sci. 2017, 82, 012063. [Google Scholar] [CrossRef] [Green Version]
- Wu, H.; Qian, H. Innovative trend analysis of annual and seasonal rainfall and extreme values in Shaanxi, China, since the 1950s. Int. J. Climatol. 2017, 37, 2582–2592. [Google Scholar] [CrossRef]
- Cui, L.; Wang, L.; Lai, Z.; Tian, Q.; Liu, W.; Li, J. Innovative trend analysis of annual and seasonal air temperature and rainfall in the Yangtze River Basin, China during 1960–2015. J. Atmos. Sol. Terr. Phys. 2017, 164, 48–59. [Google Scholar] [CrossRef]
- Gocic, M.; Trajkovic, S. Analysis of changes in meteorological variables using Mann-Kendall and Sen’s slope estimator statistical tests in Serbia. Glob. Planet. Chang. 2013, 100, 172–182. [Google Scholar] [CrossRef]
- Gu, X.; Zhang, Q.; Singh, V.P.; Shi, P. Changes in magnitude and frequency of heavy precipitation across China and its potential links to summer temperature. J. Hydrol. 2017, 547, 718–731. [Google Scholar] [CrossRef]
- St Laurent, J.; Mazumder, A. Influence of seasonal and inter-annual hydro-meteorological variability on surface water fecal coliform concentration under varying land-use composition. Water Res. 2014, 48, 170–178. [Google Scholar] [CrossRef] [PubMed]
- Wang, H.; Zhang, M.; Zhu, H.; Dang, X.; Yang, Z.; Yin, L. Hydro-climatic trends in the last 50years in the lower reach of the Shiyang River Basin, NW China. CATENA 2012, 95, 33–41. [Google Scholar] [CrossRef]
- Sorg, A.; Bolch, T.; Stoffel, M.; Solomina, O.; Beniston, M. Climate change impacts on glaciers and runoff in Tien Shan (Central Asia). Nat. Clim. Change 2012, 2, 725. [Google Scholar] [CrossRef]
- Li, X.; Zhang, L.; Yang, G.; Li, H.; He, B.; Chen, Y.; Tang, X. Impacts of human activities and climate change on the water environment of Lake Poyang Basin, China. Geoenviron. Disasters 2015, 2, 22. [Google Scholar] [CrossRef]
- Batima, P.; Natsagdorj, L.; Gombluudev, P.; Erdenetsetseg, B. Observed Climate Change in Mongolia. AIACC Work. Pap. 2005, 12, 1–26. [Google Scholar]
- Nandintsetseg, B.; Greene, J.S.; Goulden, C.E. Trends in extreme daily precipitation and temperature near lake Hövsgöl, Mongolia. Int. J. Climatol. 2007, 27, 341–347. [Google Scholar] [CrossRef] [Green Version]
- Berezhnykh, T.V.; Marchenko, O.Y.; Abasov, N.V.; Mordvinov, V.I. Changes in the summertime atmospheric circulation over East Asia and formation of long-lasting low-water periods within the Selenga river basin. Geogr. Nat. Resour. 2012, 33, 223–229. [Google Scholar] [CrossRef]
- Frolova, N.L.; Belyakova, P.A.; Grigor’ev, V.Y.; Sazonov, A.A.; Zotov, L.V. Many-year variations of river runoff in the Selenga basin. Water Resour. 2017, 44, 359–371. [Google Scholar] [CrossRef]
- Chalov, S.R.; Jarsjö, J.; Kasimov, N.S.; Romanchenko, A.O.; Pietroń, J.; Thorslund, J.; Promakhova, E.V. Spatio-temporal variation of sediment transport in the Selenga River Basin, Mongolia and Russia. Environ. Earth Sci. 2015, 73, 663–680. [Google Scholar] [CrossRef]
- Stubblefield, A.; Chandra, S.; Eagan, S.; Tuvshinjargal, D.; Davaadorzh, G.; Gilroy, D.; Sampson, J.; Thorne, J.; Allen, B.; Hogan, Z. Impacts of gold mining and land use alterations on the water quality of central Mongolian rivers. Integr. Environ. Assess. Manag. 2005, 1, 365–373. [Google Scholar] [CrossRef] [PubMed]
- Sorokovikova, L.M.; Popovskaya, G.I.; Tomberg, I.V.; Sinyukovich, V.N.; Kravchenko, O.S.; Marinaite, I.I.; Bashenkhaeva, N.V.; Khodzher, T.V. The Selenga River water quality on the border with Mongolia at the beginning of the 21st century. Russ. Meteorol. Hydrol. 2013, 38, 126–133. [Google Scholar] [CrossRef]
- Karthe, D.; Heldt, S.; Houdret, A.; Borchardt, D. IWRM in a country under rapid transition: Lessons learnt from the Kharaa River Basin, Mongolia. Environ. Earth Sci. 2015, 73, 681–695. [Google Scholar] [CrossRef]


| Months, Season | Ulaanbaatar (mm) | Erdenet (mm) | Tsetserleg (mm) | Murun (mm) | Sukhbaatar (mm) | Average Precipitation (mm) | Z-Score |
|---|---|---|---|---|---|---|---|
| January | 2.38 | 2.54 | 2.52 | 1.47 | 3.09 | 2.40 | (−0.83) |
| February | 2.45 | 2.56 | 2.90 | 1.10 | 2.18 | 2.24 | (−0.84) |
| March | 4.60 | 6.93 | 7.37 | 1.40 | 2.66 | 4.59 | (−0.75) |
| April | 8.39 | 14.03 | 13.47 | 7.71 | 9.74 | 10.67 | (−0.52) |
| May | 20.53 | 24.13 | 32.52 | 17.89 | 24.98 | 24.01 | (−0.02) |
| June | 48.23 | 69.73 | 58.95 | 48.19 | 48.78 | 54.78 | 1.13 |
| July | 69.37 | 99.39 | 86.13 | 69.86 | 64.01 | 77.75 | 1.99 |
| August | 66.80 | 86.26 | 75.71 | 57.60 | 71.55 | 71.58 | 1.76 |
| September | 25.52 | 34.71 | 25.98 | 19.78 | 32.45 | 27.69 | 0.12 |
| October | 8.94 | 12.34 | 13.07 | 5.62 | 10.02 | 10.00 | (−0.55) |
| November | 5.48 | 7.61 | 6.27 | 3.06 | 6.73 | 5.83 | (−0.70) |
| December | 3.52 | 4.28 | 3.02 | 2.98 | 4.44 | 3.65 | (−0.79) |
| Spring | 33.52 | 45.09 | 53.36 | 26.99 | 37.38 | 39.27 (13.3%) | 0.55 |
| Summer | 184.41 | 255.38 | 220.79 | 175.65 | 184.34 | 204.11 (69.15%) | 6.73 |
| Autumn | 39.94 | 54.66 | 45.31 | 28.46 | 49.20 | 43.51 (14.74%) | 0.71 |
| Winter | 8.35 | 9.39 | 8.43 | 5.56 | 9.71 | 8.29 (2.81%) | (−0.61) |
| Annual precipitation | 266.22 | 364.52 | 327.89 | 236.66 | 280.62 | 295.18 (100%) | 10.14 |
| S/No. | Name of Stations | Z (MK) | ф | β |
|---|---|---|---|---|
| 1 | Ulaanbaatar | 0.71 | −0.53 | 0.63 |
| 2 | Erdenet | 0.13 | −0.41 | 0.28 |
| 3 | Tsetserleg | 0.26 | −0.49 | 0.13 |
| 4 | Murun | 2.45 ** | 0.25 | 1.21 * |
| 5 | Sukhbaatar | 1.06 * | −0.03 | 0.62 |
| 6 | Average | 0.68 | −0.28 | 0.31 |
| S/No. | Name of Stations | Z (MK) | ф | β |
|---|---|---|---|---|
| 1 | Ulaanbaatar | 5.88 *** | −54.55 *** | 0.05 |
| 2 | Erdenet | 3.87 *** | 8.39 ** | 0.03 |
| 3 | Tsetserleg | 4.38 *** | 7.26 | 0.04 |
| 4 | Murun | 4.77 *** | −47.56 | 0.06 |
| 5 | Sukhbaatar | 2.85 ** | 7.13 *** | 0.02 |
| 6 | Average | 4.71 *** | 18.66 *** | 0.04 |
| S/No. | Name of Stations | Z (MK) | ф | β |
|---|---|---|---|---|
| 1 | Ulaanbaatar | −3.32 *** | −5.63 | −144.12 |
| 2 | Erdenet | 0.00 | −0.96 | 4.46 |
| 3 | Tsetserleg | −3.84 *** | −4.65 | −56.31 |
| 4 | Murun | −1.28 * | −1.01 | −64.15 |
| 5 | Sukhbaatar | −2.05 ** | −2.00 | −550.33 |
| 6 | Average | −2.05 ** | −2.00 | −169.80 |
© 2018 by the authors. Licensee MDPI, Basel, Switzerland. This article is an open access article distributed under the terms and conditions of the Creative Commons Attribution (CC BY) license (http://creativecommons.org/licenses/by/4.0/).
Share and Cite
Dorjsuren, B.; Yan, D.; Wang, H.; Chonokhuu, S.; Enkhbold, A.; Yiran, X.; Girma, A.; Gedefaw, M.; Abiyu, A. Observed Trends of Climate and River Discharge in Mongolia’s Selenga Sub-Basin of the Lake Baikal Basin. Water 2018, 10, 1436. https://0-doi-org.brum.beds.ac.uk/10.3390/w10101436
Dorjsuren B, Yan D, Wang H, Chonokhuu S, Enkhbold A, Yiran X, Girma A, Gedefaw M, Abiyu A. Observed Trends of Climate and River Discharge in Mongolia’s Selenga Sub-Basin of the Lake Baikal Basin. Water. 2018; 10(10):1436. https://0-doi-org.brum.beds.ac.uk/10.3390/w10101436
Chicago/Turabian StyleDorjsuren, Batsuren, Denghua Yan, Hao Wang, Sonomdagva Chonokhuu, Altanbold Enkhbold, Xu Yiran, Abel Girma, Mohammed Gedefaw, and Asaminew Abiyu. 2018. "Observed Trends of Climate and River Discharge in Mongolia’s Selenga Sub-Basin of the Lake Baikal Basin" Water 10, no. 10: 1436. https://0-doi-org.brum.beds.ac.uk/10.3390/w10101436