Water Environment Variation in the Three Gorges Tributary and Its Influencing Factors on Different Scales

1
Key Laboratory of Water Cycle & Related Land Surface Processes, Institute of Geographic Sciences and Natural Resources Research, Chinese Academy of Sciences, 11A, Datun Road, Chaoyang District, Beijing 100101, China
2
University of Chinese Academy of Sciences, Beijing 100049, China
3
Yangtze Valley Water Environment Monitoring Center, No. 13 Yongqing Branch Road, Jiangan District, Wuhan 430010, China
4
State Key Laboratory of Water Resources and Hydropower Engineering Science, Wuhan University, No. 8 Donghu South Road, Wuhan 430072, China
*
Authors to whom correspondence should be addressed.
Water 2018, 10(12), 1831; https://0-doi-org.brum.beds.ac.uk/10.3390/w10121831
Submission received: 24 September 2018
/
Revised: 23 November 2018
/
Accepted: 7 December 2018
/
Published: 12 December 2018
(This article belongs to the Special Issue Climate-Water-Ecosystem-Interaction)
Abstract
:Long River is a small tributary typical of the Three Gorges Reservoir. In order to clarify the influence of hydro-meteorological factors and human regulation of the reservoir water level on the water environment, we monitored water environment parameters at six sites along Long River for three years, and were able to assess the degree to which variation in the water environment was affected from the micro-scale to macro-scale processes. We found that the water environment parameters have obvious seasonal variation and spatial distribution patterns. From upstream to the estuary, the influence of the backwater was gradually enhanced, whereas the influence of inflow gradually weakened. The distance coefficient between the samples in the backwater area and control sites in the upstream and the Yangtze River had a significant longitudinal gradient pattern (ANOVA, p < 0.05). Through redundancy analysis (RDA) forward selection, we found that cumulative precipitation, water level, cumulative net radiation, daily average temperature, daily net radiation, and daily precipitation all had significant influences on the water environment of the Long River (global permutation test, p < 0.05). The perennial backwater area was mostly affected by water level fluctuations (explaining 39.9% of data variation), whereas the fluctuation backwater area and the upstream inflow area were most affected by cumulative precipitation (explaining 42.9% and 44.0% of data variation, respectively). On the macroscale, the contribution rate of monthly change to the variation of water environment variables reached 54.9%, and the contribution rate of geographical change to the variation of water environment variables was only 7.2%, indicating that the water environment of Long River was mainly affected by exogenous input factors driven by the monsoon climate. Furthermore, we showed that the spatial interpolation method combined with the distance coefficient can easily and efficiently describe the complicated dynamic influences of the upstream inflow and the Yangtze River backwater on the water environment in the Long River bay. The conclusions are helpful in explaining the driving mechanisms of the water environment in the tributaries of the Three Gorges Reservoir, which can provide reference for water environmental protection and management in the Three Gorges Reservoir.
1. Introduction
The operation of the Three Gorges Project (TGR) has produced tremendous social and economic benefits [1,2]. However, the construction of the dam has also had a number of ecological effects, changing the water area of TGR from the original natural river to a canyon-type reservoir. As a result, the natural eco-hydrological rhythm of the river has been changed as well. Humans now manually control the water level, which has become an important factor affecting the water environment of the TGR [3]. The impounding of the reservoir itself has had significant negative effects on the water environment. The most prominent problem is the deterioration of water quality in the tributaries and the bay, as well as consequent eutrophication and water blooms [1,4], all of which have attracted widespread concern.
In order to study the influence of the TGR on the aquatic ecosystems of Yangtze River (YR) and tributaries, and to address or prevent the ecological problems that may arise from the changes in water quality, researchers have studied the water environment characteristics [5,6,7], eutrophication status [8,9], and water bloom laws of the main stream, tributaries, and bays [10,11]. They have analyzed and estimated the nutritive salt sources of the TGR [12,13], and performed in-situ monitoring and dynamic simulations of the complicated hydrology and water quality [14,15], which all provided support for the environmental protection of the TGR. This previous research mainly focused on the larger tributaries, such as the Xiangxi River [16,17], Shennong River [18], Daning River [19], and Xiaojiang River [20], all in the middle and lower reaches of the reservoir. These studies focused on eutrophication, water blooms, or heavy metals and toxic organic substances related to the safety of drinking water [21,22], However, they lacked quantitative analysis of the influence of natural hydrological rhythms and regulating water levels on the water environment, as well as temporal and spatial variation in the water environment of the various tributaries, such as the Long River (LR).
The LR is located at the tail of the 145 m backwater area of the TGR, which is featured in short backwater distance, but it has all the characteristics affected by the YR backwater and even more typical than other big tributaries. Because of its small storage capacity, the LR responds quickly to external influences and reflected more significantly after being affected. It is therefore an ideal environment in which to examine the effects of the TGR on aquatic ecosystem ecology and hydrology.
In this study, we investigated the key factors affecting the water environment of the LR in order to clarify the mechanisms and degree of influence that variation in the hydrology and management of the TGR has on its tributaries. This study will improve our understanding of the eco-hydrology of these river-reservoir systems and provide information for the environmental protection and management in the tributaries of the TGR.
2. Materials and Methods
2.1. Research Area and Sampling Sites
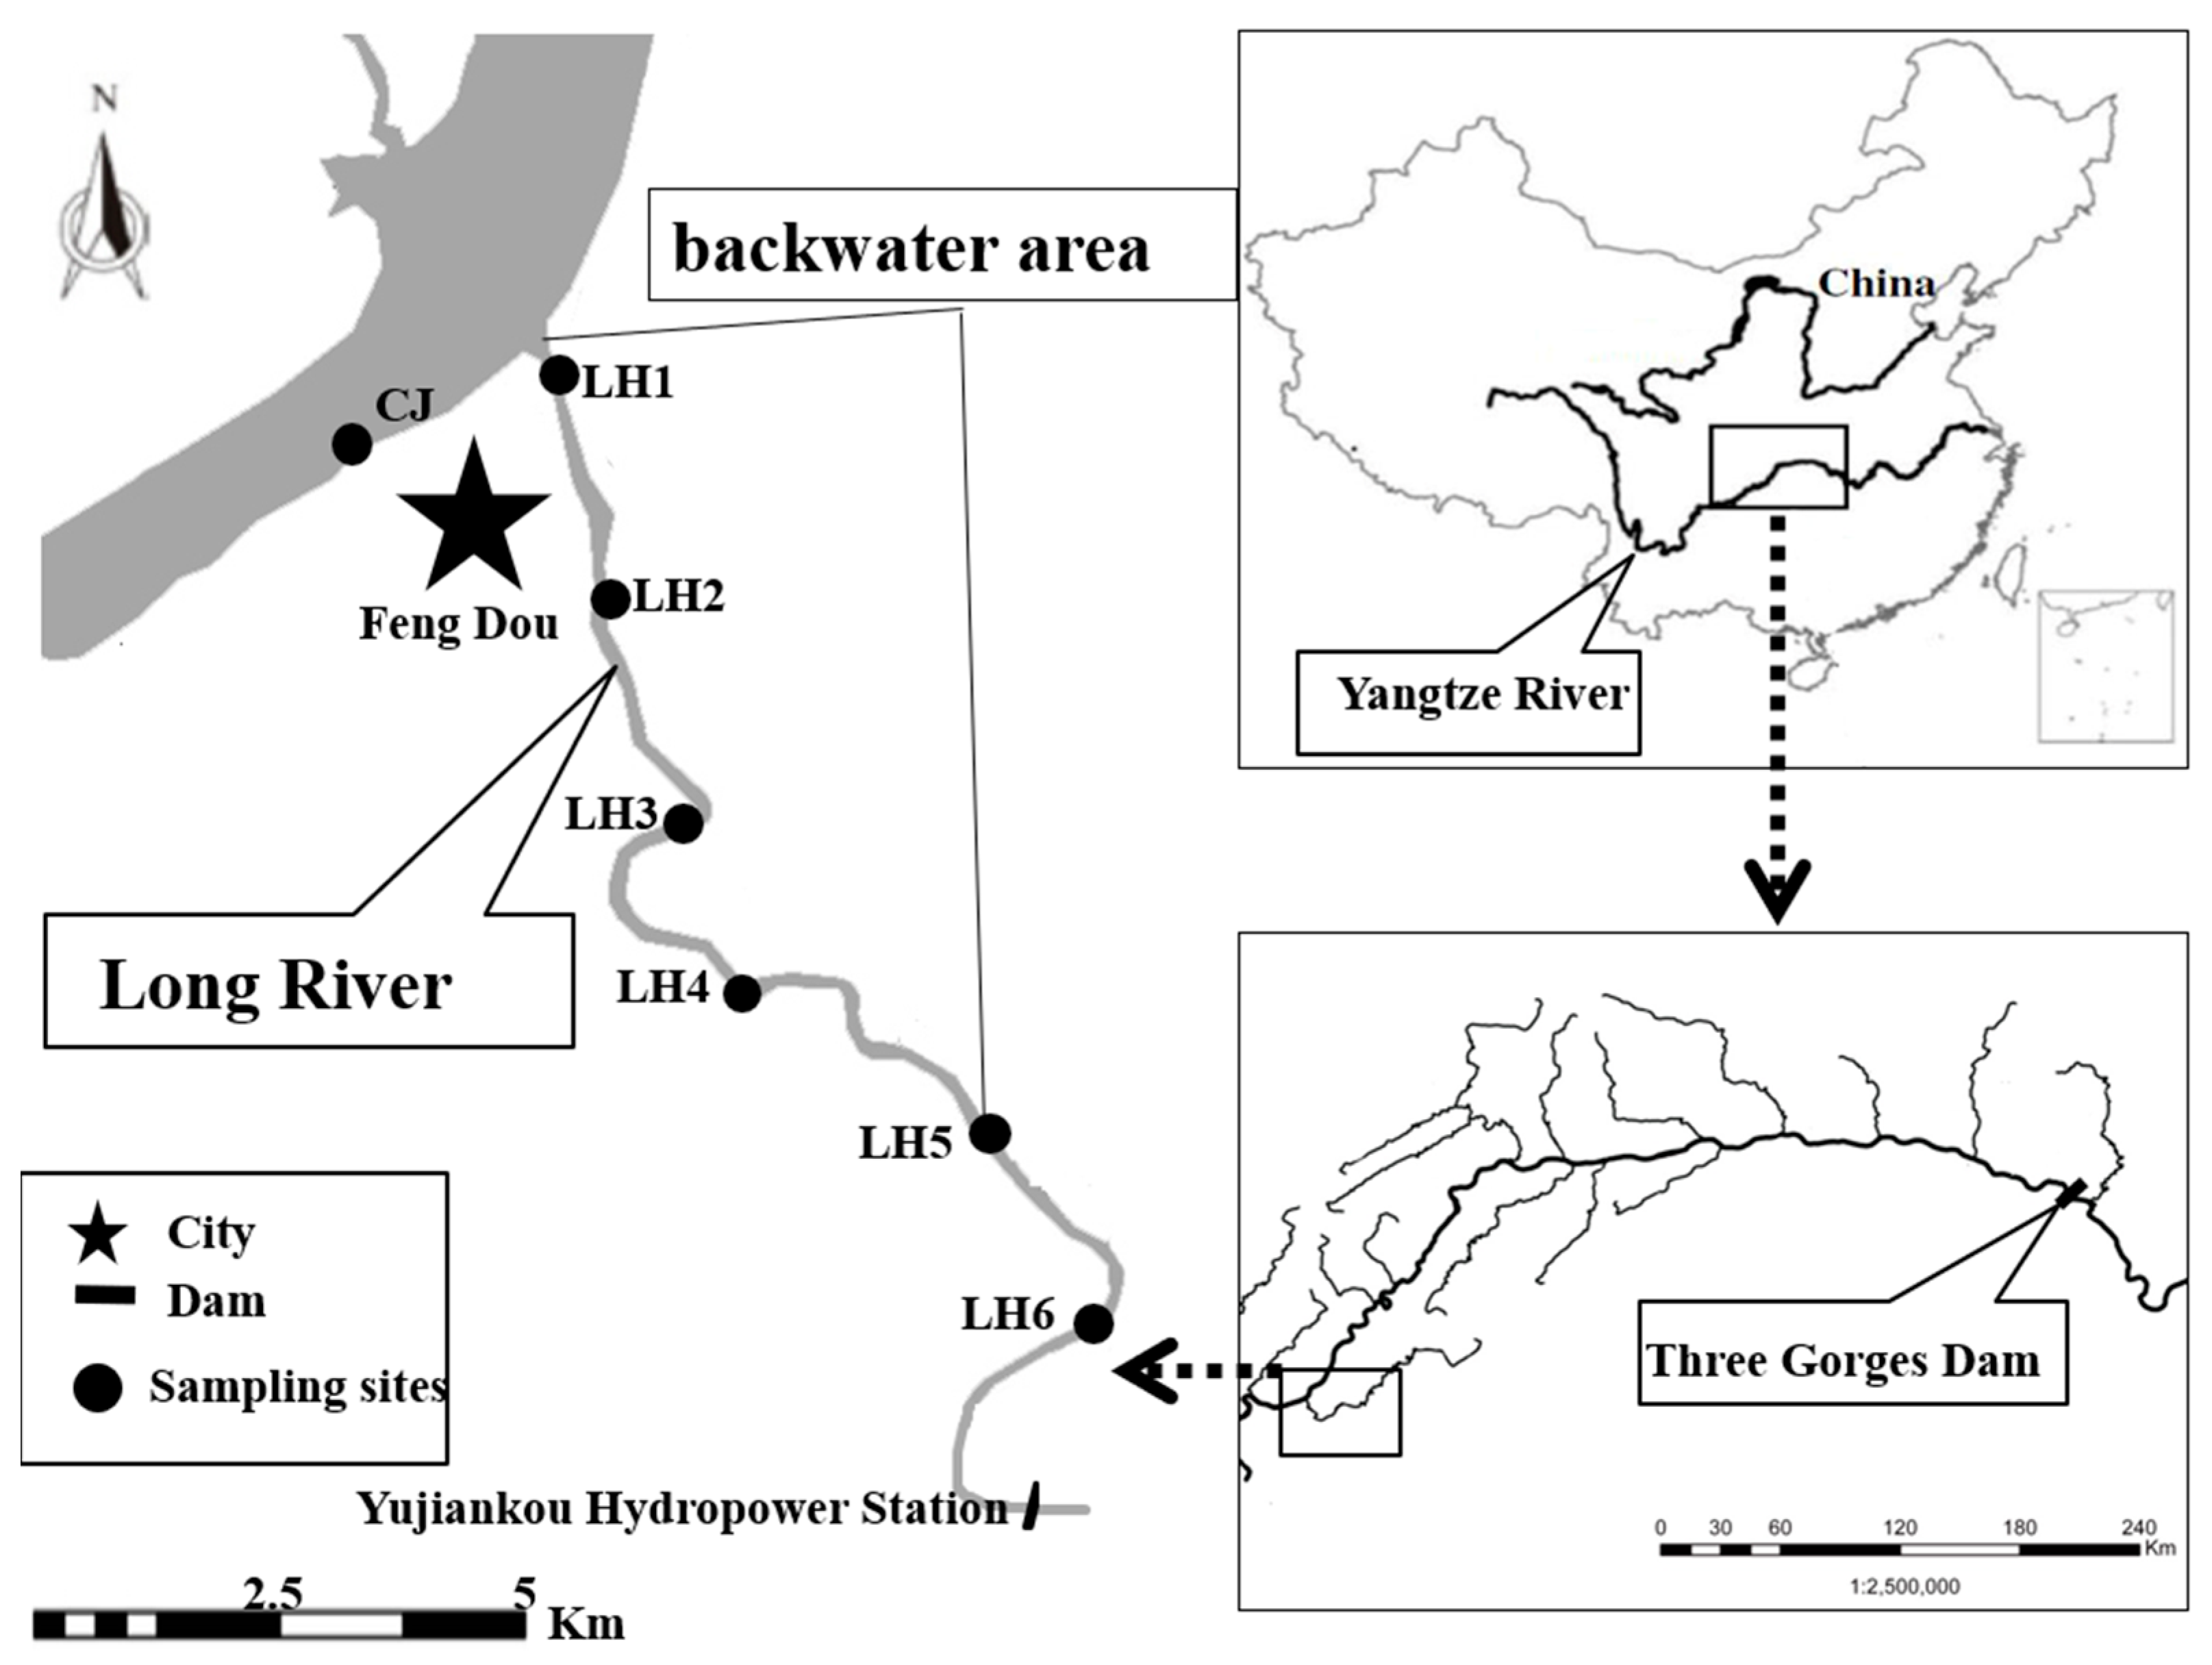
Long River Bay (LRB) is located in Fengdou County, Chongqing, China. The Long River estuary (LRE), which is 429 km away from the Three Gorges Dam, is located at the end zone of the lowest operating water level (145 m). When the reservoir is at its highest water level (175 m), the total length of the river backwater is 10 km. The average annual runoff of LR is 58 m3/s.
During the study five sampling sites were set up in the LRB (Figure 1). Sampling sites LH1 and LH2 were directly affected by the YR backwater throughout the year. Site LH3 was located at the end of the backwater area when the reservoir is at its lowest water level (145 m). Site LH4 was located in the 145 m to 175 m fluctuation backwater area. Site LH5 was located at the end of LRB where the backwater reaches when the reservoir is at its highest level (175 m).
In order to analyze the influence of the upstream inflow and the YR backwater on the water environment, two control sites were also established. The first control site, an upstream inflow control site within LR, LH6, was set 3 km upstream from LH5. Another backwater control site, CJ, was set up on YR, 2 km upstream from LRE.
2.2. Sampling and Testing
From January 2013 to December 2015, surface water samples were collected from each sampling site in LR and the YR at the end of each month. A total of 17 parameters were tested from each sample, including water temperature (WT), pH, chroma (CHROM), turbidity (TURB), transparency (TRANS), dissolved oxygen (DO), suspended substance (SS), electrical conductivity (EC), total alkalinity (TA), total phosphorus (TP), soluble orthophosphate (SOP), total nitrogen (TN), nitrate nitrogen (NO3-N), ammonia nitrogen (NH3-N), soluble silicate (SSi), permanganate index (CODMn), and chlorophyll a (Chl.a). WT, pH, TURB, DO, EC, and Chl.a were measured on-site using the YSI-6600v2 multi-parameter tester (Xylem Inc: Yellow Springs, OH, USA). TRANS was measured on-site with a Secchi’s transparency plate, A 2 L water sample was taken back to the laboratory to carry out sample pre-processing and parameter testing according to the Monitoring and Analysis Method in Water and Wastewater (4th Edition) [23]. TN, TP, CODMn, SS, TA, and CHROM were analyzed using unfiltered water samples. The dissolved nutrients such as NH3-N, NO3-N, SOP, and SSi were analyzed using filtered samples (Whatman GF/C, glass microfiber filters, 0.45 μm). Then, TN, TP, NH3-N, NO3-N, SOP, and SSi were measured with spectrophotometric methods, CODMn and TA were measured with the titration method, CHROM was measured by the visual colorimetric method, and SS was measured by the gravimetric method.
Meteorological data came from the day-by-day monitoring data of Fengdou Weather Station bulletined on China Meteorological Data Sharing Website [24]: daily precipitation (DP), daily average temperature (DAT), sunshine duration, wind speed and direction, and humidity. Daily net radiation (DNR) was calculated based on sunshine duration by the Penman-Monteith formula recommended in the Meteorological Drought Rating [25]. Cumulative precipitation (CP) during sampling twice, and cumulative net radiation (CNR) during sampling twice were calculated based on DP and DNR. The daily discharge of Yujiankou Hydropower Station, which is 5 km upstream from LH5, was taken as the inflow for LR. The estuary water level (WL) of the LR came from the Hydrological Yearbook of the People’s Republic of China [26].
2.3. Data Analysis and Drawing
Since there were a large number of potentially co-varying water environment parameters that we investigated, the least representative was first screened out. Among the 17 parameters, only those with a correlation coefficient of r ≥ 0.5 were selected for subsequent analysis. Further, only one parameter from those variables with similar physical and chemical significance was selected for subsequent analysis.
To analyze the influence of inflow and YR backwater on LRB, we took LH6 and CJ as the baseline control points, we adopt a D standardization before the Euclidean distance calculation between the sampling sites in LRB (LH1–LH5) and the control points. We tested for a difference in water chemistry between the controls and the sampling sites using ANOVA. In order to analyze the correlation between water environment variables and hydro-meteorological factors, the forward selection in the software Canoco 5.03 (Microcomputer Power: New York, NY, USA) was used to filter the variables that passed the global permutation test (p < 0.05, n = 999), The variables were transformed, log(x + 1), and then an redundancy analysis (RDA) ordination was performed. In order to analyze the influence of temporal variation and spatial location on the water environment, sampling month and sampling site are included as dummy variables in partial RDA analysis.
The variation figure of distance coefficient between the sampling sites in LRB and the control points of LH6 and CJ were drawn by the software Surfer13.0 (Golden Software: Golden, CA, USA) using the Kriging interpolation method. Other figures were drawn using the software Origin 10.1. Statistical analysis was conducted in the software SPSS 19.0 (International Business Machines Corporation: New York, NY, USA).
3. Results
3.1. Analysis of Hydrometeorological Characteristics
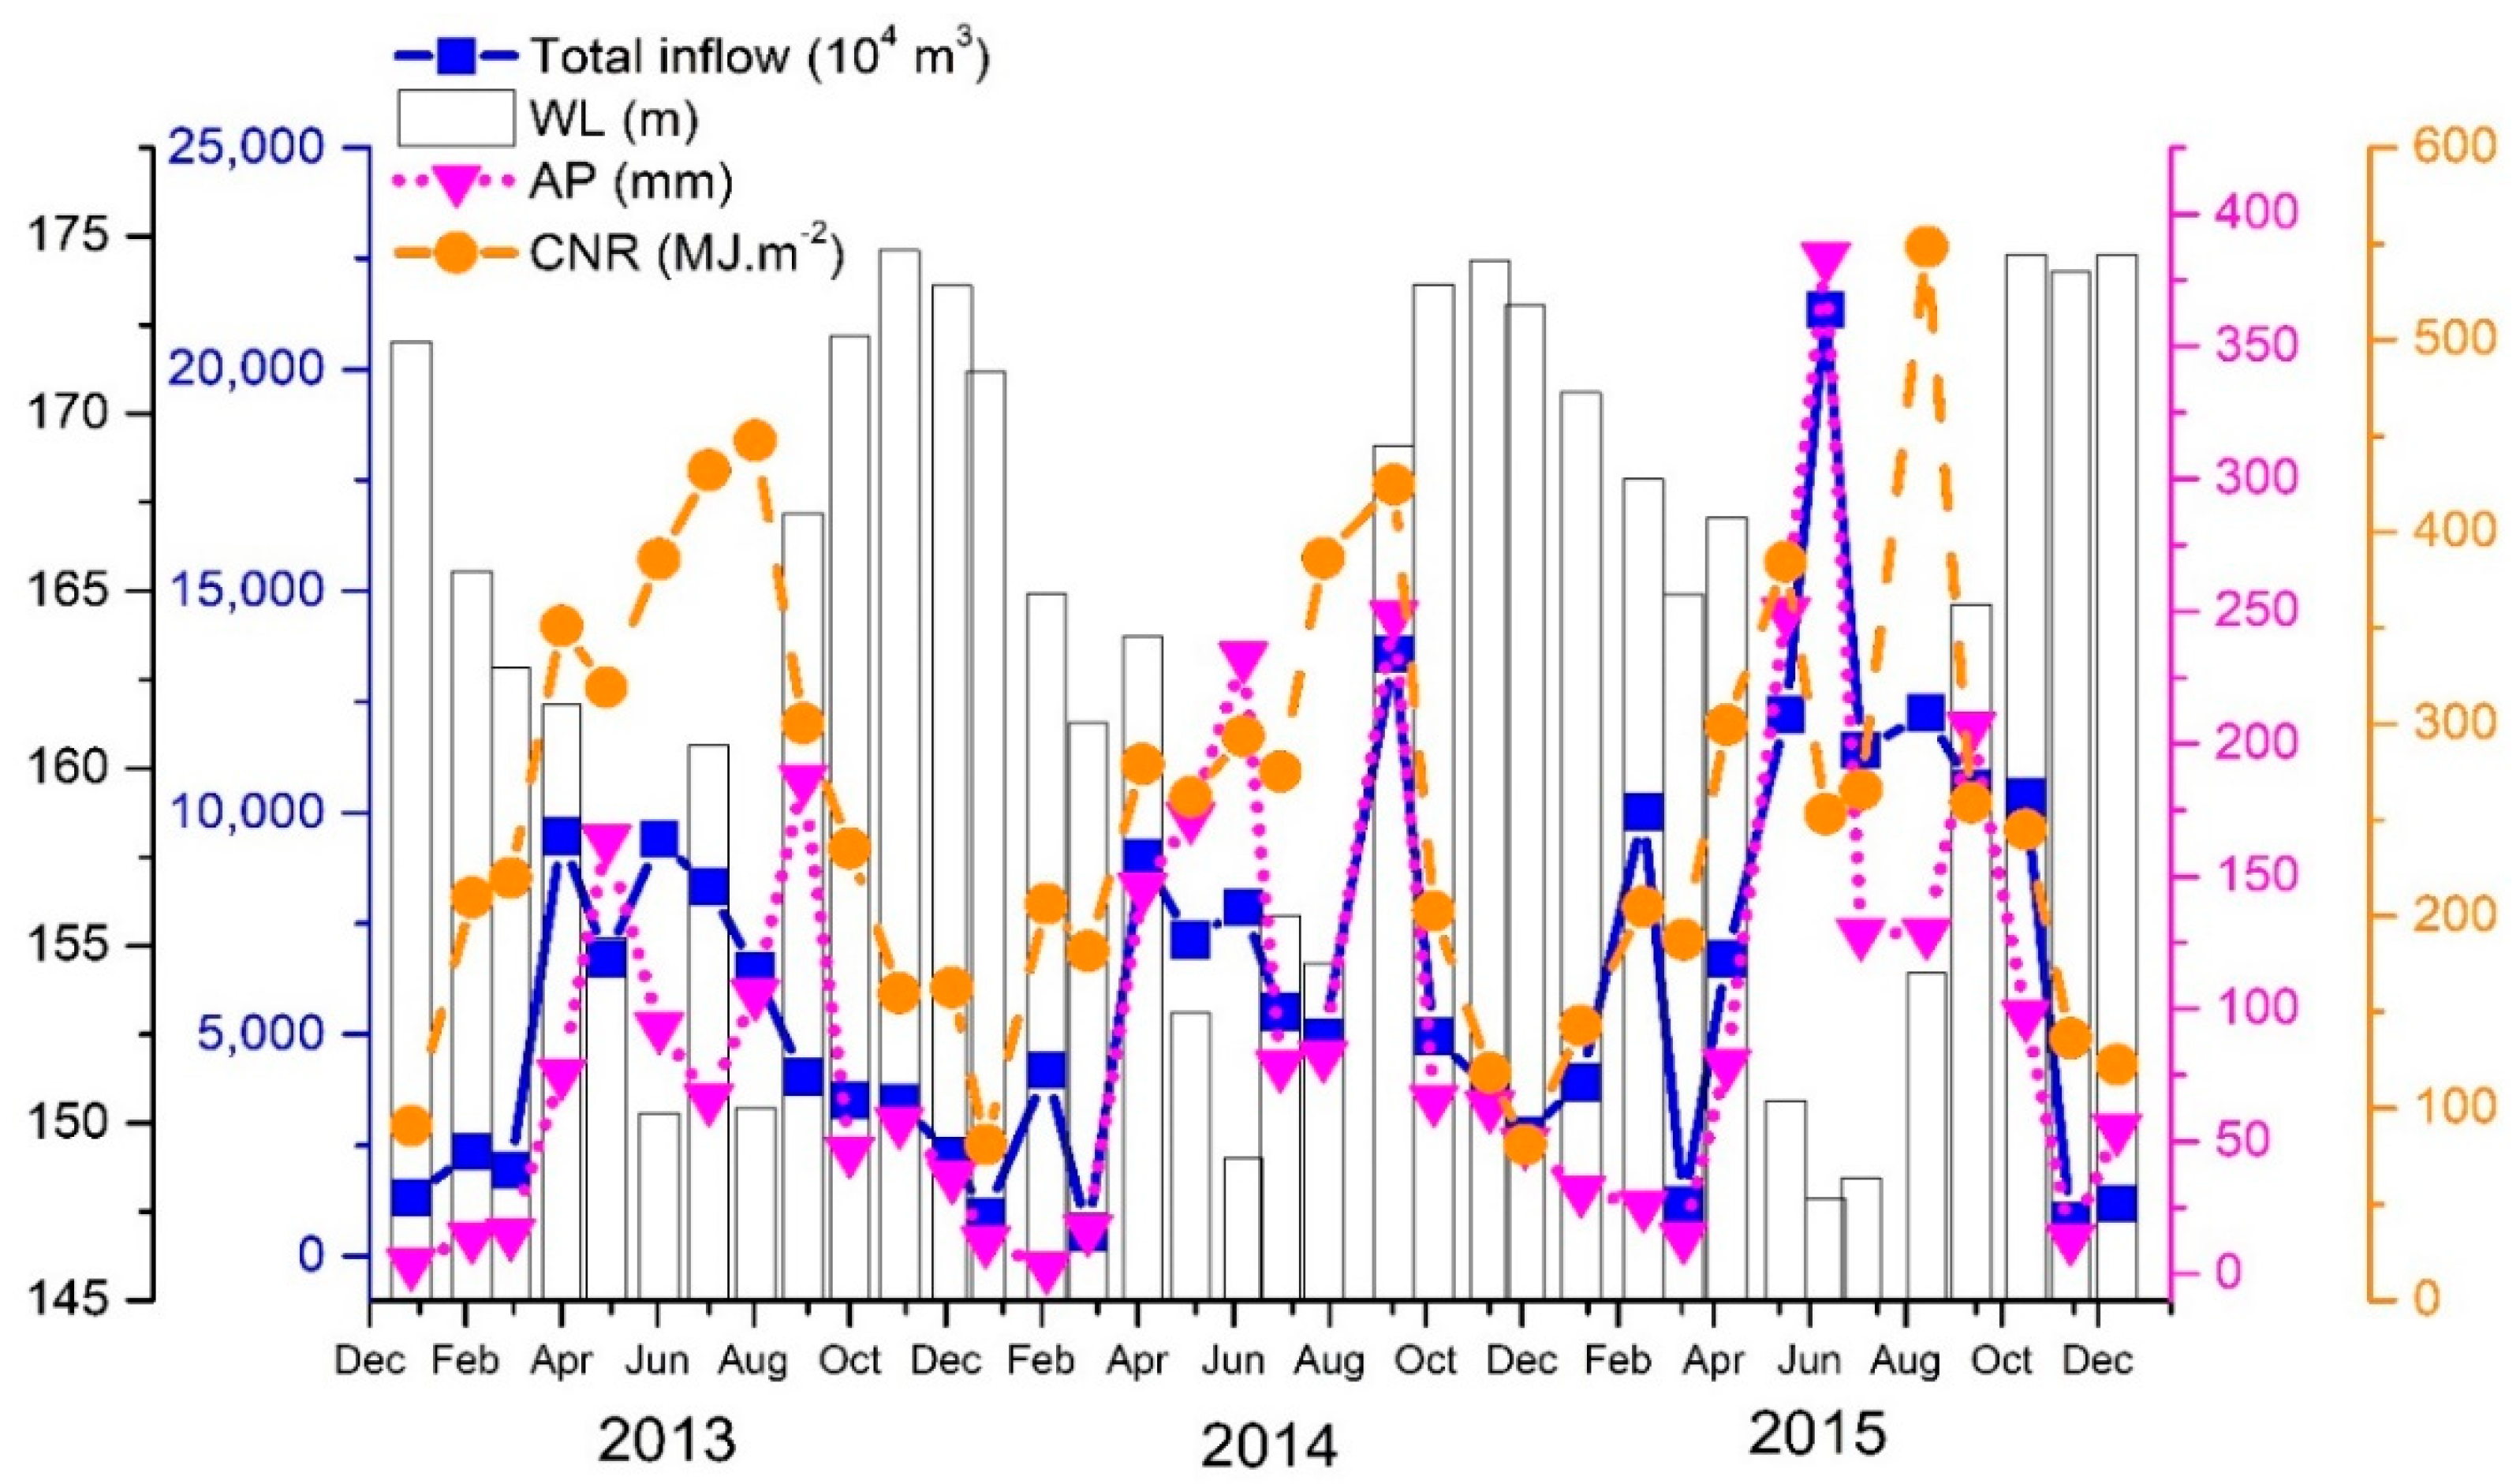
During the study, the meteorological and hydrological factors in the LRB fluctuated on annual cycle (Figure 2). The fluctuations in CP, CNR, and total inflow during sampling were generally consistent across years, showing similar patterns in the same periods of both rainfall and high temperature.
Due to the off-season manual regulation of the TGR [3], fluctuations of WL were opposite to the previous climate parameters. From October to January, the LR was maintained at a high level of around 170 m. The CP, CNR, and total inflow during the same period were all at their lower levels of the year. From February to April, the WL decreased to about 160 m, and the CP, CNR and total inflow increased rapidly. Due to the necessity of flood prevention, the LR is maintained at a low water level of about 150 m from May to August. The CP, CNR, and total inflow reach their peak during these months. After the end of September, the TGR begins to impound water. The WL rises rapidly to 170 m by the end of October, but the CP, CNR, and total inflow gradually decrease over the same period.
3.2. Water Environment Variable Screening
The water environment parameters of LR changed significantly from 2013 to 2015 (Table 1), especially chl.a and TURB. We checked 30 paired correlations between environmental variables of the 17 total tested environment parameters (|r| ≥ 0.3, spearman, Table 2). Of these, the WT was significantly negatively correlated with DO (r = −0.529, p < 0.01) but positively correlated with TURB (r = 0.511, p < 0.01). TRANS was significantly negatively correlated with CHROM (r = −0.685, p < 0.01) and TURB (r = −0.871, p < 0.01). TURB was significantly positively correlated with CHROM and SS (r = 0.684, p < 0.01; r = 0.517, p < 0.01). In addition, there was a significant positive correlation between TP and SOP (r = 0.778, p < 0.01), and a significant positive correlation between TN and NO3-N (r = 0.708, p < 0.01). Seven environmental parameters were removed at this stage, leaving the following 10 parameters: the WT, EC, DO, TA, TURB, TRANS, TN, TP, CODMn, and Chl.a.
3.3. Analysis the Variation of Water Environment Parameters
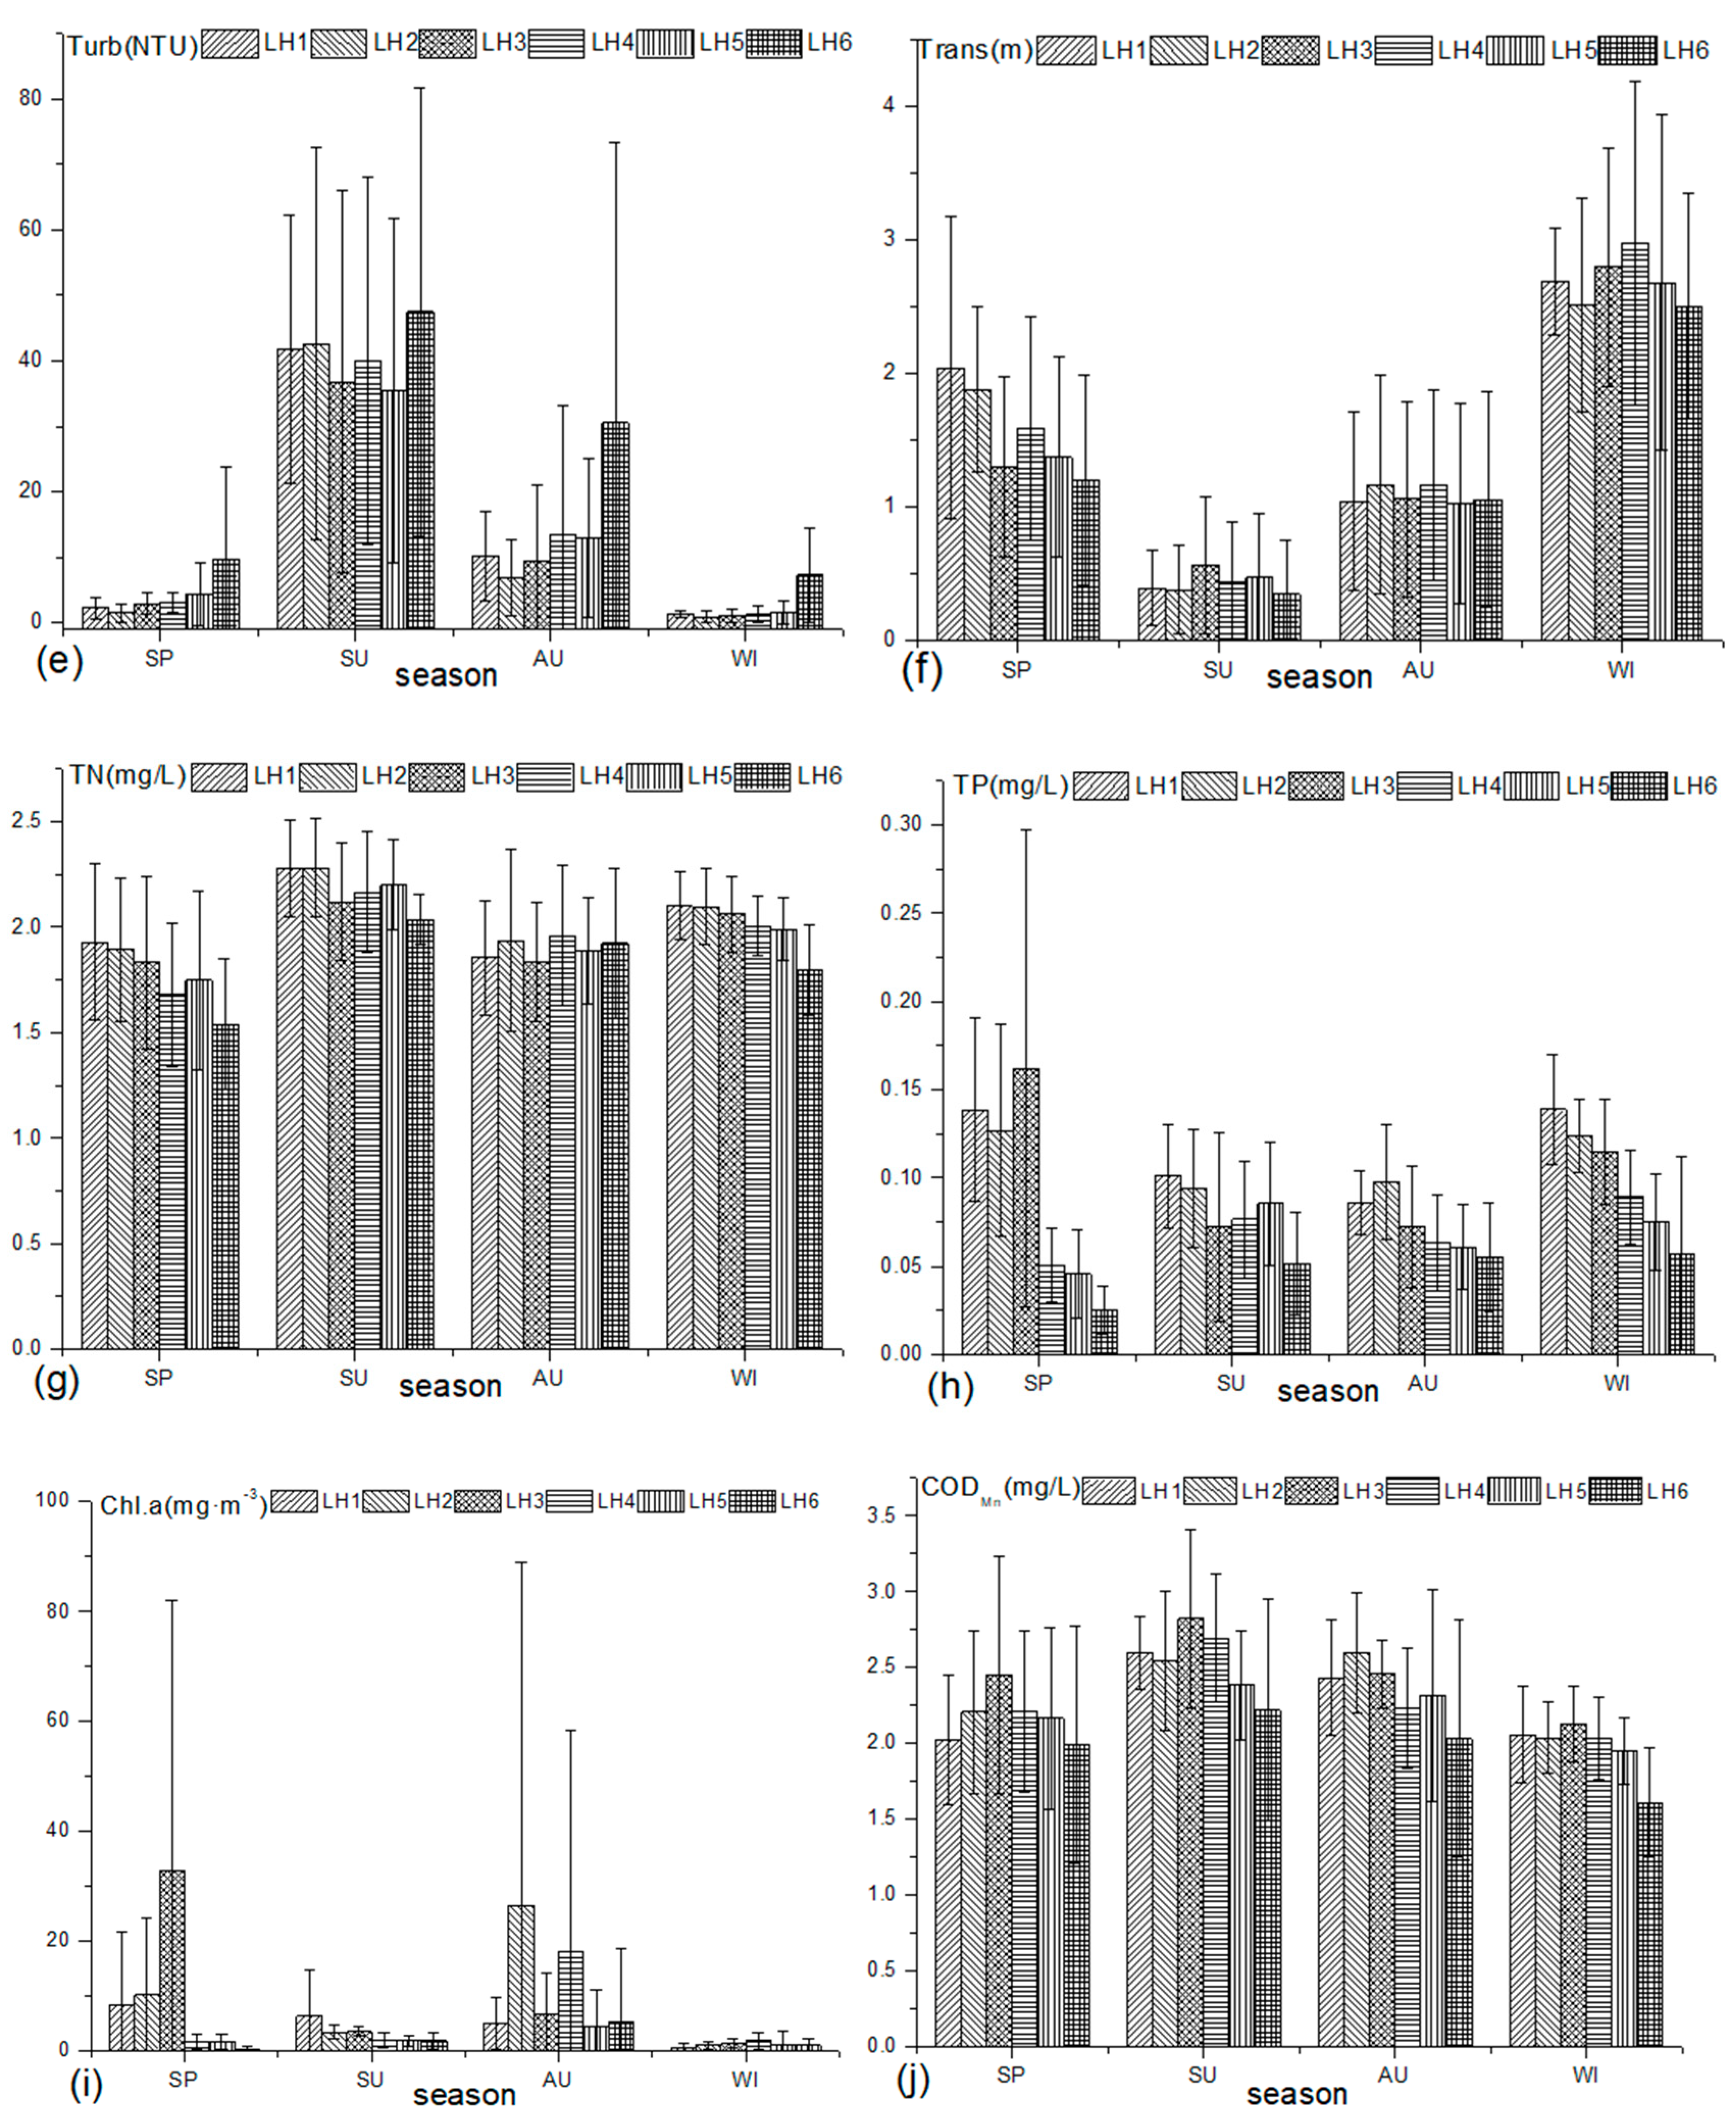
The water environment parameters changed obviously with the seasons. The WT (Figure 3a) was higher in summer and autumn than in winter and spring (ANOVA, p < 0.01). And the WT in summer and autumn represented a trend increasing from upstream to the LRE. The seasonal difference in EC (Figure 3b) were small, but slightly higher in winter and spring than in summer and autumn. The EC of the winter and spring gradually increased from the upstream sites to LRE, while in summer and autumn, EC was higher at the sampling sites at both upstream and downstream sites and low in the middle sampling sites. The DO (Figure 3c) content was high in winter and spring, and low in summer and autumn. The DO concentration in the upstream inflow control site was significantly higher than other sites throughout most of the year. The spatial and temporal distribution characteristics of TA (Figure 3d) were similar to the DO. The summer TURB (Figure 3e) was significantly higher than that of other seasons (ANOVA, p < 0.01). The TURB of the upstream inflow control sites is higher than that of other sampling sites throughout the year. The temporal and spatial variation of TRANS (Figure 3f) was the opposite of TURB. The TN (Figure 3g) concentration in summer was significantly higher than in other seasons. Except for the autumn, the TN concentration from the upstream sites to LRE showed a gradually increasing spatial distribution pattern. The spatial distribution of TP (Figure 3h) was basically consistent with TN, but the values in winter and spring were slightly higher than in summer and autumn. All the spatial distribution patterns of Chl.a (Figure 3i) and CODMn (Figure 3j) were higher in the midstream sampling sites and low in the upstream and downstream sampling sites, Chl.a content in spring and autumn was significantly higher than that in winter and summer (ANOVA, p < 0.01). However, the seasonal difference in CODMn was small.
3.4. Impact Analysis at Different Scales
3.4.1. Inflow and Backwater Effects
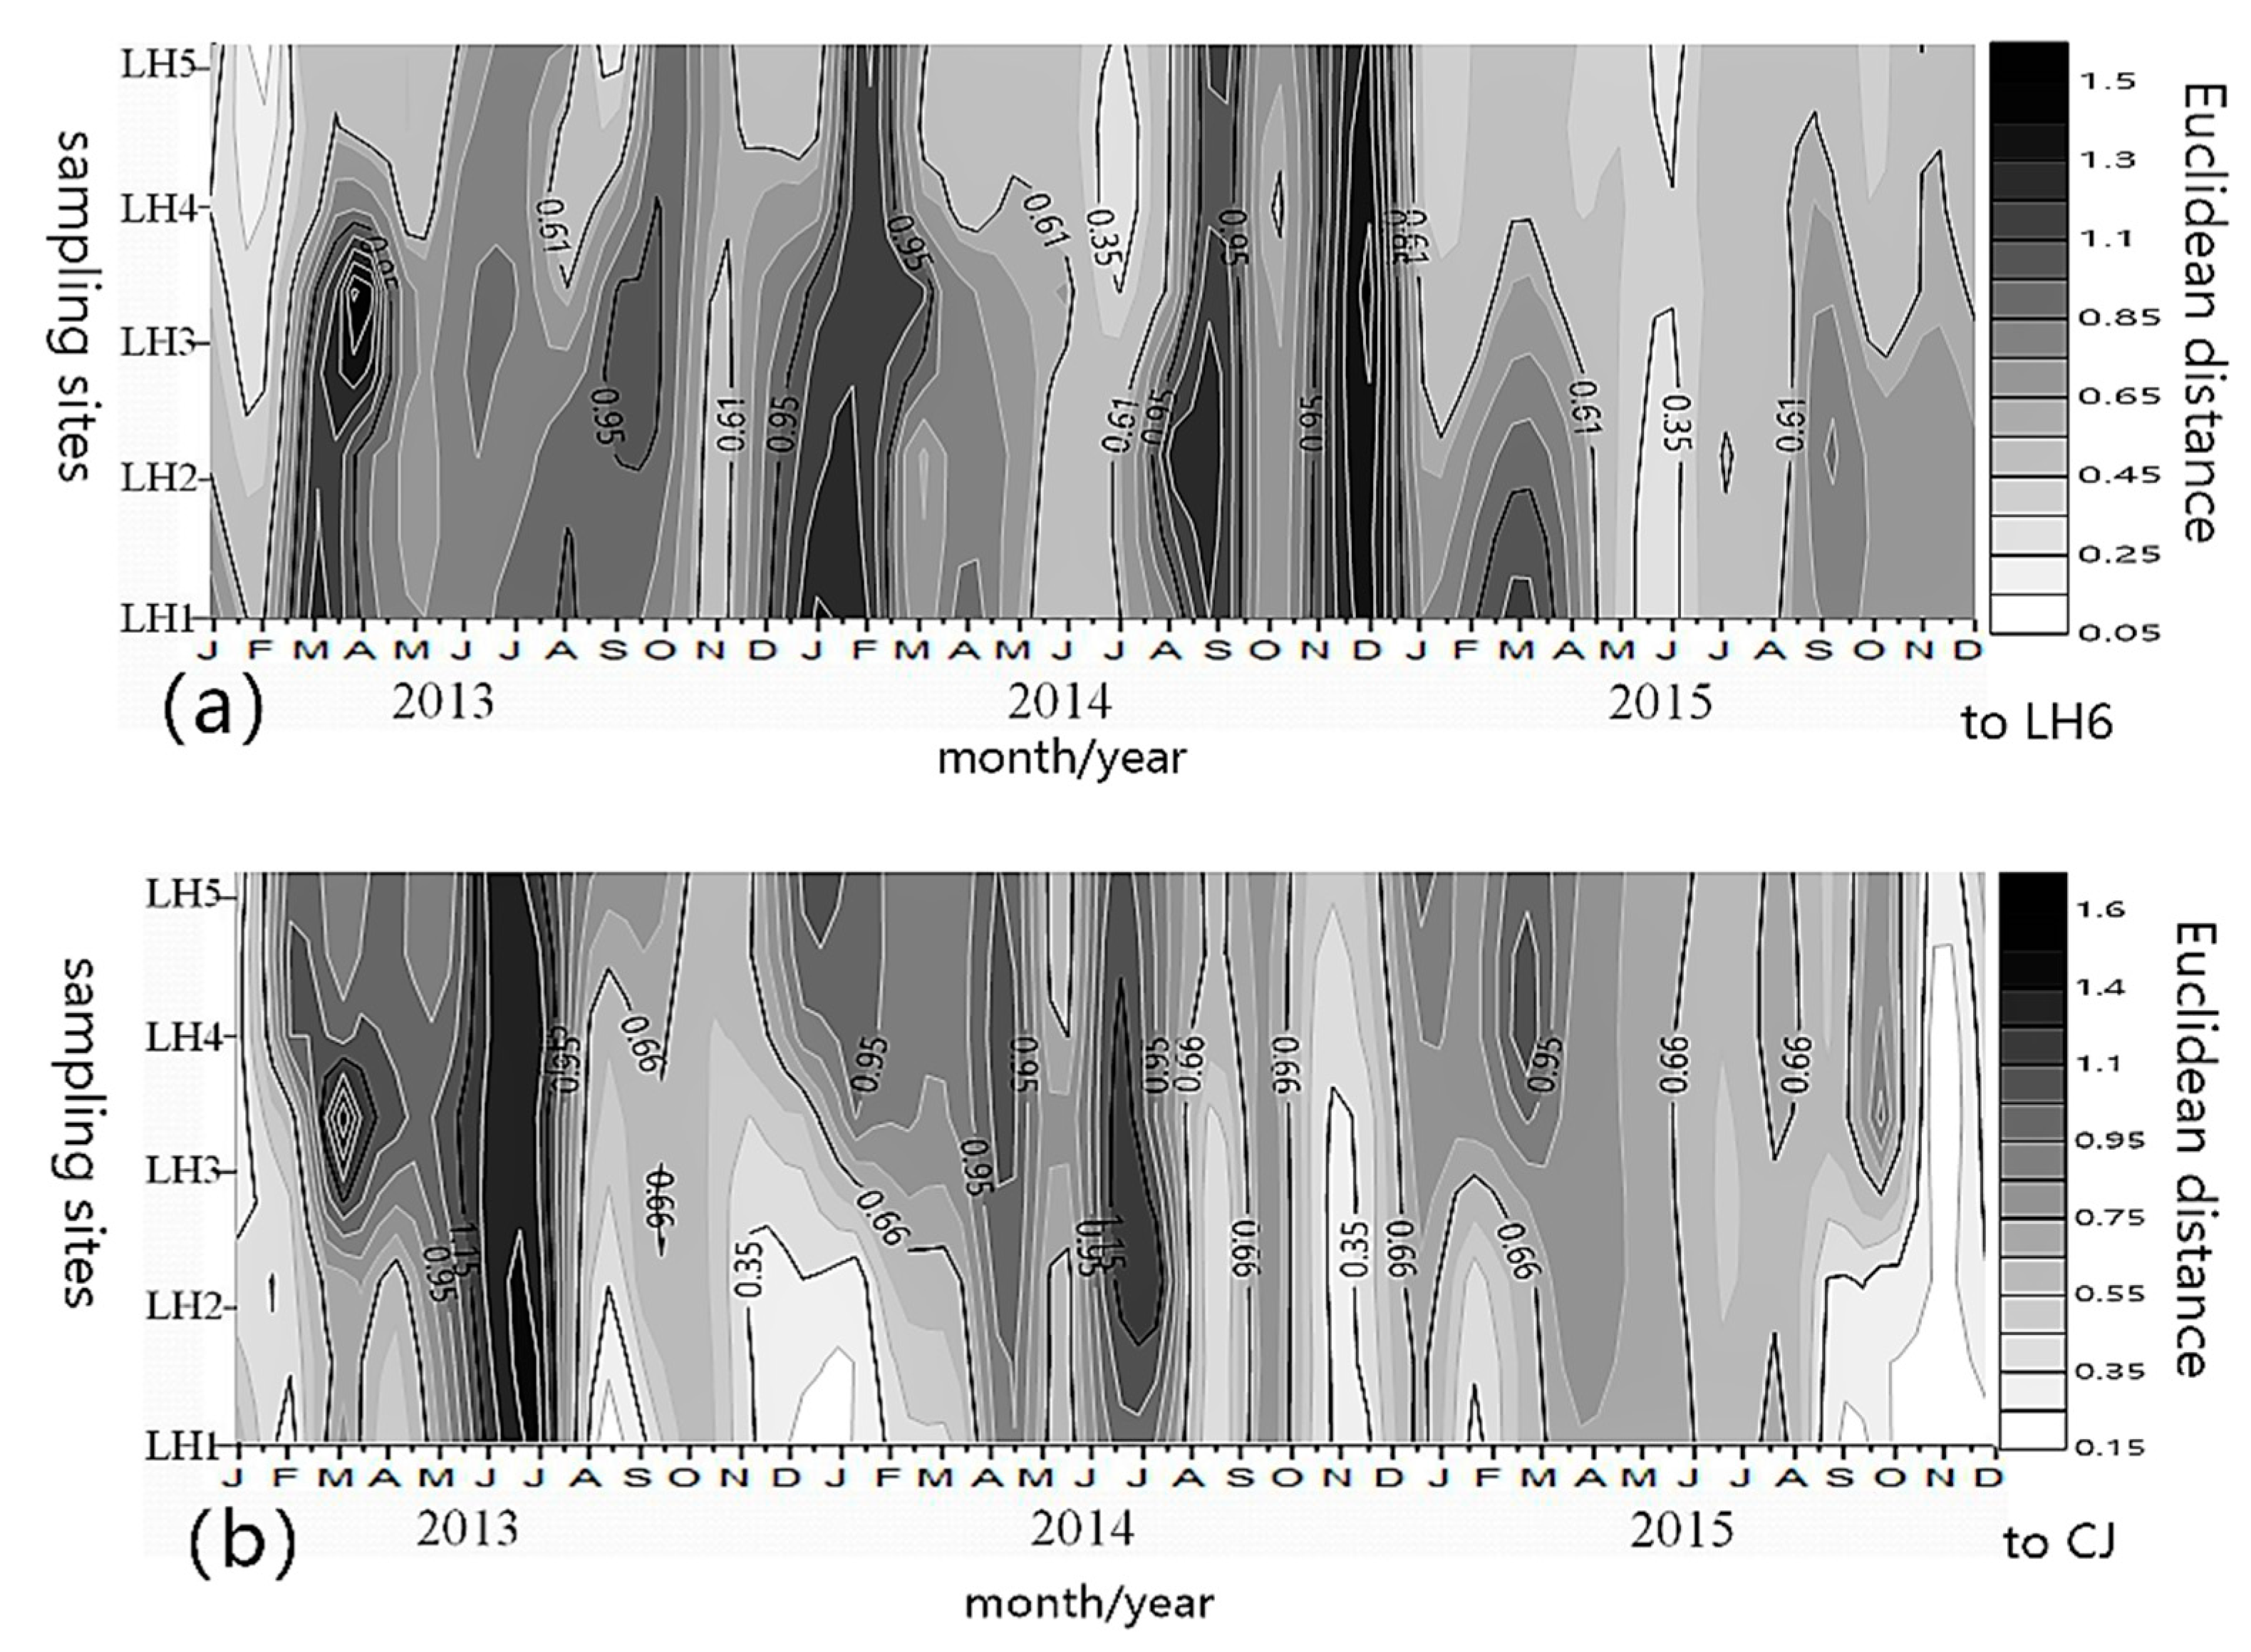
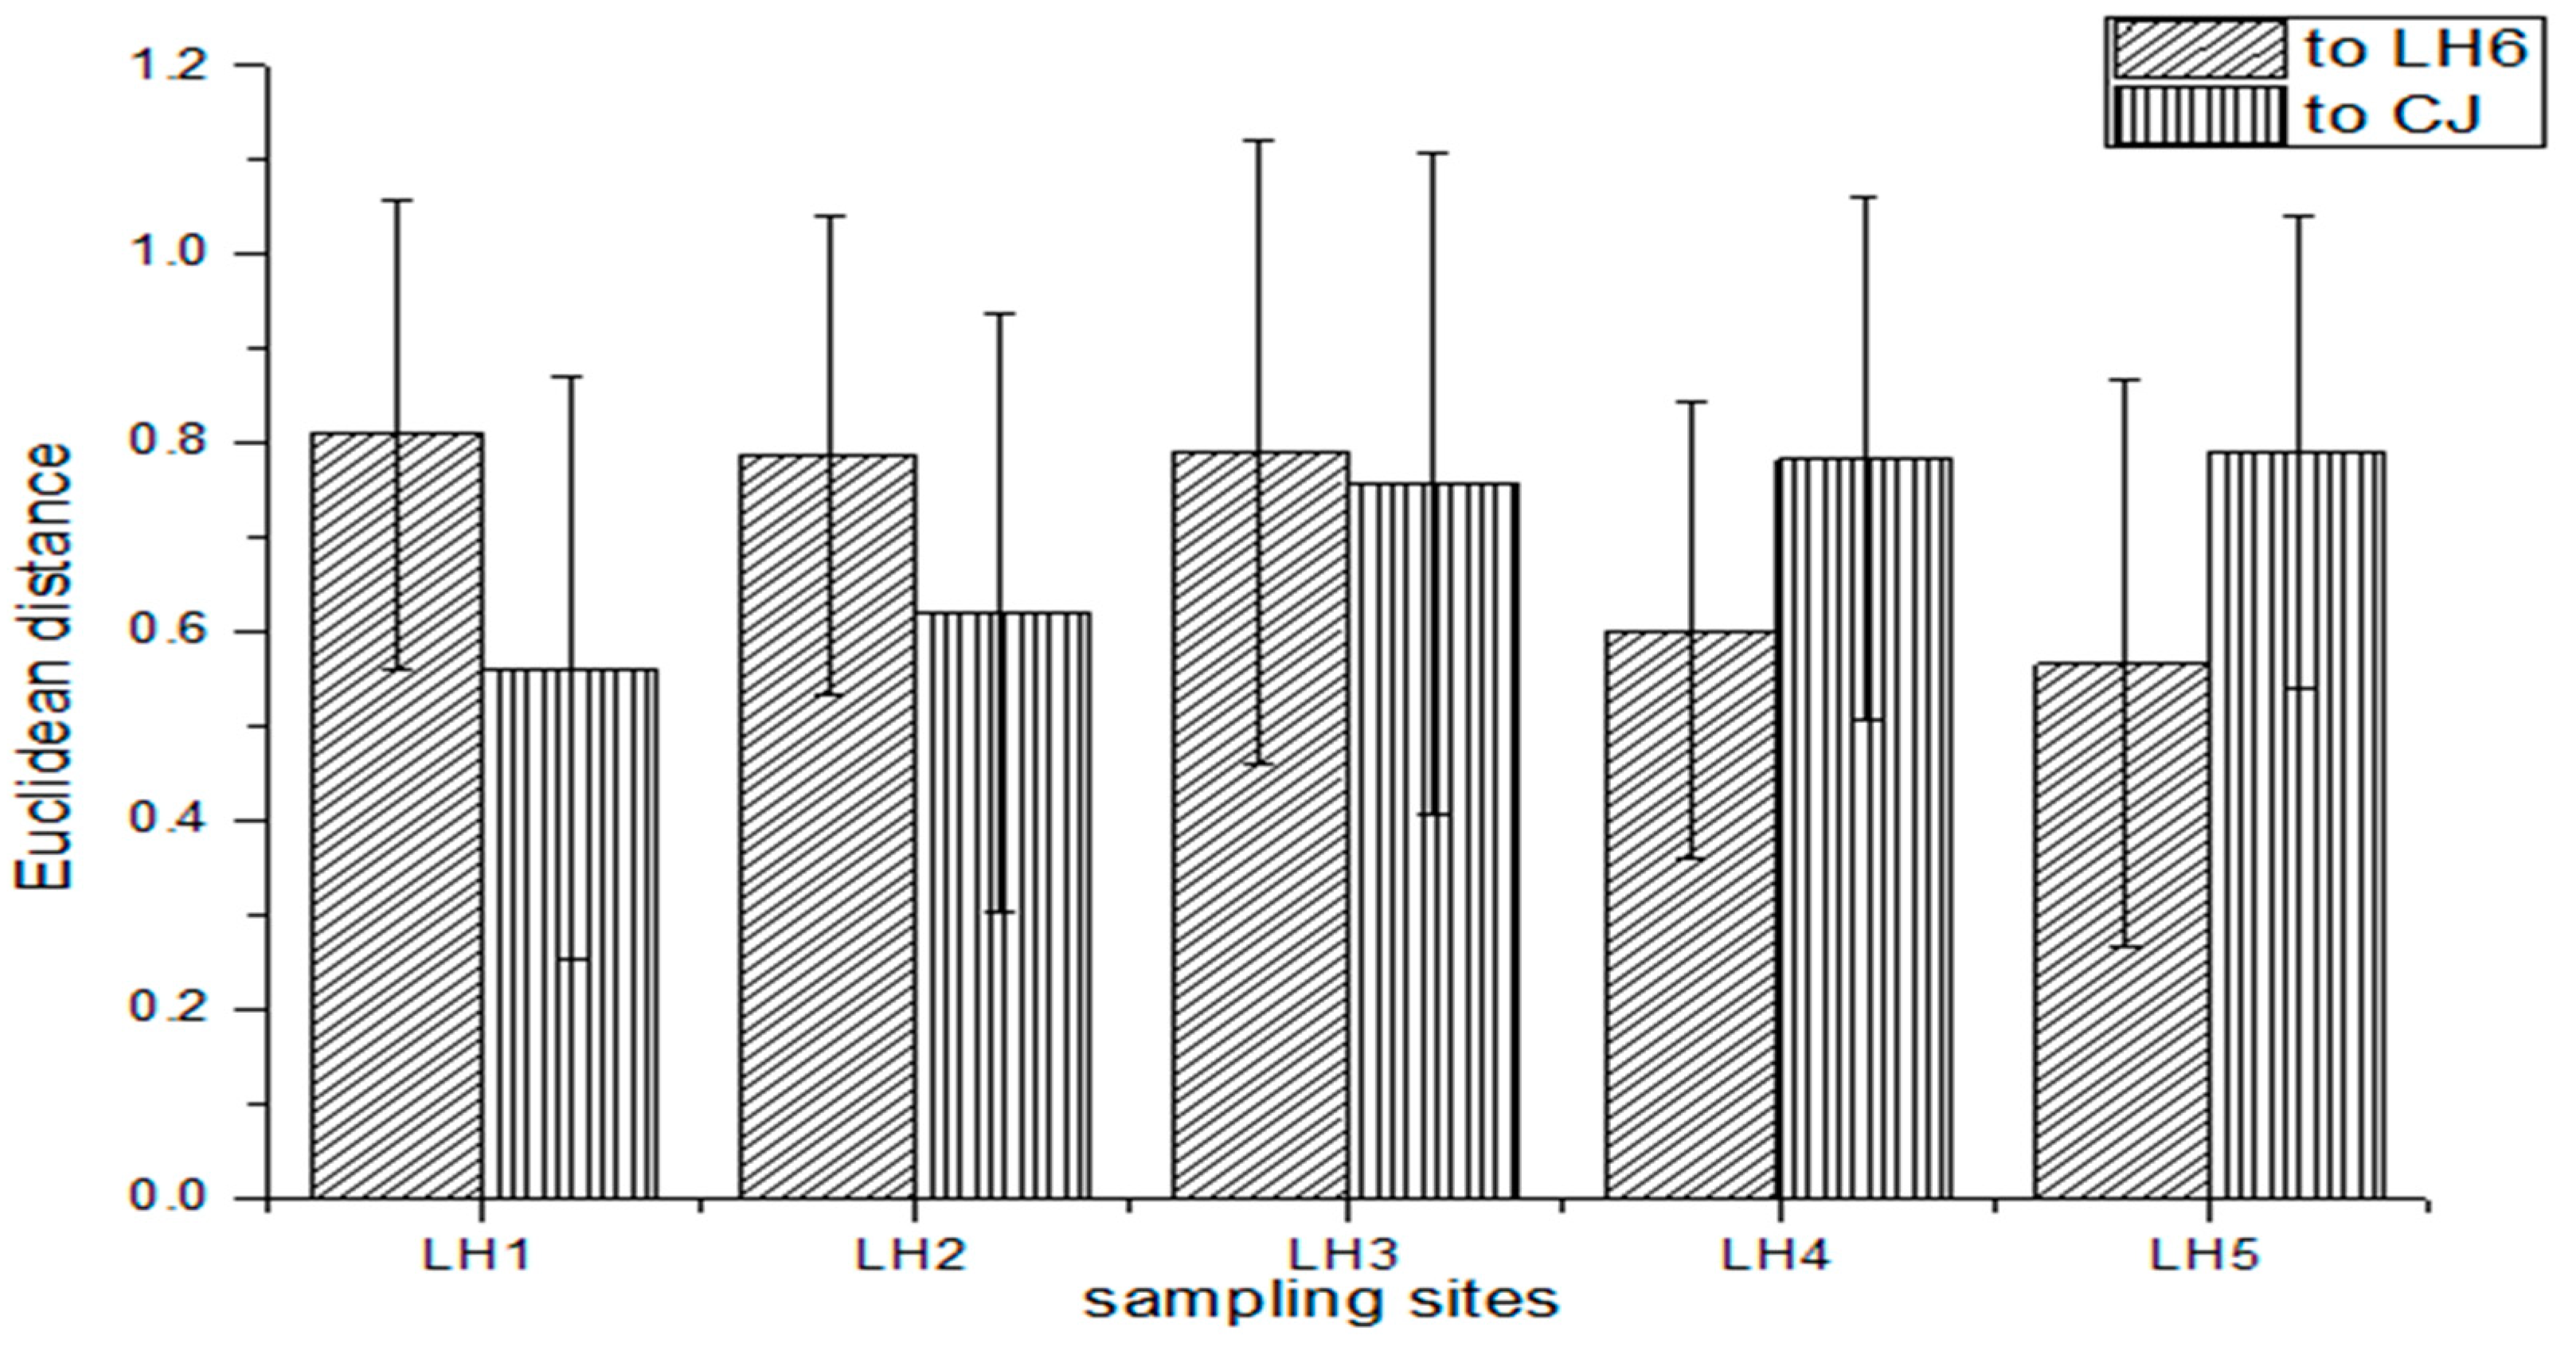
The Euler distance coefficient between the LRB sampling sites and the two control sites, LH6 and CJ, fluctuated with time. The two kinds of distance coefficients were completely opposite in both time and space distribution (Figure 4). Analyzed from the perspective of time, the distance coefficient between each sampling sites in LRB and the LH6 control site was comparatively low from May to August each year, but the distance coefficient with the CJ control site in this same period was comparatively high. For September to February of the next year, the distance coefficient between each sampling sites in LRB and the CJ control site was comparatively low, but the distance coefficient with the LH6 control site was high. Analyzed from the perspective of space, the two distance coefficients showed obvious longitudinal gradient distribution characteristics (Figure 5). As for the distance coefficient between the sampling sites and CJ gradually decreases (ANOVA, F = 4.181, p < 0.01), and the distance coefficient with LH6 gradually increases (ANOVA, F = 6.177, p < 0.01).
3.4.2. Meteo-Hydrological Influences
The results of the RDA forward selection showed that in the perennial backwater area, the four parameters of WL, CP, CNR, and DP had significant effects on the water environment variables (Table 3). The four parameters can explain 55.0% of the environmental variation, among which, the effect of WL was the most prominent, explaining 39.9% of the environmental variation, followed by CP (11.5%). In the fluctuating backwater area, CP, WL, CNR, DNR, and DAT had significant influences on the water environment variables. These five parameters explained 60.1% of the environmental variable variation, here CP was the main contributor, explaining 42.9% of the variation, followed by WL (10.3%). In the upstream inflow area, only one parameter of CP passed the global permutation test, explaining the 44.0% of the variation in the water environment variables.
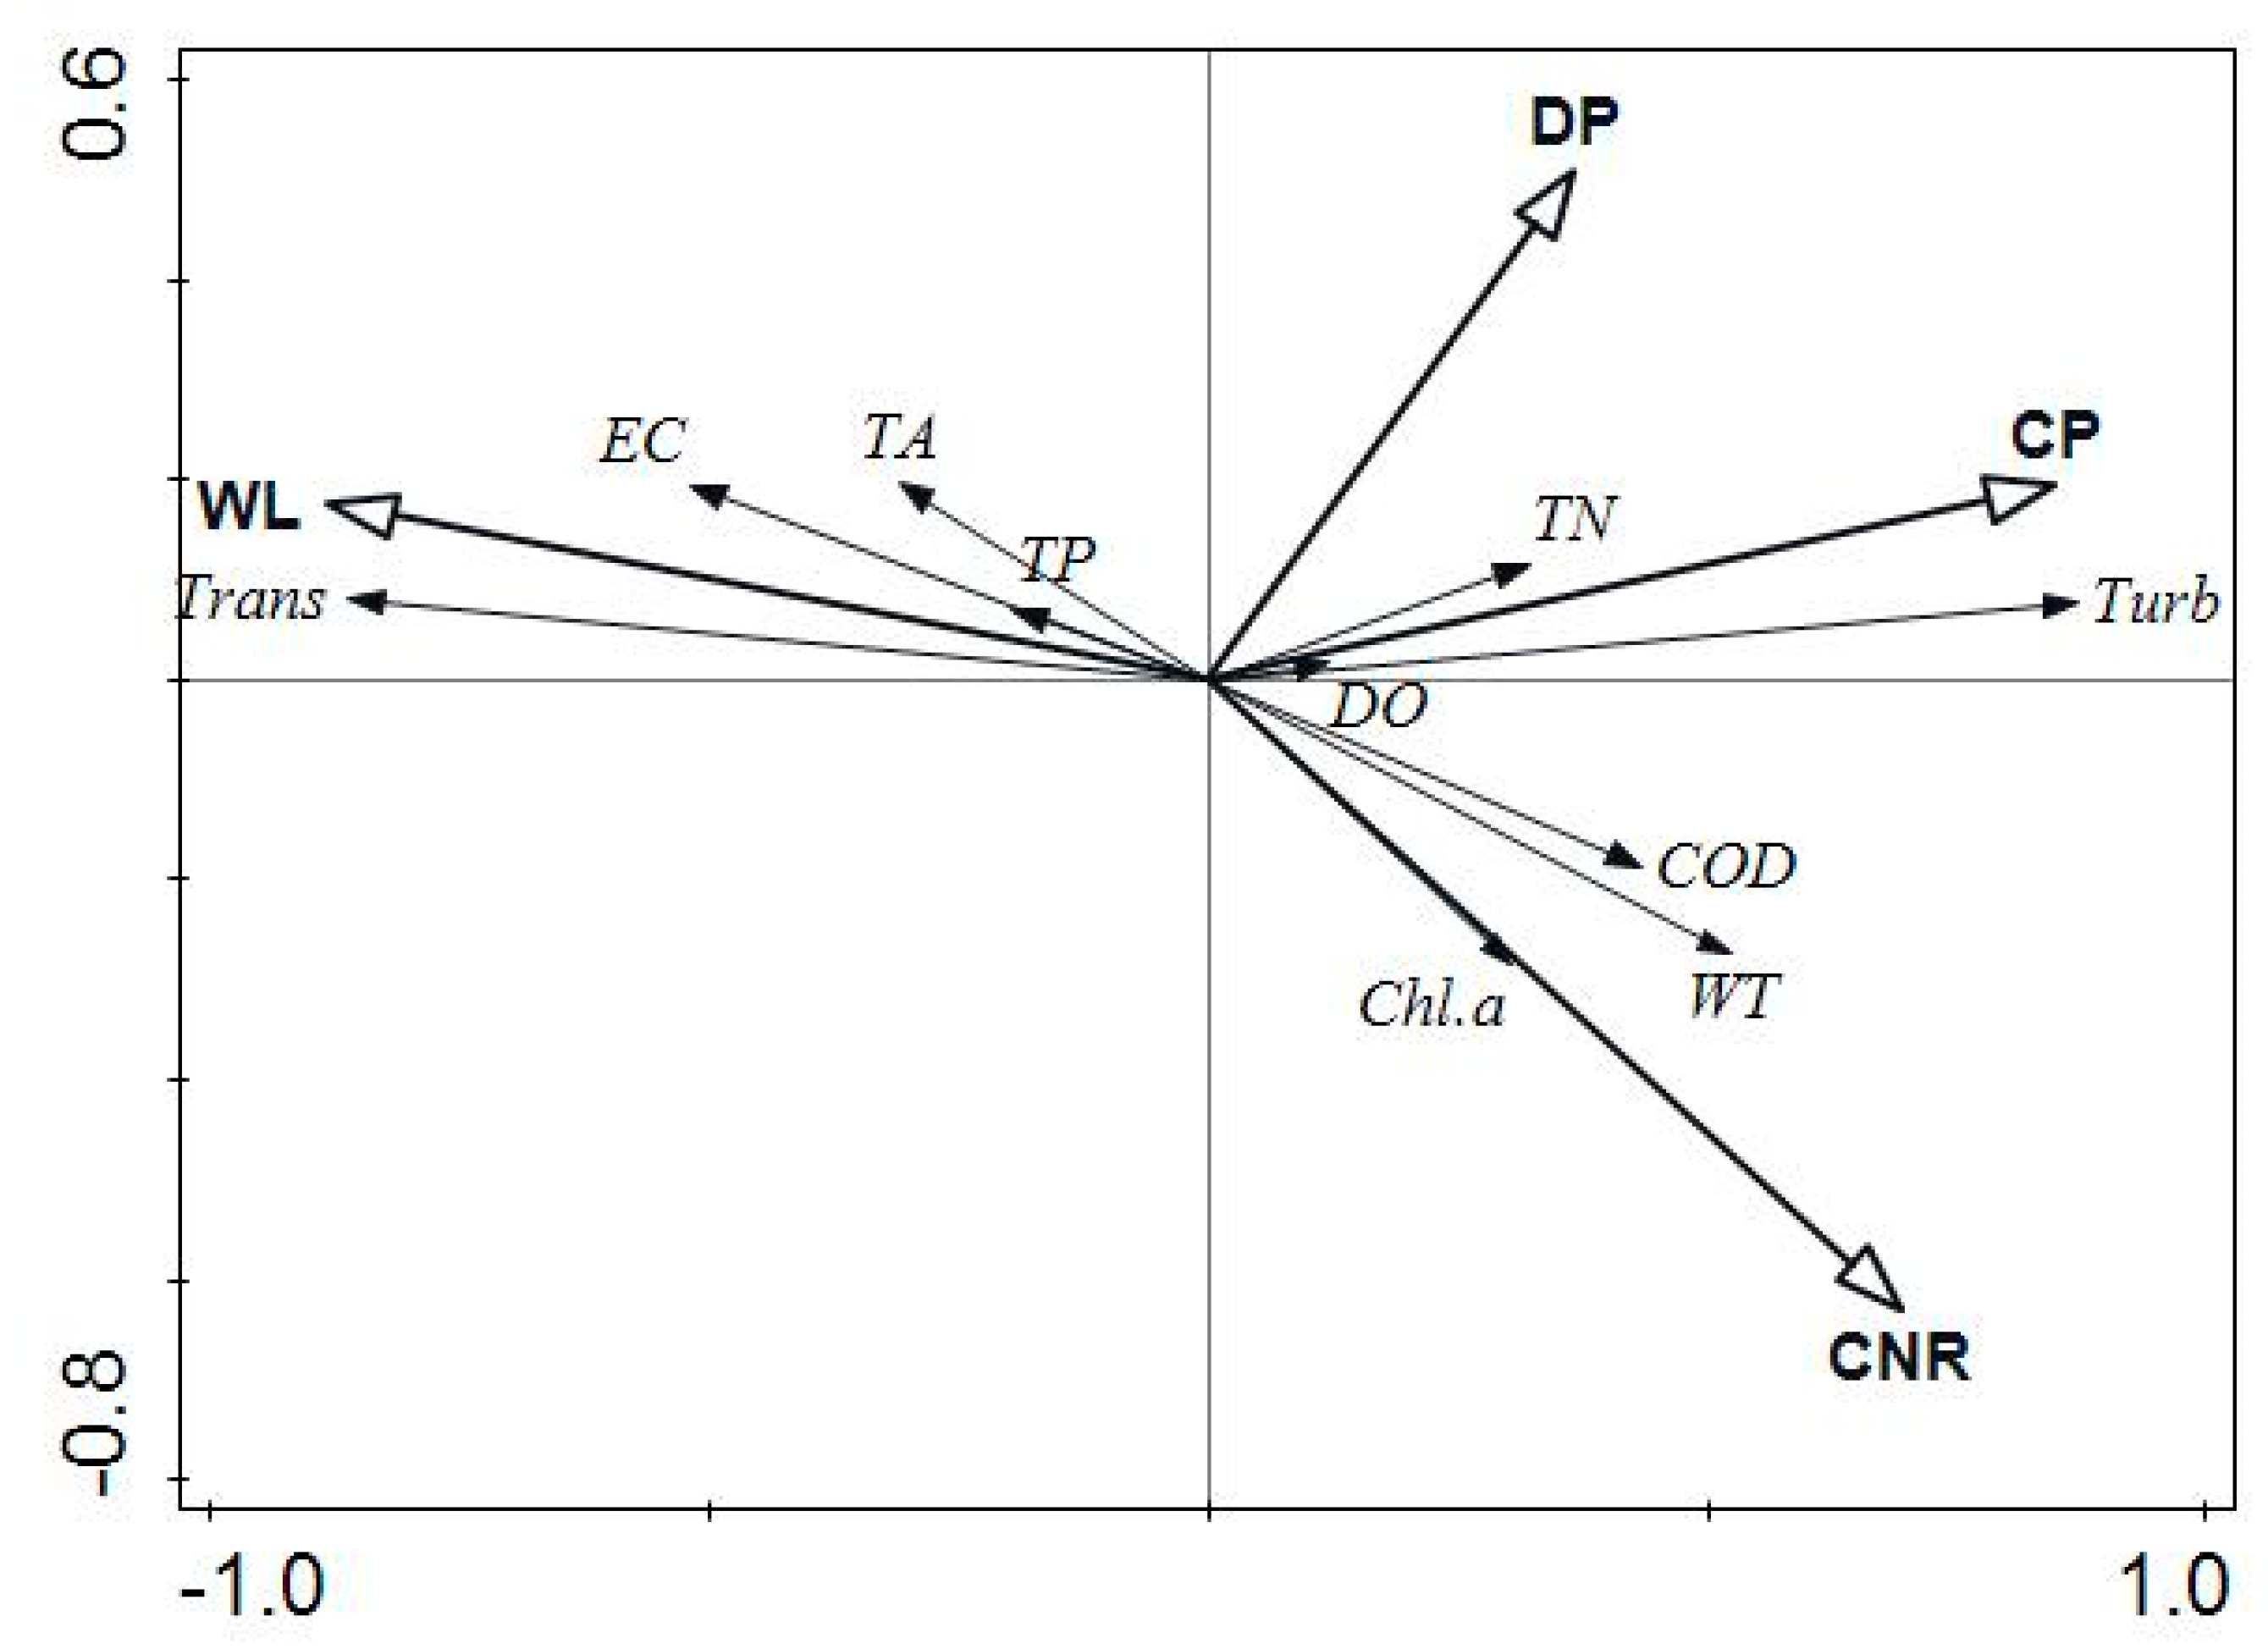
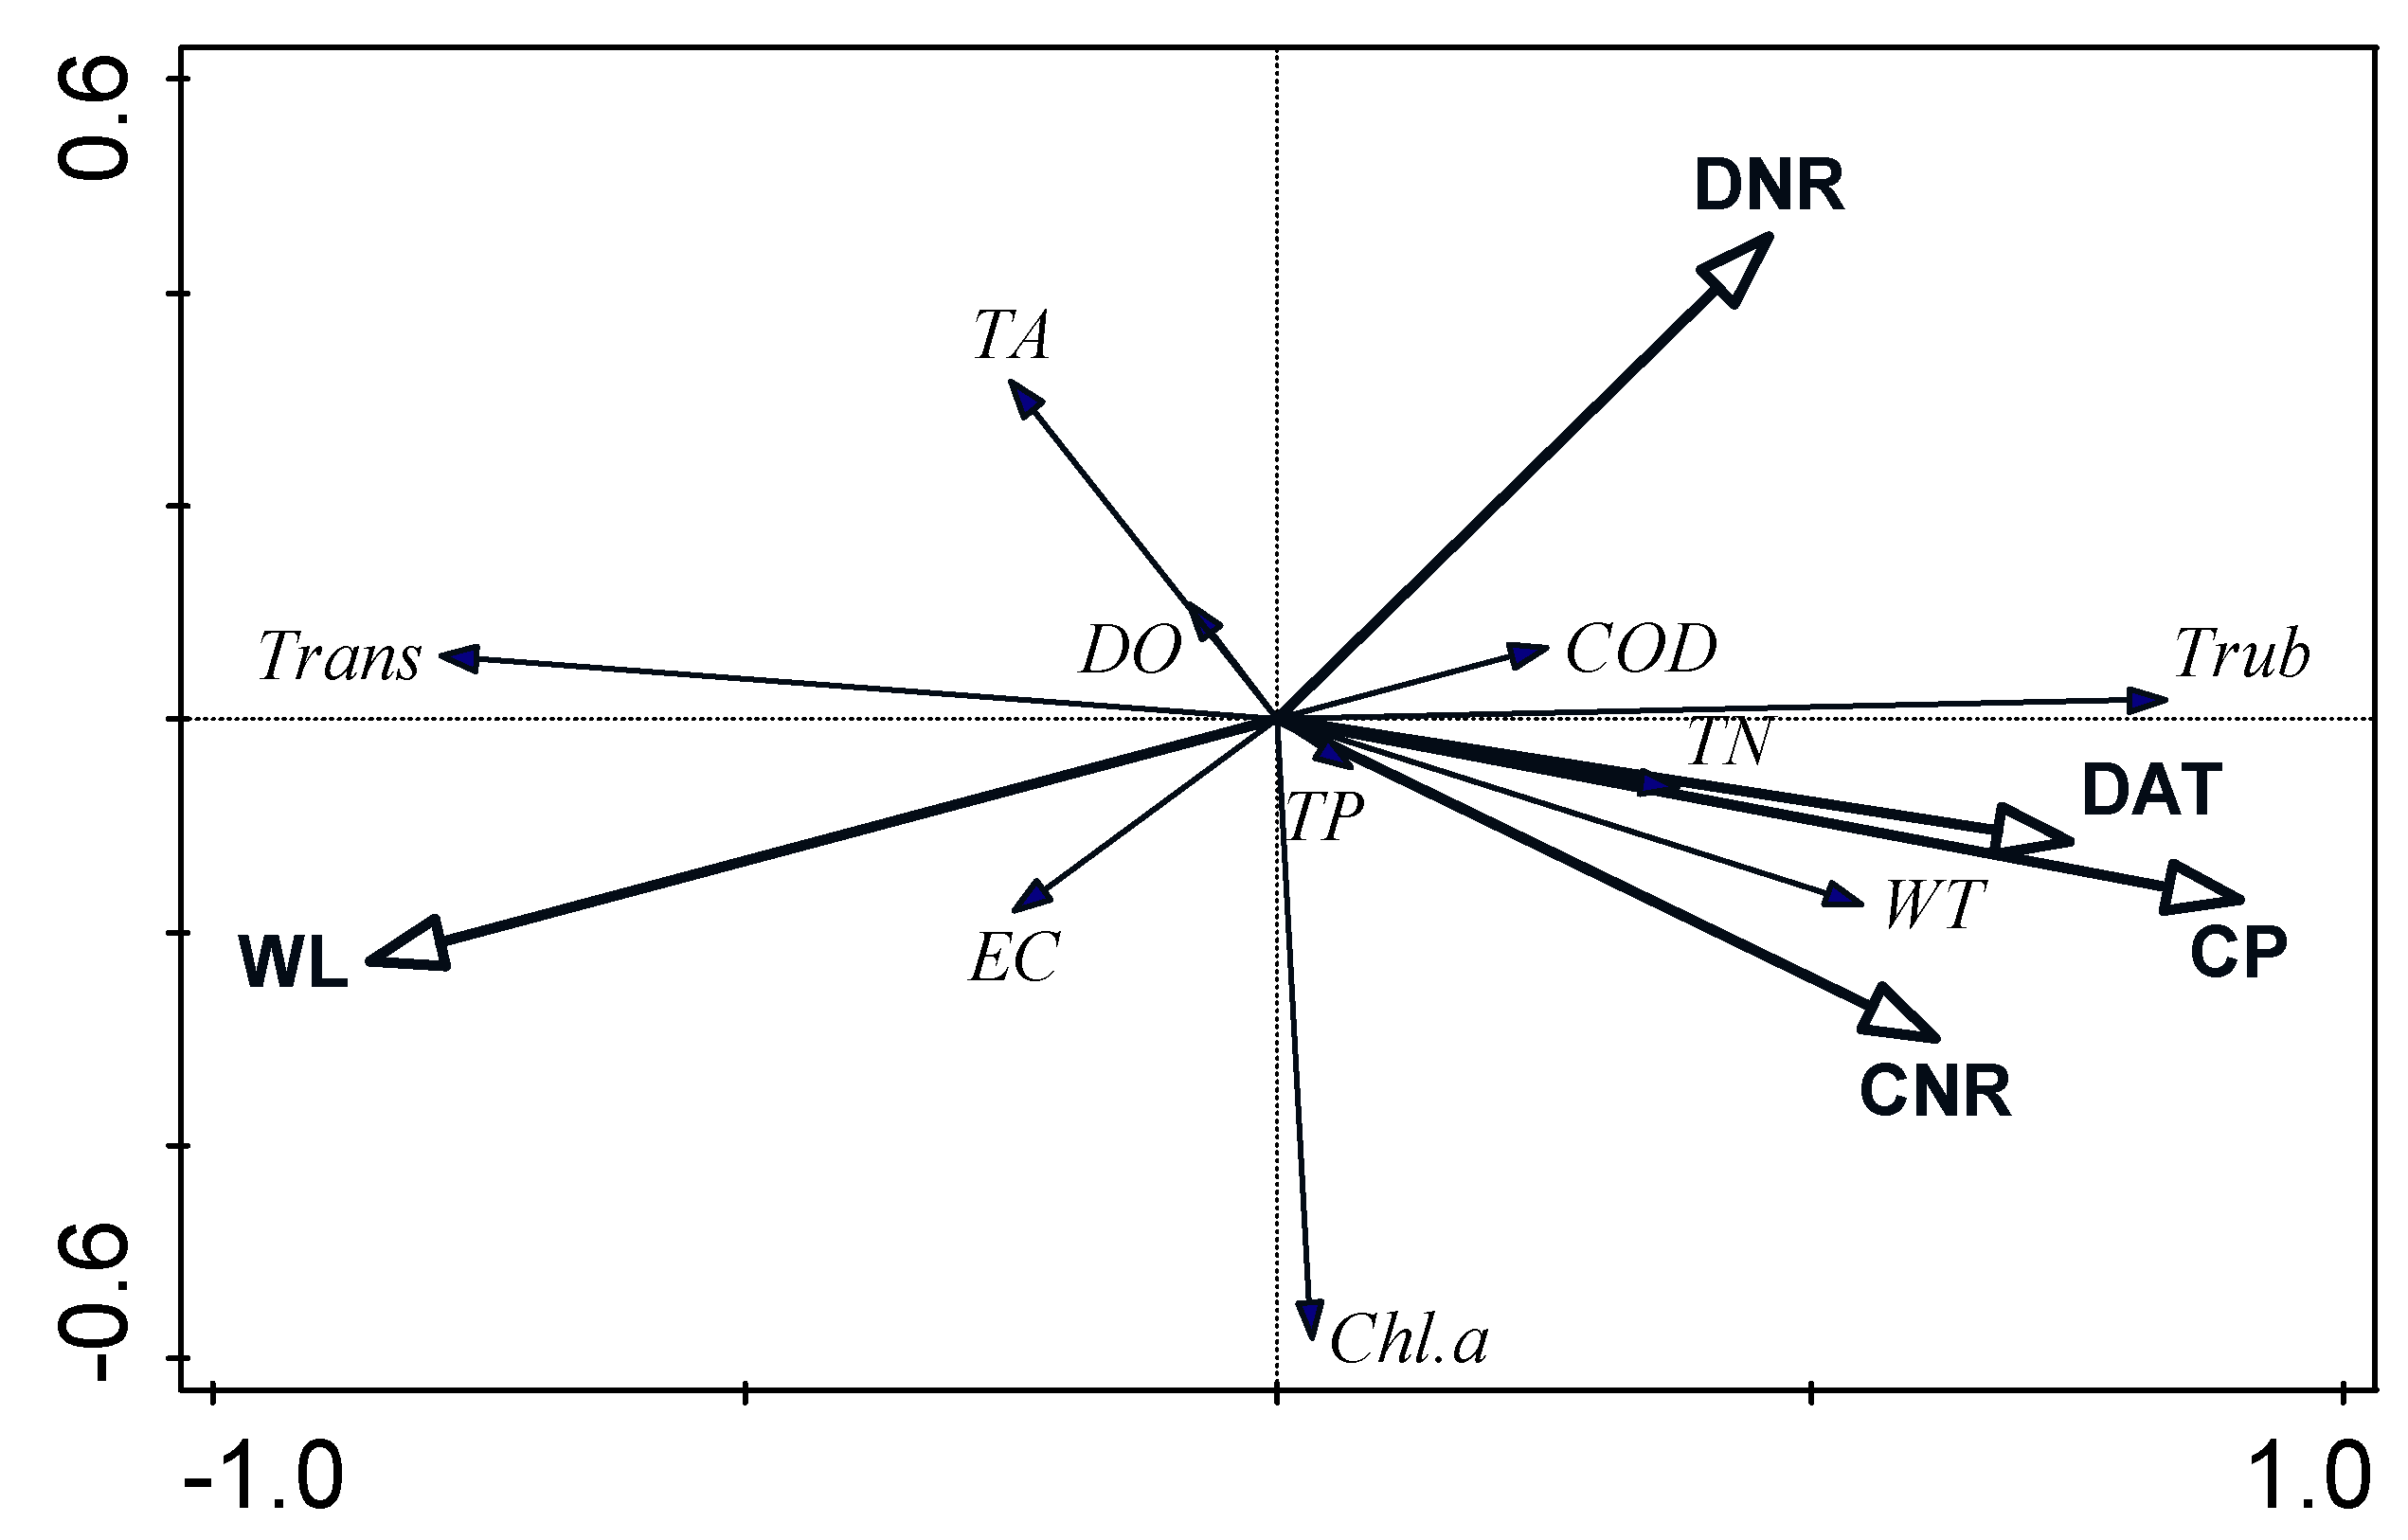
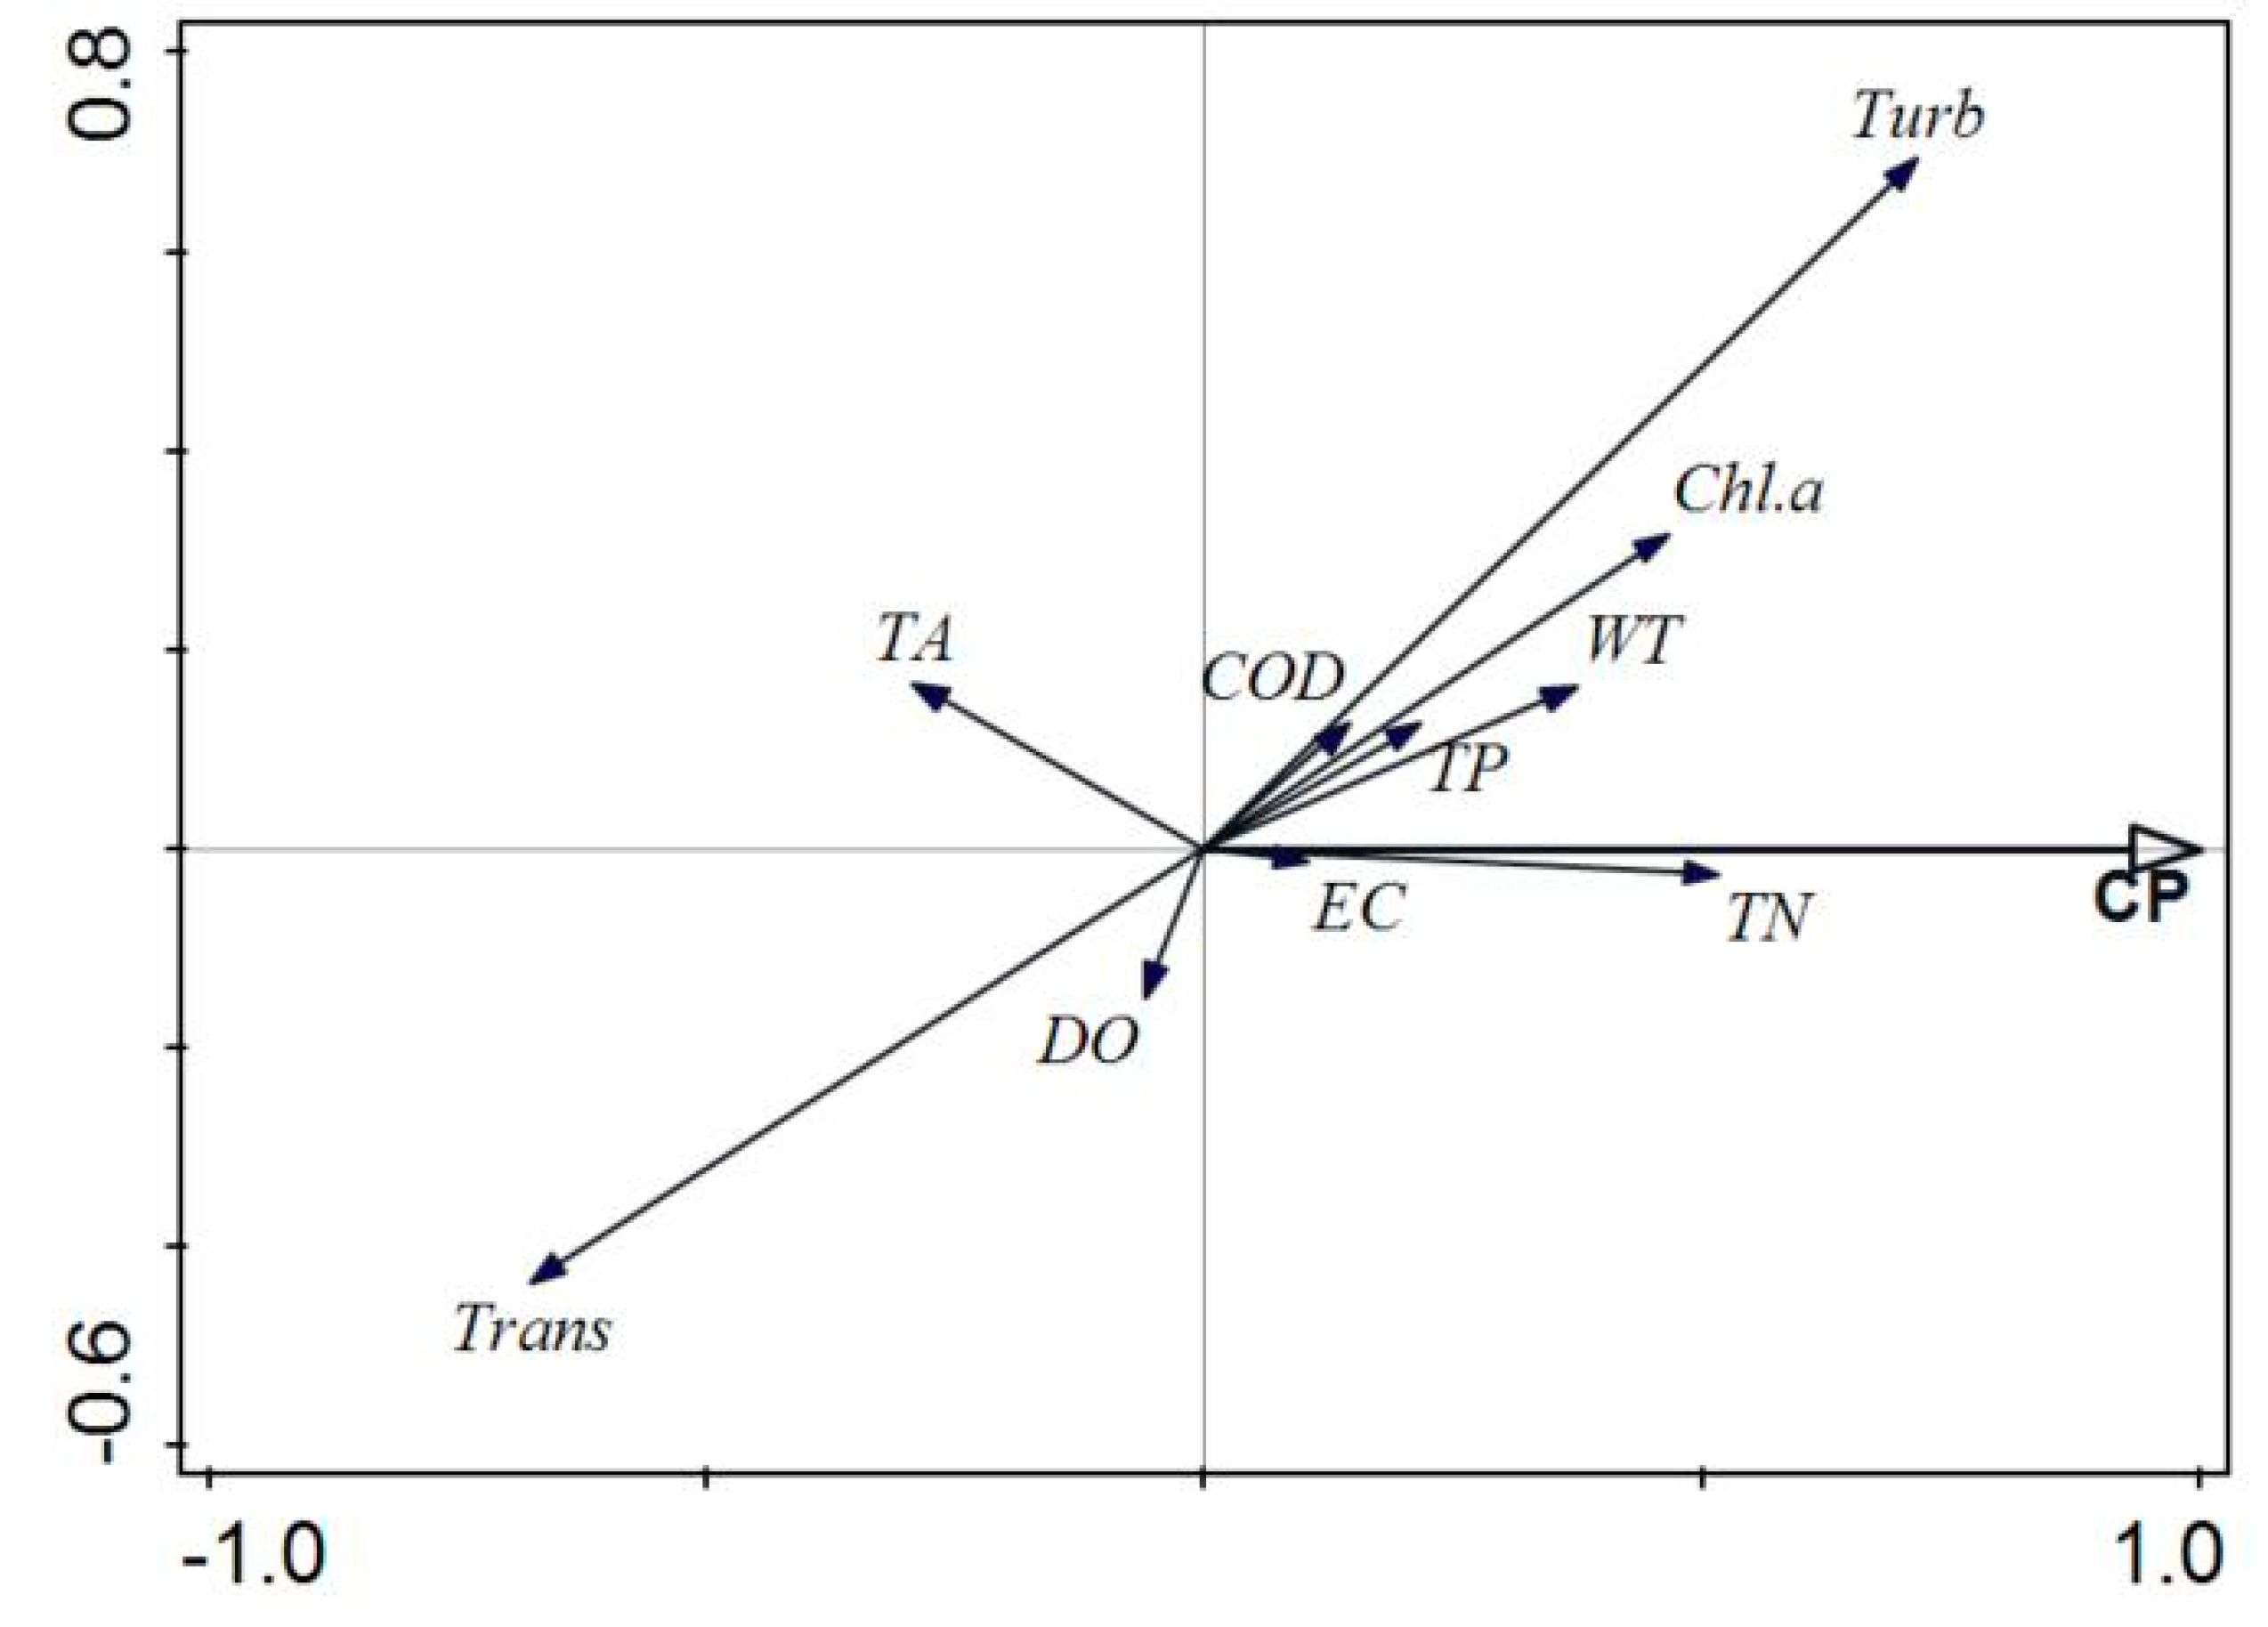
In the perennial backwater area, the first and second ordination axes contribute 51.2% and 3.3% of the variations of water environment variables, respectively (Figure 6). Here, CP had a positive correlation with ordination axis 1 (r = 0.525), and WL had a negative correlation (r = −0.510). These two variables dominate the change in the water environment variables in perennial backwater area. In the fluctuation backwater area (Figure 7), the 1st and 2nd ordination axes respectively explained 52.4% and 6.3% of the variation of water environment variables, here, CP had a significant positive correlation with ordination axis 1 (r = 0.585), and WL was negatively correlated with the axis 1 (r = −0.476). The two parameters dominated the change in the environment variables in the direction of ordination axis 1. In the upstream inflow area (Figure 8), CP explained 44.0% of the variation in the water environment variables, and was positively correlated with the first axis.
3.4.3. Influence of Time and Space Changes
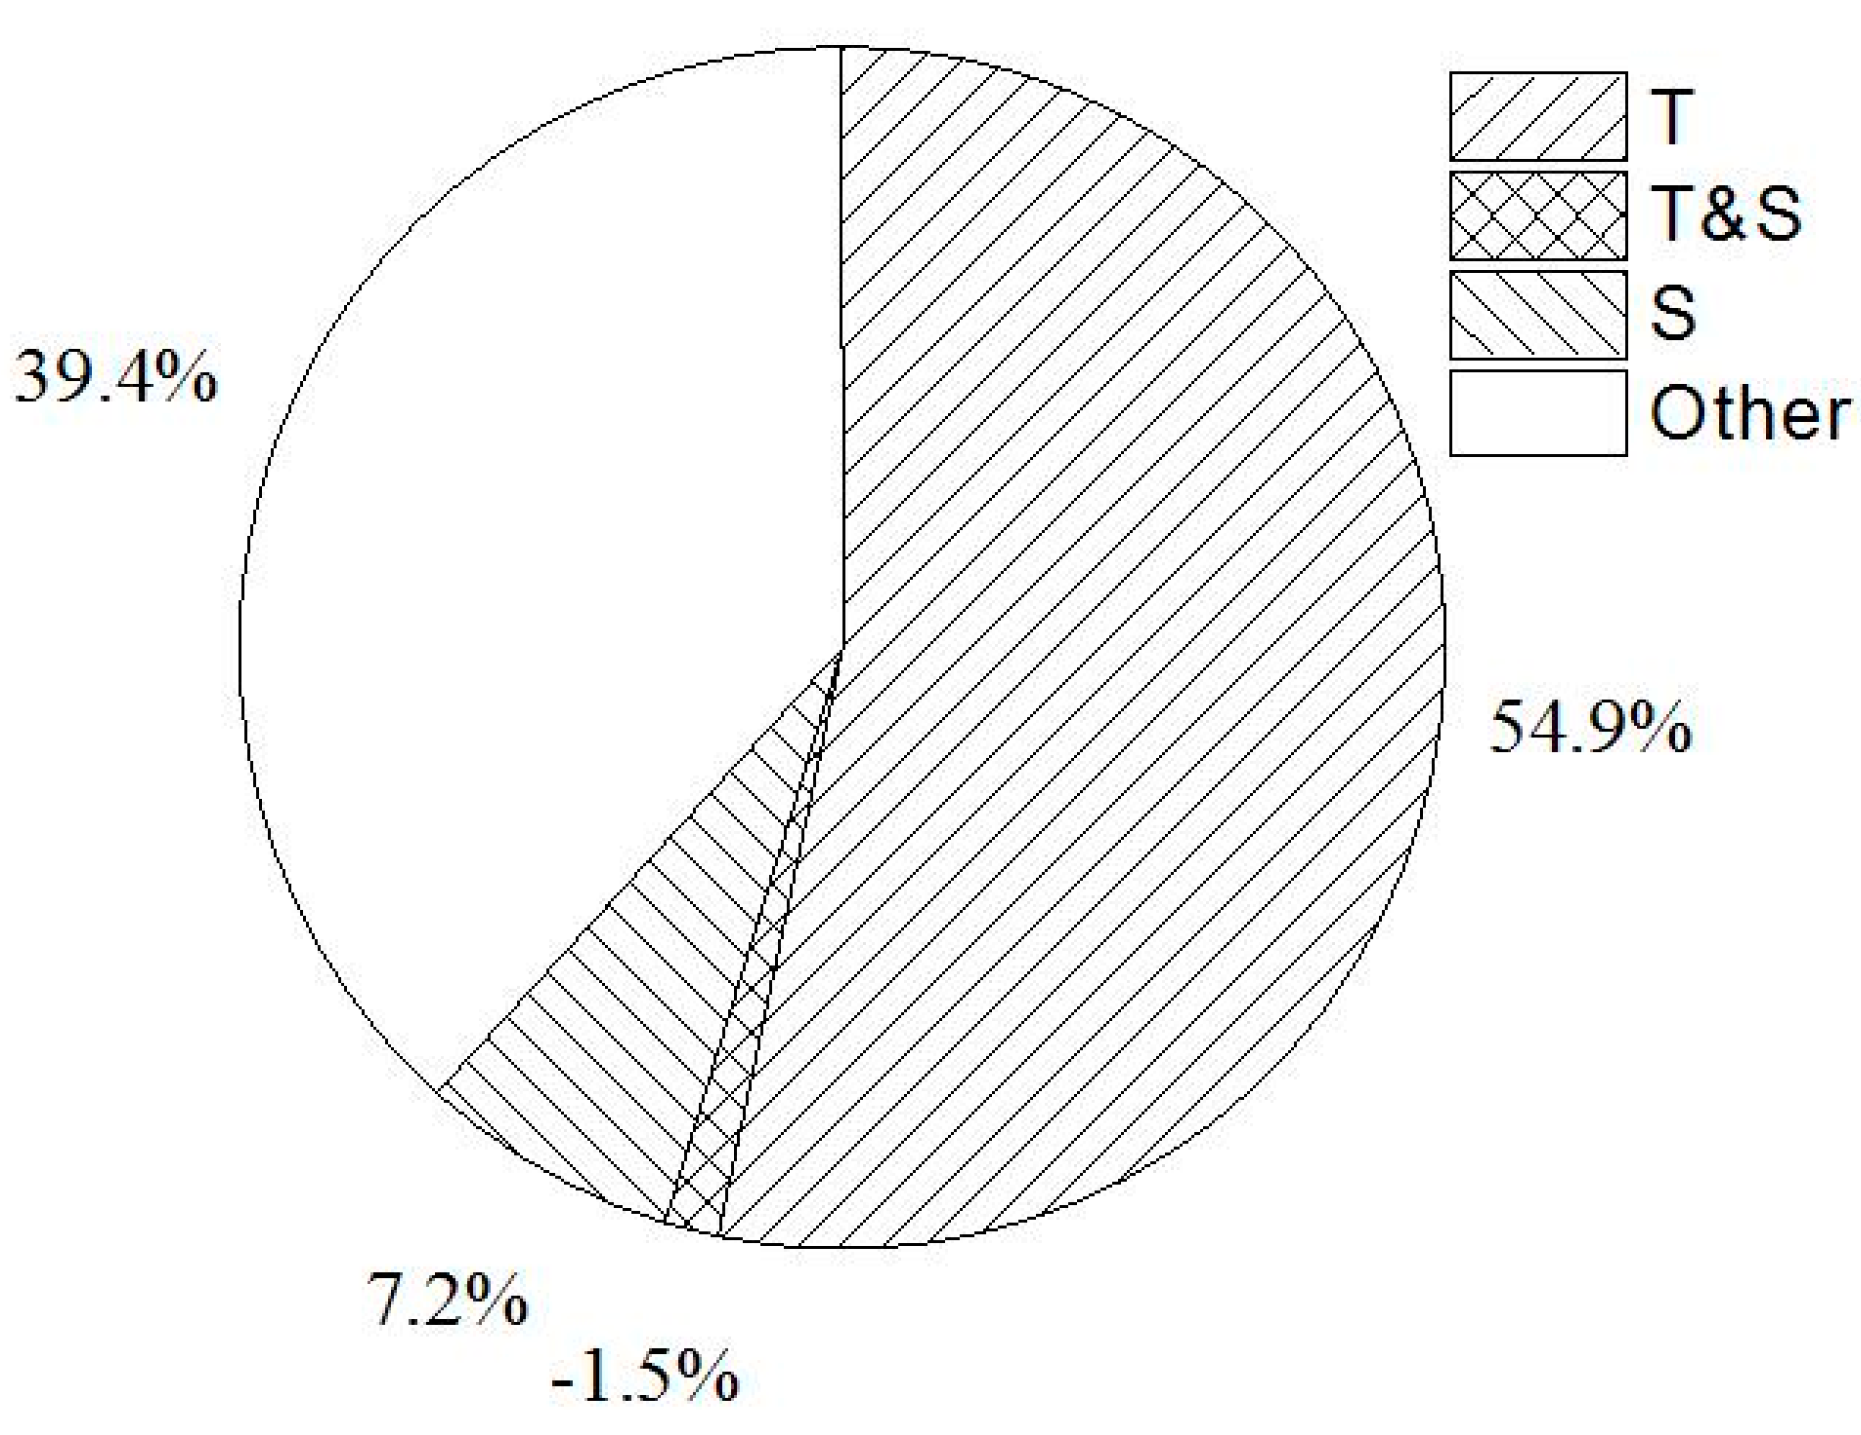
The virtual time variable T was taken to represent the sampling month, and the virtual space variable S was taken to represent the sampling site. Through the partial RDA analysis under the co-constraint of both time and space, the variance of the water environment variables was decomposed into the time-independent function part, the space-independent function part, and the integrated time and space function part. The results of the partial RDA analysis show that the 1st and 2nd ordination axes explained 52.7% and 9.1% of the variance of the water environment variables, respectively. Here, the cumulative contribution rate of the co-function of both time and space variables amounted to 60.7% (adjusted), and the contribution rate of the independent function of time variable T amounts to 54.9%, exceeding half of the total contribution. The contribution of the independent function of space variable S was only 7.2% and the synergistic contribution rate of the time and space variable T&S was 1.5%. The unexplained variation in the time and space variables accounted for 39.3% (Figure 9).
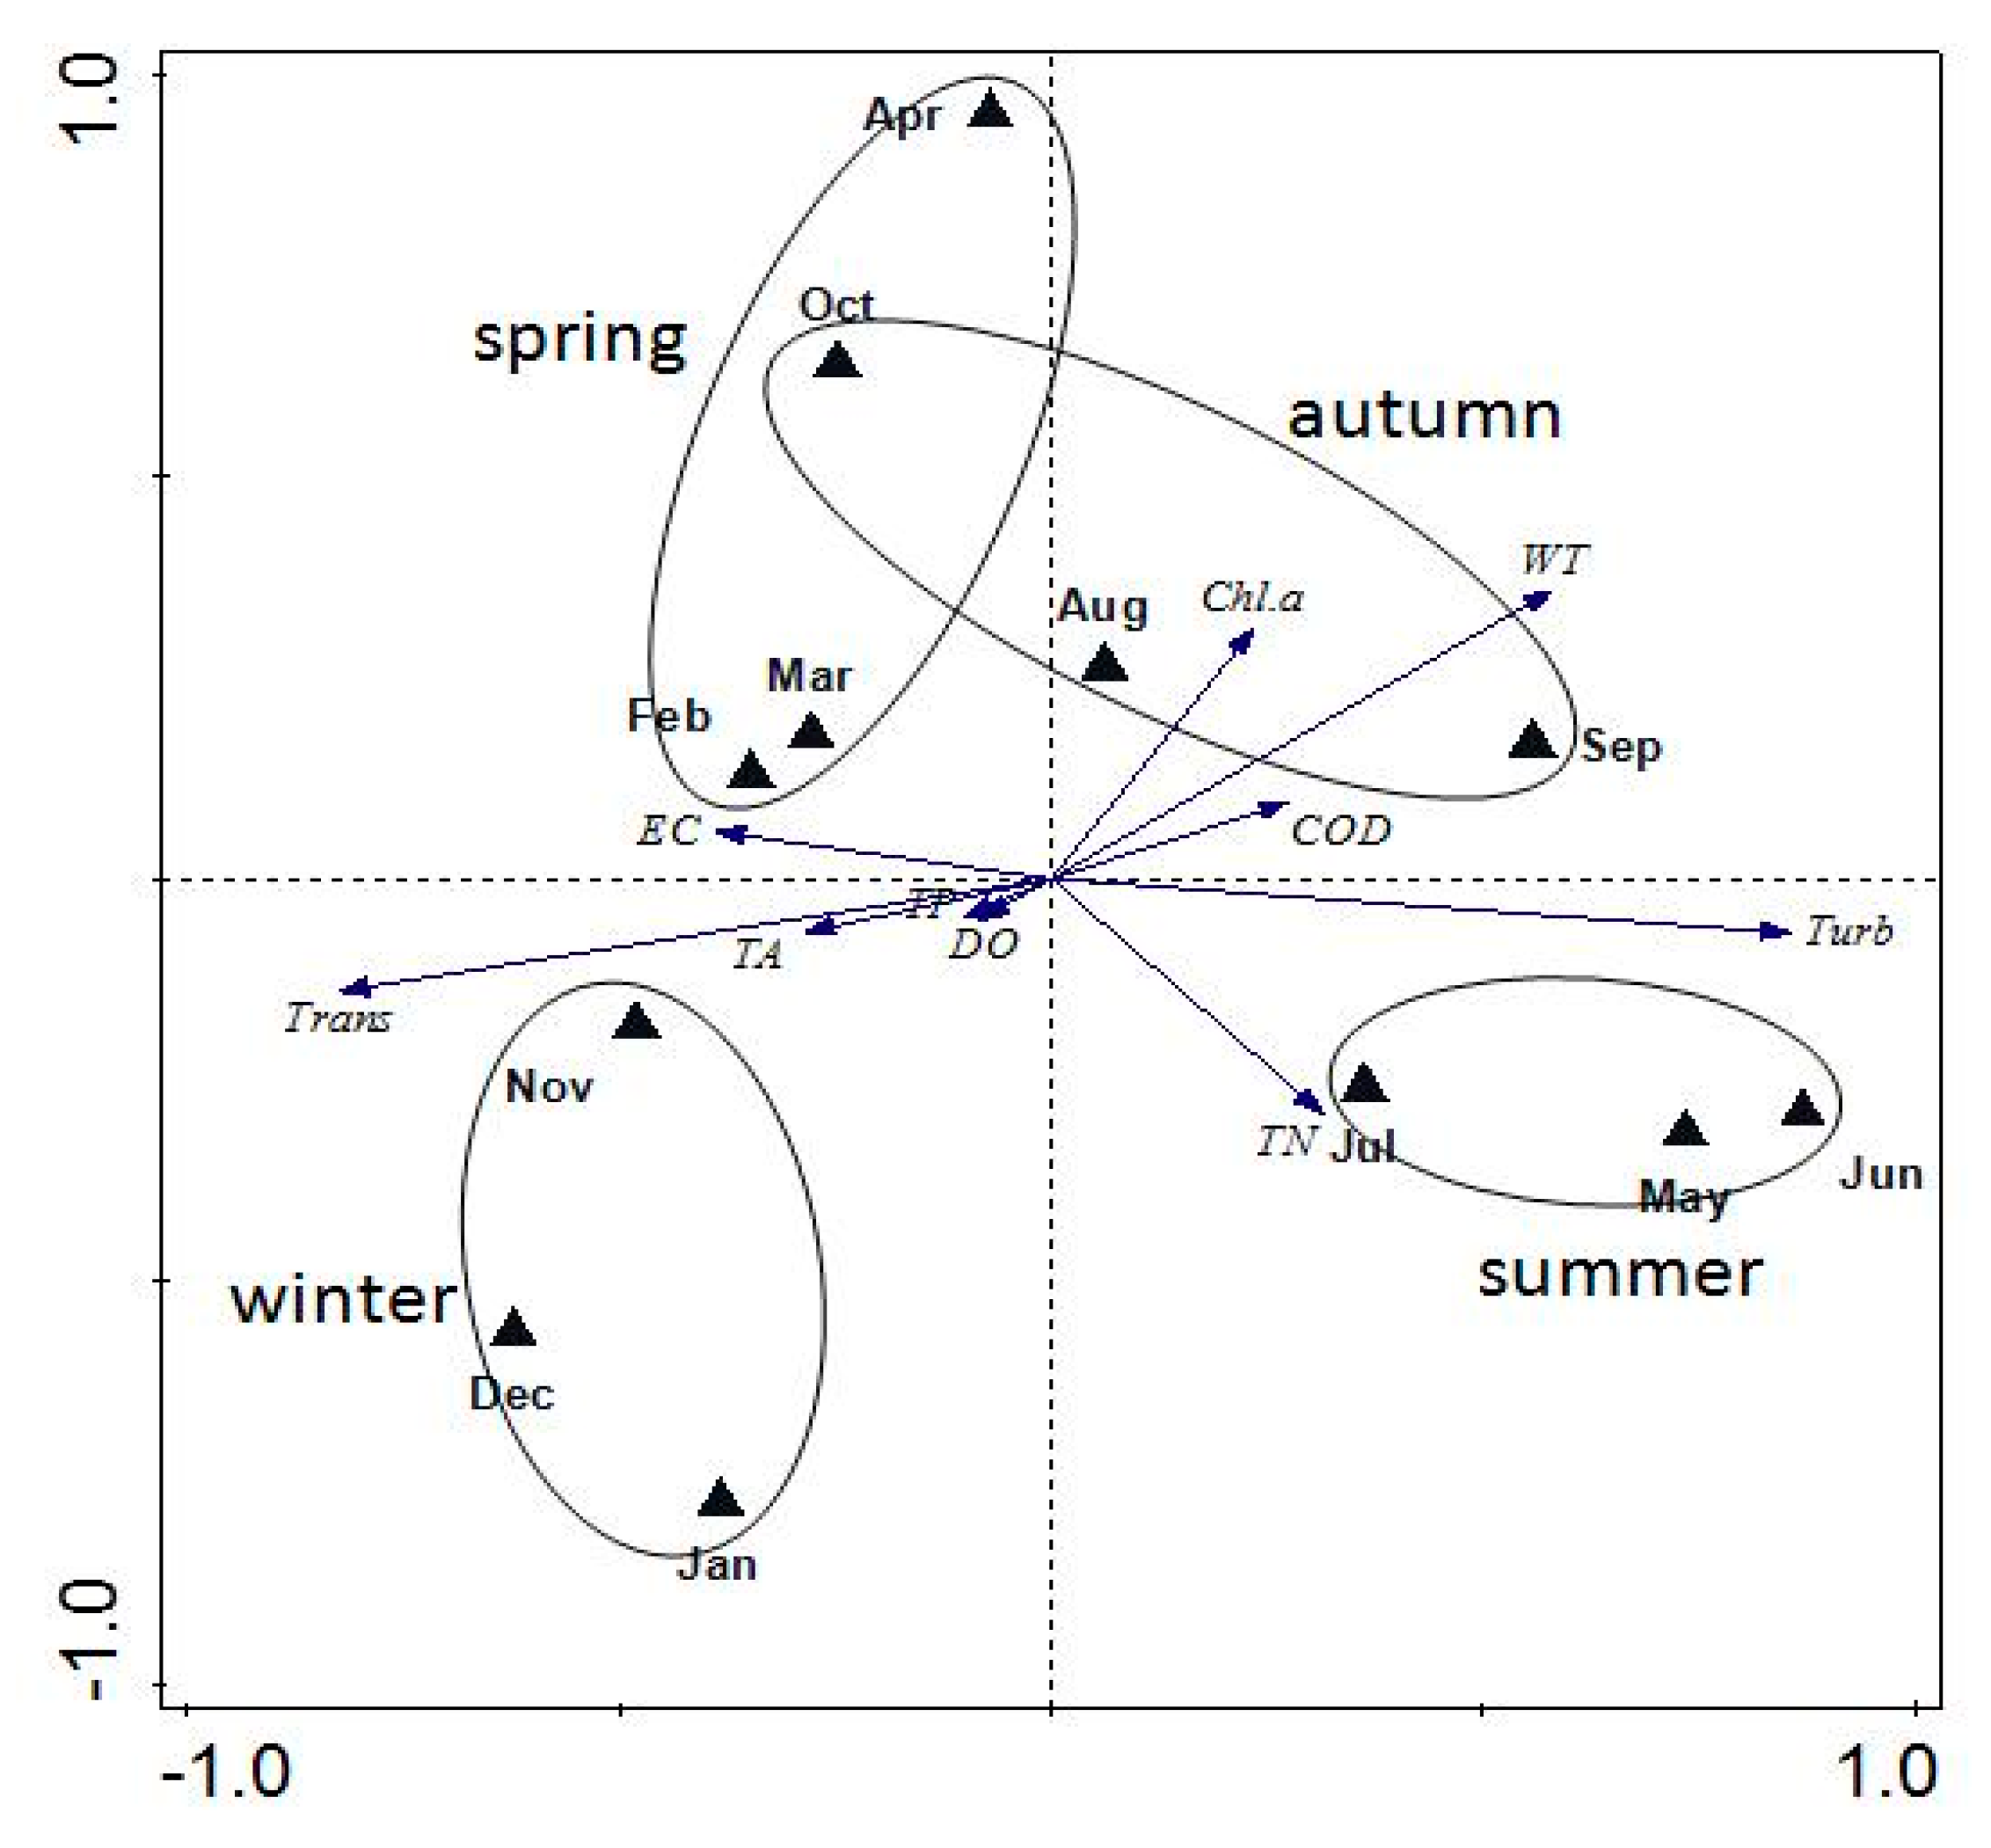
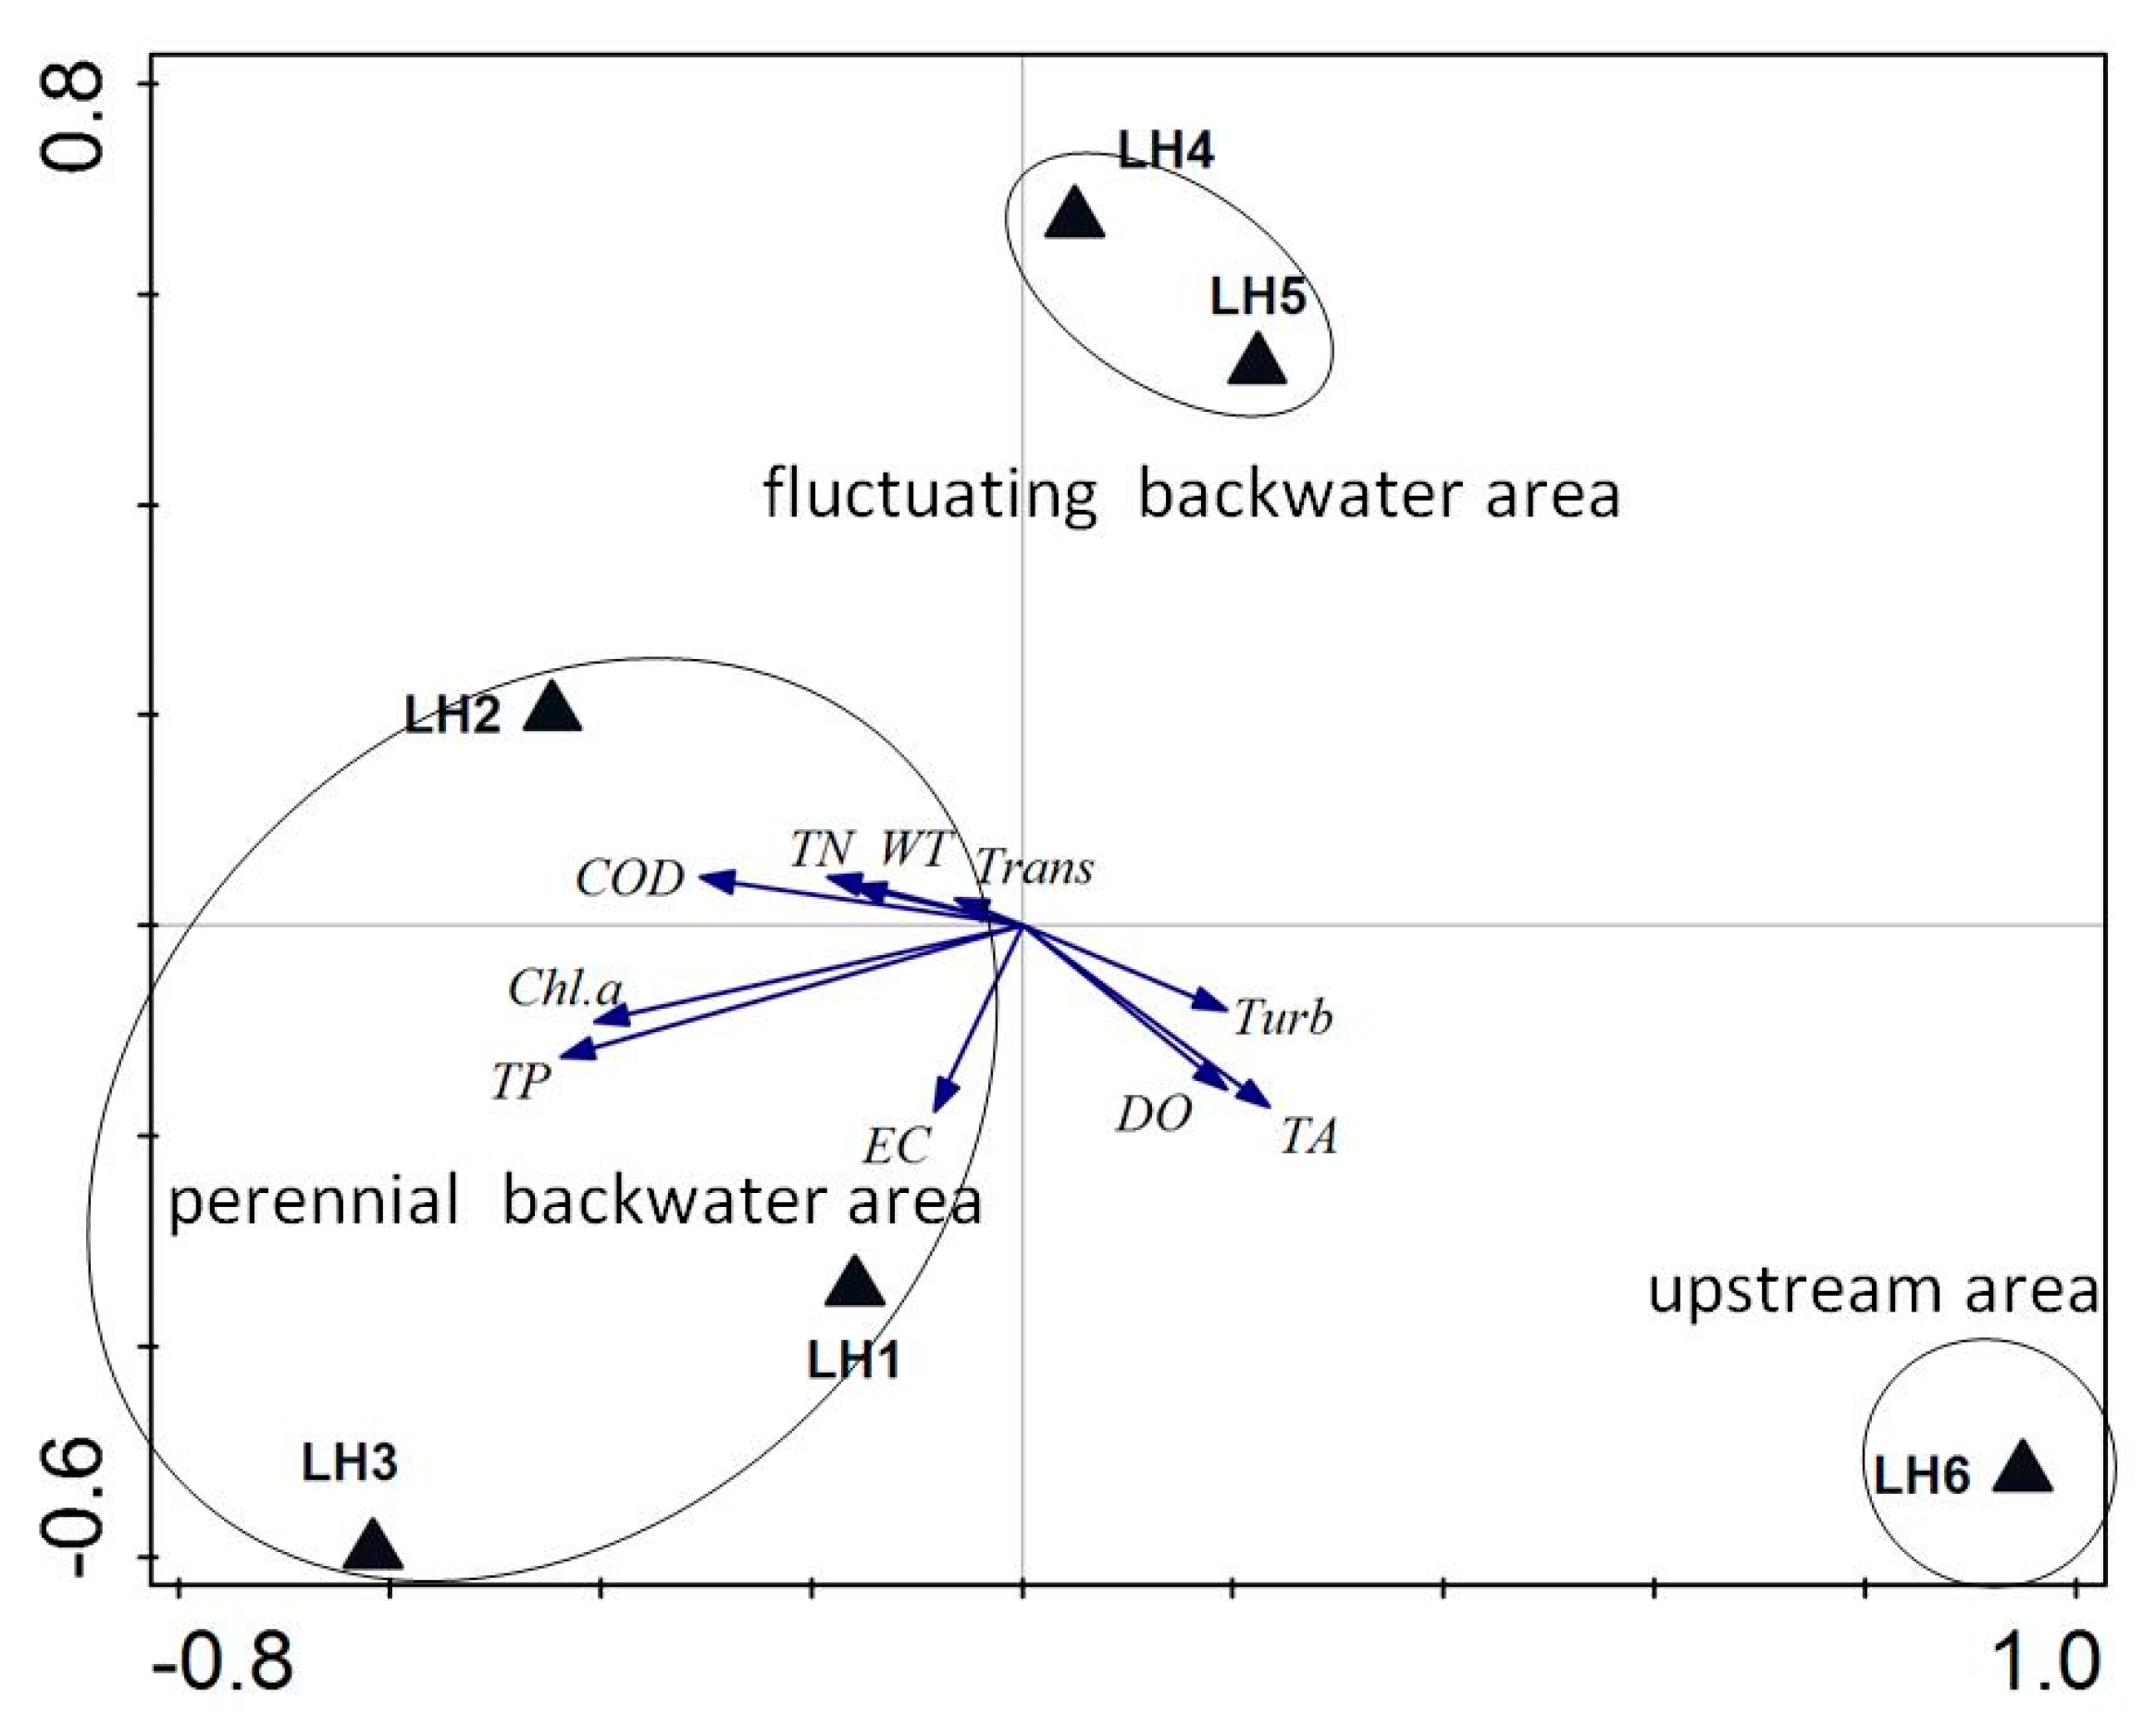
The sampling months during the survey were comparatively evenly dispersed in the four quadrants of the partial RDA ordination map (Figure 10). February, March, April, and October were in the first quadrant, and August and September were in the second quadrant, November, December, and January were in third quadrant, and May, June, and July were in the fourth quadrant. Except for September, which protruded from the second quadrant and stretched into the first quadrant of spring, the rest of the seasons were distributed in different quadrants. Viewed from the spatial relationship, the different sampling sites of LR were scattered in the ordination map (Figure 11), in which the sampling site of the upstream (LH6) was located in the right bottom corner of the first quadrant, and the sampling sites of LH4 and LH5 for the midstream fluctuation backwater area were located at the left top corner of the second quadrant. LH1, LH2, and LH3 sampling sites of the downstream backwater area are in the left bottom part of the second and the third quadrants.
4. Discussion
4.1. Influence of the Upstream Inflow and YR Backwater
River inputs, horizontal flow patterns and regulated output all affect the transport, conversion and settlement of inflow materials, which are the main drivers of the physical, chemical and biological longitudinal gradients of the reservoir from the source to the dam [27]. The physicochemical gradient driven by the tributary inflow is a typical characteristic of canyon-type reservoir, and the horizontal flow patterns and seasonal output are obviously affected by the reservoir regulation [28]. The tributaries of the TGR are affected by both the upstream inflow and the backwater. The transmission and exchange of water and its contents between the inflow and the backwater is complex [29], but it is critically important to study and describe this dynamic picture.
In this study, we used the Euler distance coefficient to describe the influence of the upstream inflow and the YR backwater on the water environment variables in the LRB. The results are in line with theoretical expectations. The distance coefficients between LRB sampling sites and the control sites of the upstream inflow and the YR showed obvious longitudinal gradient patterns, and the two distribution trends were completely opposite (Figure 5), reflecting that the upstream inflow and the YR backwater are in inverse influence to the water environment of the LRB. Viewed from the dynamic variation chart, the period from September to January is the drought season, driven by the small amount of inflow and high water level in the reservoir [30]. Therefore, the YR backwater has the farthest and most profound influence on the backwater area. In this period, the distance coefficient between the LRB sampling sites and LH6 was generally higher, but compared to CJ was lower. May to August is the flood season, which is shown by the large amount of inflow, and low WL at the same time. The capacity of LRB is small but the water fluidity is high, so this is the period when the upstream inflow has the most severe influence on the water environment of LRB. In this period, the distance coefficient between LRB sampling sites and the CJ control site was comparatively large but the distance coefficient from the LH6 control site was small (Figure 4).
Liu Yang et al. [12] found that ions such as Na+, K+, Cl−, , and hydrogen and oxygen isotope had obvious longitudinal gradients in Xiangxi Bay, demonstrating the gradient effect of the YR main stream on the tributaries of TGR. We found that TN (Figure 3g), TP (Figure 3h), and EC (Figure 3b) increased gradually from the YR backwater end to LRE, which was especially obvious in the winter and spring when the water level was high. The high concentrations of TN, TP, and various inorganic ions in the main river diffused and entered into the LRB, which was the main reason for the formation of the longitudinal gradients of these parameters in LRB, verifying the conclusions of Zhang Yu [31,32,33] et al. Ma Jun et al. [14,20] used a non-grid model to analyze the distribution rule of the heterogeneous flow in the Xiangxi River and its influence on the water environment of the reservoir bay. Compared with the methods of Liu Yang and Ma Jun et al., our method combining the distance coefficient, which is the conventional monitoring parameter of the water environment, with the spatial interpolation, can simply and efficiently describe the complicated temporal and spatial variation in the upstream inflow and the YR backwater on the water environment of the backwater area, which is both more convenient and deserves further study and promotion.
4.2. Effects of Meteorological and Hydrological Factors
The TGR is located in the subtropical monsoon climate zone, and the hydro-meteorology driven by this climate is an important factor affecting the changes in the water environment [34,35]. In addition, as the world’s largest comprehensive water conservancy project, the WL change under manual regulation is a further important factor influencing the characteristics of the water environment [2]. Supporting this idea, we found WL and CP to be the most important factors affecting the water environment of the LRB through RDA forward selection. In the perennial backwater area, changes in WL explained up to 39.9% of the variation in the water environment (Table 3), which was the largest contributing factor (Figure 6). The perennial backwater area is directly connected to, and exchanges and transports with the YR water throughout the year. Therefore, the WL is the most important factor affecting the variation of water environment. CP contributed the most to the variation of water environment in the fluctuating backwater area (Figure 7), explaining up to 42.9%. The fluctuation backwater area is affected by the reservoir backwater from September to May of the next year, and is separated from the YR by the perennial backwater area in the middle, so that the backwater influence is weakened after passing through the perennial backwater area. However, precipitation can directly flow into the fluctuation backwater area through the confluence, which is the most important factor influencing the environmental characteristics of the fluctuation backwater area. In the upstream inflow area, only CP had a significant impact on the water environment (Figure 8). It should be noted that although CP was significantly positively correlated with the total inflow (r = 0.817, p < 0.01), CP had a better interpretation efficiency to the water environment variation, probably because the total inflow only reflects the upstream inflow influence. CP itself is not only directly related to the inflow of LR, but also reflects the impact of the precipitation confluence within the 10 km backwater area, so the interpretation efficiency is higher.
Under normal circumstances, there is a natural zoning phenomenon of water ecology in the longitudinal direction of the reservoir [36]. Xu Yaoyang [35] found that the stability of a water body can reflect the natural gradient of river self-flow and the comprehensive influence of artificial impounding and backflow. Thus, water stability is an important reason for determining the type of tributary water. In this study, the influence of inflow and backwater on the water environment of different regions were quantitatively analyzed, and the natural gradient of rivers and the influence of impounding backflow in different regions were clarified. These aspects help to explain the reason for longitudinal gradient formation and the zonation mechanism of the water environment.
4.3. Influence of Time and Space Factors
The regional water environment is determined by the combined influence of various factors, including regional geography and meteorological factors on a macro-scale [37], hydrodynamics, channel morphology, and human disturbance at the medium-scale [38], and water exchange, transmission, physiological geochemical reactions, biomes, and the like on the micro-scale [39]. Nogueira et al. [40] believe that for tropical and subtropical monsoon aquatic ecosystems, variation in the water environment is usually driven by seasonal patterns of sunlight, rainfall and wind. Macro-climate factors have an indirect impact on the characteristics of the water environment through solar radiation, rainfall, wind, and even human production and life style [41]. In multipurpose reservoirs, seasonal variation in climate determines the laws and regulations governing water use. As a result, the reservoir operation schedule will then affect the water environment of reservoirs and rivers [42], something which is also true in TGR.
Our results showed that seasonal variation in climate explained up to 54.9% of variation in the water environment (Figure 9), indicating that for the LR as a whole, external macroscopic factors such as meteorology and hydrology are the major influencing factors. The changes in the water environment characteristics of the LR are mainly affected by external input factors. The length of the LRB is only about 10 km and the length of the perennial backwater area is only about 5 km. The difference of topography between different sampling sites was small. Therefore, such differences among the sampling locations of the LR had a comparatively small influence on the water environment variables, accounting for only 7.2% of the variation. This result shows that the geographical and biochemical effects within the backwater area exist but are small in scale.
Season changes are the driving factor behind climate change in the subtropical monsoon region. In the LRB, the months of May, June, and July represent the summer with high temperature, abundant rainfall but low WL. Conversely, November, December, January, and February represent winter and early spring with low temperature, little precipitation, but high WL (Figure 10). Summer is the flood season with high TN and TURB, when non-point source pollution has the greatest impact on water environment [43,44]. Winter and early spring have high WL with high TA, TRANS, EC, and TP, which is the key period when the YR backwater is the major factor affecting the water environment of LR (Figure 6 and Figure 7). In addition, there is a partial overlap in the spring and autumn months in the ordination diagram, which may because the meteorological and hydrological conditions of October are similar to those of February, March and April. The long-term study of Ye Lin [45,46] et al. conducted in Xiangxi River found that spring and autumn are the peak periods of algal blooms. We also observed correspondence between the spring and autumn and the high concentration of chl.a in LRB (Figure 3i, Figure 10).
Although change in spatial location had little influence on the characteristics of water environment, it was reflected in the ordination diagram (Figure 11). Like large tributaries such as the Xiangxi River [47], the upstream inflow in LR is an important factor affecting the water environment. The LR runoff area is of typical karst landform, so the inflow has high fluidity, strong oxygen-attached capacity, a high , content and carries a large amount of sediment and particulate matters., Accordingly high values of DO (Figure 3c), TA (Figure 3d), and TURB (Figure 3e) appeared at the control site, LH6. The Chl.a, TP, and CODMn in the LH2 and LH3 sampling sites area were also high. These are typical characteristics of eutrophic water and are directly related to the eutrophication characteristics of LRB [17,48]. The EC of LH1 in LRE was relatively high, indicating that the YR backwater plays an important role in the replenishment of various electrolytic ions in LRB [18]. LH4 and LH5 are located in the upper part of the second axis, which was different in the gradient direction from all other water environment variables, indicating that the fluctuation backwater itself has little influence on the water environment of LR.
5. Conclusions
The results of three years monitoring showed that the water environment parameters of LR fluctuates in weather and reservoir management. The major water environment parameters followed distinct distribution patterns, in which TN, TP, and EC gradually increased from the backwater end to LRE, while Chl.a and CODMn occur at higher values in the midstream. Our analysis indicated that seasonal variation of the subtropical monsoon climate was the main influence driving variation of the water environment in LR, and that the influence of geographical and biochemical factors in this area were small. Climate influence drives water variable in the form of precipitation confluence and regulation of the water level in the reservoir. Among parts of LR, the perennial backwater area was mostly affected by fluctuating of WL, while the fluctuation backwater area and the upstream inflow area were mostly affected by rainfall. Further analysis showed that there was a significant longitudinal gradient of distance coefficient between the sampling sites in LRB and the control sites of the upstream and the YR. From the upstream to the LRE, the influence of the backwater gradually increased, and the influence of the inflow gradually weakened. At the time of high WL, the YR backwater had the greatest impact on the water environment of the LRB, while in the flood season, the inflow become the greatest impact factor affecting the water environment. The upstream inflow and the YR backwater were the major reasons for the longitudinal gradient pattern and zonation formation of water environment in LRB. Using the distance coefficient combined with spatial interpolation method, the complicated influence of upstream inflow and YR backwater on the water environment of the backwater area can be described simply and efficiently.
Author Contributions
S.H., J.X. were responsible for the research design. S.H. drafted the main text. S.H., X.W., F.X. analyzed the data and prepared the figures. Y.W. and S.H. participated in the sampling. J.X. polished the manuscript. All authors participated in discussions and approved the final manuscript.
Funding
This study was supported by the National Grand Science and Technology Special Project of Water Pollution Control and Improvement (No. 2017ZX07108-001); the National key Research and Development Plan (No. 2016YFC0402207-3).
Conflicts of Interest
The authors declare no conflict of interest.
References
- Fu, B.; Wu, B.; Lue, Y.; Xu, Z.; Cao, J.; Niu, D.; Yang, G.; Zhou, Y. Three Gorges Project: Efforts and challenges for the environment. Prog. Phys. Geogr. 2010, 34, 741–754. [Google Scholar] [CrossRef]
- Xia, J.; Xu, G.; Guo, P.; Peng, H.; Zhang, X.; Wang, Y.; Zhang, W. Tempo-Spatial Analysis of Water Quality in the Three Gorges Reservoir, China, after its 175-m Experimental Impoundment. Water Resour. Manag. 2018, 32, 2937–2954. [Google Scholar] [CrossRef]
- Chen, J.; Finlayson, B.L.; Wei, T.; Sun, Q.; Webber, M.; Li, M.; Chen, Z. Changes in monthly flows in the Yangtze River, China—With special reference to the Three Gorges Dam. J. Hydrol. 2016, 536, 293–301. [Google Scholar] [CrossRef]
- Xu, X.; Tan, Y.; Yang, G. Environmental impact assessments of the Three Gorges Project in China: Issues and interventions. Earth-Sci. Rev. 2013, 124, 115–125. [Google Scholar] [CrossRef] [Green Version]
- Yin, S.; Lou, B.; Liu, H.; Lan, J.; Yuan, L.; Zhang, Q.; Zang, X. Analysis of water quality of the yangtze river within the three gorges reservoir area during construction period. Resour. Environ. Yangtze Basin 2011, 20, 305–310. [Google Scholar]
- Zhao, P.; Tang, X.; Tang, J.; Wang, C. Assessing Water Quality of Three Gorges Reservoir, China, Over a Five-Year Period From 2006 to 2011. Water Resour. Manag. 2013, 27, 4545–4558. [Google Scholar] [CrossRef]
- Long, L.; Xu, H.; Ji, D.; Cui, Y.; Liu, D.; Song, L. Characteristic of the water temperature lag in Three Gorges Reservoir and its effect on the water temperature structure of tributaries. Environ. Earth Sci. 2016, 75. [Google Scholar] [CrossRef]
- Jia, Z.; Li, W.; Bing, Z.; De, L.; Zheng, Y. Eutrophication status of the Daning River within the Three Gorges Reservoir and its controlling factors before and after experimental impoundment. Environ. Earth Sci. 2016, 75, 1182. [Google Scholar] [CrossRef]
- Xu, Y.; Shao, M.; Han, X.; Cai, Q. Temporal Asynchrony of Trophic Status Between Mainstream and Tributary Bay Within a Giant Dendritic Reservoir: The Role of Local-Scale Regulators. Water Air Soil Pollut. 2011, 219, 271–284. [Google Scholar] [CrossRef]
- Ye, L.; Han, X.Q.; Xu, Y.Y.; Cai, Q.H. Spatial analysis for spring bloom and nutrient limitation in Xiangxi bay of three Gorges Reservoir. Environ. Monit. Assess. 2007, 127, 135–145. [Google Scholar] [CrossRef]
- Zhou, G.; Zhao, X.; Bi, Y.; Liang, Y.; Hu, J.; Yang, M.; Mei, Y.; Zhu, K.; Zhang, L.; Hu, Z. Phytoplankton variation and its relationship with the environment in Xiangxi Bay in spring after damming of the Three-Gorges, China. Environ. Monit. Assess. 2011, 176, 125–141. [Google Scholar] [CrossRef]
- Yang, L.; Liu, D.; Huang, Y.; Yang, Z.; Ji, D.; Song, L. Isotope analysis of the nutrient supply in Xiangxi Bay of the Three Gorges Reservoir. Ecol. Eng. 2015, 77, 65–73. [Google Scholar] [CrossRef]
- Yang, Z.; Cheng, B.; Xu, Y.; Liu, D.; Ma, J.; Ji, D. Stable isotopes in water indicate sources of nutrients that drive algal blooms in the tributary bay of a subtropical reservoir. Sci. Total Environ. 2018, 634, 205–213. [Google Scholar] [CrossRef] [PubMed]
- Ma, J.; Liu, D.; Wells, S.A.; Tang, H.; Ji, D.; Yang, Z. Modeling density currents in a typical tributary of the Three Gorges Reservoir, China. Ecol. Model. 2015, 296, 113–125. [Google Scholar] [CrossRef]
- Mao, J.; Jiang, D.; Dai, H. Spatial-temporal hydrodynamic and algal bloom modelling analysis of a reservoir tributary embayment. J. Hydro-Environ. Res. 2015, 9, 200–215. [Google Scholar] [CrossRef]
- Zhou, G.; Zhao, X.; Bi, Y.; Hu, Z. effects of rainfall on spring phytoplankton community structure in xiangxi bay of the three-gorges reservoir, china. Fresenius Environ. Bull. 2012, 21, 3533–3541. [Google Scholar]
- Ye, L.; Cai, Q.; Zhang, M.; Tan, L.; Shen, H. Ecosystem metabolism and the driving factors in Xiangxi Bay of Three Gorges Reservoir, China. Freshwater Sci. 2016, 35, 826–833. [Google Scholar] [CrossRef]
- Lv, Y.; Liu, D.; Huang, Y.; Yang, Z.; Ji, D.; Cui, Y. Impacts of reverse density flow on nutrient distribution in shennong bay during preflood water supply period. Resour. Environ. Yangtze Basin 2015, 24, 653–660. [Google Scholar]
- Zhu, K.; Bi, Y.; Hu, Z. Responses of phytoplankton functional groups to the hydrologic regime in the Daning River, a tributary of Three Gorges Reservoir, China. Sci. Total Environ. 2013, 450, 169–177. [Google Scholar] [CrossRef] [PubMed] [Green Version]
- Shi, Y.; Xu, G.; Wang, Y.; Engel, B.A.; Peng, H.; Zhang, W.; Cheng, M.; Dai, M. Modelling hydrology and water quality processes in the Pengxi River basin of the Three Gorges Reservoir using the soil and water assessment tool. Agric. Water Manag. 2017, 182, 24–38. [Google Scholar] [CrossRef]
- Gao, J.; Wu, L.; Chen, Y.; Zhou, B.; Guo, J.; Zhang, K.; Ouyang, W. Spatiotemporal distribution and risk assessment of organotins in the surface water of the Three Gorges Reservoir Region, China. Chemosphere 2017, 171, 405–414. [Google Scholar] [CrossRef]
- Scholz-Starke, B.; Bo, L.; Holbach, A.; Norra, S.; Floehr, T.; Hollert, H.; Ross-Nickoll, M.; Schaeffer, A.; Ottermanns, R. Simulation-based assessment of the impact of fertiliser and herbicide application on freshwater ecosystems at the Three Gorges Reservoir in China. Sci. Total Environ. 2018, 639, 286–303. [Google Scholar] [CrossRef] [PubMed]
- Bureau, C.E.P. Monitoring and Analysis Method in Water and Wastewater, 4th ed.; Environmental Science Press: Beijing, China, 2013. [Google Scholar]
- China Meteorological Data Sharing Website. Available online: http://data.cma.cn (accessed on 31 December 2015).
- China Meteorological Administration. Meteorological Drought Rating; China Standard Press: Beijing, China, 2006. [Google Scholar]
- Hydrological Bureau of the Ministry of Water Resources, PRC. Hydrological Yearbook of the PRC (2013,2014,2015); Hydrographic Data of the Yangtze River Basin; Water Conservancy Press: Beijing, China, 2014,2015,2016; Volume 6. [Google Scholar]
- James, W.F.; Kennedy, R.H.; Montgomery, R.H.; Nix, J. seasonal and longitudinal variations in apparent deposition rates within an arkansas reservoir. Limnol. Oceanogr. 1987, 32, 1169–1176. [Google Scholar] [CrossRef]
- Vasek, M.; Kubecka, J.; Peterka, J.; Cech, M.; Drastik, V.; Hladik, M.; Prchalova, M.; Frouzova, J. Longitudinal and vertical spatial gradients in the distribution of fish within a canyon-shaped reservoir. Int. Rev. Hydrobiol. 2004, 89, 352–362. [Google Scholar] [CrossRef]
- Holbach, A.; Wang, L.; Chen, H.; Hu, W.; Schleicher, N.; Zheng, B.; Norra, S. Water mass interaction in the confluence zone of the Daning River and the Yangtze River-a driving force for algal growth in the Three Gorges Reservoir. Environ. Sci. Pollut. Res. 2013, 20, 7027–7037. [Google Scholar] [CrossRef] [PubMed]
- Gao, M.; Zhu, K.; Bi, Y.; Hu, Z. Spatiotemporal patterns of surface-suspended particulate matter in the Three Gorges Reservoir. Environ. Sci. Pollut. Res. 2016, 23, 3569–3577. [Google Scholar] [CrossRef]
- Ye, L.; Li, D.; Tang, T.; Qu, X.; Cai, Q. Spatial distribution of water quality in Xiangxi River, China. J. Appl. Ecol. 2003, 14, 1959–1962. [Google Scholar]
- Zhang, Y.; Liu, D.; Ji, D.; Yang, Z.; Chen, Y. Effects of Intrusions from Three Gorges Reservoir on Nutrient Supply to Xiangxi Bay. Huanjing Kexue 2012, 33, 2621–2627. [Google Scholar]
- Chen, Y.; Liu, D.; Yang, Z.; Wang, Y.; Ji, D.; Zhang, P.; Li, Y. The impacts of the stratified density currents on supply pattern of main nutrients in Xiangxi River. Acta Sci. Circumstantiae 2013, 33, 762–770. [Google Scholar]
- Xu, Y.; Shao, M.; Cao, M.; Zhou, S.; Cai, Q. Using temporal coherence to determine the responses of water clarity to hydrological processes in a giant subtropical canyon-shaped reservoir (China). Q. Int. 2010, 226, 151–159. [Google Scholar] [CrossRef] [Green Version]
- Xu, Y.; Zhang, M.; Wang, L.; Kong, L.; Cai, Q. Changes in water types under the regulated mode of water level in Three Gorges Reservoir, China. Q. Int. 2011, 244, 272–279. [Google Scholar] [CrossRef] [Green Version]
- Shao, M.; Xu, Y.; Cai, Q. Effects of Reservoir Mainstream on Longitudinal Zonation in Reservoir Bays. J. Freshw. Ecol. 2010, 25, 107–117. [Google Scholar] [CrossRef] [Green Version]
- Zhang, Y.; Zhong, P.; Chen, J.; Bing, J.; Xu, D.; Wang, M. Impacts of Climate Change and Human Activities on the Three Gorges Reservoir Inflow. Water 2017, 9, 957. [Google Scholar] [CrossRef]
- Hu, M.; Huang, G.H.; Sun, W.; Ding, X.; Li, Y.; Fan, B. Optimization and Evaluation of Environmental Operations for Three Gorges Reservoir. Water Resour. Manag. 2016, 30, 3553–3576. [Google Scholar] [CrossRef] [Green Version]
- Okeeffe, J.; Harper, D.; Ferguson, A.J.D. Managing Rivers and Their Water Resources as Sustainable Ecosystems—The South-African Experience; Ecological Basis for River Management: Beijing, China, 1995; pp. 491–503. [Google Scholar]
- Nogueira, M.G.; Henry, R.; Maricatto, F.E. Spatial and temporal heterogeneity in the Jurumirim Reservoir, Sao Paulo, Brazil. Lakes Reservoirs Res. Manag. 1999, 4, 107–120. [Google Scholar] [CrossRef]
- Zhai, X.; Xia, J.; Zhang, Y. Integrated approach of hydrological and water quality dynamic simulation for anthropogenic disturbance assessment in the Huai River Basin, China. Sci. Total Environ. 2017, 598, 749–764. [Google Scholar] [CrossRef] [PubMed]
- Skoulikaris, C.; Ganoulis, J. multipurpose hydropower projects economic assessment under climate change conditions. Fresenius Environ. Bull. 2017, 26, 5599–5607. [Google Scholar]
- Zheng, B.; Cao, C.; Qin, Y.; Huang, M. Analysis of nitrogen distribution characters and their sources of the major input rivers of three gorges reservoir. Huanjing Kexue 2008, 29, 1–6. [Google Scholar] [PubMed]
- Huang, Y.; Zhang, P.; Liu, D.; Yang, Z.; Ji, D. Nutrient spatial pattern of the upstream, mainstream and tributaries of the Three Gorges Reservoir in China. Environ. Monit. Assess. 2014, 186, 6833–6847. [Google Scholar] [CrossRef]
- Cai, Q.; Sun, Z. Water environment and aquatic ecosystem of Three Gorges Reservoir, China: Progress and prospects. Hupo Kexue 2012, 24, 169–177. [Google Scholar]
- Ye, L.; Cai, Q. Spring phytoplankton blooms in Xiangxi Bay of Three-Gorges Reservoir: Spatiotemporal dynamics across sharp nutrient gradients. J. Freshw. Ecol. 2011, 26, 11–18. [Google Scholar] [CrossRef]
- Li, F.; Ye, L.; Liu, R.; Cao, M.; Ca, Q. Dynamics of the main nutrients input to Xiangxi Bay of Three Gorge Reservoir. Acta Ecol. Sin. 2008, 28, 2073–2079. [Google Scholar]
- Zhou, H.; Fang, F.; Li, Z.; Guo, J.; de Koning, J.; van der Graaf JH, J.M. Spatiotemporal variations in euphotic depth and their correlation with influencing factors in a tributary of the Three Gorges Reservoir. Water Environ. J. 2014, 28, 233–241. [Google Scholar] [CrossRef]
Figure 1.
Sampling sites distribution map of the Long River (LR).

Figure 2.
Succession of meteorological and hydrological factors in the LR from 2013 to 2015. WL: water level; CP: cumulative precipitation; CNR: cumulative net radiation.
Figure 2.
Succession of meteorological and hydrological factors in the LR from 2013 to 2015. WL: water level; CP: cumulative precipitation; CNR: cumulative net radiation.

Figure 3.
Seasonal variation in 10 water environment variables sampled from six sites from the LRB (LH1, LH2, LH3, LH4, LH5), and LH6: (a) WT, (b) EC, (c) DO, (d) TA, (e) TURB, (f) TRANS, (g) TN, (h) TP, (i) Chl.a, and (j) COD; SP: spring, SU: summer, AU: autumn, WI: winter.
Figure 3.
Seasonal variation in 10 water environment variables sampled from six sites from the LRB (LH1, LH2, LH3, LH4, LH5), and LH6: (a) WT, (b) EC, (c) DO, (d) TA, (e) TURB, (f) TRANS, (g) TN, (h) TP, (i) Chl.a, and (j) COD; SP: spring, SU: summer, AU: autumn, WI: winter.


Figure 4.
Variation of the distance coefficient between the sampling sites in LRB and the control sites: (a) to LH6, (b) to CJ.
Figure 4.
Variation of the distance coefficient between the sampling sites in LRB and the control sites: (a) to LH6, (b) to CJ.

Figure 5.
Comparison of the distance coefficient between the sampling site in LRB and the control sites of inflow and the YR from 2013 to 2015.
Figure 5.
Comparison of the distance coefficient between the sampling site in LRB and the control sites of inflow and the YR from 2013 to 2015.

Figure 6.
Redundancy analysis (RDA) ordination biplot of water environment variables and meteo-hydrological factors in the perennial backwater area of LR, China.
Figure 6.
Redundancy analysis (RDA) ordination biplot of water environment variables and meteo-hydrological factors in the perennial backwater area of LR, China.

Figure 7.
RDA ordination biplot of water environment variables and meteo-hydrological factors in the fluctuation backwater area of LR, China.
Figure 7.
RDA ordination biplot of water environment variables and meteo-hydrological factors in the fluctuation backwater area of LR, China.

Figure 8.
RDA ordination biplot of water environment variables and meteo-hydrological factors in the upstream inflow area of LR, China.
Figure 8.
RDA ordination biplot of water environment variables and meteo-hydrological factors in the upstream inflow area of LR, China.

Figure 9.
Explanation efficiency of the collaborative effect of both time and space on the water environment variation of the LR, China, 2013–2015.
Figure 9.
Explanation efficiency of the collaborative effect of both time and space on the water environment variation of the LR, China, 2013–2015.

Figure 10.
RDA ordination biplot of environmental variables and time succession from the LR, China, 2013–2015.
Figure 10.
RDA ordination biplot of environmental variables and time succession from the LR, China, 2013–2015.

Figure 11.
RDA ordination biplot of environmental variables and location distribution from the LR, China, 2013–2015.
Figure 11.
RDA ordination biplot of environmental variables and location distribution from the LR, China, 2013–2015.


Table 1.
Statistics table of water environment variables sampled from Long River Bay (LRB), China.
| WT | EC | pH | TRANS | DO | CODMn | TA | TP | SOP | TN | NO3-N | NH3-N | CHROM | Turb | SSi | chl.a | SS | |
|---|---|---|---|---|---|---|---|---|---|---|---|---|---|---|---|---|---|
| °C | μS·cm−1 | m | mg·L−1 | mg·L−1 | mg·L−1 | mg·L−1 | mg·L−1 | mg·L−1 | mg·L−1 | mg·L−1 | NTU | mg·L−1 | mg·m−3 | mg·L−1 | |||
| LH1 | 17.8 ± 5.2 | 337.1 ± 53.1 | 7.96 ± 0.34 | 1.54 ± 1.12 | 9.11 ± 1.43 | 2.28 ± 0.42 | 99.2 ± 12.1 | 0.12 ± 0.04 | 0.07 ± 0.04 | 2.04 ± 0.31 | 1.64 ± 0.31 | 0.076 ± 0.067 | 16.3 ± 6.8 | 13.9 ± 19.6 | 6.6 ± 1.1 | 5.1 ± 8.3 | 9.1 ± 4 |
| (9.1–28.9) | (252–449) | (7.33–8.78) | (0.05–4) | (7.14–13.51) | (1.3–3.24) | (73.2–124.9) | (0.05–0.22) | (DL–0.17) | (1.34–2.69) | (0.96–2.22) | (DL–0.25) | (2.5–30) | (0.1–70.6) | (4–8.1) | (0–40.1) | (2.7–26.1) | |
| LH2 | 17.8 ± 5.1 | 325.8 ± 49.1 | 7.96 ± 0.32 | 1.52 ± 1.03 | 9.12 ± 1.52 | 2.34 ± 0.47 | 99.2 ± 12.6 | 0.11 ± 0.04 | 0.06 ± 0.04 | 2.05 ± 0.33 | 1.61 ± 0.3 | 0.085 ± 0.071 | 16.2 ± 6.7 | 12.1 ± 22 | 6.6 ± 1.2 | 5.2 ± 8 | 9.3 ± 5.4 |
| (8.7–27.8) | (246–422) | (7.45–8.7) | (0.05–3.5) | (5.83–14.43) | (1.45–3.38) | (78–123) | (0.04–0.21) | (DL–0.15) | (1.39–2.84) | (0.93–2.1) | (DL–0.345) | (2.5–30) | (0–80.1) | (3.6–8.8) | (0.2–44.6) | (2.6–32) | |
| LH3 | 17 ± 5 | 307 ± 50.8 | 8.01 ± 0.4 | 1.48 ± 1.09 | 9.34 ± 1.76 | 2.44 ± 0.54 | 97.9 ± 11.9 | 0.11 ± 0.08 | 0.04 ± 0.04 | 1.95 ± 0.31 | 1.56 ± 0.33 | 0.078 ± 0.07 | 16.9 ± 7.8 | 11.1 ± 19.4 | 6.5 ± 1.3 | 11.9 ± 27.8 | 10.2 ± 5.7 |
| (8.5–27.2) | (172–419) | (7.46–9.02) | (0.15–4) | (5.48–14.38) | (1.47–3.93) | (73.4–117) | (0.02–0.42) | (DL–0.13) | (0.88–2.62) | (0.74–2.18) | (DL–0.25) | (2.5–35) | (0–86.3) | (3.5–8.4) | (0–120.3) | (3–30.5) | |
| LH4 | 16.8 ± 4.5 | 290.3 ± 47.4 | 7.89 ± 0.36 | 1.54 ± 1.24 | 9.16 ± 1.45 | 2.29 ± 0.47 | 96.3 ± 12.3 | 0.07 ± 0.03 | 0.03 ± 0.02 | 1.95 ± 0.33 | 1.59 ± 0.3 | 0.066 ± 0.062 | 15.9 ± 6.7 | 14.4 ± 22.7 | 6.4 ± 1.2 | 2.6 ± 3.6 | 9.9 ± 4.6 |
| (8.2–25.8) | (160–409) | (6.9–8.71) | (0.05–5.2) | (5.66–12.12) | (1.38–3.4) | (75.7–123) | (0.02–0.14) | (DL–0.09) | (1.3–2.65) | (0.82–2.11) | (DL–0.23) | (2.5–30) | (0–81.8) | (3.4–8.8) | (0–21.5) | (2.4–23.6) | |
| LH5 | 16.6 ± 4.3 | 293 ± 43.6 | 7.92 ± 0.35 | 1.39 ± 1.16 | 9.05 ± 1.68 | 2.2 ± 0.51 | 97.3 ± 11.3 | 0.07 ± 0.03 | 0.03 ± 0.02 | 1.96 ± 0.31 | 1.62 ± 0.31 | 0.073 ± 0.068 | 16.3 ± 6.6 | 13.6 ± 19.5 | 6.3 ± 1.3 | 2.3 ± 3.7 | 10 ± 4.1 |
| (7.8–24.6) | (226–397) | (6.8–8.88) | (0.05–4.3) | (4.96–11.89) | (0.8–3.46) | (74.4–123.1) | (0.01–0.15) | (DL–0.08) | (1.12–2.54) | (0.82–2.26) | (DL–0.25) | (2.5–30) | (0–88) | (2.7–9.2) | (0–21.8) | (3.2–22.1) | |
| LH6 | 15 ± 3.4 | 309.2 ± 40 | 7.95 ± 0.37 | 1.31 ± 1.06 | 10.44 ± 1.03 | 1.95 ± 0.69 | 107.1 ± 14.4 | 0.05 ± 0.04 | 0.02 ± 0.02 | 1.83 ± 0.31 | 1.58 ± 0.28 | 0.043 ± 0.049 | 16.5 ± 6.9 | 23.5 ± 31.9 | 5.9 ± 1.4 | 1 ± 1.1 | 10.6 ± 7.1 |
| (5.8–21.1) | (227.5–392.5) | (6.5–9) | (0.05–3.55) | (8.48–12.86) | (0.73–3.29) | (83.6–142.9) | (0.01–0.15) | (DL–0.1) | (1.08–2.65) | (0.83–2.19) | (DL–0.2) | (2.5–30) | (0.6–123.7) | (2.7–8.3) | (0–4.9) | (3–38) | |
| CJ | 18.7 ± 5.1 | 377.9 ± 56.9 | 7.95 ± 0.29 | 1.36 ± 1.07 | 8.67 ± 1.06 | 2.39 ± 0.5 | 105.7 ± 12.7 | 0.14 ± 0.05 | 0.09 ± 0.04 | 2.1 ± 0.38 | 1.74 ± 0.32 | 0.076 ± 0.065 | 18.3 ± 8.3 | 27.2 ± 48.2 | 6.6 ± 1.3 | 0.9 ± 0.7 | 10.8 ± 5.3 |
| (9.2–27.2) | (214–471) | (7.32–8.44) | (0.1–3.6) | (6.26–10.85) | (1.29–3.37) | (77.9–135.7) | (0.01–0.23) | (DL–0.17) | (0.96–2.88) | (0.83–2.32) | (DL–0.3) | (5–40) | (0.7–215) | (3.7–8.6) | (0–3) | (2.8–31.6) |
N = 36, mean ± standard deviation, (min–max), DL: detection limit; TRANS: transparency; DO: dissolved oxygen; CODMn: permanganate index; TA: total alkalinity; TP: total phosphorus; TN: total nitrogen; NO3-N: nitrate nitrogen; NH3-N: ammonia nitrogen; CHROM: chroma; TURB: turbidity; SSi: soluble silicate; chl.a: chlorophyll a; SS: suspended substance; WT: water temperature; EC: electrical conductivity.
Table 2.
Spearman correlation coefficient matrix of water environment variables sampled from LRB, China.
Table 2.
Spearman correlation coefficient matrix of water environment variables sampled from LRB, China.
| WT | EC | pH | TRANS | DO | CODMn | TA | TP | SOP | TN | NO3-N | NH3-N | CHROM | TURB | SSi | Chl.a | SS | |
|---|---|---|---|---|---|---|---|---|---|---|---|---|---|---|---|---|---|
| WT | 1 | ||||||||||||||||
| EC | −0.261 ** | 1 | |||||||||||||||
| pH | 0.285 ** | −0.032 | 1 | ||||||||||||||
| TRANS | −0.488 ** | 0.255 ** | −0.155 * | 1 | |||||||||||||
| DO | −0.529 ** | 0.088 | 0.149 * | 0.048 | 1 | ||||||||||||
| CODMn | 0.383 ** | −0.108 | 0.058 | −0.411 ** | −0.278 ** | 1 | |||||||||||
| TA | −0.257 ** | 0.250 ** | −0.062 | 0.291 ** | 0.184 ** | −0.243 ** | 1 | ||||||||||
| TP | 0.035 | 0.442 ** | −0.05 | 0.097 | −0.261 ** | 0.158 * | 0.074 | 1 | |||||||||
| SOP | −0.056 | 0.458 ** | −0.212 ** | 0.388 ** | −0.373 ** | −0.075 | 0.148 * | 0.778 ** | 1 | ||||||||
| TN | 0.057 | 0.083 | −0.175 ** | −0.270 ** | −0.147 * | 0.212 ** | −0.086 | 0.391 ** | 0.292 ** | 1 | |||||||
| NO3-N | 0.001 | 0.140 * | −0.209 ** | −0.319 ** | −0.12 | 0.274 ** | 0.028 | 0.262 ** | 0.227 ** | 0.708 ** | 1 | ||||||
| NH3-N | 0.053 | −0.145 * | 0.195 ** | 0.08 | −0.152 * | −0.017 | −0.019 | 0.305 ** | 0.269 ** | 0.077 | −.139 * | 1 | |||||
| CHROM | 0.488 ** | −0.145 * | 0.122 | −0.685 ** | −0.06 | 0.365 ** | −0.177 ** | −0.096 | −0.327 ** | 0.289 ** | 0.263 ** | −.179 ** | 1 | ||||
| TURB | 0.511 ** | −0.340 ** | 0.175 ** | −0.871 ** | −0.086 | 0.328 ** | −0.209 ** | −0.140 * | −0.375 ** | 0.237 ** | 0.337 ** | −0.111 | 0.684 ** | 1 | |||
| SSi | −0.176 ** | 0.088 | −0.076 | 0.183 ** | −0.019 | 0.096 | 0.271 ** | 0.148 * | 0.195 ** | 0.235 ** | 0.292 ** | −0.111 | −0.083 | −0.135 * | 1 | ||
| Chl.a | 0.280 ** | −0.246 ** | 0.197 ** | −0.349 ** | −0.088 | 0.201 ** | −0.344 ** | 0.04 | −0.192 ** | 0.031 | −0.083 | 0.109 | 0.316 ** | 0.262 ** | −0.139 * | 1 | |
| SS | 0.219 ** | −0.109 | 0.05 | −0.480 ** | −0.049 | 0.104 | −0.176 ** | −0.01 | −0.210 ** | 0.217 ** | 0.211 ** | −0.121 | 0.479 ** | 0.517 ** | −0.03 | 0.136 * | 1 |
N = 246; * indicates p < 0.05; ** indicates p < 0.01 (double-tailed test); values whose correlation coefficient ≥0. 5 shall be displayed in bold type font.
Table 3.
Forward selection results of factors influencing LR water environment variables. DNR: daily net radiation; DAT: daily average temperature.
Table 3.
Forward selection results of factors influencing LR water environment variables. DNR: daily net radiation; DAT: daily average temperature.
| Environment Variable | Explains % | Contribution % | Pseudo-F | p |
|---|---|---|---|---|
| perennial backwater area | ||||
| WL | 39.9 | 66.3 | 68.3 | 0.001 |
| CP | 11.5 | 19.1 | 24.1 | 0.001 |
| CNR | 2.3 | 3.9 | 5.1 | 0.003 |
| DP | 1.3 | 2.2 | 2.9 | 0.045 |
| fluctuating backwater area | ||||
| CP | 42.9 | 67.7 | 52.6 | 0.001 |
| WL | 10.3 | 16.3 | 15.2 | 0.001 |
| CNR | 2.3 | 3.6 | 3.5 | 0.024 |
| DNR | 2.3 | 3.6 | 3.6 | 0.021 |
| DAT | 2.3 | 3.6 | 3.7 | 0.021 |
| upstream area | ||||
| CP | 44 | 76.9 | 25.1 | 0.001 |
© 2018 by the authors. Licensee MDPI, Basel, Switzerland. This article is an open access article distributed under the terms and conditions of the Creative Commons Attribution (CC BY) license (http://creativecommons.org/licenses/by/4.0/).
Share and Cite
MDPI and ACS Style
Hu, S.; Xia, J.; Wu, X.; Wang, Y.; Xia, F. Water Environment Variation in the Three Gorges Tributary and Its Influencing Factors on Different Scales. Water 2018, 10, 1831. https://0-doi-org.brum.beds.ac.uk/10.3390/w10121831
AMA Style
Hu S, Xia J, Wu X, Wang Y, Xia F. Water Environment Variation in the Three Gorges Tributary and Its Influencing Factors on Different Scales. Water. 2018; 10(12):1831. https://0-doi-org.brum.beds.ac.uk/10.3390/w10121831
Chicago/Turabian StyleHu, Sheng, Jun Xia, Xia Wu, Yingcai Wang, and Fan Xia. 2018. "Water Environment Variation in the Three Gorges Tributary and Its Influencing Factors on Different Scales" Water 10, no. 12: 1831. https://0-doi-org.brum.beds.ac.uk/10.3390/w10121831
Note that from the first issue of 2016, this journal uses article numbers instead of page numbers. See further details here.