1. Introduction
Climate change and human activities are two factors driving change in the hydrological cycle of watersheds and water resources in terms of hydrological response, energy structure, and the social economy, which have become the focus of current research in the field of global change [
1,
2]. Climate change leads to changes in atmospheric circulation including evaporation and precipitation conditions, through changes in rainfall distribution, and the evaporation and precipitation conditions in surface waters and soils [
3,
4]. Human activities including agricultural irrigation, water conservancy projects, and urbanization have directly affected the natural circulation of water resources in many regions [
5,
6]. These changes lead to decreases in runoff and increases in extreme events [
7,
8]. According to the IPCC assessment report, global climate has warmed over the past 100 years, and the climate change has seriously affected the streamflow regime [
3]. Consequently, climate change and human activities have threatened the availability of water resources that is critical to human survival, especially in terms of energy structure and production [
9,
10].
According to the U.S. Climate Change Science Program (CCSP), a new clean energy structure that includes solar, wind, and hydro-power would be an effective solution to control CO
2 emissions caused by coal power generation [
11]. Additionally, hydropower is also responsible for regulating the safety of power grid systems in future energy structures [
12]. Take the current Chinese energy structure as an example, the hydropower installed capacity had exceeded 300 GW, about 50% of the total installed power capacity, up to 2015, and about half of total power generation was hydropower from 2000–2015 [
13]. However, hydropower is vulnerable to climate change and human activities [
14]. As an important input to the hydropower generation system, runoff and water distribution changes under the influences of climate change and human activities would directly impact the operation of power stations. Therefore, researching the influences of climate change and human activities on hydrological systems and establishing efficient coping strategies are of great significance for cascade power stations.
In recent years, scholars have carried out research on how climate change and human activities have affected the hydrological processes and the operation of hydropower stations. Viers considered it necessary to anticipate changing climatic and hydrological conditions for a similar period of time for operations of hydropower stations [
15]. Harrison G P built a simulation model based on electricity systems to explore the sensitivity of power station operations to climate change [
16]. Ehsani indicated that modifying reservoir operations and increasing the size and number of dams was necessary to offset the vulnerabilities of water resources to future climate uncertainties [
17]. Ahmadi established the reservoir optimization scheduling model on the premise of considering future climate change, and the model coordinated the contradiction between the power generation guarantee rate and the vulne’rability of the reservoir [
18]. Minville took the Peribonka basin water resources system in Canada as an example, and evaluated the impact of climate change scenarios on the adaptive scheduling results of the water resources system [
19]. However, most previous research has focused on determining the characteristics and extent of change in hydropower systems under climate change [
15,
16,
17,
18,
19]. There have been few studies on the combined effects of climate change and human activity coping strategies for power stations. Chang proposed an optimal adaptive operation chart for cascade hydropower system to increase power generation under changing environmental conditions providing novels methods for hydropower station operation under climate change [
13].
Meanwhile, to balance the economic development of different regions, changing the distribution of water resources artificially has occurred more frequently [
20]. For example, a number of Inter-Basin Water Transfer (referred to hereafter as “IBWT”) projects have been built, so the runoff of the source area was changed [
21]. The operation of original cascade hydropower stations under new hydrological conditions would be challenging for both water source areas and water intake areas [
22,
23]. Therefore, assessing the combined impact of climate change and human activities on the operations of hydropower stations and developing novel operational strategies to respond to changing conditions are more necessary.
Based on previous studies, the main objective of this study is to generate modified operation charts for the cascade power stations in the upper Han River to reduce the influence of climate change and human activities. This study analyzes the extent of impacts from climate change and human activities on power station operation both separately and combined. Then, the simulated reservoir operation charts are modified based on the traditional operation chart, and an optimal single and cascade operation charts are generated by the cuckoo algorithm based on the simulated chart. Finally, an optimal operation chart of the Hanjiang to Weihe River Valley Water Diversion Project (referred to hereafter as “the Project”) is generated considering the downstream cascade power stations. This research would help quantify the impact of climate change and human activities on the operation of power stations, and provide reference value for the coping strategies for power stations.
2. Study Area and Data
2.1. The Upper Han River
The Han River is the largest tributary of the Yangtze River, China. The upper Han River is located before the Danjiangkou reservoir, with a length of 918 km and a drainage area of 95,200 km
2. The upper Han River is in an area with a subtropical humid climate. The annual rainfall distribution in this area is uneven and most runoff recharge is surface runoff from rainfall. The main flood season is from July–September; however, some small floods also occur from mid–late April [
24].
The Han River occupies a prominent position in the social development of the Yangtze River Basin. Besides providing water to the provinces in the basin, the Han River is also the water source of some IBWT projects, such as the Project and the Mid-Line Project of the South-to-North Water Transfer Project. The Project being built is the only large-scale human activities in the upstream of the cascade power stations, like
Figure 1 shows, the cascade power stations must be affected by the future operation of the Project [
25]. Also, Chang has verified that the runoff in the upper Han River is mutated resulted from climate change [
13]. Therefore, it is urgently needed to modify the operation charts for these hydropower stations to respond to future changing hydrological environments caused by climate change and human activities.
2.2. Cascade Hydropower Stations
There are three hydropower stations on the upper Han River, namely Shiquan, Xihe, and Ankang, which are the research objects of this paper. The characteristics of the cascade reservoirs are listed in
Table 1.
These three power stations are an important part of the Northwest Power Grid, which is responsible for power generation, power grid peaking, and frequency modulation. In the upstream of the cascade hydropower station, the Project is being built, which will inevitably affect the operation of the cascade hydropower stations.
2.3. The Project
Uneven distribution of water resource is obvious in Shaanxi province, China, where the southern region has a large amount of water resource, and the central and northern regions is shortage. This situation is caused by weather conditions and the rapidity of the economic development and urbanization in the area coupled with a growing population and poor water resource management [
26]. As a strategic project to improve the ecological environment and to upgrade industry, the Project is being developed in the upper Han River and will be in operation by 2025. The main task of the Project is to transfer multi-year average of 1.5 billion m
3 of water from the Han River to the Guanzhong region, including important cities, counties, and industrial parks. The Project consists of two water source areas connected by a water transfer tunnel. The Huangjinxia reservoir (HJX) in the main stream has abundant water with no regulation ability, and the Sanhekou reservoir (SHK) in a tributary has pluriennal regulation capacity with less water.
The reservoirs and power stations in the upper Han River are shown in
Figure 1, the Project is located upstream of the Shiquan power station. The Shiquan reservoir has an annual average inflow of about of 10 billion m
3, it means that the amount of water transferred by the Project accounts for 15% of the inflow of the Shiquan reservoir.
2.4. Data Collection
In the present study, the monthly inflow data series for the three reservoirs were from 1954–2010 and were considered to be reasonable and representative. Information on the water transfer process of the Project from 1954 - 2010 was from the Yangtze River Water Resources Commission. The reservoir inflow data and the conventional hydroelectric operation charts (
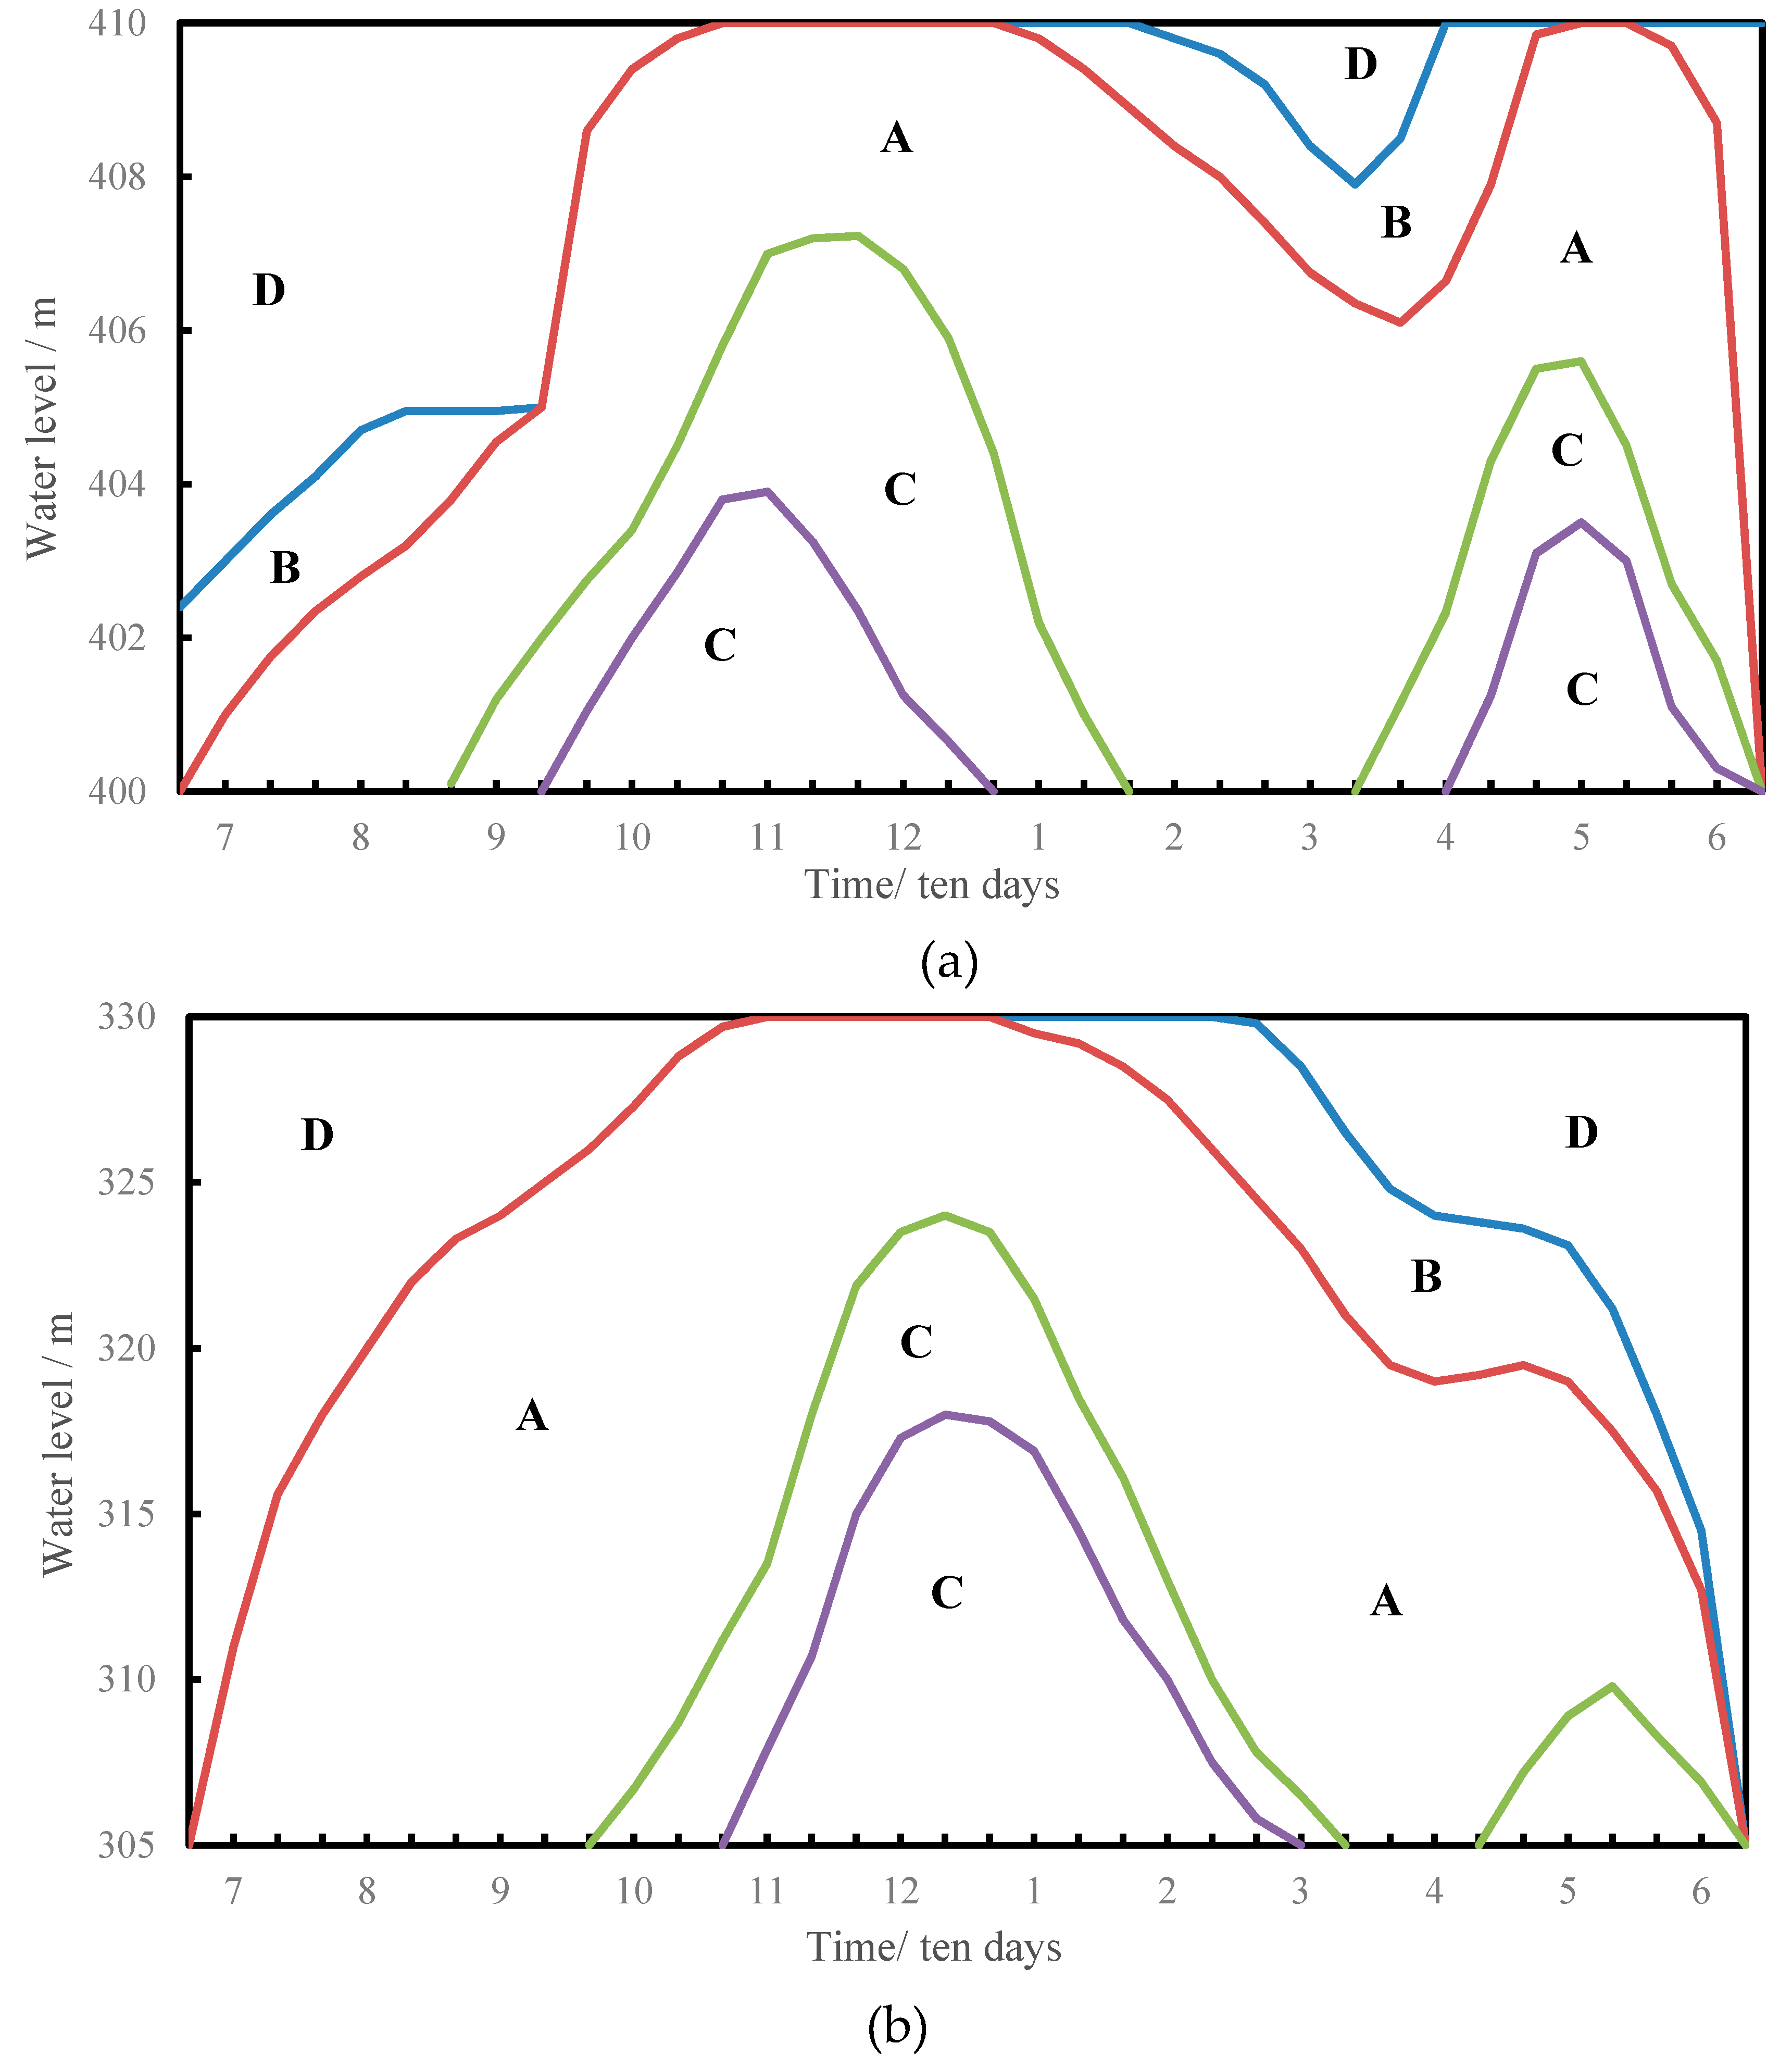
Figure 2) of Shiquan and Ankang were obtained from the hydropower plants. The operation chart consisted of four parts and the meaning and application of each is as follows:
(1) Part A refers to the guaranteed output area located between the upper and lower basic lines. If the water level at time t is in this part, then the hydropower station operates based on the guaranteed output.
(2) Part B refers to the increased output area located between the upper basic line and the anti-abandon water line. If the water level at time t is in this part, then the hydropower station should increase output based on the guaranteed output. In Shiquan and Ankang power station, the discount factor is 1.2, it means the hydropower station should operate based on 1.2 times guaranteed output.
(3) Part C refers to the decreased output area located between the lower basic line and the dead water line. If the water level at time t is in this part, then the hydropower station should decrease output based on the guaranteed output. In Shiquan and Ankang power station, the discount factor is 0.8, it means the hydropower station should operate based on 0.8 times guaranteed output.
(4) Part D refers to the flood control area. Once the water level is in this part, the reservoir should operate under the specified flood control rules.
3. Materials and Methods
3.1. Variation of Runoff
The Mann-Kendall (MK) test is a nonparametric method for analyzing trends in time series and is recommended by the World Meteorological Organization [
27,
28]. Many scholars have used the MK test to analyze trends in precipitation, runoff, temperature, and water quality. The MK test is simple and easy to calculate and is applicable to data of non-normal distribution such as the data generally found in hydrology and meteorology studies. The detailed calculation process can be found in References [
29,
30].
3.2. Hydroelectric Operation Charts
Operation rules are an intuitive and practical way to guide the operation of reservoir, and the operation chart is a practical method for applying the rules in practice and so have been widely used in engineering operations [
31,
32]. The hydropower plant compares the conditions of the reservoir with the operation chart and accordingly stores or discharges water from the reservoir to meet the power generation requirements of the power system. For most hydropower plants, the hydroelectric operation charts were generated by historical runoff series and practical experience without hydrological forecasting [
33]. However, under the combined influences of climate change and human activities, inflow runoff has changed since the traditional operation chart is designed according the initial runoff series. If the regulation capacity of a reservoir is limited compared with its inflow runoff, then runoff would largely determine the power generation of the hydropower stations. Especially if the guaranteed output area is too wide so that it further increases the difficulties in finding optimal global solutions. Therefore, exploring the coping strategies that are used to adjust conventional operation charts is of great urgency.
In recent years, much research regarding operation charts has been conducted, from which the methods of operation charts can be classified into three categories. One is the regular operation chart based on a simulation model with some manual corrections [
34]. Second is the implicit stochastic optimal operation. The historical runoff series are input into the deterministic optimization model to obtain the optimal running solutions of the reservoir, and the operation rules are mined based on these solutions [
35]. However, this operation chart is easily influenced by data mining methods and system errors. Third is to optimize the generalized operation chart directly [
36]. The advantage being that the operation chart is optimized directly with less decision variables to avoid the “dimension disaster”, and getting reasonable solutions by the long runoff series instead typical year. The optimization results can directly generate operation charts and can be analyzed and compared intuitively. Considering the existing conventional operation charts and basic rules, the third method was chosen for the present study. The four main parts are defined as follows:
(1) Part one: Generalize the initial operation charts, including the type and location of the selected water level line.
(2) Part two: Build a simulation model based on the basic rules and determine the objective functions.
(3) Part three: Choose the decision variables and an optimization method, and input the runoff series into the simulation model to calculate the objective function based on the generalized operation charts.
(4) Part four: Start evolution and iteration, and select the final operation chart corresponding to the best objective function result.
Reservoir operation methods have been greatly developed over the past 64 years. Little first applied dynamic programming and Markov chain methods to reservoir scheduling [
37]. Evolutionary algorithms have also been widely used to optimize reservoir operations owing to their simple principles, easy implementation, parallel search capability, and global optimization ability, such as Genetic Algorithm [
38], Particle Swarm Optimization [
39], Cuckoo Search Algorithm (CS) [
40], and Differential Evolution Algorithm (DE) [
41]. The CS algorithm was chosen for use in the present study owing to its superior search performance, fewer parameters, and robustness to obtain the optimal operation charts. CS mainly involves initializing the population, using Levi’s flight to update the bird’s nest position, and calculating fitness values; specific steps were shown in Reference [
40].
3.3. Model Construction and Parameters
3.3.1. Simulation Model
The simulation model is constructed to analyze the influences of climate change and human activities singly and combined and to calculate the regular operation chart. This is also one part of the optimal model, which is used to obtain the optimal operation chart. The main purpose of establishing the simulation model is to generate the regular hydroelectric operation chart with the climate change and human activities data. The regular hydroelectric operation chart is drawn by the typical year method and co-output method. In this method, the dry season and wet season are determined first, then repeated to try out the power plant’s output process until the output at time t is close to the basic output. The basic principle of the simulation model is water balance, and the main calculation processes are as follows:
Step one: Calculate the regulated flow during the dry season and determine the guaranteed output according to formulae (1)–(9).
where
and
represent regulated flow during the dry season and wet season, respectively and
and
represent the inflow and outflow, respectively.
and
represent the length of the dry season and wet season, respectively. If the reservoir is in the dry season or wet season,
or
, respectively. If the reservoir would not regulate the runoff,
.
and
represent the reservoir storage and monthly average reservoir storage at
t time, respectively.
represents the designed regulating reservoir storage, and
is the iteration step, which is 1 month.
represents the operation time point, which matches with runoff time series.
and
represent the functional relationship of
V~
Z and
Q~
Z, respectively.
and
represent the water level at the beginning and end of time
t, respectively.
and
represent the water head for generation and head loss at time
t, respectively.
and
represent the output in the regulating period and the guaranteed output in the dry season, respectively.
Step two: Assume an initial power generation flow and calculate the initial reservoir storage based on the water balance formula and the upstream water level as follows:
,
,
,
, and
are calculated as in formulae (4)–(8).
Step three: Compare the power plant output
with
. Then adjust the outflow with
and return to step two:
where
is the change in the outflow of the power plant according to the actual reservoir conditions.
Step four: If formula (12) is successfully calculated, then go ahead to step five, otherwise adjust the outflow and return to step two:
where, usually,
= 0.01, kW.
Step five: If formula (13) is successfully calculated, then stop, otherwise adjust the outflow and return to step two.
where
and
represent the water level at the end of whole period and the designed water dead level. The time trial ends when the above formula is satisfied; repeating all the steps until to the first period of the wet season.
3.3.2. Optimal Model of Cascade Hydropower Joint Operation
The main purpose of establishing an optimal model is to determine the optimized hydroelectric operation charts under the influences of climate change and human activities. However, with the development of reservoir operations over the past 60 years, researches on the cascade reservoir joint operations have been recognized by the public compared with single reservoir operation. Joint operation of cascade reservoirs with hydrological and hydraulic connections can obtain greater benefits than single reservoir operations. Additionally, in practice, cascade hydropower joint operations are one of bottlenecks to achieve more benefit in hydropower stations of the Han River. Therefore, an optimal model for cascade hydropower joint operations is established and maximizing power generation is the main objective function of the optimal model. The objective function and constraints of this model are as follows:
(1) Objective function
where
is equal to the total power generation of the three power stations in operation series, 10
8 kWh.
and
represent the length of the operation cycle and the number of reservoirs, followed by Shiquan, Xihe, and Ankang.
represents the water head of the
m reservoir at time
t,
represents the power coefficient of the
m power station.
(2) Operational constraints
- 1)
- 2)
- 3)
- 4)
- 5)
Operation lines are not allowed to be intersected in the operation chart optimization.
where
is the installed capacity of the
m hydropower station;
is the value of the water level line of the operation chart of
m hydropower station at time
and
is the number of the water level line.
3.3.3. Parameter Setting and Evaluation Indicators
According to optimal model determined in the present study, the value of the water level of the operation line of the operation chart is chosen as the decision variable, and the specific parameters are listed in
Table 2.
In addition to the two indicators of power generation and guaranteed output, three other indicators are increased including the rate of water abandonment, the assurance rate of power generation, and the rate of water consumption to evaluate the optimized performance of the hydroelectric operation charts. The formulae are as follows:
1) The rate of water abandonment-
Pa
where
represents the discarded outflow at time
t.
2) The assurance rate of power generation-
P
where
f(
) represents the number of the output of the power station is greater than the guaranteed output.
3) The rate of water consumption—
Pw (m
3/k·Wh)
where
W is equal to the water quantity used for power generation.
3.4. Calculation Schemes
In this study, the coping operation charts are the final objective for managers. Therefore, four operation scenarios are designed, including the initial runoff series, the influence of climate change, the influence of human activities, and combined influence of climate change and human activities.
Before the construction of the Project, there is no large-scale human development in the upper reaches of the cascade power station, so the Project represents human activity. Since the Project is not yet operational, if the existing observed runoff data mutates, it is caused by the influence of climate change. Runoff variation point (Y) is obtained by MK test. The runoff series before the variation point is the initial runoff series, and the data series after the variation point is the runoff series affected by the climate change. In other study of the research group, the simulated results of the Project are obtained. So the operation data of the Project is subtracted from the runoff data before and after the variation point respectively, and runoff data series affected by human activities only and affected by combined influence of climate change and human activities have been obtained.
Three kinds of operations charts as coping strategies are the final results in this paper. Chart 1 is the conventional corrections for traditional single reservoir operation chart. Data series of four operation scenarios are calculated in designed traditional operation charts. Chart 1 is generated from the results of the data series affected comprehensively by climate change and human activities. Chart 2 and Chart 3 is the optimal single and cascade reservoir operation chart, respectively. Both are generated by CS algorithm from the results of the data series affected comprehensively by climate change and human activities.
Six schemes are designed in terms of the operation cascade hydropower stations under climate change and human activities and its revised optimal operation strategies. The specific schemes are presented in
Table 3. Correspondingly, the flow chart of calculation for coping operation charts are showed in
Figure 3.
There are four classes of operation chart including the conventional designed operation chart. The main reasons and purposes of the six schemes were as follows:
(1) To identify the influence of climate change and human activities on hydropower stations, the station was set to operate under four scenarios with the conventional operation chart. The power generation (E), guaranteed output (Ng), Pa, P, and Pw were used to quantitatively analyze the impacts.
(2) Chang. J. generates cascade joint operation charts for Shiquan, Xihe, and Ankang to respond to climate change in the upper Han River [
13]. Also, the Project will run until 2030; therefore, calculating the operation charts after the Project has operated is one of the main tasks. Chang. J. indicates that optimal operation charts could lead to the generation of more power in the cascade stations [
13]. Scheme five is therefore set in the optimal model.
(3) Before the Project operated, the operation chart in Reference [
13] is applied. Once the Project has been operated, a cascade joint operation chart under climate change and human activities will be necessary. Therefore, scheme six is set in the cascade joint optimal model.
4. Results and Discussion
The results include analysis of runoff variation points, the influences of climate change and human activities on hydropower generation, and the coping regular and optimal operation charts. All operation charts are expanded based on the order of the schemes. Then we discuss the effects on cascade hydropower joint operations of the combined influence of climate change and human activities and generate three cascade hydropower joint operation charts.
4.1. Analysis of Runoff Variation Point
Only the runoff data series is used in the present study, therefore, the runoff variation point is acquired using the inflow runoff of Shiquan reservoir with the MK test (
Figure 4). Then, we review the references to verify the existence of the variation point.
In the MK test, the statistical variable is −2.5372, which indicates a decreasing trend for the runoff (
Figure 4). The curves of
UBk and
UFk crossed in 1990, which may indicate that the runoff begins to change in this year.
He reports that increased in average temperature and decreased in precipitation leading to changes in the hydrological process from 1950–2005 in the upper Han River [
42]. The climate become drier from 1980–2005. Similarly, Chang. J. also finds the runoff in the upper Han River has changed in 1990 [
13]. Both of these studies report similar meteorological factors under climate change, and 1990 is regarded as the beginning of the observed variation. Therefore, 1990 is the variation point (Y) in this study, and the runoff data of four operation scenarios are listed as follows:
- (1)
Initial natural runoff (1954–1990)
- (2)
Only climate change: Natural runoff (1991–2010)
- (3)
Only human activities: Natural runoff (1954–1990) minus transferred process (1954–1990)
- (4)
Combined climate change and human activities: natural runoff (1991–2010) minus the transferred process (1991–2010)
4.2. Influences of Climate Change and Human Activities on Hydropower Operation
According to the results in
Section 4.1 and the schemes in
Table 3, the Operating results calculated in conventional operation charts are shown in
Table 4 and
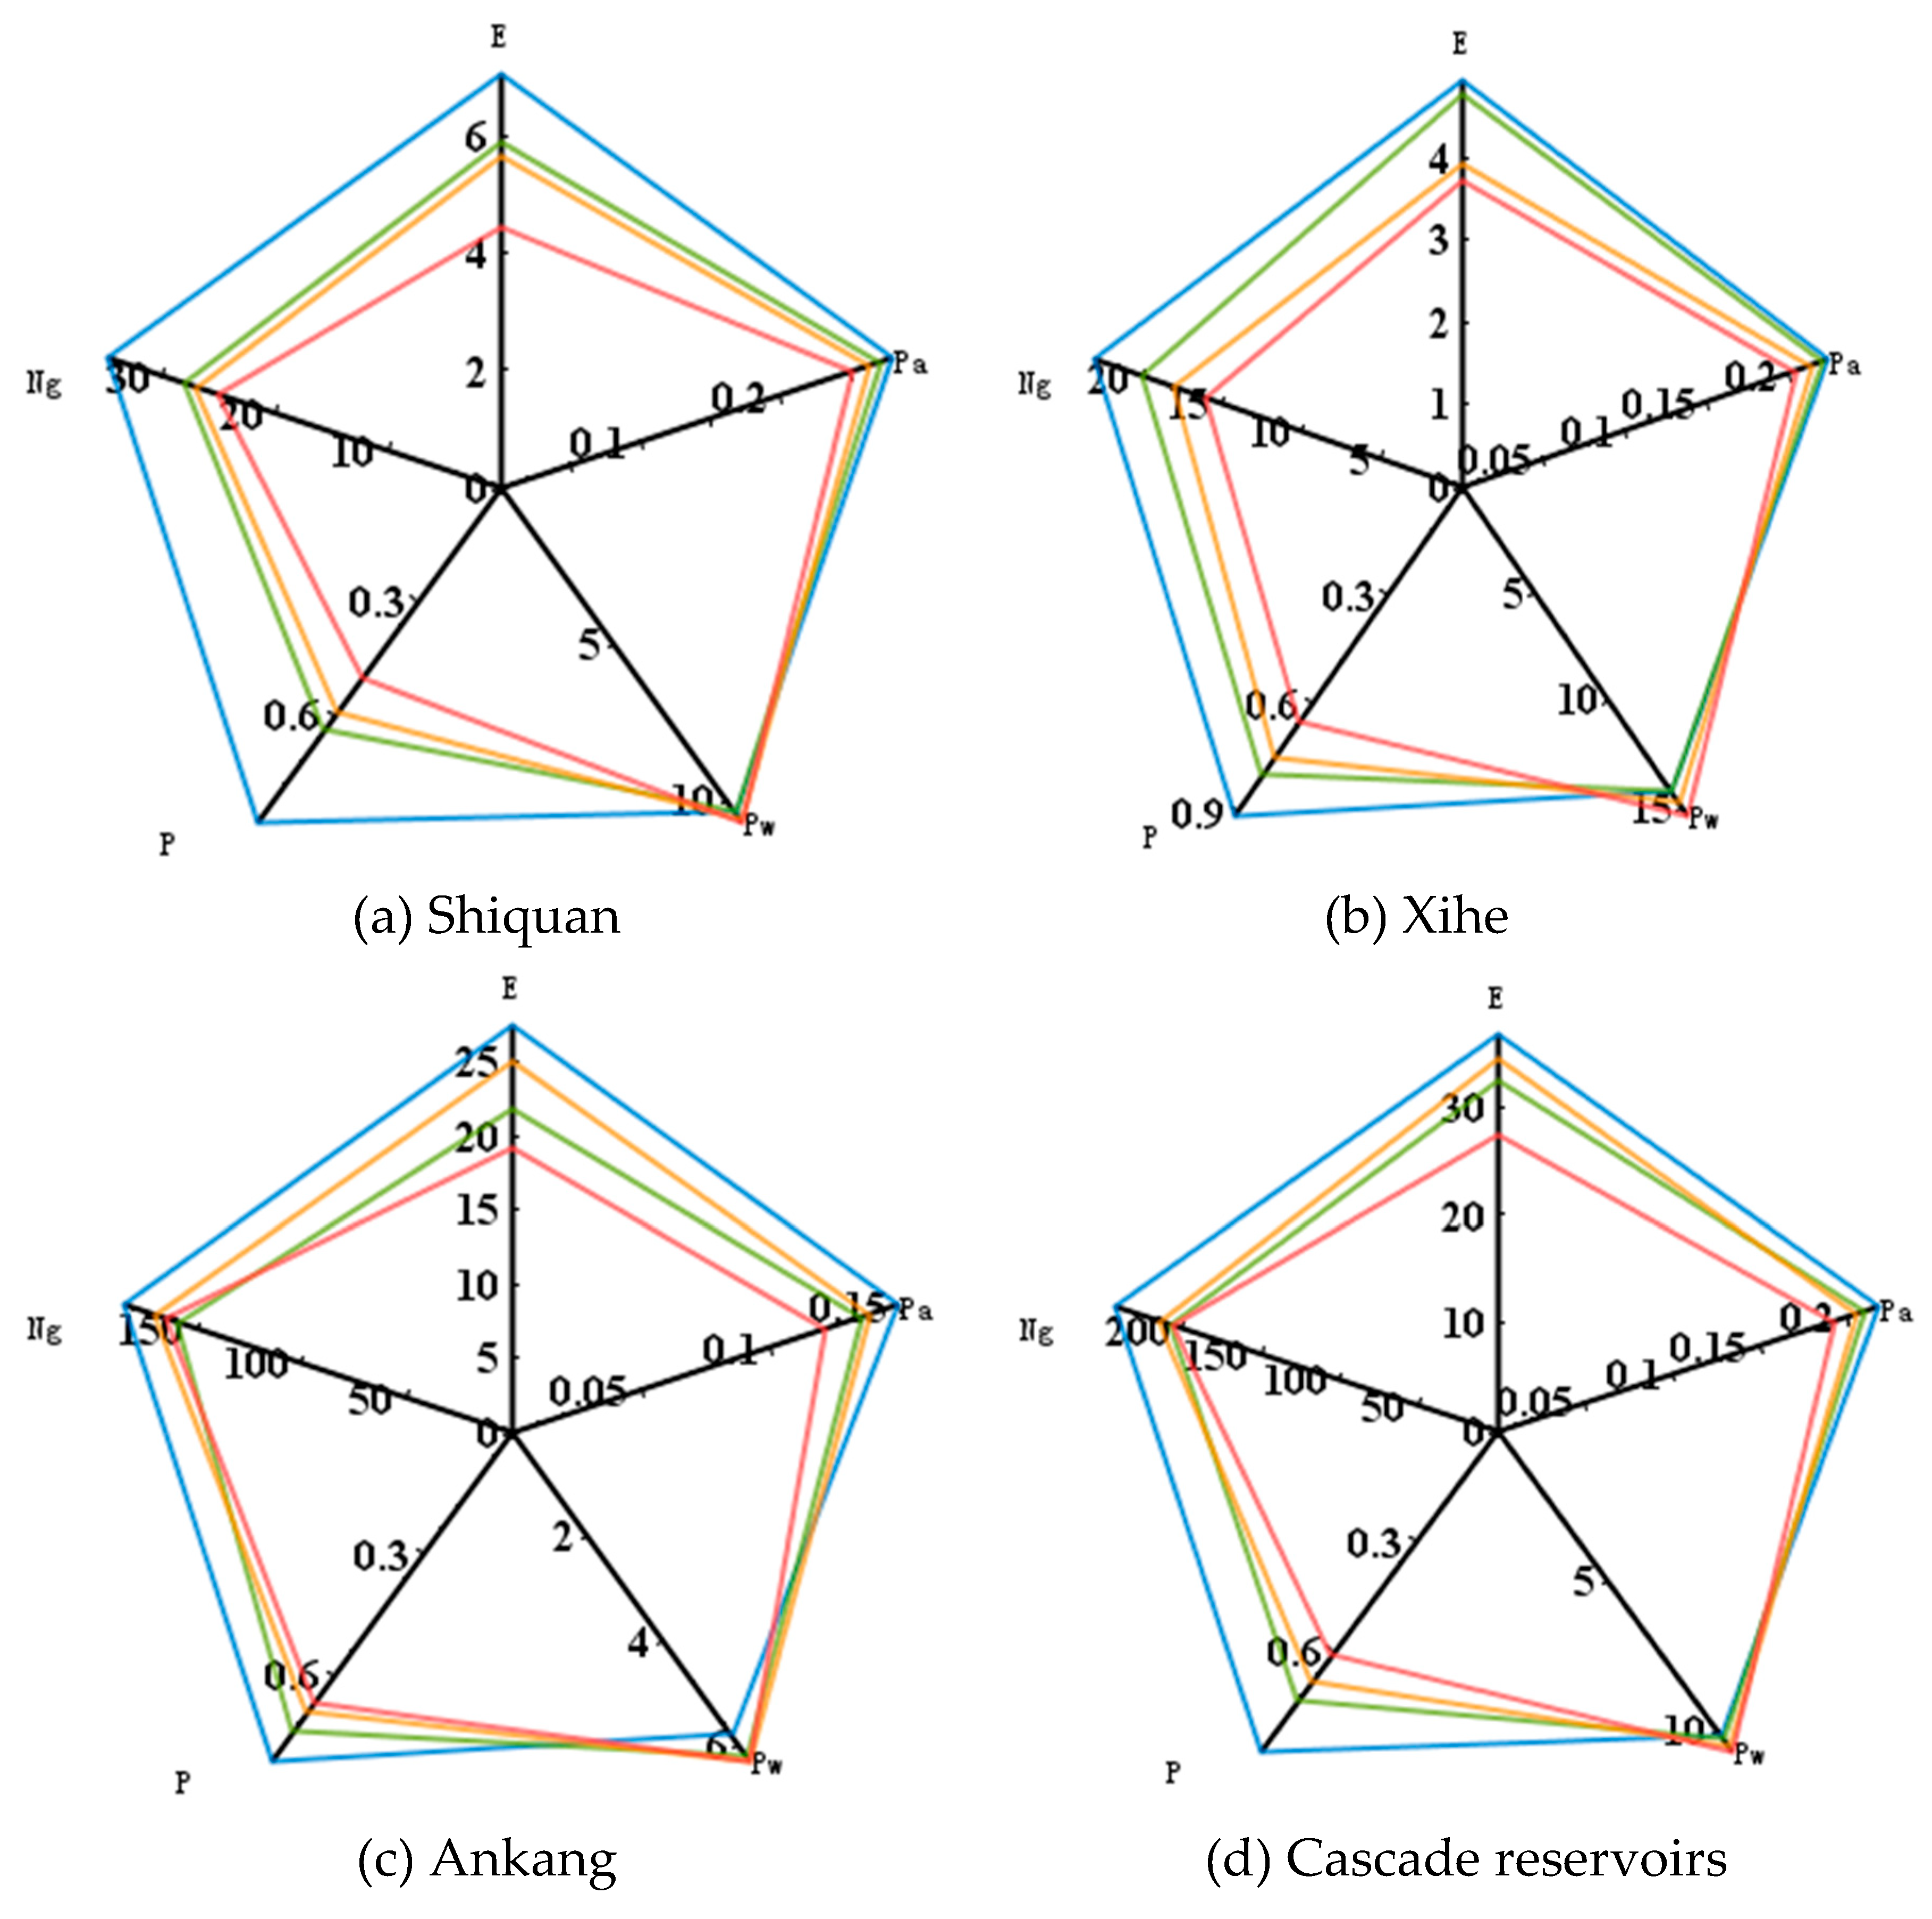
Figure 5.
The results of the present study show that both climate change and human activities affect the operation of the three hydropower stations under investigation. Only the power generation and guaranteed output of scheme 1 is found to reach or exceed the design value in the three power stations. Because the calculation series used in designing conventional operation charts is different from that used in the present study, scheme 1 is regarded as a reference standard of conventional operation charts rather than for designed values. Compared with scheme 1, the results indicate that:
(1) The results of schemes 2–4 are significantly worse than those of scheme 1. This indicates that the conventional operation chart is no longer suitable for the operation and development of the power stations under the varied hydrological situations. For example, the power generation of Shiquan under schemes 2–4 decrease by 1.18 × 10⁸ kWh (16.67%), 1.45 × 10⁸ kWh (20.48%), and 2.73 × 10⁸ kWh (38.56%), respectively. Additionally, the same decreasing trend occurs in Xihe, which decreases by 0.2 × 10⁸ kWh (4.04%), 0.3 × 10⁸ kWh (6.06%), and 0.37 × 10⁸ kWh (7.47%) and Ankang, which decreases by 5.73 × 10⁸ kWh (20.78%), 2.59 × 10⁸ kWh (9.39%), and 7.68 × 10⁸ kWh (27.85%), respectively
(2) From the results of cascade reservoir operations, the influence of climate change is greater than that of human activities. For instance, power generation under schemes 2 and 3 decreases by 17.95% and 12.83%, respectively. The reason for this is that the natural runoff after 1990 decreases by an annual average of about 2.5 billion m3 in the upper Han River area.
(3) Based on the sensitivity of the power stations to these changes, Shiquan is the most affected followed by Ankang. The reason for this is that there is lower storage capacity in Shiquan than in Ankang, which means that Shiquan does not have sufficient capacity to save water and regulate the power head when runoff is reduced. This once again verifies the necessity to modify the operation charts under existing engineering and hydrological conditions.
4.3. Coping Hydropower Operation Charts under the Influence of Climate Change and Human Activities
Because the Project is planned to operate completely by 2030, hydropower operations of cascade power stations are currently mainly affected by climate change. Considering that [
13] proposes adaptive operation charts and cascade joint optimal operation charts for the upper Han River, the main object of the present study is to develop the coping strategies to deal with the combined influence of climate change and human activities after 2030. As shown in
Table 4, scheme 4 and 5 are used to generate the modified regular and optimal single hydropower operation charts, respectively. Scheme 6 is used to generate the modified optimal cascade hydropower operation chart. All the modified operation charts are listed in
Figure 6.
4.3.1. Chart 1: Modified Regular Single Reservoir Operation Chart
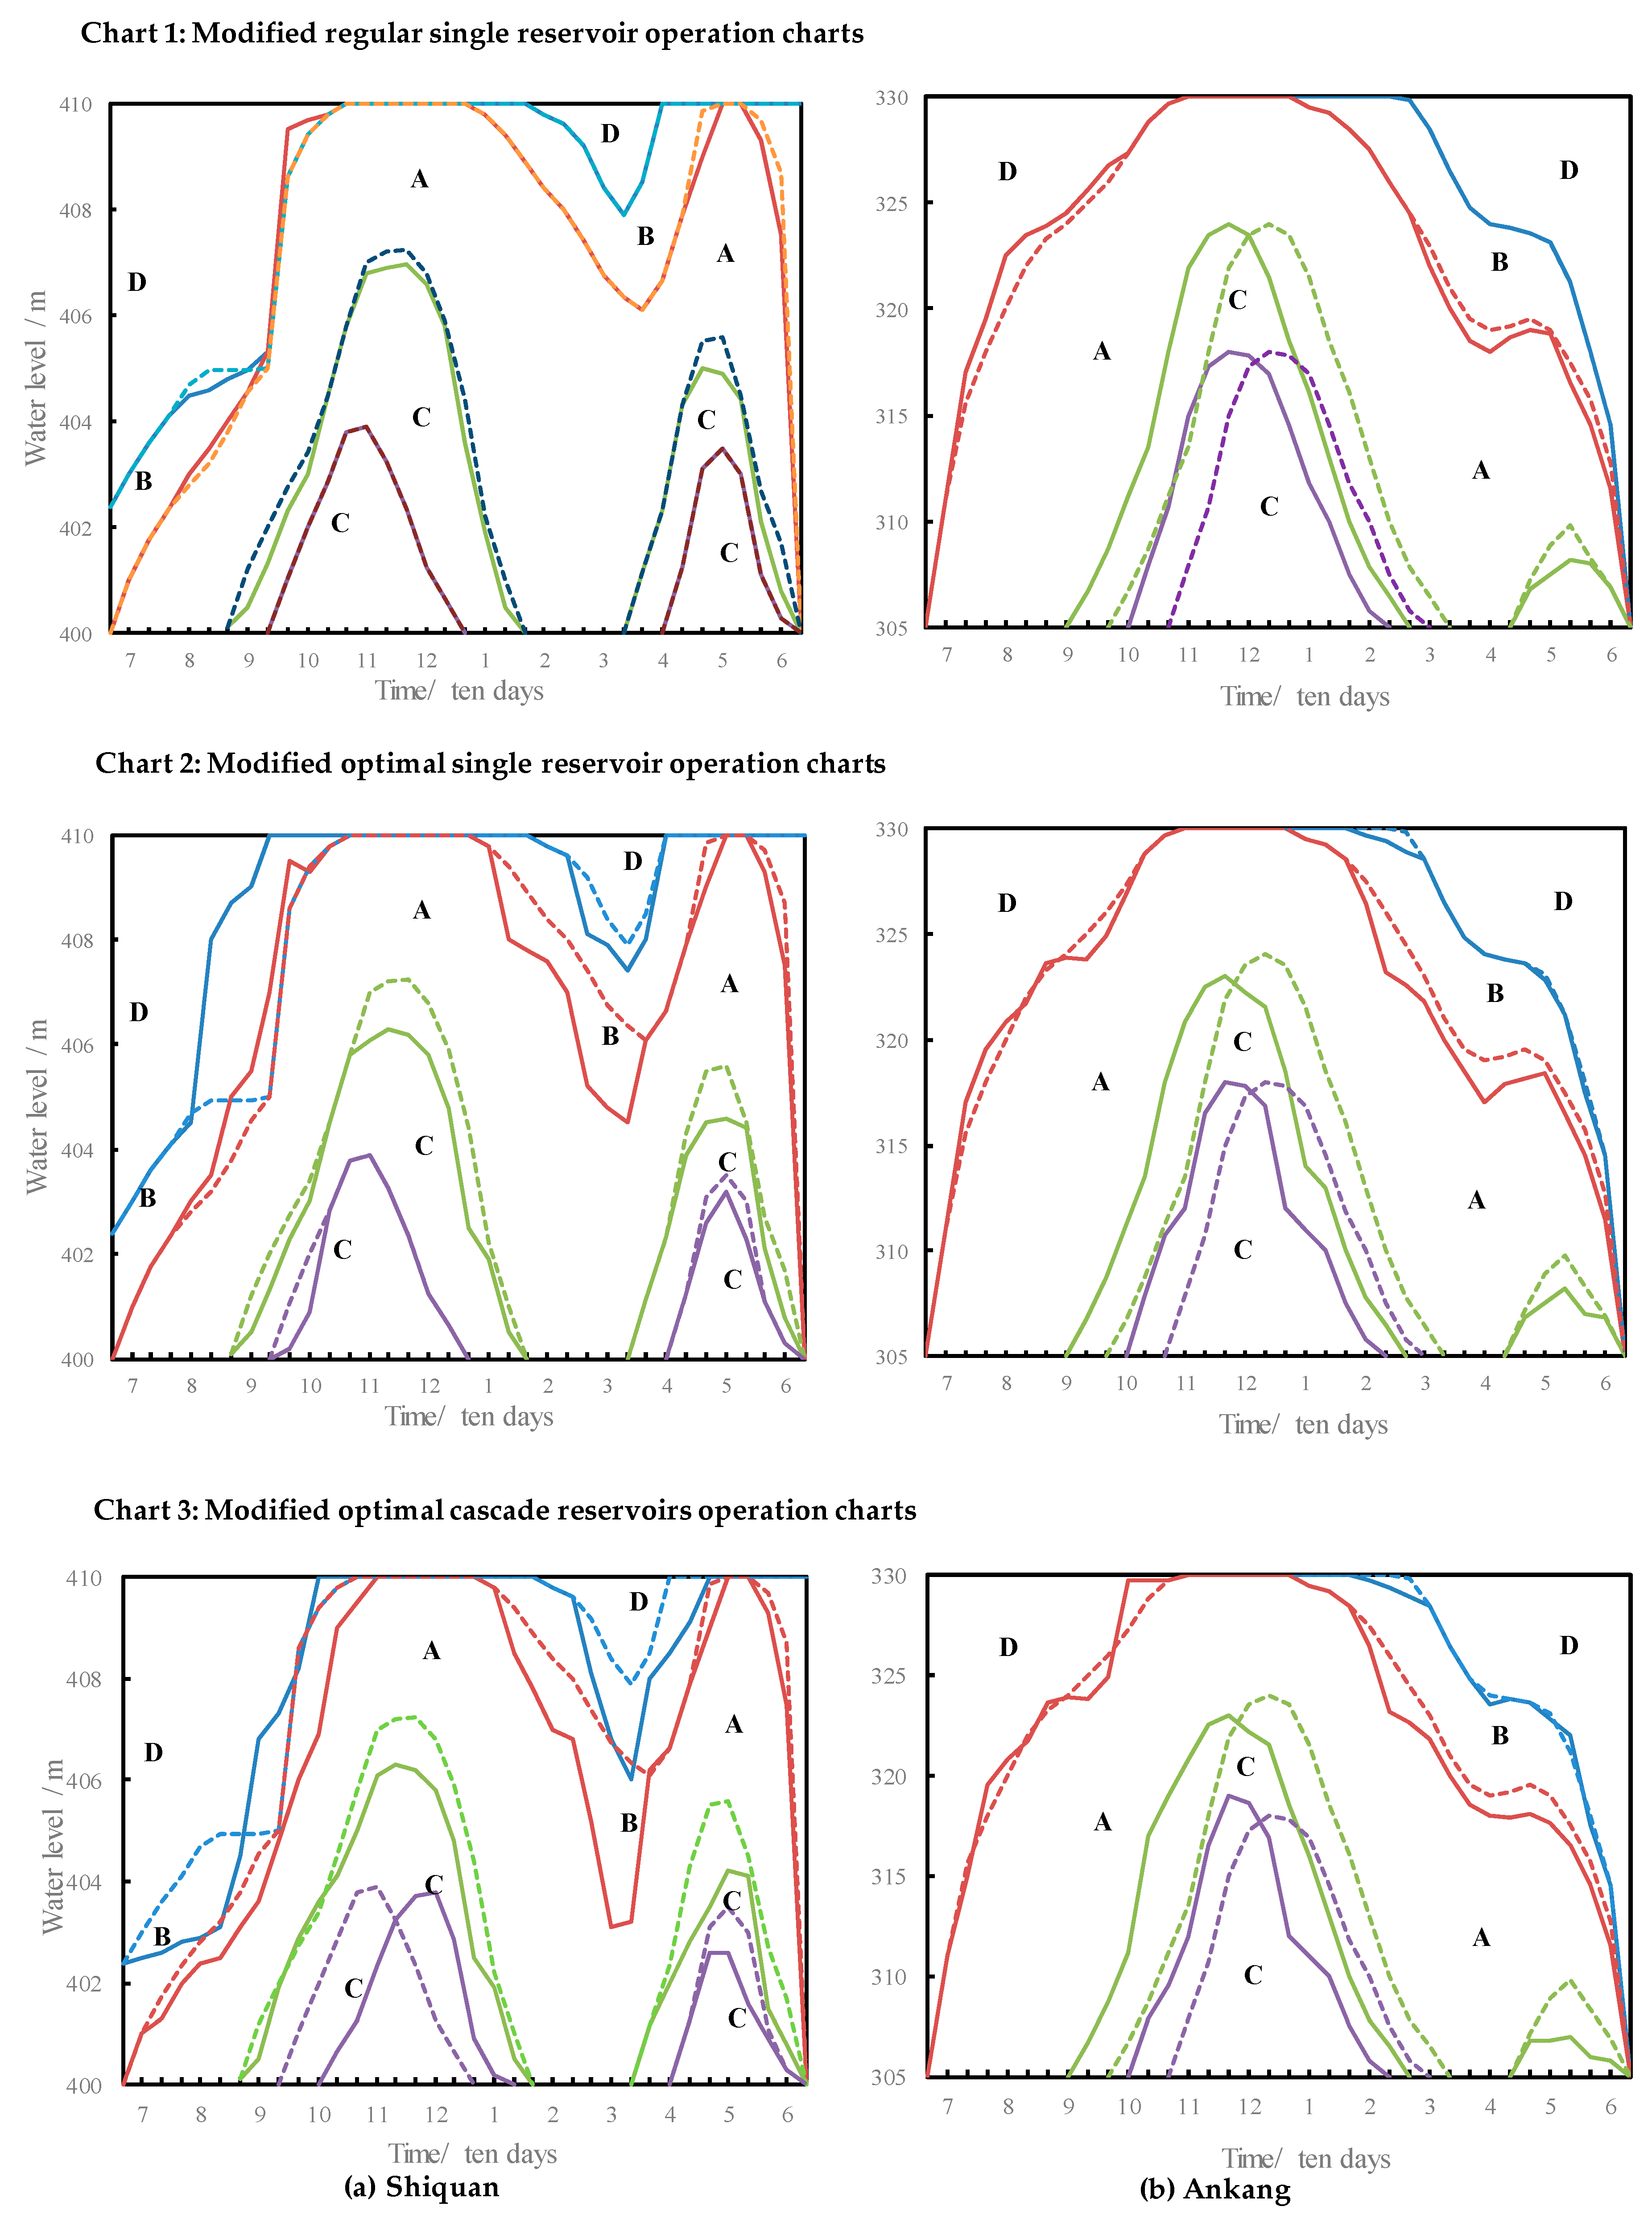
Comparing Chart 1 in
Figure 6 with the conventional operation charts (
Figure 1), shows that the integral operation trend is similar to the traditional one. The upper and lower basic lines move slightly up and down. Specifically, the upper basic lines of both reservoirs move up a little during the main flood season and move down during the dry season. Furthermore, both lower basic lines move down during operation time, and the water storage period of the Ankang reservoir move forward for about 20 days. The main reason for this change is that reservoir inflow is decreased compared with the designed data series. During the main flood season, to improve power generation efficiency, the guaranteed output area is expanded and moves down, and the increased output area becomes smaller. This change would probably make the power stations work more in the guaranteed output area. Then, once the power plant is working in part A, it would be able to maintain a high water level and guarantee water demand during the dry season. Furthermore, in contrast to the previous conditions, the Ankang reservoir should store water in advance to raise the water level and avoid the power plant operating at a decreased output after the flooding season. In the dry season, the operation mode is different from during the wet season, in which the increased output area become larger making the power plant work in the increased output area, avoiding the abandoned water.
We assume that the cascade power stations are running under the Chart 1 (
Figure 6) to verify their usefulness. The simulation results show that the effect of both operation charts could not reach the design value under the current runoff situation, but the modified chart is preferable to the conventional chart. Cascade power generation increases by about 12 million kWh, of which Ankang reservoir increases by about 9 million kWh. If the electricity price is calculated at RMB 0.25, then the increased value of the power generated is about RMB 3 million. Therefore, it is necessary and valuable to modify the operation charts for the changing hydrological environment, especially for reservoirs that are designed for power generation.
4.3.2. Chart 2: Modified Optimal Single Reservoir Operation Chart
Comparing the Chart 2 in
Figure 6 and
Figure 7 shows that the overall trends at Shiquan and Ankang have not changed. After the calculation of the CS algorithm, part B of Shiquan increases to avoid abandoned water during the flood season because heavy rains often occur in the Han River basin, and rainfall is particularly heavy during the flood season. Additionally, the flooding season commonly lasts until October. Therefore, the hydropower plant should increase its outflow to improve power generation and avoid abandoned water. Part A of the Ankang reservoir increases to raise the water level, and the water level line of 0.8 N
p is slightly low compared with
Figure 6b. All these changes are used to increase the power generation of the power stations.
Like in scheme 5, we assume that the cascade power stations are running under the Chart 2 to verify their usefulness. The simulation results show that the optimal chart outperforms the conventional chart. Cascade power generation increases by about 32 million kWh, of which Shiquan and Ankang reservoirs increases by about 9 and 23 million kWh, respectively. The increased value of the power generated is about RMB 8 million. Therefore, the single optimal operation chart (Chart 2) further improves the power generation of the power stations compared to the modified single regular operation chart (Chart 1).
4.3.3. Chart 3: Modified Optimal Cascade Reservoir Operation Chart
Comparing the Charts 2 and Chart 3, it can be seen that the operating areas of the Shiquan and Ankang reservoirs have not changed. In Chart 3, the upper basic lines moves down slightly during the dry season and the increasing output areas become lager. Similarly, under joint operation, the guaranteed output is increased to avoid abandoning water.
Like in scheme 5, we assume that the cascade power stations are running under the Chart 3 to verify their usefulness. The simulation results show that if the power stations run in a joint operation, the effects of human activities and climate change are greatly reduced. Cascade power generation increases by about 47 million kWh, of which Shiquan and Ankang reservoirs increases by about 12 and 35 million kWh, respectively. The increased value of the power generated is about RMB 11.25 million. These joint operation charts consider the effects of human activities and climate change that could be applied in the cascade hydropower stations in theory once the Project is finished in 2030. Climate change is a gradual process, and its effects on runoff are subtle. At present, runoff cannot be restored to its original state. However, it is possible to reduce the effect on runoff by making significant changes to human activities.
4.4. Optimal Operation of the Project
As the Project is based at the first cascade of the upper reaches of the Han River, its operation mode will directly affect the operation of the downstream power station group. [
24] studies the joint optimization scheduling of the Huangjinxia (HJX) and Sanhekou (SHK) reservoirs of the Project to determine water supply, power generation, and energy consumption for the Project’s own operation. While the modified optimal single reservoir and joint reservoirs operation charts of the cascade power stations increase power generation, abandoned water of reservoirs will always occur and reduce water energy efficiency. Therefore, based on the optimal models in Reference [
24], preventing the occurrence of abandoned water at the downstream cascade power stations is as important as determining water supply and energy efficiency.
The results from schemes 5 and 6 show that abandoned water of cascade reservoirs often occur before and during the flood season (June–November). Therefore, the Project in upstream should increase the outflow constraint in the joint operation model during this period to avoid the cascade power stations generating excessive abandoned water
The operation process for the whole system includes two steps: (1) Obtaining reservoir outflow series for the joint optimal operation of the Project. These series are also taken as the inflow of the Shiquan reservoir. (2) Joint operation chart 3 is regarded as another fitness function. The model locates the series in which the corresponding power generation process resulted in higher levels of generated power coupled with lower levels of abandoned water. Then, following iterative optimization, an operation process for the Project is determined.
Figure 7 shows the monthly average change process of water abandoned of the cascade power stations in condition of the operation of the Project is optimized. When the Project operates in optimal situation, and the cascade power stations operate according the Chart 3, the operation results of the cascade power stations show: (1) The average annual of abandoned water would decrease by about 150 million m
3 and power generation would increase by 5 million kWh. (2) The Project would reduce the water level pressure for the downstream reservoirs before the flood season, and the abandoned water of Shiquan, Xihe, and Ankang power stations would decrease by 5.19%, 6.67%, and 5.33%, respectively. (3) The abandoned water from Shiquan and Xihe reservoirs always occurs at the same time, and the largest amount of abandoned water is July. These three reservoirs occur abandoned water in June and September at the same time, and Ankang reservoir has the largest abandoned water before the flood season (June).
The results for the joint operation model of the Project are suitable for the operation of the Project itself (data not shown in detail). Additionally, this section focuses on the operation rules of the Project, which are conducive to the operation of the downstream power stations.
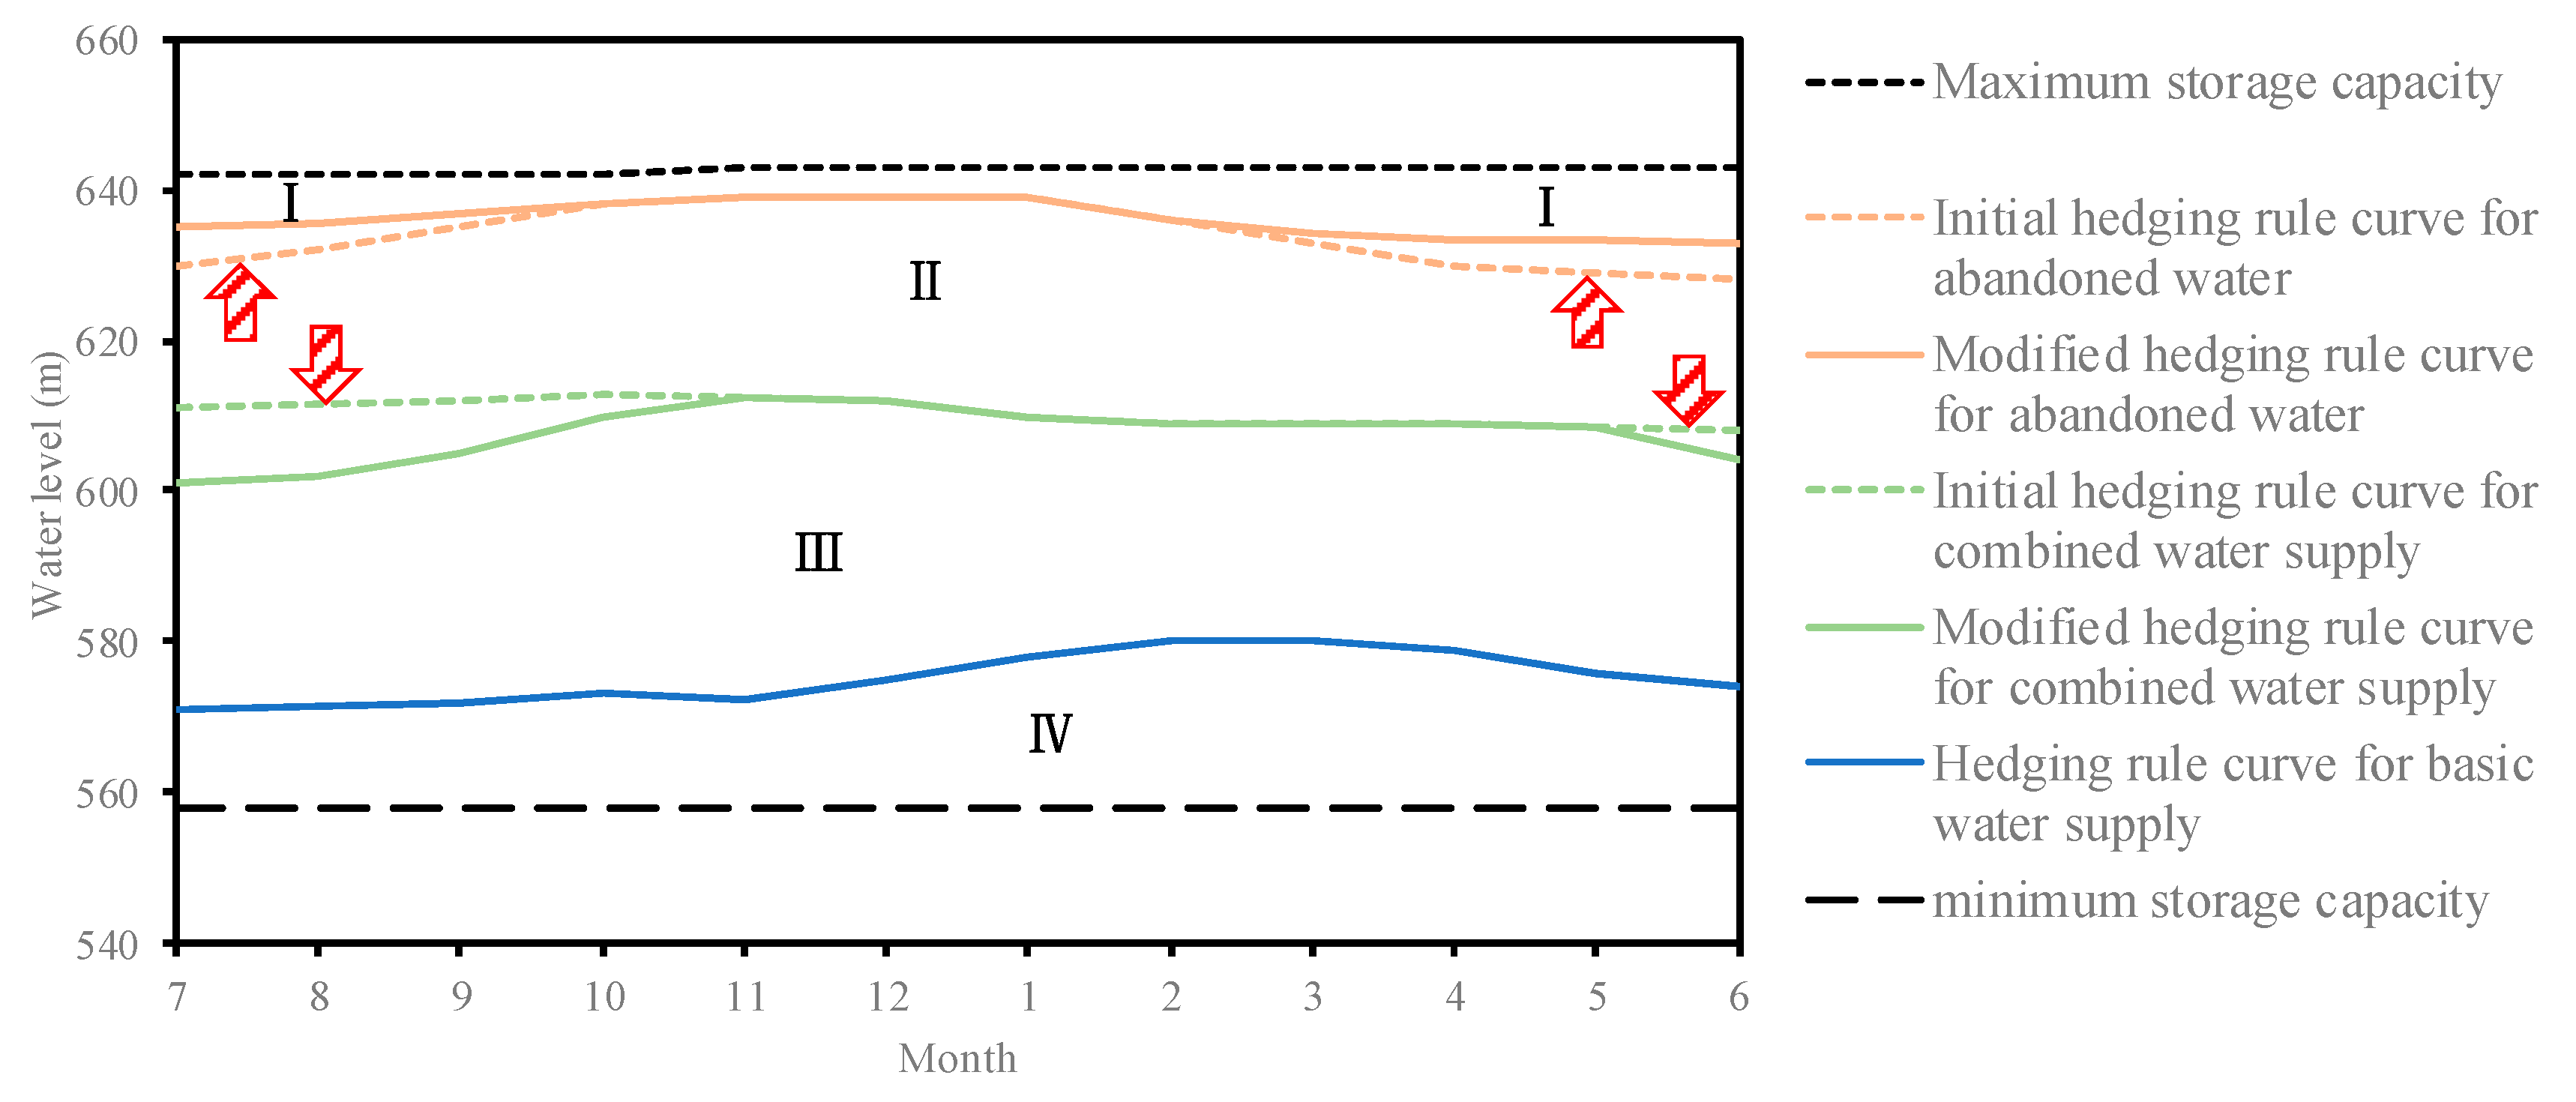
Figure 8 shows that the differences between the two operation charts are mainly in terms of the hedging rule curve for abandoned water and the combined water supply. (1) The modified hedging rule curve for abandoned water shifts upward about 3 m from March–October compared with the initial curve. This part is defined as the operation area for preventing the abandonment of water. If the SHK water level at time
t is in this location, then the SHK reservoir would be regarded as the first water resource to supply water and the HJX reservoir is the second. Otherwise, the HJX reservoir would still undertake the majority of the water supply task and reduce the probability that of water abandonment at the downstream power plants. (2) The modified hedging rule curve for abandoned water shifts down about 10 m from May–November compared with the initial curve. This part is defined as the guaranteed operation area of combined water supply. If the SHK water level at time
t is in this location, then the HJX reservoir would be regarded as the first water resource. This change increased the probability of the HJX reservoir supply water for intake areas.
The water transferred scale of the Project is limited by the adjustable water volume which is approved by the government. Therefore, the basis of the Project operation chart change is in the range of adjustable water volume, what’s more, HJX reservoir must take on more water supply tasks, and the SHK reservoir would mainly regulate the main stream runoff through the water supply. These measures have been validated in the model to mitigate the abandoned water of the downstream reservoirs. This also means that, if the effects of human activities are inevitable, then the optimal operation of the whole system could reduce the impact.
5. Conclusions
Many conventional operation rules for reservoir operations no longer apply to the current hydrological environment, which has been affected by climate change and human activities. Therefore, revised strategies are urgently needed for the optimized operation of cascade reservoirs. In the present study, the influence of climate change and human activities is analyzed and procedures are formulated to develop revised strategies. We consider three runoff series conditions including initial runoff, only affected by climate, and affected by both climate and human activities. A simulation model is applied to analyze the effects on power generation under four schemes, and a modified regular operation chart is generated through scheme 4. An optimal model for operation charts based on the simulation model is constructed to generate single and joint optimal operation charts for cascade power stations under the influence of climate change and human activities. We also attempt to change the influence of human activities by optimizing the rules of the Project to reduce its influence on power stations in the downstream. The primary conclusions are as follows:
(1) Both climate change and human activities affect the operation of cascade power stations. At the same time, the effect on power generation is greatest when climate change and human activities were combined, followed by climate change alone, and finally human activities alone. Compared with the initial condition, corresponding power generation decreases by 25.71%, 17.95%, and 12.83%, respectively. Furthermore, owing to geographical location and its own storage capacity, the Shiquan reservoir is the most sensitive to these changes.
(2) Three kinds of revised strategies for the cascade power stations are proposed herein, mainly by modifying existing operation charts. The three modified operation charts include a regular chart, an optimal single operation chart, and an optimal joint operation chart. Compared with the conventional chart, all three modified charts are preferable for the cascade power stations. The optimal joint operation chart shows better adaptability to the changes in runoff and the most evident increase in power generation (47 million kWh; RMB 11.25 million).
(3) Optimizing the upstream Project and slowing down its impact on the downstream power stations is another revised strategy proposed herein. If the Project works as in
Figure 8, then the average annual abandoned water of the downstream power stations would decrease by about 150 million m
3, and the abandoned water of Shiquan, Xihe, and Ankang power stations would decrease by 5.19%, 6.67%, and 5.33%, respectively, which could increase power generation by 5 million kWh. The Project can also reduce the water level pressure before the flood season for the downstream power stations.
The present study has practical significance for the efficient operation of cascade hydropower stations and is informative for reservoir operation theory under changing environmental conditions. In future, studies should focus on power generation operations considering river ecology to solve the conflicting objectives of ecological benefit and power generation under changing environments.
6. Supplementary Material
6.1. The Multi-Objective Optimal Model for the Project
The multi-objective optimal model for the Project considers energy consumption, power generation, and water supply.
(1) Multi-objective function:
Objective one: minimizing energy consumption
Objective two: maximizing power generation
Objective three: meeting water demand
where Ω represents the set of optimal solutions for multi-objective operation models,
Epump represents the total energy consumption of two pump stations in an operation series,
Epower represents the total power generation of two power stations in an operation series,
W represents the transferred water quantity.
T,
M, and Δ
t represent the same as in the simulated operation model;
represents the power from pump station
m consumed in the period
t,
represents the water flow of pump station
m transferred in the period
t,
represents the efficiency of pump station
m,
g represents gravity;
represents the power generation of power station
m generated in the period
t,
represents the power flow of power station
m used in the period
t,
represents the water head of reservoir
m in the period
t, and
k represents the power coefficient of power station
m.
(2) Operational constraints
The operational constraints were as follows:
- 1)
- 2)
- 3)
Transferable water quantity
- 4)
- 5)
- 6)
Power of pump station
where
Vm represents storage capacity of the
m reservoir in
t period (10
8 m
3);
,
, and
represent the inflow runoff, outflow runoff, and water transferred flow of the reservoir
m in period
t, respectively (m
3/s);
Z2(
t) represents the water level of the SHK reservoir in period
t,
represents the dead water level and
(
t) represents the highest water level, including the flood control level during flooding season and the normal high water level during non-flooding seasons (m);
(
t) represents the maximum transferable water quantity of the Han River in period
t (10
8 m
3);
Qm represents the outflow of the power station
m in period
t,
represents the maximum outflow of the power station
m (m
3/s);
Qtunnel(
t) represents the average transferred flow in the Qinling tunnel in period
t,
represents the maximum water transfer capability of the Qinling tunnel (m
3/s);
Nm(
t) represents the output of power station
m in period
t,
represents the installed capacity of power station
m,
and
represent the output in the dry season and the firm power of HJX power station, respectively;
Pm(
t) represents the power consumption of the pump station
m in period
t,
represents the installed capacity of pump station
m. All variables were non-negative.
6.2. The Original Interpretation of the Operation Chart for the Project
The operation chart (
Figure 8) includes four parts defined as follows:
(1) Part Ⅰ
This part was defined as the operation area for preventing the occurrence of abandoned water. If the SHK water level at time t was in this location, then to save energy, the SHK reservoir would be regarded as the first water resource and its pump station would not work in this moment. At the same time, the HJX reservoir would be regarded as an auxiliary water resource. If the SHK reservoir is able to meet the water demands of the Guanzhong area, then the HJX pump station would not be needed, otherwise it would need to start supplying water.
(2) Part Ⅱ
This part was defined as the guaranteed operation area for combined water supply. If the SHK water level at time t was in this location, then the HJX reservoir would be regarded as the first water resource and its pump station should supply the Guanzhong area and the SHK reservoir as much as possible. If the water in HJX is not sufficient, then the SHK reservoir would start to supply. In this part, the Project should meet the water demand of the Guanzhong area.
(3) Part Ⅲ
This part was defined as the control operation area of combined water supply. In this part, the HJX and SHK reservoirs would supply the Guanzhong area together, and the HJX reservoir would not supply the SHK reservoir. The actual water supply of the Project would not meet the water demand because the actual water demand was applied according to the modified ratios set by the decision makers.
(4) Part Ⅳ
This part was defined as the minimum capacity water supply operation area. In this part, the HJX and SHK reservoirs both supply water according to their minimum capacity, and the HJX reservoir stops supplying the SHK reservoir.


