Article

Dam Site Suitability Mapping and Analysis Using an Integrated GIS and Machine Learning Approach

by
Rami Al-Ruzouq
1,2,*,
Abdallah Shanableh
1,2,
Abdullah Gokhan Yilmaz
1,2,3,
AlaEldin Idris
4,
Sunanda Mukherjee
2,
Mohamad Ali Khalil
2 and
Mohamed Barakat A. Gibril
2
1
Civil and Environmental Engineering Department, University of Sharjah, Sharjah 27272, UAE
2
Research Institute of Sciences and Engineering, University of Sharjah, Sharjah 27272, UAE
3
Department of Engineering, School of Engineering and Mathematical Sciences, La Trobe University, Melbourne, Victoria 3086, Australia
4
Sharjah Electricity and Water Authority, Sharjah 135, UAE
*
Author to whom correspondence should be addressed.
Submission received: 28 July 2019 / Revised: 28 August 2019 / Accepted: 4 September 2019 / Published: 10 September 2019
(This article belongs to the Section Water Resources Management, Policy and Governance)

Abstract

:
Meeting water demands is a critical pillar for sustaining normal human living standards, industry evolution and agricultural growth. The main obstacles for developing countries in arid regions include unplanned urbanisation and limited water resources. Locating and constructing dams is a strategic priority of countries to preserve and store water. Recent advances in remote sensing, geographic information system (GIS), and machine learning (ML) techniques provide valuable tools for producing a dam site suitability map (DSSM). In this research, a hybrid GIS decision-making technique supported by an ML algorithm was developed to identify the most appropriate location to construct a new dam for Sharjah, one of the major cities in the United Arab Emirates. Nine thematic layers have been considered to prepare the DSSM, including precipitation, drainage stream density, geomorphology, geology, curve number, total dissolved solid elevation, slope and major fracture. The weights of the thematic layers were determined through the analytical hierarchy process supported by several ML techniques, where the best attempted ML technique was the random forest method, with an accuracy of 76%. Precipitation and drainage stream density were the most influential factors affecting the DSSM. The developed DSSM was validated using existing dams across the study area, where the DSSM provides an accuracy of 83% for dams located in the high and moderate zones. Three major sites were identified as suitable locations for constructing new dams in Sharjah. The approach adopted in this study can be applied for any other location globally to identify potential dam construction sites.

1. Introduction

Water is a crucial element for the survival of life on earth [1]. With urban development and its associated growing population with its ever-increasing demand [2], water scarcity has been significantly increasing. Water consumption per capita has reached 550 L/day in some countries due to modern lifestyles, a development which places an additional pressure on existing water resources [3]. Developing countries are more vulnerable to water scarcity compared with the developed ones. The main obstacles developing countries face include unplanned urbanisation, limited water resources and ineffective regulations for managing water supply and distribution. Therefore, managing water resources and identifying unconventional methods to store and supply water are strategic priorities for any nation [4,5].
The United Arab Emirates (UAE) is amongst the fastest developing nations on the globe. Its population hopped steeply from 531,265 in 1975 to 9.04 million in 2013 [6]. The UAE is the only federal country in the Middle East. It consists of seven emirates (or states). The high-quality lifestyle of the UAE population resulted in an increased daily water consumption per capita from 82 L per day in 1968 to 550 L per day in 2010, a rate that is considered one of the highest around the world [7]. Note that the UAE is located in an arid climate region with limited freshwater resources and scarce rainfall [8,9]. Thus, the UAE depends mainly on water desalination to meet the water demand of the population, a process which entails high cost and negative environmental impacts [10]. The UAE vision for 2021 and 2071 is to be one of the best countries in the world [11,12]. One of the challenges to realize that vision is to ensure sufficient water supply to its population. Dams represent one of the critical assets for water storage. In case of an occurrence of a dam breach or break, massive losses in life and economy, as well as a negative impact on the environment, could happen [13,14,15]. Therefore, the problem of selecting best suitable sites to build new dams is crucial. In this research, we focus on developing a technique to ascertain the most suitable locations for building new dams in the UAE.
Generally, dam site selection is conducted by traditional methods, such as conventional decision-making techniques or according to political interests [16]. However, remote sensing (RS), geographic information systems (GIS) and machine learning (ML) techniques are recently emerging as some of the most appropriate approaches to understand dam sites. In recent years, the advancement in satellite and computational power has enhanced the opportunity to manage different hydrologic parameters and terrain characteristics. RS and GIS offer a high adaptability of joining of spatial information with different progressed numerical, factual and decision-making strategies, such as fuzzy logic, analytical hierarchal processes (AHP), Boolean logic, weighted overlay analysis, multi-criteria evaluation techniques and artificial intelligence [17].
A contemporary study for dam site selection has been conducted at the Greater Zab Region in Northern Iraq [18]. The study has considered several spatial layers like the geological formation, soil type, fault line, tectonic line, altitude, slope, rainfall data, water discharge, land use/cover, road network and material used for dam construction. These layers were integrated with AHP and fuzzy logic techniques to determine the appropriate location for dam site construction. Four major sites were identified as suitable locations for intermediate-to-large dam construction areas. Nevertheless, the fuzzy model produced suitable results for clustered areas. Another study conducted for the Boda-Kalvsvik Island in Sweden implemented the weighted overlay analysis technique on layers including precipitation, evapotranspiration, potential recharge, piezometric level and geological and geomorphological layers [19]. The study was validated using the topographic wetness index method and groundwater balance. The method resulted in favour of regions with humid climates with limited natural water storage capacities. Many other investigations on dam site selection and suitability have also been conducted using a variety of multi-criteria decision-making (MCDM) techniques [20,21]. To highlight key factors that affect dam site suitability, we investigated the most commonly used factors in the literature (Table 1). The following are the most utilized factors: topographical condition, geological and geomorphological structure, foundation condition, physiographic unit, availability of materials, spillway size and location and runoff capacity of streams. Other factors include construction cost and maintenance, as well as the dam life and aesthetics.
This research utilised weighted overlay analysis supported by state-of-the-art ML techniques to create a dam site suitability map (DSSM) for Sharjah, the third largest emirate. Towards generating the DSSM, nine factors were developed: geology, geomorphology, drainage stream density (DSD), slope, elevation, rainfall, curve number (CN) (representing runoff), total dissolved solids (TDS) and major fractures. The geo-hydrological aspects of Sharjah in relation to dam site suitability and the most influential factors for such suitability were investigated. This study aims to recognise suitable regions for the development of dams by utilising remote sensing, GIS, AHP and the ML system. AHP and ML were applied to select suitable sites for dam construction on selected streams. The objectives of this research were as follows:
  • Investigate suitable zones for constructing a dam in Sharjah in the light of managing replenished water resources
  • Identify and map related geological, geomorphological and climatological factors and discover their weighted commitment in deciding the most suitable site for dam construction
  • Employ ML techniques, AHP and a weighted overlay analysis to prepare a DSSM
  • Perform a sensitivity analysis to establish factors that determine the suitable locations for dam construction
  • Validate the outcome of the DSSM through already existing dams in Sharjah

2. Study Area

The UAE is located in the Middle East and borders the Gulf of Oman and the Arabian Gulf between Oman and Saudi Arabia (Figure 1). The UAE is situated in an arid tropical zone with an annual precipitation of 110–150 mm [30]. The country records maximum temperatures of 45–50 °C in the desert, has long-term (2003–2017) average relative humidity of approximately 80% and has high pan evaporation ranging from 8 to 12 mm/day [8,21]. The development of the UAE has peaked within the past 15–20 years as a young developed country, along with a rise in its gross domestic water demand from 1970 to 2018. The per capita water consumption of the country is one of the highest in the world with 550 L per day [7].
This study focuses on Sharjah, the third largest emirate in the UAE. Sharjah covers an area of 2590 km2, which is approximately 3.3% of the total area of the UAE. Sharjah shares a boundary on both coasts: The Arabian Gulf in the west and the Gulf of Oman in the east. Large parts of the emirate comprise desert regions, deep soil formed in eolian sands and some agricultural areas. Sharjah also has marshes and acacia forests. The annual rainfall of Sharjah is approximately 106.9 mm [9]. The southern part of Sharjah comprises a continuous, well-watered fertile littoral strip known as the Batinah Coast that runs between the mountains and the sea. The total population of Sharjah according to the Department of Statistics and Community Development is approximately 1,628,932 [31].

3. Methodology

Figure 2 illustrates the methodology developed to identify the best suitable dam location in Sharjah. Firstly, we collected the raw data required to develop the thematic layers of the study area. Data from a suitable imagery programme and the historical records of climatological data were necessary. Furthermore, field data collection was conducted to measure in-situ groundwater quality.
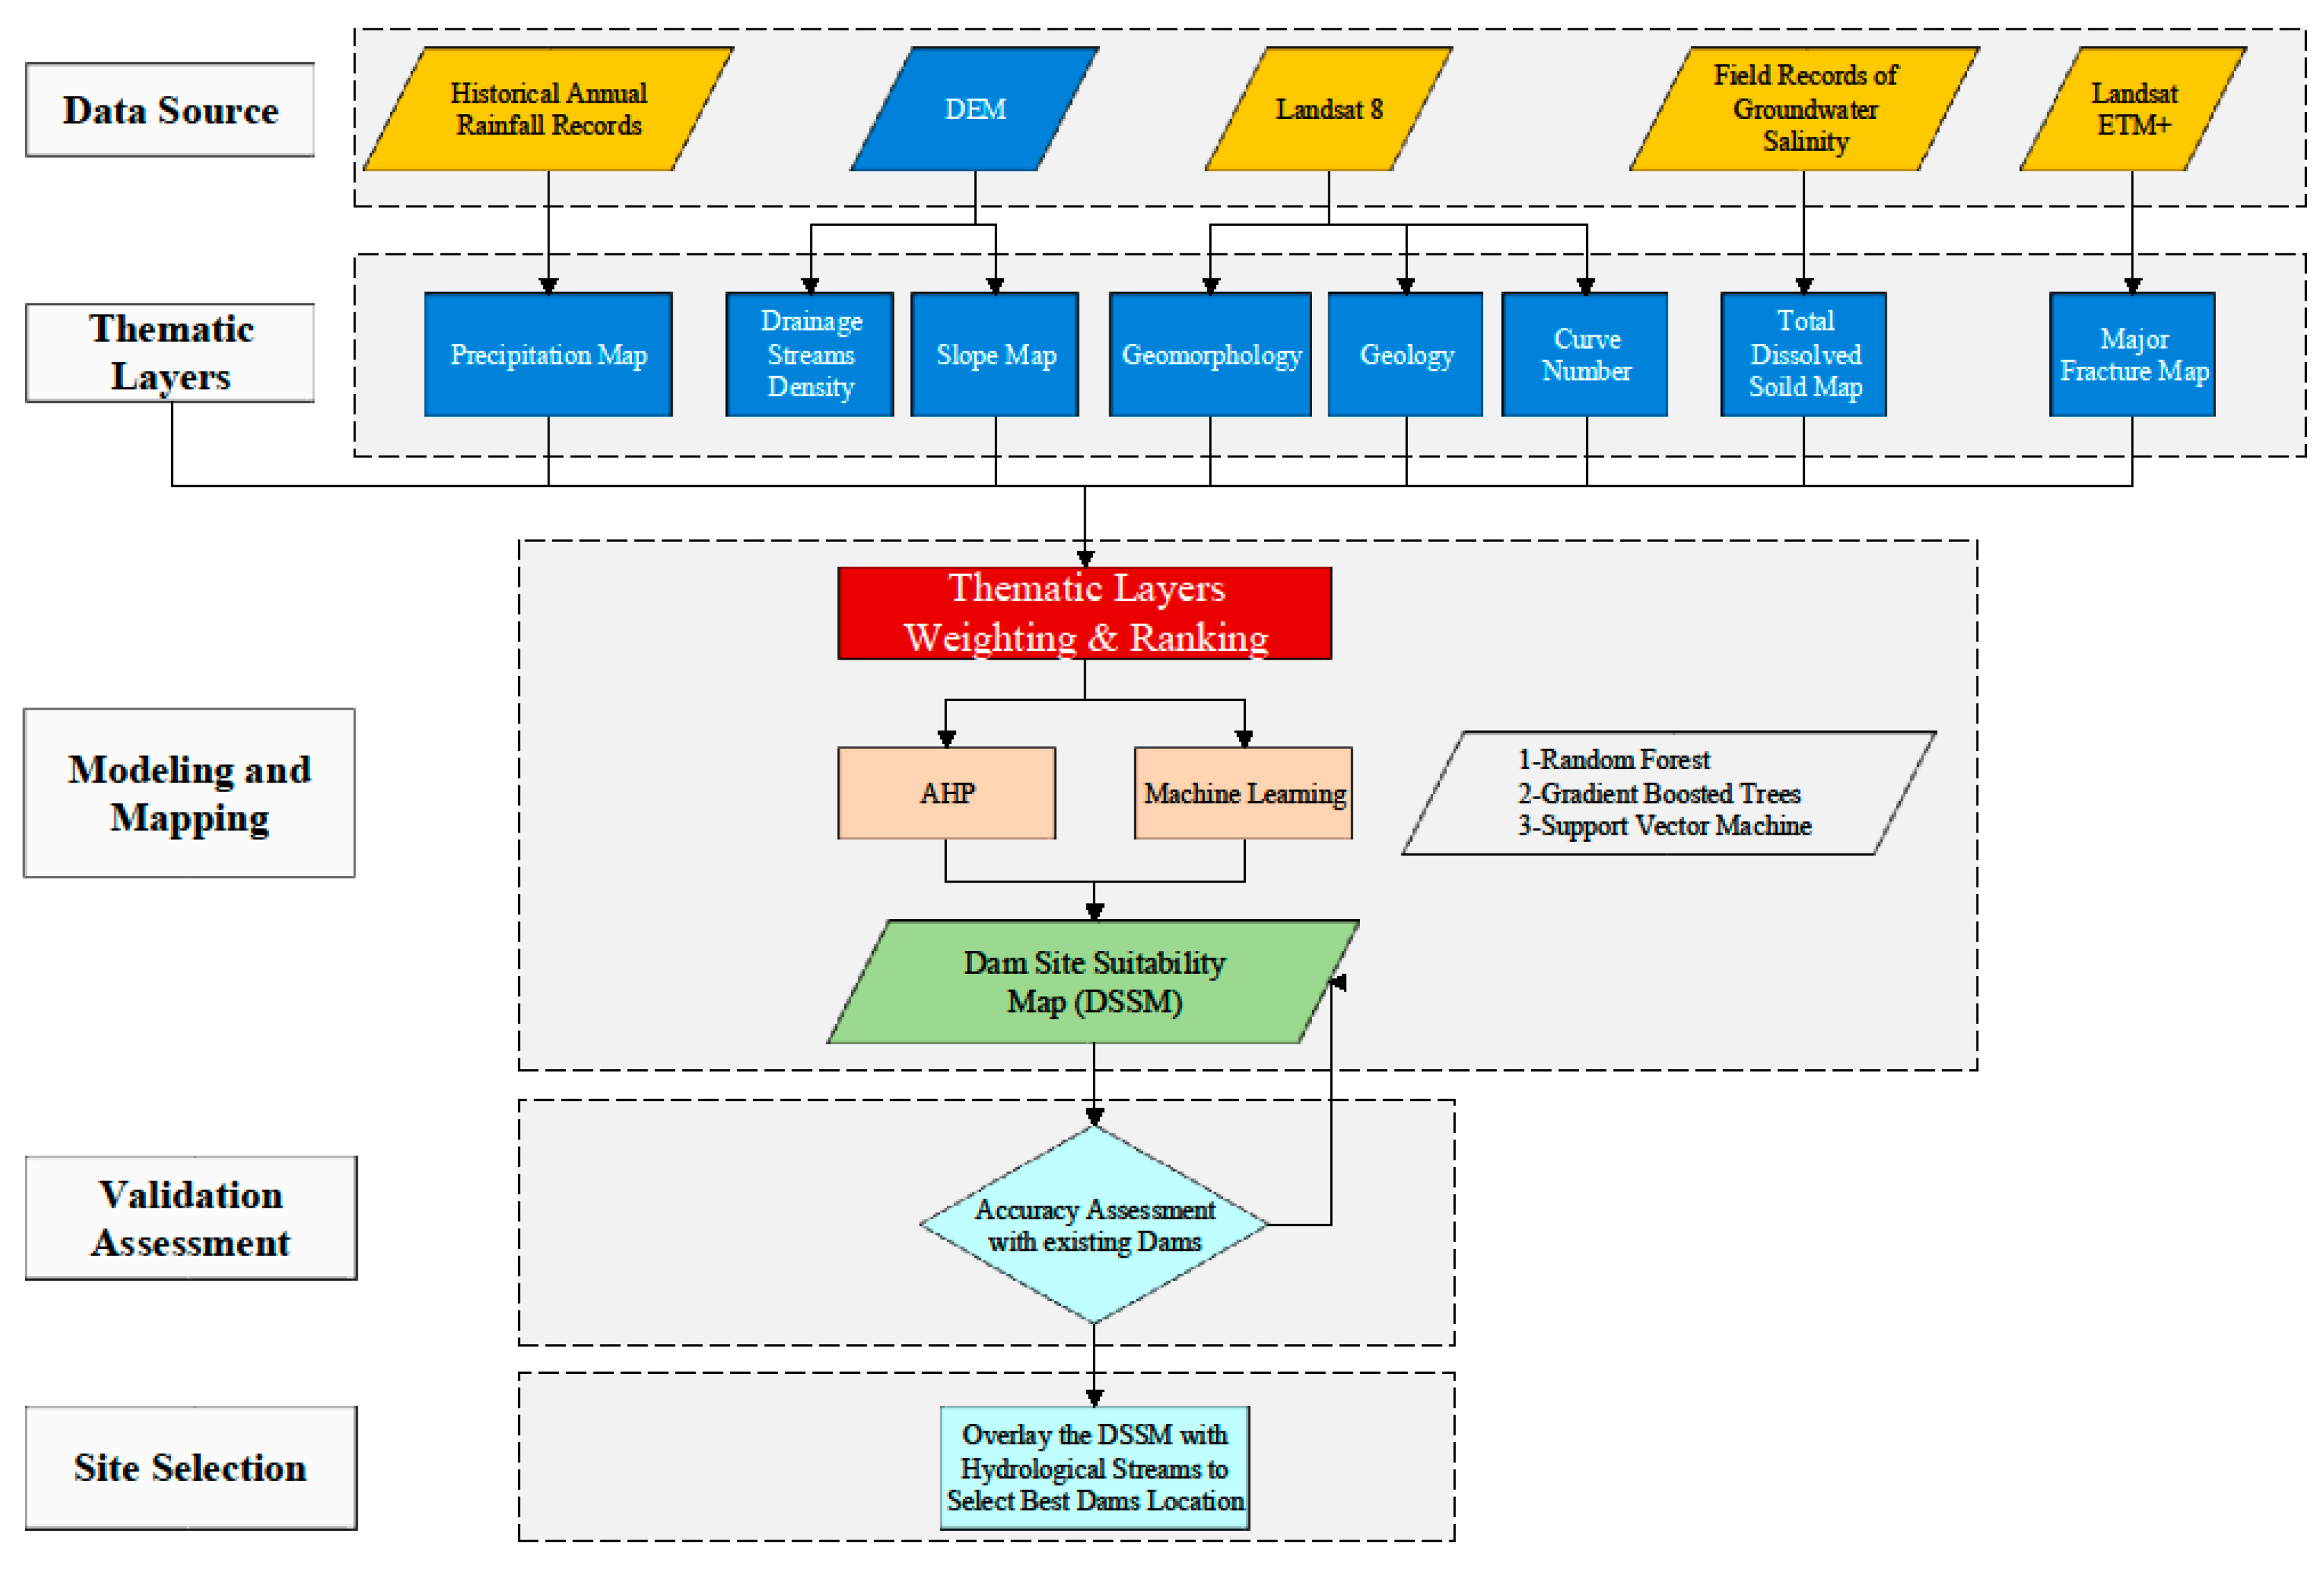
The second stage focused on processing the raw data to generate the thematic layers. Nine thematic layers were developed for the study area: precipitation, DSD, geomorphology, geology, CN, total dissolved solid, elevation, slope and major fracture. Many processing techniques and statistical algorithms were utilised in a spatial context to develop these thematic layers. The next subsection presents details about each thematic layer.
In the third stage, all the thematic layers were processed to model and map the best suitable dam location in Sharjah. Since the units of each thematic factor are different, combining and fusing the thematic factors is not applicable. Therefore, all the thematic layers were standardized by reclassifying each into five classes through the natural breaks (Jenks) technique [32]. Each class was ranked in a scale from one to nine according to its relation to a suitable location for dam construction. Two main approaches were followed to determine the weighting, i.e., the AHP and ML techniques. AHP modelling depends mainly on determining the weight in line with the literature and expert opinion. Conversely, the ML approach depends on ground truth data about the available groundwater in the study area [8]. The resulted weighting of the two approaches was moderated to obtain a new thematic layer weighting. The new weighting was utilised to generate the DSSM for Sharjah following the equation below:
GPM = k f   W k × r k
where k = element of the thematic layer set, f = set of all the thematic layers, W = weight of each thematic layer and r = rating of the subclasses of each thematic layer.
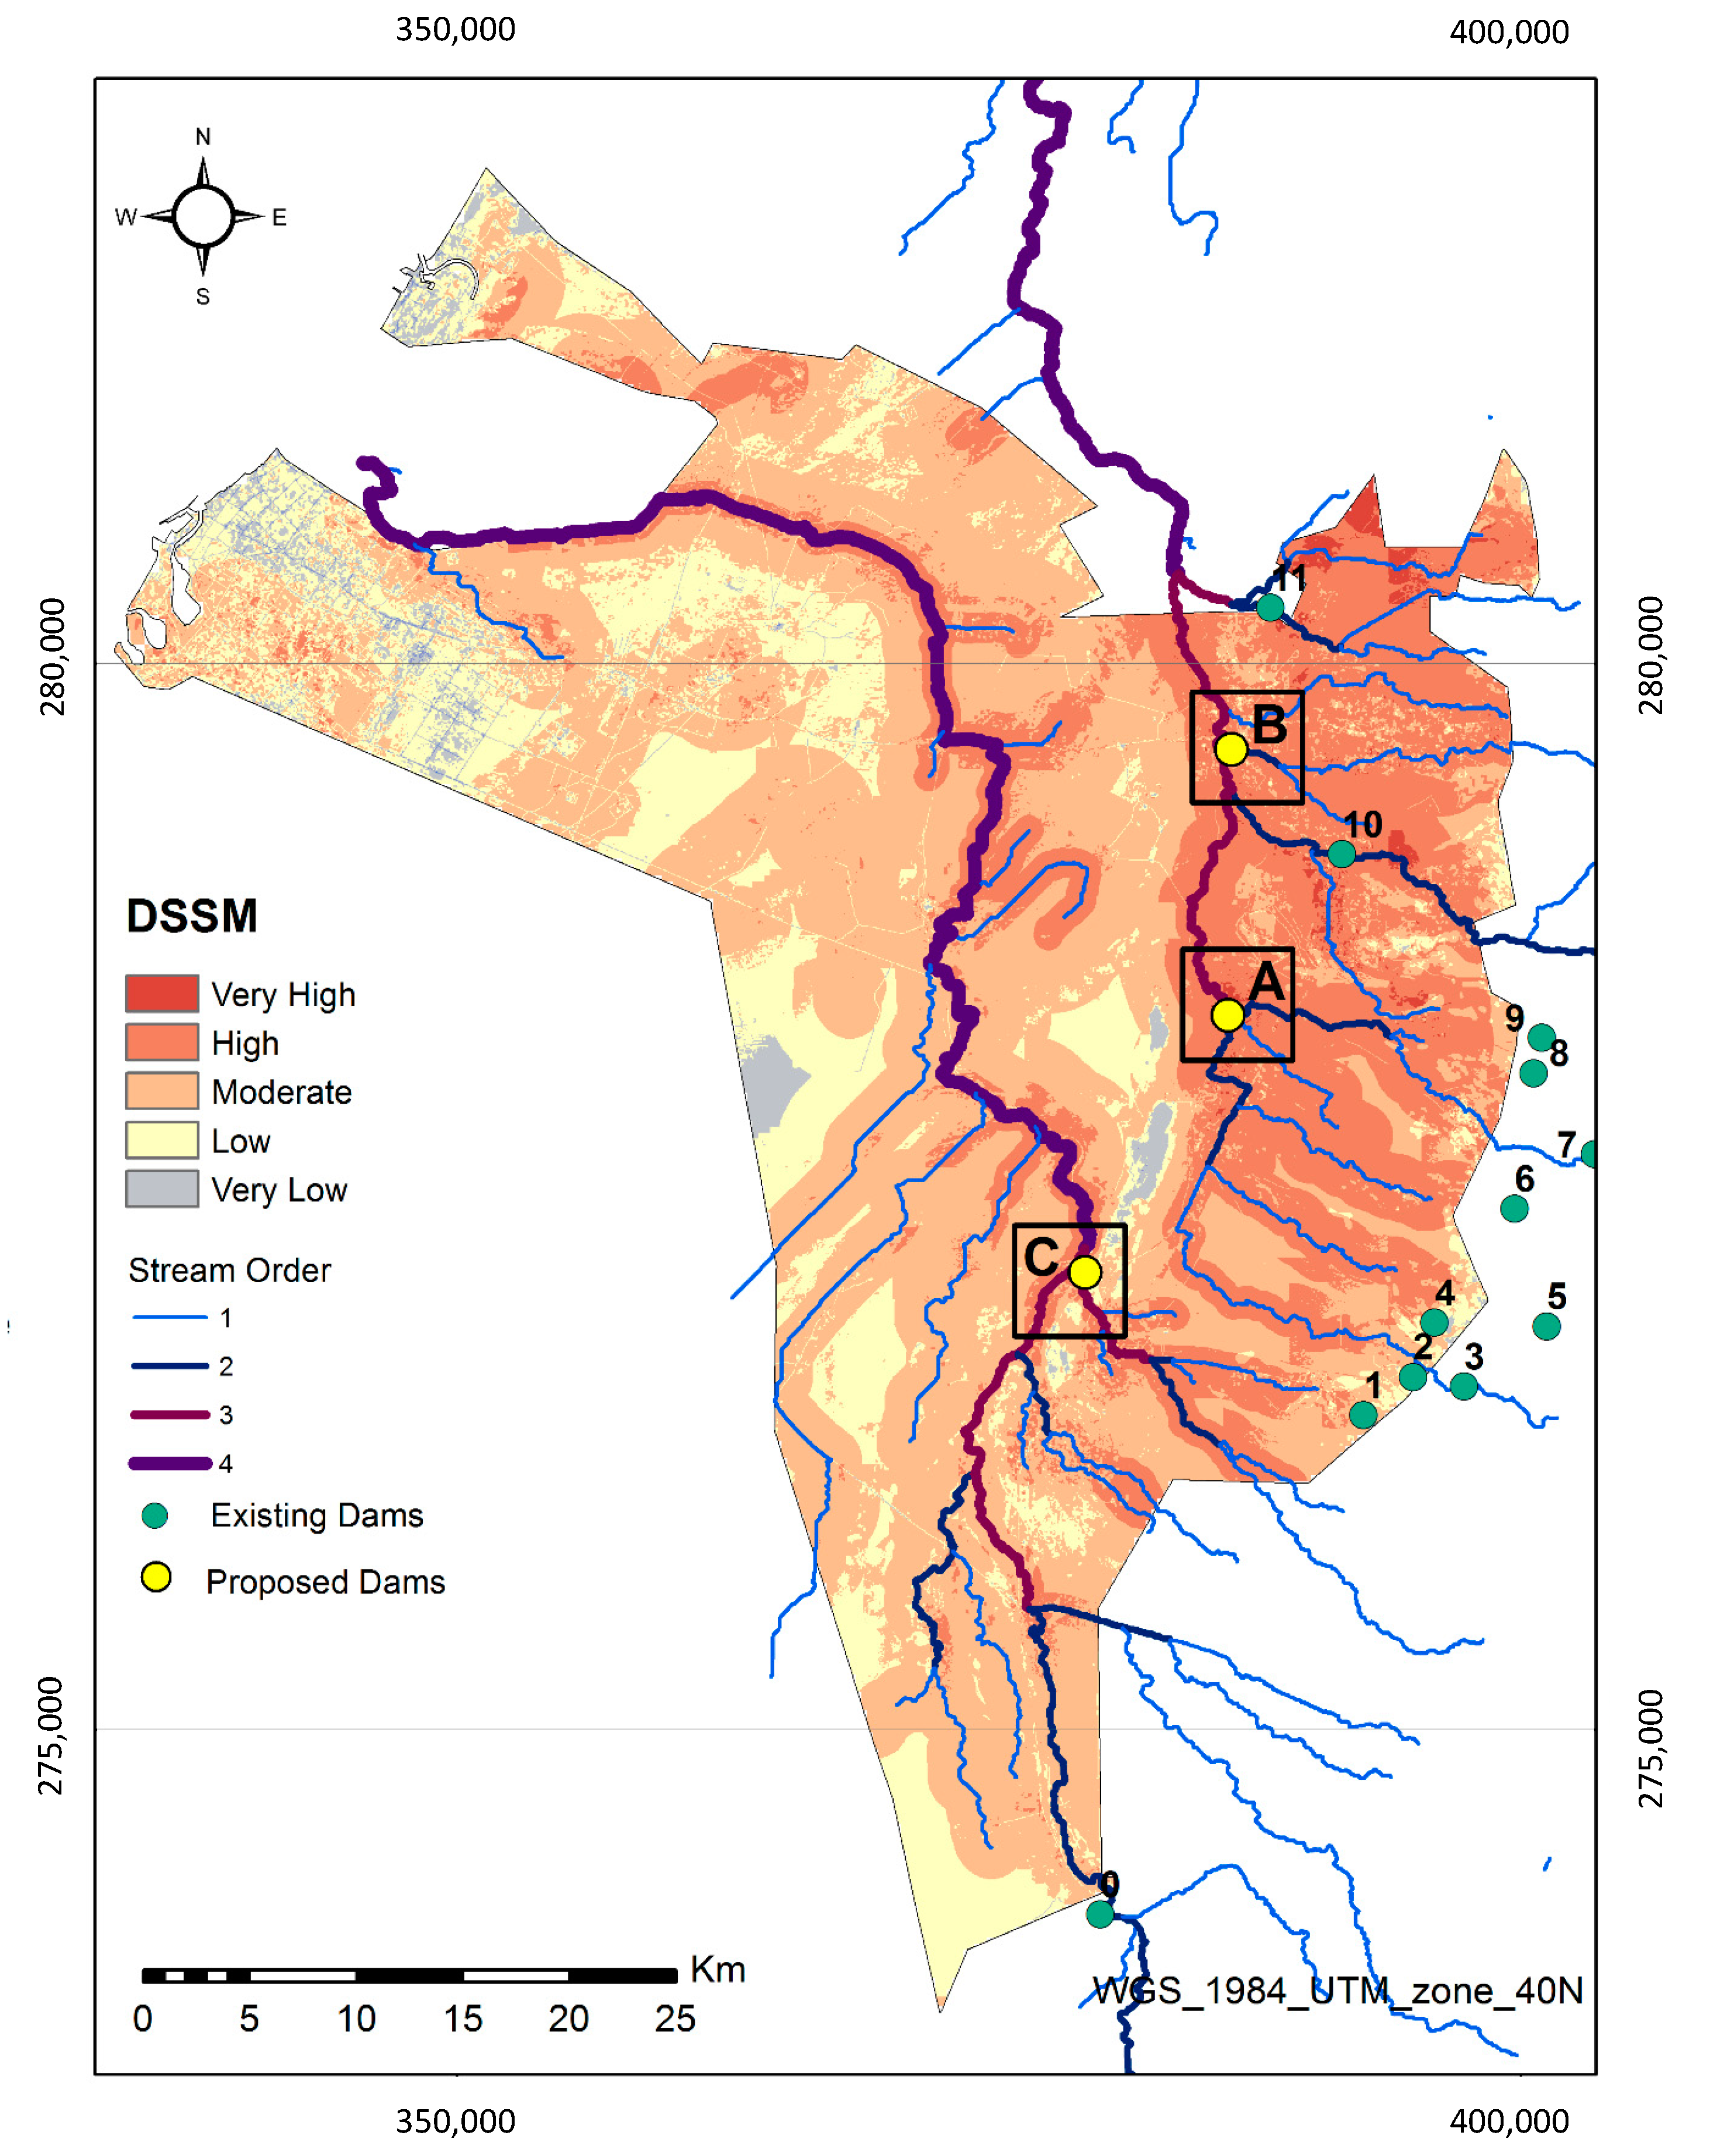
Subsequently, the DSSM was validated following existing dams in the study area, where the weighting may be fine-tuned to achieve accuracy. The drainage streamlines (vector format) were finally overlaid at the DSSM to select the best locations for dams in Sharjah.

3.1. Data Used

This study adopted nine parameters for determining suitable sites for dam construction: precipitation, drainage density, geomorphology and geology, CN, TDS, slope, elevation and distance from major fractures. The brief descriptions of the aforementioned parameters for locating suitable sites for dam construction are indicated below:
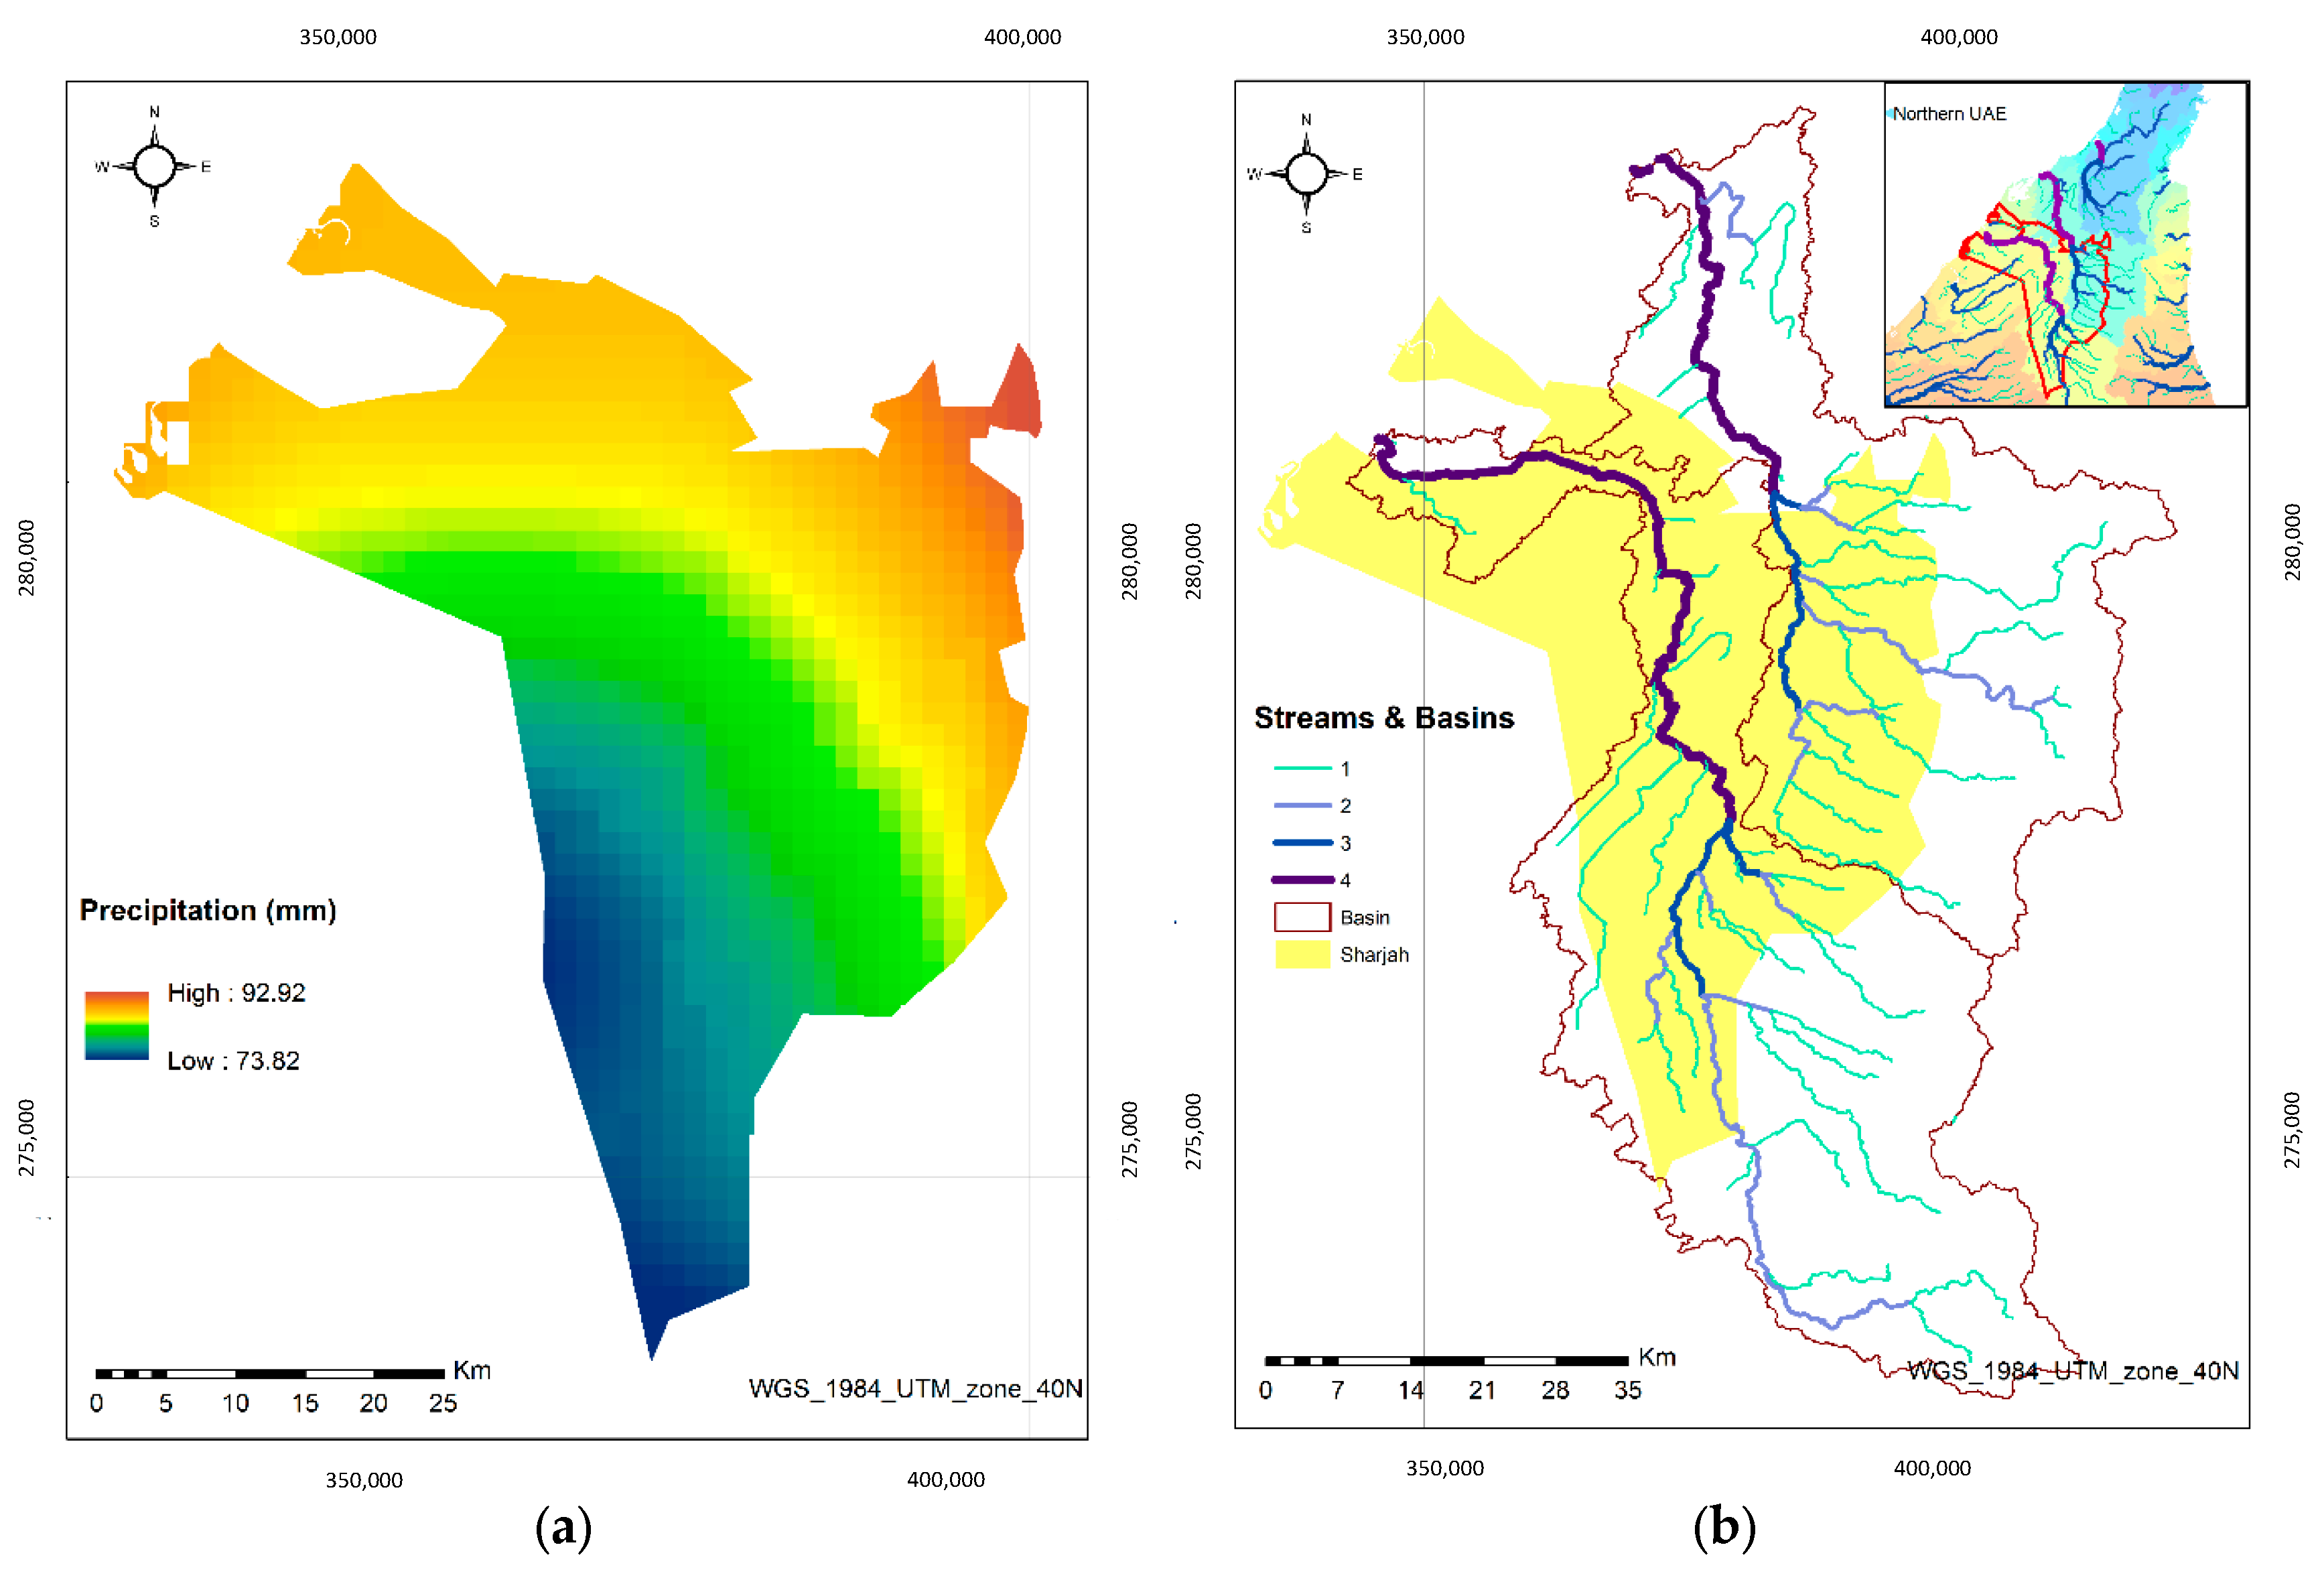
Precipitation:Figure 3a depicts the annual total rainfall data obtained from the National Centre of Meteorology, UAE, for the period of 2003–2017 to prepare the rainfall map. For Sharjah, the recorded amount varied from 73 mm as the minimum annual total to 92 mm as the maximum annual total. Precipitation is high in the north-eastern part of the study area. High precipitation zones are considered appropriate for identifying suitable sites for dam construction. The inverse distance weighted (IDW) interpolation method was applied to identify the spatial layer. The IDW equation is as follows:
Z 0 = i = 1 N z i × d i n i = 1 N d i n
where Z0 is the estimation value of variable z in point i, zi is the sample value in point i, di is the distance of the sample point to the estimated point, N is the coefficient that determines weight according to distance, and n is the total number of predictions for each validation case [33].
Hydrology and drainage stream density: Hydrology plays a vital role in understanding the structure of available water resources: surface and sub-surface resources. Streams originate from the north-eastern part of the UAE and flow towards the western part to join the sea. Thus, first-order streams are located at the eastern part, and a higher order of streams is located at the western part (Figure 3b). For locating suitable dam sites, first-order streams are generally considered [18]. DSD is the total length of streams of all orders divided by the area of the drainage basin and indicates the closeness of the spacing of channels [23]. A major indicator of percolation rate is lithology, which determines the quality of a drainage network. The structure of a drainage network helps gauge the characteristics of a water holding zone [19]. The drainage density of the study area ranges from 0 to 0.58 per km2 (Figure 3c). The suitability of locating a dam site is directly proportional to the drainage density because of its relationship with surface runoff and permeability. A high drainage density indicates a high prospect of groundwater and increased suitability for locating a dam site [25]. The drainage streams and basins should also be mapped for preparing the drainage density raster layer.
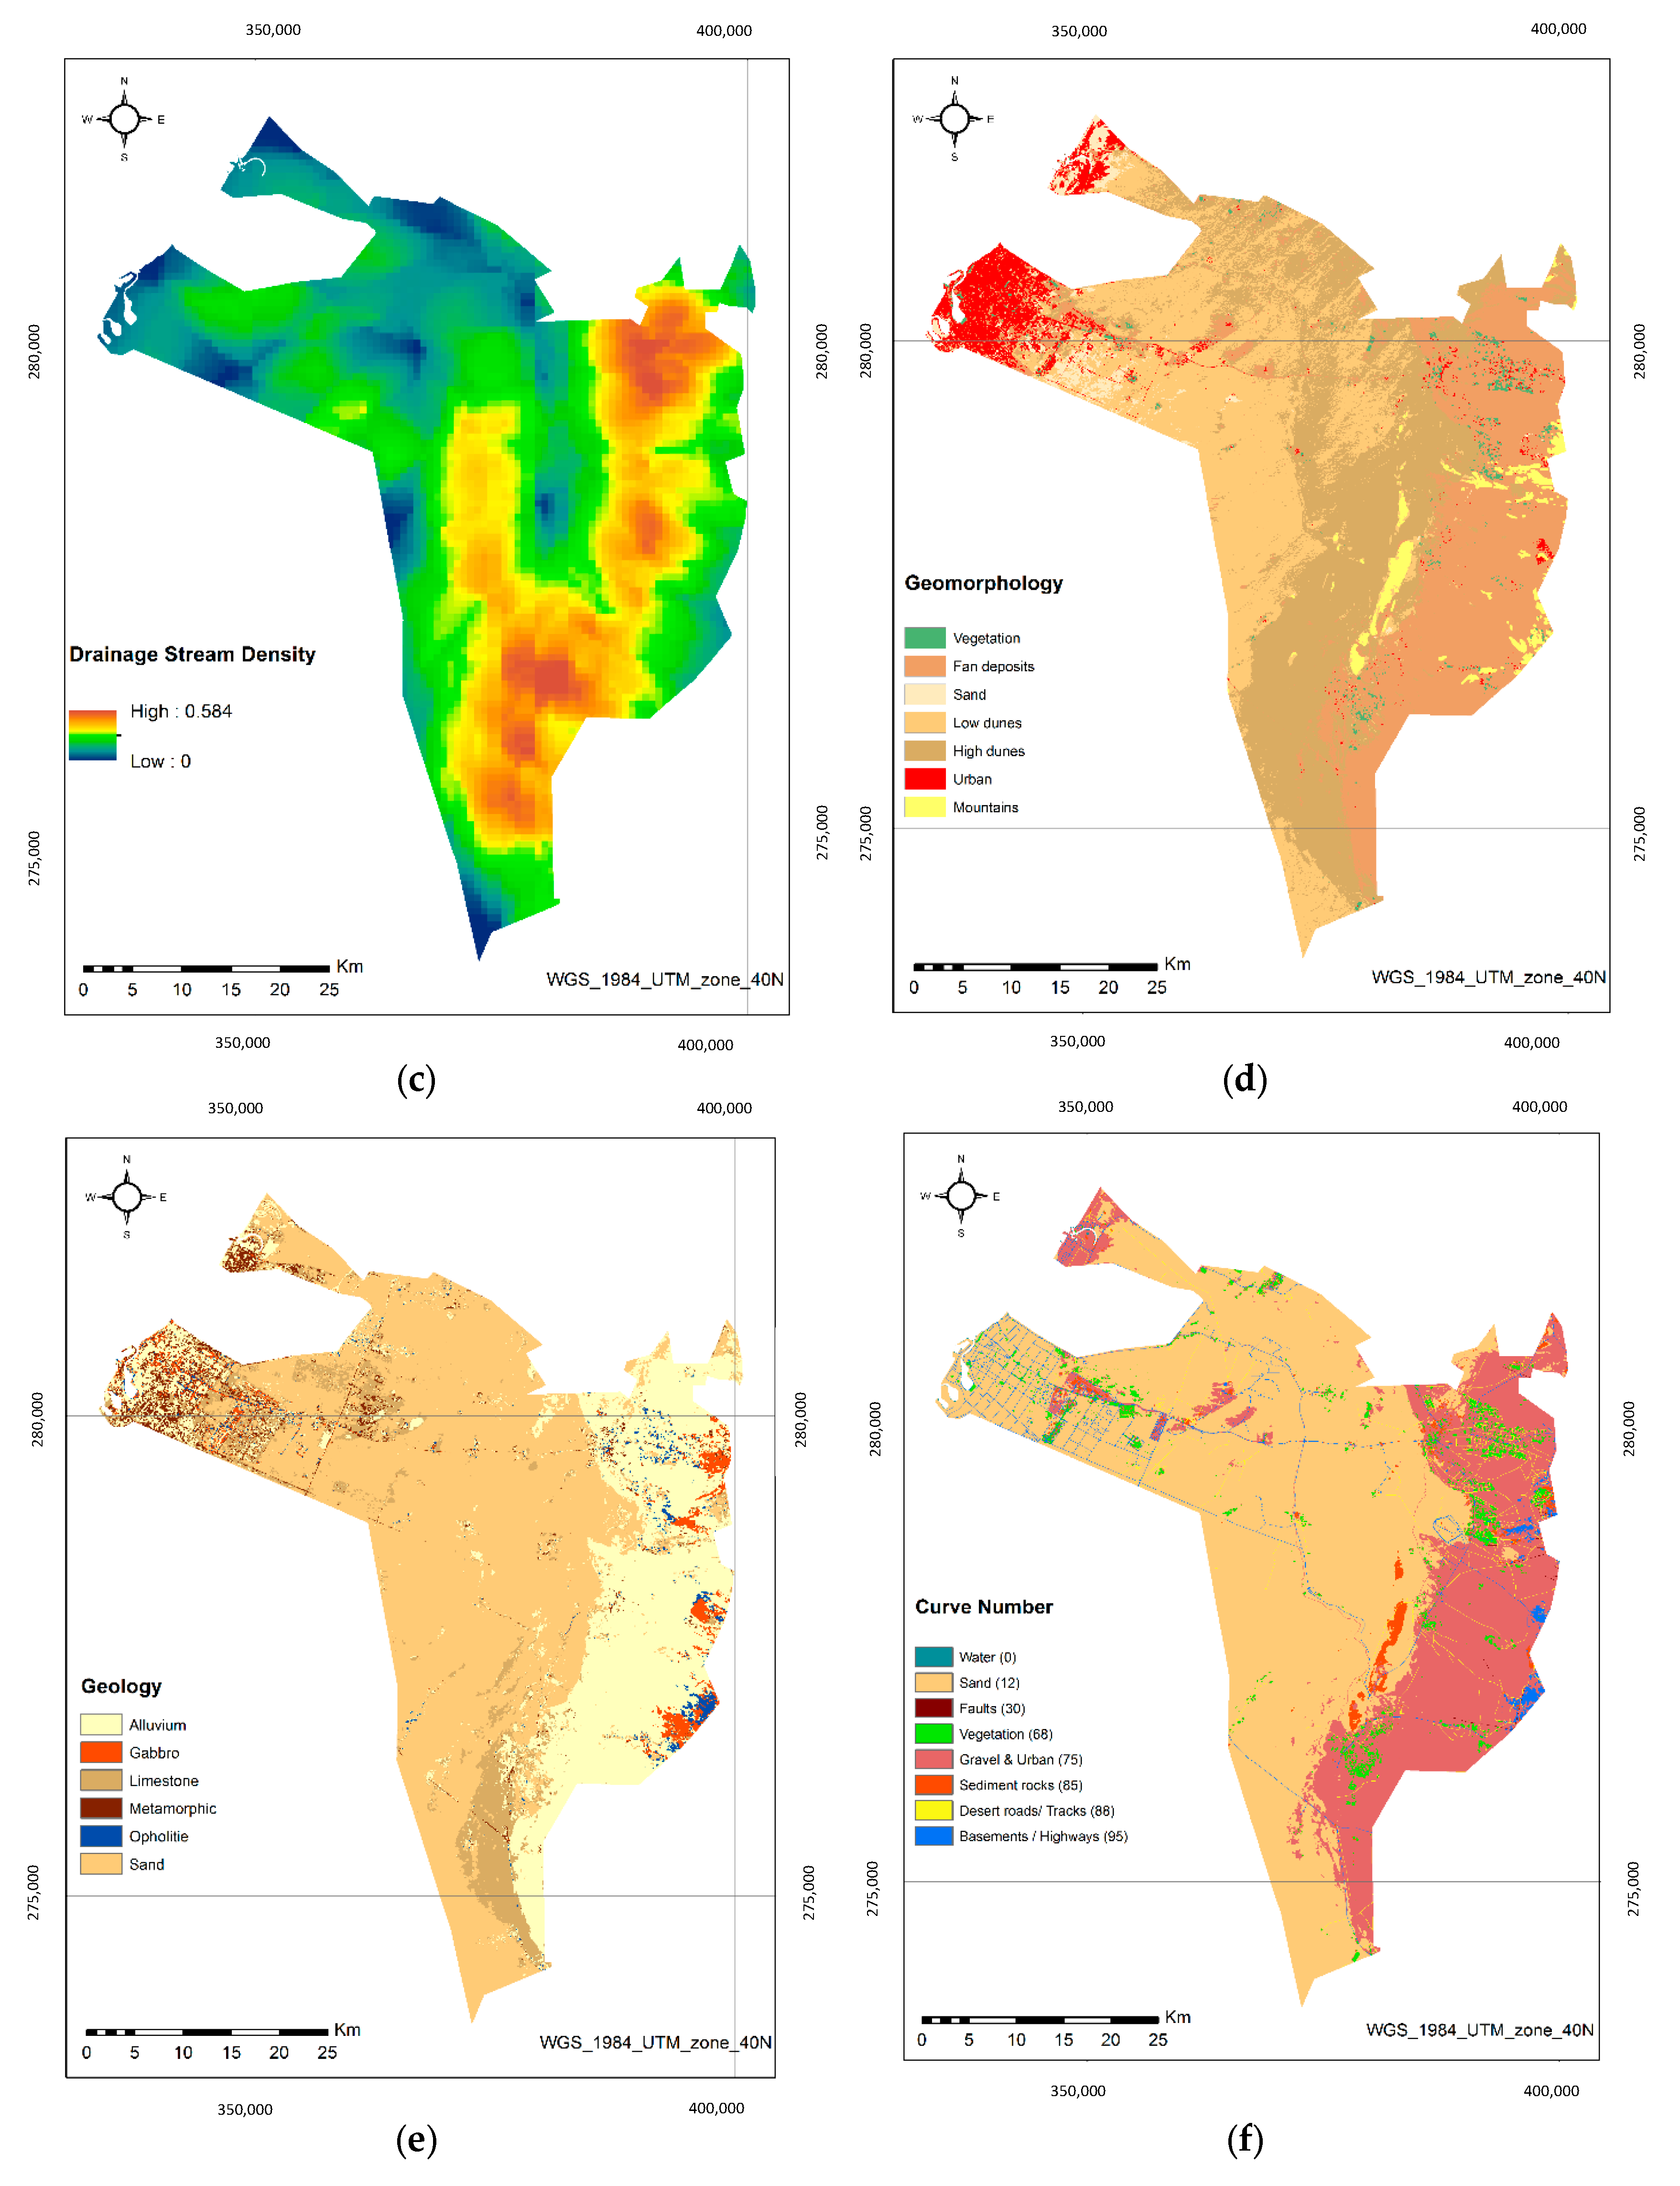
Geomorphology: This thematic layer has seven classes: Fan deposit, high and low dunes, mountain, sand, urban areas and vegetation (Figure 3d). It is important to mention that the urban areas class was considered within the geomorphology layer as it describes the physical feature (mainly asphalt for roads and concrete for buildings) for the urban centre in Sharjah. Urban areas are dominant along the western part of the study area near the shores [8]. The eastern part of the study area is mostly covered by fan deposits, whilst the middle part is predominantly covered by low and high dunes.
Geology: The produced geology layer consists of alluvium, gabbro, limestone, metamorphic, ophiolite and sand classes (Figure 3e). As the map indicates, most of the study area consists of sand. The profusion of alluvium and sand in the study area allows for suitable locations for dam construction.
Curve number: The CN is used to predict direct runoff or retention. The CN depends on the soil type, the effects of land use and cover and the hydrogeological condition. For this study, CNs were obtained for the mentioned conditions (Figure 3f). A high CN indicates low suitability for locating dam sites.
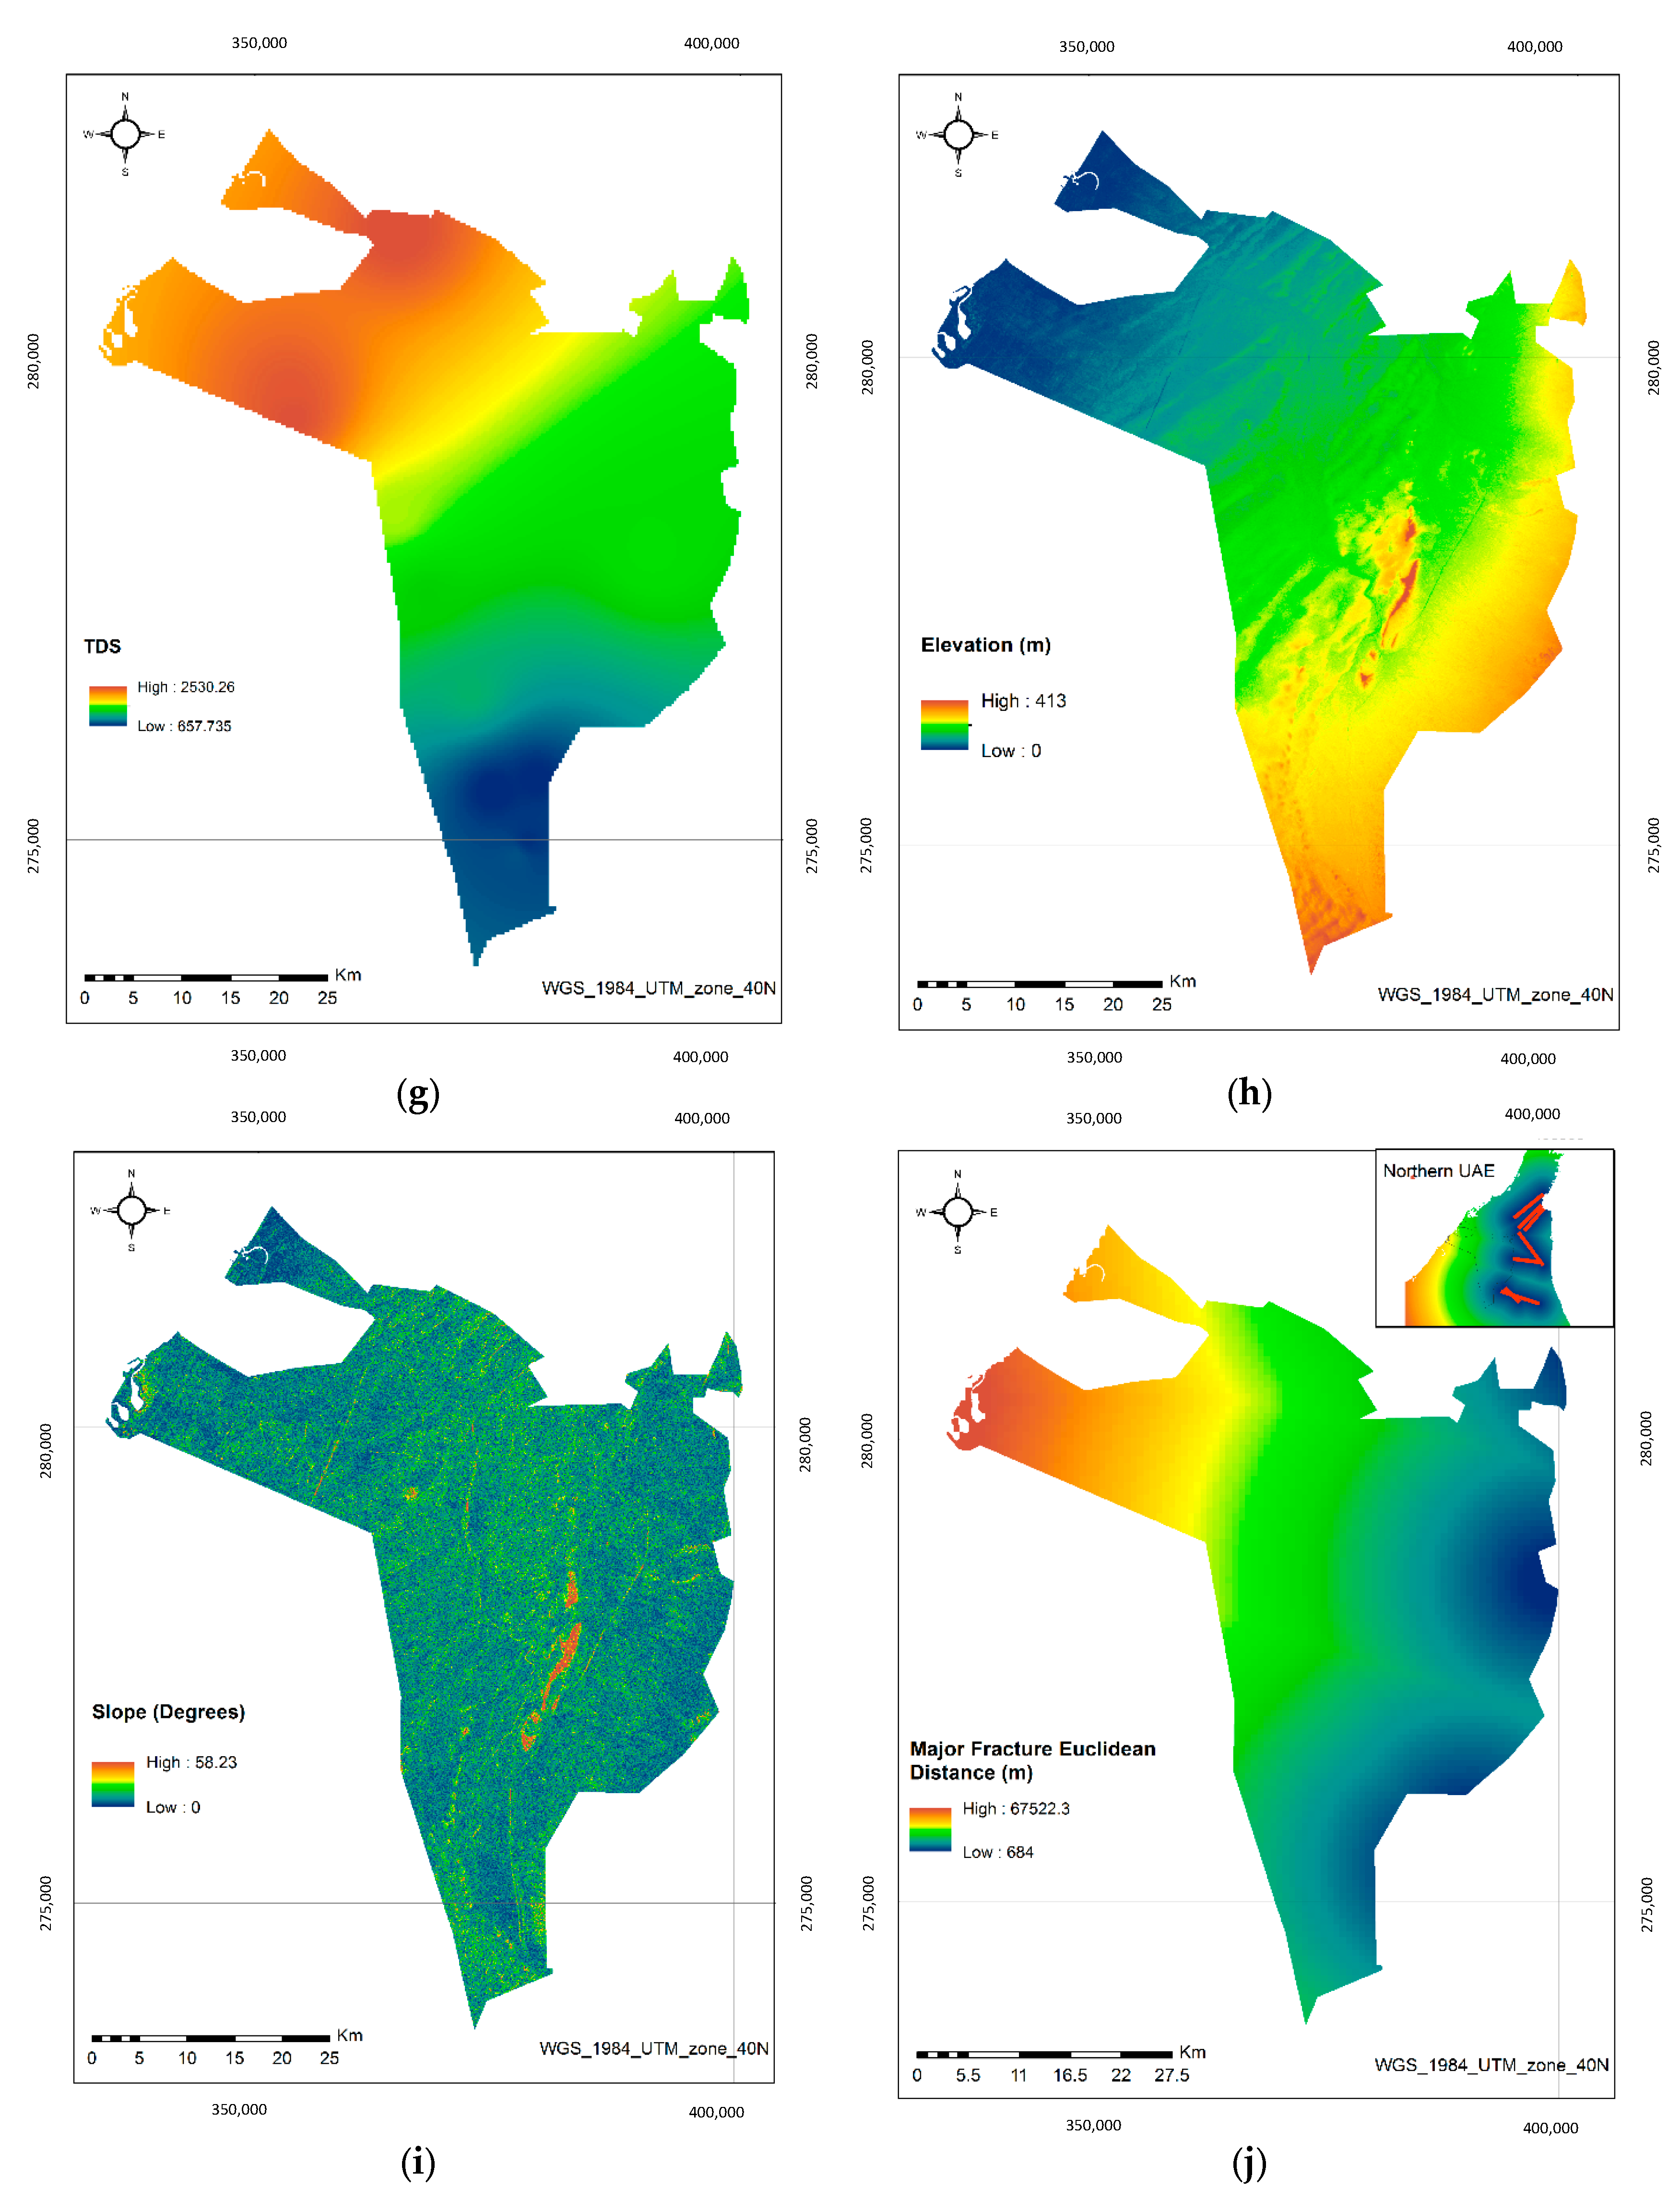
Total dissolved solids: TDS is a fundamental parameter to assess water quality. A high TDS value indicates high turbidity and unsuitability for potable use. Given the high salinity of the region, the sea water of the Arabian Gulf represents a major hurdle in its use for potable drinking conditions. For the study area, TDS was measured in parts per million (ppm). The TDS values range from 657 to 2530 ppm for Sharjah (Figure 3g). The map was prepared by referring to the values of TDS from the UAE Ministry of Environment and Water (2015).
Elevation: A digital elevation model (DEM) with a resolution of 30 m was acquired for Sharjah, and the elevation raster ranged from 0 to 413 m (above sea level) (Figure 3h). The DEM influences the dam’s best location since it affects the water accumulation and movement [34]. A low elevation has been considered suitable for dam site construction since the possibility of accumulating precipitated water as well as groundwater is higher at a lower elevation [8,35].
Slope: The slope degree parameter affects water velocity for surface and ground water. The lower the slope, the higher the possibility of water accumulation. As with elevation, a slope map was also obtained from the DEM at a 30 m resolution (Figure 3i). For Sharjah, the slope ranged up to 58 degrees (Figure 3i). Water velocity is directly proportional to slope. A slope under 5% is suitable for the water holding capacity of the proposed dam construction [22].
Major fracture Euclidean distance: For the Northern UAE, major fractures are mostly concentrated in the mountainous regions (Figure 3j). The stream flow depends on the major fracture and moves from higher to lower elevations. A distance of 100 m from the tectonic faults and fractures should be at least considered for considering suitable locations for dam construction. Areas with faults should be excluded from the consideration of dam site suitability [18].

3.2. Analytical Hierarchal Process

AHP is one of the MCDM aids. Many researchers have utilised AHP for various domains [36,37,38]. Locating a suitable site for dam construction is one such domain where AHP has been applied for investigations. Determining the importance of parameters is the main task in AHP. Weight determination is discussed below.

3.2.1. Assigning Weights to the Parameters

Weighing the parameters was conducted in a square framework by assigning a value of 1 as its diagonal element. The weightage of these parameters was then decided from the eigenvalue and the corresponding right eigenvector of the AHP correlation grid [39]. Each parameter was assigned weights according to their sub-criteria (Table 2).

3.2.2. Consistency Ratio

The consistency index, randomised index and consistency ratio (CR) were calculated to evaluate the consistency of the square matrix. CR should be under 10% to maintain the consistency of the matrix [39]. The CR can be derived using the following equations:
CI = λ max n n 1
RI = 1.98 × ( n 1 ) n
CR = CI Random   Consistency   Index   ( RI )
where CI is the consistency index, RI is the randomised index, CR is the consistency ratio, and n is the order of the compression matrix. Table 3 presents the pairwise comparison matrix of the study. The CR was calculated as 2% and thus fulfils the criteria to be considered as a good model.

3.3. Machine Learning

ML techniques use computational algorithms and statistical models to develop models without any predetermined model. In other words, ML teaches the computer to do what humans naturally do, i.e., learn from experience and examples. As the quality of the experience and the examples increase, the better the ML achieved models become. ML techniques are of two types: supervised learning and unsupervised learning. The former tackles regression and classification problems, and the latter deals with clustering problems only. In this paper, we utilised three supervised ML techniques to classify the best location to build new dams in Sharjah. The techniques include random forest (RF), gradient boosted trees (GBT) and support vector machine (SVM). The RF technique is an advanced version of the decision tree method that uses a tree-like model structure for classification prediction through a multiple splitting process. The RF is an ensemble ML that consists of multiple tree models to improve prediction accuracy. The GBT is an ensemble tree-like model that consists of two steps: Firstly, it utilises the subsets of the original database to generate a series of averagely performing models. Secondly, it ‘boosts’ their performance by combining them using a certain cost function. Finally, the SVM technique uses kernel functions to transform the input data into a high dimensional feature space, where linear modelling is then employed to overcome any complex nonlinear relationship [40]. SVM is best known for its capacity in classification problems [41].
We established four databases ranging from 1000 to 2500 data sample across the study area to train the ML algorithms in this research. The independent parameters are the thematic layers developed in this study, and the dependent parameter was the potential groundwater. The groundwater potential map (GPM) was developed in an early study for the Northern Emirates [8]. The GPM data considered in this study were categorised into three groups: high, medium and low. All ML modelling was conducted utilizing the RapidMiner software (https://rapidminer.com/). Initial modelling revealed that the database with 2000 data samples attained the best accuracy. Therefore, all the results for the ML techniques, described in this section, are based on the 2000-sample database.
Each ML model has been fine-tuned to achieve its best accuracy. The best RF model has trees of 100 with a maximum depth of seven. Conversely, the best GBT has trees of 100 with a maximum depth of two. Finally, the best-scored SVM had a gamma of 0.001 and C of 100. Overall, RF had the best accuracy relative to the other techniques (Table 4). RF reached 76.5% accuracy with a standard deviation of ±2.4%. The accuracy rates of the GBT and the SVM were 76% and 72.7%, respectively. Table 5 shows the confusion matrix accuracy of the RF technique. The ‘True High’ accuracy reaches almost 80%.
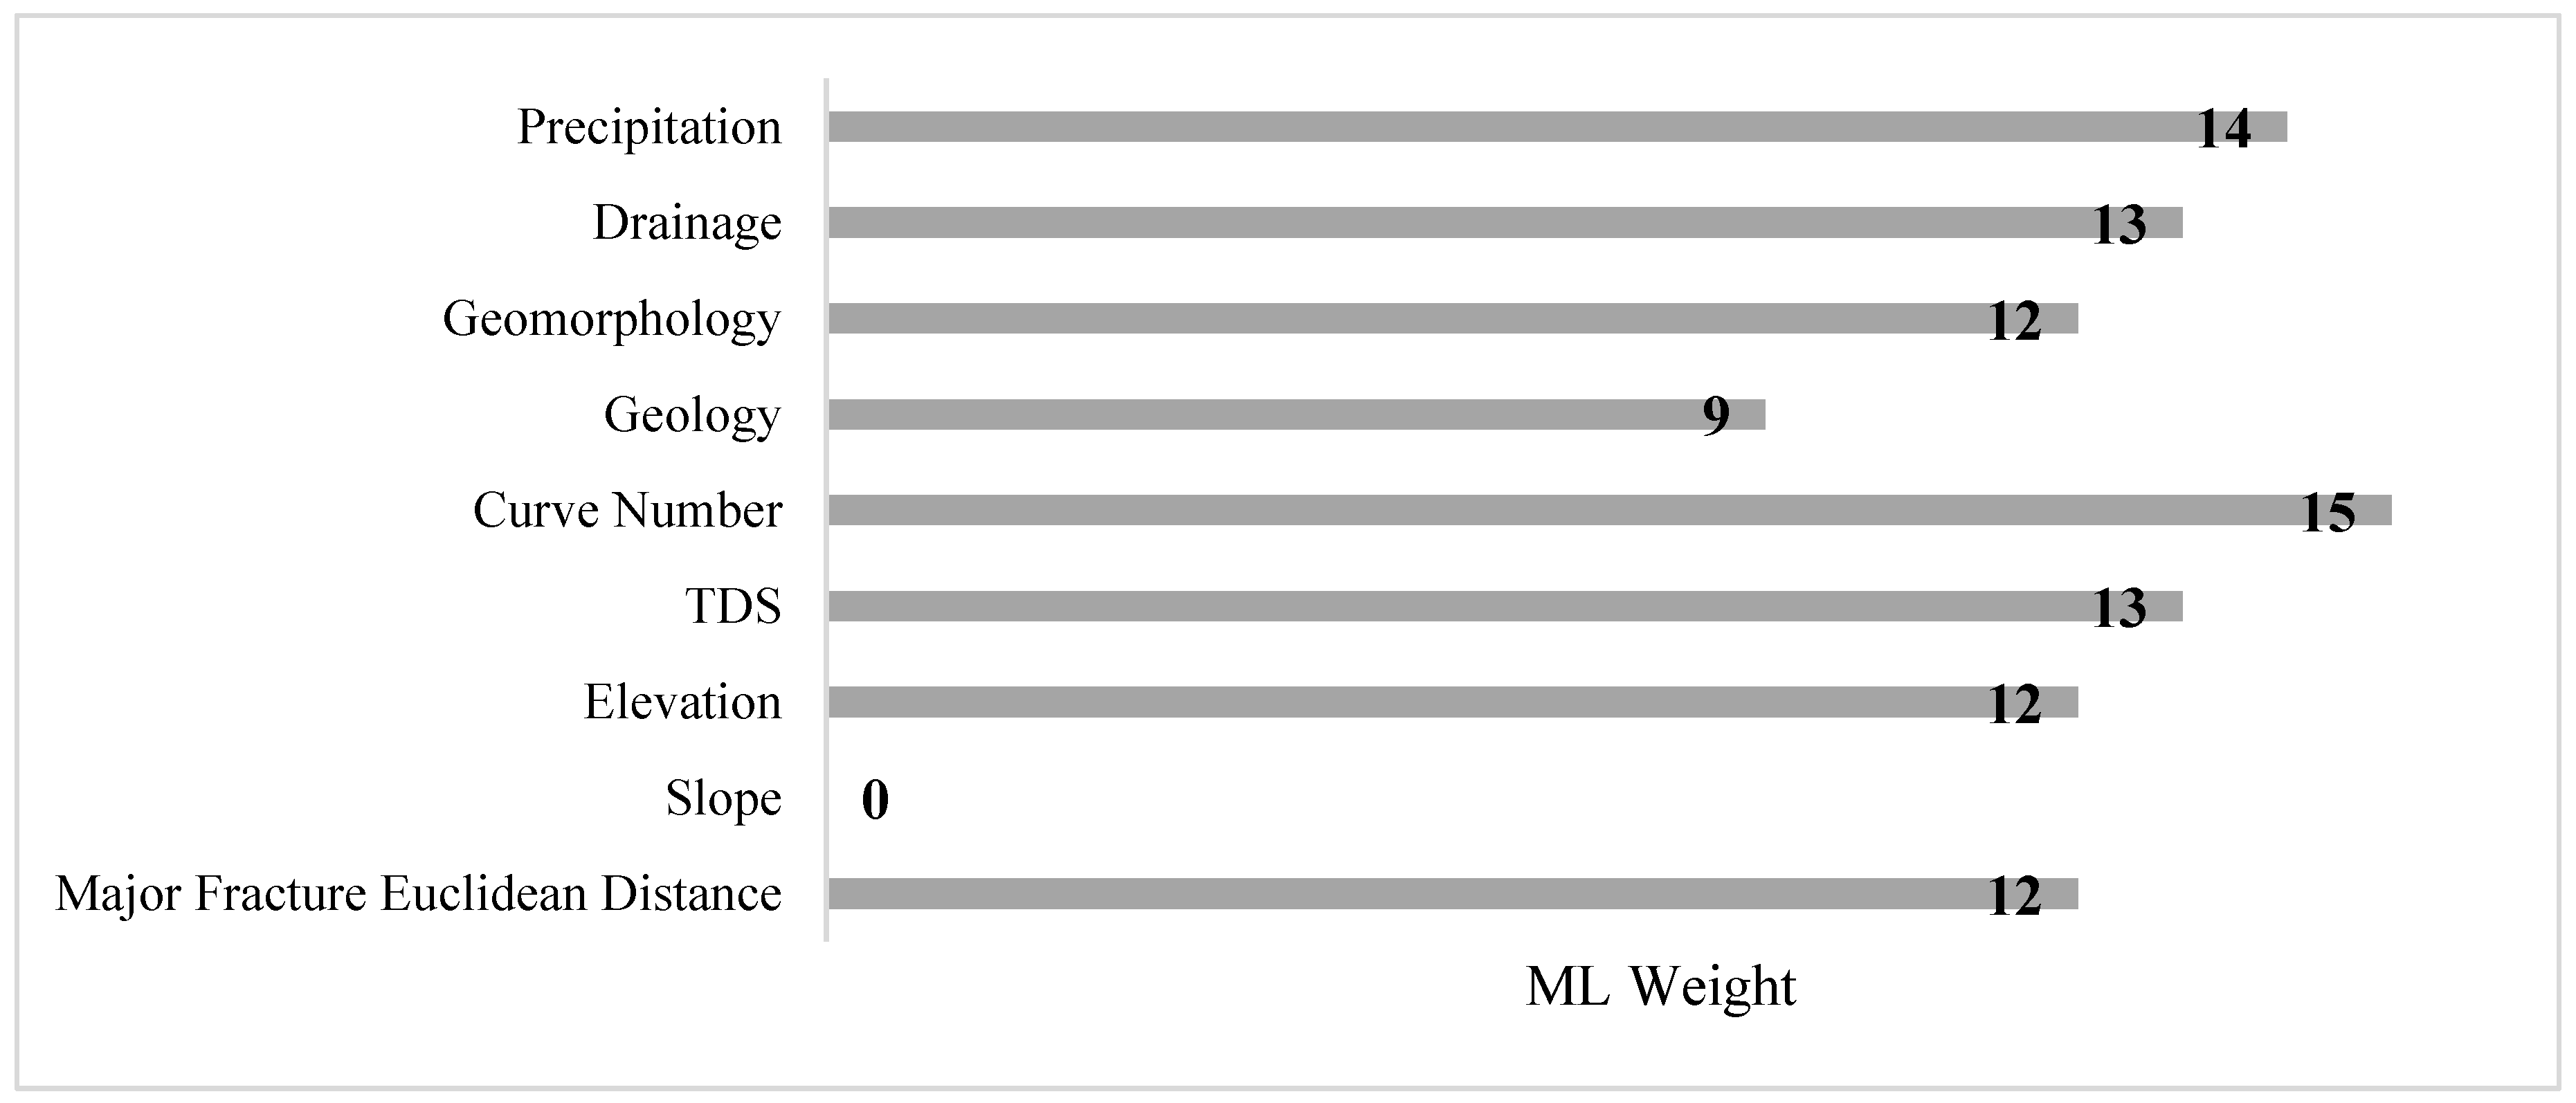
Figure 4 presents the weight of each inputted parameter (the thematic layers) with respect to the dependent parameter (GPM) according to feature engineering techniques. The weights are generally comparable with the AHP weights that are based on the literature and expert opinions. However, a key difference occurs. The slope parameter from the ML received zero weight, thereby indicating that its presence is unimportant. By contrast, the slope from the AHP attained a 5% weighting. Given our knowledge of the study area, we assert that the slope is excluded in the ML weighting process because the variation in the slope within the study area is almost negligible.

4. Results and Discussions

Table 6 shows the recommended final weights to generate the DSSM after revising and moderating the weights of the ML and the AHP. The revised weighting attempted to balance and mitigate any over- or under-estimation of the thematic layers that influence the dam suitability location.
Figure 5 shows the DSSM processed using the revised weights. The DSSM was divided into five classes: very high, high, medium, low and very low. Three locations were considered for dam construction on the basis of spatial analysis. The first involves the very high areas in the map which are mainly located on the north-eastern part of Sharjah. The two other areas are the highly and moderately suitable locations. These locations were further investigated through a field visit to finalise the location for dam construction. Existing dams located within the study area and their surroundings were superimposed over the DSSM to investigate and validate the obtained DSSM (Figure 5). Table 7 presents the storage capacity of each existing dam. Given the information in Table 7 and Figure 5, the following points can be made:
  • The very high zone is located in the north-eastern part of Sharjah. The properties of the input parameters include a slope at approximately 3%, elevation at 130 m, sand geology, high dune geomorphology, drainage density of 0.21 per km2 and precipitation of approximately 85–90 mm for the categorised region. The neighbouring region of this site has already been used for constructing the Falajalamala Dam (ID 11) which lies within the Umm Al-Quwain Emirate and has a storage capacity of 0.068 million m3.
  • The eastern part of Sharjah has been categorised as a highly suitable location because of its satisfactory drainage and geology properties. Conversely, the western part of Sharjah has been categorised as a highly or moderately suitable location for dam construction by the AHP model.
  • Three locations were proposed for constructing a dam: Locations A, B and C. Locations A and B have been categorised as very highly suitable regions according to the AHP model. Location C falls under a highly suitable region for dam construction.
  • The Shokah dam (ID 7) with a storage capacity of 0.275 million m3 has already been constructed on the first-order stream of the proposed Location A. Thus, given all the factors, the site was proposed at the conjunction of the second- and third-order streams. Location A receives approximately 84 mm of rainfall and has a high dune geomorphology and alluvium geology. Its drainage density is near to 0.34 per km2, and its TDS ranges within 1400–1430 mg/L.
  • Location B was proposed at the conjunction of the second- and third-order stream. The Koderah (ID 10) dam has already been constructed in the adjacent stream, so a parallel conjoint point was selected for dam construction. The average rainfall for the proposed location is approximately 85 mm, the drainage density is 0.44 per km2, TDS is 1550 mg/L and elevation is 122 m.
  • Location C was proposed at the conjunction of the third- and fourth-order streams which falls into a highly suitable region. The area has an observed rainfall of 82 mm, a drainage of 0.4 per km2, a high dune geomorphology, and sand as the geological structure.
Validation was conducted using pre-existing dams to analyse the accuracy of both models (AHP and ML) adapted to prepare the DSSM. Dams within Sharjah and the surrounding state border were considered. As per the models and the pre-existing dams, 83.3% of the dams fall under high and moderate zones, thereby validating our approach and study. Four dams were constructed within the Sharjah emirate. Amongst them, three were constructed within moderately suitable regions. Moreover, one was constructed within a highly suitable region. This study was conducted and validated, so that additional dams within highly and moderately suitable locations can be considered within the Sharjah emirate to maintain and fulfil the water needs and in light of sustainable development.

5. Conclusions

Identifying potential locations for dam construction is an important strategic initiative for water conservation in any country, particularly in those located in arid and semi-arid regions. In this study, a hybrid algorithm that combines GIS, AHP and ML was developed to identify the best location to construct new dams in one of the major cities in the UAE. Nine thematic layers were considered to prepare the DSSM, including precipitation, DSD, geomorphology, geology, CN, TDS elevation, slope and major fracture. Two approaches were followed to determine the influence of each factor: one based on the literature and expert opinion following the AHP techniques and the other based on ground truth groundwater mapping following ML techniques. The weighting according to the two approaches was moderated into a new revised weighting.
Precipitation and drainage density are the most influential factors for the DSSM. By contrast, slope was the least influential as the variation in the slope across the study area was minimal. The developed DSSM was verified using existing dams, and approximately 83.3% of such dams are located in high and medium zones. The result of this research provides a guideline for researchers and concerned engineers in identifying the best suitable location for new dam construction in the study area. The developed technique can be utilised alongside traditional approaches to ascertain new locations for dam construction as it increases efficiency and saves time and resources. Future research could focus on comparing other decision-making techniques versus ML algorithms. Moreover, additional work could be implemented to link the optimal capacity of the newly proposed dam with GIS and RS.

Author Contributions

R.A.-R., A.S., A.G.Y., and A.I., developed the concept and the methodology of the study. R.A.-R., S.M., and M.B.A.G. conducted the spatial processing to develop the required thematic layers. R.A.-R., A.S., A.G.Y., A.I., and S.M. carried out the AHP weighting approach. R.A.-R. and M.A.K. conducted the ML techniques. R.A.-R., A.S., A.G.Y., and A.I., contributed in selecting the best location for building new dams. R.A.-R., A.G.Y., S.M., and M.A.K. prepared and reviewed the manuscript.

Funding

The project was jointly funded by the University of Sharjah (UoS) and the Sharjah Electricity and Water Authority (SEWA), grant number: 1602040133-P under the SEWA Chair for Energy & Water.

Acknowledgments

The authors would like to thank Hamid Al Naimy, Chancellor of UoS, and Rashid Alleem, Director of SEWA, for facilitating the study.

Conflicts of Interest

The authors declare no conflict of interest.

References

  1. Veldkamp, T.I.E.; Wada, Y.; Aerts, J.C.J.H.; Döll, P.; Gosling, S.N.; Liu, J.; Masaki, Y.; Oki, T.; Ostberg, S.; Pokhrel, Y.; et al. Water scarcity hotspots travel downstream due to human interventions in the 20th and 21st century. Nat. Commun. 2017, 8. [Google Scholar] [CrossRef] [PubMed]
  2. Al-Ruzouq, R.; Hamad, K.; Shanableh, A.; Khalil, M. Infrastructure growth assessment of urban areas based on multi-temporal satellite images and linear features. Ann. GIS 2017, 23, 183–201. [Google Scholar] [CrossRef]
  3. Hoekstra, A.Y.; Chapagain, A.K. Water footprints of nations: Water use by people as a function of their consumption pattern. In Integrated Assessment of Water Resources and Global Change: A North.-South. Analysis; Springer: Berlin/Heidelberg, Germany, 2007; pp. 35–48. [Google Scholar] [CrossRef]
  4. Gallego-Ayala, J.; Juízo, D. Strategic implementation of integrated water resources management in Mozambique: An A’WOT analysis. Phys. Chem. Earth 2011, 36, 1103–1111. [Google Scholar] [CrossRef]
  5. Aldaya, M.M.; Allan, J.A.; Hoekstra, A.Y. Strategic importance of green water in international crop trade. Ecol. Econ. 2010, 69, 887–894. [Google Scholar] [CrossRef] [Green Version]
  6. The World Bank United Arab Emirates Data. Available online: http://data.worldbank.org/country/united-arab-emirates (accessed on 30 April 2017).
  7. UAE Ministry of Environment and Water. State of Enviornment Report United Arab Emirates (English Version); UAE Ministry of Environment and Water: Dubai, UAE, 2015.
  8. Al-Ruzouq, R.; Shanableh, A.; Merabtene, T.; Siddique, M.; Khalil, M.A.; Idris, A.E.; Almulla, E. Potential groundwater zone mapping based on geo-hydrological considerations and multi-criteria spatial analysis: North UAE. Catena 2019, 173, 511–524. [Google Scholar] [CrossRef]
  9. Shanableh, A.; Al-Ruzouq, R.; Yilmaz, A.G.; Siddique, M.; Merabtene, T.; Imteaz, M.A. Effects of land cover change on urban floods and rainwater harvesting: A case study in Sharjah, UAE. Water 2018, 10, 631. [Google Scholar] [CrossRef]
  10. Rizk, Z.S.; Alsharhan, A.S. Water resources in the United Arab Emirates. Dev. Water Sci. 2003, 50, 245–264. [Google Scholar] [CrossRef]
  11. UAE The Cabinet. Mohammed Bin Rashid Launches Five-Decade Government Plan ‘UAE Centennial 2071’. Available online: https://uaecabinet.ae/en/details/news/mohammed-bin-rashid-launches-five-decade-government-plan-uae-centennial-2071 (accessed on 18 July 2019).
  12. UAE Government. UAE Vision 2021. Available online: http://www.vision2021.ae/en (accessed on 18 July 2019).
  13. Li, Z.; Li, W.; Ge, W. Weight analysis of influencing factors of dam break risk consequences. Nat. Hazards Earth Syst. Sci. 2018, 18, 3355–3362. [Google Scholar] [CrossRef] [Green Version]
  14. Wu, M.; Ge, W.; Li, Z.; Wu, Z.; Zhang, H.; Li, J.; Pan, Y. Improved set pair analysis and its application to environmental impact evaluation of dam break. Water 2019, 11, 821. [Google Scholar] [CrossRef]
  15. Ge, W.; Li, Z.; Liang, R.Y.; Li, W.; Cai, Y. Methodology for establishing risk criteria for dams in developing countries, case study of china. Water Resour. Manag. 2017, 31, 4063–4074. [Google Scholar] [CrossRef]
  16. Jozaghi, A.; Alizadeh, B.; Hatami, M.; Flood, I.; Khorrami, M.; Khodaei, N.; Ghasemi Tousi, E. A Comparative Study of the AHP and TOPSIS Techniques for Dam Site Selection Using GIS: A Case Study of Sistan and Baluchestan Province, Iran. Geosciences 2018, 8, 494. [Google Scholar] [CrossRef]
  17. Kumar, M.G.; Agarwal, A.K.; Bali, R. Delineation of potential sites for water harvesting structures using remote sensing and GIS. J. Indian Soc. Remote Sens. 2008, 36, 323–334. [Google Scholar] [CrossRef]
  18. Mohammed, A.; Pradhan, B.; Mahmood, Q. Dam site suitability assessment at the Greater Zab River in northern Iraq using remote sensing data and GIS. J. Hydrol. 2019, 574, 964–979. [Google Scholar] [CrossRef]
  19. Jamali, I.A.; Olofsson, B.; Mo, U. Locating suitable sites for the construction of subsurface dams using GIS. Environ. Earth Sci. 2013, 70, 2511–2525. [Google Scholar] [CrossRef]
  20. Tsiko, R.G.; Haile, T.S. Integrating geographical information systems, fuzzy logic and analytical hierarchy process in modelling optimum sites for locating water reservoirs. A case study of the debub district in Eritrea. Water 2011, 3, 254–290. [Google Scholar] [CrossRef]
  21. Charabi, Y.; Gastli, A. PV site suitability analysis using GIS-based spatial fuzzy multi-criteria evaluation. Renew. Energy 2011, 36, 2554–2561. [Google Scholar] [CrossRef]
  22. Sayl, K.N.; Muhammad, N.S. Estimation the physical variables of rainwater harvesting system using integrated GIS-based remote sensing approach. Water Resour. Manag. 2016, 30, 3299–3313. [Google Scholar] [CrossRef]
  23. Jamali, I.A.; Mörtberg, U.; Olofsson, B. A spatial multi-criteria analysis approach for locating suitable sites for construction of subsurface dams in Northern Pakistan. Water Resour. Manag. 2014, 28, 5157–5174. [Google Scholar] [CrossRef]
  24. Syst, E.; Attribution, C.C.; Weerasinghe, H. Water harvest-and storage-location assessment model using GIS and remote sensing. Hydrol. Earth Syst. Sci. Discuss. 2011, 8, 3353–3381. [Google Scholar] [CrossRef]
  25. Pandey, A.; Chowdary, V.M.; Mal, B.C.; Dabral, P.P. Remote sensing and GIS for identification of suitable sites for soil and water conservation structures. Land Degrad. Dev. 2011, 22, 359–372. [Google Scholar] [CrossRef]
  26. Darshdeep, J.P.S.; Litoria, S.P.K. Selection of Suitable Sites for Water Harvesting Structures in Soankhad Watershed, Punjab using Remote Sensing and Geographical Information System (RS & GIS) Approach—A Case Study. J. Indian Soc. Remote Sens. 2009, 37, 21–35. [Google Scholar]
  27. Das, S.; Paul, P.K. Selection of site for small hydel using GIS in the Himalayan region of India. J. Spat. Hydrol. 2006, 6, 18–28. [Google Scholar]
  28. Ratnam, K.N.; Rao, V.V.; Amminedu, E. Check dam positioning by prioritization of micro-watersheds using SYI model and morphometric analysis—Remote sensing and GIS perspective. J. Indian Soc. Remote Sens. 2005, 33, 25. [Google Scholar] [CrossRef]
  29. Baban, S.M.J.; Wan-yusof, K. Modelling optimum sites for locating reservoirs in tropical environments. Water Resour. Manag. 2003, 17, 1–17. [Google Scholar] [CrossRef]
  30. Sherif, M.; Chowdhury, R.K.; Shetty, A.V. Rainfall and Intensity-Duration-Frequency (IDF) Curves in the United Arab Emirates. In Proceedings of the World Environmental and Water Resources Congress, Portland, OR, USA, 1–5 June 2014; pp. 2316–2325. [Google Scholar]
  31. World Population Review Sharjah Population 2019. Available online: http://worldpopulationreview.com/world-cities/sharjah-population/ (accessed on 21 July 2019).
  32. Chen, J.; Yang, S.; Li, H.; Zhang, B.; Lv, J. Research on geographical environment unit division based on the method of natural breaks (Jenks). Int. Arch. Photogramm. Remote Sens. Spat. Inf. Sci. ISPRS Arch. 2013, 40, 47–50. [Google Scholar] [CrossRef]
  33. Setianto, A.; Triandini, T. Comparison of kriging and inverse distance weighted (IDW) interpolation methods in lineament extraction and analysis. J. Appl. Geol. 2013, 5. [Google Scholar] [CrossRef]
  34. Mura, J.C.; Gama, F.F.; Paradella, W.R.; Negrão, P.; Carneiro, S.; de Oliveira, C.G.; Brandão, W.S. Monitoring the vulnerability of the dam and dikes in Germano iron mining area after the collapse of the tailings dam of fundão (Mariana-MG, Brazil) using DInSAR techniques with terraSAR-X data. Remote Sens. 2018, 10, 1507. [Google Scholar] [CrossRef]
  35. Datta, P.S.; Bhattacharya, S.; Tyagia, S.K. 18O studies on recharge of phreatic aquifers and groundwater flow-paths of mixing in the Delhi area. J. Hydrol. 1996, 176, 25–36. [Google Scholar] [CrossRef]
  36. Al-Ruzouq, R.; Hamad, K.; Dabous, S.A.; Zeiada, W.; Khalil, M.A.; Voigt, T. Weighted multi-attribute framework to identify freeway incident hot spots in a spatiotemporal context. Arab. J. Sci. Eng. 2019, 1–19. [Google Scholar] [CrossRef]
  37. Li, H.; Ni, F.; Dong, Q.; Zhu, Y. Application of analytic hierarchy process in network level pavement maintenance decision-making. Int. J. Pavement Res. Technol. 2018, 11, 345–354. [Google Scholar] [CrossRef]
  38. Shi, S.J.; Shuo, L.X.; Cui, X.T. The Application of the Analytic Hierarchy Process (AHP) in Mine Geological Environment Evaluation. Appl. Mech. Mater. 2013, 416–417, 2020–2024. [Google Scholar] [CrossRef]
  39. Al-Ruzouq, R.; Shanableh, A.; Omar, M.; Al-Khayyat, G. Macro and micro geo-spatial environment consideration for landfill site selection in Sharjah, United Arab Emirates. Environ. Monit. Assess. 2018, 190, 147. [Google Scholar] [CrossRef]
  40. Naghibi, S.A.; Ahmadi, K. Application of support vector machine, random forest, and genetic algorithm optimized random forest models in groundwater potential mapping. Water Resour. Manag. 2017, 31, 2761–2775. [Google Scholar] [CrossRef]
  41. Kenda, K.; Matej, Č.; Bogataj, M.; Senožetnik, M.; Klemen, K.; Pergar, P.; Laspidou, C.; Mladeni, D. Groundwater Modeling with Machine Learning Techniques: Ljubljana polje Aquifer. Proceedings 2018, 2, 697. [Google Scholar] [CrossRef]
Figure 1. Study Area.
Water 11 01880 g001
Figure 2. Methodology Framework.
Water 11 01880 g002
Figure 3. Major thematic layers. (a) Precipitation; (b) Streams & Basins; (c) Drainage Stream Density; (d) Geomorphology; (e) Geology; (f) Curve Number; (g) Total Dissolved Solid (TDS); (h) Elevation; (i) Slope; (j) Major Fracture Euclidian Distance.
Water 11 01880 g003aWater 11 01880 g003bWater 11 01880 g003c
Figure 4. Thematic layer weighting using ML techniques.
Water 11 01880 g004
Figure 5. Dam site suitability map with dams and streams.
Water 11 01880 g005
Table 1. Review of recent dam site suitability studies.
ReferencesStudy AreaUtilized FactorsUtilized Technique
Noor et al. [18]Greater Zab river, Northern IraqRainfall, geology, soil type, fault line, tectonic line, altitude, slope, road network, LU/LC, material used for dam constructionanalytical hierarchal processes (AHP) and fuzzy logic
Sayl et al. [22]Western dessert of IraqWestern dessert of Iraqelevation area volume curve method
Jamali et al. [23]Northern PakistanNorthern Pakistananalytic hierarchy process (AHP) and the factor interaction method (FIM)
Jamali et al. [19]Boda-Kalvsvik, SwedenBoda-Kalvsvik, Swedenwater balance calculations and overlay analysis
Weerasinghe et al. [24]Sao-Francisco and Nile catchmentsSao-Francisco and Nile catchmentssoil conservation service curve number (SCS-CN) equation, compound weighted index (CWI) and multi criteria evaluation techniques
Pandey et al. [25]Karso, Hazaribagh, IndiaKarso, Hazaribagh, Indiaoverlay analysis (Integrated Mission for Sustainable Development (IMSD) guidelines)
Singh et al. [26]Soankhad watershed, Punjab, IndiaSoankhad watershed, Punjab, Indiaoverlay analysis (IMSD guidelines) and Water balance study
Kumar et al. [17]Bakhar watershed of Mirzapur District, Uttar Pradesh, IndiaBakhar watershed of Mirzapur District, Uttar Pradesh, Indiaweighted overlay analysis (IMSD and Indian National Committee of
Hydrology (INCOH))
Das et al. [27]Himalayan region, IndiaHimalayan region, Indiacalculation of available flow of water
Ratnam et al. [28]Yarafeni watershed in Midnapur district, West Bengal, IndiaYarafeni watershed in Midnapur district, West Bengal, Indiasediment yield index (SYI) and weighted overlay analysis
Baban et al. [29]Langkawi Island, MalaysiaLangkawi Island, Malaysiaweighted overlay analysis
LU/LC: Land use and land cover.
Table 2. Ranks and weights for thematic layers and their subclasses.
Thematic LayerThematic Layer WeightClassesRanks
Precipitation20%74.21–77.561
77.56–79.652
79.65–81.893
81.89–83.94
83.9–85.615
85.61–87.256
87.25–89.197
89.19–92.778
Drainage Stream Density20%0–0.141
0.14–0.233
0.23–0.325
0.32–0.427
0.42–0.589
Geomorphology15%Fan deposits9
High dunes7
Sand6
Low dunes5
Vegetation4
Mountains2
Urban1
Geology10%Alluvium9
Sand7
Limestone4
Opholitie3
Gabbro2
Metamorphic1
Curve Number10%Sand9
Faults7
Vegetation6
Gravel & Urban4
Sediment rocks3
Desert roads/Tracks2
Basements/Highways1
Total Dissolved Solids10%658.01–1090.589
1090.58–1479.197
1479.19–1846.675
1846.67–2203.113
2203.11–2530.261
Elevation5%0–559
55–1097
109–1575
157–2033
203–4131
Slope5%0–2.699
2.69–5.027
5.02–8.605
8.60–18.053
18.05–57.151
Major Fracture Euclidean Distance5%684–14,797.189
14,797.18–24,897.987
24,897.98–36,770.965
36,770.96–50,100.383
50,100.38–67,522.271
Table 3. Pairwise Comparison Matrix.
PrecipitationDrainageGeomorphologyGeologyCurve NumberTDSElevationSlopeMFED
Precipitation1.0001.0001.3332.0002.0002.0004.0004.0004.000
Drainage1.0001.0001.3332.0002.0002.0004.0004.0004.000
Geomorphology0.7500.7501.0001.5001.5001.5003.0003.0003.000
Geology0.5000.5000.6671.0001.0001.0002.0002.0002.000
Curve Number0.5000.5000.6671.0001.0001.0002.0002.0002.000
TDS0.5000.5000.6671.0001.0001.0002.0002.0002.000
Elevation0.2500.2500.3330.5000.5000.5001.0001.0001.000
Slope0.2500.2500.3330.5000.5000.5001.0001.0001.000
Major Fracture ED *0.2500.2500.3330.5000.5000.5001.0001.0001.000
* ED: Euclidean Distance.
Table 4. Overall accuracy of attempted machine learning (ML) models.
ML ModelAccuracyStandard Deviation
Random Forest76.5±2.4%
Gradient Boosted Trees76±0.8%
Support Vector Machine72.7±1.3%
Table 5. Confusion matrix of the random forest (RF) model.
True “High”True “Medium”True “Low”Class Prediction
Predicted “High”10330276.30%
Predicted “Medium”232053877.07%
Predicted “Low”33311375.84%
Class Prediction79.84%76.49%73.86%
Table 6. Revised parameters weighting of the thematic layers.
FactorFinal Weight
Precipitation18
Drainage18
Geomorphology13
Geology10
Curve Number12
TDS11
Elevation9
Slope0
Major Fracture Euclidean Distance9
Table 7. Dam storage capacity for accuracy assessment.
IDDam NameEmirateTypeHeight (m)Length (m)Volume (mcm)Construction Year
0Shwaib DamAbu DhabiConcrete11300031NA
1Fili 2 DamSharjahEarth Rockfill2.512610.1252002
2Fili 1 DamSharjahEarth Rockfill2.515360.252002
3Buraq DamRas Al-KhaimahEarth Rockfill93260.52001
4Nasas DamSharjahEarth Rockfill102840.432002
5Modenah DamRas Al-KhaimahEarth Rockfill9.63000.4382002
6Al Layat DamRas Al-KhaimahEarth Rockfill5500.0582001
7Shokah DamRas Al-KhaimahConcrete131070.2752001
8Qoshesh DamRas Al-KhaimahEarth Rockfill122000.42002
9Qasaa DamRas Al-KhaimahEarth Rockfill10.549012002
10KhoderahSharjahEarth Rockfill610640.2762013
11Falajalm’ala DamUmm Al-QuwainEarth Rockfill66750.0682013

