Sulfamethoxazole and Trimethoprim Degradation by Fenton and Fenton-Like Processes
by
 , ,
, ,
Antover Panazzolo Sarmento
1 ,
,
Alisson Carraro Borges
2,*,
Antonio Teixeira de Matos
3 and
Lincoln Lucílio Romualdo
4 1
Faculty of Engineering, Federal University of Catalão (UFCAT), Catalão-GO 75.704-020, Brazil
2
Department of Agricultural Engineering, Federal University of Viçosa (UFV), Viçosa-MG 36.570-900, Brazil
3
Department of Sanitary and Environmental Engineering, Federal University of Minas Gerais (UFMG), Belo Horizonte-MG 31.270-901, Brazil
4
Institute of Chemistry, Federal University of Catalão (UFCAT), Catalão-GO 75.704-020, Brazil
*
Author to whom correspondence should be addressed.
Water 2020, 12(6), 1655; https://0-doi-org.brum.beds.ac.uk/10.3390/w12061655
Submission received: 13 May 2020
/
Revised: 1 June 2020
/
Accepted: 6 June 2020
/
Published: 9 June 2020
(This article belongs to the Special Issue Wastewater Engineering and Environmental Catalysis)
Abstract
:In this work, the degradation of sulfamethoxazole (SMX) and trimethoprim (TMP) via Fenton and Fenton-like processes was evaluated using Mn2+ as supporting catalyst in the Fenton reaction. The optimum conditions of degradation were also evaluated. Besides that, the effect of independent factors pH, [H2O2], [Fe2+], [Mn2+] and reaction time (t) on the efficiency of the SMX and TMP degradation were assessed. Box–Behnken was the experimental design adopted, delineating the relative concentration (C/Co) of antibiotics after treatments as response variable. The inferences were conducted using variance analysis, Pareto chart, response surface methodology, and desirability function. Due to the lack of adjustment of the SMX degradation model, there are no more inferences about it. The significant variables (p ≤ 0.05) on TMP degradation were: reaction time quadratic and linear effect, [Fe2+] linear effect, [Mn2+] linear effect, interaction pH vs. [Mn2+]. The Mn2+ addition aided TMP degradation in environments with lower pH values. However, the addition may harm the efficiency of the antibiotic degradation at higher pH. The optimum condition for TMP degradation in the conventional process (without the addition of Mn2+) is: pH 5, [H2O2] equal to 4.41 mmol L−1, [Fe2+] equal to 0.81 mmol L−1 and 90 min reaction time.
1. Introduction
Advances of technology and scientific knowledge aim at the improvement of life quality for people. Medicines have been highlighted in the health area, in particular antibiotics. A relevant matter to be raised in relation to the excessive use of antibiotics is environmental contamination. After their ingestion by human beings, the natural elimination of part of the quantity that has been administered occurs, releasing in sewages high contaminant loads of antibiotics, with consequent contamination of water courses, fauna. and flora [1,2].
Pharmaceutical products are discarded into the environment in both original and metabolized form. Several papers report the presence of these micropollutants in sanitary, industrial, and hospital sewage, leachate from landfills, superficial waters, marine environments and sediments [3,4,5]. Some researches, conducted in many countries in the world, have reported the detection in the aquatic environment of more than 80 emergent pollutants, such as medicines, products of veterinary use, hygiene products, agrichemicals, and endocrine disruptors, from synthetic or natural origin, and even some uncommon microorganisms in the studied regions [6,7,8,9].
Emergent micropollutants present in sanitary sewages exert toxic effects, such as endocrine deregulation, having the potential to affect human health even in concentrations in the order of micrograms or nanograms per liter. Based on evidence observed in studies involving several species of living beings, it is believed that these micropollutants may cause alterations in human health, affecting the reproductive system as infertility, in breast cancer, and testicle cancer [10].
Studies in this area suggest the possible applications of Advanced Oxidation Processes (AOPs) in the treatment of water and wastewater containing a wide range of micro and biopollutants [11,12]. Several experiments have been performed using AOPs for antibiotic degradation [13,14]. Research for improving the operating conditions of the Fenton process has evaluated the use of auxiliary catalysts (Co2+, Cu2+, Mn2+, Mn4+, Zn2+ and other transition metals), mainly for the Fenton-like reaction, having observed the influence of these catalysts in other oxidation processes [15,16,17,18,19,20].
The Fenton process (Fe2+/H2O2—Equations (1) and (2) [21,22]), proposed by Henry Fenton [23], is one of the systems which stands out in terms of oxidations of organic compounds in an aqueous environment and has been extensively studied over recent years in degradation processes of different contaminants [24,25,26]. Mn2+ catalyst chosen to carry out this study, can participate in the Fenton reaction catalysis as shown in Equations (3) and (4) [27,28].
Fe2+ + H2O2 → Fe3+ + ∙OH + HO−,
Fe3+ + H2O2 → Fe2+ + ∙O2H + H+,
Mn2+ + H2O2 → Mn3+ + ∙OH + OH−,
Mn3+ + H2O2 → Mn2+ + ∙O2H + H+
Experimental designs and response surfaces have been used to optimize experiments. The Box–Behnken Design (BBD) is a good alternative for central composition experiments, especially in cases when building the response surface, only the use of factors with three levels (−1—low, 0—medium and +1—high) are necessary [29,30]. Besides that, the BBD has enough information to perform the lack of fit test [31] and it is more efficient than central composite design [32].
Despite studies regarding the degradation of these substances having been reported, some gaps remain, such as the behavior of different catalysts, different pH conditions, the interaction between these conditions and ways to simplify the process and guarantee efficiency. Here, we performed a multivariate study (Box–Behnken), analyzing five factors, namely pH, [H2O2], [Fe2+], [Mn2+], and reaction time (t) on the efficiency of the sulfamethoxazole and trimethoprim degradation using the Fenton-like process.
2. Materials and Methods
2.1. Reagents and Solutions
The medicine used in this paper was Bactrim (Roche®, Rio de Janeiro, Brazil), in the form of tablets, of which the composition of each tablet is 800 mg of SMX and 160 mg of TMP. The tablets were macerated, triturated, and dissolved directly in solution. The solutions for degradation were prepared to have an initial concentration of 20 mg L−1 of SMX and 4 mg L−1 of TMP.
2.2. Calibration Curve and Determination of SMX and TMP Concentration
Seven standard solutions were prepared with concentrations of the mixture of antibiotics SMX and TMP equal to 0.05; 0.1; 0.2; 0.4; 0.8; 1.6, and 3.2 mg L−1 each. After the preparation, 40 μL from each standard solution was injected into a chromatographic apparatus and analyzed. The analyses were conducted with high-performance liquid chromatography (HPLC) equipment from Shimadzu brand (pump LC-20 AT). The flow used was 1.0 mL min−1 and wavelengths of 254 nm and 265 nm. A column C-18 (Luna®, 10 mm, 0.012 µm, Phenomenex, Torrance, CA, USA) was used [33]: 40 μL of each aliquot previously diluted were injected. As mobile phase, phosphate buffer KH2PO4 was used at concentration of 0.01 mol L−1 (pH = 5) and methanol, in the ratios 75:25 (v:v), respectively. Calibration curves were constructed considering the area of peaks as function of the nominal concentrations of each standard solution.
2.3. Experimental Procedure
The dependent variable was the pollutants relative concentration (C/Co), the independent variables evaluated being as follows: the initial solution pH, the effect of dosage of the H2O2, the catalysts Fe2+ (using heptahydrated ferrous sulphate, Fe2SO4·7H2O) and Mn2+ (using monohydrated manganese sulphate, MnSO4·H2O), and the reaction time.
The direct response was the determination of the pollutant concentration after the conduction of the experimental treatment, which was converted to relative concentration and removal efficiency, thus enabling inferences of the effect of all independent variables to be made.
In order to analyze the effect of the independent variables tested, the Box–Behnken design was used, which is a rotational design in which three levels are worked for each factor used and there is no vertex point [34].
The experimental design consisted of 4 factorial points per block, 10 blocks with variation of two factors each, and 6 central points [35]. The low and high levels of the independent factors, selected after a literature review and previous researches [36,37], were: 3 and 5, for pH (X1), 2.65 and 6.17 mmol L−1 for [H2O2] (X2), 0 and 1.61 mmol L−1 for [Fe2+] (X3), 0 and 1.64 mmol L−1 for [Mn2+] (X4), and 30 and 90 min for t (reaction time, X5), according to Table 1.
All the experimental stages were conducted randomly in the environment condition (). After dilutions of the solutions prepared at the initial concentrations had been carried out, the pH of the runs was monitored and, after the proper dosages had been made, the runs were subjected to the mentioned reaction times, under 100 rpm of agitation in a Jartest [38,39,40,41]. At the end of the experiment, sodium sulfite was added in a stoichiometric ratio of 1.1:1 (3.71 × 1.1 = 4.08 g of Na2SO3 per g of H2O2) and reacted further for 5 more minutes to completely stop the Fenton reaction [42]. After that, the samples were filtered with a membrane of 0.45 μm, collecting aliquots that were diluted with water at a ratio of 1:5, and then injected in the HPLC machine with an ultraviolet detector, in order to quantify the run concentration.
Response surfaces and degradation models of the constituents were created considering the significance level established of 5% (p ≤ 0.05). The estimate of the values from the regression coefficients was obtained by the method of minimum squares, its significance being evaluated by test t. The polynomial model of regression of second order (Equation (5)) was obtained, containing 5 linear terms, 5 quadratic terms, and 10 terms of interaction.
where Y is the response (C/C0); b0 is the intercept; Xi are the Factors and bi; bii; bij representing the coefficients of regression estimated.
3. Results and Discussion
Table 2 shows efficiency values of degradation and relative concentration (C/C0) alongside the respective treatments suggested in the experimental design, using Fe2SO4·7H2O (Fe2+) as iron source and MnSO4·H2O (Mn2+) as manganese source. In this table, run—corresponds to the experiment number; pH, [H2O2], [Fe2+], [Mn2+], e t (reaction time)—are the values that were used for each experiment for each variable as explained in Table 1; Efficiency—is the value in percentage of the degradation efficiency for each experiment; C/C0—is the relative concentration after degradation of each experiment. The best experimental run is highlighted.
After Table 2, the statistical analysis for each antibiotic is presented (first TMP and then SMX). To make statistical inferences about the experiments, analysis of variance was performed. Analysis of variance is used to verify if a regression model is significant and if the lack of fit is non-significant. For an antibiotic that has a regression model considered to be predictive, the regression coefficients are presented and later discussions held. For antibiotics that have not been able to generate a predictive model, only possible discussions are held based on a brief descriptive analysis.
Table 3 shows the analysis of variance, where the complete model of regression from the relative concentration of TMP was significant and the lack of fit was not, the model tested being considered predictive. The coefficient of determination from model (R2) showed that 80.41% of the response variation was explained by the estimated regression equation.
After verifying that the complete model tested (Equation (5)) is considered predictive, the regression analysis was continued to find the coefficients of the variables. Table 4 shows the summary of the coefficients of regression from the polynomial equation of second order adjusted for the equations for TMP degradation, jointly with the results of significance from the linear and quadratic terms and the interactions from the terms of the model.
Table 5 shows the analysis of variance, verifying that the complete model of regression from the relative concentration of SMX was significant. However, the lack of fit was significant. Despite the coefficient of determination from the model (R2) shows that 89.17% of the response variation was explained by the function estimated, due to the significance of the lack of fit, it is inappropriate to make inferences regarding the experimental behavior of SMX degradation.
3.1. Degradation of TMP by the Fenton-Like Process
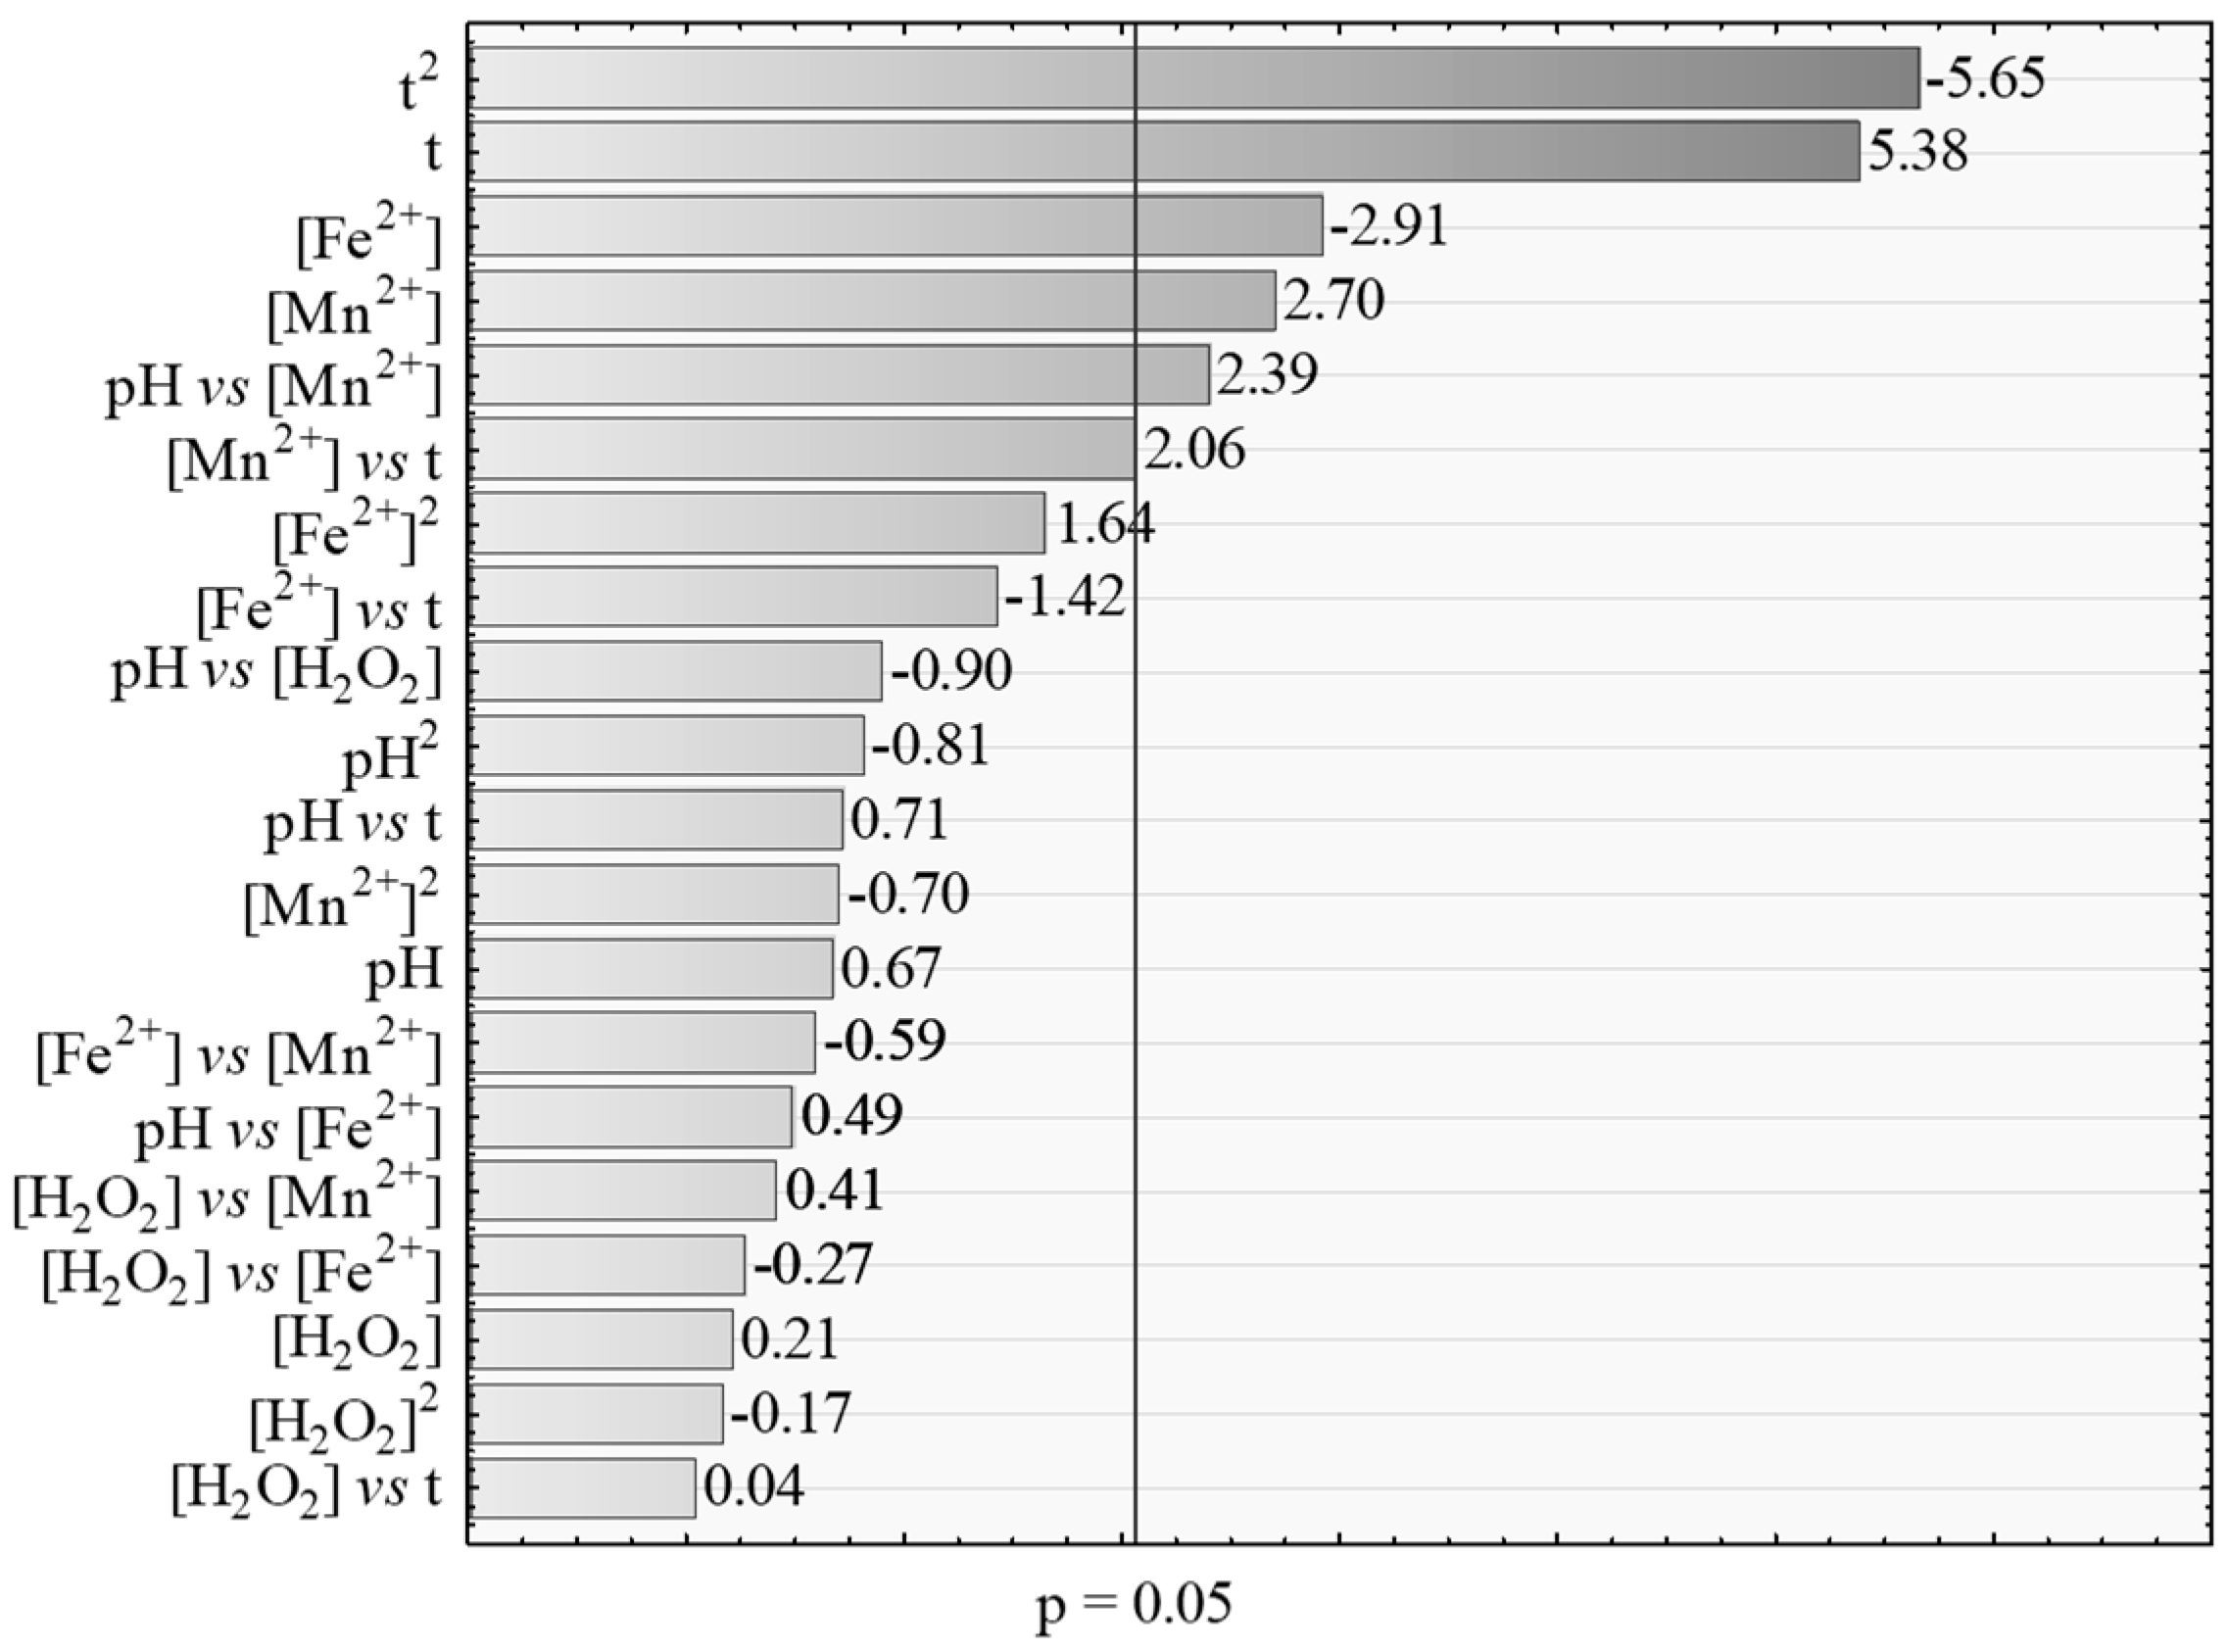
To facilitate the visualization of the variables which had a significant effect on the TMP degradation, the Pareto chart may be visualized in Figure 1, where the investigated effects are shown. Those which exceeded the red line are significant, while the ones that did not exceed the line are insignificant and do not influence the TMP degradation by the Fenton-like process.
According to the observation of the Pareto Graph (Figure 1), regarding the experimental design (Box–Behnken) used on this experiment to analyze the TMP degradation, it was found that the variables which had higher efficiency (significant effect) were the t (reaction time) quadratic and linear effect, [Fe2+] linear effect, [Mn2+] linear effect, and the interaction pH vs. [Mn2+].
The reaction time showed a linear effect: the longer the reaction time, the lower the efficiency. However, there is also a negative quadratic effect, which indicates that when the reaction time is increased to a certain point (from 30 to 60 min), the efficiency is decreased, and from this point (60 to 90 min) the efficiency is increased. It is believed that this fact occurred because at the very beginning of the reaction, the process degrades the original micropollutant. however, as the time passes, the formation of intermediate compounds may be occurring, which interfere with the reading of the micropollutant concentration. Nevertheless, at longer reaction times, the Fenton process continues to degrade these intermediate products with an increase of the system’s efficiency. Hasan et al. [43] verified that the maximum efficiency is 88.4% on phenol degradation by the Fenton process occurring in 20 min, the efficiency being decrescent with the increase of the reaction time. This achieved 66% in 100 min and 41.8% in 180 min. A similar fact was also reported by Marinho [44], when using the Fenton process for the degradation of estrogen. The author obtained ≅40% of degradation efficiency at 10 min, however, at 15 min of reaction, the efficiency decreased to ≅20%, returning to increase after 30 min of reaction, reaching ≅60% of efficiency at 60 min.
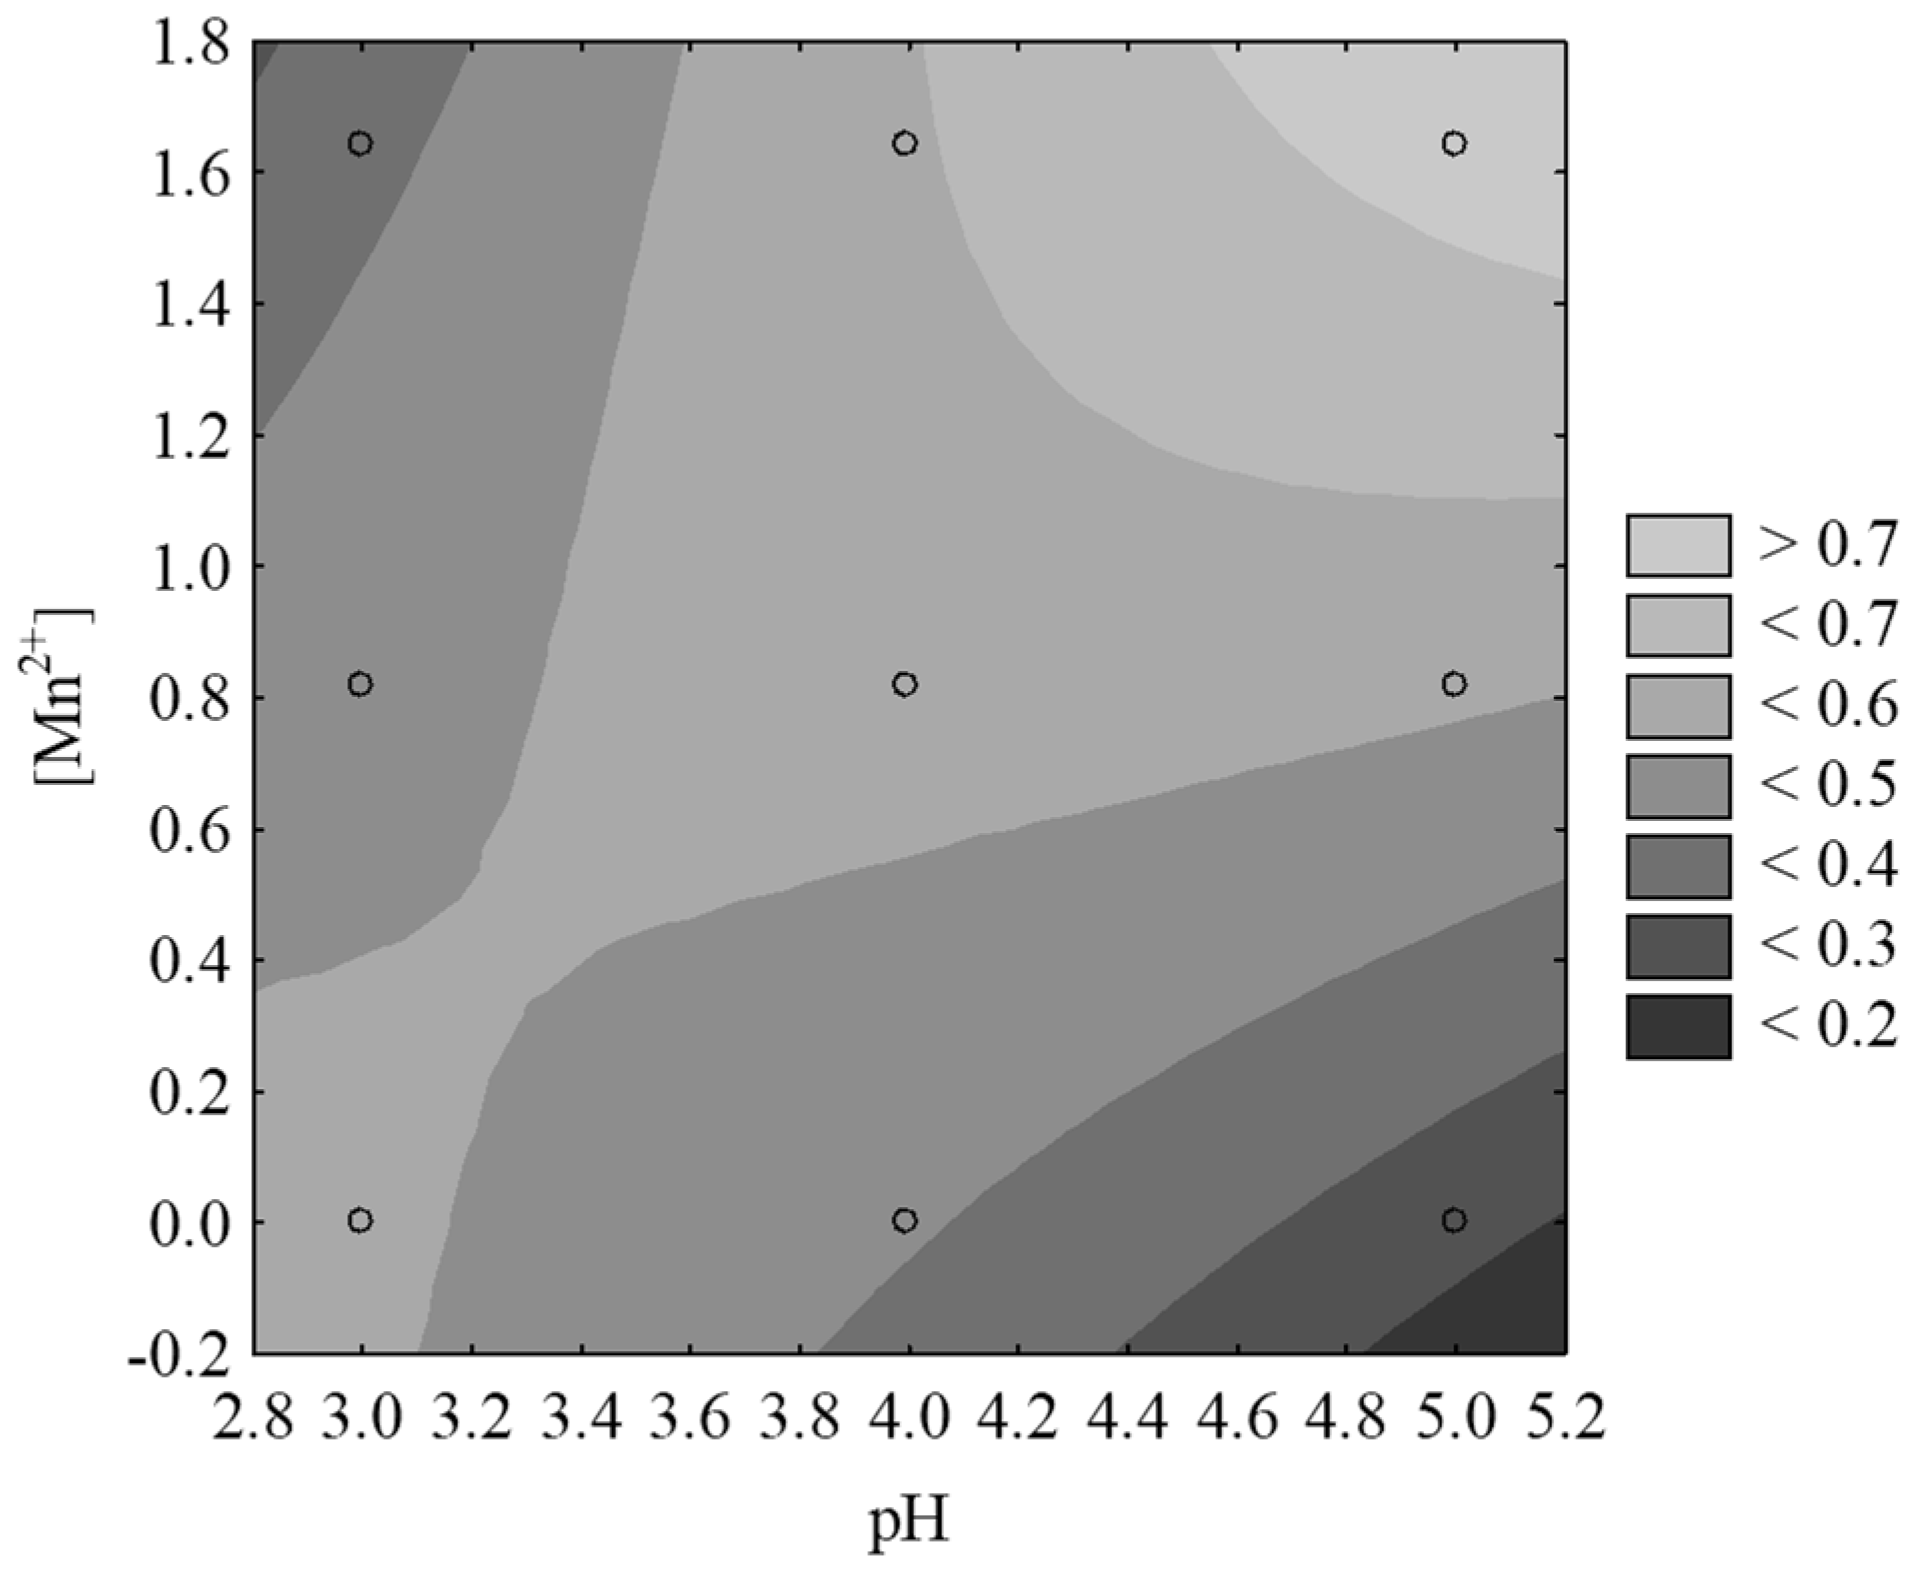
The graph of the contours of the TMP relative concentration (C/C0) under the effect of the independent variables which had significant effects is displayed in Figure 2.
The [Fe2+] had a significant effect on the TMP degradation, according to Figure 1. On increasing the [Fe2+], the degradation efficiency of the Fenton process also increases, however the [Fe2+] tended to have a positive quadratic effect. It may be stated that, if the [Fe2+] keeps increasing from a certain concentration, there will be a decrease on the process efficiency. The excess of Fe2+ ions may become harmful to the process efficiency, because they may generate competition with hydroxyl radicals and the organic compound degrading, decreasing, therefore, the degradation efficiency, according to that also reported by Wu et al. [45]. Huang et al. [27] observed a similar effect (quadratic) when they evaluated other transition metals as Mn2+.
The pH 3, 4, and 5 were tested in this experiment, obtaining good efficiencies for all of them. However, it is not possible to make further inferences regarding these results considering only the effect of pH, since this variable alone did not present a significant effect (Figure 1). There was significant interaction between the independent variables pH and [Mn2+] (Figure 1 and Figure 2), interaction of inverse relation, considering that the higher efficiencies expected for this interaction are obtained in the absence of Mn2+ and pH 5. An interesting observation is that if the substrate is more acidic (pH 3), to increase the efficiency of TMP degradation it is estimated (Figure 2) that the addition of Mn2+ would be beneficial. In other words, the lower the pH, the higher the concentration of Mn2+ must be to obtain better efficiencies of degradation. This observation is according to the reports from Nidheesh and Gandhimathi [20]. They tested, in the degradation of Rhodamine B, several transition metals (Fe0, Fe2+, Fe3+, Cu2+ e Mn2+) on the electro-Fenton process and observed that both Cu2+ and Mn2+ provided better degradation efficiencies if the initial pH of the reaction was more acidic—the highest efficiency (73.59%) was obtained with pH 2.5.
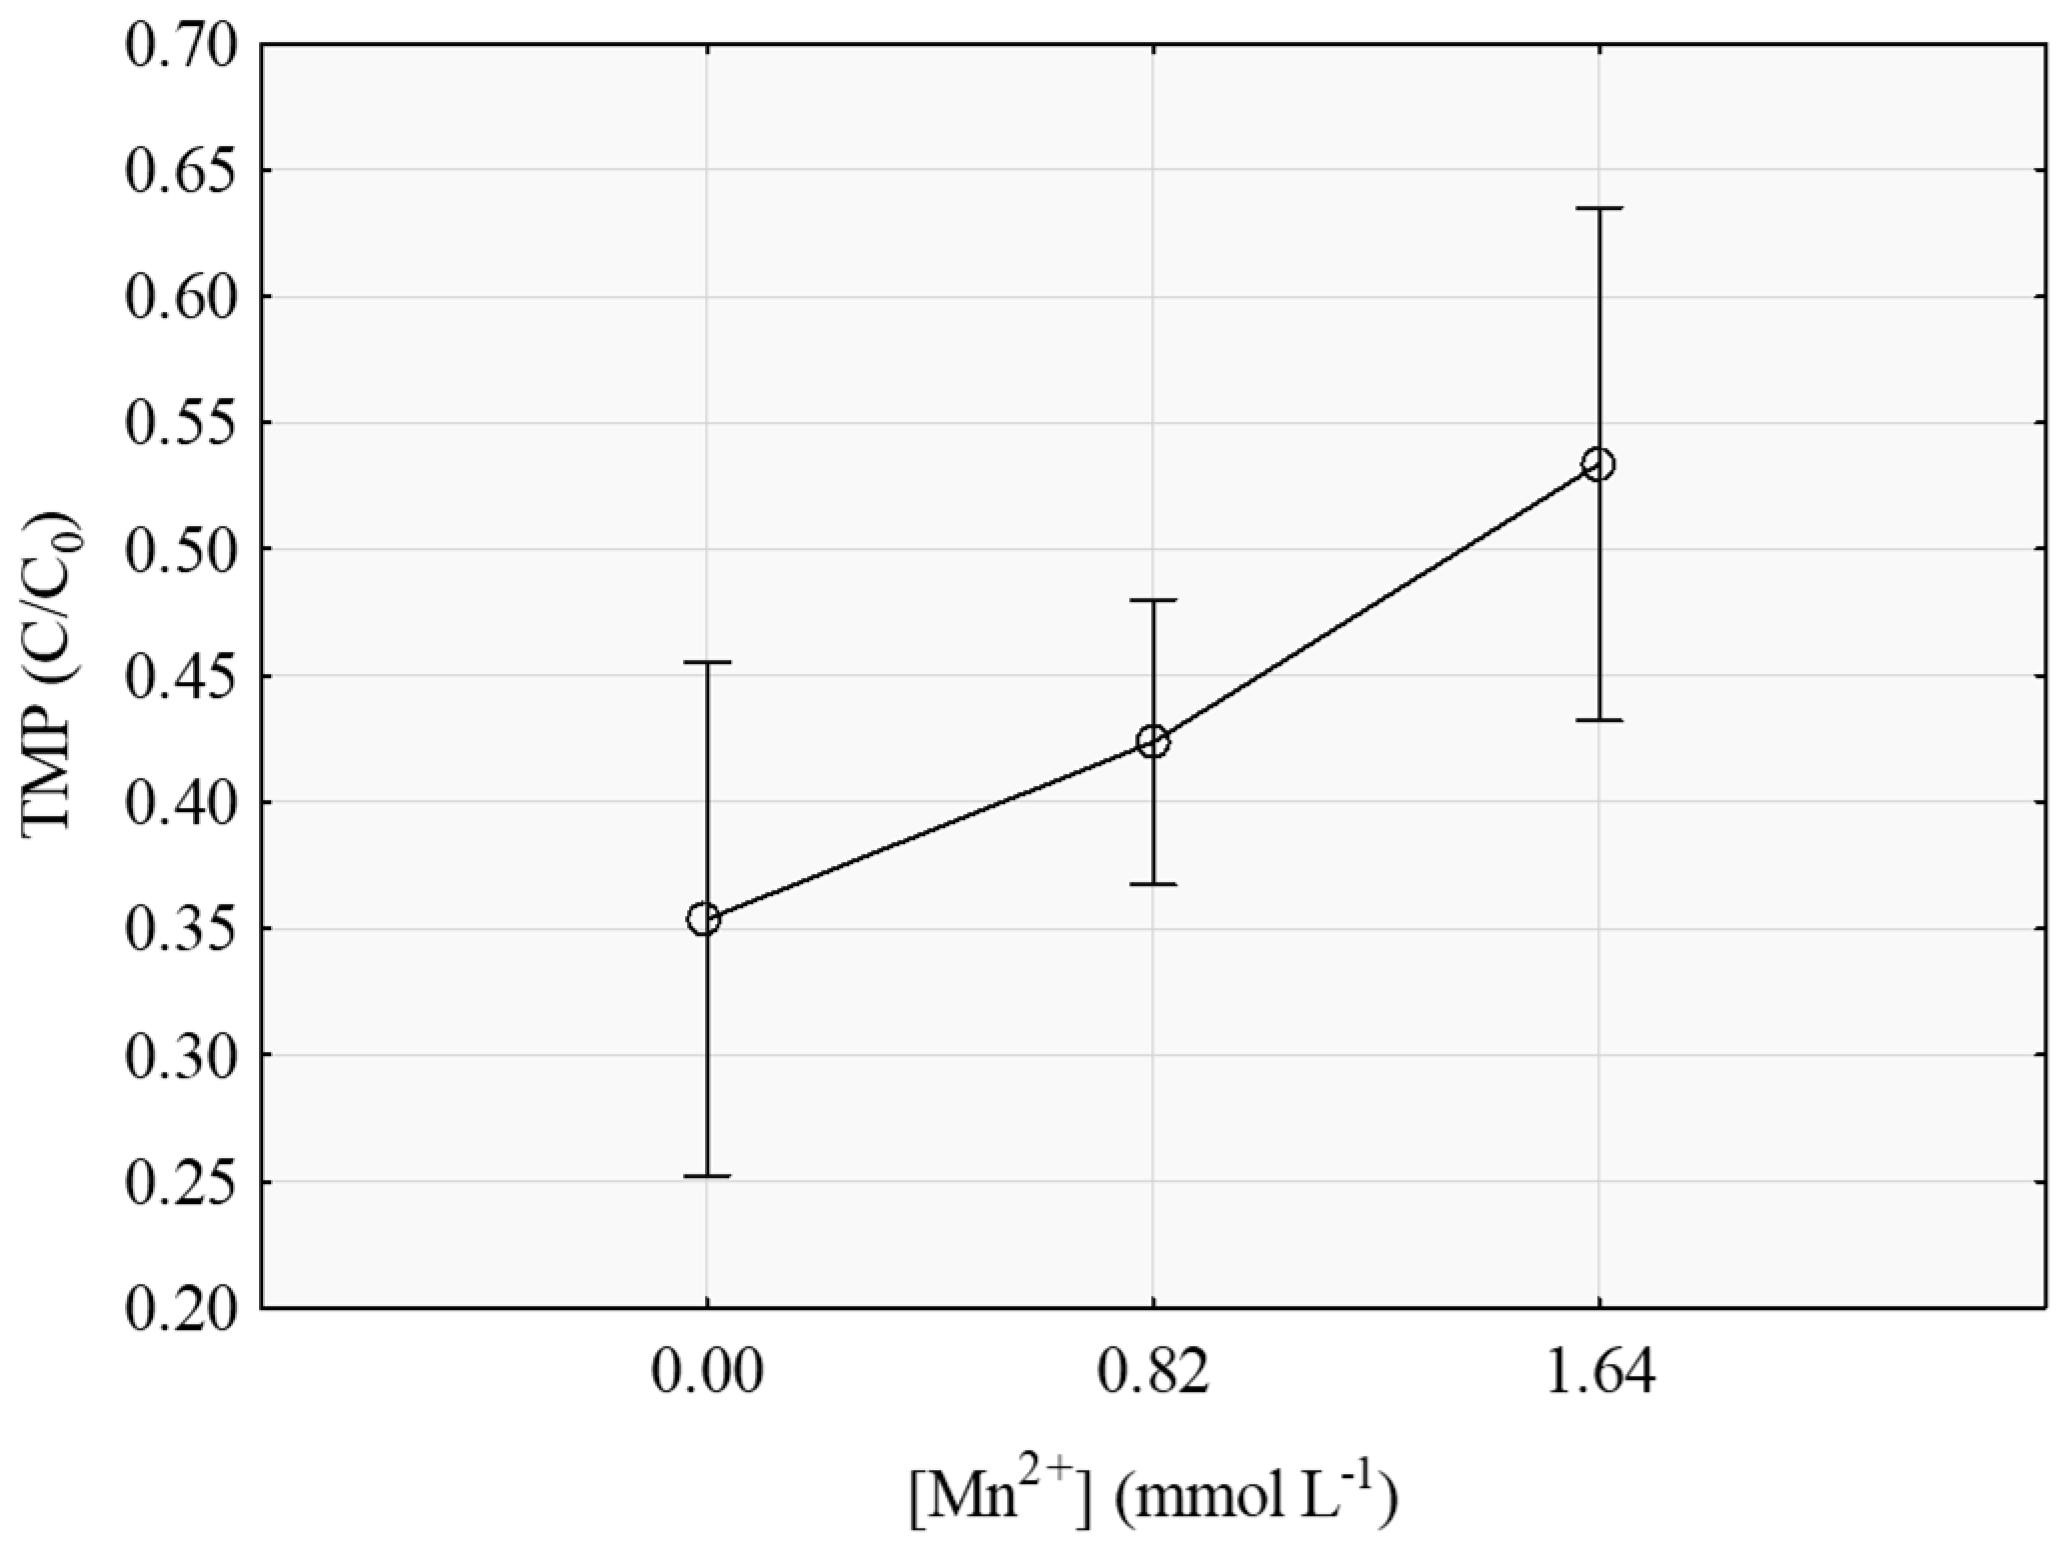
Balci et al. [46], with their experiments of glyphosate degradation by the modified electro-Fenton process, on testing Ag+, Cu2+ and Mn2+ as catalysts, observed that the Mn2+ was clearly a better catalyst than the other ones. In this paper, on TMP degradation, according to that observed in Figure 1, the utilization of a transition metal as Mn2+ as catalyst for the Fenton-like process (in the form of MnSO4·H2O), was not a good alternative. This was verified by the significant linear effect that it had on the TMP degradation. To corroborate this affirmation, in Figure 3 the global average of the relative concentration in all runs tested is displayed, for the three levels of the factor [Mn2+].
It has been observed, in similar papers (modified Fenton and modified photo-Fenton), that better efficiencies are obtained with the utilization of Mn2+. Huang et al. [27], for instance, compared the degradation of 2,4-D on the photo-Fenton and modified photo-Fenton process and reported that up to a time of 90 min of reaction, the conventional photo-Fenton process provided higher efficiencies (60%). However, after 90 min, it maintained this range of efficiency and the modified photo-Fenton process in approximately 180 min reached efficiencies of around 100%.
3.2. Degradation of SMX by the Fenton-Like Process
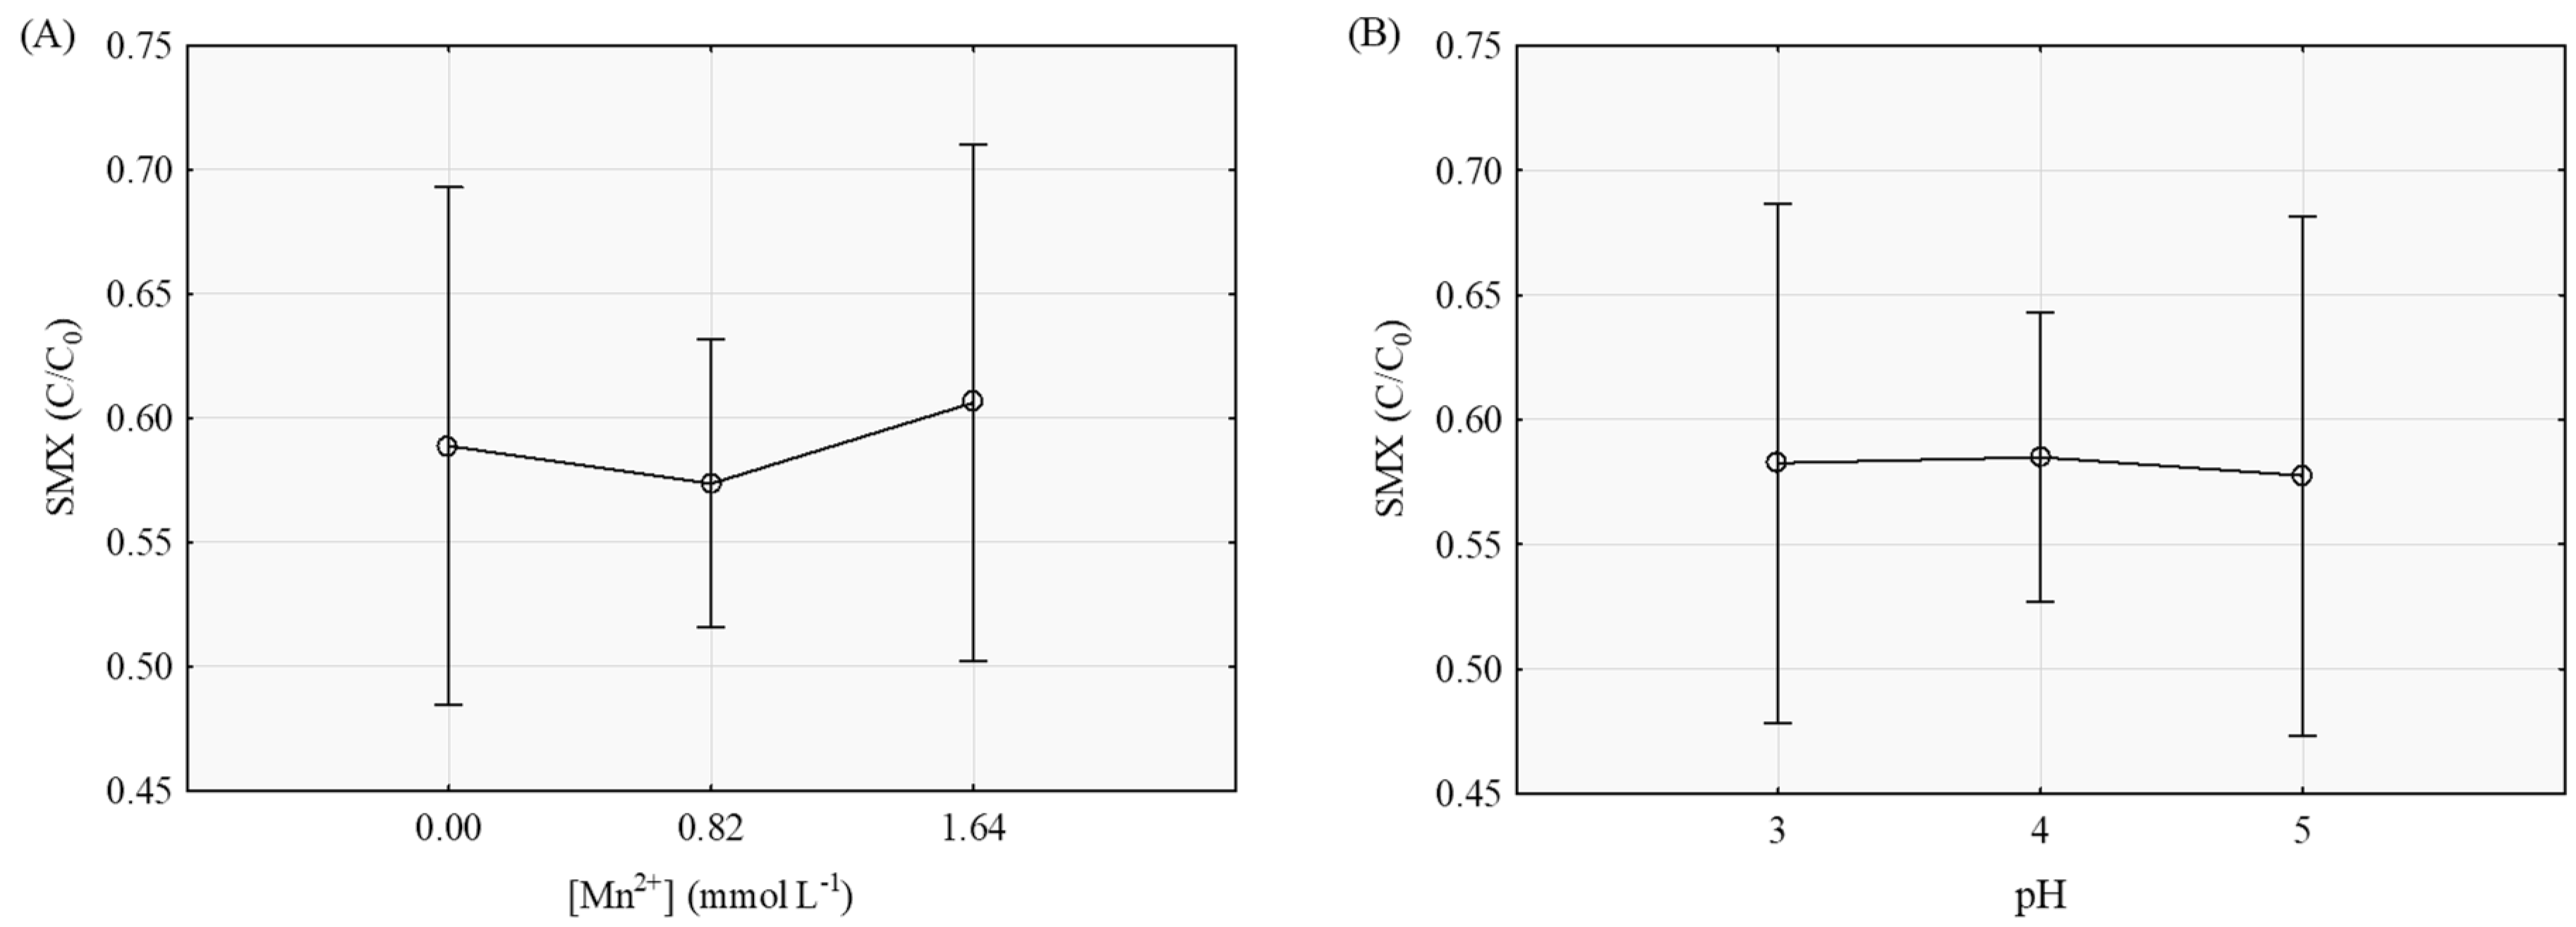
The variables with no significance were excluded from the regression model. Many combinations were tested, however a model in which the lack of fit would not be significant was not obtained. Therefore, it was opted to not perform inferences regarding the prediction of the model. On the results obtained, it may be observed, in a global way, that the Mn2+ did not contribute to the Fenton-like process in obtaining better efficiencies (Figure 4a) and the pH did not influence the efficiency (Figure 4b).
The global average degradation of the SMX was 39.82%, with standard deviation of 26.18%, being the minimum and maximum degradations obtained, respectively, 10.12 and 98.46%.
3.3. Optimization of the Fenton-Like Process
Based on the results obtained in this experiment, it was verified that the addition of Mn2+ on the Fenton process, transforming it into denominated Fenton-like, did not provide an increase of the degradation efficiency of the antibiotics analyzed. This fact may be verified by the linear effect, the greater the [Mn2+], the lower the efficiency of the process degradation.
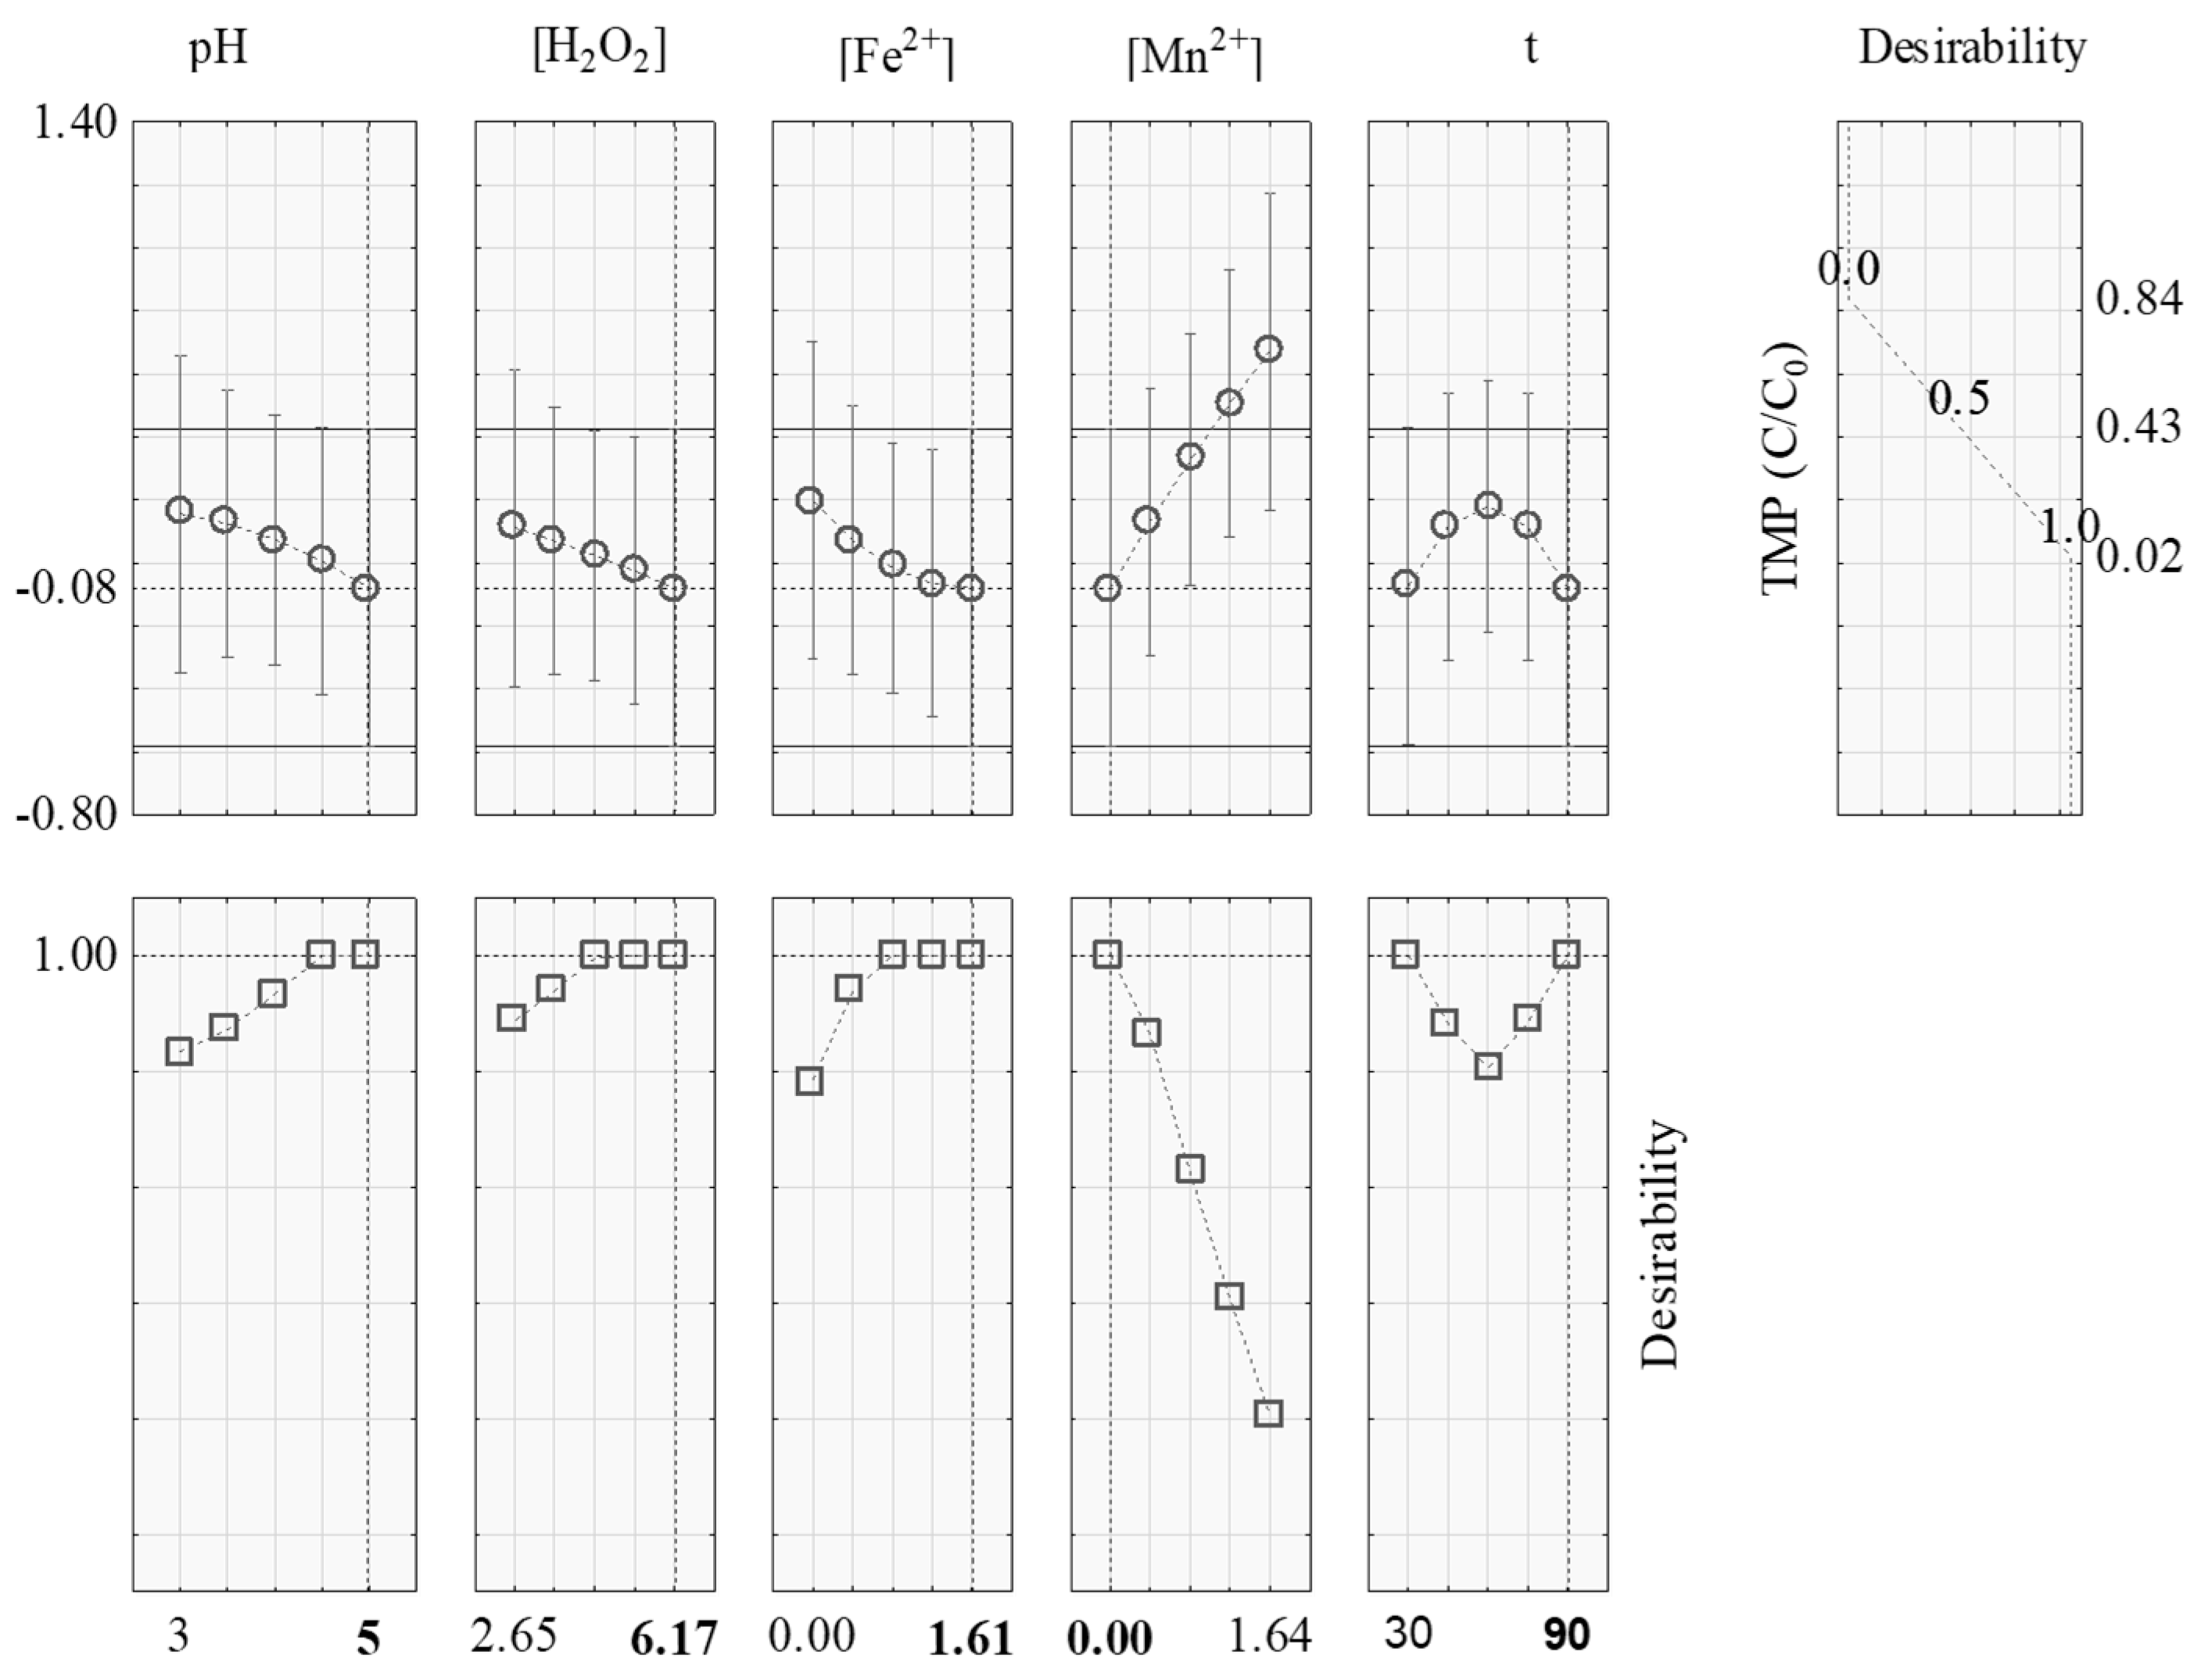
The regression model of TMP degradation was considered significant and demonstrated a non-significant lack of fit (Table 3). Thus, it enabled the analysis of the optimal conditions for the tested variables. Through the utilization of the desirability function, it is possible to verify the optimal conditions for each studied variable, as shown in Figure 5.
In Figure 5, it may be seen that for [Fe2+] and time, there is more than one value for the maximum condition of desirability. Therefore, the best efficiencies on TMP degradation are obtained below pH 5, [H2O2] between 4.41 and 6.17 mmol L−1, [Fe2+] between 0.81 and 1.61 mmol L−1, [Mn2+] at 0.00 mmol L−1 and t of 30 and, or, 90 min.
Ben et al. [47], studying the conventional Fenton process for the degradation of sulfonamides in effluents with pH of ≅8.5, testing pH of 3, 5 and 8.8, concluded that it was not be necessary to acidify the pH to 3, as they obtained high efficiencies even at pH 5.
The most economical condition would be the pH 5, condition which would not require the necessity to acidify the effluent, giving lower expenses without acidification; [H2O2], [Fe2+] and [Mn2+], respectively at 4.41, 0.81, and 0.00 mmol L−1, for lower expense of inputs; and t of 30 min, for the shorter time of process. Despite the visualization of a t of 30 min in this experiment being optimum for the desirability, it would be more prudent to use t of 90 min (Figure 5), bearing in mind that, on pollutant degradation, as time passes, the formation of intermediate products may occur that demand longer reaction time.
4. Conclusions
The addition of Mn2+ in the Fenton process, transforming it into a denominated Fenton-like process, did not provide an increase in the degradation efficiency of the antibiotics analyzed. It was found that only at more acidic conditions (pH 3) did the presence of Mn2+ allow degradation of the antibiotic.
The variables that influenced directly the efficiency of the TMP degradation by the Fenton-like process, presented with significant effect in influence order: t quadratic and linear effect, [Fe2+] linear effect, [Mn2+] linear effect, and interaction between pH vs. [Mn2+]. The conventional Fenton process, using Fe2+-Fe2SO4.7H2O, was shown to be a viable alternative for the degradation of TMP.
Excellent results were obtained at optimized conditions from the environmental point of view. The decrease of the TMP concentrations confirmed that antibiotics are virtually mineralized after only 90 min of process. The optimum conditions expected for the operation of the Fenton process for the degradation of TMP are pH 5, [H2O2] = 4.41 mmol L−1, [Fe2+] = 0.81 mmol L−1, [Mn2+] = 0.00 mmol L−1 and t = 90 min.
The degradation of SMX by the Fenton-like process reached values higher than 90%.
Author Contributions
A.P.S., A.C.B., A.T.d.M., and L.L.R. conceived the idea of the paper, A.P.S. designed and performed the experiment with L.L.R. helping. A.P.S. wrote the manuscript and all authors contributed to improving the paper. All authors have read and agreed to the published version of the manuscript.
Funding
This research was funded by the Foundation for Research Support of the State of Goiás (FAPEG Grant 201210267001185) and the Coordination for the Improvement of Higher Education Personnel (CAPES Finance Code 01).
Acknowledgments
To FAPEG and CAPES for funding this research project, the Federal University of Goiás for the institutional doctorate scholarship of the first author, the Engineer Marta C. S. Carvalho, the Chemists Rafaela S. Santos and Kamila P. de Amorim for the support during the experimental stage.
Conflicts of Interest
The authors declare no conflict of interest.
References
- Yahyaoui, G.; Hendi, R.; Mahmoud, M. Prevalence of resistant Escherichia coli strain isolated from community acquired urinary infection in university hospital HASSAN II of Fez, Morocco. Saudi J. Pathol. Microbiol. 2017, 2, 1–6. [Google Scholar]
- Zhang, R.; Zhang, R.; Li, J.; Cheng, Z.; Luo, C.; Wang, Y.; Yu, K.; Zhang, G. Occurrence and distribution of antibiotics in multiple environmental media of the East River (Dongjiang) catchment, South China. Environ. Sci. Pollut. Res. 2017, 24, 9690–9701. [Google Scholar] [CrossRef] [PubMed]
- Pal, A.; Gin, K.Y.-H.; Lin, A.Y.-C.; Reinhard, M. Impacts of emerging organic contaminants on freshwater resources: Review of recent occurrences, sources, fate and effects. Sci. Total. Environ. 2010, 408, 6062–6069. [Google Scholar] [CrossRef] [PubMed]
- Shraim, A.; Diab, A.; Alsuhaimi, A.; Niazy, E.; Metwally, M.; Amad, M.; Sioud, S.; Dawoud, A. Analysis of some pharmaceuticals in municipal wastewater of Almadinah Almunawarah. Arab. J. Chem. 2017, 10 (Suppl. 1), S719–S729. [Google Scholar] [CrossRef] [Green Version]
- Beretta, M.; Britto, V.; Tavares, T.M.; Silva, S.M.T.; Pletsch, A.L. Occurrence of pharmaceutical and personal care products (PPCPs) in marine sediments in the Todos os Santos Bay and the north coast of Salvador, Bahia, Brazil. J. Soils Sediments 2014, 14, 1278–1286. [Google Scholar] [CrossRef]
- Heberer, T. Occurrence, fate, and removal of pharmaceutical residues in the aquatic environment: A review of recent research data. Toxicol. Lett. 2002, 131, 5–17. [Google Scholar] [CrossRef]
- Silva, C.G.A.; Collins, C.H. Aplicações de cromatografia líquida de alta eficiência para o estudo de poluentes orgânicos emergentes [Applications of high performance liquid chromatography for the study of emerging organic pollutants]. Quím. Nova 2011, 34, 665–676. [Google Scholar] [CrossRef] [Green Version]
- Kuster, M.; López de Alda, M.J.; Hernando, M.D.; Petrovic, M.; Martín-Alonso, J.; Barceló, D. Analysis and occurrence of pharmaceuticals, estrogens, progestogens and polar pesticides in sewage treatment plant effluents, river water and drinking water in the Llobregat river basin (Barcelona, Spain). J. Hydrol. 2008, 358, 112–123. [Google Scholar] [CrossRef]
- Li, Q.; Gao, J.; Zhang, Q.; Liang, L.; Tao, H. Distribution and Risk Assessment of Antibiotics in a Typical River in North China Plain. Bull. Environ. Contam. Toxicol. 2017, 98, 478–483. [Google Scholar] [CrossRef]
- Balabanič, D.; Rupnik, M.; Klemenčič, A.K. Negative impact of endocrine-disrupting compounds on human reproductive health. Reprod. Fertil. Dev. 2011, 23, 403–416. [Google Scholar] [CrossRef] [Green Version]
- Macku’ak, T.; Nagyová, K.; Faberová, M.; Grabic, R.; Koba, O.; Gál, M.; Birošová, L. Utilization of Fenton-like reaction for antibiotics and resistant bacteria elimination in different parts of WWTP. Environ. Toxicol. Pharmacol. 2015, 40, 492–497. [Google Scholar] [CrossRef] [PubMed]
- Martínez-Costa, J.I.; Rivera-Utrilla, J.; Leyva-Ramos, R.; Sánchez-Polo, M.; Velo-Gala, I.; Mota, A.J. Individual and simultaneous degradation of the antibiotics sulfamethoxazole and trimethoprim in aqueous solutions by Fenton, Fenton-like and photo-Fenton processes using solar and UV radiations. J. Photochem. Photobiol. A Chem. 2018, 360, 95–108. [Google Scholar] [CrossRef]
- Borowska, E.; Gomes, J.; Martins, R.; Quinta-Ferreira, R.; Horn, H.; Gmurek, M. Solar Photocatalytic Degradation of Sulfamethoxazole by TiO2 Modified with Noble Metals. Catalysts 2019, 9, 500. [Google Scholar] [CrossRef] [Green Version]
- Domingues, E.; Gomes, J.; Assunção, N.; Gmurek, M.; Quina, M.J.; Quinta-Ferreira, R.M.; Martins, R.C. Iron-based catalysts under solar and visible radiation for contaminants of emerging concern removal. Energy Rep. 2020, 6, 711–716. [Google Scholar] [CrossRef]
- Andreozzi, R.; Marotta, R.; Sanchirico, R. Manganese-catalysed ozonation of glyoxalic acid in aqueous solutions. J. Chem. Technol. Biotechnol. 2000, 75, 59–65. [Google Scholar] [CrossRef]
- Zhang, H.; Huang, C.-H. Oxidative transformation of triclosan and chlorophene by manganese oxides. Environ. Sci. Technol. 2003, 37, 2421–2430. [Google Scholar] [CrossRef]
- Fernandez, J.; Maruthamuthu, P.; Renken, A.; Kiwi, J. Bleaching and photobleaching of Orange II within seconds by the oxone/Co2+ reagent in Fenton-like processes. Appl. Catal. B Environ. 2004, 49, 207–215. [Google Scholar] [CrossRef] [Green Version]
- Zheng, Z.W.; Lei, L.C.; Xu, S.J.; Cen, P.L. Heterogeneous UV/Fenton catalytic degradation of wastewater containing phenol with Fe-Cu-Mn-Y catalyst. J. Zhejiang Univ. Sci. 2004, 5, 206–211. [Google Scholar] [CrossRef]
- Friedrich, L.C.; Mendes, M.A.; Silva, V.O.; Zanta, C.L.P.S.; Machulek, A., Jr.; Quina, F.H. Mechanistic implications of zinc(II) ions on the degradation of phenol by the fenton reaction. J. Braz. Chem. Soc. 2012, 23, 1372–1377. [Google Scholar] [CrossRef] [Green Version]
- Nidheesh, P.V.; Gandhimathi, R. Comparative Removal of Rhodamine B from Aqueous Solution by Electro-Fenton and Electro-Fenton-Like Processes. CLEAN Soil Air Water 2014, 42, 779–784. [Google Scholar] [CrossRef]
- Haber, F.; Weiss, J. Über die Katalyse des Hydroperoxydes. Naturwissenschaften 1932, 20, 948–950. [Google Scholar] [CrossRef]
- Walling, C.; Goosen, A. Mechanism of the ferric ion catalyzed decomposition of hydrogen peroxide. Effect of organic substrates. J. Am. Chem. Soc. 1973, 95, 2987–2991. [Google Scholar] [CrossRef]
- Fenton, H.J.H. LXXIII.—Oxidation of tartaric acid in presence of iron. J. Chem. Soc. Trans. 1894, 65, 899–910. [Google Scholar] [CrossRef] [Green Version]
- Hermosilla, D.; Cortijo, M.; Huang, C.P. Optimizing the treatment of landfill leachate by conventional Fenton and photo-Fenton processes. Sci. Total Environ. 2009, 407, 3473–3481. [Google Scholar] [CrossRef]
- Wu, Y.; Zhou, S.; Ye, X.; Zhao, R.; Chen, D. Oxidation and coagulation removal of humic acid using Fenton process. Colloids Surf. A Physicochem. Eng. Asp. 2011, 379, 151–156. [Google Scholar] [CrossRef]
- Jiang, C.; Gao, Z.; Qu, H.; Li, J.; Wang, X.; Li, P.; Liu, H. A new insight into Fenton and Fenton-like processes for water treatment: Part II. Influence of organic compounds on Fe(III)/Fe(II) interconversion and the course of reactions. J. Hazard. Mater. 2013, 250–251, 76–81. [Google Scholar] [CrossRef]
- Huang, Y.; Liu, X.; Fang, Y.; Wang, Q.; Lau, K. Degradation of 2, 4-D acid using Mn2+ as catalyst under UV irradiation. Wuhan Univ. J. Nat. Sci. 2009, 14, 262–266. [Google Scholar] [CrossRef]
- Davies, G.; Kirschenbaum, L.J.; Kustin, K. Kinetics and stoichiometry of the reaction between manganese(III) and hydrogen peroxide in acid perchlorate solution. Inorg. Chem. 1968, 7, 146–154. [Google Scholar] [CrossRef]
- Tekindal, M.; Bayrak, H.; Özkaya, B.; Yavuz, Y. Box-Behnken experimental design in factorial experiments: The importance of bread for nutrition and health. Turkish J. Field Crops 2012, 17, 115–123. [Google Scholar]
- Maruyama, S.A.; Palombini, S.V.; Claus, T.; Carbonera, F.; Montanher, P.F.; Souza, N.E.d.; Visentainer, J.V.; Gomes, S.T.M.; Matsushita, M. Application of Box-Behnken design to the study of fatty acids and antioxidant activity from enriched white bread. J. Braz. Chem. Soc. 2013, 24, 1520–1529. [Google Scholar] [CrossRef]
- Honary, S.; Zolfaghari, A.; Ghasemitabar, M. Preparation of gold nanoparticles for biomedical applications using chemometric technique. Trop. J. Pharm. Res. 2013, 12, 295–298. [Google Scholar] [CrossRef] [Green Version]
- Ferreira, S.L.C.; Bruns, R.E.; Ferreira, H.S.; Matos, G.D.; David, J.M.; Brandão, G.C.; Silva, E.G.P.; Portugal, L.A.; Reis, P.S.; Souza, A.S.; et al. Box-Behnken design: An alternative for the optimization of analytical methods. Anal. Chim. Acta 2007, 597, 179–186. [Google Scholar] [CrossRef]
- Amorim, K.P.; Romualdo, L.L.; Andrade, L.S. Performance and kinetic-mechanistic aspects in the electrochemical degradation of sulfadiazine on boron-doped diamond electrode. J. Braz. Chem. Soc. 2014, 25, 1484–1492. [Google Scholar] [CrossRef]
- NIST/SEMATECH. e-Handbook of Statistical Methods. Available online: http://www.itl.nist.gov/div898/handbook/ (accessed on 15 March 2017).
- Box, G.E.P.; Behnken, D.W. Some new three level designs for the study of quantitative variables. Technometrics 1960, 2, 455–475. [Google Scholar] [CrossRef]
- Sarmento, A.P.; Borges, A.C.; Matos, A.T.; Romualdo, L.L. Phenol degradation by Fenton-like process. Environ. Sci. Pollut. Res. 2016, 23, 18429–18438. [Google Scholar] [CrossRef]
- Sarmento, A.P.; Borges, A.C.; Matos, A.T.; Romualdo, L.L. Humic acid degradation by fenton-like process using Fe2+ and Mn4+. Water Pract. Technol. 2018, 13, 388–399. [Google Scholar] [CrossRef]
- Khalid, A.; Khan, A.S.; Nazli, Z.-I.-H.; Mahmood, T.; Siddique, M.T.; Mahmood, S.; Arshad, M. Post-treatment of aerobically pretreated poultry litter leachate using fenton and photo-fenton processes. Int. J. Agric. Biol. 2011, 13, 439–443. [Google Scholar]
- Mortazavi, S.; Sabzali, A.; Rezaee, A. Sequence-fenton reaction for decreasing phenol formation during benzene chemical conversion in aqueous solutions. Iran. J. Environ. Health Sci. Eng. 2005, 2, 62–71. [Google Scholar]
- Kang, S.-F.; Liao, C.-H.; Chen, M.-C. Pre-oxidation and coagulation of textile wastewater by the Fenton process. Chemosphere 2002, 46, 923–928. [Google Scholar] [CrossRef]
- Oliveira, L.C.A.; Gonçalves, M.; Oliveira, D.Q.L.; Guarieiro, A.L.N.; Pereira, M.C. Síntese e propriedades catalíticas em reações de oxidação de goethitas contendo nióbio [Synthesis and catalytic properties on oxidation reaction of goethite containing niobium]. Quím. Nova 2007, 30, 925–929. [Google Scholar] [CrossRef] [Green Version]
- Liu, W.; Andrews, S.A.; Stefan, M.I.; Bolton, J.R. Optimal methods for quenching H2O2 residuals prior to UFC testing. Water Res. 2003, 37, 3697–3703. [Google Scholar] [CrossRef]
- Hasan, D.U.B.; Abdul Aziz, A.; Daud, W. Application of response surface methodology in process parameters optimization for phenol mineralization using Fenton’s peroxidation. Afr. J. Biotechnol. 2011, 10, 10218–10231. [Google Scholar]
- Marinho, B.A. Estudo da Potencialidade da Fotocatálise Heterogênea e dos Processos Fenton Para Degradação de Micropoluentes em Águas Residuárias (Esgoto Tratado); Mestrado em Química Analítica, Universidade Federal do Paraná: Curitiba, Brazil, 2012. [Google Scholar]
- Wu, Y.; Zhou, S.; Qin, F.; Peng, H.; Lai, Y.; Lin, Y. Removal of humic substances from landfill leachate by Fenton oxidation and coagulation. Process Saf. Environ. Protect. 2010, 88, 276–284. [Google Scholar] [CrossRef]
- Balci, B.; Oturan, M.A.; Oturan, N.; Sirés, I. Decontamination of Aqueous Glyphosate, (Aminomethyl)phosphonic Acid, and Glufosinate Solutions by Electro-Fenton-like Process with Mn2+ as the Catalyst. J. Agric. Food Chem. 2009, 57, 4888–4894. [Google Scholar] [CrossRef] [PubMed]
- Ben, W.; Qiang, Z.; Pan, X.; Chen, M. Removal of veterinary antibiotics from sequencing batch reactor (SBR) pretreated swine wastewater by Fenton’s reagent. Water Res. 2009, 43, 4392–4402. [Google Scholar] [CrossRef]
Figure 1.
Pareto chart from the experimental design used (Box–Behnken), obtained for the degradation of TMP by the Fenton-like process, using Fe2+ and Mn2+ as catalysts.
Figure 1.
Pareto chart from the experimental design used (Box–Behnken), obtained for the degradation of TMP by the Fenton-like process, using Fe2+ and Mn2+ as catalysts.

Figure 2.
Graph of contours of the TMP relative concentration (C/C0) as resulting from variable interaction [Mn2+] and pH ([H2O2] = 4.41 mmol L−1, [Fe2+] = 0.81 mmol L−1, t = 60 min).
Figure 2.
Graph of contours of the TMP relative concentration (C/C0) as resulting from variable interaction [Mn2+] and pH ([H2O2] = 4.41 mmol L−1, [Fe2+] = 0.81 mmol L−1, t = 60 min).

Figure 3.
Graph of the global average of the relative concentration of TMP in all runs tested, for the three levels tested of [Mn2+].
Figure 3.
Graph of the global average of the relative concentration of TMP in all runs tested, for the three levels tested of [Mn2+].

Figure 4.
Graph of the global average of relative concentration of SMX in all the runs conducted, for the three levels tested of (A) Mn2+ and (B) pH.
Figure 4.
Graph of the global average of relative concentration of SMX in all the runs conducted, for the three levels tested of (A) Mn2+ and (B) pH.

Figure 5.
Profile of the predictive values and desirability function of the degradation of the emergent micropollutant TMP.
Figure 5.
Profile of the predictive values and desirability function of the degradation of the emergent micropollutant TMP.


Table 1.
Experimental design used for sulfamethoxazole (SMX) and trimethoprim (TMP) degradation studies.
Table 1.
Experimental design used for sulfamethoxazole (SMX) and trimethoprim (TMP) degradation studies.
| Variables | Symbol | Code | ||
|---|---|---|---|---|
| −1 | 0 | +1 | ||
| Initial pH | X1 | 3 | 4 | 5 |
| [H2O2] (mmol L−1) | X2 | 2.65 | 4.41 | 6.17 |
| [Fe2+] (mmol L−1) | X3 | 0.00 | 0.81 | 1.61 |
| [Mn2+] (mmol L−1) | X4 | 0.00 | 0.82 | 1.64 |
| t—reaction time (minutes) | X5 | 30 | 60 | 90 |
Table 2.
Factors and levels from Box–Behnken design with their respective efficiencies for degradation and relative concentrations using Fe2SO4·7H2O (Fe2+) as iron source and MnSO4·H2O (Mn2+) as manganese source on the degradation of TMP and SMX.
Table 2.
Factors and levels from Box–Behnken design with their respective efficiencies for degradation and relative concentrations using Fe2SO4·7H2O (Fe2+) as iron source and MnSO4·H2O (Mn2+) as manganese source on the degradation of TMP and SMX.
| Run | pH | [H2O2] | [Fe2+] | [Mn2+] | t | TMP | SMX | ||
|---|---|---|---|---|---|---|---|---|---|
| Efficiency | C/C0 | Efficiency | C/C0 | ||||||
| (mmol L−1) | (min) | (%) | (%) | ||||||
| 1 | 3 | 2.65 | 0.81 | 0.82 | 60 | 74.02 | 0.26 | 47.28 | 0.53 |
| 2 | 5 | 2.65 | 0.81 | 0.82 | 60 | 36.38 | 0.64 | 33.36 | 0.67 |
| 3 | 3 | 6.17 | 0.81 | 0.82 | 60 | 66.76 | 0.33 | 38.28 | 0.62 |
| 4 | 5 | 6.17 | 0.81 | 0.82 | 60 | 52.79 | 0.47 | 23.64 | 0.76 |
| 5 | 4 | 4.41 | 0.00 | 0.00 | 60 | 39.38 | 0.61 | 31.70 | 0.68 |
| 6 | 4 | 4.41 | 1.61 | 0.0 | 60 | 55.49 | 0.45 | 34.82 | 0.65 |
| 7 | 4 | 4.41 | 0.00 | 1.64 | 60 | 30.17 | 0.70 | 19.55 | 0.80 |
| 8 | 4 | 4.41 | 1.61 | 1.64 | 60 | 62.40 | 0.38 | 37.78 | 0.62 |
| 9 | 4 | 2.65 | 0.81 | 0.82 | 30 | 85.57 | 0.14 | 89.57 | 0.10 |
| 10 | 4 | 6.17 | 0.81 | 0.82 | 30 | 84.00 | 0.16 | 89.85 | 0.10 |
| 11 | 4 | 2.65 | 0.81 | 0.82 | 90 | 62.13 | 0.38 | 29.20 | 0.71 |
| 12 | 4 | 6.17 | 0.81 | 0.82 | 90 | 59.04 | 0.41 | 24.65 | 0.75 |
| 13 | 3 | 4.41 | 0.00 | 0.82 | 60 | 23.16 | 0.77 | 17.50 | 0.83 |
| 14 | 5 | 4.41 | 0.00 | 0.82 | 60 | 23.30 | 0.77 | 41.37 | 0.59 |
| 15 | 3 | 4.41 | 1.61 | 0.82 | 60 | 56.28 | 0.44 | 40.91 | 0.59 |
| 16 | 5 | 4.41 | 1.61 | 0.82 | 60 | 42.62 | 0.57 | 17.40 | 0.83 |
| 17 | 4 | 4.41 | 0.81 | 0.00 | 30 | 94.38 | 0.06 | 74.37 | 0.26 |
| 18 | 4 | 4.41 | 0.81 | 1.64 | 30 | 89.49 | 0.11 | 88.39 | 0.12 |
| 19 | 4 | 4.41 | 0.81 | 0.00 | 90 | 81.80 | 0.18 | 31.12 | 0.69 |
| 20 | 4 | 4.41 | 0.81 | 1.64 | 90 | 22.49 | 0.78 | 38.08 | 0.62 |
| 21 | 4 | 2.65 | 0.00 | 0.82 | 60 | 39.79 | 0.60 | 10.24 | 0.90 |
| 22 | 4 | 6.17 | 0.00 | 0.82 | 60 | 25.51 | 0.74 | 13.24 | 0.87 |
| 23 | 4 | 2.65 | 1.61 | 0.82 | 60 | 44.20 | 0.56 | 25.95 | 0.74 |
| 24 | 4 | 6.17 | 1.61 | 0.82 | 60 | 37.06 | 0.63 | 20.31 | 0.80 |
| 25 | 3 | 4.41 | 0.81 | 0.00 | 60 | 44.86 | 0.55 | 15.27 | 0.85 |
| 26 | 5 | 4.41 | 0.81 | 0.00 | 60 | 97.97 | 0.02 | 98.46 | 0.02 |
| 27 | 3 | 4.41 | 0.81 | 1.64 | 60 | 45.94 | 0.54 | 42.80 | 0.57 |
| 28 | 5 | 4.41 | 0.81 | 1.64 | 60 | 34.92 | 0.65 | 21.28 | 0.79 |
| 29 | 4 | 4.41 | 0.00 | 0.82 | 30 | 91.35 | 0.09 | 87.93 | 0.12 |
| 30 | 4 | 4.41 | 1.61 | 0.82 | 30 | 92.20 | 0.08 | 90.16 | 0.10 |
| 31 | 4 | 4.41 | 0.00 | 0.82 | 90 | 31.04 | 0.69 | 23.65 | 0.76 |
| 32 | 4 | 4.41 | 1.61 | 0.82 | 90 | 70.37 | 0.30 | 41.94 | 0.58 |
| 33 | 3 | 4.41 | 0.81 | 0.82 | 30 | 92.39 | 0.08 | 90.69 | 0.09 |
| 34 | 5 | 4.41 | 0.81 | 0.82 | 30 | 94.94 | 0.05 | 89.22 | 0.11 |
| 35 | 3 | 4.41 | 0.81 | 0.82 | 90 | 62.81 | 0.37 | 41.90 | 0.58 |
| 36 | 5 | 4.41 | 0.81 | 0.82 | 90 | 46.52 | 0.53 | 15.23 | 0.85 |
| 37 | 4 | 2.65 | 0.81 | 0.00 | 60 | 47.75 | 0.52 | 10.12 | 0.90 |
| 38 | 4 | 6.17 | 0.81 | 0.00 | 60 | 55.89 | 0.44 | 33.80 | 0.66 |
| 39 | 4 | 2.65 | 0.81 | 1.64 | 60 | 45.95 | 0.54 | 41.05 | 0.59 |
| 40 | 4 | 6.17 | 0.81 | 1.64 | 60 | 42.56 | 0.57 | 25.72 | 0.74 |
| 41 | 4 | 4.41 | 0.81 | 0.82 | 60 | 48.25 | 0.52 | 22.45 | 0.78 |
| 42 | 4 | 4.41 | 0.81 | 0.82 | 60 | 48.58 | 0.51 | 16.46 | 0.84 |
| 43 | 4 | 4.41 | 0.81 | 0.82 | 60 | 16.49 | 0.84 | 24.00 | 0.76 |
| 44 | 4 | 4.41 | 0.81 | 0.82 | 60 | 52.36 | 0.48 | 25.76 | 0.74 |
| 45 | 4 | 4.41 | 0.81 | 0.82 | 60 | 51.45 | 0.49 | 25.04 | 0.75 |
| 46 | 4 | 4.41 | 0.81 | 0.82 | 60 | 64.64 | 0.35 | 30.30 | 0.70 |
The best experimental run is in bold.
Table 3.
Analysis of variance from the complete model of regression for the efficiency of TMP degradation by the Fenton-like process.
Table 3.
Analysis of variance from the complete model of regression for the efficiency of TMP degradation by the Fenton-like process.
| Variation Source | Degrees of Freedom | Square Sum | Average Square | F Calculated |
|---|---|---|---|---|
| Regression | 20 | 1.8364 | 0.0918 | 5.1307 * |
| Residue | 25 | 0.4474 | 0.0179 | |
| Lack of fit | 20 | 0.3143 | 0.0157 | 0.5905 n.s. |
| Pure error | 5 | 0.1331 | 0.0266 | |
| Total | 45 | 2.2838 |
* Significant values at 5% probability. n.s. non-significant.
Table 4.
Coefficients of regression from the quadratic model for efficiency of TMP degradation treated by the Fenton-like process.
Table 4.
Coefficients of regression from the quadratic model for efficiency of TMP degradation treated by the Fenton-like process.
| Parameter | Coefficient | Standard Error | t (25) | p-Value |
|---|---|---|---|---|
| Intercept | −0.910762 | 1.397793 | −0.65157 | 0.520623 |
| pH | 0.178586 | 0.432823 | 0.41261 | 0.683411 |
| pH vs. pH | −0.036667 | 0.045284 | −0.80971 | 0.425750 |
| [H2O2] | 0.153310 | 0.220854 | 0.69417 | 0.493976 |
| [H2O2] vs. [H2O2] | −0.002421 | 0.014619 | −0.16562 | 0.869787 |
| [Fe] | −0.126336 | 0.450193 | −0.28063 | 0.781306 |
| [Fe] vs. [Fe] | 0.114806 | 0.069883 | 1.64282 | 0.112939 |
| [Mn] * | −0.964534 | 0.442079 | −2.18181 | 0.038734 |
| [Mn] vs. [Mn] | −0.047095 | 0.067347 | −0.69929 | 0.490826 |
| t * | 0.032151 | 0.012587 | 2.55429 | 0.017114 |
| t vs. t * | −0.000284 | 0.000050 | −5.64953 | 0.000007 |
| pH vs. [H2O2] | −0.034091 | 0.038005 | −0.89701 | 0.378271 |
| pH vs. [Fe] | 0.040294 | 0.083091 | 0.48495 | 0.631938 |
| pH vs. [Mn] * | 0.195122 | 0.081572 | 2.39203 | 0.024595 |
| pH vs. t | 0.001583 | 0.002230 | 0.71013 | 0.484193 |
| [H2O2] vs. [Fe] | −0.012551 | 0.047211 | −0.26586 | 0.792527 |
| [H2O2] vs. [Mn] | 0.019055 | 0.046348 | 0.41113 | 0.684480 |
| [H2O2] vs. t | 0.000047 | 0.001267 | 0.03738 | 0.970483 |
| [Fe] vs. [Mn] | −0.059795 | 0.101330 | −0.59011 | 0.560416 |
| [Fe] vs. t | −0.003940 | 0.002770 | −1.42263 | 0.167204 |
| [Mn] vs. t | 0.005589 | 0.002719 | 2.05565 | 0.050402 |
* Significant variables at 5% significant level; R2 = 80.41%; R2 adjusted = 64.74%.
Table 5.
Analysis of variance from the complete model of regression for the efficiency of the SMX degradation treated by the Fenton-like process.
Table 5.
Analysis of variance from the complete model of regression for the efficiency of the SMX degradation treated by the Fenton-like process.
| Variation Source | Degrees of Freedom | Square Sum | Average Square | F calculated |
|---|---|---|---|---|
| Regression | 20 | 2.7544 | 0.1377 | 10.2963 * |
| Residue | 25 | 0.3344 | 0.0134 | |
| Lack of fit | 20 | 0.3235 | 0.0162 | 7.4314 * |
| Pure error | 5 | 0.0109 | 0.0022 | |
| Total | 45 | 3.0888 |
* Significant values at 5% probability.
© 2020 by the authors. Licensee MDPI, Basel, Switzerland. This article is an open access article distributed under the terms and conditions of the Creative Commons Attribution (CC BY) license (http://creativecommons.org/licenses/by/4.0/).
Share and Cite
MDPI and ACS Style
Sarmento, A.P.; Borges, A.C.; Matos, A.T.d.; Romualdo, L.L. Sulfamethoxazole and Trimethoprim Degradation by Fenton and Fenton-Like Processes. Water 2020, 12, 1655. https://0-doi-org.brum.beds.ac.uk/10.3390/w12061655
AMA Style
Sarmento AP, Borges AC, Matos ATd, Romualdo LL. Sulfamethoxazole and Trimethoprim Degradation by Fenton and Fenton-Like Processes. Water. 2020; 12(6):1655. https://0-doi-org.brum.beds.ac.uk/10.3390/w12061655
Chicago/Turabian StyleSarmento, Antover Panazzolo, Alisson Carraro Borges, Antonio Teixeira de Matos, and Lincoln Lucílio Romualdo. 2020. "Sulfamethoxazole and Trimethoprim Degradation by Fenton and Fenton-Like Processes" Water 12, no. 6: 1655. https://0-doi-org.brum.beds.ac.uk/10.3390/w12061655
Note that from the first issue of 2016, this journal uses article numbers instead of page numbers. See further details here.