
Transmissivity Estimates by Specific Capacity Data of Some Fractured Italian Carbonate Aquifers


1
Department of Physics and Geology, University of Perugia, 06123 Perugia, Italy
2
Regione Umbria, Servizio Risorse Idriche e Rischio Idraulico, 06121 Perugia, Italy
*
Author to whom correspondence should be addressed.
Water 2021, 13(10), 1374; https://doi.org/10.3390/w13101374
Submission received: 19 April 2021
/
Revised: 10 May 2021
/
Accepted: 12 May 2021
/
Published: 14 May 2021
(This article belongs to the Special Issue Methods and Tools for Assessment of Groundwater)
Abstract
:Transmissivity estimates can be obtained by different approaches, mainly analytical and empirical. The application of analytical methods requires checking non-linear well losses due to turbulence and vertical flow related to partial penetration. The empirical approach relates transmissivity values to specific capacity data measured in the same well. The interpretation of available pumping tests highlights porous media solutions’ applicability in most of the step-drawdown curves analyzed. Double or triple porosity approaches are more appropriate only for wells located close to fault systems. In this work, a new relationship to estimate transmissivity by specific capacity data in some Italian carbonate aquifers is proposed. The comparison with other relationships available in the literature for similar aquifers worldwide confirms the validity of a general equation for carbonate aquifers, helping the spatial characterization of aquifer transmissivity in scarce data regions. Nonetheless, the use of equations of the same kind with different coefficients allows good results on our set of data. Results can improve the knowledge of fractured–karst aquifers by also including data from Central Italy.
1. Introduction
Groundwater assessment and management require knowledge of an aquifer’s hydrogeological parameters, the estimation of which can be costly and time-consuming [1]. Transmissivity (T), one of the main hydrological parameters, describes the ability of the aquifer to transmit groundwater across a given saturated thickness. Transmissivity values are generally obtained by analytical methods based on the interpretation of drawdown-pumping tests in unsteady or steady state conditions. The application of analytical methods requires corrections for non-linear well losses due to turbulence. The use of observations from piezometers helps to overcome this problem, but frequently only drawdown data from pumping well are available (no observation wells are present). This situation is common in mountain areas where groundwater levels are very deep and costs for drilling piezometers are very high. As Mace [2] reported, aquifer test data are not so abundant, and correction of well loss can be very uncertain, greatly affecting the reliability of T values estimations.
Analytical methods have been complemented over time by empirical approaches, aiming to estimate T values by specific capacity data (Sc, Equation (1)).
where:
- Q—discharge of pumping well (L3/T);
- sw—steady-state drawdown (L).
The choice of using the specific capacity as a reference parameter for estimating T depends on the fact that Sc data are typically much more abundant and readily available than time-drawdown data [3]. Several studies in the literature presented empirical relationships (T = f(Sc)) for different aquifer types (fractured and karst carbonates, sandstones, metamorphic, volcanic, alluvial, etc.). Most of the relationships proposed are log–log equations [2,4,5,6,7,8,9,10,11,12,13] even if some linear functions were also proposed [14,15,16]. As reported by Verbovšek [16], studies of T-Sc relationships for fractured or karst rocks are scarcer than those of alluvial aquifers. Mace [2]—based on data from southwest Texas (USA)—developed a log–log empirical equation, which was validated on data from Florida and Ohio aquifers, suggesting its potential application to other similar fractured karst aquifers. Central Italy is characterized by a wide outcropping of fractured and karst carbonates hosting large aquifers pumped by wells; information useful to enrich the discussion about this topic is therefore available. Coupling new data from thirty-two pumping tests (PTs) carried out in the last thirty years with those available from the literature; this work presents a new equation describing the T-Sc relationship for some Italian carbonate aquifers. Results are compared and discussed with other relationships on similar aquifers, improving the knowledge on transmissivity of fractured-karst aquifers.
2. Materials and Methods
2.1. Hydrogeological Setup and Well Characteristics
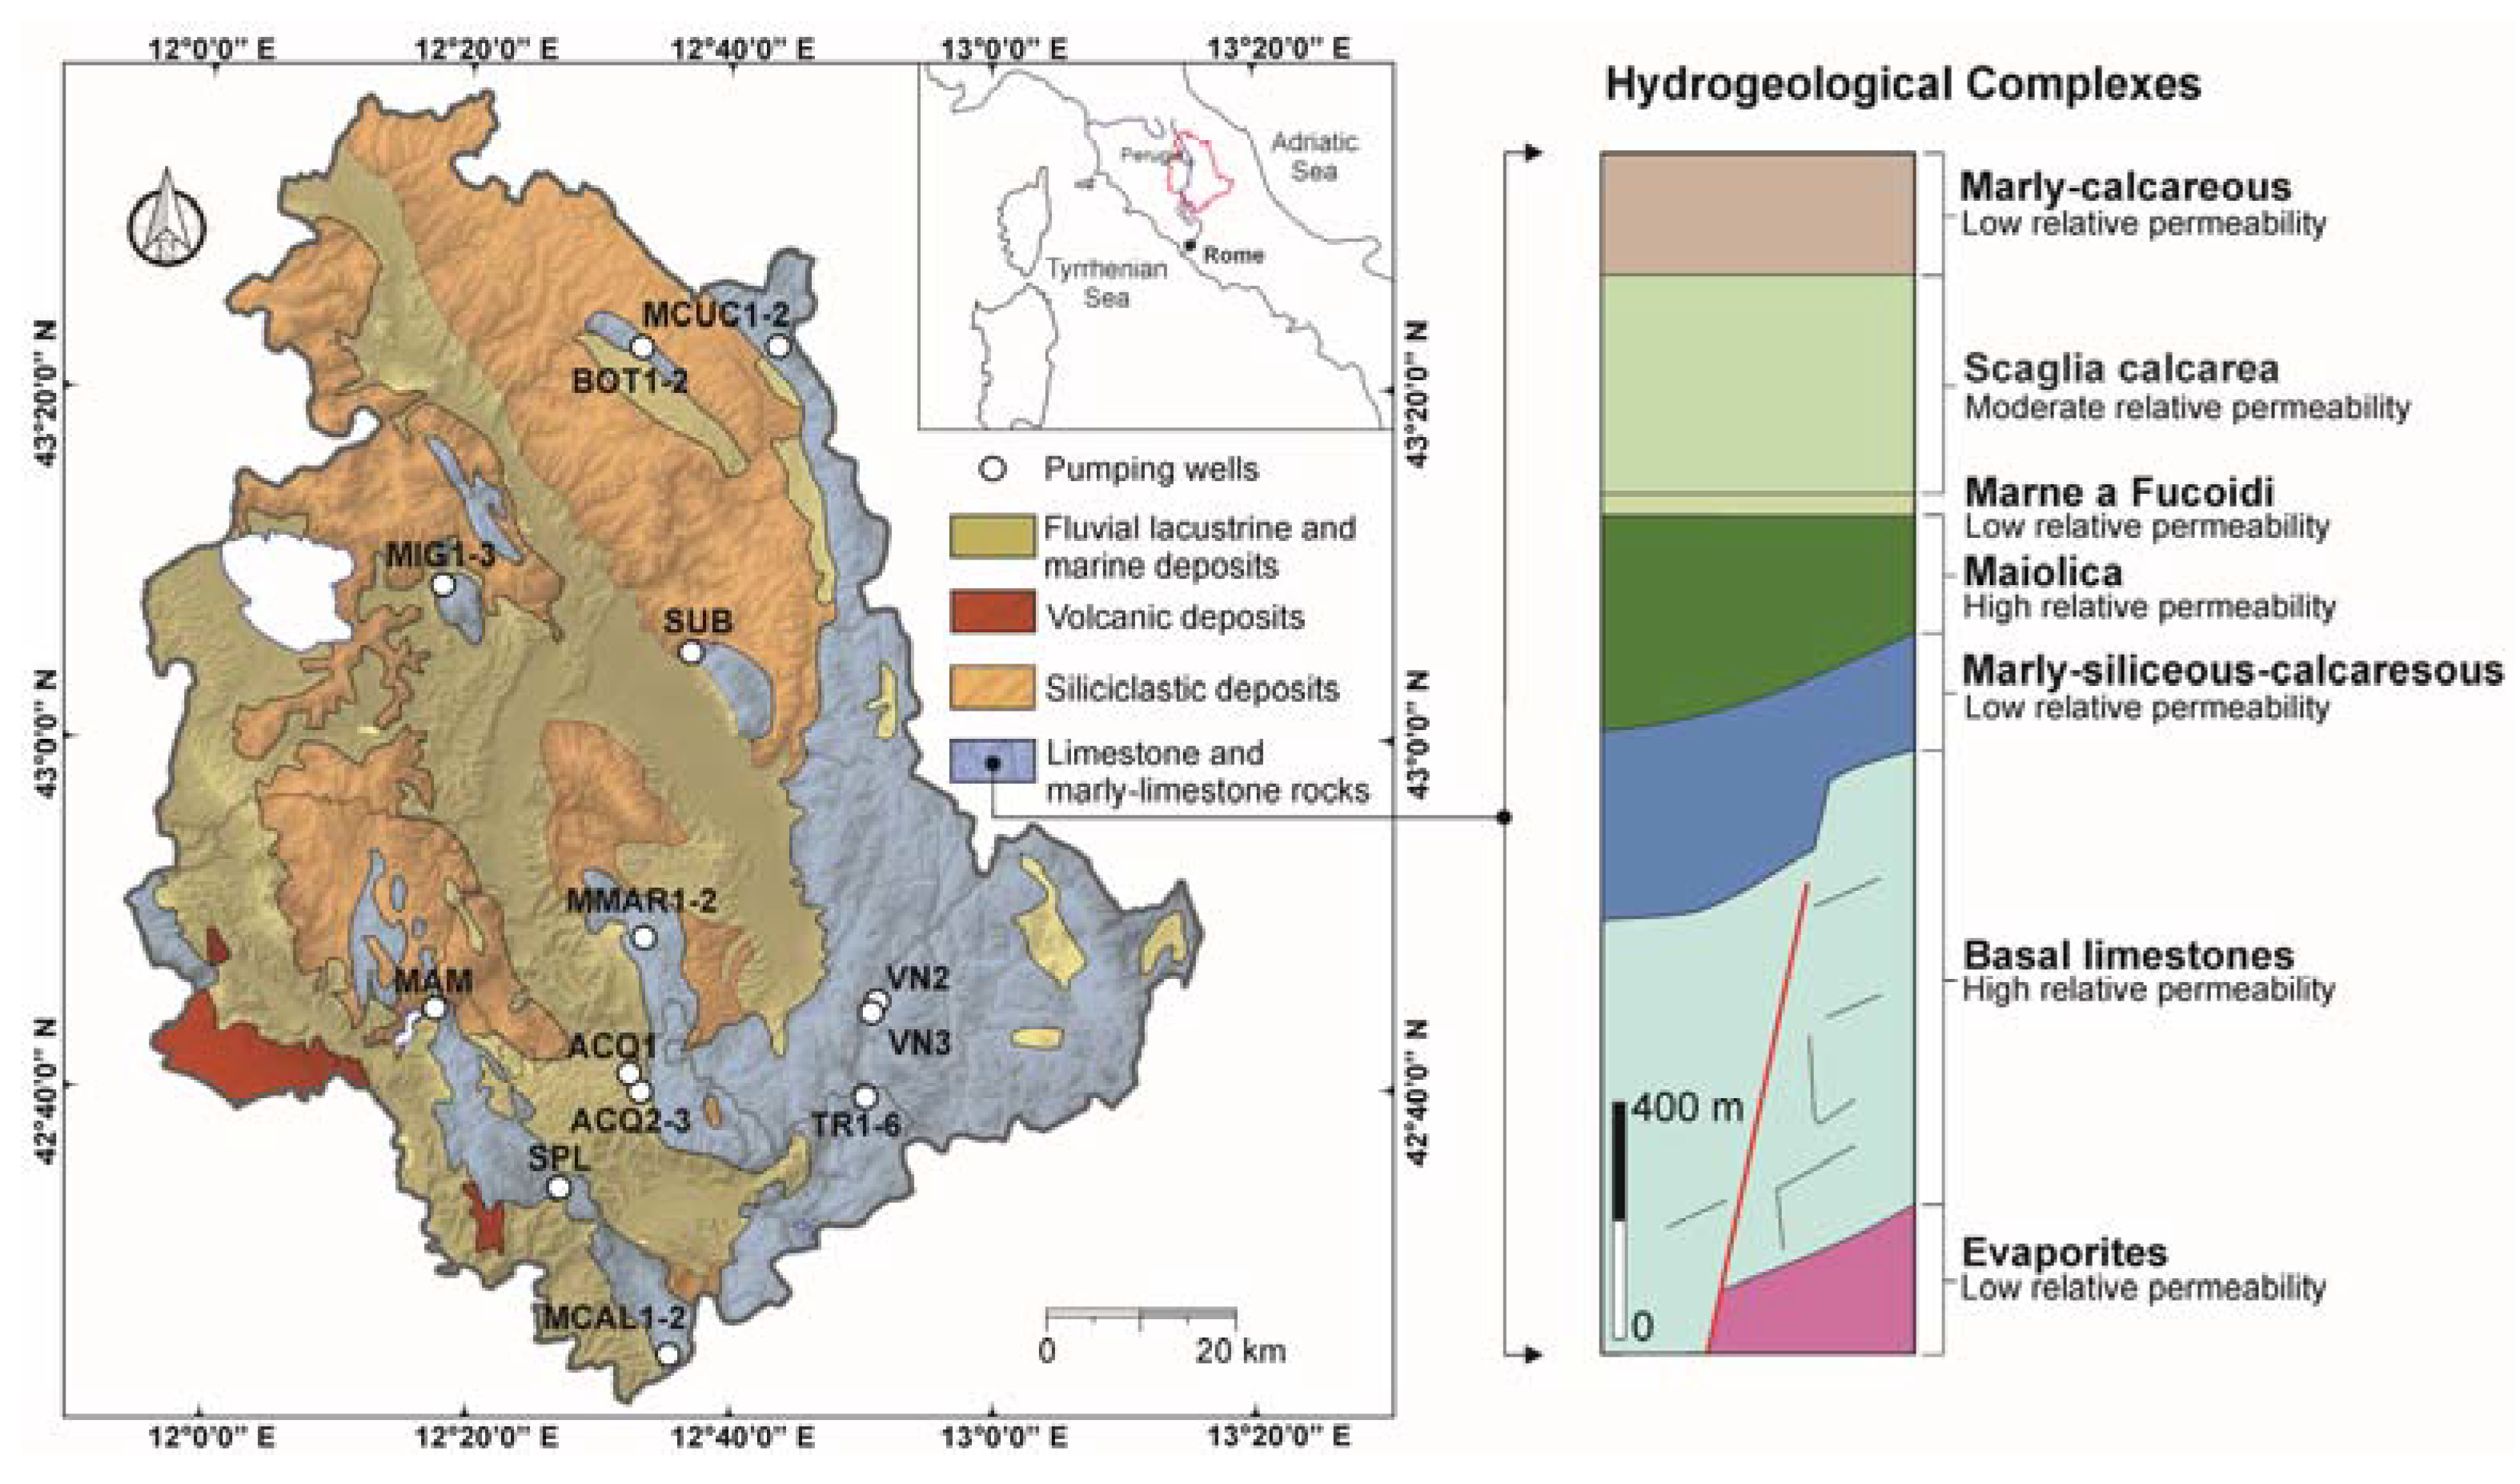
The study area is located in Central Italy (Umbria region), which is characterized by different lithologies: 23% of limestone and marly–limestone rocks, 25% of siliciclastic rocks, 2% of volcanic deposits, and 50% of fluvial-lacustrine and marine deposits, including recent alluvial [17]. Limestone and marly-limestone rocks belong to the Umbria-Marche sequence, forming the Umbria-Marche Apennines ridge, a compressive Miocene/Pliocene arc-shaped fold-and-thrust belt, with eastward vergence and convexity, later affected by Quaternary extension [18,19]. Figure 1 shows a schematic lithological map of the Umbria Region with the stratigraphic column of the Umbria-Marche sequence. Formations are grouped into different hydrogeological complexes, considering the stratigraphic relationships and the relative permeability [20,21,22,23,24,25]. The main aquifers are hosted into the Basal Limestones complex (Calcare Massiccio and Corniola Formations), characterized by fractured/karstified carbonates, and Maiolica complex, which is composed of stratified and fractured pelagic carbonates. Moreover, some aquifers are hosted into the Scaglia calcarea complex (stratified and fractured pelagic limestone and marly limestone) or in Calcari Diasprigni (regularly stratified limestone with flint beds), characterized by lower yields. It should be noted that the Calcari Diasprigni formation was included among the rocks with low permeability (Marly-siliceous-calcareous complex in Figure 1): nonetheless, at a local scale, these rocks, if intensely fractured, can host aquifers of low storage capacity. The aquifer systems are separated by marly, siliceous, and clayey rocks with low or very low relative permeability (Figure 1): often these aquicludes are dislocated by normal faults, producing the hydraulic connection between the main aquifers [26,27]. Normal faults help the development of a deep regional flow involving the Basal Limestones complex [24,28,29,30,31].
Interesting aquifers are hosted also in lithoid travertines deposited in the early Pleistocene of Tiberino basin (e.g., Acquasparta wells, ACQ1-3 in Figure 1). These carbonate rocks, belonging to the Acquasparta Formation (AF), are stratified and fractured with thickness of up to 50 m [32].
Abundant and high quality drinking water resources characterize carbonate aquifers. In response to the continuous demand for drinking water, and in order to optimize withdrawals from carbonate aquifers, the Umbria region (the authority in charge for managing water resources) had advanced projects for siting and drilling wells since the beginning of the 1990s [33]. Data of about twenty-six wells, all provided with pumping tests, have been collected, resulting from unpublished reports and from literature. Some data have been kindly provided by companies managing the pumping wells.
Table 1 summarizes the main characteristics of wells indicating their depth and the hydrogeological complex exploited. The mean depth of wells is 230 m, with a maximum value of 445 m: about 46% of wells are drilled in the Maiolica complex, followed by about 35% in the Basal Limestones complex. It should be noted that most of wells are in confined aquifers and often they do not fully penetrate the aquifer, especially in the Basal Limestones complex (Figure 1). In some cases, wells are drilled in unconfined aquifers (e.g., ACQ1-3, VN2, and VN3) and penetrate more than 70% of the aquifer.
2.2. Analytical Methods for Pumping Test Analysis
Drawdown data (s) from pumping wells and/or from surrounding piezometers are used to estimate the hydrogeological properties of aquifers (transmissivity and storage coefficient). Time-drawdown data (unsteady state conditions) are generally monitored during step-drawdown tests (a sequence of different constant-rate pumping steps), constant-rate tests (constant discharge during the time), and recovery tests (after the pumping stop). The steady-state drawdown data can also be used to estimate transmissivity at a certain discharge rate. Hydrogeological parameters can be estimated by the distance-drawdown method developed by Thiem-Dupuit [34,35]. Equation (2) shows the Thiem-Dupuit equation for confined aquifer, integrating two radial distances r1 and r2 from the pumping well. Theis [36] derived an analytical equation (Equation (3)) for the non-steady flow considering fully penetrating well in a confined homogeneous and isotropic aquifer having an infinite areal extent. This equation can also be used for unconfined aquifers if the vertical component of the flow can be neglected (Dupuit-Forchheimer assumption). The Theis’ equation has been simplified by Cooper-Jacob [37] Equation (4), truncating the infinite Taylor series, which is used for estimating the well function W(u) of Equation (3). This method is valid for smaller values of u, generally less than 0.01–0.05 [38,39,40]. A straight line through the data in s-log t plot identifies the range of validity of Cooper-Jacob equation. In the case of steady state, radial flow to a pumping well, for both confined and unconfined aquifers.
where:
- s—drawdown (L);
- Q—pumping discharge (L3/T);
- T—transmissivity (L2/T);
- W(u)—Theis well function, (dimensionless);
- t—time from the beginning of pumping (T);
- S—storage coefficient (dimensionless);
- r—radial distance from the pumping well (L).
The analytical methods for porous media are often applied for estimating the hydrogeological parameters of fractured aquifers also, under the assumption that the fracture systems are highly interconnected (fracture network continuum) so that the medium can be approximated to an Equivalent Porous Medium (EPM) [41,42]. In most cases, the spatial distribution of fractures surrounding the well cannot be neglected (the flow is not radial). In these cases, other methods can be used such as double porosity flow models e.g., [43,44], triple porosity flow models e.g., [45], etc. In these models, the medium can be separated into distinct domains (fracture and matrix, the latter being possibly characterized by different inter-porosity). In the case of limestone massive rocks with negligible permeability of the matrix, the role of discontinuities (fracture systems and dissolution conduits) is predominant for the understanding of groundwater path [46]. Fractured and karstified systems are very complex and this complexity has implications for the interpretation of pumping tests. Bourdet et al. [47] developed a diagnostic plot to unify methodologies to interpret pumping test data. As reported by Renard et al. [48] and Ferroud et al. [49], this plot allows the identification of an appropriate conceptual model best suited to interpret the pumping test data. The method is named derivative analysis, and the most straightforward computation is reported in Equation (5). The method—consisting in the plotting of the drawdown and derivative versus time in log-log scale—allows distinguishing changes in groundwater flow regime due to variations in aquifer conditions, which are less detectable on drawdown-time plots [49,50].
2.3. Empirical Relationships between Specific Capacity and Transmissivity
If well losses can be neglected (no turbulent flow), T is linearly proportional to Sc [4,6]. Referring to a pumping test in a confined aquifer at steady-state conditions, Equation (2) can be rewritten as Equation (6), considering r2 = R (radius of influence) with s2 = 0 and r1 = rw (radius of the well) with s1 = sw (drawdown in the well). Therefore, T can be calculated by knowing Sc data and the coefficient c. Equation (6) can be used for unconfined aquifers by correcting drawdown data using the Jacob equation [51]. To test the efficiency of the well, step-drawdown tests are carried out. Generally, the drawdown at low flow rates is not affected by well losses, i.e., the validity of the Equation (6) is verified. As Mace [2] reported, the number of transmissivity data available for certain aquifer types is not so many as to allow a spatial description. In many cases, well reports only indicate the specific capacity value and not the aquifer parameters. Therefore, the use of empirical relationships between Sc and T values can be useful to increase the number of data for aquifer characterization, a very important task in fractured carbonate aquifers. A set of at least 25 T-Sc data covering a wide range of transmissivity values is needed to build the relationships [3].
Table 2 shows a summary of log–log literature relationships (power functions) obtained for fractured and karstified carbonate aquifers, which have been obtained on a range of transmissivity values, covering three to up to six orders of magnitude.
3. Results
Thirty-two PTs have been interpreted for obtaining T and Sc values: some of T-Sc pairs are taken from the literature (Table 1). These data come from pumping tests carried out during the last thirty years, previously not systematically analyzed together. They were obtained on carbonate aquifers with different karst and fracturing degree related to tectonic activity and presence of fault zones nearby the well areas of the well. A synthesis of hydrogeological parameters of some PTs carried out in the main Umbria Region aquifers is also reported in [54]. Table 3 shows the results of the pumping tests indicating the methods used for the interpretation.
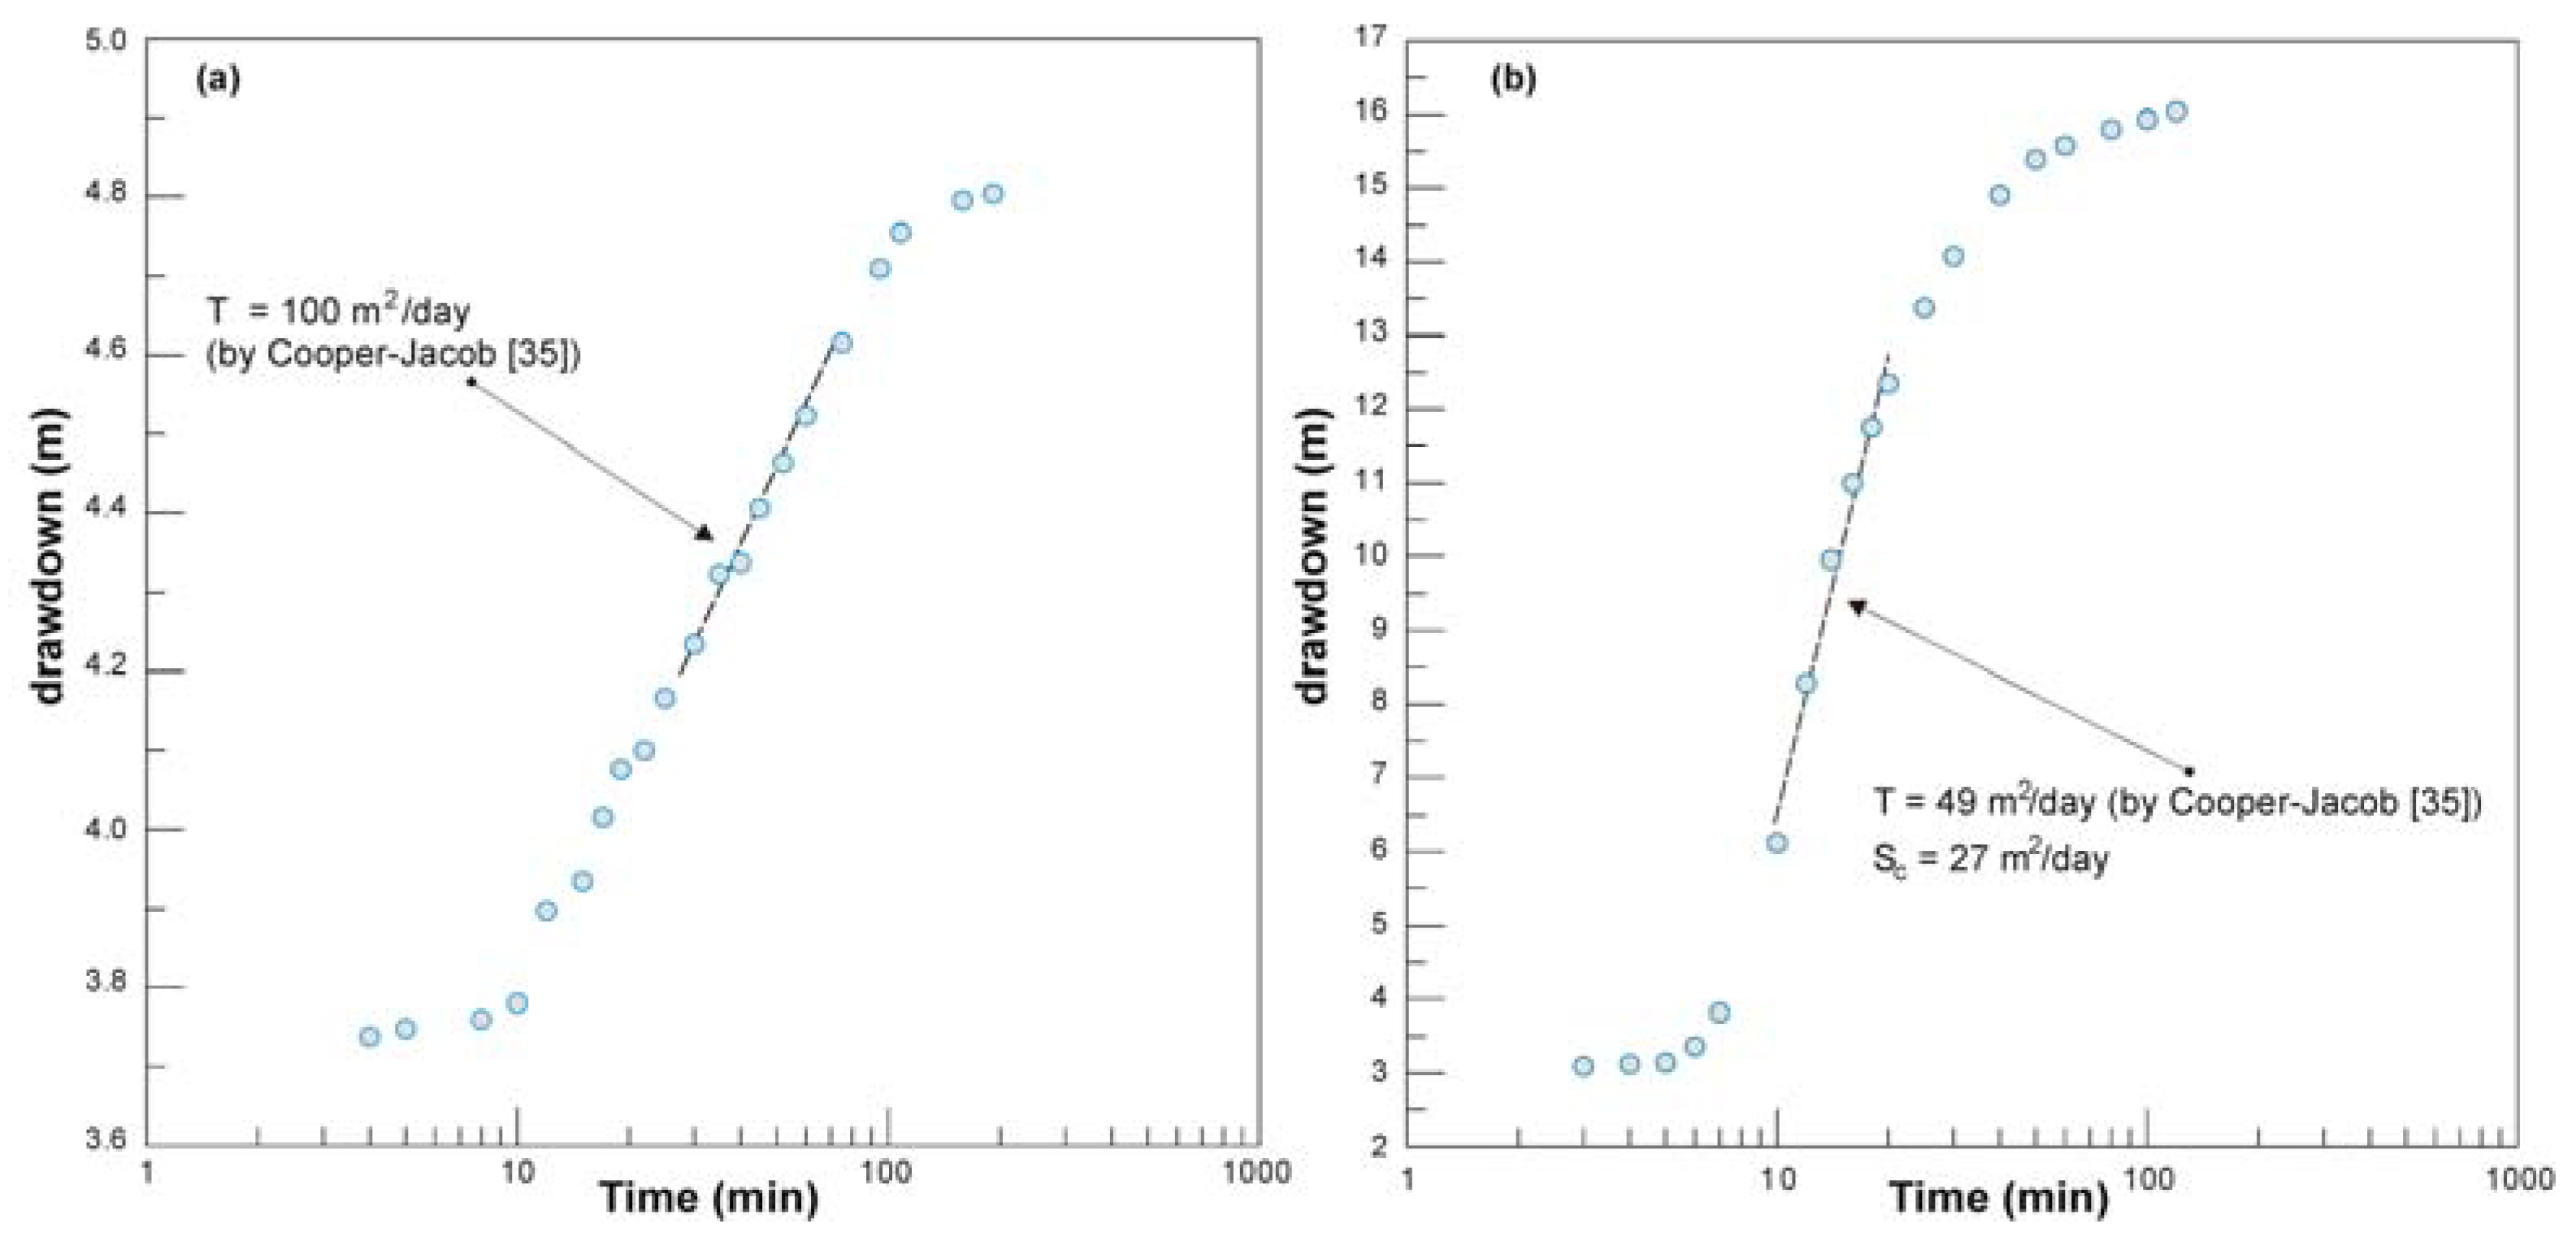
Most data come from step-drawdown tests and a few from constant-rate tests. For all the wells, the drawdown-discharge rate curves are used to calculate the linear aquifer-loss coefficient (B) and the non-linear well-loss coefficient (C) [51,55]. This approach allowed individuating the discharge rate values for which the non-linear well-loss are nil. Most of step-drawdown curves follow the Theis and Cooper and Jacob equations—Equations (3) and (4)—indicating that fractures in some carbonate aquifers are highly interconnected (radial flow). Figure 2 shows the Cooper Jacob method applied to two pumping tests carried out in wells sited in Maiolica and Scaglia-Maiolica aquifers.
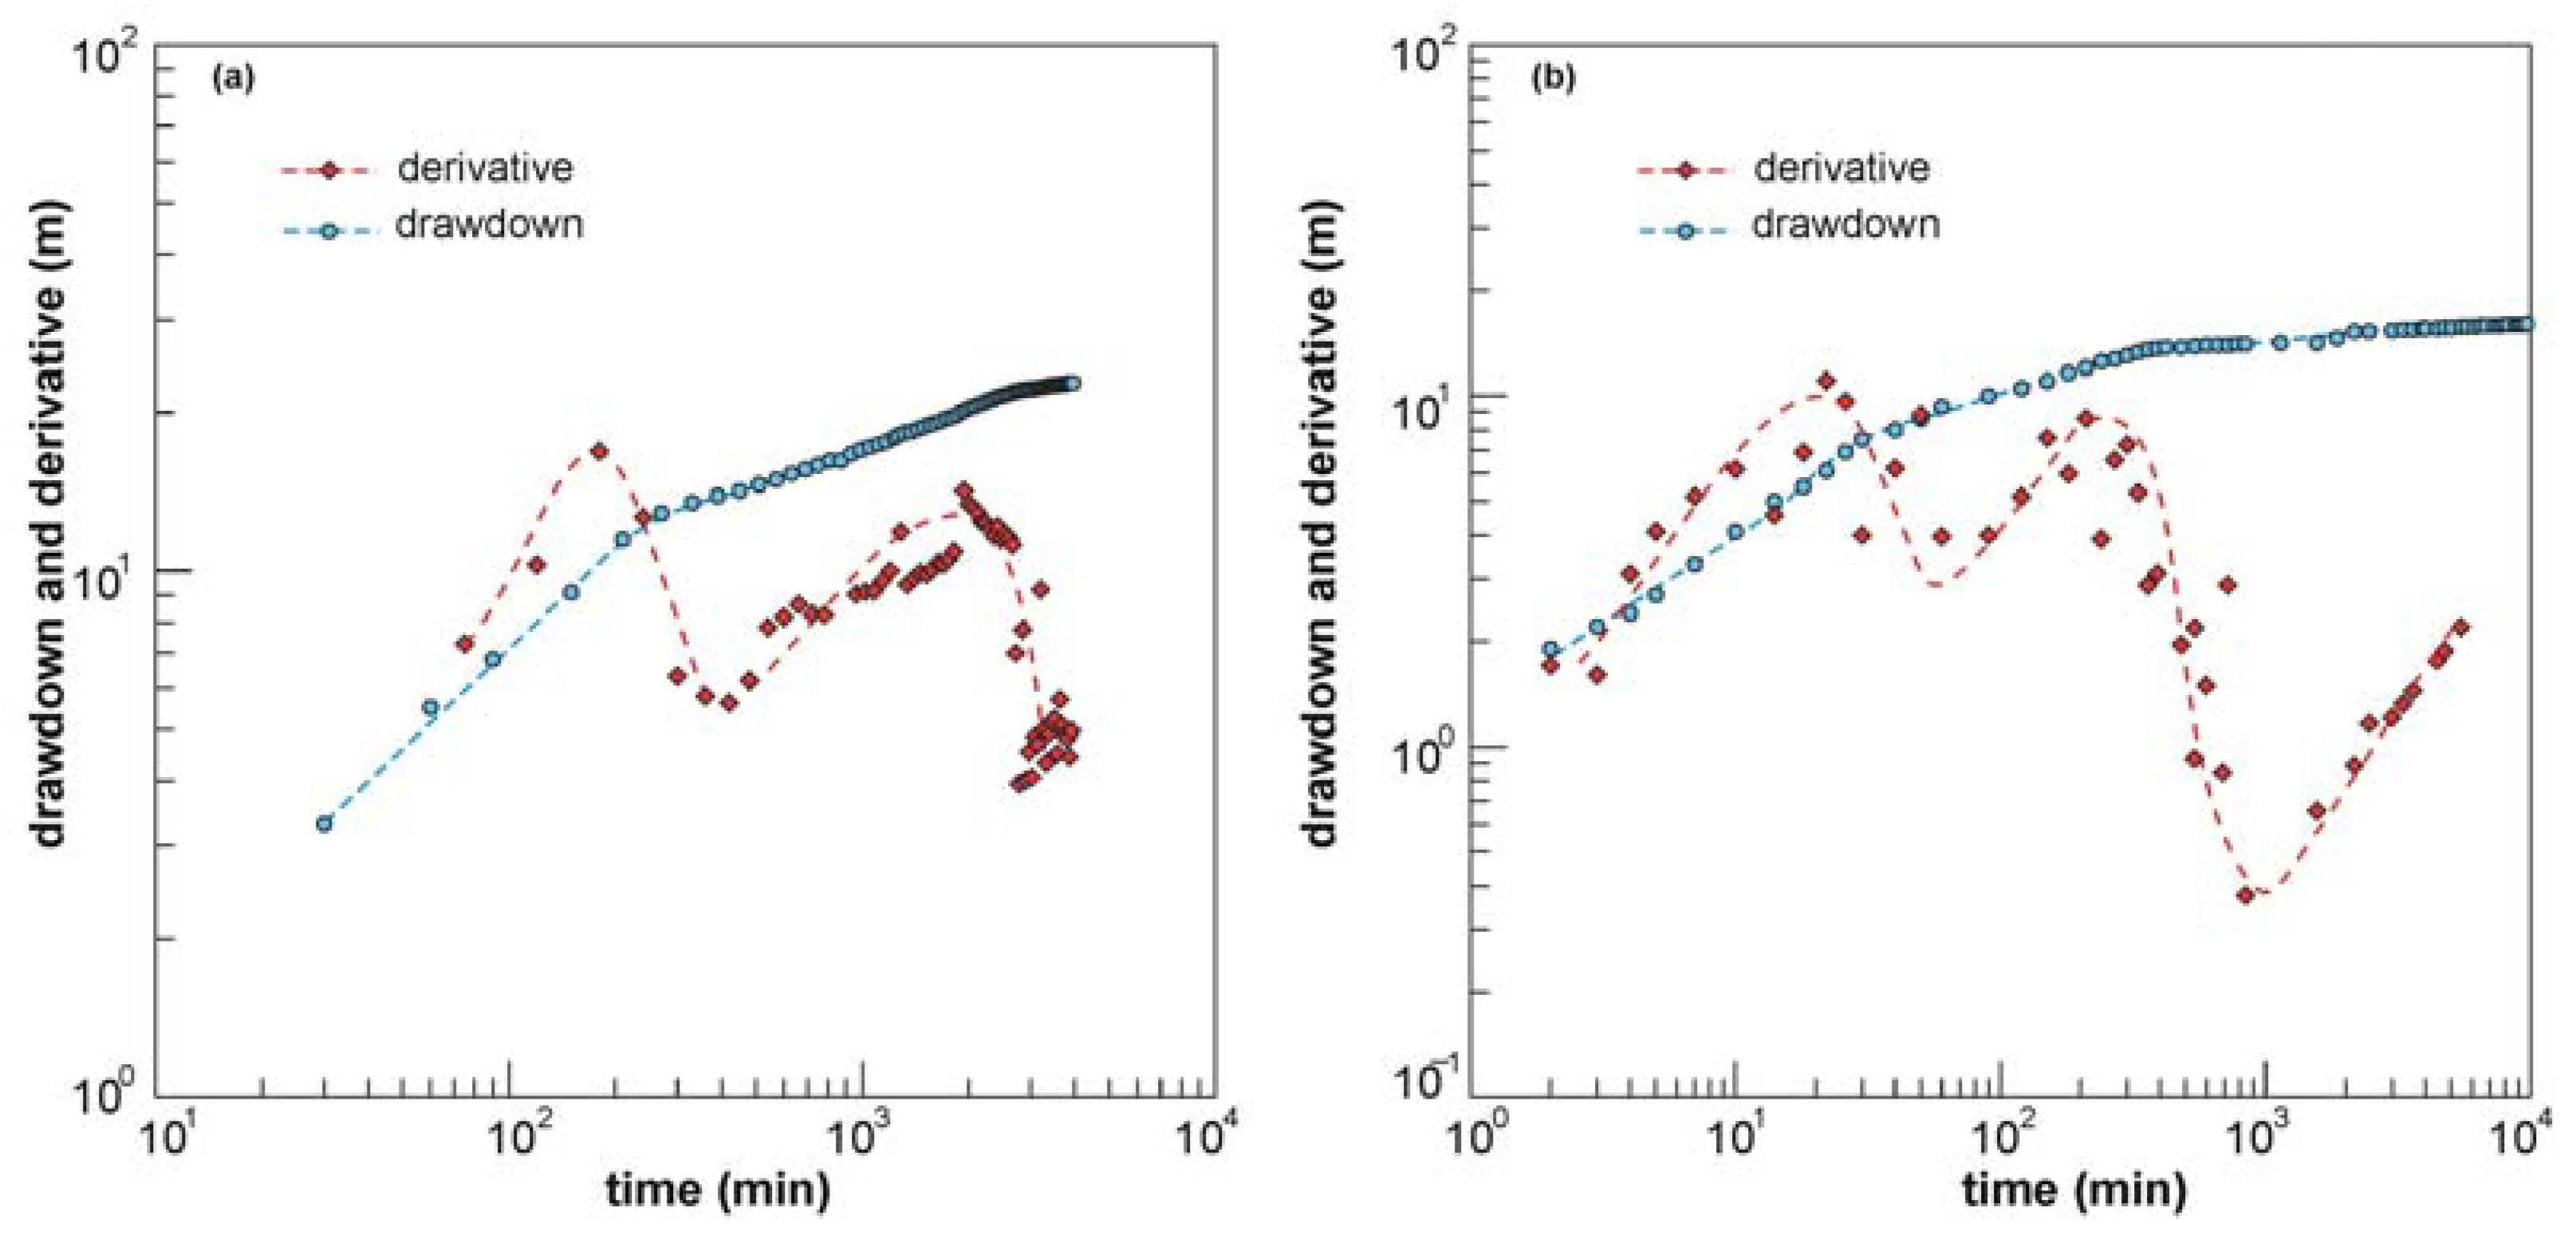
The derivative analysis applied to the available constant-rate pumping tests data (pumping prolonged for several days) allows detecting the possible presence of different porosity systems in the carbonate aquifers. Figure 3 shows the derivative analysis applied to drawdown-time data of TR5 and MCAL1 wells. Double or triple porosity are well distinguished, indicating changes in groundwater flow regime due to variations in aquifer conditions. During the first stage of pumping, the water is drawn from the fractures with high drawdown values. In the case of double porosity system, such as in Figure 3a, as pumping time increases the water is released from the matrix with small drawdown values compared to that produced by fractures. In the case of triple porosity systems (Figure 3b), the derivative analysis detected the different contribute made by fractures, small conduits, and the primary porosity of the rock matrix. It is interesting to point out that among the five constant-rate tests, in three the pumping test data the Cooper-Jacob equation can be used the estimation of hydrogeological parameters. This finding indicates that the spatial distribution of fractures surrounding the wells is homogeneous, i.e., the flow is radial.
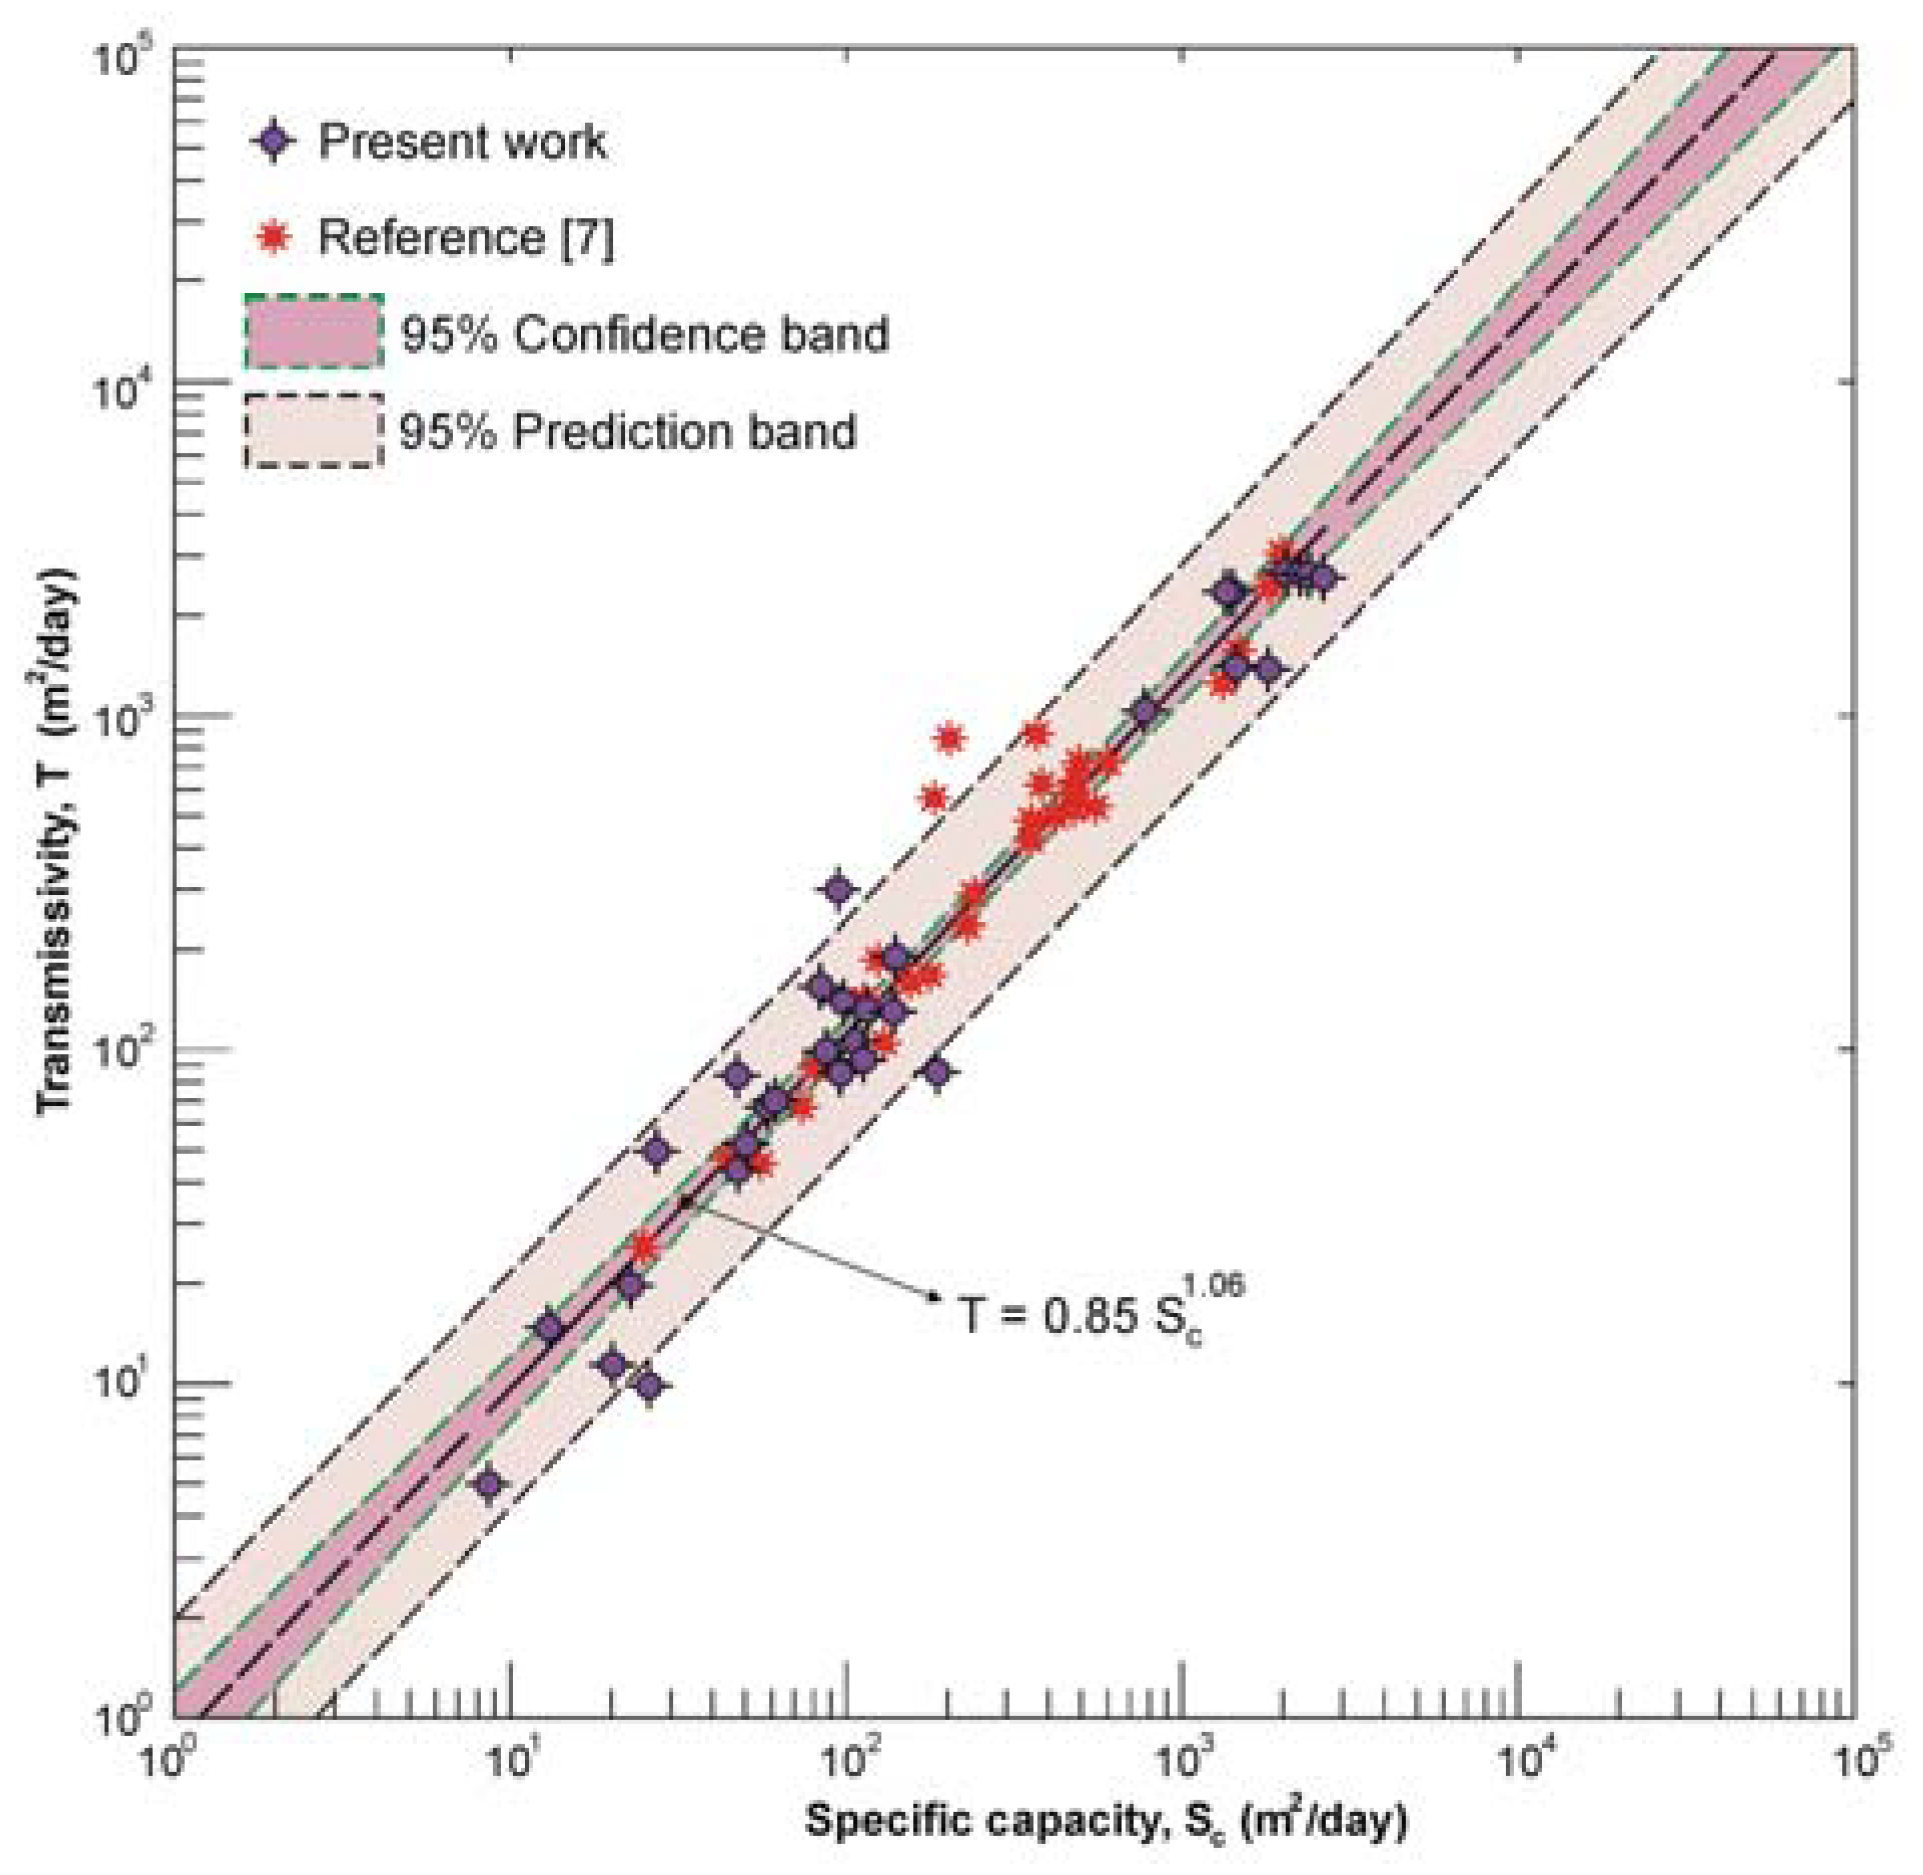
The analysis of pumping tests gives T values ranging from 5 to about 2700 m2/day, falling within the literature range for carbonate-fractured aquifers worldwide (Table 2). In order to create a more representative dataset involving different Italian carbonate aquifers, our data have been integrated with those of the Euganean aquifer, northern Italy [7]. A total of 77 T-Sc pairs have been collected: according to the Kolmogorov-Smirnov method for the goodness of fit (K-S test), both variables are log-normally distributed.
This type of distribution has also been found by other studies on large data sets in similar aquifers e.g., [2,6,16]. The log-log regression analysis of the dataset showed a slightly better correlation coefficient (R2) than that of the linear regression, 0.94 and 0.91, respectively. This is because the two parameters Sc and T are log-normally distributed [6]. To check the performance of the two relationships, the Relative Mean Absolute Error (RMAE) has been used. The RMAE value for the log-log relationship is 26.0% while that of the linear relationship is 80.0%, indicating that the log–log Equation (7) is much more accurate than the linear one.
4. Discussions
The development of tools, such as empirical relationships based on Sc data, can improve the knowledge of estimate of T values in fractured and karstified carbonate aquifers. This approach has to be considered for first rough estimates of transmissivity values, especially in hydrogeological systems with wells not provided by pumping tests but with known Sc data. In these conditions, Sc values may improve the hydrogeological characterization of data-scarce aquifers. The equation here proposed for some Italian carbonate aquifers Equation (7) was derived on the basis of transmissivity values determined mostly from the analysis of data collected during pumping tests in thick confined aquifers. As shown in Figure 1, Maiolica complex and Basal Limestones complex of Central Apennines are several hundred meters thick. In these aquifers, due cost–benefit constraints, pumping wells often penetrate the aquifer thickness just partially. This approach is typically used in mountain regions where wells are drilled in the productive part of aquifers, characterized by high transmissivity, without drilling deeper [16]. As shown in Table 3, most of the step-drawdown pumping tests can be interpreted by the Cooper-Jacob method which, according to [56,57], is affected only minimally by partial penetration in confined aquifers. Moreover, as Verbovšek [16] reported, pumping wells, which penetrate more than 70% of the entire aquifer thickness, can be treated as fully penetrating, as they activate the whole aquifer thickness. Among the wells analyzed in the Umbria region, those sited in unconfined aquifers have a screen length, which penetrates more than 70% of the aquifer thickness: in addition, transmissivity values have been estimated on drawdown curves at low flow rates, so that the vertical component of the flow can be considered negligible.
The transmissivity values presented in Table 3 are to be considered representative of the Central Apennine hydrogeological systems. As an example, the case of TR and VN wells (Figure 1) is taken into account and discussed. These wells are located in the Maiolica and Basal Limestones complexes. The aquifers hosted in these complexes are interconnected by direct fault systems related to the Jurassic and Quaternary tectonic activities, forming a large carbonate aquifer feeding the Nera River by a set of permanent linear springs [58,59]. It has been documented by several base flow measurements carried out by [60,61]. Considering a similar river stretch (about 3000 m), the river flow increment in the VN2-3 well area is about 1.11 m3/s, while that in the area where TR wells are located is 0.60 m3/s. The one order of magnitude difference in transmissivity estimated in VN compared to TR wells (about 2500 m2/day vs. about 125 m2/day) can be attributed to the higher degree of aquifer fracturing in the VN area, which contributes to the high rivers discharge increases.
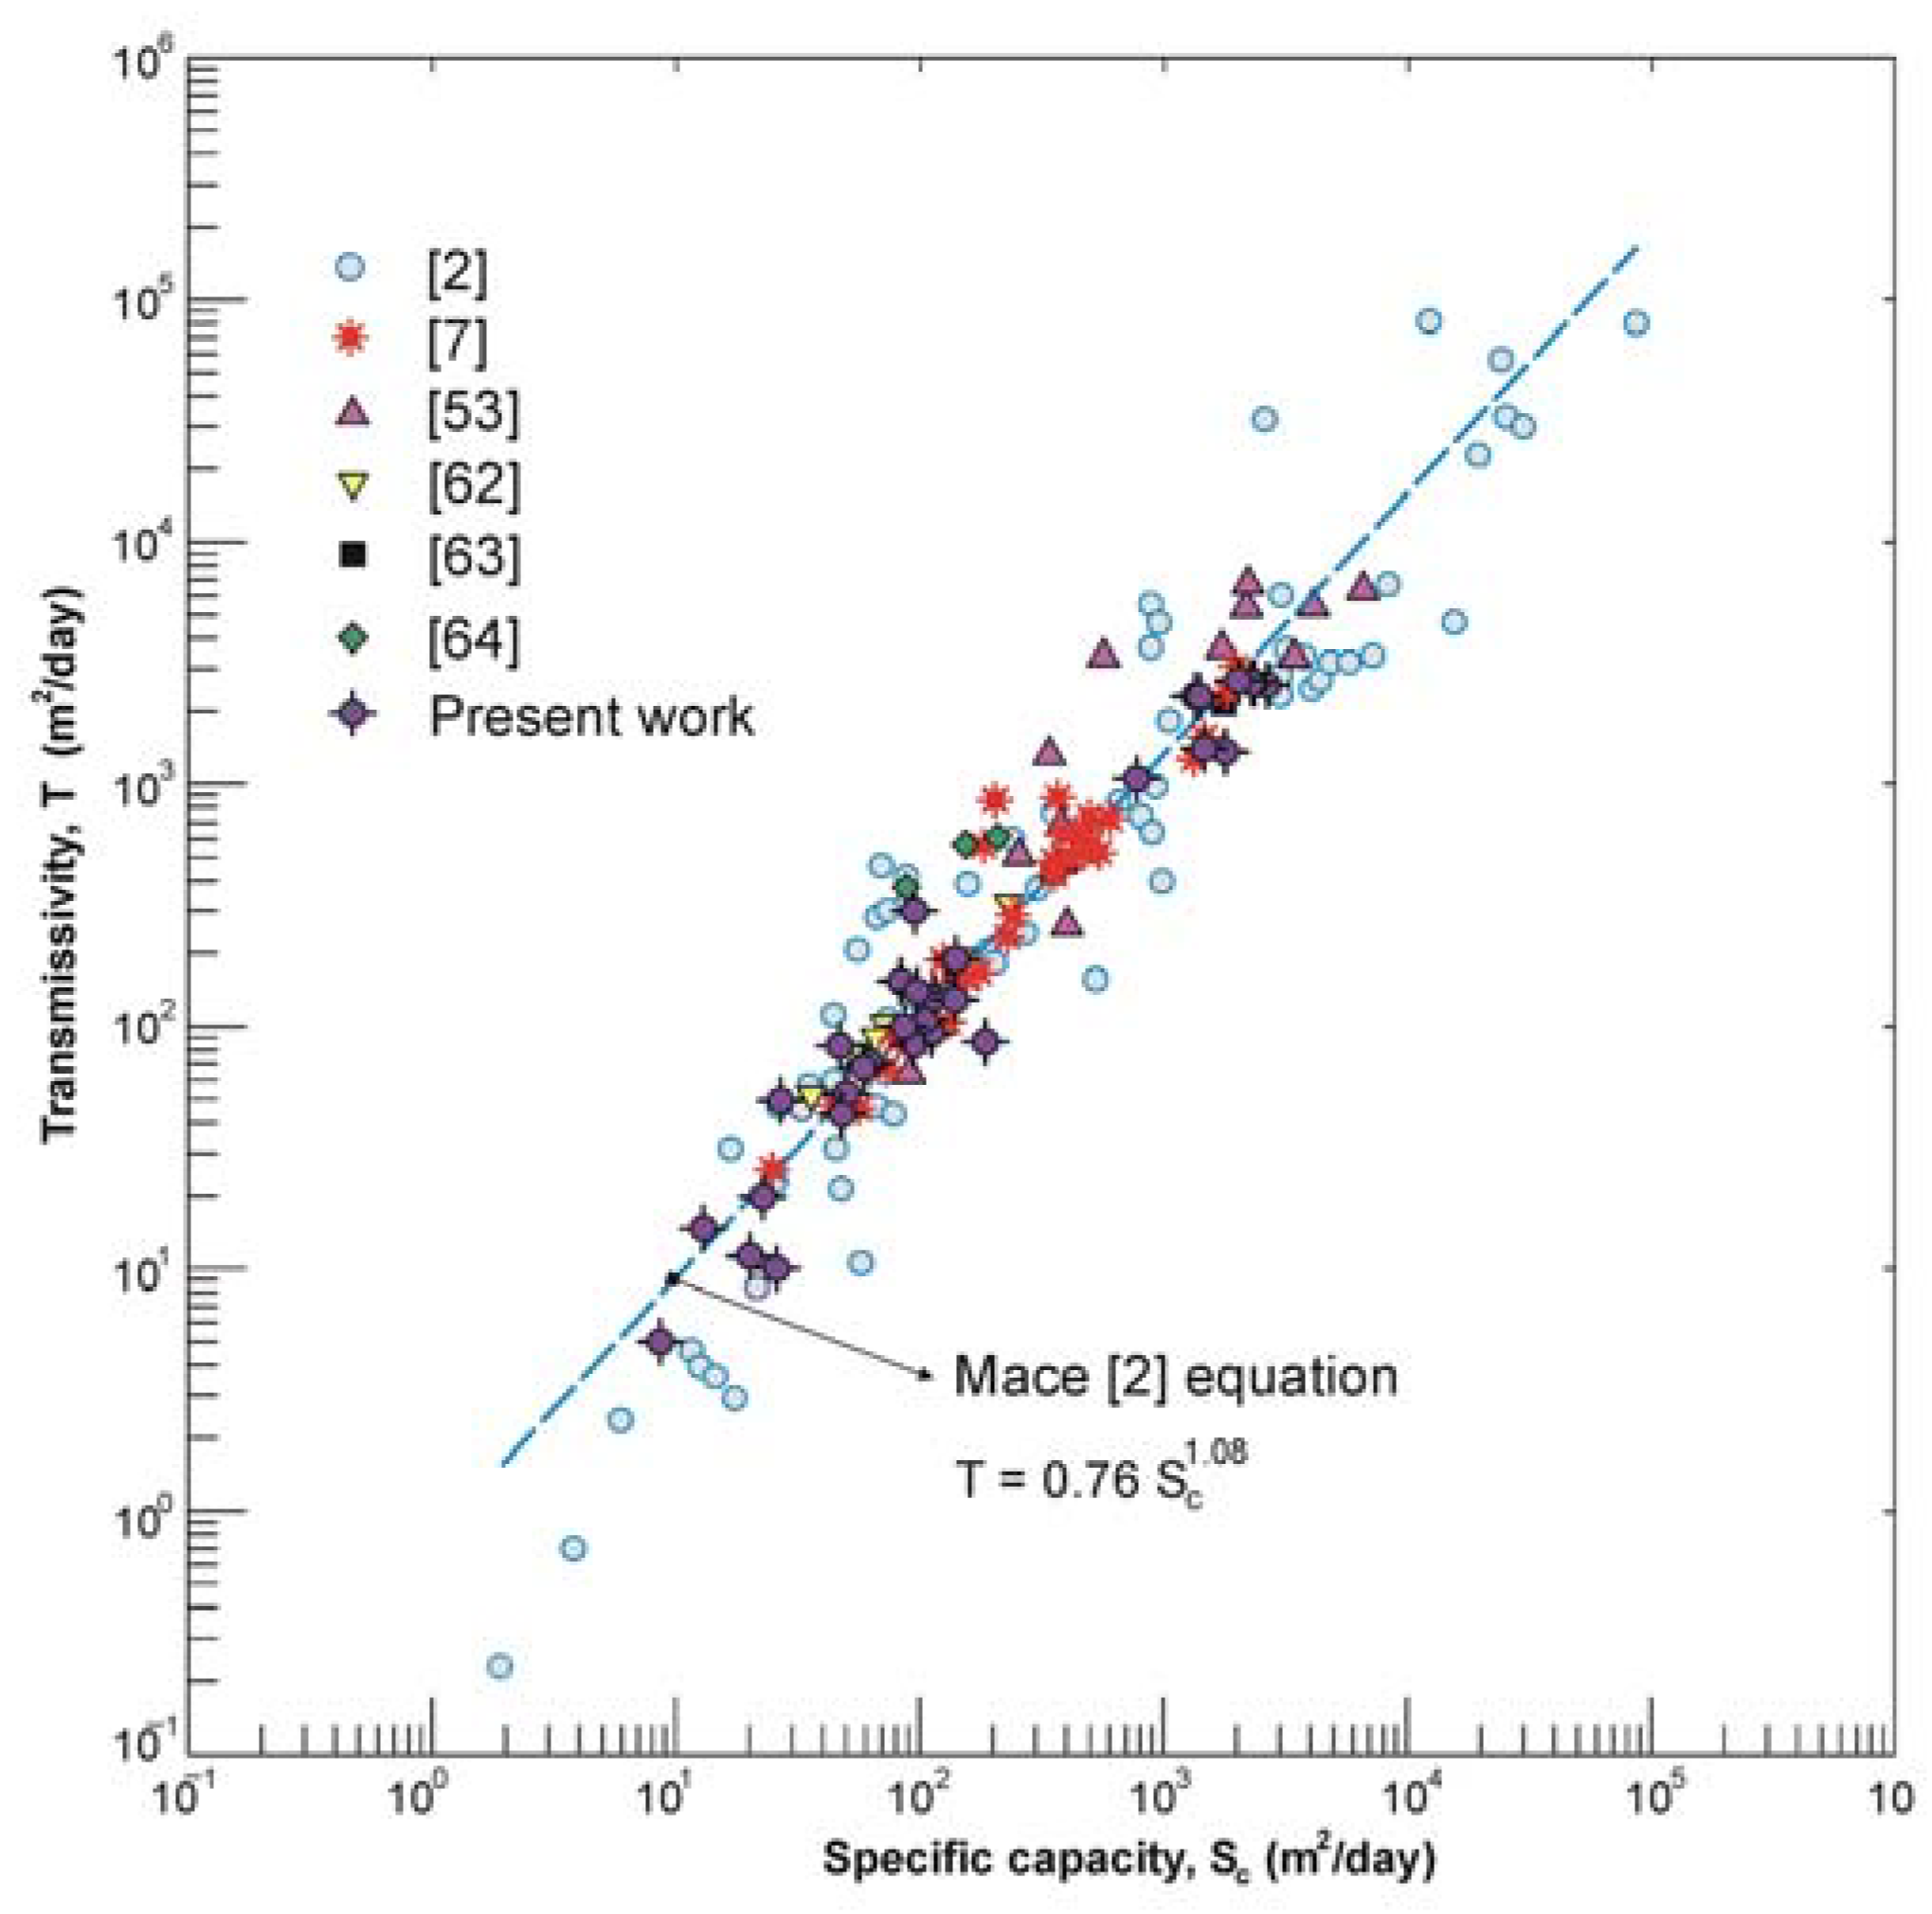
The comparison of T-Sc pairs coming from similar hydrogeological systems can help check the typical transmissivity ranges for carbonate aquifers, including their distribution. Figure 5 shows the distribution of a large T-Sc dataset (about 180 pairs) obtained on fractured karstified carbonate aquifers worldwide, which confirm the lognormal distribution. Figure 6 plots the T-Sc pairs available from the literature, highlighting that the data from carbonate aquifers in Central Italy agrees with those obtained on similar aquifers, falling on the Mace [2] relationships. As Mace [3] reported and observed in Figure 6, for Sc values lower than 10 m2/day, the relationship tends to overestimate the transmissivity values. Moreover, Sc values lower than 10 m2/day and higher than 3000 m2/day represent only 7% of the dataset, indicating that the aquifers having these values are few and the T estimates are less reliable. As expected, the Italian carbonates’ and β parameters Equation (7) differ from those found by [2]. The Absolute Mean Error (MAE) computed for the Mace equation is 154 m2/day while that for the specific equation for the Italian carbonates is 142 m2/day. However, it should be noted that the latter equation gives Relative Mean Absolute Error (RMAE) just slightly lower than the Mace one, i.e., 26.0% instead of 26.5%. This indicates that the Mace’s model [2] remains valid and applicable in similar geological environments. Results here obtained differ from that proposed by Verbovšek [16] for confined and unconfined dolomite aquifers, where the prediction accuracy was higher for the linear than for the log-transformed relationship.
5. Conclusions
The work presented and discussed a tool useful for the hydrogeological parameterization of carbonate aquifers, which is a very complex issue in mountain regions where pumping test data are scarce. The interpretation of available pumping tests highlighted porous media solutions’ applicability in most of the step-drawdown curves, except for wells located close to fault systems where double or triple porosity approaches are more appropriated, as emphasized by the derivative analysis.
T-Sc pairs of carbonate aquifers of central Italy are log-normally distributed, and transmissivity values range from about 10 to 2700 m2/day (pumping tests carried out during the last thirty years). A new empirical correlation for estimating T based on Sc values has been presented. The equation compared to that presented by Mace [2] shows the same log–log form but with different coefficients α and β. The development of specific equations for a certain geological environment, such that here presented, is recommended. Despite this, the Mace equation’s predictions—even if slightly less accurate—help to a regional characterization of fractured and karstified carbonates of different regions, especially when few data from pumping tests are available, or it is difficult to obtain them as tests are very dated. In conclusion, it is necessary to test and improve the proposed equations in other hydrogeologically similar areas. It should be noted that the results of the present work and those from previous studies confirm that a general equation can be used for a rough estimation of transmissivity values in carbonate aquifers of different kind. Pumping test analysis remains the most accurate tool for the estimation of the hydrogeological parameters, even if the development of empirical equations is necessary for data scarce areas.
Author Contributions
Conceptualization, L.D.M. and D.V.; methodology, L.D.M., D.V. and R.C.; formal analysis, L.D.M., D.V. and C.C.; investigation, L.D.M., D.V., CC. and R.C.; resources, L.D.M., D.V. and C.C.; data curation, L.D.M., D.V. and C.C.; writing—original draft preparation, L.D.M., D.V., C.C. and R.C.; writing—review and editing, L.D.M., D.V., C.C. and R.C. All authors have read and agreed to the published version of the manuscript.
Funding
This research received no external funding.
Institutional Review Board Statement
Not applicable.
Informed Consent Statement
Not applicable.
Data Availability Statement
Data used in the work are reported in Table 3.
Acknowledgments
The authors wish to thank the Umbria Region, Umbria Acque Company (Giacomo Schirò), and Servizio Idrico Integrato (Paolo Nunzi) for supporting the collection of pumping test data and technical information of wells. A special thanks to Gaetano Vacca for the fruitful cooperation with the Department of Physics and Geology in the study of water resources. We would like also to thank all the geologists who acquired the pumping test data.
Conflicts of Interest
The authors declare no conflict of interest.
References
- Richard, S.K.; Chesnaux, R.; Rouleau, A.; Coupe, R.H. Estimating the reliability of aquifer transmissivity values obtained from specific capacity tests: Examples from the Saguenay-Lac-Saint-Jean aquifers, Canada. Hydrol. Sci. J. 2016, 61, 173–185. [Google Scholar] [CrossRef]
- Mace, R.E. Determination of transmissivity from specific capacity tests in a karst aquifer. Groundwater 1997, 35, 738–742. [Google Scholar] [CrossRef]
- Mace, R.E. Estimating Transmissivity Using Specific-Capacity Data (Vol. 1). Bureau of Economic Geology, University of Texas at Austin, USA, 2001. Available online: https://www.researchgate.net/profile/Robert-Mace-2/publication/275832466_Estimating_transmissivity_using_specific-capacity_data/links/5547e45a0cf2b0cf7ace9684/Estimating-transmissivity-using-specific-capacity-data.pdf (accessed on 25 March 2021).
- Razack, M.; Huntley, D. Assessing transmissivity from specific capacity in a large and heterogeneous alluvial aquifer. Ground Water 1991, 29, 856–861. [Google Scholar] [CrossRef]
- Huntley, D.; Nommensen, R.; Steffey, D. The use of specific capacity to assess transmissivity in fractured-rock aquifers. Ground Water 1992, 30, 396–402. [Google Scholar] [CrossRef]
- El-Naqa, A. Estimation of transmissivity from specific capacity data in fractured carbonate rock aquifer, central Jordan. Environ. Geol. 1994, 23, 73–80. [Google Scholar] [CrossRef]
- Fabbri, P. Transmissivity in the geothermal Euganean Basin; a geostatistical analysis. Ground Water 1997, 35, 881–887. [Google Scholar] [CrossRef]
- Jalludin, M.; Razack, M. Assessment of hydraulic properties of sedimentary and volcanic aquifer systems under arid conditions in the Republic of Djibouti (Horn of Africa). Hydrogeol. J. 2004, 12, 159–170. [Google Scholar] [CrossRef]
- Hamm, S.Y.; Cheong, J.Y.; Jang, S.; Jung, C.Y.; Kim, B.S. Relationship between transmissivity and specific capacity in the volcanic aquifers of Jeju Island, Korea. J. Hydrol. 2005, 310, 111–121. [Google Scholar] [CrossRef]
- Al Farrah, N.; Van Camp, M.; Walraevens, K. Deducing transmissivity from specific capacity in the heterogeneous upper aquifer system of Jifarah Plain, NWLibya. J. Afr. Earth Sci. 2013, 85, 12–21. [Google Scholar] [CrossRef]
- Srivastav, S.K.; Lubczynski, M.W.; Biyani, A.K. Upscaling of transmissivity, derived from specific capacity: A hydrogeomorphological approach applied to the Doon Valley aquifer system in India. Hydrogeol. J. 2007, 15, 1251–1264. [Google Scholar] [CrossRef]
- Hsu, S.M.; Chou, P.Y. Applicability of method to estimate transmissivity based on yield-drawdown analysis in mountainous fractured-rock aquifers: A case study in Taiwan. Eng. Geol. 2019, 262, 105315. [Google Scholar] [CrossRef]
- Piscopo, V.; Formica, F.; Lana, L.; Lotti, F.; Pianese, L.; Trifuoggi, M. Relationship Between Aquifer Pumping Response and Quality of Water Extracted from Wells in an Active Hydrothermal System: The Case of the Island of Ischia (Southern Italy). Water 2020, 12, 2576. [Google Scholar] [CrossRef]
- Logan, J. Estimating transmissibility from routine production tests of water wells. Hydrogeol. J. 1964, 2, 35–37. [Google Scholar] [CrossRef]
- Ad Yalkar, P.G.; Mani, V.V.S. An attempt at estimating the transmissibilities of Trappean aquifers from specific capacity values. Hydrogeol. J. 1972, 17, 237–241. [Google Scholar] [CrossRef]
- Verbovšek, T. Estimation of transmissivity and hydraulic conductivity from specific capacity and specific capacity index in dolomite aquifers. J. Hydrol. Eng. 2008, 13, 817–823. [Google Scholar] [CrossRef]
- Motti, A.; Natali, N. La Storia Degli Open Data Geotematici del Servizio Geologico della Regione Umbria e la Definizione Della Rappresentatività Geologica. Technical Report Regione Umbria (Italy), Servizio Geologico. Available online: https://www.researchgate.net/publication/329339254_La_storia_degli_open_data_geotematici_del_Servizio_Geologico_della_Regione_Umbria_e_la_definizione_della_rappresentativita_geologica (accessed on 20 March 2021). (In Italian).
- Colacicchi, R.; Pialli, G. Dati a conferma di una lacuna dovuta ad emersione nel Giurese di Monte Cucco (Appennino Umbro). Boll. Soc. Geol. Ital. 1967, 86, 179–192. (In Italian) [Google Scholar]
- Barchi, M.; Lavecchia, G. Structural style of the Umbrie-Marches fold belt: Buckle folding or thrust ramping? In Proceedings of the 73° Congresso Nazionale della Società Geologica d’Italia, Roma, Italy, 29 September–4 October 1986. (In Italian). [Google Scholar]
- Freeze, R.A.; Cherry, J.A. Groundwater; Prentice-Hall: Englewood Cliffs, NJ, USA, 1979; p. 604. [Google Scholar]
- Boscherini, A.; Checcucci, R.; Natale, G.; Natali, N. Carta Idrogeologica della Regione Umbria (scala 1:100.000). Giornale di Geologia Applicata 2005, 2, 399–404. (In Italian) [Google Scholar] [CrossRef]
- Civita, M. Idrogeologia Applicata e Ambientale; Casa Editrice Ambrosiana: Milano, Italy, 2005; p. 800. (In Italian) [Google Scholar]
- Valigi, D.; Mastrorillo, L.; Barchi, M.R.; Cardellini, C.; Checcucci, R.; Di Matteo, L.; Frondini, F.; Mirabella, F.; Viaroli, S.; Vispi, I. Springs discharge variations induced by strong earthquakes: The Mw 6.5 Norcia event (Italy, 30 October 2016). Rend. Online Soc. Geol. Ital. 2019, 47, 141–146. [Google Scholar] [CrossRef]
- Di Matteo, L.; Dragoni, W.; Azzaro, S.; Pauselli, C.; Porreca, M.; Bellina, G.; Cardaci, W. Effects of earthquakes on the discharge of groundwater systems: The case of the 2016 seismic sequence in the Central Apennines, Italy. J. Hydrol. 2020, 583, 124509. [Google Scholar] [CrossRef]
- Viaroli, S.; Mirabella, F.; Mastrorillo, L.; Angelini, S.; Valigi, D. Fractured carbonate aquifers of Sibillini Mts. (Central Italy). J. Maps 2021, 17, 140–149. [Google Scholar] [CrossRef]
- Cambi, C.; Valigi, D.; Di Matteo, L. Hydrogeological study of data-scarce limestone massifs: The case of Gualdo Tadino and Monte Cucco structures (Central Apennines, Italy). Boll. di Geofis. Teor. ed Appl. 2010, 51, 345–360. [Google Scholar]
- Di Matteo, L.; Valigi, D.; Cambi, C. Climatic characterization and response of water resources to climate change in limestone areas: Considerations on the importance of geological setting. J. Hydrol. Eng. 2013, 18, 773–779. [Google Scholar] [CrossRef] [Green Version]
- Cambi, C.; Dragoni, W. Groundwater, Recharge Variability and Climatic Changes: Considerations Arising from the Modelling of a Spring in the Umbria-Marche Apennines. Hydrogéologie 2000, 4, 11–25. Available online: https://www.researchgate.net/profile/Walter-Dragoni/publication/233511654_Groundwater_yield_climatic_changes_and_recharge_variability_Considerations_out_of_the_modelling_of_a_spring_in_the_Umbria-Marche_Apennines/links/09e4150aa4773a6434000000/Groundwater-yield-climatic-changes-and-recharge-variability-Considerations-out-of-the-modelling-of-a-spring-in-the-Umbria-Marche-Apennines.pdf (accessed on 20 March 2021).
- Di Matteo, L.; Dragoni, W.; Valigi, D. Update on knowledge of water resources of Amelia Mountains (Central Italy). IJEGE 2009, 1, 83–96. [Google Scholar] [CrossRef]
- Mastrorillo, L.; Baldoni, T.; Banzato, F.; Boscherini, A.; Cascone, D.; Checcucci, R.; Petitta, M.; Boni, C. Quantitative hydrogeological analysis of the carbonate domain of the Umbria Region (Central Italy). IJEGE 2009, 1, 137–155. [Google Scholar] [CrossRef]
- Boni, C.; Baldoni, T.; Banzato, F.; Cascone, D.; Petitta, M. Hydrogeological study for identification, characterisation and management of groundwater resources in the Sibillini mountains national park (Central Italy). IJEGE 2010, 2, 21–39. [Google Scholar] [CrossRef]
- Basilici, G. Sedimentary facies in an extensional and deep-lacustrine depositional system: The Pliocene Tiberino Basin, Central Italy. Sediment. Geol. 1997, 109, 73–94. [Google Scholar] [CrossRef]
- Regione Umbria. Piano Ottimale Dell’utilizzazione delle Risorse Idriche Della REGIONE Umbria. Studi sulle Strutture Carbonatiche; Unpublished Technical Report of Assessorato Difesa del Suolo, Ambiente e Infrastrutture; Regione Umbria: Perugia, Italy, 1989. (In Italian) [Google Scholar]
- Dupuit, J. Mouvement de l’eau a travers le terrains permeables. C. R. Hebd. Seances Acad. 1857, 45, 92–96. [Google Scholar]
- Thiem, G. Hydrologische Methoden; Gebhardt: Leipzig, Germany, 1906. [Google Scholar]
- Theis, C.V. The relation between the lowering of the piezometric surface and the rate and duration of discharge of a well using groundwater storage. Eos 1935, 16, 519–524. [Google Scholar] [CrossRef]
- Cooper, H.H., Jr.; Jacob, C.E. A generalized graphical method for evaluating formation constants and summarizing well-field history. Am. Geophys. Union Trans. 1946, 27, 526–534. [Google Scholar] [CrossRef]
- Meier, P.M.; Carrera, J.; Sánchez-Vila, X. An evaluation of Jacob’s method for the interpretation of pumping tests in heterogeneous formations. Water Resour. Res. 1998, 34, 1011–1025. [Google Scholar] [CrossRef]
- Kruseman, G.P.; De Ridder, N.A. Analysis and Evaluation of Pumping Test Data; Publication 47; The International Institute for Land Reclamation and Improvement: Wageningen, The Netherlands, 1970; 370p. Available online: https://hwbdocuments.env.nm.gov/Los%20Alamos%20National%20Labs/General/31955.pdf (accessed on 28 March 2021).
- Fetter, C.W. Applied Hydrogeology; Waveland Press: Long Groove, IL, USA, 2000; 599p. [Google Scholar]
- Long, J.C.; Remer, J.S.; Wilson, C.R.; Witherspoon, P.A. Porous media equivalents for networks of discontinuous fractures. Water Resour. Res. 1982, 18, 645–658. [Google Scholar] [CrossRef] [Green Version]
- Anderson, M.P.; Woessner, W.W.; Hunt, R.J. Applied Groundwater Modeling: Simulation of Flow and Advective Transport; Academic Press Inc.: San Diego, CA, USA, 2015. [Google Scholar]
- Warren, J.E.; Root, P.J. The behavior of naturally fractured reservoirs. Soc. Pet. Eng. J. 1963, 3, 245–255. [Google Scholar] [CrossRef] [Green Version]
- Moench, A.F. Double-porosity models for a fissured groundwater reservoir with fracture skin. Water Resour. Res. 1984, 20, 831–846. [Google Scholar] [CrossRef]
- Escobar, F.H.; Saavedra, N.; Escorcia, G.; Polania, J. Pressure and pressure derivative analysis without type-curve matching for triple porosity reservoirs. In Proceedings of the SPE Asia Pacific Oil and Gas Conference and Exhibition, Perth, Australia, 18–20 October 2004. [Google Scholar] [CrossRef]
- Lancia, M.; Saroli, M.; Petitta, M. A double scale methodology to investigate flow in karst fractured media via numerical analysis: The Cassino plain case study (central Apennine, Italy). Geofluids 2018, 1–12. [Google Scholar] [CrossRef] [Green Version]
- Bourdet, D.; Whittle, T.; Douglas, A.; Picard, Y. A New Set of Types Curves Simplifies Well Test Analysis. World Oil 1983, 196, 95–106. Available online: https://blasingame.engr.tamu.edu/z_zCourse_Archive/P648_19A/P648_19A_Reading_Portfolio/World_Oil_(Bourdet)_Pressure_Derivative_Type_Curves_(OCR)_(pdf).pdf (accessed on 1 April 2021).
- Renard, P.; Glenz, D.; Mejias, M. Understanding diagnostic plots for well-test interpretation. Hydrogeol. J. 2009, 17, 589–600. [Google Scholar] [CrossRef] [Green Version]
- Ferroud, A.; Rafini, S.; Chesnaux, R. Using flow dimension sequences to interpret non-uniform aquifers with constant-rate pumping-tests: A review. J. Hydrol. 2019, 2, 100003. [Google Scholar] [CrossRef]
- Issaka, M.B.; Ambastha, A.K. A generalized pressure derivative analysis for composite reservoirs. J. Can. Pet. Technol. 1999, 38. [Google Scholar] [CrossRef]
- Jacob, C.E. Drawdown test to determine effective radius of artesian well. Trans. Am. Soc. Civ. Eng. 1947, 112, 1047–1064. [Google Scholar] [CrossRef]
- Eagon, H.B., Jr.; Johe, D.E. Practical solutions for pumping tests in carbonate-rock aquifers. Ground Water 1972, 10, 6–13. [Google Scholar] [CrossRef]
- Wolansky, R.M.; Corral, M.A. Aquifer Tests in West-Central Florida, 1952–1976; Water-Resources Investigations Report 84–4044; US Geological Survey: Orlando, FL, USA, 1984; 133p. Available online: https://pubs.usgs.gov/wri/1984/4044/report.pdf (accessed on 1 April 2021).
- Checcucci, R.; Dragoni, W.; Marchetti, G. Le risorse idriche strategiche in Umbria. Conoscenze e prospettive di utilizzo. Quaderni di Geologia Applicata 1999, 2, 4133–4142. (In Italian) [Google Scholar]
- Rorabaugh, M.I. Graphical and Theoretical Analysis of Step-Drawdown Test of Artesian Well. Proceedings of American Society of Civil Engineers, Minnesota International Hydraulics Convention, Minneapolis, MN, USA, 1–4 September 1953; Volume 79, pp. 1–23. [Google Scholar]
- Halford, K.J.; Weight, W.D.; Schreiber, R.P. Interpretation of transmissivity estimates from single-well pumping aquifer tests. Ground Water 2006, 44, 467–471. [Google Scholar] [CrossRef] [PubMed]
- Wang, L.; Xiang, Y.; Hu, J.; Li, T.; Cai, C.; Cai, J. Unsteady flow to a partially penetrating pumping well with wellbore storage in a dual-permeability confined aquifer. J. Hydrol. 2020, 591, 125345. [Google Scholar] [CrossRef]
- Boni, C.; Bono, P.; Capelli, G. Schema Idrogeologico dell’Italia Centrale. Mem. Soc. Geol. It. 1986, 35, 991–1012. Available online: https://www.idrogeologiaquantitativa.it/wordpress/wp-content/uploads/2009/11/Pubb_1986_Schema_Italia_Centrale.pdf (accessed on 1 April 2021). (In Italian).
- Cencetti, C.; Dragoni, W.; Nejad Massoum, M. Contributo alle conoscenze delle caratteristiche idrogeologiche del Fiume Nera (Appennino centro-settentrionale). Geol. Appl. Hidrogeol. 1989, 24, 191–210. [Google Scholar]
- Boni, C.; Preziosi, E. Una possibile simulazione numerica dell’acquifero basale di M. Coscerno—M.Aspra (Bacino del F. Nera). In Proceedings of the 3° Convegno Nazionale Giovani Ricercatori in Geologia Applicata, Potenza, Italy, 28–30 October 1993; Available online: https://www.idrogeologiaquantitativa.it/wordpress/wp-content/uploads/2009/11/Pubb_1993_M_Coscerno.pdf (accessed on 1 April 2021). (In Italian).
- Preziosi, E.; Romano, E. From a hydrostructural analysis to the mathematical modelling of regional aquifers (Central Italy). IJEGE 2009, 1, 183–198. [Google Scholar] [CrossRef]
- Olcott, P.G. Ground Water Atlas of the United States: Connecticut. Maine, Massachusetts, New Hampshire, New York, Rhode Island, Vermont: US Geological Survey Hydrologic Investigations Atlas HA–730M, 1995. Available online: https://pubs.usgs.gov/ha/ha730/ch_m/M-carbonate.html (accessed on 7 April 2021).
- Sardinha, J.; Carneiro, J.F.; Zarhloule, Y.; Barkaoui, A.; Correia, A.; Boughriba, M.; Rimi, A.; El Houadi, B. Structural and hydrogeological features of a Lias carbonate aquifer in the Triffa Plain, NE Morocco. J. Afr. Earth Sci. 2012, 73, 24–32. [Google Scholar] [CrossRef]
- Al-Dabbas, M.; Al-Kubaisi, Q.; Hussain, T.A.; Al-Qaraghuli, S. Hydrogeological characteristics of Dammam confined aquifer, West Razzaza Lake, Iraq. In IOP Conference Series: Materials Science and Engineering; IOP Publishing: Bristol, UK, 2020; Volume 737, p. 012162. [Google Scholar]
Figure 1.
Lithological map of the Umbria region (central Italy) with wells in fractured and karstified carbonate aquifers.
Figure 1.
Lithological map of the Umbria region (central Italy) with wells in fractured and karstified carbonate aquifers.

Figure 2.
Cooper-Jacob straight-line method on two pumping tests carried out in Maiolica and Scaglia-Maiolica aquifers. (a) Drawdown data recorded in an observation well during the first step-drawdown pumping test in MCUC1 well. (b) Drawdown data recorded in SUB well (first step-drawdown curve at low discharge Q = 0.005 m3/s).

Figure 3.
Diagnostic plot of drawdown monitored during unsteady state constant-rate pumping tests. (a) Data from piezometer of well TR5: double porosity model; (b) data of well MCAL2: triple porosity model.
Figure 3.
Diagnostic plot of drawdown monitored during unsteady state constant-rate pumping tests. (a) Data from piezometer of well TR5: double porosity model; (b) data of well MCAL2: triple porosity model.

Figure 4.
Relationship between specific capacity and transmissivity data for some carbonate aquifers in Italy. Data of Fabbri [7] are picked from [3] by using Engauge Digitizer free software.

Figure 5.
Frequency distribution (a,b) and Q-Q plots (c,d) of specific capacity and transmissivity of fractured and carbonate aquifers worldwide. Data are picked from Mace [3] by using Engauge Digitizer free software and are expressed as logarithm of the values.
Figure 5.
Frequency distribution (a,b) and Q-Q plots (c,d) of specific capacity and transmissivity of fractured and carbonate aquifers worldwide. Data are picked from Mace [3] by using Engauge Digitizer free software and are expressed as logarithm of the values.

Figure 6.
Specific capacity and transmissivity data of fractured and karstified aquifers worldwide based on [2,7,53,62,63,64]. When not available in publications, data have been picked from Mace [3] by using Engauge Digitizer free software.


Table 1.
Main characteristics of pumping wells in the fractured carbonate aquifer in the Umbria region. The location of wells is in Figure 1.
Table 1.
Main characteristics of pumping wells in the fractured carbonate aquifer in the Umbria region. The location of wells is in Figure 1.
| Name | Well Depth (m) | Hydrogeological Complex | Source |
|---|---|---|---|
| BOT1 | 200 | BL | Umbra Acque Company (ATI2 Umbria) |
| BOT2 | 200 | BL | Umbra Acque Company (ATI2 Umbria) |
| MCUC1 | 250 | MA | Umbria Region |
| MCUC2 | 200 | MA | Umbria Region |
| MIG1 | 85 | MA | Umbra Acque Company (ATI2 Umbria) |
| MIG2 | 102 | MA | Umbra Acque Company (ATI2 Umbria) |
| MIG3 | 109 | MA | Umbra Acque Company (ATI2 Umbria) |
| MIG4 | 105 | BL | Umbra Acque Company (ATI2 Umbria) |
| SUB | 445 | SC-MA | Umbra Acque Company (ATI2 Umbria) |
| MMAR1 | 429 | SC | Umbria Region |
| MMAR2 | 436 | MA | Umbria Region |
| MAM | 240 | MA | Umbra Acque Company (ATI2 Umbria) |
| SPL | 300 | BL | Present work |
| ACQ1 | 45 | TRA | Present work |
| ACQ2 | 60 | TRA | Present work |
| ACQ3 | 48 | TRA | Present work |
| VN2 | 140 | MA | Umbria Region |
| VN3 | 150 | MA | Umbria Region |
| TR1 | 300 | BL | SII (ATI4 Umbria) |
| TR2 | 300 | BL | SII (ATI4 Umbria) |
| TR3 | 300 | MA-CD | SII (ATI4 Umbria) |
| TR4 | 300 | MA | SII (ATI4 Umbria) |
| TR5 | 300 | CD-BL | SII (ATI4 Umbria) |
| TR6 | 300 | CD | SII (ATI4 Umbria) |
| MCAL1 | 280 | BL | Umbria Region |
| MCAL2 | 270 | BL | Umbria Region |
BL—Basal Limestones complex; CD—Calcari Diasprigni complex; MA—Maiolica complex; SC—Scaglia calcarea complex; TRA—Lithoid travertine complex. ATI—Ambito Territoriale Integrato; SII—Servizio Idrico Integrato.
Table 2.
Summary of empirical relationships between well specific capacity (Sc) and transmissivity (T) of fractured and karst aquifers. The unit of all equations is m2/day.
Table 2.
Summary of empirical relationships between well specific capacity (Sc) and transmissivity (T) of fractured and karst aquifers. The unit of all equations is m2/day.
| Author | Setting | Empirical Relationships | n. Data | Range of Application (m2/day) |
|---|---|---|---|---|
| Reference [52] * | Fractured carbonate (Northwestern Ohio aquifer, USA) | T = 3.24 Sc0.81 | - | 10–2000 |
| Reference [53] | Fractured/karstic carbonate (Floridan aquifer, USA) | T = 1.23 Sc1.05 | 14 | 100–100,000 |
| Reference [6] | Fractured carbonate (Amman-Wadi Sir aquifer, Jordan) | T = 1.81 Sc0.917 | 237 | 3–20,000 |
| Reference [2] | Fractured/karstic carbonate (Edwards aquifer, USA) | T = 0.76 Sc1.08 | 71 | 1–100,000 |
| Reference [7] | Fractured carbonate (Euganean basin, North-East Italy) | T = 0.85 Sc1.07 | 45 | 6–2500 |
* Johe relationship [52] was corrected for well loss.
Table 3.
Results of the pumping tests (PTs) with methods used for the interpretation. 1—Thiem–Dupuit method [34,35]; 2—Cooper and Jacob method [37]; 3—Warren and Root method [43]; 4—Escobar method [45].
| Name | PTs Type | Method of PTs Analysis | Sc (m2/day) | T (m2/day) |
|---|---|---|---|---|
| BOT1 | step-drawdown | 2 | 1800 | 1361 |
| BOT2 | step-drawdown | 2 | 1469 | 1400 |
| MCUC1 | step-drawdown | 2 | 86 | 100 |
| MCUC2 | step-drawdown | 2 | 9 | 5 |
| MIG1 | step-drawdown | 2 | 62 | 71 |
| MIG2 | step-drawdown | 2 | 115 | 132 |
| MIG3 | step-drawdown | 2 | 13 | 15 |
| MIG4 | step-drawdown | 2 | 59 | 67 |
| SUB | step-drawdown | 2 | 27 | 49 |
| MMAR1 | step-drawdown | 2 | 26 | 10 |
| MMAR2 | step-drawdown | 2 | 778 | 1050 |
| MAM | step-drawdown | 2 | 186 | 86 |
| SPL | constant-rate | 2 | 50 | 53 |
| ACQ1 | step-drawdown | 2 | 140 | 130 |
| ACQ2 | step-drawdown | 2 | 112 | 94 |
| ACQ3 | step-drawdown | 2 | 47 | 84 |
| VN2 | step-drawdown | 1 | 1350 | 2318 |
| VN2 | step-drawdown | 1 | 1412 | 2317 |
| VN3 | step-drawdown | 1 | 2667 | 2578 |
| VN3 | step-drawdown | 1 | 2373 | 2635 |
| VN3 | step-drawdown | 1 | 2304 | 2635 |
| VN3 | constant-rate | 1 | 2036 | 2693 |
| TR1 | step-drawdown | 2 | 94 | 84 |
| TR1 | constant-rate | 2 | 95 | 300 |
| TR2 | step-drawdown | 2 | 23 | 20 |
| TR2 | step-drawdown | 2 | 20 | 11 |
| TR3 | step-drawdown | 2 | 84 | 154 |
| TR4 | step-drawdown | 2 | 105 | 106 |
| TR5 | constant-rate | 3 | 97 | 140 |
| TR6 | constant-rate | 2 | 141 | 190 |
| MCAL1 | step-drawdown | 2 | 86 | 100 |
| MCAL2 | constant-rate | 4 | 48 | 43 |
Publisher’s Note: MDPI stays neutral with regard to jurisdictional claims in published maps and institutional affiliations. |
© 2021 by the authors. Licensee MDPI, Basel, Switzerland. This article is an open access article distributed under the terms and conditions of the Creative Commons Attribution (CC BY) license (https://creativecommons.org/licenses/by/4.0/).
Share and Cite
MDPI and ACS Style
Valigi, D.; Cambi, C.; Checcucci, R.; Di Matteo, L. Transmissivity Estimates by Specific Capacity Data of Some Fractured Italian Carbonate Aquifers. Water 2021, 13, 1374. https://0-doi-org.brum.beds.ac.uk/10.3390/w13101374
AMA Style
Valigi D, Cambi C, Checcucci R, Di Matteo L. Transmissivity Estimates by Specific Capacity Data of Some Fractured Italian Carbonate Aquifers. Water. 2021; 13(10):1374. https://0-doi-org.brum.beds.ac.uk/10.3390/w13101374
Chicago/Turabian StyleValigi, Daniela, Costanza Cambi, Roberto Checcucci, and Lucio Di Matteo. 2021. "Transmissivity Estimates by Specific Capacity Data of Some Fractured Italian Carbonate Aquifers" Water 13, no. 10: 1374. https://0-doi-org.brum.beds.ac.uk/10.3390/w13101374
Note that from the first issue of 2016, this journal uses article numbers instead of page numbers. See further details here.