Article

Analysis of the Spatiotemporal Annual Rainfall Variability in the Wadi Cheliff Basin (Algeria) over the Period 1970 to 2018

1
Faculty of Nature and Life Sciences, Laboratory of Water & Environment, University Hassiba Benboual of Chlef, Chlef 02180, Algeria
2
National Higher School of Agronomy, ENSA, Hassan Badi 16200, El Harrach, Algiers 16004, Algeria
3
National Research Council-Institute for Agricultural and Forest Systems in Mediterranean (CNR-ISAFOM), 87036 Rende, Italy
4
Department of Sanitary Engineering and Water Management, University of Agriculture in Krakow, Mickiewicza 24/28 Street, 30-059 Krakow, Poland
5
Department of Civil Engineering and NOAA-CREST, The City College of New York, New York, NY 10031, USA
6
Laboratory Management and Valorization of Agricultural and Aquatic Ecosystems, Morsli Abdellah Tipaza University Center, Oued Merzoug, Tipaza 42000, Algeria
*
Author to whom correspondence should be addressed.
Submission received: 2 May 2021 / Revised: 20 May 2021 / Accepted: 22 May 2021 / Published: 25 May 2021
(This article belongs to the Special Issue Hydrology in Water Resources Management)

Abstract

:
In the context of climate variability and hydrological extremes, especially in arid and semi-arid zones, the issue of natural risks and more particularly the risks related to rainfall is a topical subject in Algeria and worldwide. In this direction, the spatiotemporal variability of precipitation in the Wadi Cheliff basin (Algeria) has been evaluated by means of annual time series of precipitation observed on 150 rain gauges in the period 1970–2018. First, in order to identify the natural year-to-year variability of precipitation, for each series, the coefficient of variation (CV) has been evaluated and spatially distributed. Then, the precipitation trend at annual scale has been analyzed using two nonparametric tests. Finally, the presence of possible change points in the data has been investigated. The results showed an inverse spatial pattern between CV and the annual rainfall, with a spatial gradient between the southern and the northern sides of the basin. Results of the trend analysis evidenced a marked negative trend of the annual rainfall (22% of the rain gauges for a significant level equal to 95%) involving mainly the northern and the western-central area of the basin. Finally, possible change points have been identified between 1980 and 1985.

1. Introduction

The Mediterranean basin is climatically affected by the interaction between mid-latitude and tropical processes, being located in a transition zone between the arid climate of North Africa and the temperate and rainy climate of Europe. For this reason, it is considered a major hotspot of climate change, subject to strong warming and drying, with increasing consequences on spatial and temporal precipitation distribution [1]. Within this context, spatial and temporal precipitation analyses with different methodologies has been recently performed in the Mediterranean basin [2] and, especially, in Northern Africa [3]. The majority of these studies were principally based on non-parametric tests, which are better suited than parametric ones to deal with non-normally distributed data in hydrometeorology [4]. In particular, different results have been obtained between the eastern and western side of the region. In effect, the west-central part is characterized by a negative rainfall trend [5], albeit irregular and high variable across the decades. By contrast, the eastern side presents positive rainfall tendencies in some areas [6,7], and negative trends in others such as Israel [8,9]. In the Middle East and North Africa (MENA) region, which includes North Africa, Donat et al. [10] detected an opposite behavior in the period 1980–2010: a marked positive trend in the western side, and some consistent tendency toward dryer conditions in the eastern part. In the past years, several studies evidenced a negative rainfall trend in Northwest Africa [11,12]. For example, in the Maghreb region, Tramblay et al. [13] detected a strong negative trend in annual rainfall and number of wet days for the period 1950–2009. This trend behavior was more marked for Morocco and Western Algeria. In particular, in Algeria, average annual rainfall evidenced a decrease beginning around the second half of the 1970s [14]. This tendency has been forecast to continue over the 21st century [15,16] and to be particularly significant in semiarid areas.
Giorgi [17] demonstrated that this large decrease in average rainfall is coupled with an increase in rainfall variability, especially during the warm season. For this reason, besides rainfall trend, it is especially important to evaluate the inter-annual variability of rainfall, which has received little attention so far [18]. In fact, the inter-annual rainfall variability is a measure of the year-to-year variability in cumulative rainfall occurrences and allows us to identify years with rainfall abundance and years with rainfall scarcity. In order to evaluate the inter-annual rainfall variability, first the relative variability index has been proposed [19], but recently, the coefficient of variation (CV) has found wide application. Several authors evidenced an increase in inter-annual variability at global scale [16,20,21,22], but fewer studies have been performed at regional scales. For example, Gajbhiye et al. [23] analyzed CV in the Sindh river basin (India) for annual and seasonal (monsoon, post monsoon, summer and winter) rainfall events evidencing that the inter-annual variability of post monsoon rainfall is greater than that of the annual rainfall. Similar results have been obtained again in India, in the Jharkhand State [24]. He and Gautam [25] detected an increasing tendency of annual, winter and spring rainfall variabilities in California, which suggests an increasing frequency of precipitation extremes. Młyński et al. [26] detected that variability of annual extremes of precipitation in southern Poland is linked with types of cyclonic circulations. Thus, many studies evidenced that inter-annual variability of annual precipitation on many region of the World is visible and can be caused by climate change. The variability of precipitation can strongly influence water resources and thus the spatiotemporal occurrence of hydrological extremes like floods, droughts and water scarcity, and associated socioeconomic problems [27,28].
The aim of this paper was to study the spatiotemporal variability of annual rainfall in a semi-arid area by examining the annual precipitation across the Wadi Cheliff basin in Algeria. In particular, the spatial distribution of CV has been analyzed and a trend investigation on annual rainfall has been carried out using nonparametric tests. The study was performed on data recorded at 150 stations during an observation period of 49 years.

2. Methodology

CV is a statistical measure of the difference between the data points and the mean value of a series. Greater values of CV indicate larger variability and vice versa. The CV value for each series can be computed as follows:
CV = σ μ
where σ is the annual precipitation standard deviation and µ is the mean annual precipitation.
In order to analyze possible trend in annual rainfall series two non-parametric tests for trend detection have been used: the Theil-Sen (TS) estimator [29] for the evaluation of the slopes of the trends and the Mann–Kendall (MK) test [30,31] for assessment of the statistical significance. These estimators have been selected because they are not susceptible to the influence of extreme values and thus are more powerful than linear regression methods in trend slope evaluation in the presence of outliers in the series.
The first step in the calculation of the TS estimator is to evaluate the values of the gradient Qi, given N pairs of data:
Q i = x j x k j k f o r       i = 1 , , N
in which xj and xk are the data values at times j and k (with j > k), respectively.
If there is only one datum in each time period, then N = n(n − 1)/2, where n is the number of time periods. If there are multiple observations in one or more time periods, then N < n(n − 1)/2, where n is the total number of observations.
The TS estimator is then computed as the median Qmed of the N values of Qi, ranked from the smallest to the largest:
Q m e d = Q ( N + 1 / 2 ]                                               i f   N   i s   o d d Q N / 2 + Q N + 2 / 2 2               i f   N   i s   e v e n
The Qmed sign reveals the trend behaviour, while its value indicates the magnitude of the trend.
In order to evaluate the significance of the trend according to Mann-Kendall test, the statistic S must be first estimated as:
S = i = 1 d 1 j = i + 1 d s g n x j x i ;   w i t h       s g n x j x i = 1     i f     x j x i > 0 0     i f     x j x i = 0 1     i f     x j x i < 0
Here, xj and xi are the variable values in the years j and i (with j > i), respectively, and d is the dimension of the series.
Given independent and randomly ordered values, for the d > 10, the statistic S is distributed following a normal distribution with zero mean and variance:
V A R S = d d 1 2 d + 5 i = 1 m t i i i 1 2 i + 5 / 18
with ti a number of i-fold ties.
Finally, the standardized statistic ZMK can be computed as:
Z M K = S 1 V a r S f o r S > 0 0 f o r S = 0 S + 1 V a r S f o r S < 0
By applying a two-tailed test, for a specified significance level α, the statistical significance of the trend can be evaluated. In particular, in this work, the rainfall series have been examined for three different significance levels (SL) equal to 90%, 95% and 99%.
Finally, in order to detect possible change points in the annual rainfall series, a particular form of the nonparametric Mann–Whitney (MW) test, developed by Pettitt [32], was applied.

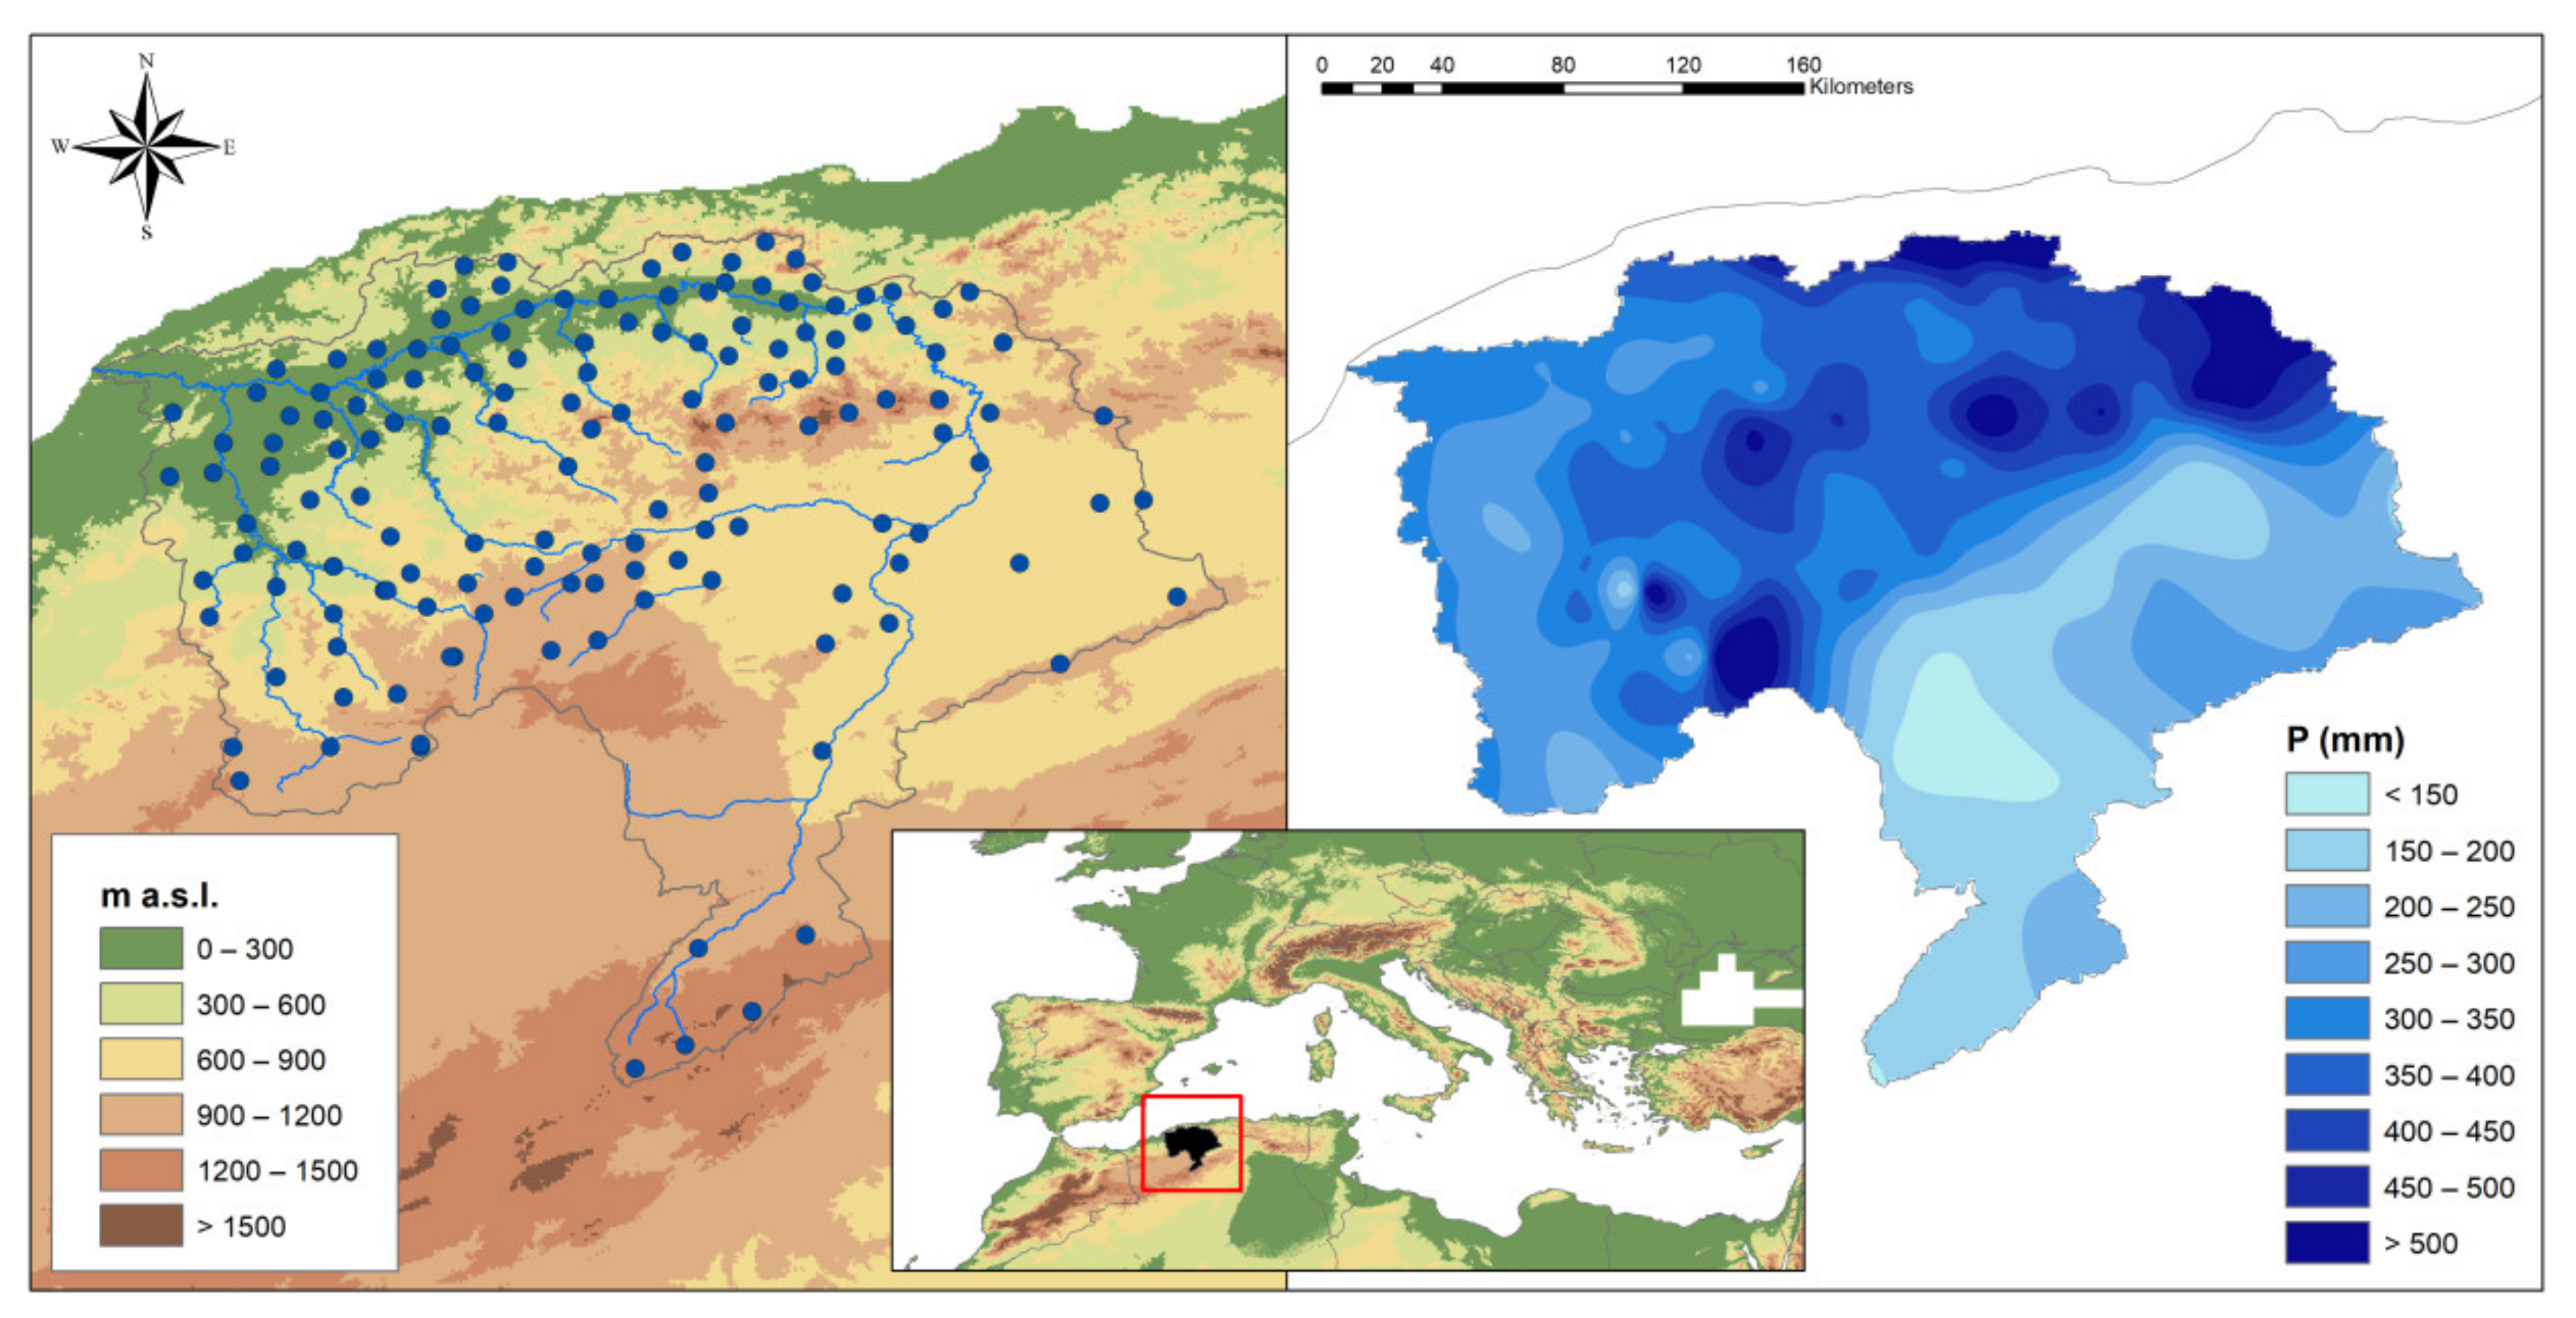
3. Study Area and Data

The Wadi Cheliff is the longest river in the country and plays a vital role in the socioeconomic development of the main regions in Algeria. The Wadi originates from the Saharan Atlas, near Aflou in the mountains of the Jebel Amour, and is approximately 750 km long (Figure 1).
The Wadi Cheliff Basin (WCB) covers an area of 43,750 km2 and lies between 0°7′44″ E to 3°31′7″ E and between 33°53′13″ N and 36°26′34″ N (Figure 1). The topography of the basin is complex and rugged. The altitude varies from −4 m to 1969 m. The tributaries distribute symmetrically from the south to the north along the main secondary wadis
Climatically, the region is arid and semi-arid. The mean annual temperature decrease gradually from the north to south with a minimum registered at Tissimsilt region (14.20 °C) and a maximum at Cheliff region (18.7 °C) [14]. The extreme maximum and minimum temperatures occur in July and January as 42 °C and −5 °C respectively. The mean annual precipitation is from 161 mm to 662 mm (1970–2018), 80% of which falls between November and March. For this study, datasets of 150 rainfall stations (Figure 1) with long-term monthly precipitation records from 1970 to 2018 across the WCB were taken from the National Agency of the Water Resources (ANRH). However, the period of the records for these stations varies and some have missing records, and thus, to improve data quality, only the observing stations with data series accounting for 70% or more of the overall period were chosen for our study. After excluding the stations with too many missing values, the double mass curve technique was used to analyze the remaining missing data. The data was subjected to quality control and data gap filling using the linear regression method. The period of study has been chosen to be 1970–2018, which is as long as possible depending on the availability of recorded data for majority of stations in the region.

4. Results and Discussion

In this work, first the CV has been evaluated and spatially distributed. Then, the precipitation trend at annual scale has been analyzed. Finally, the presence of possible change points in the data has been investigated.
Figure 2 shows the results of the inter-annual rainfall variability analysis performed through the CV. In particular, in the boxplot, the characterization of the average CV series is represented. The CV ranges between about 16.0% (minimum CV value) and 56.5% (maximum CV value), thus evidencing high variability that is typical of the Mediterranean basin [33]. This CV range is similar to the ones obtained in past studies performed in Eastern and Southern Africa, especially for the maximum values. In fact, a high inter-annual variability has been detected in north-eastern Kenya, with CV values higher than 55% [34]. Conversely, a belt along western Uganda, Rwanda, Burundi, Tanzania and northwest Zambia with moist climate conditions evinced CV values lower than 10%.
In addition to providing the characterization of the average CV values, the analysis of the spatial distribution of the CV values is paramount for understanding the risk of extreme events (Figure 2). Areas with higher inter-annual variability in rainfall are more susceptible to extreme events such as floods and droughts [35]. Results showed an inverse CV spatial pattern with respect to those observed for the annual rainfall, with a spatial gradient between the southern and the northern sides of the basin. Thus, the highest variability (CV values up to 56%) has been detected in the mountainous areas of the south side of the region, which also shows the lowest values of annual precipitation. Conversely, the northern areas of the basin, which show the highest precipitation, evidenced the lowest CV values. Both the CV and the annual rainfall spatial pattern maps were obtained with a spline algorithm.
The trend analysis has been performed at annual scale for the period 1970–2018 for three different significance levels (SL): 90%, 95% and 99% (Figure 3a). As a result, a prevalent negative rainfall trend has been evidenced. In fact, about 26.2% (SL = 90%), 16.8% (SL = 95%) and 7.4% (SL = 99%) of the rainfall series of the study area showed a negative trend. On the contrary, a positive rainfall trend has been detected in about 11.4%, 8.7% and 0.7% of the series, for a SL = 90%, 95% and 99%, respectively. This rainfall reduction at annual scale confirms the results obtained in other Mediterranean areas. e.g., [36], including in southern Italy [37,38,39,40] and in some regions of central Italy, such as Abruzzo [41] and Marche [42].
Spatially, for a SL = 95%, the negative trend mainly involved the northern and the western-central areas of the basin, with a maximum decrease in annual precipitation of more than 20 mm/10 years (Figure 4). On the contrary, a positive trend has been evidenced in the eastern side of the basin (>10 mm/10 years) and, particularly, in the southwestern area, with a maximum increase of more than 20 mm/10 years.
Finally, the identification of the shifts in annual precipitation observed in the Wadi Cheliff identified that the years 1982 (22% of the rain gauges), 1981 (14%) and 1983 (7%) can be considered the most probable change point years for the greatest number of stations (Figure 3b). By comparison, several studies, e.g., [43] that included earlier time periods identified change points in the decade 1960–1970.
As an example, in the Supplementary Material, Figure S1 shows the negative and the positive trend behavior, and the change point, for two of the most characteristic stations.
In order to better understand the rainfall behavior detected in this paper, it could be useful to refer to some climatic factors influencing rainfall. In fact, as evidenced by several authors, the Mediterranean rainfall regime is strongly linked to general atmospheric circulation patterns such as the El Niño Southern Oscillation (ENSO) [44], the Mediterranean Oscillation (MO) [45] and the Western Mediterranean Oscillation (WeMO) [34,46]. As regards Algeria, Meddi et al. [47] showed that the temporal variability of the annual precipitation in the west of the country is influenced by ENSO, while Tramblay et al. [13] evidenced that rainfall in North African countries such as Morocco, Algeria and Tunisia are mainly affected by the North Atlantic Oscillation (NAO). In particular, a predominant negative phase of the NAO occurred between 1940 and 1980, corresponding to a period when precipitation was above normal; it was followed by a predominant positive phase, which significantly contributed to the rainfall reduction observed from the beginning of the 1980s in the Mediterranean basin and, also, in Algeria. Similar results have been obtained by Singla et al. [48] who showed a decrease in rainfall in some regions of Morocco from the 1970s onwards and evidenced a strong relationship between rainfall and the NAO phases. In fact, a rainfall decrease is connected to a positive phase of the NAO, which occurrences increased in this century, and some studies forecasted a further increase in its occurrence in the future [49,50].
Differently from past studies analyzing rainfall trend in northern Africa, this study also focused on the identification of change points in the rainfall series, which in the past years has been mainly performed in central Africa. In particular, this study evidenced similar results with the ones obtained further south in West Africa, where studies have tended to identify change points in the 1980s, around the peak of the well-known severe Sahel drought [51,52,53].

5. Conclusions

With the aim to better understand the annual rainfall variability in a semi-arid area, in this paper 150 rainfall series of the Wadi Cheliff basin (Algeria) were analyzed. First, for each series, the year-to-year variability of precipitation has been studied through the coefficient of variation. Then, a trend analysis has been performed using two non-parametric tests. Finally, the presence of possible change points in the data has been investigated. The following main results were obtained:
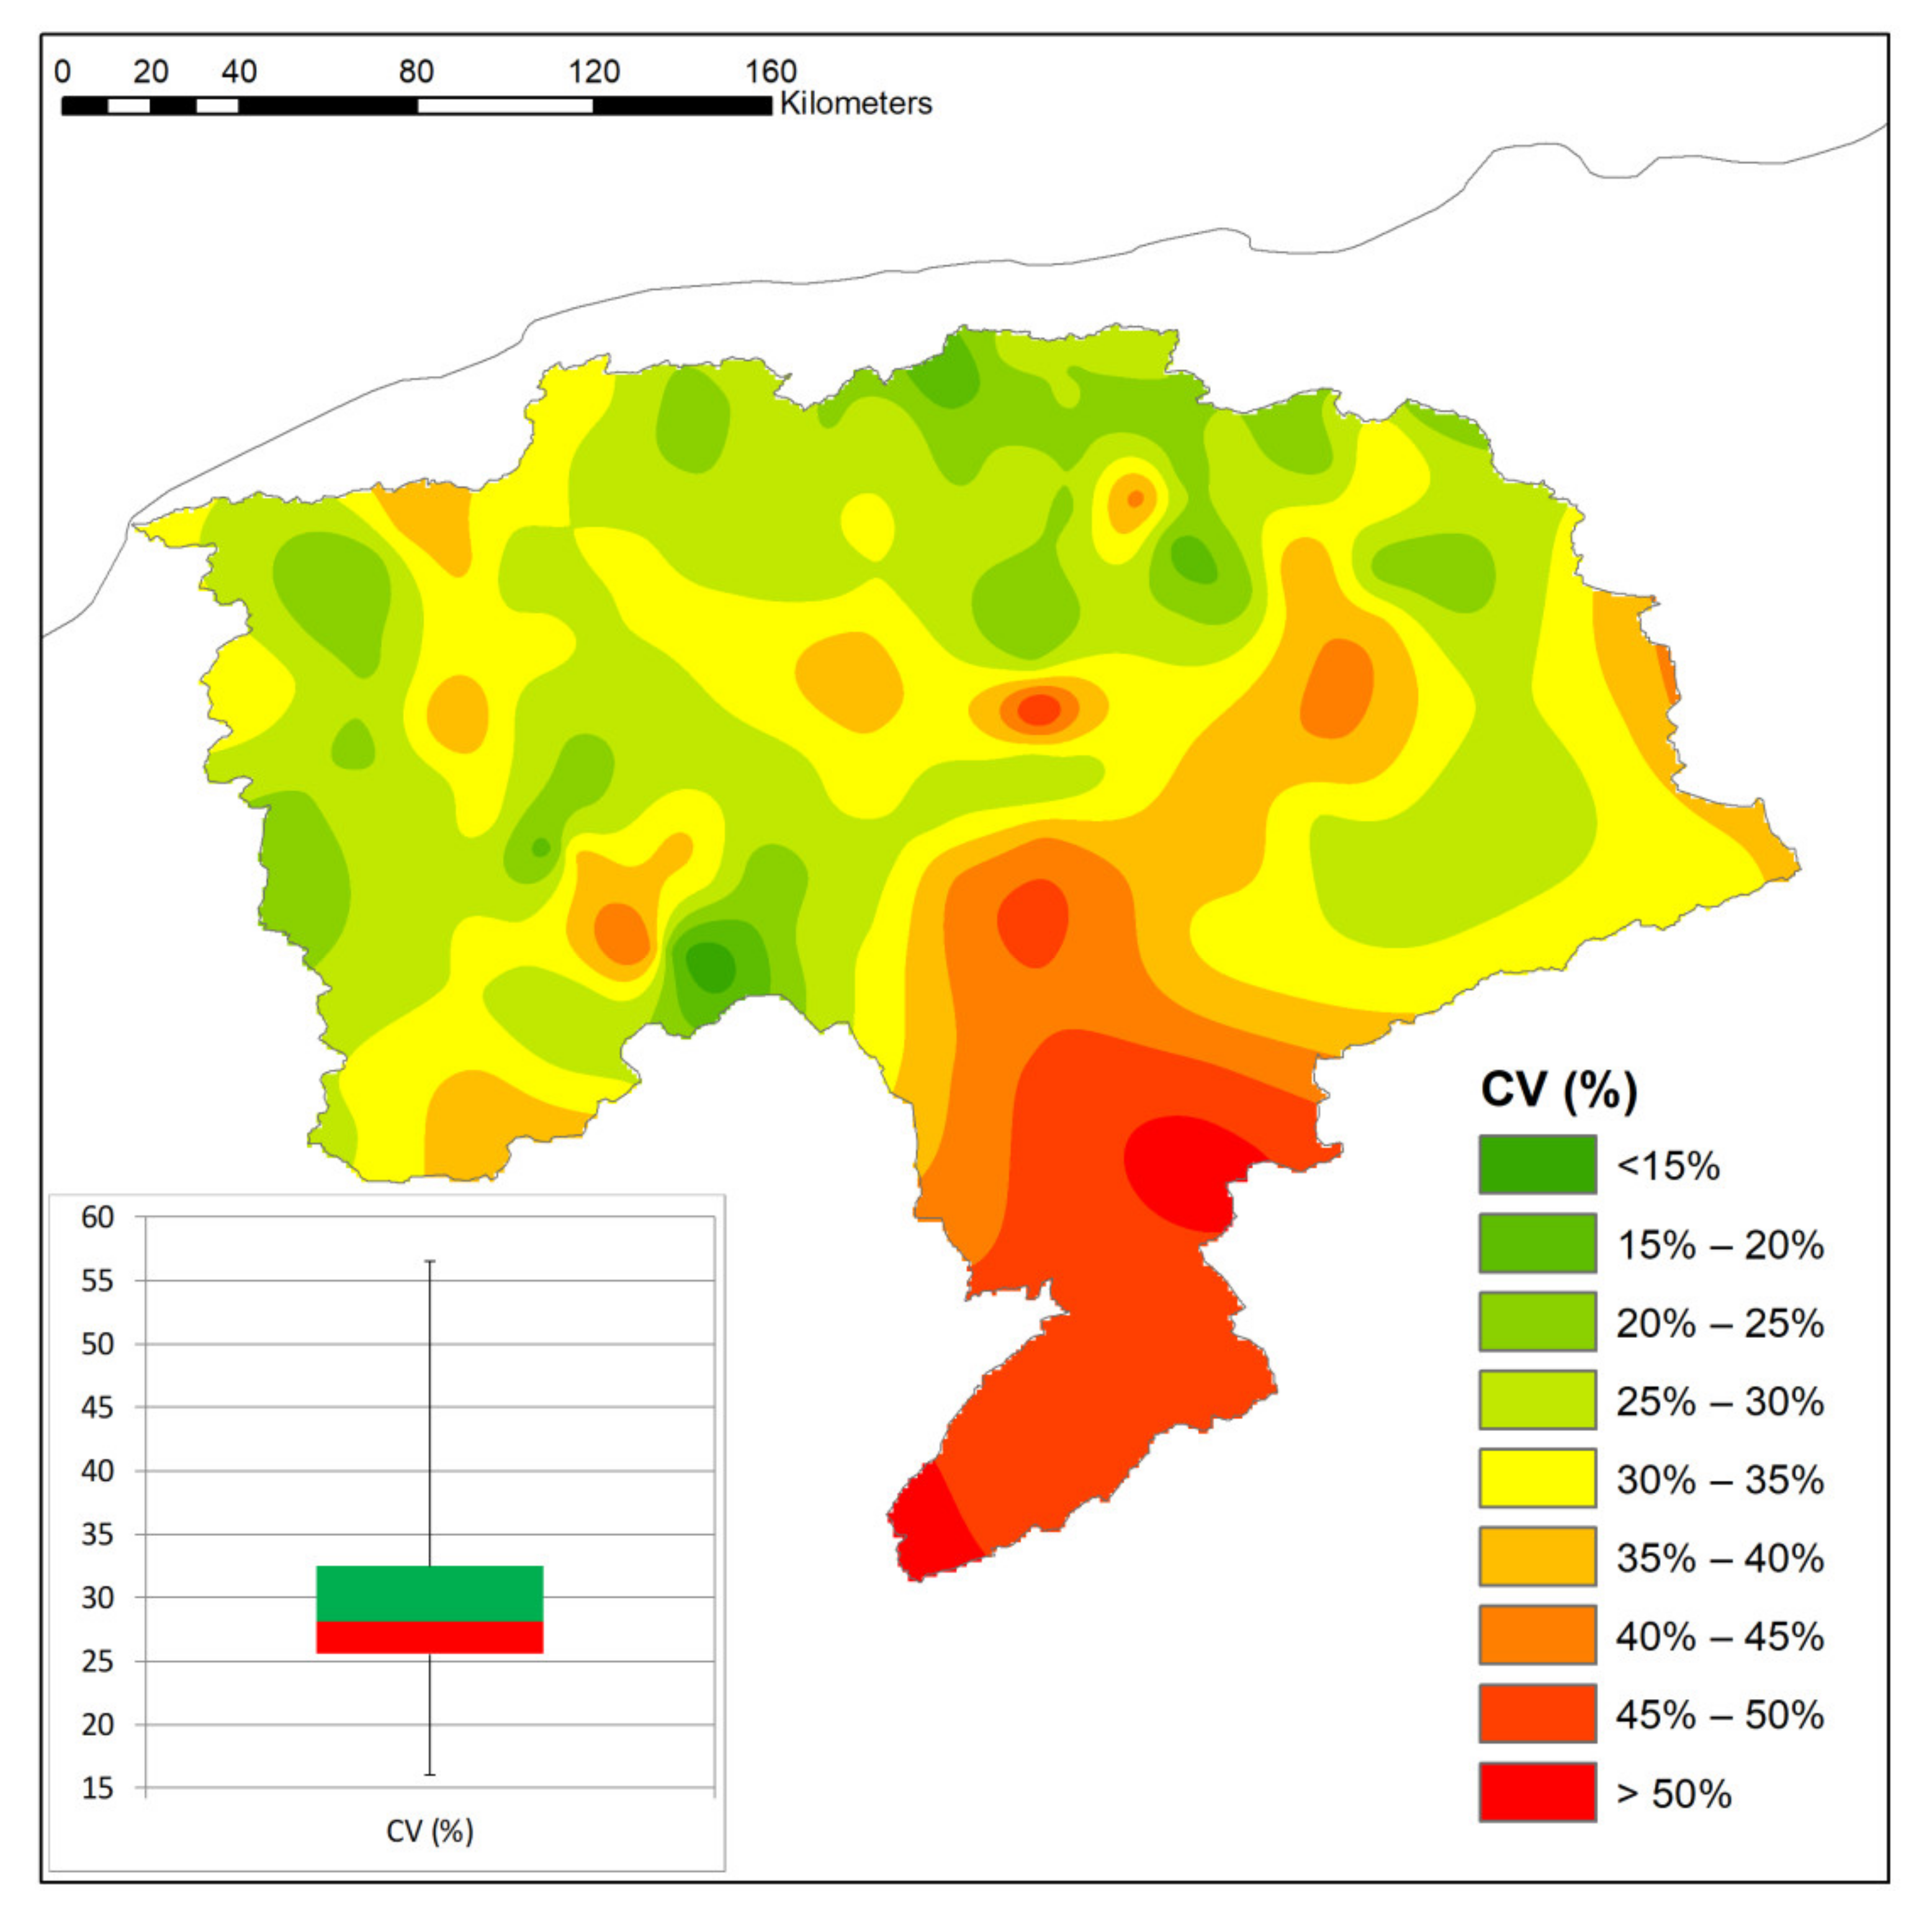
  • the CV range between about 16.0% and 56.5%, thus evidencing high variability typical of the Mediterranean basin;
  • a spatial gradient in the CV values between the southern and the northern sides of the basin has been identified, with the highest values detected in the mountainous areas of the south side of the region and the northern areas showing the lowest CV values;
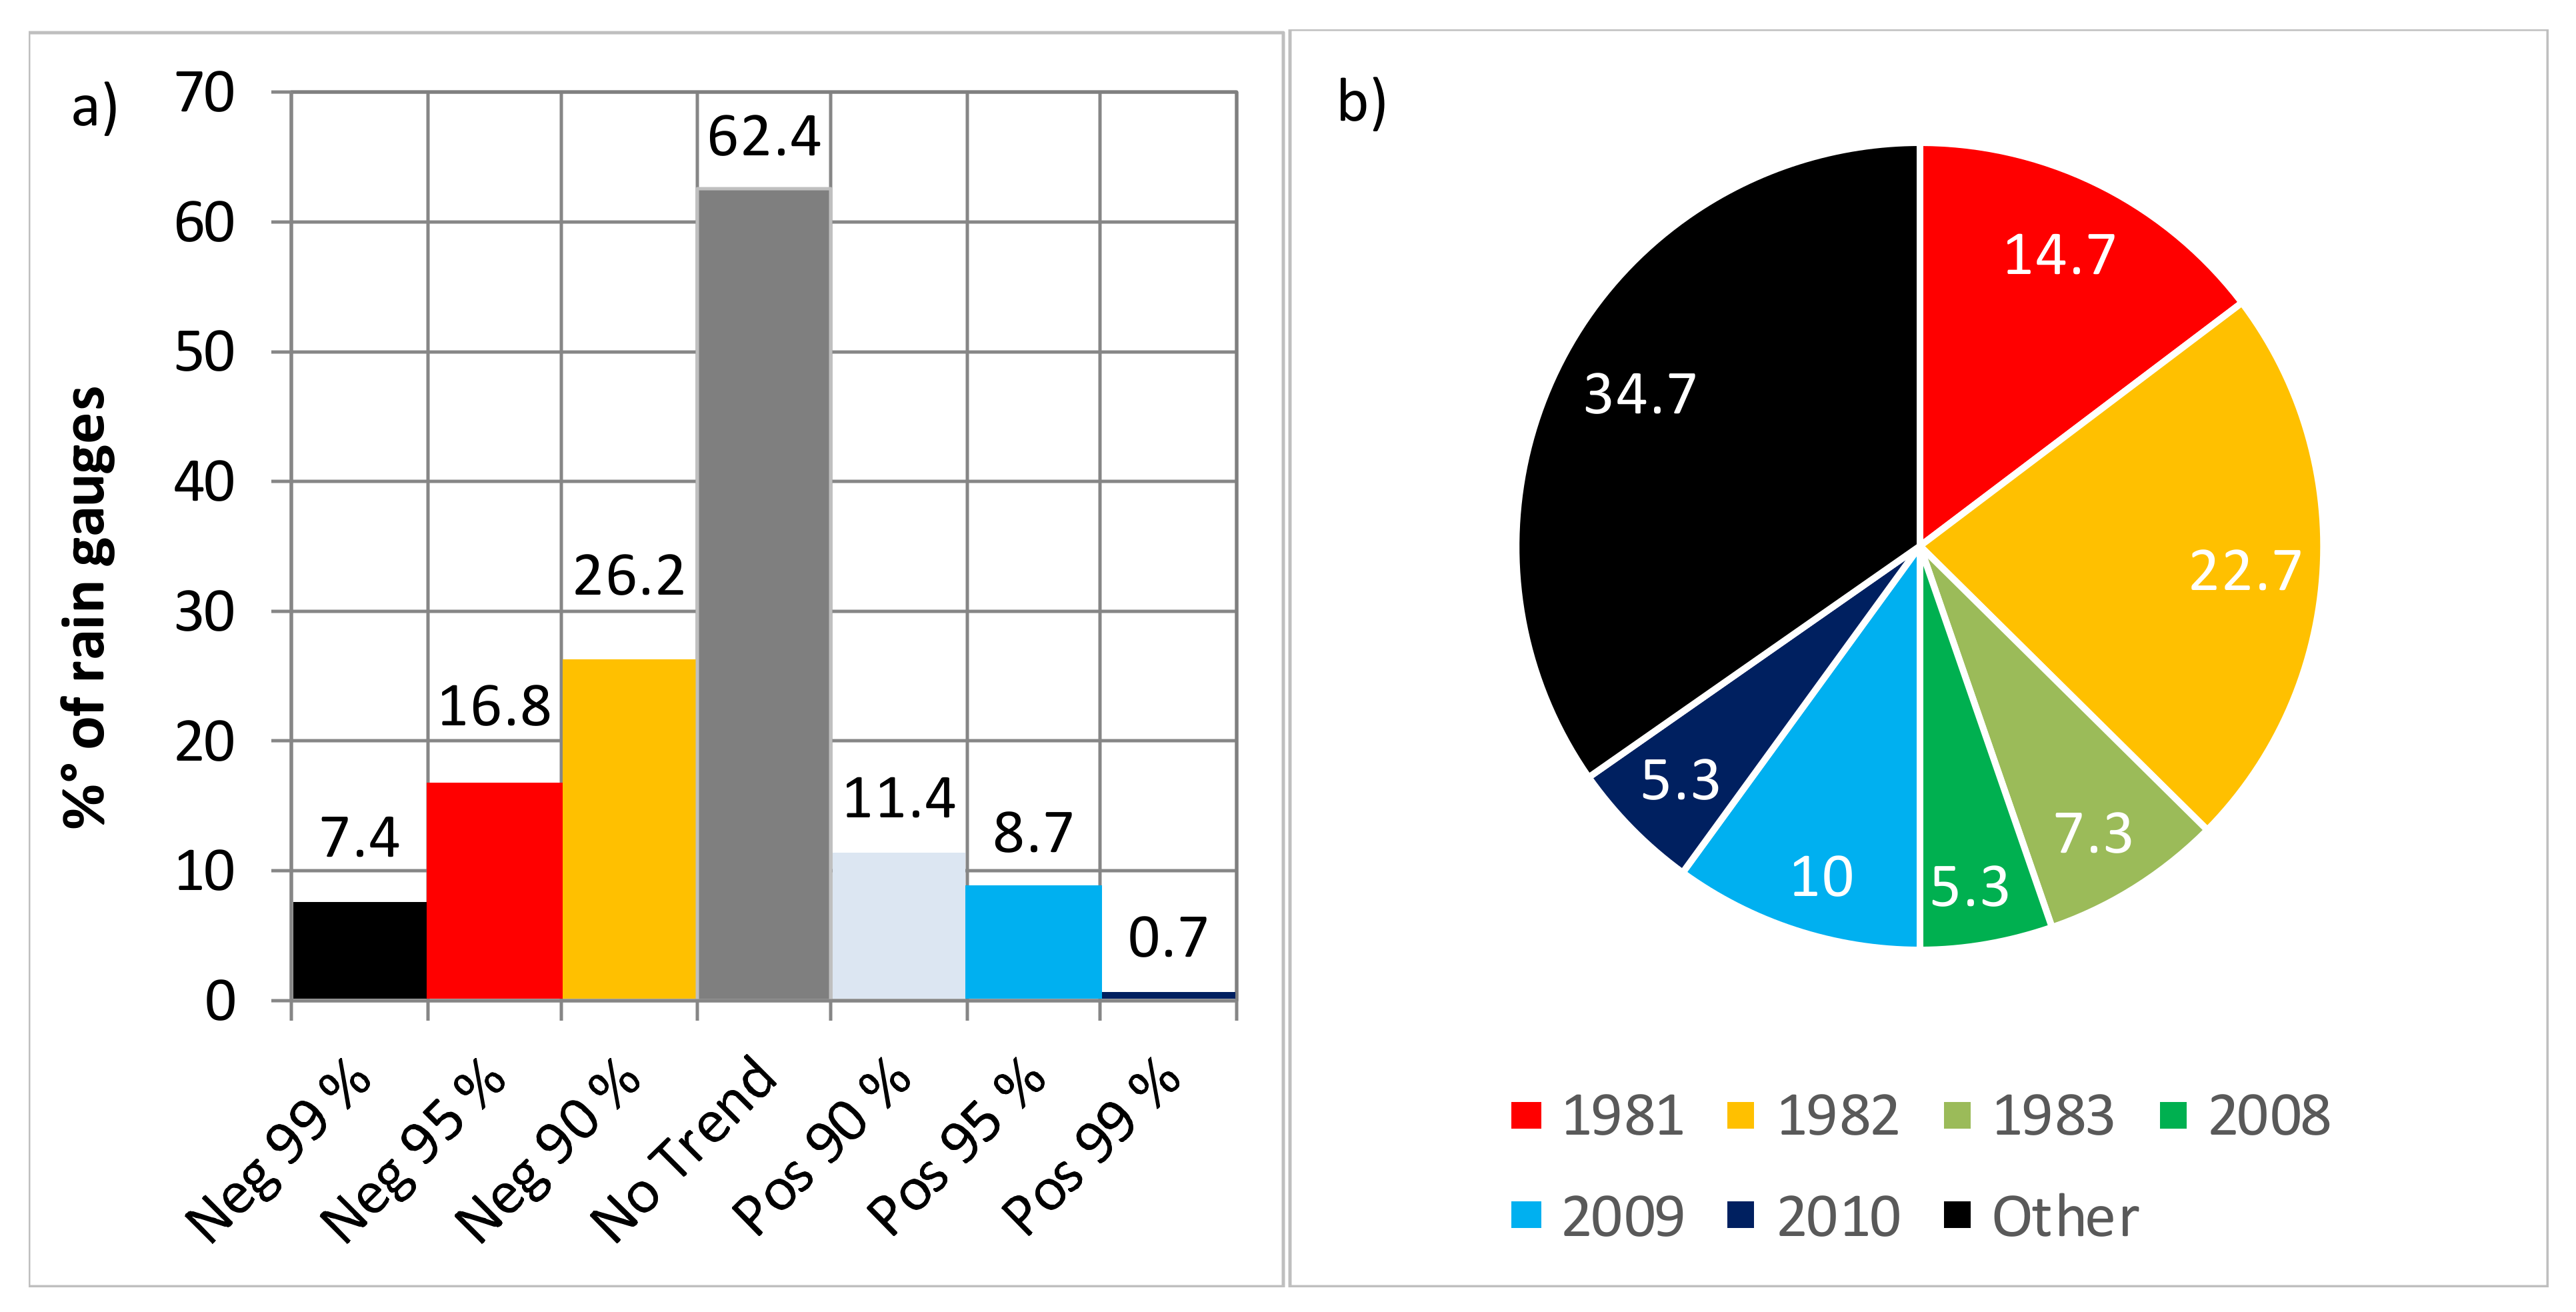
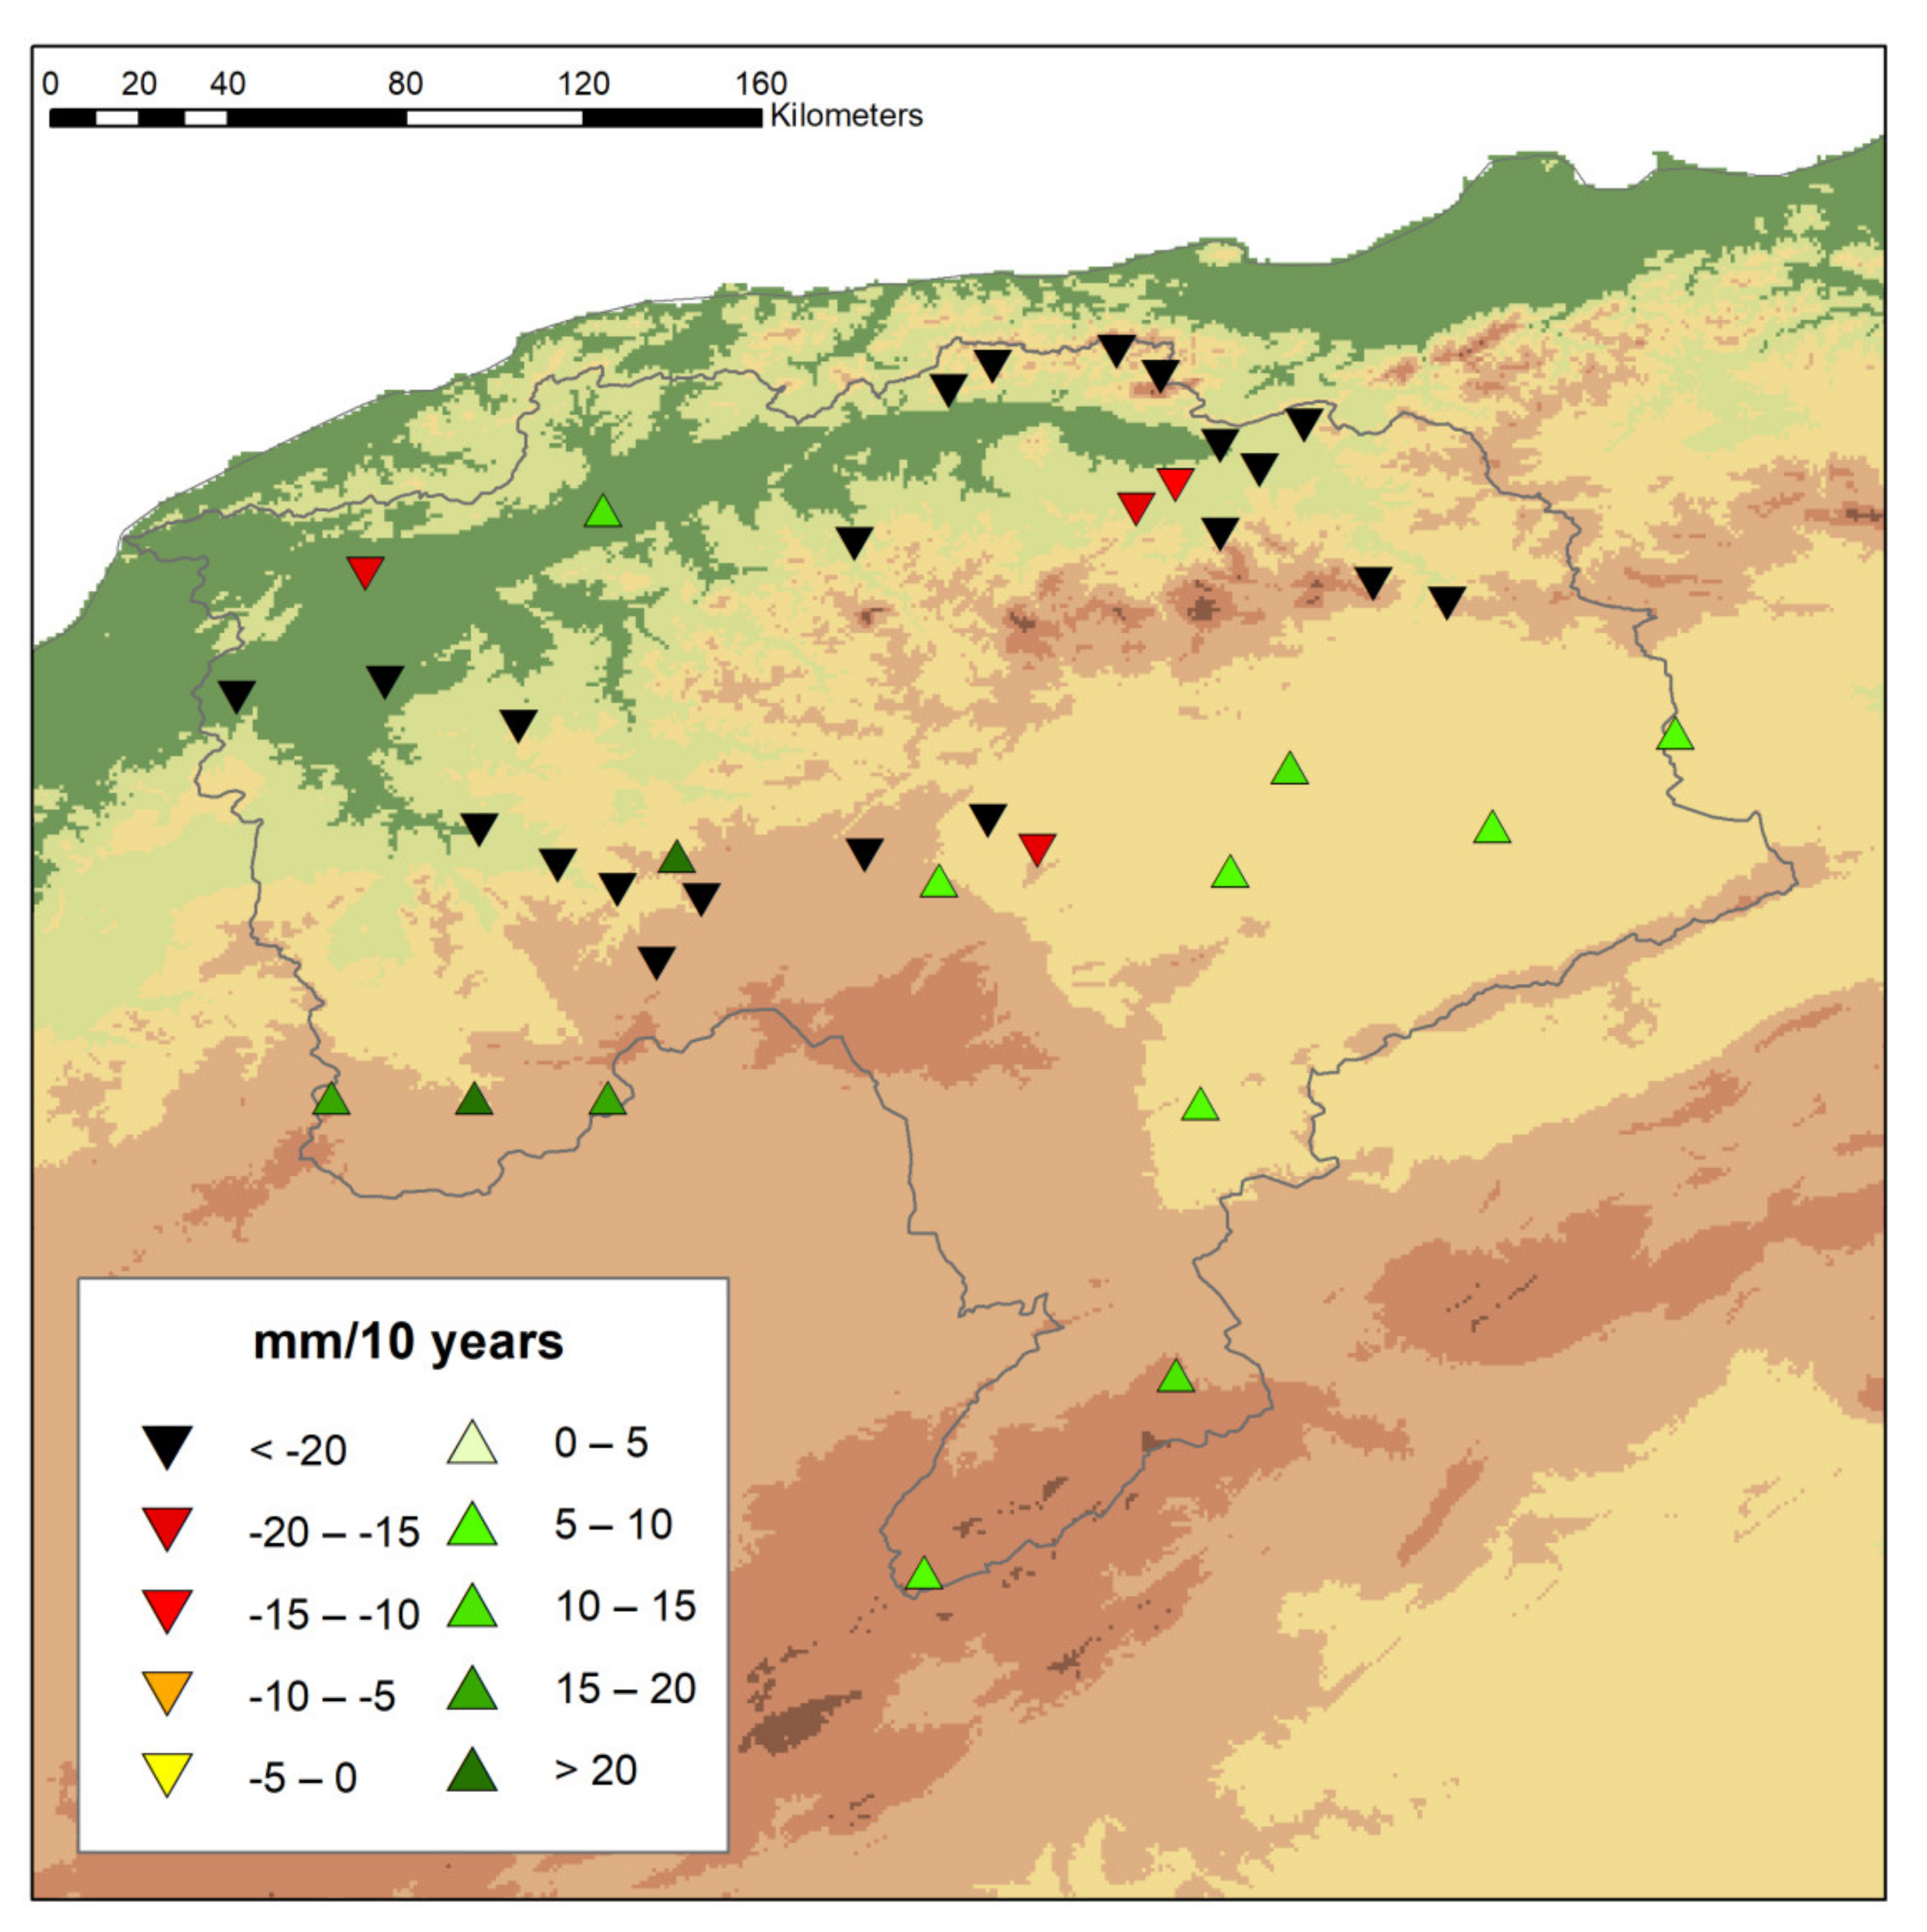
  • a general negative trend has been evidenced for the annual rainfall;
  • the negative trend mainly involved the northern and the western-central area of the basin while a positive trend has been evidenced in the eastern side of the basin;
  • the years 1981, 1982, and 1983 can be considered the most probable change point years for the largest number of stations in the basin.

Supplementary Materials

The following are available online at https://0-www-mdpi-com.brum.beds.ac.uk/article/10.3390/w13111477/s1: Figure S1. Example of negative and positive trends with change point (vertical orange line) for two characteristic stations.

Author Contributions

Conceptualization, M.A. and T.C.; methodology, M.A. and T.C.; software, M.A. and T.C.; validation, M.A. and T.C.; formal analysis, M.A., T.C. and A.W.; investigation, M.A., T.C., A.W., N.K. and T.H.; data curation, M.A.; writing—original draft preparation, T.C.; writing—review and editing, M.A., T.C., A.W. and N.K. and visualization, M.A. and T.C. All authors have read and agreed to the published version of the manuscript.

Funding

This research received no external funding. The APC was funded by MDPI Editor.

Institutional Review Board Statement

Not applicable.

Informed Consent Statement

Not applicable.

Data Availability Statement

The study did not report any data.

Conflicts of Interest

The authors declare no conflict of interest.

References

  1. IPCC. Summary for Policymakers. In Fifth Assessment Report of the Intergovernmental Panel on Climate Change; Cambridge University Press: Cambridge, UK, 2013. [Google Scholar]
  2. Caloiero, T.; Caloiero, P.; Frustaci, F. Long-term precipitation trend analysis in Europe and in the Mediterranean basin. Water Environ. J. 2018, 32, 433–445. [Google Scholar] [CrossRef]
  3. Zittis, G. Observed rainfall trends and precipitation uncertainty in the vicinity of the Mediterranean, Middle East and North Africa. Theor. Appl. Climatol. 2018, 134, 1207–1230. [Google Scholar] [CrossRef]
  4. Onyutha, C. Identification of sub–trends from hydro–meteorological series. Stoch. Environ. Res. Risk Assess. 2016, 30, 189–205. [Google Scholar] [CrossRef]
  5. Longobardi, A.; Villani, P. Trend analysis of annual and seasonal rainfall time series in the Mediterranean area. Int. J. Climatol. 2010, 30, 1538–1546. [Google Scholar] [CrossRef]
  6. Maheras, P.; Tolika, K.; Anagnostopoulou, C.; Vafiadis, M.; Patrikas, I.; Flocas, H. On the relationships between circulation types and changes in rainfall variability in Greece. Int. J. Climatol. 2001, 24, 1695–1712. [Google Scholar] [CrossRef]
  7. Altin, T.B.; Barak, B. Changes and trends in total yearly precipitation of the Antalya District, Turkey. Procedia Soc. Behav. Sci. 2014, 120, 586–599. [Google Scholar] [CrossRef] [Green Version]
  8. Shohami, D.; Dayan, U.; Morin, E. Warming and drying of the eastern Mediterranean: Additional evidence from trend analysis. J. Geophys. Res. 2011, 116, D22101. [Google Scholar] [CrossRef]
  9. Ziv, B.; Saaroni, H.; Pargament, R.; Harpaz, T.; Alpert, P. Trends in rainfall regime over Israel, 1975–2010, and their relationship to large-scale variability. Reg. Environ. Chang. 2014, 14, 1751–1764. [Google Scholar] [CrossRef]
  10. Donat, M.G.; Peterson, T.C.; Brunet, M.; King, A.D.; Almazroui, M.; Kolli, R.K.; Boucherf, D.; Al-Mulla, A.Y.; Nour, A.Y.; Aly, A.A.; et al. Changes in extreme temperature and precipitation in the Arab Region: Long-term trends and variability related to ENSO and NAO. Int. J. Climatol. 2014, 34, 581–592. [Google Scholar] [CrossRef]
  11. Meddi, M.; Hubert, P. Impact de la modification du régime pluviométrique sur les ressources en eau du Nord–Ouest de l’Algérie. In Hydrology of the Mediterranean and Semiarid Regions; Servat Najem, E., Leduc, W., Shakeel, E.A., Eds.; IAHS Publ.: Wallingford, UK, 2003; pp. 229–235. [Google Scholar]
  12. Goubanova, K.; Li, L. Extremes in temperature and precipitation around the Mediterranean basin in an ensemble of future climate scenario simulations. Glob. Planet. Chang. 2007, 57, 27–42. [Google Scholar] [CrossRef]
  13. Tramblay, Y.; El Adlouni, S.; Servat, E. Trends and variability in extreme precipitation indices over Maghreb countries. Nat. Hazards Earth Syst. Sci. 2013, 13, 3235–3248. [Google Scholar] [CrossRef] [Green Version]
  14. Elmeddahi, Y.; Issaadi, A.; Mahmoudi, H.; Tahar Abbes, M.; Goossen, M.F.A. Effect of climate change on water resources of the Algerian Middle Cheliff basin. Desalination Water Treat. 2014, 52, 2073–2081. [Google Scholar] [CrossRef]
  15. Ragab, R.; Prudhomme, C. Climate change and water resources management in arid and semi–arid regions: Prospective and challenges for the 21st Century. Biosyst. Eng. 2002, 81, 3–34. [Google Scholar] [CrossRef]
  16. Giorgi, F.; Lionello, P. Climate change projections for the Mediterranean region. Glob. Planet. Chang. 2008, 63, 90–104. [Google Scholar] [CrossRef]
  17. Giorgi, F. Climate change hot-spots. Geophys. Res. Lett. 2006, 33, L08707. [Google Scholar] [CrossRef]
  18. Longobardi, A.; Boulariah, O. Preliminary long term changes in inter–annual precipitation variability in a Mediterranean region. In Managing Water Resources for a Sustainable Future; Garrote, L., Tsakiris, G., Tsihrintzis, V., Vangelis, H., Tigkas, D., Eds.; EWRA Editorial Office: Athens, Greece, 2019; pp. 461–462. [Google Scholar]
  19. Conrad, V. The variability of precipitation. Mon. Weather Rev. 1941, 69, 5–11. [Google Scholar] [CrossRef]
  20. Giorgi, F.; Bi, X. Regional changes in surface climate interannual variability for the 21st century from ensembles of global model simulations. Geophys. Res. Lett. 2005, 32, L13701. [Google Scholar] [CrossRef]
  21. Pendergrass, A.G.; Knutti, R.; Lehner, F.; Deser, C.; Sanderson, B.M. Precipitation variability increases in a warmer climate. Sci. Rep. 2017, 7, 17966. [Google Scholar] [CrossRef] [Green Version]
  22. He, C.; Li, T. Does global warming amplify interannual climate variability? Clim. Dyn. 2019, 52, 2667–2684. [Google Scholar] [CrossRef]
  23. Gajbhiye, S.; Meshram, C.; Mirabbasi, R.; Sharma, S. Trend analysis of rainfall time series for Sindh river basin in India. Theor. Appl. Climatol. 2016, 125, 593–608. [Google Scholar] [CrossRef]
  24. Chandniha, S.K.; Meshram, S.G.; Adamowski, J.F.; Meshram, C. Trend analysis of precipitation in Jharkhand State, India. Theor. Appl. Climatol. 2017, 130, 261–274. [Google Scholar] [CrossRef]
  25. He, M.; Gautam, M. Variability and trends in precipitation, temperature and drought indices in the State of California. Hydrology 2016, 3, 14. [Google Scholar] [CrossRef] [Green Version]
  26. Młyński, D.; Cebulska, M.; Wałęga, A. Trends, Variability, and Seasonality of Maximum Annual Daily Precipitation in the Upper Vistula Basin, Poland. Atmosphere 2018, 9, 313. [Google Scholar] [CrossRef] [Green Version]
  27. Tian, W.; Liu, X.M.; Wang, K.W.; Bai, P.; Liang, K.; Liu, C.M. Evaluation of six precipitation products in the Mekong River Basin. Atmos. Res. 2021, 255, 105539. [Google Scholar] [CrossRef]
  28. Qi, B.Y.; Liu, H.H.; Zhao, S.F.; Liu, B.Y. Observed precipitation pattern changes and potential runoff generation capacity from 1961–2016 in the upper reaches of the Hanjiang River Basin, China. Atmos. Res. 2021, 254, 105392. [Google Scholar] [CrossRef]
  29. Sen, P.K. Estimates of the regression coefficient based on Kendall’s tau. J. Am. Stat. Assoc. 1968, 63, 1379–1389. [Google Scholar] [CrossRef]
  30. Mann, H.B. Nonparametric tests against trend. Econometrica 1945, 13, 245–259. [Google Scholar] [CrossRef]
  31. Kendall, M.G. Rank Correlation Methods; Hafner Publishing Company: New York, NY, USA, 1962. [Google Scholar]
  32. Pettitt, A.N. A non–parametric approach to the change point problem. Appl. Stat. 1979, 8, 126–135. [Google Scholar] [CrossRef]
  33. Insua-Costa, D.; Lemus-Canovas, M.; Miguez-Macho, G.; Llasat, M.C. Climatology and ranking of hazardous precipitation events in the western Mediterranean area. Atmos. Res. 2021, 255, 105521. [Google Scholar] [CrossRef]
  34. Muthoni, F.K.; Odongo, V.O.; Ochieng, J.; Mugalavai, E.M.; Mourice, S.K.; Hoesche-Zeledon, I.; Mwila, M.; Bekunda, M. Long-term spatial-temporal trends and variability of rainfall over Eastern and Southern Africa. Theor. Appl. Climatol. 2019, 137, 1869–1882. [Google Scholar] [CrossRef] [Green Version]
  35. Halifa-Martin, A.; Lorente-Plazas, R.; Pravia-Sarabia, E.; Montavez, J.P.; Jimenez-Guerrero, P. Atlantic and Mediterranean influence promoting an abrupt change in winter precipitation over the southern Iberian Peninsula. Atmos. Res. 2021, 253, 105485. [Google Scholar] [CrossRef]
  36. Del Rio, S.; Herrero, L.; Fraile, R.; Penas, A.P. Spatial distribution of recent rainfall trends in Spain (1961–2006). Int. J. Climatol. 2011, 31, 656–667. [Google Scholar]
  37. Coscarelli, R.; Gaudio, R.; Caloiero, T. Climatic trends: An investigation for a Calabrian basin (southern Italy). In The Basis of Civilization—Water Science? Rodda, J.C., Ubertini, L., Eds.; IAHS Publ.: Wallingford, UK, 2004; pp. 255–266. [Google Scholar]
  38. Longobardi, A.; Buttafuoco, G.; Caloiero, T.; Coscarelli, R. Spatial and temporal distribution of precipitation in a Mediterranean area (southern Italy). Environ. Earth Sci. 2016, 7, 189. [Google Scholar] [CrossRef]
  39. Caloiero, T.; Coscarelli, R.; Ferrari, E. Application of the innovative trend analysis method for the trend analysis of rainfall anomalies in southern Italy. Water Resour. Manag. 2018, 32, 4971–4983. [Google Scholar] [CrossRef]
  40. Caloiero, T.; Coscarelli, R.; Gaudio, R.; Leonardo, G.P. Precipitation trend and concentration in the Sardinia region. Theor. Appl. Climatol. 2019, 137, 297–307. [Google Scholar] [CrossRef]
  41. Scorzini, A.R.; Leopardi, M. Precipitation and temperature trends over central Italy (Abruzzo Region): 1951–2012. Theor. Appl. Climatol. 2019, 135, 959–977. [Google Scholar] [CrossRef]
  42. Gentilucci, M.; Barbieri, M.; Lee, H.S.; Zardi, D. Analysis of Rainfall Trends and Extreme Precipitation in the Middle Adriatic Side, Marche Region (Central Italy). Water 2019, 11, 1948. [Google Scholar] [CrossRef] [Green Version]
  43. Caloiero, T.; Coscarelli, R.; Ferrari, E.; Mancini, M. Trend detection of annual and seasonal rainfall in Calabria (southern Italy). Int. J. Climatol. 2011, 31, 44–56. [Google Scholar] [CrossRef]
  44. Lloyd-Hughes, B.; Saunders, M.A. Seasonal prediction of European spring precipitation from El Niño–Southern Oscillation and local sea surfaces temperatures. Int. J. Climatol. 2002, 22, 1–14. [Google Scholar] [CrossRef]
  45. Conte, M.; Giuffrida, A.; Tedesco, S. The Mediterranean Oscillation. Impact on Precipitation and Hydrology in Italy Climate Water; Publications of the Academy of Finland: Helsinki, Finland, 1989. [Google Scholar]
  46. Martín-Vide, J.; Lopez-Bustins, J.A. The Western Mediterranean Oscillation and rainfall in the Iberian Peninsula. Int. J. Climatol. 2006, 26, 1455–1475. [Google Scholar] [CrossRef]
  47. Meddi, M.; Assani, A.A.; Meddi, H. Temporal variability of annual rainfall in the Macta and Tafna catchments, northwestern Algeria. Water Resour. Manag. 2010, 24, 3817–3833. [Google Scholar] [CrossRef]
  48. Singla, S.; Mahe, G.; Dieulin, C.; Driouech, F.; Milano, M.; El Guelai, F.Z.; Ardoin-Bardin, S. Évolution des relations pluie-débit sur des bassins versants du Maroc. In Global Change: Facing Risks and Threats to Water Resources; Servat, E., Demuth, S., Dezetter, A., Daniell, T., Ferrari, E., Ijjaali, M., Jabrane, R., van Lanen, H.A.J., Huang, Y., Eds.; IAHS Publ.: Wallingford, UK, 2010; pp. 679–687. [Google Scholar]
  49. Schilling, J.; Freier, K.P.; Hertig, E.; Scheffran, J. Climate change, vulnerability and adaptation in North Africa with focus on Morocco. Agric. Ecosyst. Environ. 2012, 156, 12–26. [Google Scholar] [CrossRef]
  50. Mariotti, A.; Pan, Y.; Zeng, N.; Alessandri, A. Long–term climate change in the Mediterranean region in the midst of decadal variability. Clim. Dyn. 2015, 44, 1437–1456. [Google Scholar] [CrossRef]
  51. Sarr, M.A.; Zorome, M.; Seidou, O.; Bryant, C.R.; Gachon, P. Recent trends in selected extreme precipitation indices in Senegal-A changepoint approach. J. Hydrol. 2013, 505, 326–334. [Google Scholar] [CrossRef]
  52. Tarhule, A.; Tarhule-Lips, R.F.A. Discontinuities in precipitation series in the West African Sahel. Phys. Geogr. 2001, 22, 430–448. [Google Scholar] [CrossRef]
  53. De Longueville, F.; Hountondji, Y.C.; Kindo, I.; Gemenne, F.; Ozer, P. Long-Term Analysis of Rainfall and Temperature Data in Burkina Faso (1950–2013). Int. J. Climatol. 2016, 36, 4393–4405. [Google Scholar] [CrossRef]
Figure 1. Location of the selected 150 rain gauges on a DEM (left) and spatial distribution of the average annual precipitation (right).
Water 13 01477 g001
Figure 2. Spatial distribution of the CV and characterization of the CV through boxplot (Bottom and top of the box: first and third quartiles. Band inside the box: median. Ends of the whiskers: minimum and maximum values. Red color: values below the median. Green color: values above the median).
Water 13 01477 g002
Figure 3. Percentages of annual rainfall series presenting positive or negative significant trends (a) and most probable change point years (b).
Water 13 01477 g003
Figure 4. Spatial results of the trend analysis.
Water 13 01477 g004
Publisher’s Note: MDPI stays neutral with regard to jurisdictional claims in published maps and institutional affiliations.

