Article

Identifying Storm Hotspots and the Most Unsettled Areas in Barcelona by Analysing Significant Rainfall Episodes from 2013 to 2018

1
GAMA Team, Department of Applied Physics, University of Barcelona, 08028 Barcelona, Spain
2
Meteorological Service of Catalonia (Servei Meteorològic de Catalunya—SMC), 08029 Barcelona, Spain
3
Barcelona Cicle de l’Aigua S.A. (BCASA), 08038 Barcelona, Spain
*
Author to whom correspondence should be addressed.
Submission received: 20 May 2021 / Revised: 16 June 2021 / Accepted: 21 June 2021 / Published: 22 June 2021
(This article belongs to the Special Issue Management of Hydro-Meteorological Hazards)

Abstract

:
Urban floods repeatedly threaten Barcelona, damaging the city infrastructure and endangering the safety of the population. The urban planning of the city, the socioeconomic distribution, its topography, and the characteristics of precipitation systems translate into these flood events having a heterogeneous effect across the city. It means that the coping capacity has a strong dependence on local factors that must be considered when management plans are developed by the municipality. This work aims to contribute to the better knowledge of precipitation structures associated with heavy rainfall events and floods in Barcelona based on radar data and an urban rain gauge network. Radar data have been provided by the Meteorological Service of Catalonia (SMC), while precipitation data, impact data, and early warnings, have been provided by Barcelona Cicle de l’Aigua S.A. (BCASA), for the period 2013–2018. A new radar-based methodology has been developed to identify convective rainfall structures from radar reflectivity volumes (CAPPI and TOP products) to make the analysis easier. The high computing speed of the procedure allows efficient analysis of a large set of convective cells without scarifying temporal resolution of radar data. Both rainfall fields (radar and rain gauge, respectively) have been compared. Then through the identified rainfall convective structures, thunderstorm hotspots have been identified. Considering an alert indicator from BCASA and the reported incidents, episodes with the highest impact have been analysed in depth. Results show 207 significant rainfall episodes in the ROI for the six years, which are mainly concentrated between September and November. The fact that significant episodes are usually produced by highly convective rain corroborates the advantage of using radar images as a tool to detect any maxima even when no rain gauge is there. In 64 of the episodes, the level of pre-alert was achieved with a maximum frequency between August and September. The proposed algorithm shows more than 8000 centroids of convective cells from 189 cases. Whilst maximum surface reflectivity over 45 dBZ is more prone to occur near the coastline, the centroids of storm cells tend to concentrate more inland. The final objective is to improve the actions taken by the organisation responsible for managing urban floods, which have seen Barcelona recognised as a model city for flood resilience by the United Nations.

1. Introduction

Hydrometeorological hazards especially affect the Mediterranean basin, where heavy rainfalls play an important role and usually produce flash floods, surface floods and urban floods. Most of the floods are concentrated inside a geographical belt that runs from the western Mediterranean to the Black Sea [1]. In Catalonia (NE of the Iberian Peninsula, and NW of the Mediterranean Basin), floods are the most damaging natural hazard [2], with a mean rate of over eight flood episodes per year [3]. During the 1981–2015 period, more than 250 cases were identified, most of them near the coastline [3,4,5]. As a result, the Spanish Insurance Compensation Consortium (in Spanish, Consorcio de Compensación de Seguros—CCS) paid out over 450 million euros between 1996 and 2015. Furthermore, other private insurance expenses must be added. Highly convective and very localised precipitation is responsible for 70% of the flood episodes along the Catalan coast [6,7], affecting the most densely populated Catalan counties in one out of three cases.
According to the flood classification in Barrera et al. [8], Llasat et al. [9] showed that 36% of the floods (including flash floods, riverine floods, surface water floods, and urban floods) recorded in Catalonia between 1982 and 2010 were ordinary (no damages or minor ones), 53% were extraordinary (moderate damages) and 11% were catastrophic (major damages). There is no significant trend related to catastrophic floods in Catalonia, but the number of extraordinary floods has increased in recent years [3,8,9,10]. Explaining this trend requires considering not only hydrometeorological hazards but also vulnerability, exposure and coping capacity [11,12,13,14]. Still, recent studies point towards an increase in flood risk but more to an increase in the associated socioeconomic impact [15]. Strong social commitment and sustainable efforts are needed to increase flood prevention and resilience [16]. This can only be achieved through better empowerment and co-responsibility at every level, based on improved knowledge of prevention and forecasting [17].
A study on regions in the United States by Naylor and Sexton [18] concluded that the urbanisation of metropolitan areas may have changed the location of convective storm cells and precipitation fields. In the Mediterranean region, there is a significant interaction between urbanisation and convective precipitation, as most floods are caused by very heavy and local precipitation in urbanised areas [7]. The topographic characteristics of the Mediterranean region, in combination with its geographical location and the presence of a warm sea, mean that hazardous convective systems can develop, or unsettled Atlantic perturbations can be strengthened [19]. Rigo and Llasat [20] determined that Mesoscale Convective Systems (MCS) and large multicellular systems are the most common structures responsible for the most significant rainfall episodes in Catalonia. On the contrary, isolated convection or small multicellular systems can produce heavy, localised rainfall that can potentially cause flash floods (in short and torrential streams) and urban floods [7]. To be managed as well as possible, good meteorological forecasts and primary warning systems are required. Numerical weather predictions are usually not accurate enough for such small scales with complex orography, and advanced monitoring systems have limitations as well. New and more advanced decision support systems are needed to provide valuable information in critical situations [1].
In this context, radar data offer good complementary information and can work as an observational system and also as an assimilating source for meteorological mesoscale models [21,22]. Radar networks provide reflectivity composites with wide spatial coverage and a continuous timeline. This information allows the monitoring of the whole life cycle of MCS and also of minor convective structures. As the rainfall amount is usually underestimated by radar, and this fact increases with range and beam blocking [23], a rain gauge network with good coverage provides a complementary source to reproduce small-scale variability in rainfall [24].
The main objective of the present work is to determine if whether storm cells are more concentrated in some areas of Barcelona than in others. In a first step, radar data will be combined with observations from rain gauges to find significant rainfall episodes in Barcelona. A radar-based methodology is developed to identify convective cells in those relevant episodes, and a further study is carried out to localise the areas of the city where convective cells are most frequently located to achieve the objective. The identification and characterisation of storms aim to increase understanding to improve short-term forecasts. The performance of early warning systems will improve in conjunction with better forecasts, reducing the impact of severe weather.
Section 2 details the region of interest, BCASA water management system, the different data sources and explains the methodology. Then in Section 3, all the different results are shown, and in Section 4, they are discussed. Finally, in Section 5, the conclusions are reached.

2. Data and Methodology

This section first describes the region of study and explains the water cycle management system in Barcelona. Then it goes on to share the data sources, and finally, it details the methodology.

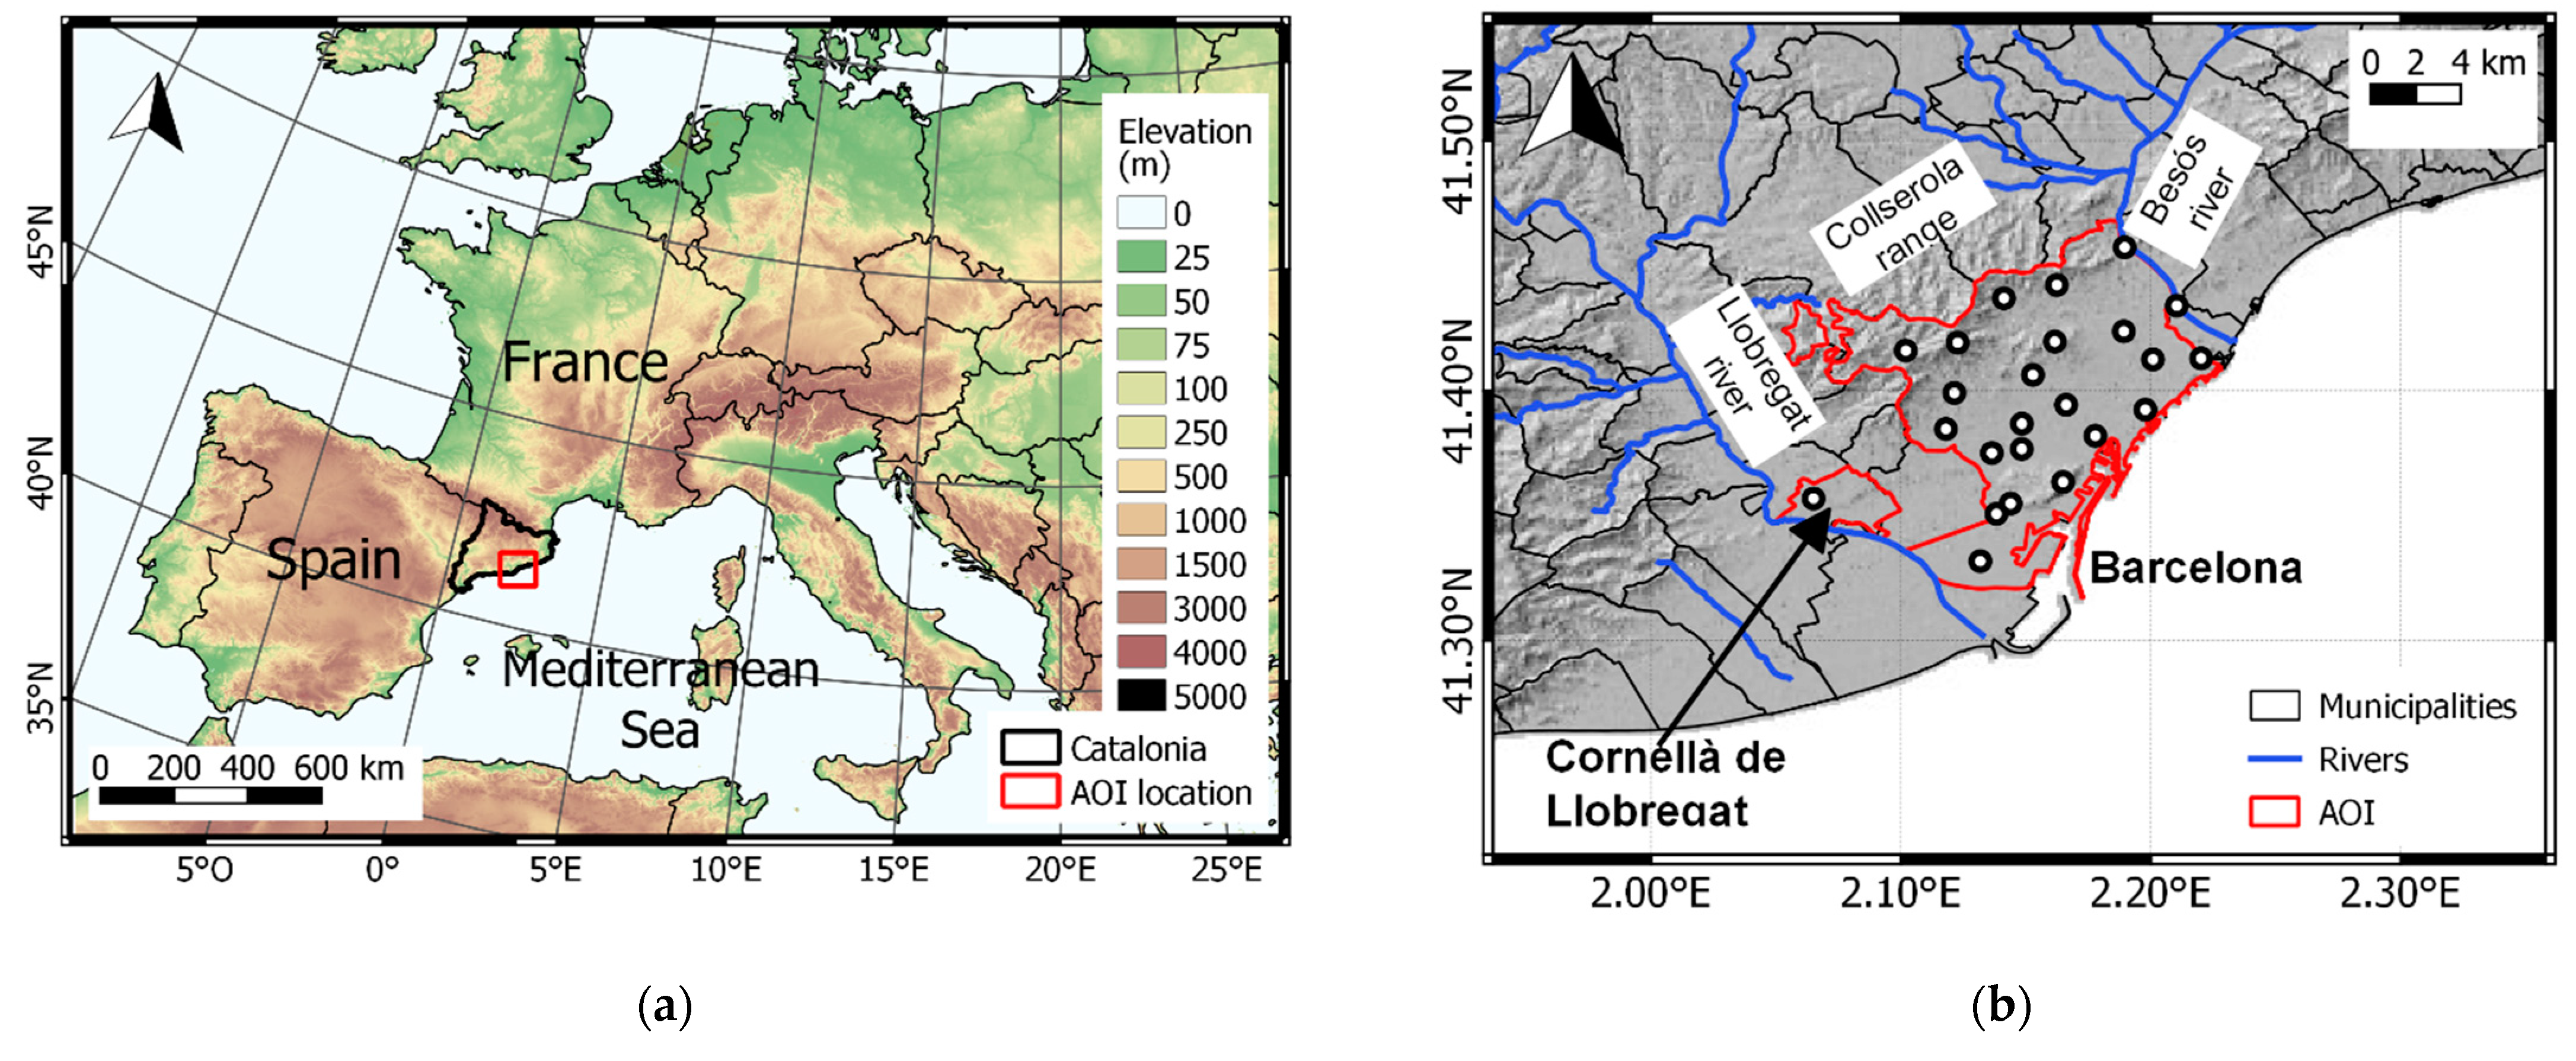
2.1. Region of Interest

The Barcelona Metropolitan Area (AMB) is placed in the northeast of the Iberian Peninsula, about 120 km to the south of the Pyrenees (Figure 1a). It covers more than 600 km2, and it is densely urbanised (36 municipalities comprising over 3.2 million people) with very frequent heavy rainfall events. It is naturally limited by the Mediterranean Sea (east), the Collserola mountain range (west), the river Llobregat (south) and the river Besós (north) (Figure 1b). In addition, different hills are within the city. Torrential streams born in the Littoral Mountain range and hills usually experience flash floods in autumn, as a consequence of heavy rainfalls favoured by the orography. Additionally, both of the main rivers surrounding the city have experienced historical catastrophic floods. Barcelona is the second most populated city in Spain, with more than 1,600,000 inhabitants (2018). It covers around 101 km2. Floods are relatively frequent in the city, with more than three pluvial flood episodes per year (109 flood events were registered between 1981–2015 according to [17]). In general, they cause damage to basements and ground floors, power outages, and create problems for urban traffic and public transportation. Floods can even affect historical or heritage buildings, given their locations in flood-prone areas.
In the present study, the comparison between radar data, surface observations and impact data will focus on Barcelona city and Cornellà (see Section 2.4.1 for more details). The mentioned area will be referenced as the Region of Interest (ROI). Nevertheless, to have a better understanding of the phenomena within the ROI, the analysed area for each episode from a radar point of view has been extended about 10 km2 from the ROI (Figure 1b).

2.2. Water Cycle Management and Alert System in Barcelona

The first attempt to improve resilience to city floods in Barcelona (Spain) was in 1988 with the design of a specific sewerage plan (within the context of the 1992 Olympics) that sought to facilitate water evacuation off the streets by means of building large water collectors near the sea (breakwaters). In 1992, Barcelona City Council created a consortium partnership, Clavegueram de Barcelona S.A. (CLABSA), to complete this task. After some years, on 21 September 1995, a flood caused one death, and the city collapsed (2500 emergency calls, 25 flooded metro stations, 80 incidents in the sewer system, etc.) because of a local daily rainfall of 91.9 mm and a maximum 5-min rainfall intensity of 235 mm/h [25]. That unfortunate flood event showed the need for more actions to improve the management of intense rainfall events in the city. In 1997, BCASA published a new specific sewerage plan for Barcelona (PECLAB’97), diagnosing the drainage problems in the city and proposing a new series of actions for improvement. From 1997 to 2004, a series of slide gates and underground stormwater retention tanks were built, and rain gauges began to be installed in several locations in the city. In addition, a remote system to control the slide gates and water tanks was implemented. Overall, the system was designed to prevent floods for the 10-year event precipitation, and even at some points for a 50-year event [26]. In 2014, Barcelona City Council decided to turn the CLABSA consortium into a public enterprise to manage the entire water cycle in the city: Barcelona Cicle de l’Aigua S.A. (BCASA). They handle all the related water processes: sewerage, rainwater tanks, groundwater system, seawater quality control, flooding risk at riverside parks and rainfall intensity warnings.
Nowadays, BCASA manages 13 underground water tanks and 2 surface flooding areas with a capacity of 477,010 m3. They also monitor real-time rainfall data from their rain gauge network, compounded by 23 Lambrecht and Geónica tipping bucket sensors (with an accuracy of 0.1 mm) that cover the entire area of Barcelona (Figure 1b). The forecasting team at BCASA is always informed with the latest weather forecast and the radar weather observations from the Meteorological Service of Catalonia (SMC) along with nearly real-time rain gauge data from the network (5-min updating frequency). The automatic alert system processes the data from the rain gauge network and based on 20-min and 60-min rainfall intensities (maximum and average), it issues five different alert levels for Barcelona (“Nivel de Alerta a Barcelona”, NAB) (Table 1). The first three levels act as a warning, so the current automatic protocols are revised by experts, and the different contributors to emergency prevention and mitigation are revised to ensure the situation is being controlled automatically, with no incidents. Level four suggests that Civil Protection should activate the Alert Plan for possible floods in Barcelona. Finally, level five activates an emergency, and the expert committee meets to coordinate the situation in the city. At this point, BCASA contributes as an information provider and experienced consultant.
The average number of alerts activated per year is between 3 and 4, but it varies from one year to the next. Furthermore, as urban floods in Barcelona have very short time scales and are rapidly solved, the emergency level is rarely activated. The combination of the automatic sewerage and drainage systems, along with an alert protocol, allows a coordinated effort with Civil Protection and authorities when flash floods occur in the city.

2.3. Data Sources

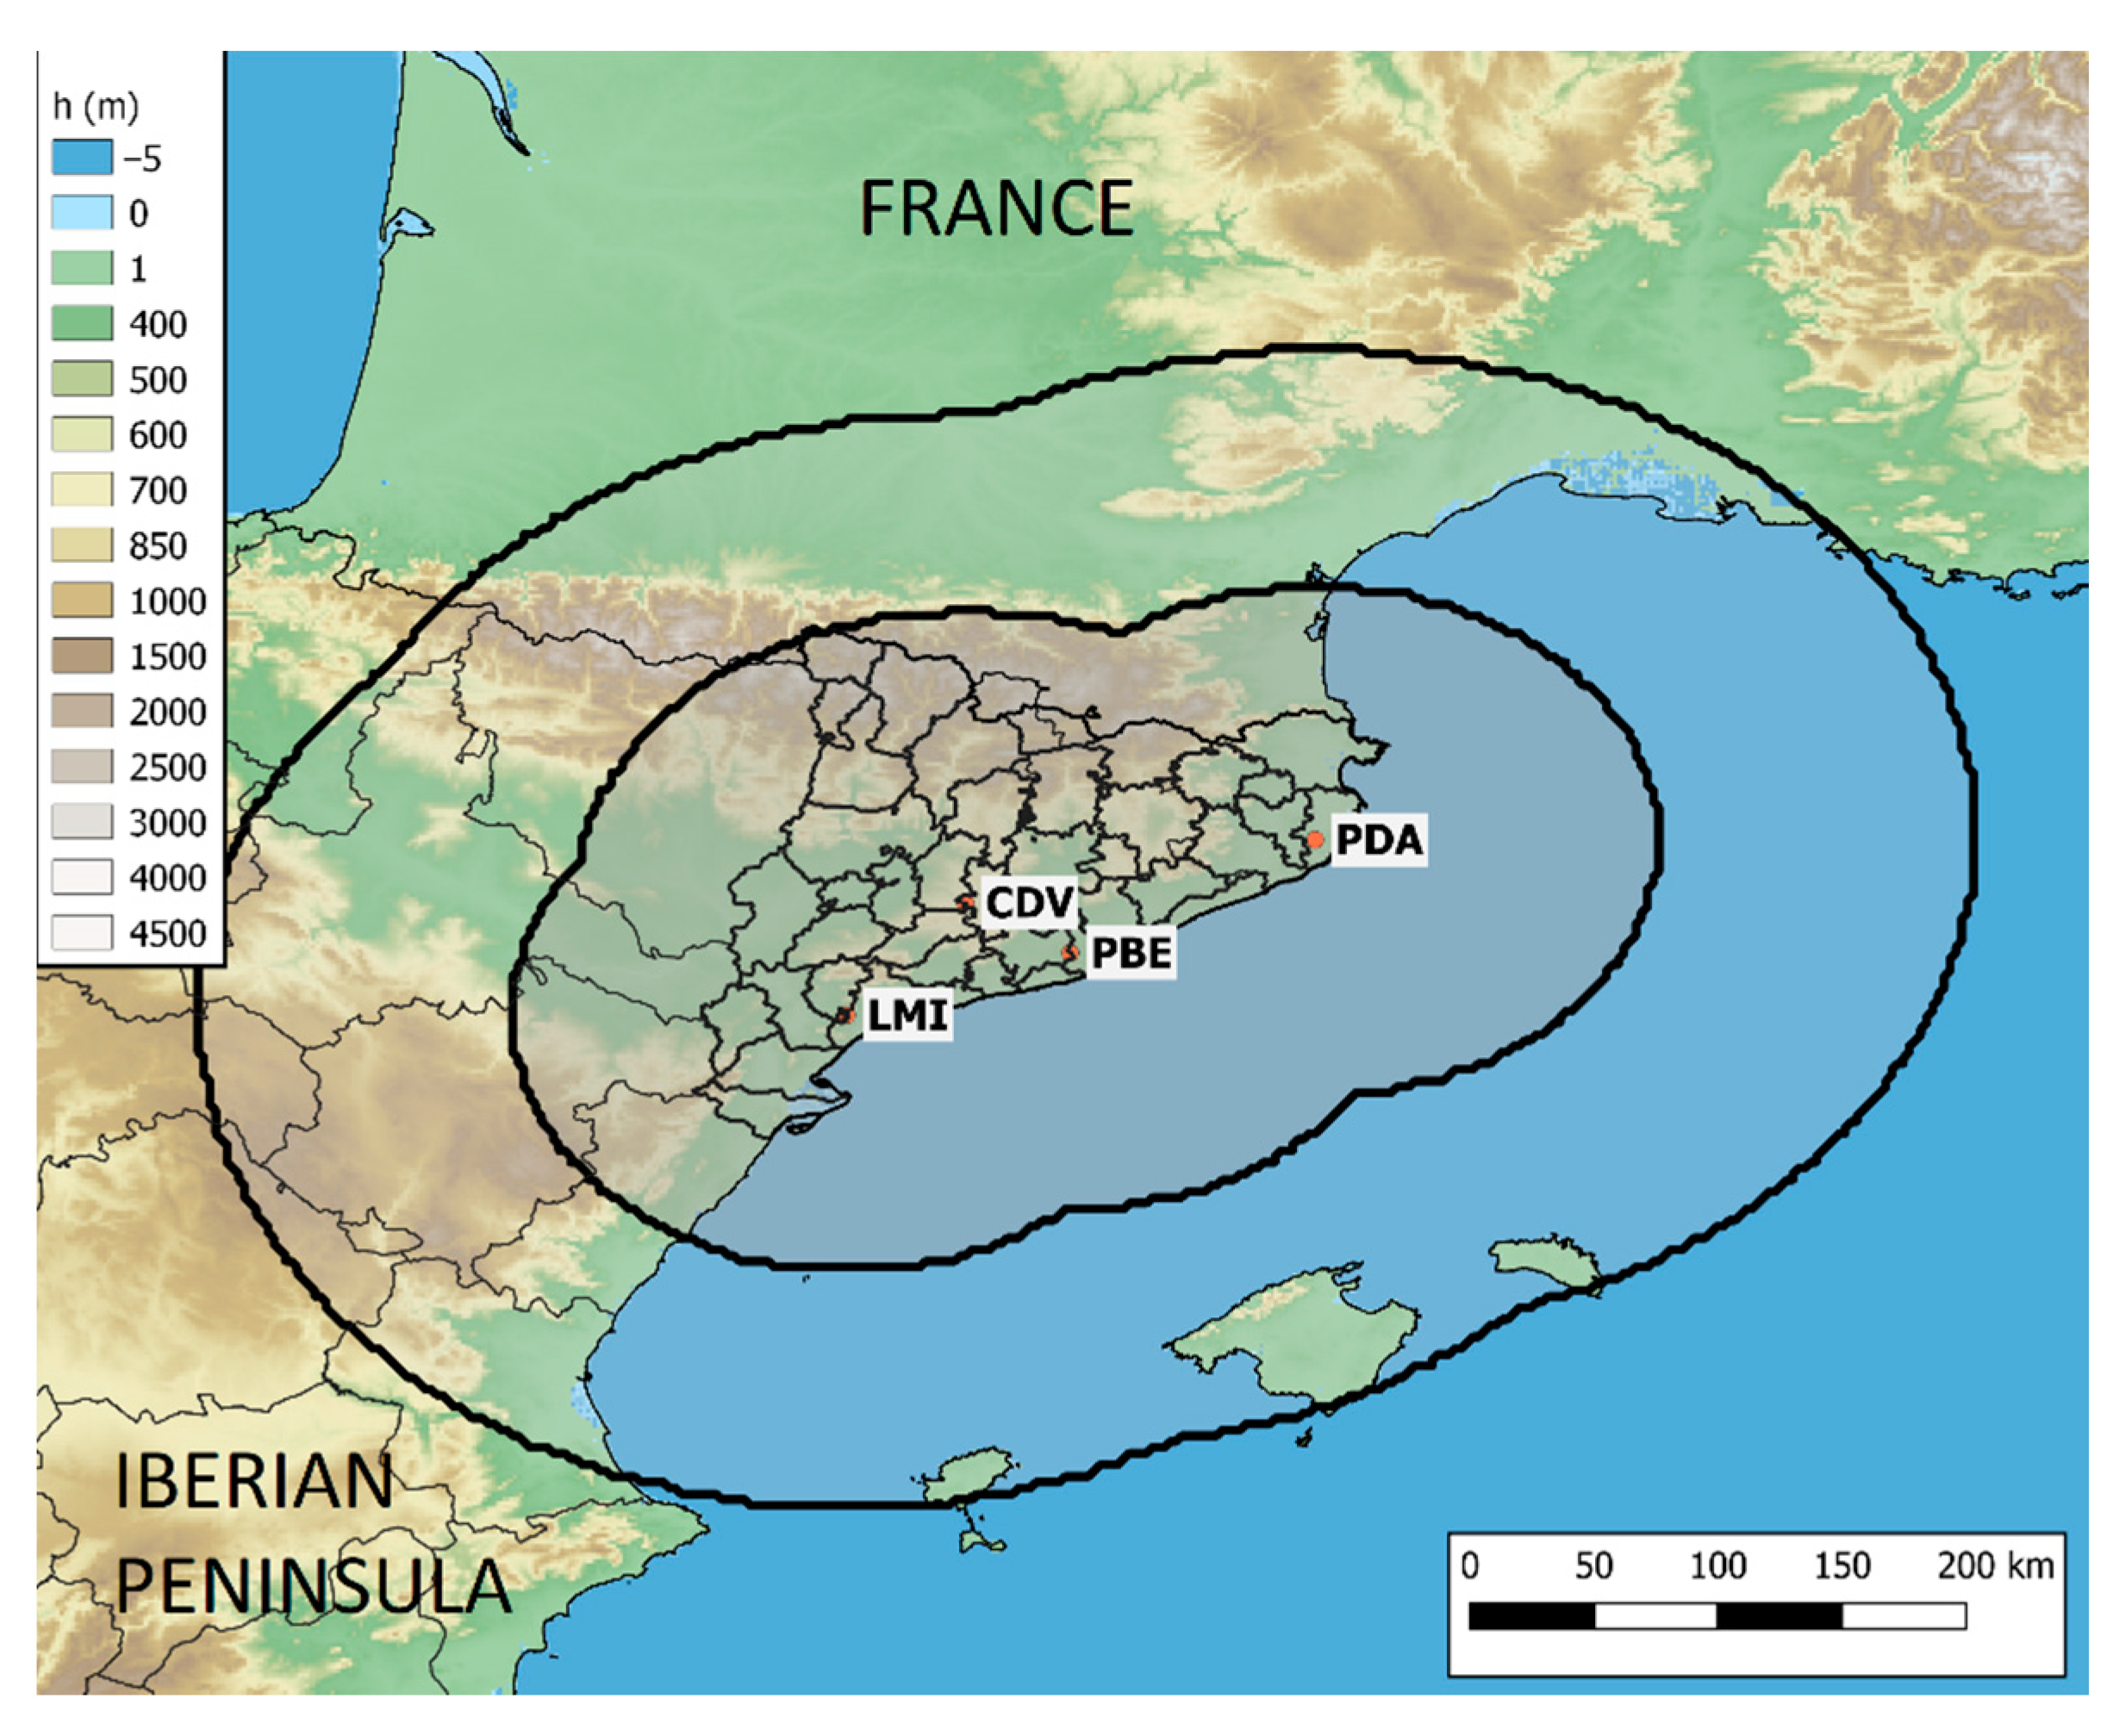
2.3.1. Radar Data from the Meteorological Service of Catalonia (SMC)

Radar data used in this study belong to the radar network of the Meteorological Service of Catalonia (XRAD). XRAD is composed of four radars distributed in strategic points throughout Catalonia (Figure 2): Puig Bernat in Vallirana (PBE, installed in 2000), Puig d’Arques in Cruïlles, Monells and Sant Sadurní de l’Heura (PDA, 2002), la Creu del vent in La Panadella, Montmaneu (CDV, 2003) and La Miranda, in Tivissa-Llaberia (LMI, 2008). Each works on three tasks: one long-range task (250 km), which operates at a set of elevations that are part of the radar volume with similar characteristics, and two short-range tasks (130–150 km), from which different products are created. Composite products are created from individual radar products. They cover the whole region of Catalonia and its surroundings (Figure 2).
All radar products used here are a composition of the images provided by the four different radars. The first one is the daily Quantitative Precipitation Estimation (QPE), corrected with EHIMI (Hydrometeorological Integrated Forecasting Tool) [27] and observational data from the Automatic Weather Stations network of the SMC (XEMA). It is a short-range product with 1 × 1 km2 spatial resolution. Data files have been available in ‘GeoTIFF’ format since 2013. In a second stage, to identify convective cells, the maximum surface reflectivity compositions, and short-range reflectivity compositions on 10 vertical levels, CAPPIs (Plan Position Indicator of Constant Altitude), are also used. This product has a vertical extension between 1 km and 10 km (by 1 km) and has a time resolution of 6 min and a spatial resolution of 2 × 2 km2. Considering all vertical levels available adds more robustness to the method when identifying convective cells than when only considering the lowest levels (see Section 2.4.3).

2.3.2. BCASA Rain Gauge Network and Database
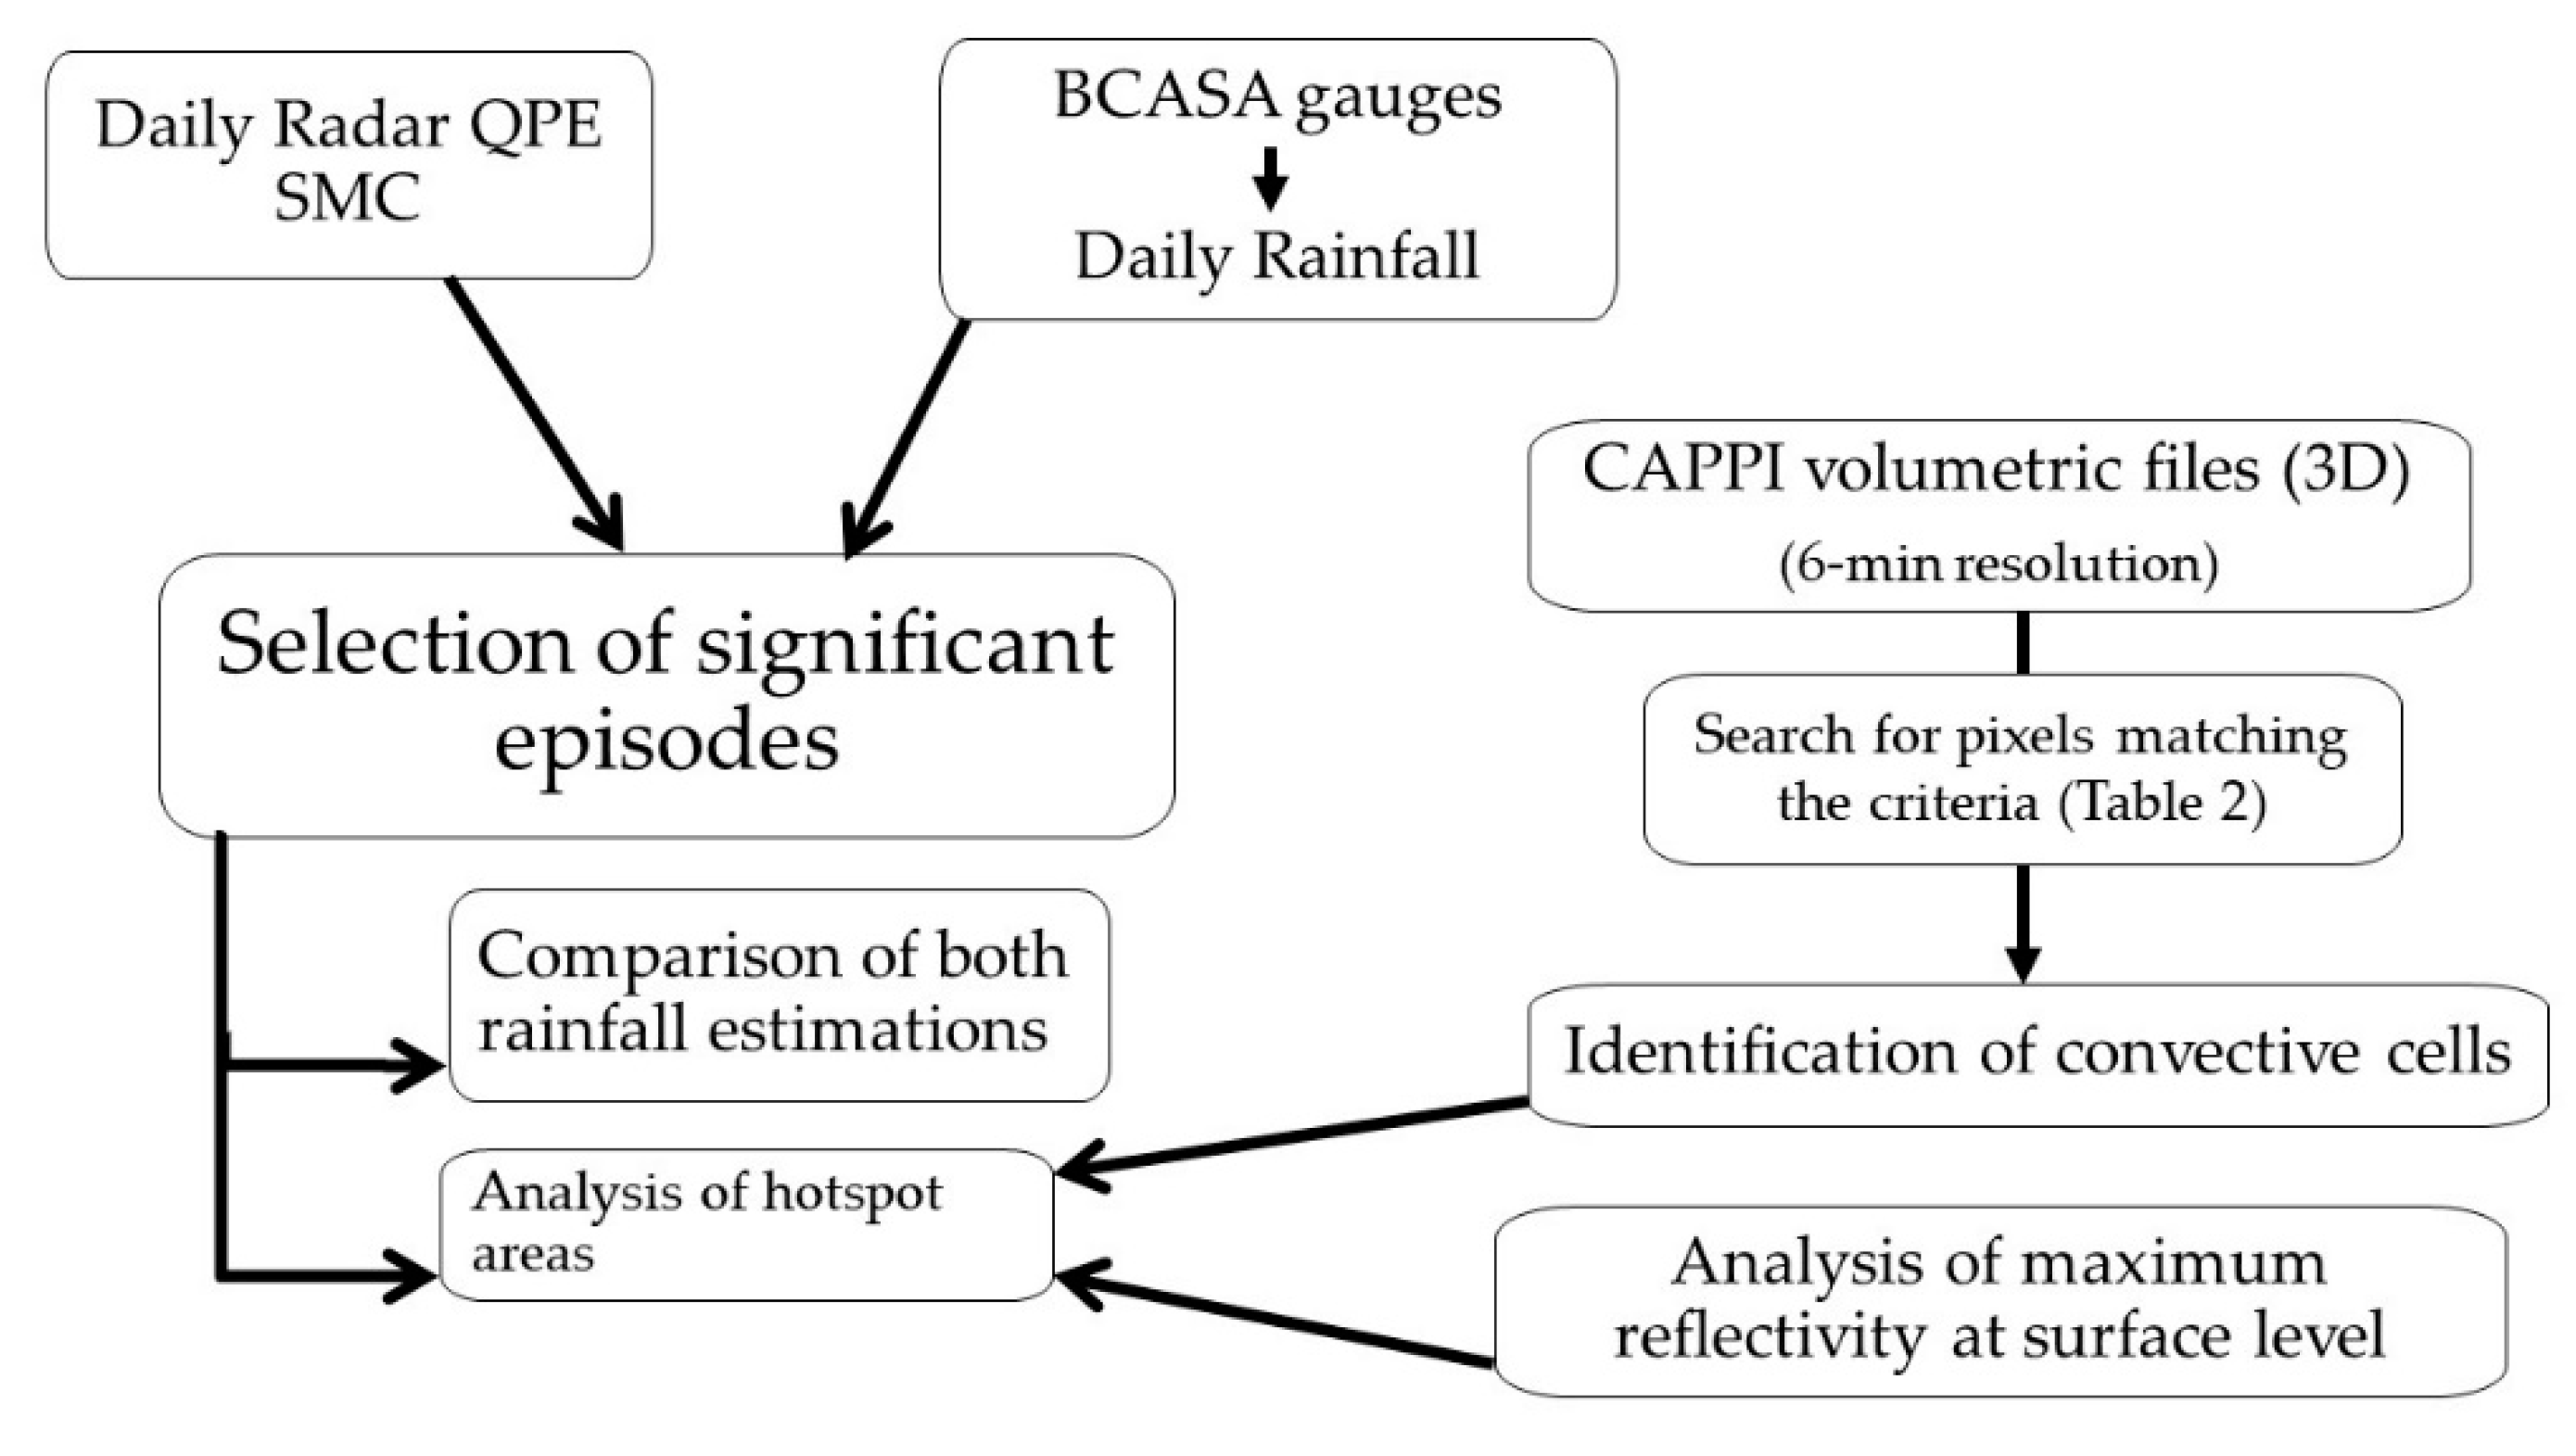
As mentioned in Section 2.2, the rain gauge data from the BCASA network (Figure 1b) are stored in a database. As the network is composed of tipping bucket devices, the information is stored when the bucked fills up and turns over. This information must be converted to minute intensities or hourly rainfall accumulations, depending on how it will be applied. Since 2011, there has also been a separate database with post-event rainfall reports for all the different episodes that have exceeded the rainfall volume of 1 mm. This second database includes for each episode the date of occurrence, daily average and maximum precipitation, average and maximum 20-min and 60-min intensities and NAB (Table 1). When the NAB reaches or exceeds level 3, information about the related incidents is requested by Barcelona City Council and is also included in the database. These incidents are usually related to the sewer system, but they also include flooding on streets, in the metro and basements.
Hourly rainfall data from the different stations of the rain gauge network were used in the study to calculate 24-h rainfall accumulation. These data were cleaned and prepared in advance for the purposes of this study. The rainfall reports were also used to classify rainfall events in Barcelona into different categories according to their impact by means of NAB.

2.4. Methodology

Figure 3 shows the different steps followed in the present study. In the following subsections, every process is explained in greater detail.

2.4.1. Database Creation: Significant Rainfall Episodes inside ROI

The first objective was to identify all the significant rainfall episodes within the ROI (cities of Barcelona and Cornellà) that were recorded between April 2013 to December 2018. The reason why it did not start in January is because the SMC started to generate volumetric georeferenced radar files (with the actual format) at the beginning of 2013, but during the first few months, some adjustments had to be made to obtain good quality data. Therefore, the first months of radar data were not used.
For the purposes of this study, a significant rainfall episode was defined as a single rainfall day in which a minimum of 10 mm of accumulated rain was exceeded at a given point. Rainfall accumulations were computed every day from 00:00 UTC to 23:59 UTC. If the precipitation continued after 23:59 UTC, two different episodes were defined. Following these criteria, episodes were identified from radar QPE (Quantitative Precipitation Estimation) computed over 24 h (Pmax) at a pixel resolution of 1 × 1 km2. The identification of significant rainfall episodes was also carried out independently by selecting the days that met the criteria from the rain gauge network of BCASA. Episodes obtained from both sources were then compared. If episodes did not appear in both lists, an analysis was carried out to determine if the rainfall within the ROI was significant or if it was an inaccuracy in the data from one of the systems.
NAB criteria from BCASA were incorporated (Table 1) to analyse the episodes that caused major stress to the city in greater detail. A sub-selection of episodes for which BCASA issued an NAB alert level greater than or equal to three was considered for the analysis. Furthermore, to have a more complete view of the impact on the city, reported incidents by the Barcelona City Council were also incorporated.

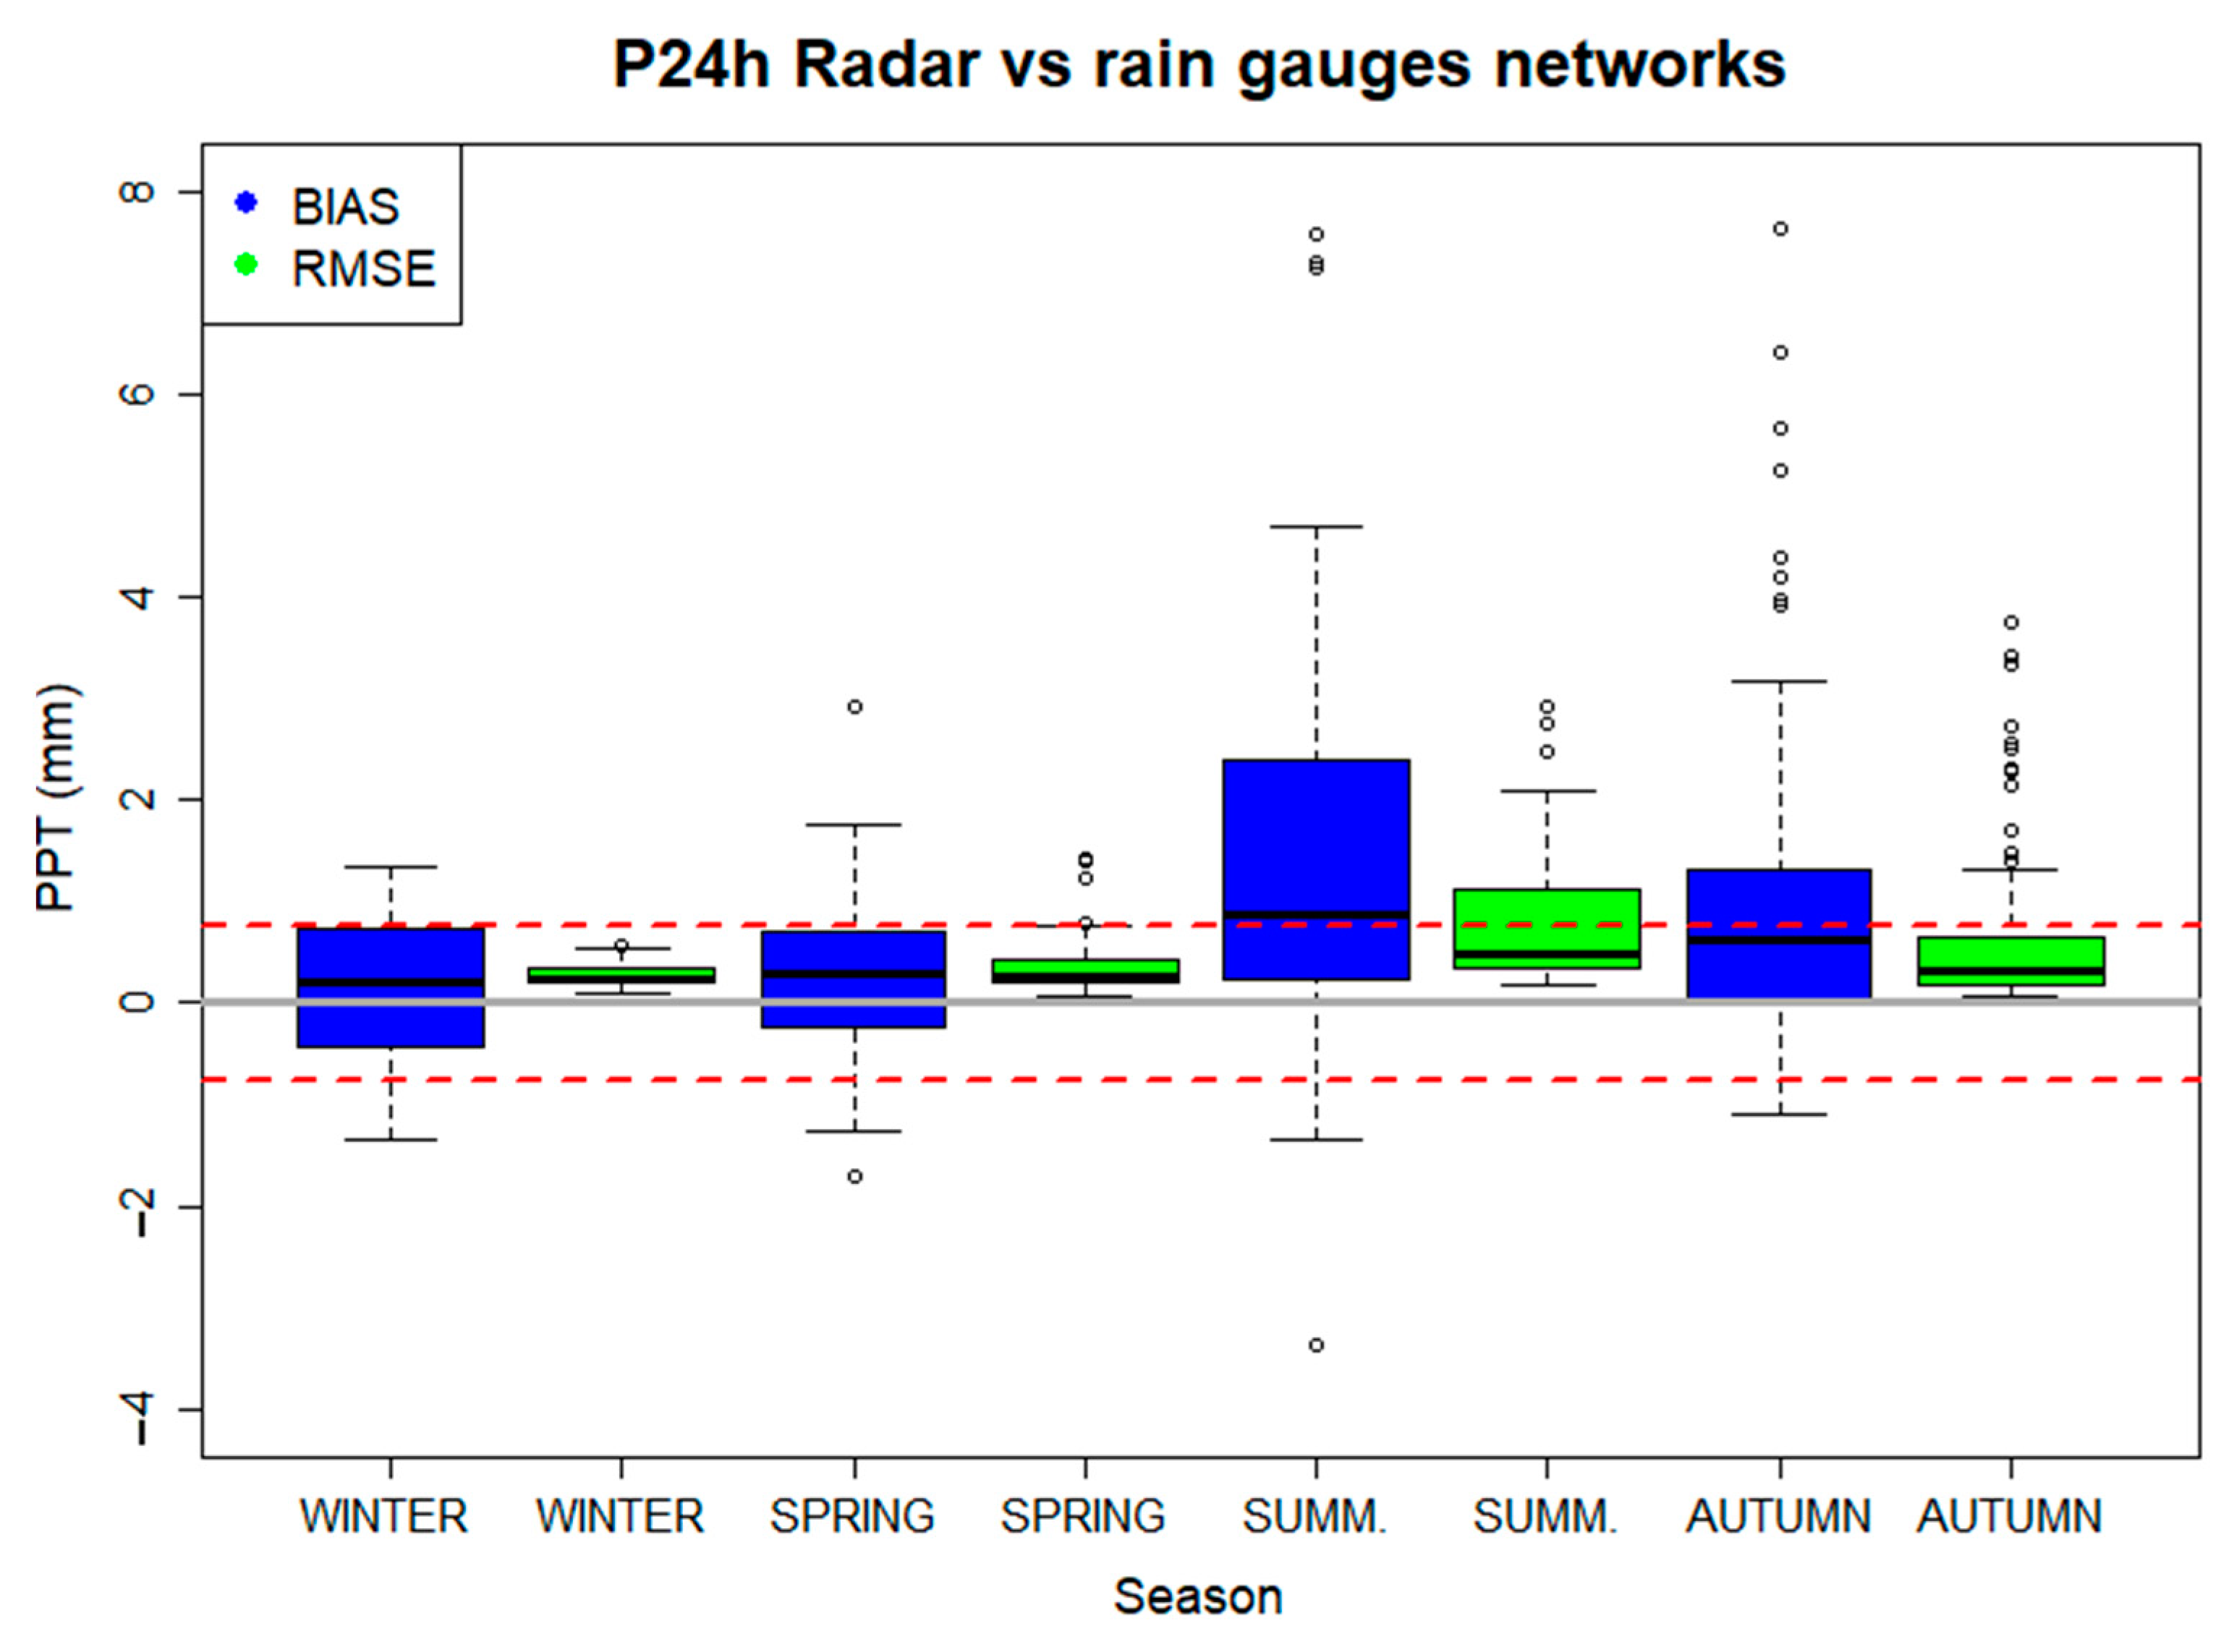
2.4.2. Comparison of Rain Gauge Data and Radar Data for Rainfall Episodes

Rain gauge data were only available for the specific sites where devices are installed. So, when comparing data from the radar network, radar QPE values must be extracted for each episode on the same coordinates (longitude and latitude) where the BCASA rain gauges are located. Using similar statistics as Trapero et al. [23,28], the Bias (expressed in mm) and the Root Mean Square Factor (RMSf) were calculated for each rainfall episode:
B I A S = 1 N i = 1 n 10 × log [ Q P E r a d Q P E g a u ]
R M S f = 1 N i = 1 n ( ln [ Q P E r a d Q P E g a u ] ) 2
where N is the number of points where either QPErad or QPEgau are greater than 0.1 mm. The RMSf is a dispersion indicator, so it should be larger whenever the episode has high variability. That will happen if the rainfall episode is highly convective. Otherwise, if Bias is close to zero, radar and rain gauges agree in rainfall accumulations, while Bias values smaller or greater than zero will indicate either that the radar underestimated or overestimated the rainfall amounts, respectively.

2.4.3. Analysis of Storm Hotspots with Radar

Nowadays, there is wide literature about weather radar applications, such as works focused on forecasting [29,30,31], some others about the characteristics of meteorological patterns [32] or about the identification of convective structures [29,33]. In this last case, there are strategies for identifying storm structures from levels near the surface [32,34,35] and others with a higher degree of complexity that use volumetric thresholds and can require a long processing time [29,33]. In this work, two approaches were explored to identify the sites within the ROI where intense rainfalls are most prone to occur. These methods have low computation requirements and can be run over a great number of rainfall events, as well as in an operative way. The first approach was an analysis of radar-maximum surface reflectivity products, while the second was based on CAPPI products.
The first approach analyses radar data files of 24 h maximum reflectivity intensity at surface level. For each radar file (maximum values of surface reflectivity for an episode), three different thresholds were established: 30 dBZ, 45 dBZ and 55 dBZ. For each episode and threshold, a density map of threshold exceedance was generated. The resulting products show the number of episodes that surpassed a threshold at a pixel resolution of 1 × 1 km2. In this way, the most frequent locations where surface reflectivity values were high could be identified.
As has been mentioned, the second approach consisted of establishing a fast methodology to do the identification of convective cells. It was applied for all the significant episodes. For this task, CAPPI products from XRAD were used. As explained in Section 2.3.1, these are volumetric files containing different vertical levels of reflectivity at a time resolution of 6 min. The algorithm was programmed as an R script. For each time step, the following procedure was applied:
  • The script searches for all the pixels (2 × 2 km2) inside Barcelona and the surrounding area (a radius of about 10 km from the limits of the city) that comply with these three criteria: (1) the maximum reflectivity value surpasses the threshold of 35 dBZ, (2) reflectivity achieves at least 30 dBZ above 3 km of altitude, and (3) at least five contiguous pixels match the previous conditions.
  • All the adjacent pixels that meet these conditions will be grouped into a single convective cell. It is possible to identify other convective cells in the same image as long as the distance between them is at least one pixel.
  • The information that characterises each convective cell is stored in a text file. This information covers the date of the event, the time when the cell was detected, the longitude and latitude coordinates of the centre of the cell, how many pixels it is made of, its overall area, and if there were other cells at the same time inside the analysed region.
The restriction of a minimum number of pixels to meet the reflectivity conditions is imposed to avoid the consideration of isolated reflectivity maximums without enough organisation as convective storm cells.
Both [29] or [33] also proposed a minimum size for convective cells and used CAPPI values, but they had used more complex 3D algorithms to identify them. They both consider a wider range of thresholds at different vertical levels. They are useful for nowcasting operations [33] as well as to analyse anomalous movements [31], but in coastal regions, where shallow convection is prone to occur, those complex 3D algorithms can be too restrictive to characterise significant storms. Therefore, the described algorithm seems more appropriate to this study. Even when it is based on simple restrictions, it considers the altitude of convective structures (simplified 3D algorithm), which makes it more robust than other 2D algorithms [32,35]. The simplifications make the methodology computationally efficient, which allows the analysis of a very large number of episodes in a short time.

3. Results

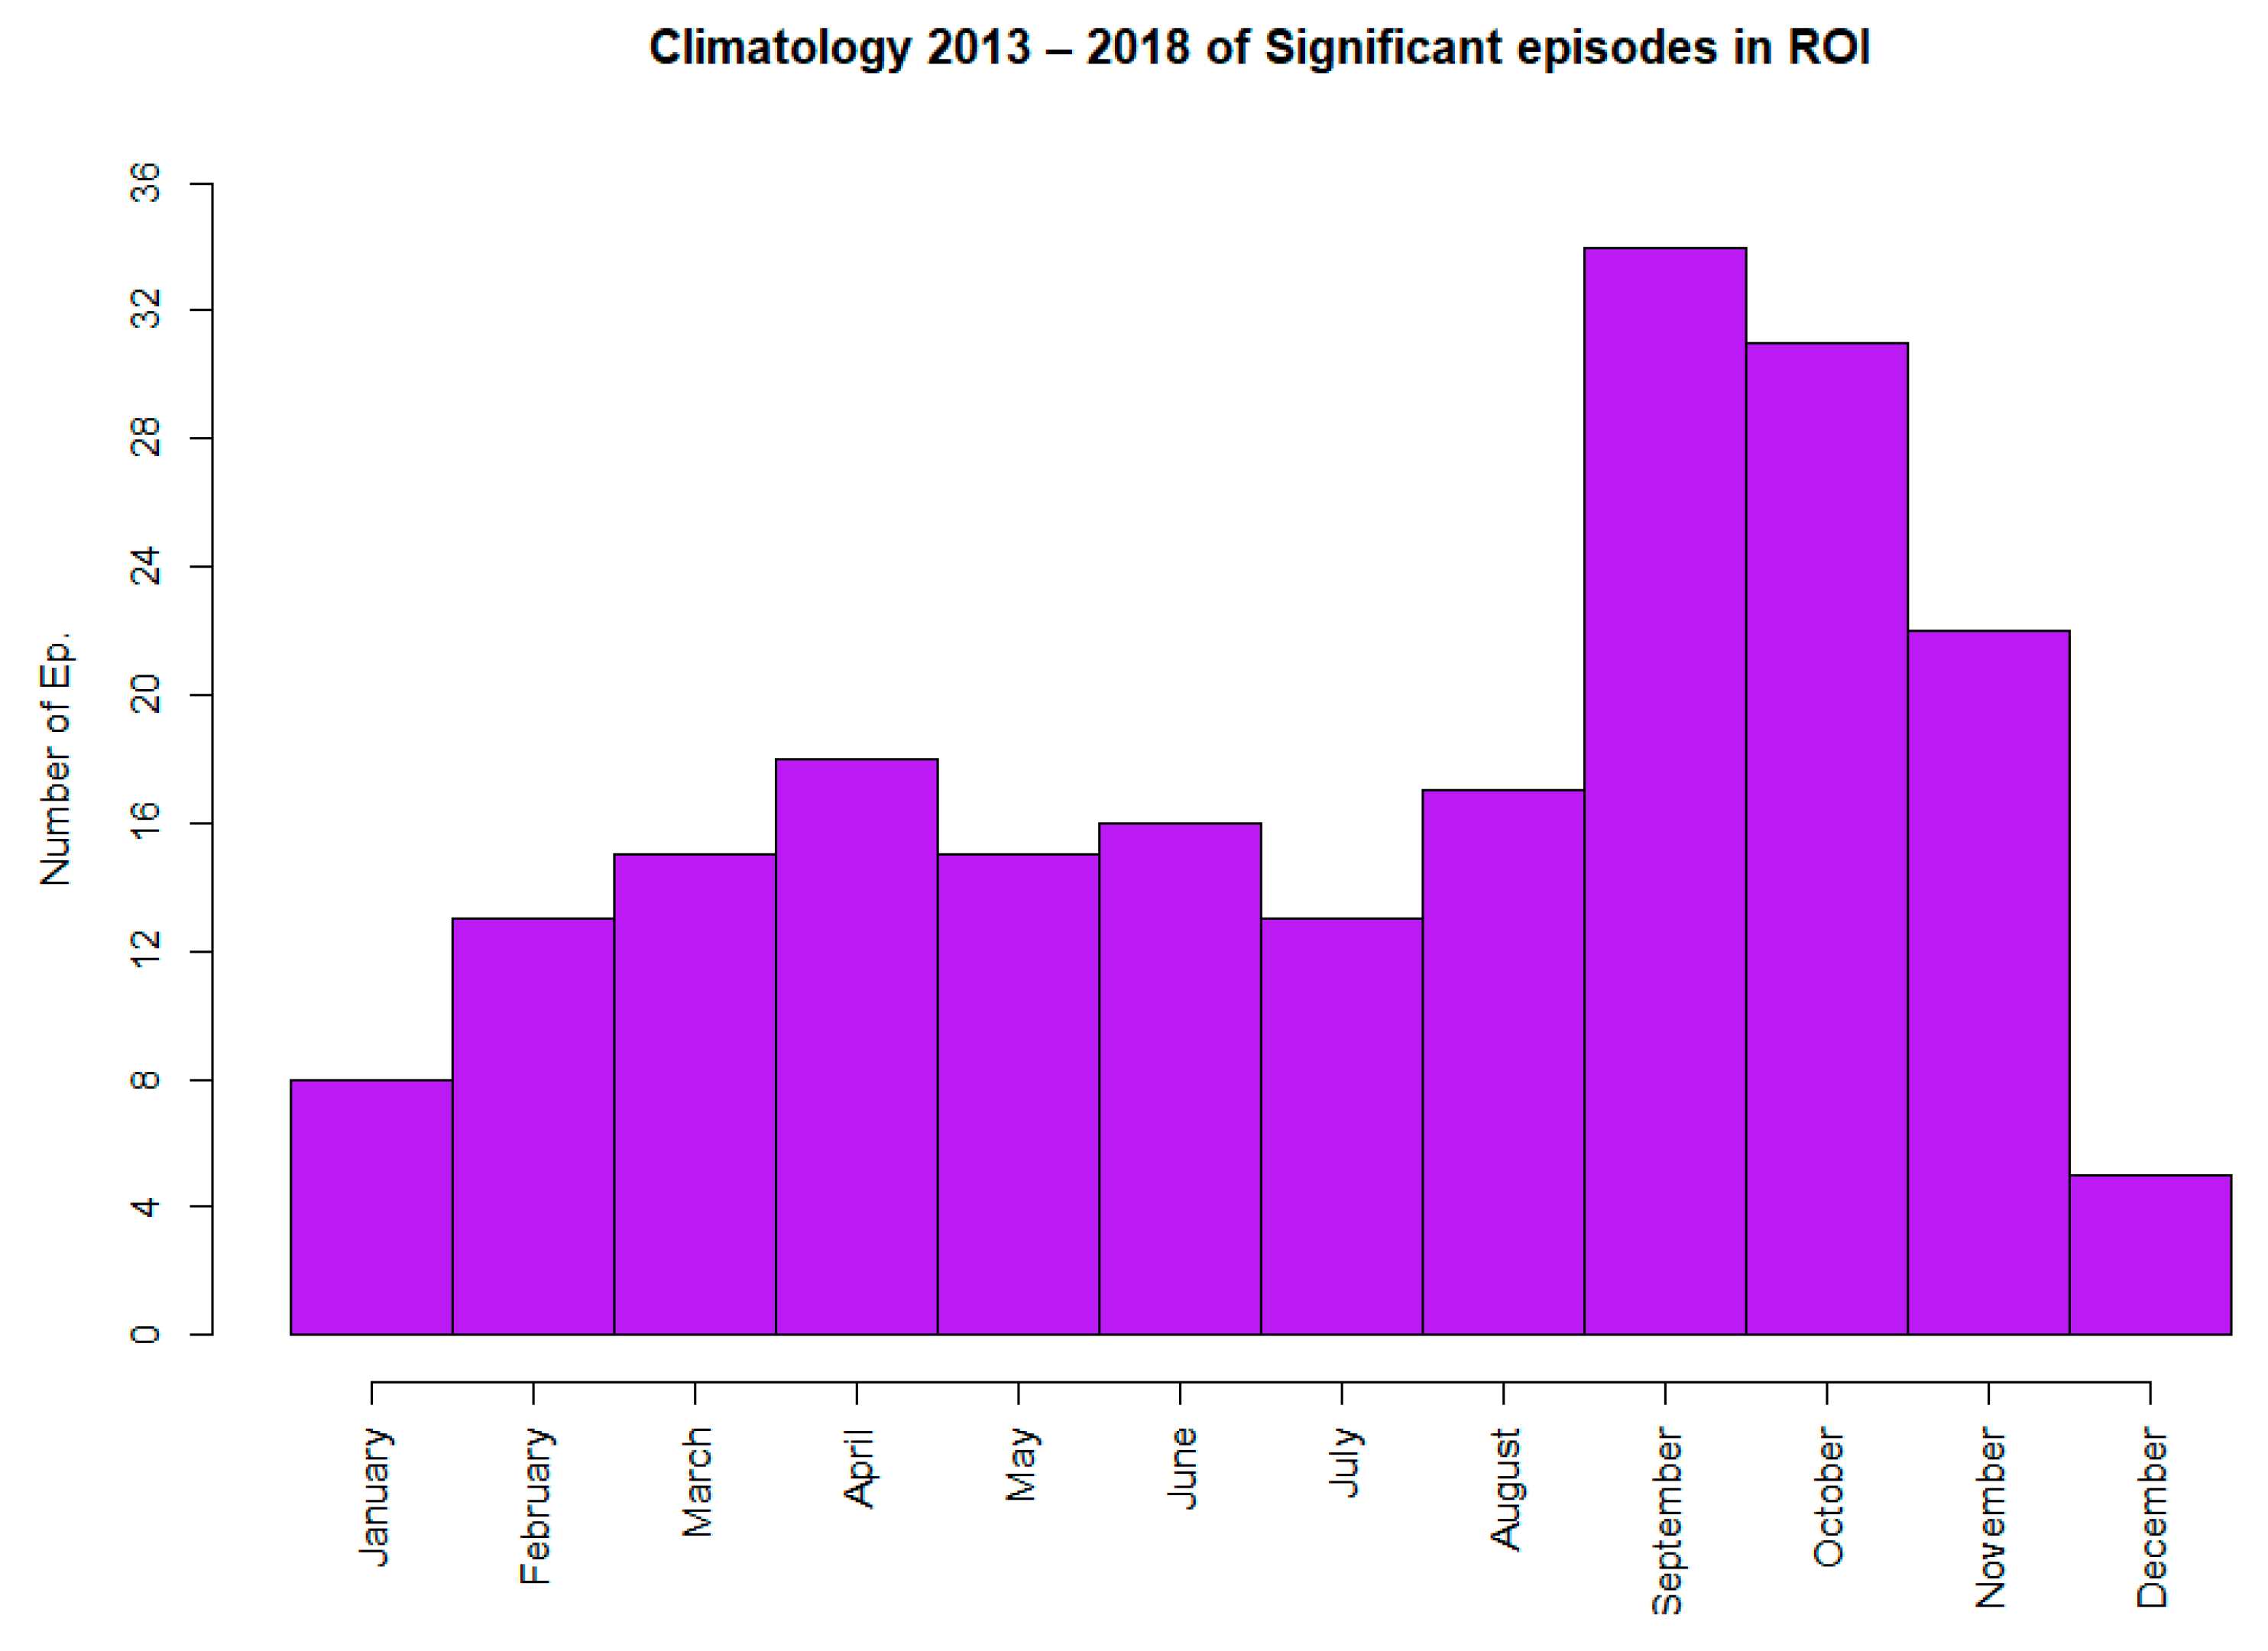
3.1. Database Creation: Rainfall Episodes

Between April 2013 and December 2018, 163 rainfall episodes that met the criteria (Section 2.4.1) were found in both data sets (XRAD and BCASA networks). However, there were 58 additional episodes detected only by radar. For those episodes, a deeper analysis was carried out, concluding the following:
  • In 38 cases, BCASA rainfall observations registered precipitation between 1 and 10 mm at some places.
  • In 6 cases, rainfall recorded by BCASA network was under 1 mm, but radar showed a congruent rainfall field.
  • In a further 14 cases, the rainfall field barely crossed the border of ROI, or rainfall occurred mainly over the sea. The algorithm used to find the significant episodes from radar data has classified the day as a significant rainfall episode, but the detailed analysis revealed that it was not significant at all. These cases were not included in the final list of episodes.
The differences found in the first two types of missing episodes may be due to the different spatial coverage of both types of sensors. Given that the radar has a homogeneous coverage in the study area, these 44 cases were considered good, reaching a total number of 207 significant rainfall episodes in the ROI between April 2013 and December 2018 (shown in Appendix A, Table A1).
Major differences in the number of episodes between both sources were shown by the end of spring and the beginning of autumn: a difference of 9 episodes in June, 12 in July, 11 in September and 12 in October. Summer events are usually very convective, short and local, and for this reason, they may not have been detected by the rain gauge network. Despite the good spatial resolution of the rain gauge network, convective precipitation can be highly localised and not detected by any rain gauge [36]. Moreover, anomalous propagation of the radar beam under certain atmospheric conditions [37] or other anomalous echoes that may identify precipitating nuclei when they do not exist can be considered.
The yearly distribution of these significant episodes is shown in Figure 4. December was the month with the least episodes, and September had the most. Overall, from February to August, there were between 12 and 18 episodes per month. It was during autumn (from September to November) when the greater number of episodes was found.
The distribution along the year of significant rainfall episodes in this work is consistent with previous studies carried out in the same region for longer periods. In Catalonia, there is a large spatial and temporal variability in terms of the annual rainfall cycle, with typically short thunderstorms during summer and spring and larger events during late autumn and winter [20,36]. In addition, Barrera et al. [8] and Cortès et al. [5] showed that most of the floods in Barcelona are concentrated between the end of summer and autumn, with the maximum number of episodes per month in September.
When filtering rainfall episodes using the NAB level issued by BCASA, that were greater than or equal to 3, there were 64 cases in the studied period (Table A2 in Appendix A). Analysing the dates for the episodes with the highest alert level (NAB = 4) in Table A2, one observes they were not uniformly distributed throughout the year. They seemed more likely to occur from July to November, but since there were only 17 cases over a 6-year period, it was not possible to determine any kind of trend. Referring to those with NAB equal to 3, the probability of occurrence was higher from May to November, with a maximum average of cases per month in August and September. These results are consistent with [36]. According to the data, there was no evidence of an upward trend for episodes with greater NAB, but again, the study period is too short.
NAB is an alert indicator, but it is not directly related to the impacts in the city. For this reason, incidents reported by Barcelona City Council were also included (Table A2 in Appendix A). It stands out that not all the episodes with the highest precipitation values had the most reported number of incidents. In fact, incidents were only reported for 28 of them. The first four episodes that reported the largest number of events took place in the last year of the study (2018). From October to November of the same year, there was an unusually high occurrence of extraordinary rainfall episodes in the city. In general, NAB = 4 cases had more reported incidents per episode than NAB = 3 ones. These episodes were mainly concentrated in November, March, September and October. Considering the total number of incidents per year, 2018 (with 353) was the most reported year. The second was 2014 (174), then 2017 (75), 2016 (58), 2015 (17) and finally 2013 (15). Since 2013, there has been an increasing trend in the number of incidents per year, but this could be caused by the reporting methodology. In the past, Barcelona City Council gathered water-related incidents through phone calls from citizens. Today, BCASA manages the database and has changed the way in which information is obtained. They want to obtain a greater variety of rain-related incidents in order to create a more robust database. Table 2 shows the annual distribution of the rainfall episodes with reported incidents. In all the winter seasons, no episode was reported with these characteristics. The episodes with the highest alert level were most concentrated in the autumn seasons. Nevertheless, the number of those events reported during summers was also significant. Overall, there was a similar number of cases with NAB = 3, spread over the spring, summer, and autumn periods.
After analysing the maximum cumulative precipitation (BCASA network) on the previously sub-selected episodes with reported incidents (Table 2), the ones with NAB equal to 3 indicated a maximum between 12.45 and 40.30 mm. Episodes with NAB equal to 4 showed a wider range of values: there were episodes with maximums from 28.10 to more than 110 mm (cumulative rainfall over 24 h) and an exceptional case with 133.4 mm. It must be noted how on some intense rainfall episodes, few or no incidents were reported, but also, episodes with a significant impact on the city and without large rainfall accumulations were also found. Table 2 also displays the seasonal variability of maximums collected in those rainfall episodes. Higher maximum values were observed in both the spring and autumn seasons. Looking at the 75% percentile, episodes with NAB = 3 had larger rainfall accumulations in spring, while for those with NAB = 4, the larger accumulations occurred during autumn.
When trying to establish trends and patterns in terms of impacts on the city of Barcelona, it seems that the number of episodes with reported incidents shows a decreasing trend over the analysed period, except for 2018, where an unusually high number of extraordinary rainfall episodes compromised the normal running of the city. There is no doubt that rainwater management systems (such as rainwater tanks) and correct maintenance of the sewerage system, coordinated by BCASA, have had an important role in decreasing damage in the city [8], which again highlights the importance of early warning systems in order to be prepared against the most significant events.

3.2. Comparison of Rain Gauge Data and Radar Data for Rainfall Episodes

For each episode on the database, maximum cumulative precipitation on rain gauge locations from radar products and rain gauge data were compared, as explained in Section 2.4.2 of methodology. For the 207 cases presented in the previous section, the overall difference (BIAS) was calculated, as well as the RMSE. In Figure 5, the seasonal distribution of BIAS and RMSE is shown. Episodes with no observational rain gauge data (3 of them) were counted as radar overestimation cases. For some months (from May to October), the radar struggled to reproduce the observations from the BCASA network, and a trend to rainfall overestimation was observed. This is a consequence of using a single Z-R relationship throughout the year. Radar QPE calculations do not distinguish the water phase, but when there is ice in the clouds, the reflectivity values are much higher than usual, and the resulting QPE may be much higher than the real figures. This applies to hail episodes (relatively frequent in Catalonia and the ROI [29]).
SMC had previously calculated the overall bias of its radar network in Catalonia. For each episode, they compared point by point, the accumulated precipitation with the observations from an automatic weather station network (XEMA), also managed by the SMC. From June to September, SMC gets an overall positive bias, which is consistent with the results in Figure 5. But in this work, the positive bias also extended to October. This is also consistent with the SMC calculations, as they also documented a positive bias along the coastline of Catalonia from September to November. However, overall, this bias was compensated with a negative bias inland (not shown).
By comparing maximum cumulative precipitation values from both sources for episodes with NAB greater than or equal to 3, a trend towards radar overestimation can be observed. A larger study with a greater number of episodes with the same characteristics is needed to analyse this tendency in more detail. With the available data, it seems XRAD has a better ability to reproduce more accurate maximum values when NAB is equal to 3 than when it is equal to 4. It is also important to note that the rain gauge network is not as dense as the radar resolution data, so for highly convective precipitation with wide intensity gradients, radar measurements may be more accurate [24].

3.3. Storm Hotspot Analysis with Radar

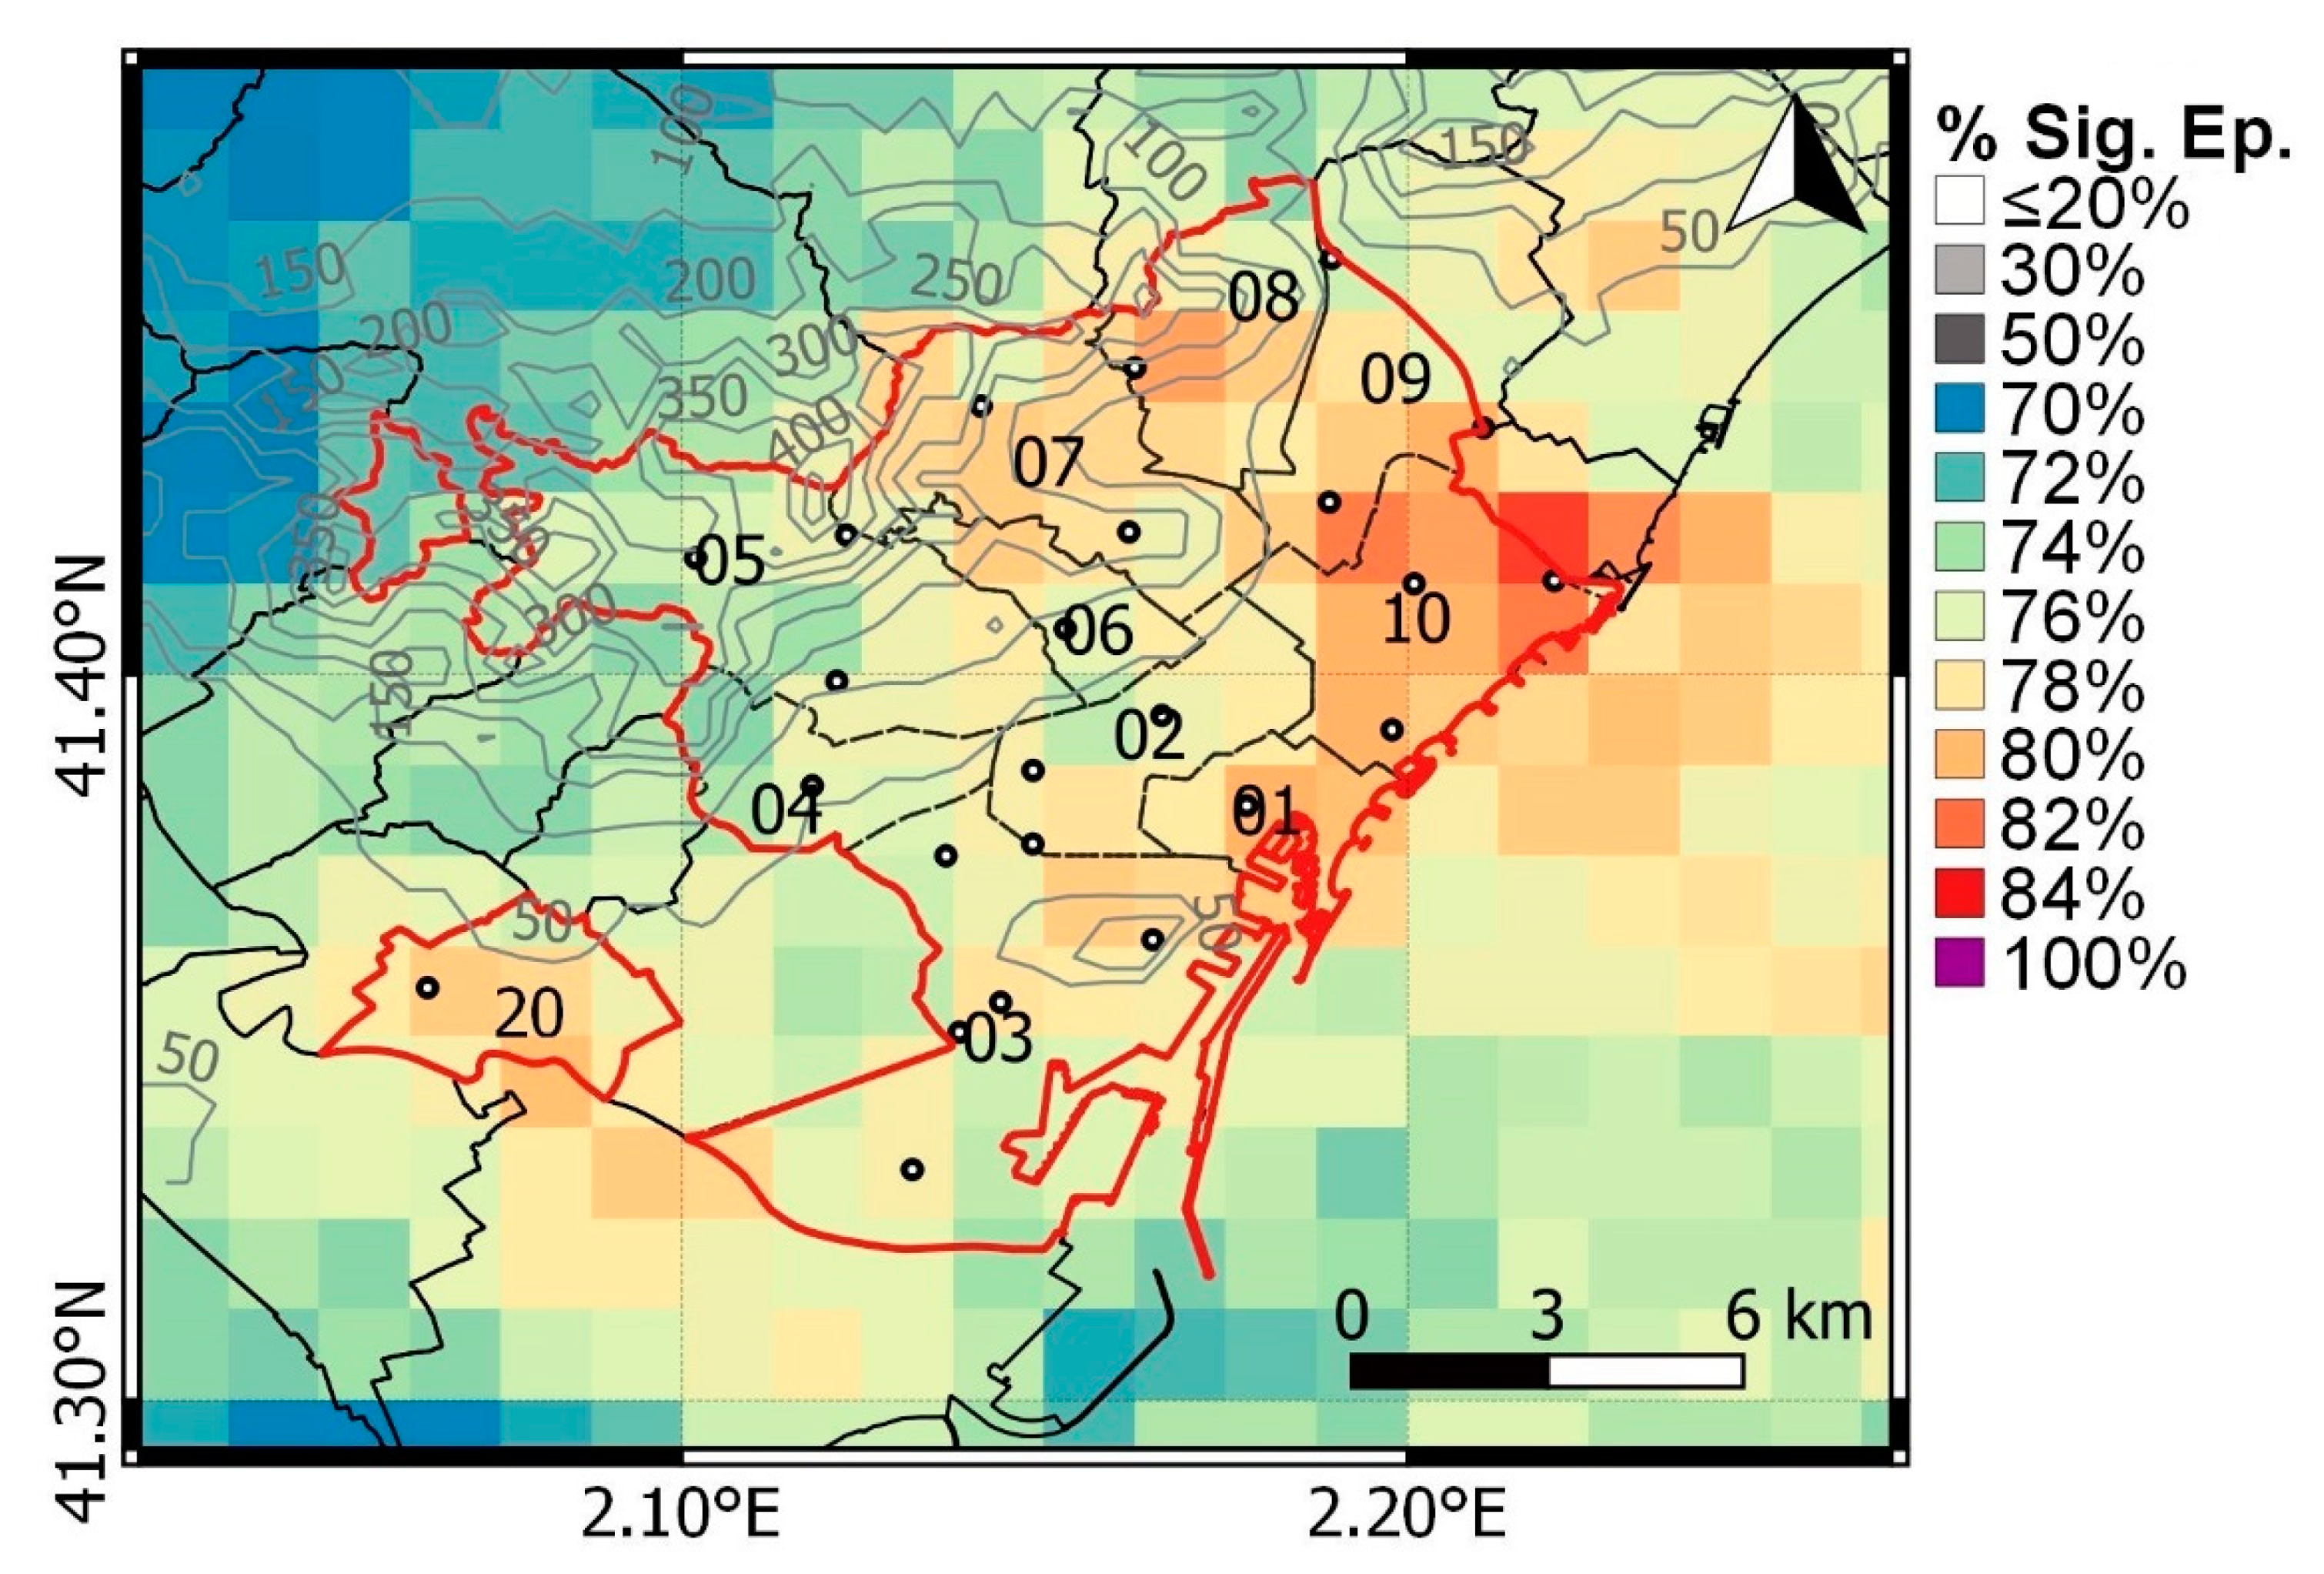
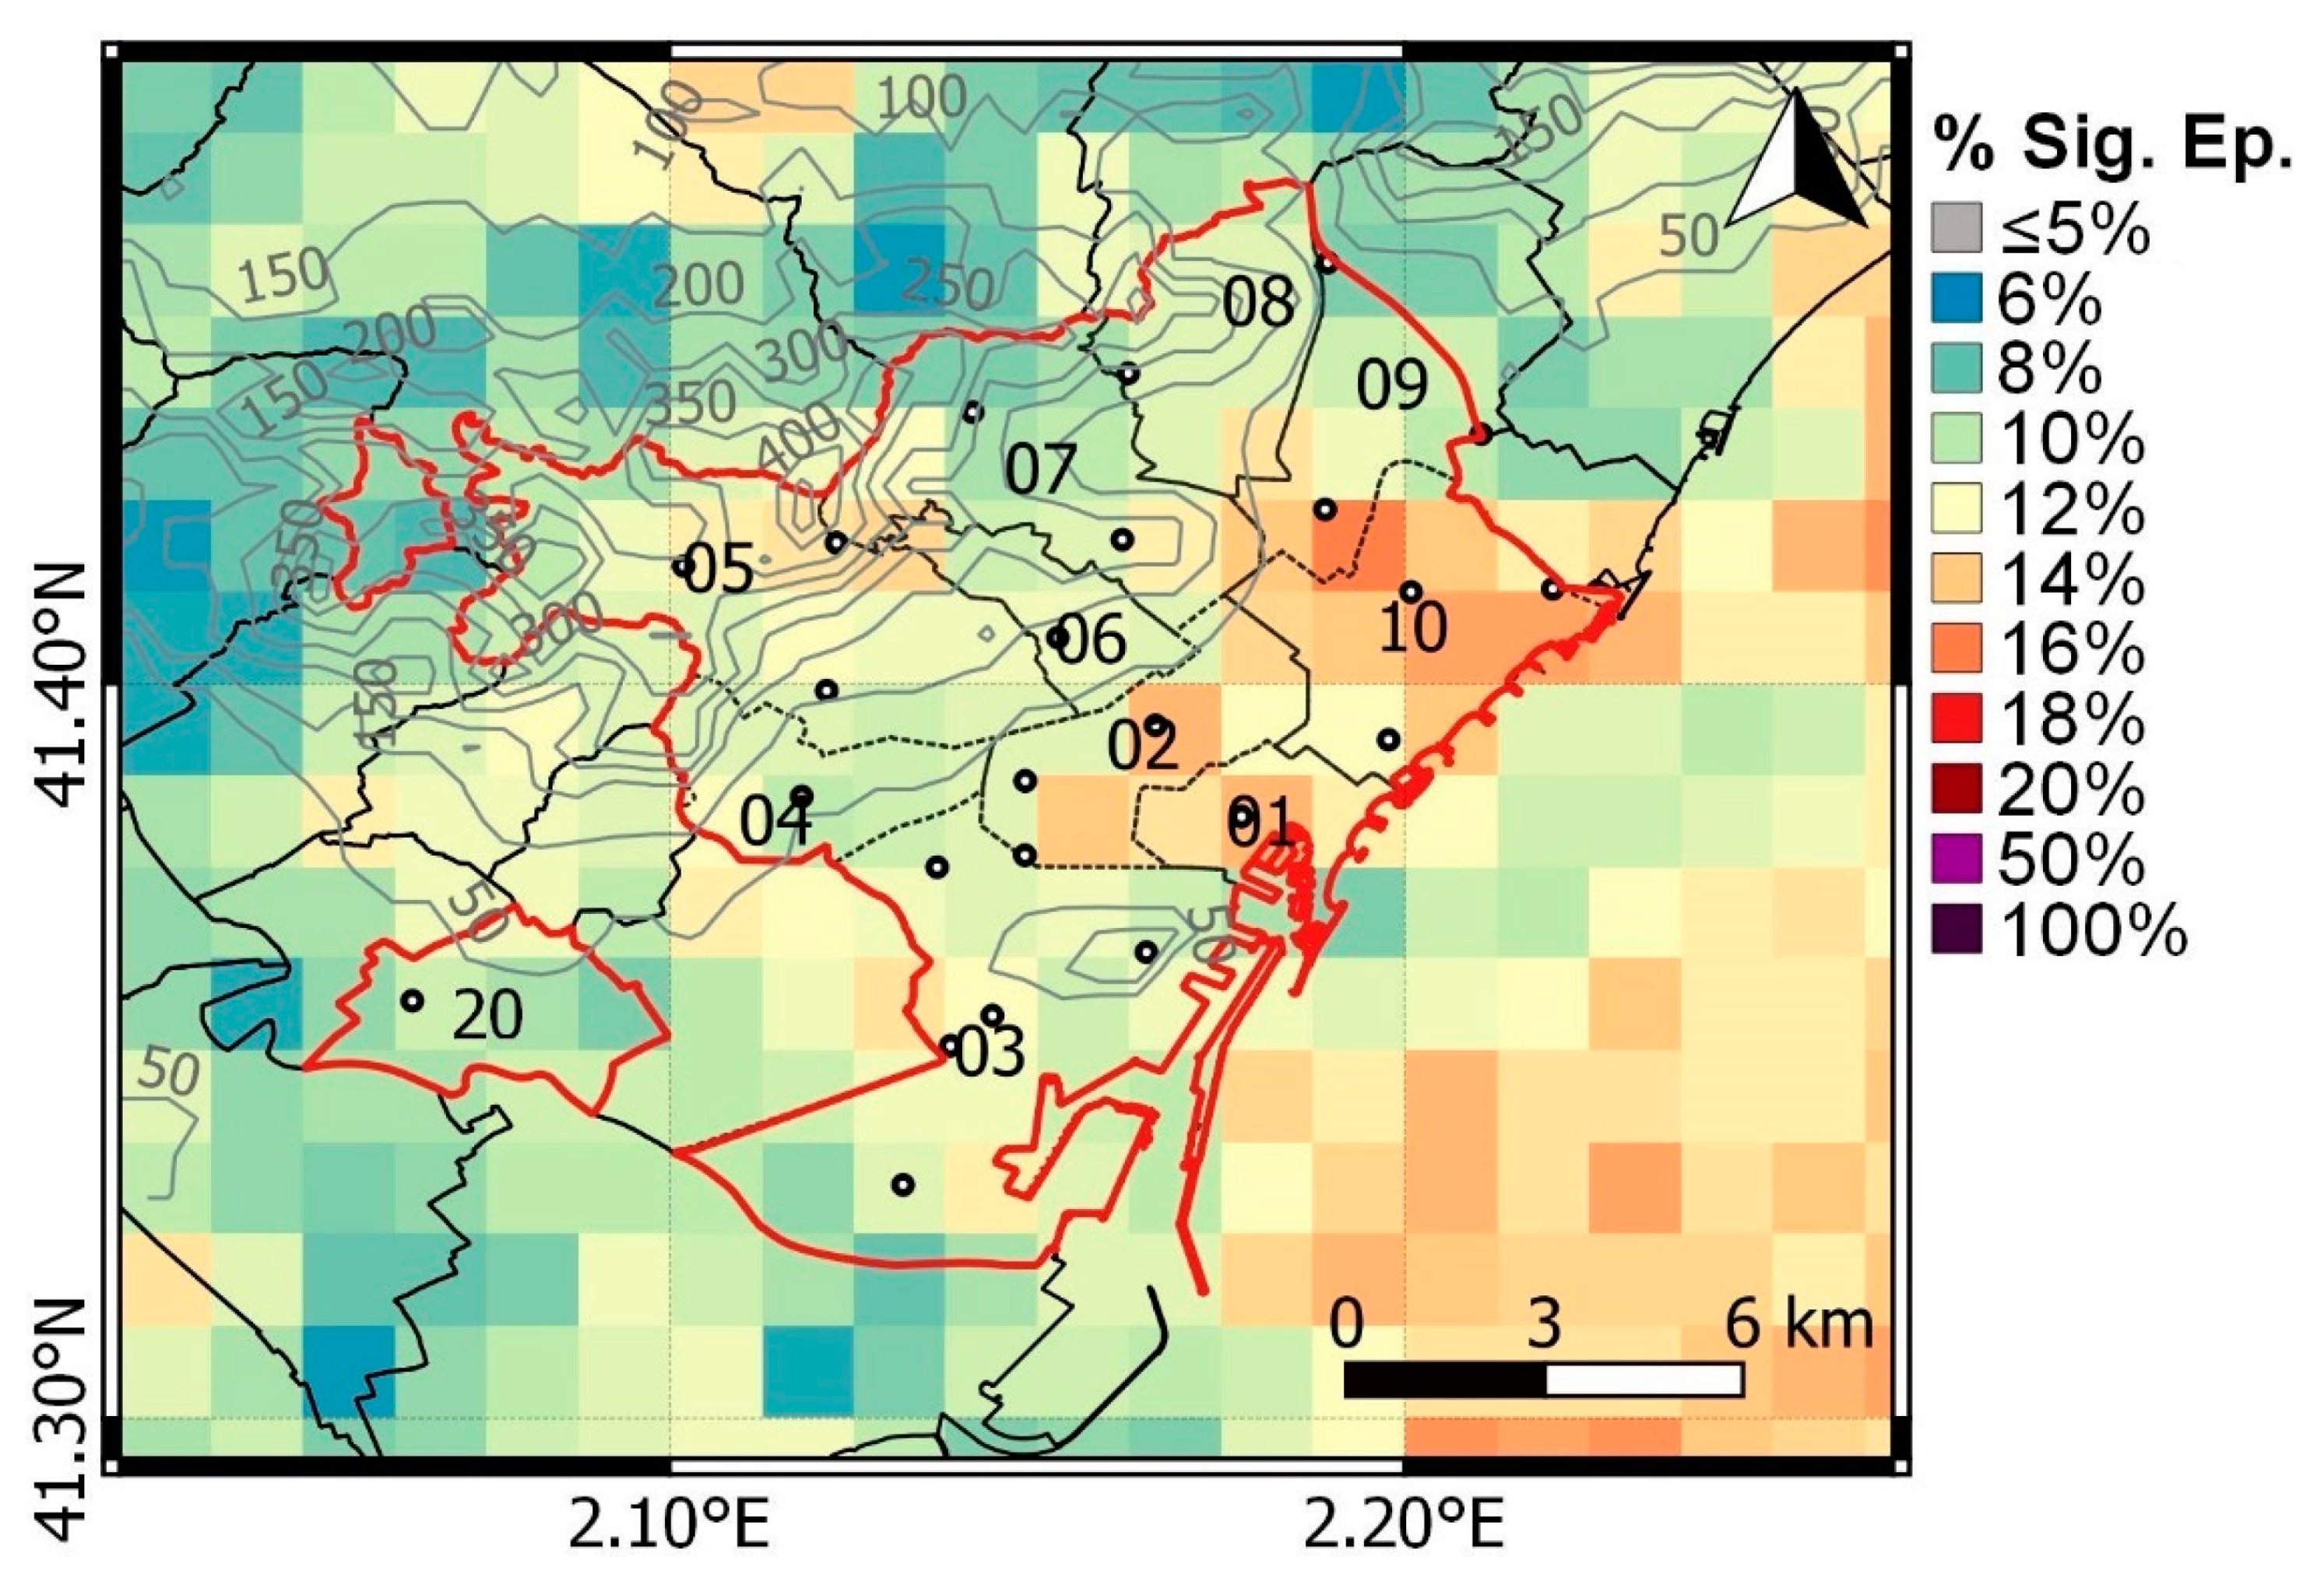
3.3.1. Analysis of Surface Maximum Reflectivity Maps

Following the first approach, the frequency of exceeding a surface reflectivity of 30 dBZ in significant rainfall episodes is shown (Figure 6). The procedure was repeated two more times, raising the target threshold to surpass a surface reflectivity of 45 dBZ (Figure 7) and once again for 55 dBZ (not shown).
Figure 6 shows the greatest concentration of pixels with the highest frequencies in the north-eastern part of the ROI, mostly near the coast. In the Sant Martí district, for more than 81% of the cases, maximum surface reflectivity exceeded 30 dBZ. Another hotspot can be observed in Ciutat Vella and Nou Barris (for more than 80% of significant episodes). Furthermore, Cornellà de Llobregat, Sant Andreu and Horta-Guinardó surpassed the threshold in up to 80% of the studied episodes. When repeating the procedure with the 45 dBZ threshold, the number of significant episodes exceeding the threshold significantly decreased (Figure 7), but three different areas had a higher frequency of episodes surpassing the threshold. This occurred in the Sant Martí and Sant Andreu districts, with maximum frequencies up to 16%, in Ciutat Vella and Eixample with frequencies around 15%, and locally in the north-eastern part of Sarrià with 14% of cases. On the other hand, surface reflectivity values above 55 dBZ were rarely achieved inside the ROI, just in 1% of the significant episodes analysed for some of the pixels inside Sarrià and Ciutat Vella districts (not shown).

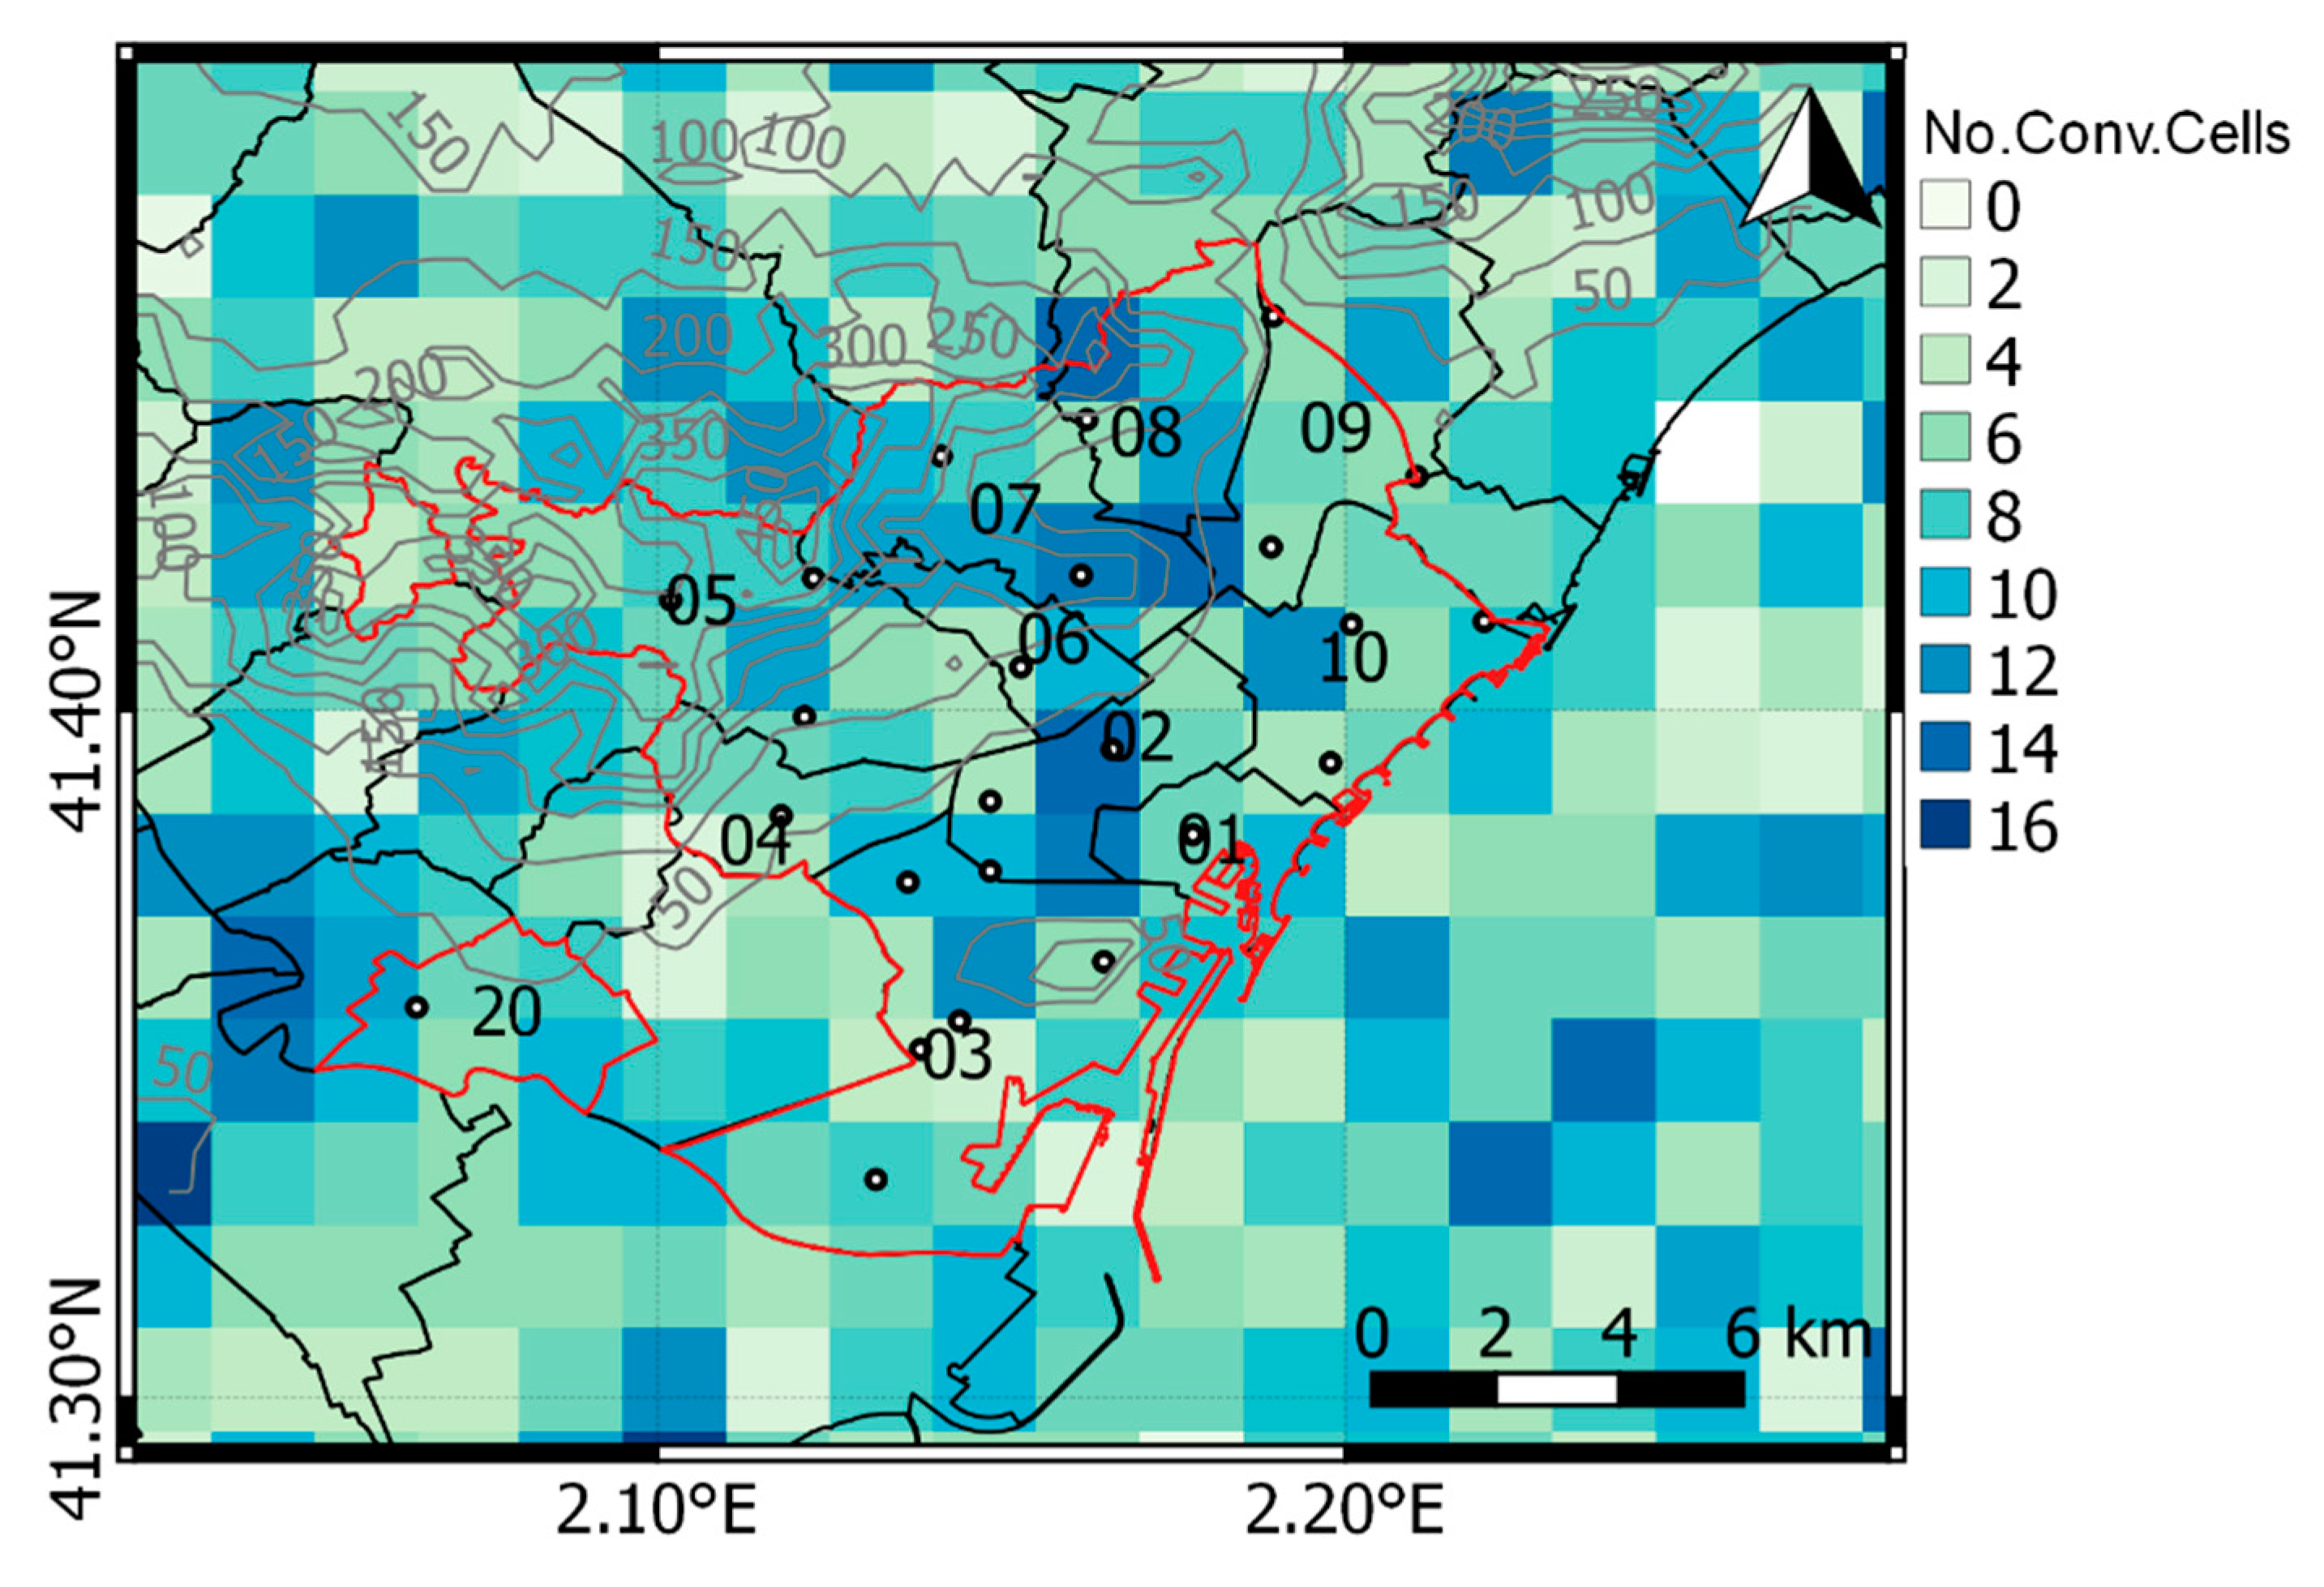
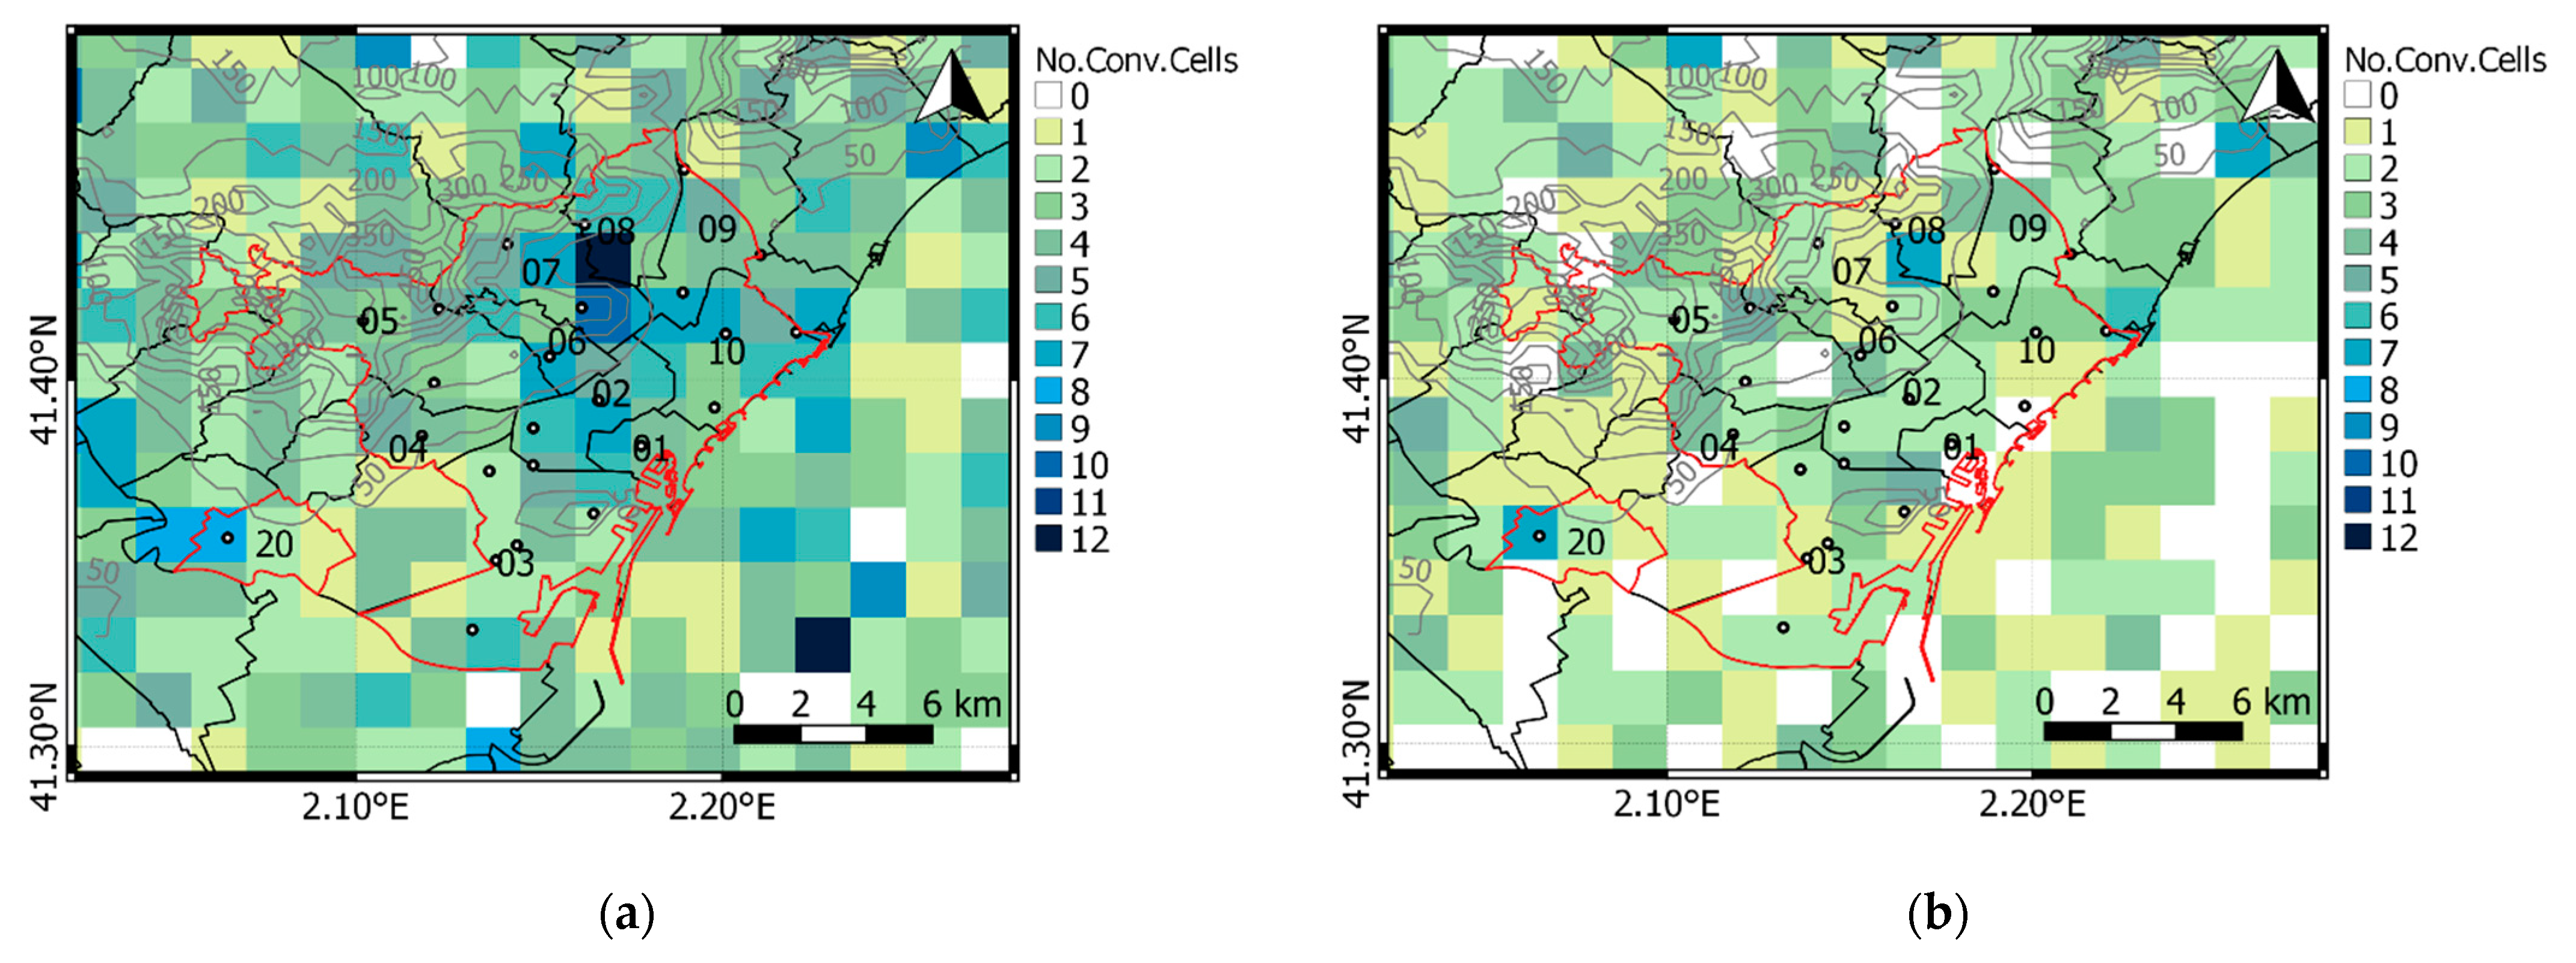
3.3.2. Analysis of Convective Cells on Rainfall Episodes

The second approach was applied to the 207 rainfall episodes to identify convective cells within the area (ROI and a surrounding 10 km buffer). As a result, more than 8000 centroids of convective cells from 189 cases were obtained. Figure 8 shows the spatial distribution of these centroids inside ROI. A higher density of centroids was identified in four different zones:
  • In the north-north-eastern part of the city, mostly affecting the Nou Barris and Horta-Guinardó districts, and the northern part of the Gràcia district.
  • Right in the middle of the city, affecting the Eixample district, southern Gràcia and northern Sants-Montjuïc.
  • The west part of the municipality of Cornellà de Llobregat.
  • In the northwest of the Sant Martí district.
Some of the mentioned districts also had high rates of surpassing the 45 dBZ threshold for surface reflectivity. Nevertheless, when comparing spatial distributions between Figure 7 and Figure 8, they were not so similar. While maximum surface reflectivity values over 45 dBZ were more prone to occur near the coastline, the centroids of storm cells tended to concentrate more inland, right in the middle of the studied area. This means that, even when the intensity of radar reflectivity is related to rainfall intensity, it is not the only factor to monitor to prevent flash floods.
For all the episodes with an NAB greater than or equal to 3, one or more convective cells were found by the algorithm. When analysing the hourly distribution of convective cells for these episodes, two maximums were obtained:
  • Around 07:00 UTC time (in the morning), a relative maximum.
  • From 15:00 to 20:00 UTC time (afternoon), reaching the peak at 17:00 UTC.
These results are consistent with a diurnal convection cycle, with the first maxima right after convection starts due to diurnal heating and the second one after the peak, causing convection to develop. Nonetheless, it is worth mentioning that a lower frequency of convective storm cells was expected during the night, especially during the early hours of the day. One possible explanation could be related to anomalous propagation on the radar display. During steady nights where a temperature inversion is more likely, anomalous propagation may generate false echoes of intense reflectivity, and the effect is most prone to occur in coastal regions [37,38]. Those echoes can be wrongly identified as storm cells.
Although the ensemble of episodes with greater NAB was limited, Figure 9 shows the spatial distribution of centroids (a) and the same for episodes with reported incidents.
When comparing Figure 8 and Figure 9, some common features are revealed. Pixels with the highest concentrations of centroids were located on the lower side of complex terrain, with a higher number of centroids per pixel in the middle of the ROI. Darker pixels on Figure 9a are similar to those in Figure 8, but with a smaller number of centroids per pixel and a larger gradient between the most affected districts and the ones that were not so affected. Both figures agree that most of the centroids were found in the districts of Nou Barris, Horta-Guinardó, Eixample and Sants-Montjuïc. On the other side, Figure 9b highlights maximum concentrations on Cornellà and on the border between Nou Barris and Horta-Guinardó districts. In addition, some pixels had slightly higher concentrations of centroids on the southern part of Gràcia, on Sarrià and les Corts and on the border between Montjuïc, Ciutat Vella and Eixample.

4. Discussion

Rainfall episodes with a greater impact on Barcelona are not the only factor linked to flood hazards, but vulnerability and exposure also play an important role [3]. Between 1351 and 2005, 85 flash floods and pluvial floods seriously affected the city of Barcelona [8]. The analysis of this long period showed a positive trend of extraordinary floods from the middle 19th century until the first years of the 20th century, that was mainly due to the walls’ destruction that partially acted as a protection in front of flash-floods; urban planning that did not include a suitable waste and drainage systems; the great population increase (from 1,555,236 in 1950 to 3,213,775 inhabitants in 2015) and the change in uses of soil [6]. The comparison between land use maps between 1956 and 2009 shows that around 80% of the agricultural soil in the area analysed was substituted by urban surfaces and the road network (increase of more than 225%) [5]. As a consequence of this change in the uses of the soil, the runoff in Barcelona increased 19% for this period. The improvements in sewerage systems and flood prevention infrastructures that were introduced in the 1990s changed the sign of this trend. Although nowadays it is negative, anomalous years can be recorded. In this sense, 2018 was an anomalous year with the greatest number of extremely intense rainfall episodes and reported incidents of the analysed period.
Identifying rainfall episodes with a combination of both XRAD and BCASA information seemed a good approach since considering a single source can lead to the detection of some non-real rainfall episodes. During the winter, XRAD had good agreement with rain gauge data about maximum cumulated precipitations in Barcelona. However, throughout May to October, radar showed higher amounts of precipitation.
Greater concentrations of convective cell centroids were identified on the lower side of the complex orography of Barcelona. This distribution did not exactly match with the locations more prone to surpass 45 dBZ (along the coastline). Some intense storms may not have high-intensity values of reflectivity, but still, they may have a high impact. It can be thought that the convective maxima near the sea are developed by the formation of convergence lines over the sea or in the coast, perhaps between the breeze and the maritime flow, while the maxima in the interior are associated with blockages and orographic forcing.
Although the pixels with the highest concentrations of centroids were different in the three different selections of episodes (Figure 7, Figure 8 and Figure 9), it is clear from Figure 8 and Figure 9 that the complex topography bounding the ROI plays a major role in the location of the storms linked to the studied centroids. The importance of small-scale topographic obstacles as a triggering factor for storms has been widely proved by several studies and models [6,39] as well as the influence of the sea and the topography on the motion of the storm systems [39]. Nevertheless, it is also important to highlight that rainfall patterns do not only respond to the influence of topography [40].
Finally, from a hazard point of view, urban flash floods response is a combination between the spatial-temporal distribution of precipitation, local drainage system and local relief inside the city [41]. In this study, only meteorological hazards and impacts were considered, but for a wider study on urban floods, it is essential to include the different urban land uses (natural drainage) and their runoff coefficients [42,43] as well as the drainage system. However, it must be said that the study by Cortès et al. [5] showed that although land uses can be very different in the Barcelona Metropolitan Area, within the ROI they are essentially non-draining ones. The undergrown water retention system and sewerage management of BCASA have been designed according to these characteristics, and they are a key point to avoid fatalities and major economic losses in the city.

5. Conclusions

During this research, a new and relatively easy methodology was established to identify convective cells in the city of Barcelona. A database was created by combining data from the BCASA rain gauge network and XRAD radar products from April 2013 to December 2018. The methods used were also able to identify some areas in the city with a greater concentration of storm centroids than others. Results showed 207 significant rainfall episodes in the ROI for the six years, which were mainly concentrated between September and November. The fact that significant episodes were usually produced by highly convective rain corroborates the advantage of using radar images as a tool to detect any maxima even when no rain gauge is there. In 64 of the episodes, the level of pre-alert was achieved with a maximum frequency between August and September. The proposed algorithm showed more than 8000 centroids of convective cells from 189 cases. While maximum surface reflectivity over 45 dBZ was more prone to occur near the coastline, the centroids of storm cells tended to concentrate more inland. Finally, from the 64 rainfall episodes that achieved the level of pre-alert or alert, a higher concentration of convective cells was found in the middle of the city with a time distribution that agrees with the maximum for convection activity (diurnal heating). The unexpectedly large number of centroids identified at night may be a consequence of unfiltered anomalous propagation.
Although this study focused on a small area, a more detailed analysis would provide a greater understanding of flash floods in Barcelona. A wider study period is needed and impacts on the city must be gathered more robustly. Furthermore, the usage of urban meteorological and hydrological models should be considered. For all these reasons, the role of specific institutions, such as BCASA, is increasingly important. Data need to be stored, cleaned, and analysed in robust ways, and monitoring and management systems need to be continually reviewed and improved in order to increase resilience to flash floods in Barcelona.

Author Contributions

Conceptualisation, L.E., M.C.L. and T.R.; methodology, L.E. and T.R.; software, L.E.; validation, L.E., T.R., B.A. and M.C.L.; writing—original draft preparation, L.E.; writing—review and editing, M.C.L. and T.R. All authors have read and agreed to the published version of the manuscript.

Funding

This research received no external funding.

Institutional Review Board Statement

Not applicable.

Informed Consent Statement

Not applicable.

Data Availability Statement

Not applicable.

Acknowledgments

This work was carried out under the framework of the SINOPTICA (H2020-SESAR-2019-2, 892362) European project of Horizon 2020 and the M-CostAdapt (CTM2017-83655-C2-2-R) research project, funded by the Spanish Ministry of Economy and Competitiveness (MINECO/AEI/FEDER, UE). The authors would like to thank BCASA for their commitment, collaboration, and data. Thanks also go to the Meteorological Service of Catalonia for their collaboration and the data provided. Finally, thanks go to the Water Research Institute (Instituto de Investigación del Agua—IdRA) and the SINOPTICA (H2020-SESAR-2019-2, 892362) European project of Horizon 2020 for enabling this paper to be written. Thank you to Hannah Bestow for her revision of the English.

Conflicts of Interest

The authors declare no conflict of interest.

Appendix A

Table A1. List of the 207 rainfall episodes inside ROI resulting from the combination of XRAD and BCASA data.
DatePmaxPmaxDatePmaxPmaxDatePmaxPmaxDatePmaxPmax
BCASAXRADBCASAXRADBCASAXRADBCASAXRAD
25 April 201317.416.217 September 20144.313.022 July 201618.621.926 January 201862.151.5
27 April 201323.62822 September 20149.720.130 August 201612.313.01 February 201816.210.0
28 April 201313.414.423 September 20146.010.010 September 201611.55.04 February 201827.938.9
29 April 201316.727.828 September 201495.4101.213 September 201624.928.15 February 201839.239.9
15 May 201332.738.329 September 201421.37.014 September 201618.220.88 February 201845.216.8
16 May 20136.717.730 September 201446.335.323 September 201657.469.412 February 201820.619.0
18 May 20137.910.85 October 201412.417.86 October 201631.528.128 February 201813.915.9
19 May 201316.523.83 November 201444.645.512 October 201661.177.720 March 201845.435.4
20 May 201310.312.14 November 201418.915.313 October 201662.254.024 March 201858.447.7
8 June 201325.128.826 November 201435.435.322 October 20168.210.026 March 201813.516.0
21 June 20135.615.527 November 201414.416.422 November 201612.613.48 April 201810.39.0
18 July 201333.43629 November 201452.140.323 November 201628.532.510 April 201810.08.0
29 July 20133.812.130 November 201440.453.327 November 201614.021.911 April 201835.430.7
26 August 201319.315.515 December 201418.618.016 December 201619.316.513 April 20186.310.7
27 August 2013219.419 January 201513.413.919 December 201616.917.914 April 201810.112.0
28 August 20132.615.14 February 201519.320.122 January 20176.913.01 May 201882.062.4
7 September 201324.423.25 February 20150.023.927 January 201723.623.113 May 20187.912.7
10 September 20131.583.44 March 201513.112.28 February 201714.216.422 May 20180.717.1
11 September 201318.210.214 March 201522.512.513 February 201719.115.829 May 201811.09.0
4 October 201314.115.821 March 201536.321.624 February 201715.714.73 June 201821.029.2
6 October 201310.424.726 March 201511.817.53 March 201716.213.06 June 201839.837.2
7 October 201317.255.819 May 201543.455.64 March 201712.710.07 June 201818.330.9
8 October 20130.613.120 May 201534.328.524 March 2017107.4101.228 June 20183.512.2
9 October 20133.814.111 June 201511.913.725 March 201724.125.616 July 201850.544.4
11 October 201313.411.215 June 201529.926.61 April 201715.413.122 July 201818.715.5
16 November 201340.156.716 June 20153.410.95 April 20179.110.117 August 201864.965.8
17 November 201343.462.931 July 201510.014.226 April 201712.910.625 August 20184.013.0
18 November 201341.449.31 August 201523.414.027 April 201725.422.930 August 201811.712.5
19 December 201310.111.513 August 201532.732.311 May 201721.916.831 August 201873.277.5
19 January 201435.425.115 August 201517.017.54 June 201724.024.11 September 201814.215.7
29 January 201428.826.718 August 201518.226.75 June 201710.312.26 September 201892.294.9
9 February 201413.913.610 September 201535.237.530 June 20178.912.97 September 201839.676.3
30 March 201413.214.323 September 201519.013.925 July 201725.346.712 September 201840.541.1
31 March 201410.912.229 September 201517.420.78 August 201714.014.215 September 20181.140.2
3 April 201455.957.830 September 201526.523.231 August 201719.618.518 September 201840.027.0
22 April 201430.512.43 October 201538.080.16 September 201711.120.87 October 201821.226.3
26 May 201426.033.07 October 201538.969.49 September 201721.330.79 October 2018102.8118.2
28 May 201428.125.28 October 20155.617.912 September 20177.533.210 October 201821.921.7
30 May 201417.719.413 October 201513.922.214 September 201714.714.213 October 201814.012.2
15 June 201427.738.926 October 20159.017.015 September 20178.010.014 October 201844.549.8
16 June 20147.014.427 October 20157.814.918 September 20176.113.619 October 201818.928.9
17 June 201414.328.42 November 201560.652.822 September 201737.117.827 October 201829.931.2
4 July 201417.017.83 November 20157.253.426 September 20179.419.028 October 20189.814.1
7 July 201430.047.227 February 201630.426.41 October 201713.435.829 October 20180.012.6
28 July 201430.539.416 March 201629.419.718 October 201729.427.831 October 201860.152.5
29 July 20146.615.120 March 201623.818.419 October 201792.095.45 November 20189.911.9
2 August 201411.916.91 April 201619.519.220 October 20176.114.29 November 201837.732.1
15 August 201414.419.95 April 201621.521.304 November 201710.814.614 November 20182.611.0
22 August 201454.355.321 April 201630.035.325 November 20179.016.315 November 2018138.5133.4
5 September 201410.914.118 June 201628.823.92 December 20170.021.418 November 201818.712.1
14 September 201418.827.313 July 20164.812.87 January 201813.919.520 November 201811.010.9
16 September 201420.346.814 July 20160.924.013 January 20189.311.2
Table A2. Rainfall episodes in Barcelona with NAB levels greater than or equal to 3. Maximum cumulative values of precipitation from radar data and rain gauges data are also provided along with the NAB level achieved and the number of incidents reported to Barcelona City Council.
DatePmax RadPmax BCASANABIncidents
8 June 201328.825.1415
18 July 201336.033.44
7 September 201323.224.43
4 October 201315.814.13
17 November 201362.943.43
19 January 201425.135.44
29 January 201426.728.83
3 April 201457.855.9429
22 April 201412.430.53
26 May 201433.026.0328
28 May 201425.228.13
30 May 201419.417.738
15 June 201438.927.736
17 June 201428.414.332
4 July 201417.817.03
7 July 201447.230.03
28 July 201439.430.5420
29 July 201415.16.63
2 August 201416.911.93
15 August 201419.914.43
22 August 201455.354.348
14 September 201427.318.83
16 September 201446.820.33
28 September 2014101.295.4426
30 September 201435.346.33
3 November 201445.544.6434
26 November 201435.335.437
29 November 201440.352.135
30 November 201453.340.431
19 May 201555.643.431
20 May 201528.534.334
1 August 201514.023.43
13 August 201532.332.734
15 August 201517.517.03
10 September 201537.535.236
29 September 201520.717.43
30 September 201523.226.53
3 October 201580.13831
7 October 201569.438.93
2 November 201552.860.642
20 March 201618.423.83
18 June 201623.928.83
13 September 201628.124.93
23 September 201669.457.43
6 October 201628.131.5458
13 October 201654.062.23
24 March 2017101.2107.4411
25 July 201746.725.33
31 August 201718.519.63
19 October 201795.492.0464
26 January 201851.562.13
1 May 201862.482.03
6 June 201837.239.83
16 July 201844.450.5472
17 August 201865.864.9425
31 August 201877.573.23
6 September 201894.992.2472
7 September 201876.339.63
12 September 201841.140.5411
18 September 201827.040.03
9 October 2018118.2102.8479
14 October 201849.844.53
9 November 201832.137.73
15 November 2018133.4138.5494

References

  1. Marchi, L.; Borga, M.; Preciso, E.; Gaume, E. Characterisation of Selected Extreme Flash Floods in Europe and Implications for Flood Risk Management. J. Hydrol. 2010, 394, 118–133. [Google Scholar] [CrossRef]
  2. Llasat, M.C.; Barriendos, M.; Barrera, A.; Rigo, T. Floods in Catalonia (NE Spain) since the 14th Century. Climatological and Meteorological Aspects from Historical Documentary Sources and Old Instrumental Records. J. Hydrol. 2005, 313, 408–418. [Google Scholar] [CrossRef]
  3. Llasat, M.C.; Llasat-Botija, M.; Rodriguez, A.; Lindbergh, S. Flash Floods in Catalonia: A Recurrent Situation. Adv. Geosci. 2010, 26, 105–111. [Google Scholar] [CrossRef] [Green Version]
  4. Barnolas, M.; Llasat, M.C. A Flood Geodatabase and Its Climatological Applications: The Case of Catalonia for the Last Century. In Natural Hazards and Earth System Science; European Geosciences Union: Munich, Germany, 2007; pp. 271–281. [Google Scholar] [CrossRef] [Green Version]
  5. Cortès, M.; Llasat, M.C.; Gilabert, J.; Llasat-Botija, M.; Turco, M.; Marcos, R.; Martín Vide, J.P.; Falcón, L. Towards a Better Understanding of the Evolution of the Flood Risk in Mediterranean Urban Areas: The Case of Barcelona. Nat. Hazards 2018, 93, 39–60. [Google Scholar] [CrossRef]
  6. Gascón, E.; Laviola, S.; Merino, A.; Miglietta, M.M. Analysis of a Localized Flash-Flood Event over the Central Mediterranean. Atmos. Res. 2016, 182, 256–268. [Google Scholar] [CrossRef]
  7. Llasat, M.C.; Marcos, R.; Turco, M.; Gilabert, J.; Llasat-Botija, M. Trends in Flash Flood Events versus Convective Precipitation in the Mediterranean Region: The Case of Catalonia. J. Hydrol. 2016, 541, 24–37. [Google Scholar] [CrossRef] [Green Version]
  8. Barrera, A.; Llasat, M.C.; Barriendos, M. Estimation of Extreme Flash Flood Evolution in Barcelona County from 1351 to 2005. Nat. Hazards Earth Syst. Sci. 2006, 6, 505–518. [Google Scholar] [CrossRef] [Green Version]
  9. Llasat, M.C.; Marcos, R.; Llasat-Botija, M.; Gilabert, J.; Turco, M.; Quintana-Seguí, P. Flash Flood Evolution in North-Western Mediterranean. Atmos. Res. 2014, 149, 230–243. [Google Scholar] [CrossRef] [Green Version]
  10. Llasat, M.C.; López, L.; Barnolas, M. Flash-Floods in Catalonia: The Social Perception in a Context of Changing Vulnerability. Adv. Geosci. 2008, 17, 63–70. [Google Scholar] [CrossRef] [Green Version]
  11. Blöschl, G.; Viglione, A.; Montanari, A. Emerging Approaches to Hydrological Risk Management in a Changing World. In Climate Vulnerability: Understanding and Addressing Threats to Essential Resources; Elsevier Inc.: Amsterdam, The Netherlands, 2013; pp. 3–10. [Google Scholar] [CrossRef]
  12. Llasat, M.C.; Llasat-Botija, M.; López, L. A Press Database on Natural Risks and Its Application in the Study of Floods in Northeastern Spain. Nat. Hazards Earth Syst. Sci. 2009, 9, 2049–2061. [Google Scholar] [CrossRef] [Green Version]
  13. Nakamura, I.; Llasat, M.C. Policy and Systems of Flood Risk Management: A Comparative Study between Japan and Spain. Nat. Hazards 2017, 87, 919–943. [Google Scholar] [CrossRef] [Green Version]
  14. United Nations for Disaster Risk Reduction. Hazard. Definition & Classification Review; United Nations: New York, NY, USA, 2020. [Google Scholar]
  15. IPCC. 2014: Climate Change 2014: Synthesis Report. Contribution of Working Groups I, II and III to the Fifth Assessment Report of the Intergovernmental Panel on Climate Change; Core Writing Team, Pachauri, R.K., Meyer, L.A., Eds.; IPCC: Geneva, Switzerland, 2014; 151p. [Google Scholar]
  16. Drost, R.; Casteel, M.; Libarkin, J.; Thomas, S.; Meister, M. Severe Weather Warning Communication: Factors Impacting Audience Attention and Retention of Information during Tornado Warnings. Weather Clim. Soc. 2016, 8, 361–372. [Google Scholar] [CrossRef]
  17. Cortès, M.; Turco, M.; Llasat-Botija, M.; Llasat, M.C. The Relationship between Precipitation and Insurance Data for Floods in a Mediterranean Region (Northeast Spain). Nat. Hazards Earth Syst. Sci. 2018, 18, 857–868. [Google Scholar] [CrossRef] [Green Version]
  18. Naylor, J.; Sexton, A. The Relationship between Severe Weather Warnings, Storm Reports, and Storm Cell Frequency in and around Several Large Metropolitan Areas. Weather Forecast. 2018, 33, 1339–1358. [Google Scholar] [CrossRef]
  19. Doswell, C., III; Ramis, C.; Romero, R.; Alonso, S. A Diagnostic Study of Three Heavy Precipitation Episodes in the Western Mediterranean Region. Weather Forecast. 1998, 13, 102–124. [Google Scholar] [CrossRef]
  20. Rigo, T.; Llasat, M.C. A Methodology for the Classification of Convective Structures Using Meteorological Radar: Application to Heavy Rainfall Events on the Mediterranean Coast of the Iberian Peninsula. Nat. Hazards Earth Syst. Sci. 2004, 4, 59–68. [Google Scholar] [CrossRef] [Green Version]
  21. Bech, J.; Vilaclara, E.; Pineda, N.; Rigo, T.; López, J.; O’hora, F.; Lorente, J.; Sempere, D.; Fàbregas, F.X. The Weather Radar Network of the Catalan Meteorological Service: Description and Applications. In Proceedings of the ERAD (2004), Visby, Sweden, 1 January 2004; pp. 416–420. [Google Scholar]
  22. Cáceres, R.; Codina, B. Radar Data Assimilation Impact over Nowcasting a Mesoscale Convective System in Catalonia Using the WRF Model. Tethys 2018, 15, 3–17. [Google Scholar] [CrossRef]
  23. Trapero, L.; Bech, J.; Rigo, T.; Pineda, N.; Forcadell, D. Uncertainty of Precipitation Estimates in Convective Events by the Meteorological Service of Catalonia Radar Network. Atmos. Res. 2009, 93, 408–418. [Google Scholar] [CrossRef]
  24. Steiner, M.; Smith, J.A.; Burges, S.J.; Alonso, C.V.; Darden, R.W. Effect of Bias Adjustment and Rain Gauge Data Quality Control on Radar Rainfall Estimation. Water Resour. Res. 1999, 35, 2487–2503. [Google Scholar] [CrossRef]
  25. Barcelona Cicle de l’Aigua, S.A.; CLABSA. Informe de Pluja [Versió Resumida]: Període del 21 de Setembre al 22 de Setembre de 1995. Available online: https://bcnroc.ajuntament.barcelona.cat/jspui/handle/11703/118351 (accessed on 1 March 2021).
  26. Malgrat Bregolat, P.; Vilalta i Cambra, A.; Verdejo, J.M. Los Depositos de Retencion de Aguas Pluviales de Barcelona: Un Nuevo Enfoque en la Lucha Contra las Inundaciones y la Proteccion Medioambiental. Available online: https://www.osti.gov/etdeweb/biblio/20567346 (accessed on 7 April 2021).
  27. Berenguer, M.; Lee, G.; Sempere-Torres, D.; Zawadzki, I. A Variational Method for Attenuation Correction of Radar Signal. Proceedings of 2nd European Radar Conference, Delft, The Netherlands, 18–22 November 2002; European Meteorological Society: Delft, Holland, 2002; Volume 11. [Google Scholar]
  28. Gjertsen, U.; Sálek, M.; Michelson, D.B. Gauge Adjustment of Radar-Based Precipitation Estimates in Europe. In Proceedings of the ERAD (2004), Visby, Sweden, 1 January 2004; pp. 7–11. [Google Scholar]
  29. Rigo, T.; Llasat, M.C. Forecasting Hailfall Using Parameters for Convective Cells Identified by Radar. Atmos. Res. 2016, 169, 366–376. [Google Scholar] [CrossRef]
  30. Wilson, J.W.; Feng, Y.; Chen, M.; Roberts, R.D. Nowcasting Challenges during the Beijing Olympics: Successes, Failures, and Implications for Future Nowcasting Systems. Weather Forecast. 2010, 25, 1691–1714. [Google Scholar] [CrossRef]
  31. del Moral, A. Of Severe Thunderstorms: Radar-Based Nowcasting of Severe Thunderstorms: A Better Understanding of the Dynamical Influence of Complex Topography and the Sea. Ph.D. Thesis, University of Barcelona, Barcelona, Spain, 2020. [Google Scholar]
  32. Peleg, N.; Morin, E. Convective Rain Cells: Radar-Derived Spatiotemporal Characteristics and Synoptic Patterns over the Eastern Mediterranean. J. Geophys. Res. Atmos. 2012, 117. [Google Scholar] [CrossRef]
  33. del Moral, A.; Rigo, T.; Llasat, M.C. A Radar-Based Centroid Tracking Algorithm for Severe Weather Surveillance: Identifying Split/Merge Processes in Convective Systems. Atmos. Res. 2018, 213, 110–120. [Google Scholar] [CrossRef]
  34. Barnolas, M.; Rigo, T.; Llasat, M.C. Characteristics of 2-D Convective Structures in Catalonia (NE Spain): An Analysis Using Radar Data and GIS. Hydrol. Earth Syst. Sci 2010, 14, 129–139. [Google Scholar] [CrossRef] [Green Version]
  35. Davini, P.; Bechini, R.; Cremonini, R.; Cassardo, C. Radar-Based Analysis of Convective Storms over Northwestern Italy. Atmosphere 2012, 3, 33–58. [Google Scholar] [CrossRef] [Green Version]
  36. Llasat, M.C. An Objective Classification of Rainfall Events on the Basis of Their Convective Features: Application to Rainfall Intensity in the Northeast of Spain. Int. J. Climatol. 2001, 21, 1385–1400. [Google Scholar] [CrossRef]
  37. Bech, J.; Codina, B.; Lorente, J. Forecasting Weather Radar Propagation Conditions. Meteorol. Atmos. Phys. 2007, 96, 229–243. [Google Scholar] [CrossRef]
  38. Steiner, M.; Smith, J.A. Use of Three-Dimensional Reflectivity Structure for Automated Detection and Removal of Nonprecipitating Echoes in Radar Data. J. Atmos. Ocean. Technol. 2002, 19, 673–686. [Google Scholar] [CrossRef]
  39. del Moral, A.; del Carmen Llasat, M.; Rigo, T. Connecting Flash Flood Events with Radar-Derived Convective Storm Characteristics on the Northwestern Mediterranean Coast: Knowing the Present for Better Future Scenarios Adaptation. Atmos. Res. 2020, 238. [Google Scholar] [CrossRef]
  40. Czigány, S.; Pirkhoffer, E.; Geresdi, I. Environmental Impacts of Flash Floods in Hungary. In Flood Risk Management: Research and Practice; Taylor & Francis Group: London, UK, 2008. [Google Scholar] [CrossRef]
  41. Yin, J.; Yu, D.; Yin, Z.; Liu, M.; He, Q. Evaluating the Impact and Risk of Pluvial Flash Flood on Intra-Urban Road Network: A Case Study in the City Center of Shanghai, China. J. Hydrol. 2016, 537, 138–145. [Google Scholar] [CrossRef] [Green Version]
  42. Nardi, F.; Annis, A.; Biscarini, C. On the Impact of Urbanization on Flood Hydrology of Small Ungauged Basins: The Case Study of the Tiber River Tributary Network within the City of Rome. J. Flood Risk Manag. 2018, 11, S594–S603. [Google Scholar] [CrossRef]
  43. Díaz-Sanz, J.; Robert, S.; Keller, C. Parameters Influencing Run-off on Vegetated Urban Soils: A Case Study in Marseilles, France. Geoderma 2020, 376, 114455. [Google Scholar] [CrossRef]
Figure 1. (a) Geographical location of Catalonia and the Region of Interest (ROI). (b) ROI (in red) and the region selected to analyse radar data. White dots represent the rain gauge network managed by BCASA. The main rivers surrounding Barcelona (Llobregat and Besós) are labelled, as well as the main mountain range (Collserola).
Water 13 01730 g001
Figure 2. Map showing the north-eastern Iberian Peninsula and southern France. The black outer line represents the long-range coverage of XRAD, and the inner line represents the short-range coverage. The labels and orange dots correspond to each XRAD radar. LMI (La Miranda), CDV (Creu del vent), PBE (La Panadell), and PDA (Puig d’Arques i Cruïlles).
Water 13 01730 g002
Figure 3. Conceptual scheme of the followed methodology.
Water 13 01730 g003
Figure 4. Monthly evolution of significant rainfall episodes from April 2013 to December 2018.
Water 13 01730 g004
Figure 5. Seasonal distribution of the calculated 24 h rainfall BIAS and RMSE between XRAD products and the BCASA rain gauge network for the 207 rainfall episodes in the ROI.
Water 13 01730 g005
Figure 6. Distribution of maximum surface reflectivity surpassing 30 dBZ. It shows the frequency on each pixel for significant rainfall episodes. The grey contour lines show regions of a constant height (m). The red solid line outlines the ROI. Inside, black solid lines divide the different districts labelled as follows: 01—Ciutat Vella, 02—Eixample, 03—Sants-Montjuïc, 04—Les Corts, 05—Sarrià, 06—Sant Gervasi, 07—Horta-Guinardó, 08—Nou Barris, 09—Sant Andreu, 10—Sant Martí, and 20—Cornellà de Llobregat.
Water 13 01730 g006
Figure 7. Same as Figure 6, for 45 dBZ.
Water 13 01730 g007
Figure 8. Distribution of centroids of convective cells for significant episodes. The numbers refer to Barcelona districts, and they are detailed on Figure 6.
Water 13 01730 g008
Figure 9. Distribution of storm cells centroids across all episodes with NAB 3 or 4 (a) and for episodes with the mentioned NAB levels and reported incidents (b).
Water 13 01730 g009
Table 1. BCASA criteria to activate the alert level in Barcelona (NAB). Levels are based on two precipitation intensity thresholds (20 min intensity, I20 and 60 min intensity, I60). PAB = Forecast of a possible alert in Barcelona.
NABPABRainfall Level
High Intensity Indicator (I20)Prolonged Rain Indicator (I60)
0INACTIVE0--
1STANDBY1; 20 mm/h (T20 > 0)0 mm/h (T60 > 0)
2SURVEILLANCE20 mm/h (T20 < 0.1)10 mm/h (T60 < 0.1)
3PRE-ALERT≥330 mm/h (T20 ≈ 0.15)15 mm/h (T60 ≈ 0.15)
4ALERT50 mm/h (T20 ≈ 0.4)25 mm/h (T60 ≈ 0.4)
5EMERGENCY 70 mm/h (T20 ≈ 1)35 mm/h (T60 ≈ 1)
Table 2. Seasonal distribution of episodes with the most impact in Barcelona based on the reported incidents from April 2013 to December 2018. The seasons considered were winter (December, January, and February), spring (May, April, and March), summer (June, July, and August) and autumn (September, October, and November). The values shown are the number of episodes for each category (NAB equal to 3 or 4) per season, observed maximum, minimum and median values for maximum cumulated precipitation in an episode for each season, and 25 and 75 percentiles for the same variable for each season.
SeasonNAB 3NAB 4
No. of Ep.Pmax 24h (mm)No. of Ep.Pmax 24h (mm)
MaxMinMed25%75%MaxMinMed25%75%
Winter0-----0-----
Spring433.0012.4026.8526.2338.652101.2057.8079.5068.6590.35
Summer326.1530.3535.6065.8028.80565.8028.8044.4039.4055.3
Autumn540.3037.5053.30133.4028.109133.4028.1094.9045.50101.2
Publisher’s Note: MDPI stays neutral with regard to jurisdictional claims in published maps and institutional affiliations.

