
Appraising the Impact of Pressure Control on Leakage Flow in Water Distribution Networks


1
Department of Electrical Engineering, University of South Africa, Florida 1709, South Africa
2
Department of Electrical Engineering, Tshwane University of Technology, Pretoria 0183, South Africa
3
École Supérieure d’Ingénieurs en Électrotechnique et Électronique, 2 Boulevard Blaise Pascal, 93160 Noisy-Le-Grand, France
4
Laboratoire d’Ingénierie des Systémes de Versailles, Université de Versailles Saint-Quentin-en-Yvelines UVSQ, Université Paris-Saclay, 10-12 Avenue de l’Europe, 78140 Vélizy, France
*
Author to whom correspondence should be addressed.
†
These authors contributed equally to this work.
Water 2021, 13(19), 2617; https://0-doi-org.brum.beds.ac.uk/10.3390/w13192617
Submission received: 1 July 2021
/
Revised: 13 September 2021
/
Accepted: 14 September 2021
/
Published: 23 September 2021
(This article belongs to the Special Issue Urban Water Networks Modelling and Monitoring)
Abstract
:Water losses in Water Distribution Networks (WDNs) are inevitable. This is due to joints interconnections, ageing infrastructure and excessive pressure at lower demand. Pressure control has been showing promising results as a means of minimising water loss. Furthermore, it has been shown that pressure information at critical nodes is often adequate to ensure effective control in the system. In this work, a greedy algorithm for the identification of critical nodes is presented. An emulator for the WDN solution is put forward and used to simulate the dynamics of the WDN. A model-free control scheme based on reinforcement learning is used to interact with the proposed emulator to determine optimal pressure reducing valve settings based on the pressure information from the critical node. Results show that flows through the pipes and nodal pressure heads can be reduced using this scheme. The reduction in flows and nodal pressure leads to reduced leakage flows from the system. Moreover, the control scheme used in this work relies on the current operation of the system, unlike traditional machine learning methods that require prior knowledge about the system.
1. Introduction
The existence of leakages in water supply systems is inevitable. The nature of their interconnection renders them susceptible to wear and tear and therefore resulting in water losses. Management of these leakages now becomes a critical task considering the scarcity of the resource, mostly in sub-Saharan Africa.
For water distribution networks (WDNs), leakage minimisation has been the subject of research dating from the early 80s [1]. With the ageing water supply infrastructures, water utilities and municipalities are faced with more frequent occurrences of pipe breaks and increased leakages. In South Africa, it is estimated that annually, 7 billion ZAR is lost as a result of leakages on the nodes, pipes or valves [2,3]. Furthermore, the United State of America experiences almost 20% of water loss due to leakages [4].
Globally, the demand for water supply has increased due to steady population growth [5]. However, a significant portion of water is lost as a result of leakages in WDNs [6]. However, it is asserted in [7] that reducing the leakage component to zero is neither technically nor economically feasible. Water loss may pose a great threat to the availability of this important scarce resource [8]. The quantity of water lost due to leakages varies from different networks. The operation, state of the network and the location of the network determine the quantity of water lost.
To date, pressure management is a strategy under research for effective leakage minimisation [9,10,11,12]. Installation of pressure reduction valves (PRVs) and their appropriate setting has the potential to reduce the pressure profile of the network [13]. In addition, this intervention was shown to not affect the water age and quality [14]. However, the type of the PRVs and the control strategy to be used may need to be carefully selected, given that the laboratory tests in [15] showed some pressure oscillation when using the piston-actuated PRVs. Furthermore, it was shown in [16] that model formulation of the said PRVs bears relevance in the solution of the nonlinear programming (NLP) formulated for pressure control.
Consequently, various strategies are being proposed to determine the appropriate setting of PRVs based on hydraulic simulation of the network. Radical advances in control theories are unlocking the potential for effective leakage management in a water distribution network (WDN) and enhanced efficiency in their operation. The foundation for applications of control theories is based on fixed outlet pressure control (FOPC), time-modulated pressure control approach (TMPC), flow modulated pressure control (FMPC), closed-loop pressure control (CLPC) [5,17,18].
Various strategies ranging from classical [19] to more recent advanced [20] control laws are being used for PRVs settings. The shortfall of control precision of classical control laws was raised in refs. [21,22]. As a result, efforts to mitigate the shortfalls are evident in [21] where the fuzzy-based system was integrated into the classical PID controller for pressure control. Furthermore, Page et al. proposed a parameter-less P controller to adjust the pressure in WDN instead of classical P-controller. Further improvements could are considered in [23] and the stability of the controller, approaches for stability improvements are put forward. The strength of the proposed improvement relates to their performance as the demand offset becomes higher. Advanced control schemes, such as model predictive control [24,25] and adaptive reference control [26,27], were also applied for pressure regulation in water distribution. The strength of these schemes lies in the fact that they re-develop a control problem into an optimisation problem [28]. Different optimisation formulations exist for pressure regulation in water supply systems. More recently, a nonconvex NLP-based control scheme was proposed in [29]. This scheme was seen to be superior to the state-of-the-art global optimisation solvers Without a consensus in optimisation formulation, this area has been left open to further development. In addition, the Water 4.0 [30] imperatives could lead to a need for further improvement in the optimisation formulation given that the possibilities of sensing and communication are opening up. An extension of the work is presented in [31], whereby the grey-box model developed from simulated step response experiments consists of sum of transport delays.
An inherent problem in pressure is the availability of adequate measurements. However, it was shown in [26] that partial pressure information from a critical node could be used to effectively control the system’s pressure. In [32], a graph theory approach was adopted to identify vulnerable components of the WDN. It was observed that 77% of the identified critical links are connected to the actuator node. Kazeem et al. identify critical links as pipes with leakages above the given threshold [2].
This work proposes the utilisation of a model-free scheme to control pressure via settings of PRVs. The model-free scheme comprises the water network emulator based on a quadratic approximation of the hydraulic simulation. A reinforcement learning scheme is put forward as a controller, interacting with the hydraulic simulation’s emulator and providing an optimal setting for pressure-reducing valves in water distribution networks. The strength of this scheme could be attributed to its ability to generate control settings without interaction with the model. This could be useful in case that an ageing infrastructure needs to be managed in order to reduce water and prevention of introduction of a harmful agent into the water network. In addition, this work put a novel greedy algorithm for the identification of the critical node in WDNs. The significance of the identification of these nodes stems from the fact that they could be easily experienced under or overpressure as the demand varies and special treatment must be given by the control agent.
The rest of the paper is organised as follows: In Section 2 the model for the hydraulic simulation of the WDNs is presented. In addition, the procedure for the determination of critical nodes is also given in Section 2. Section 3 gives the formulation of of the quadratic approximation and the reinforcement learning approach used for PRVs control. The leakage flow model is given in Section 4. The results of the numerical experiment and their discussions are presented in Section 5, while some concluding remarks are given in Section 6.
2. Water Distribution Network Modelling
Ordinarily, the solution (hydraulic simulations) of the water distribution networks (WDNs) is obtained by solving the system of equations in (1)
In Equation (1), Q and L are the flows through the pipes and the quantity of water withdrawn at the demand nodes. The known pressure head at the supply nodes is denoted by , while represents the pressure head at the demand nodes. A is the diagonal matrix of head losses along the pipes. and represents the components of the decomposed incidence matrix. The incidence matrix is defined as:
Identification of Critical Node
A critical node in WDNs is commonly referred to as the sensitive node (i.e., the node with highest pressure head variation as the demand changes) [33,34]. This node could easily encounter under or over pressure as the varies over the day. To identify the critical node, this work expresses the sensitive index as
and
where is the reference head pressure. For the demand at period i, a vector ranking nodes in descending order of the head variation could be written as
where is the node with the highest variation and has the lowest variation. Given the variation threshold as , nodes with a variation that is less than could be eliminated to have a vector with length z. The number of critical nodes z is predetermined and remains the same for all variations (i.e., for each variation, only z nodes are taken as critical). For m demand variation, the critical node’s index (CNI) matrix is obtained as
A vector could be obtained by reshaping . will be the node with the highest appearances in and the one having the largest variations. The solution to the critical node identification can be obtained using a greedy algorithm in Algorithm 1.
| Algorithm 1: Greedy Algorithm for Identification of Critical Nodes. |
 |
3. Model-Free Approach
Determination of optimal settings of the PRVs has been widely used to control the pressure in WDNs. However, in most cases, only limited measurements are available to make a judgement on the state of affairs. However, it has been shown that the information on the critical node could be sufficient to give an overall picture of the pressure in the system [26]. In addition, control based on these selected nodes can affect the excessive pressure in other nodes [35].
Given a set of measurement of pressure at a critical node () with corresponding demand , the control problem would be to determine optimal PRVs settings to regulate the pressure within the given bounds. Using model-based approaches, these settings could be determined and the generated dataset be used to develop an emulator for the process [31]. The emulator could be in the form of a function p, such that,
In view of the quadratic nature of the WDN in Equation 1, this work uses a quadratic function as
where x is a vector of comprising of a set of control inputs and the demand (i.e., ). and are the matrices of coefficients of the quadratic formula and c is the constant. In matrix form, Equation (8) can be expressed as
Optimal PRVs Control
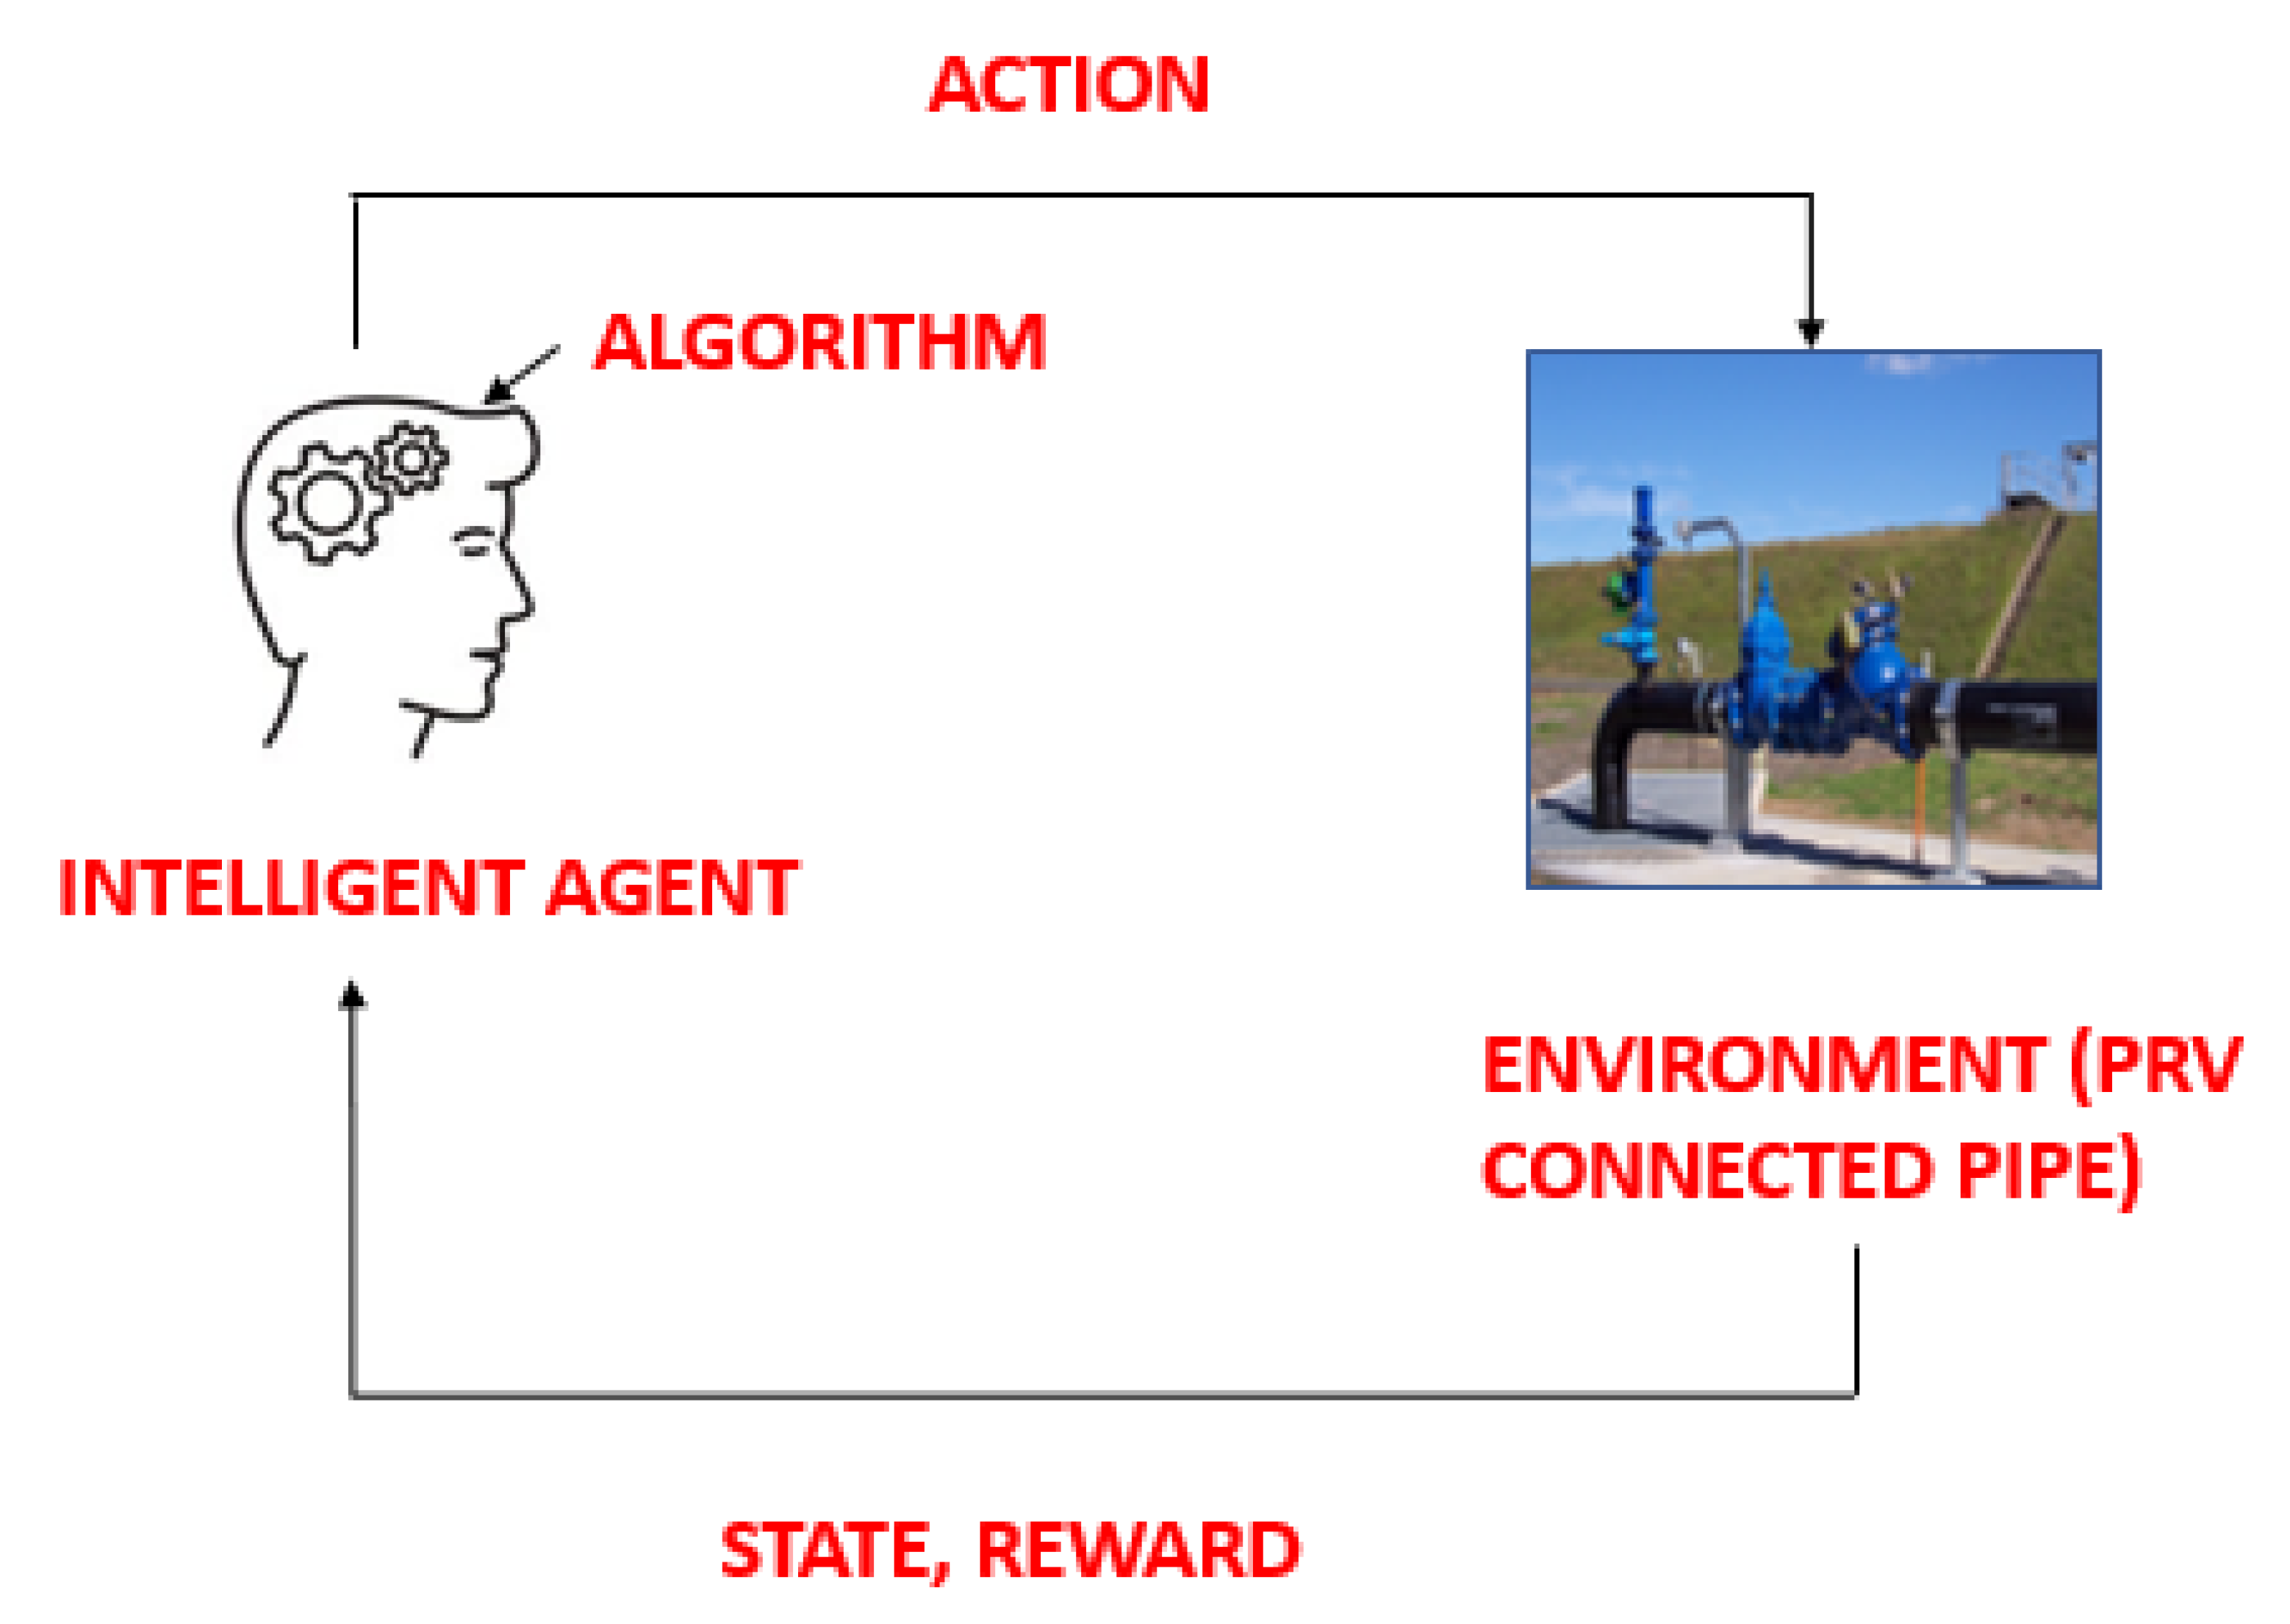
In this work, a reinforcement learning approach to determine the optimal control of the PRVs is presented. As a subset of machine learning, reinforcement learning differs from the supervised and unsupervised scheme in that it interact with the agent that is controlling and therefore makes it more suitable for dynamic environments.
In Figure 1, the state (s) and action (a) are the demand (L) and the proposed PRV settings (). The reward r is given to the agent, and it is based on the effectiveness of the proposed action (i.e., based on the value function ). The agent is rewarded with a positive integer if the actions proposed yield satisfactory results and a negative integer for the opposite. To avoid undesirable conditions, the actions are constrained to be , 0 being a fully closed valve and 1 as a fully open valve. The resulting r and a are used to update the control policy of the agent. A value iteration algorithm is used in this work to update the policy of the agent. The flowchart of the algorithm is shown in Figure 2.
4. Leakage Flow Model
Leakages in WDNs occur in both the nodes and along the pipes. The leakage flow along the pipe could be expressed as
where and l are the leakage discharge coefficient and length of the pipe, respectively. The mean pressure along the pipe in Equation (10) is represented by H. For number of pipes, Equation (10) can be written in vector format as
5. Results and Discussion
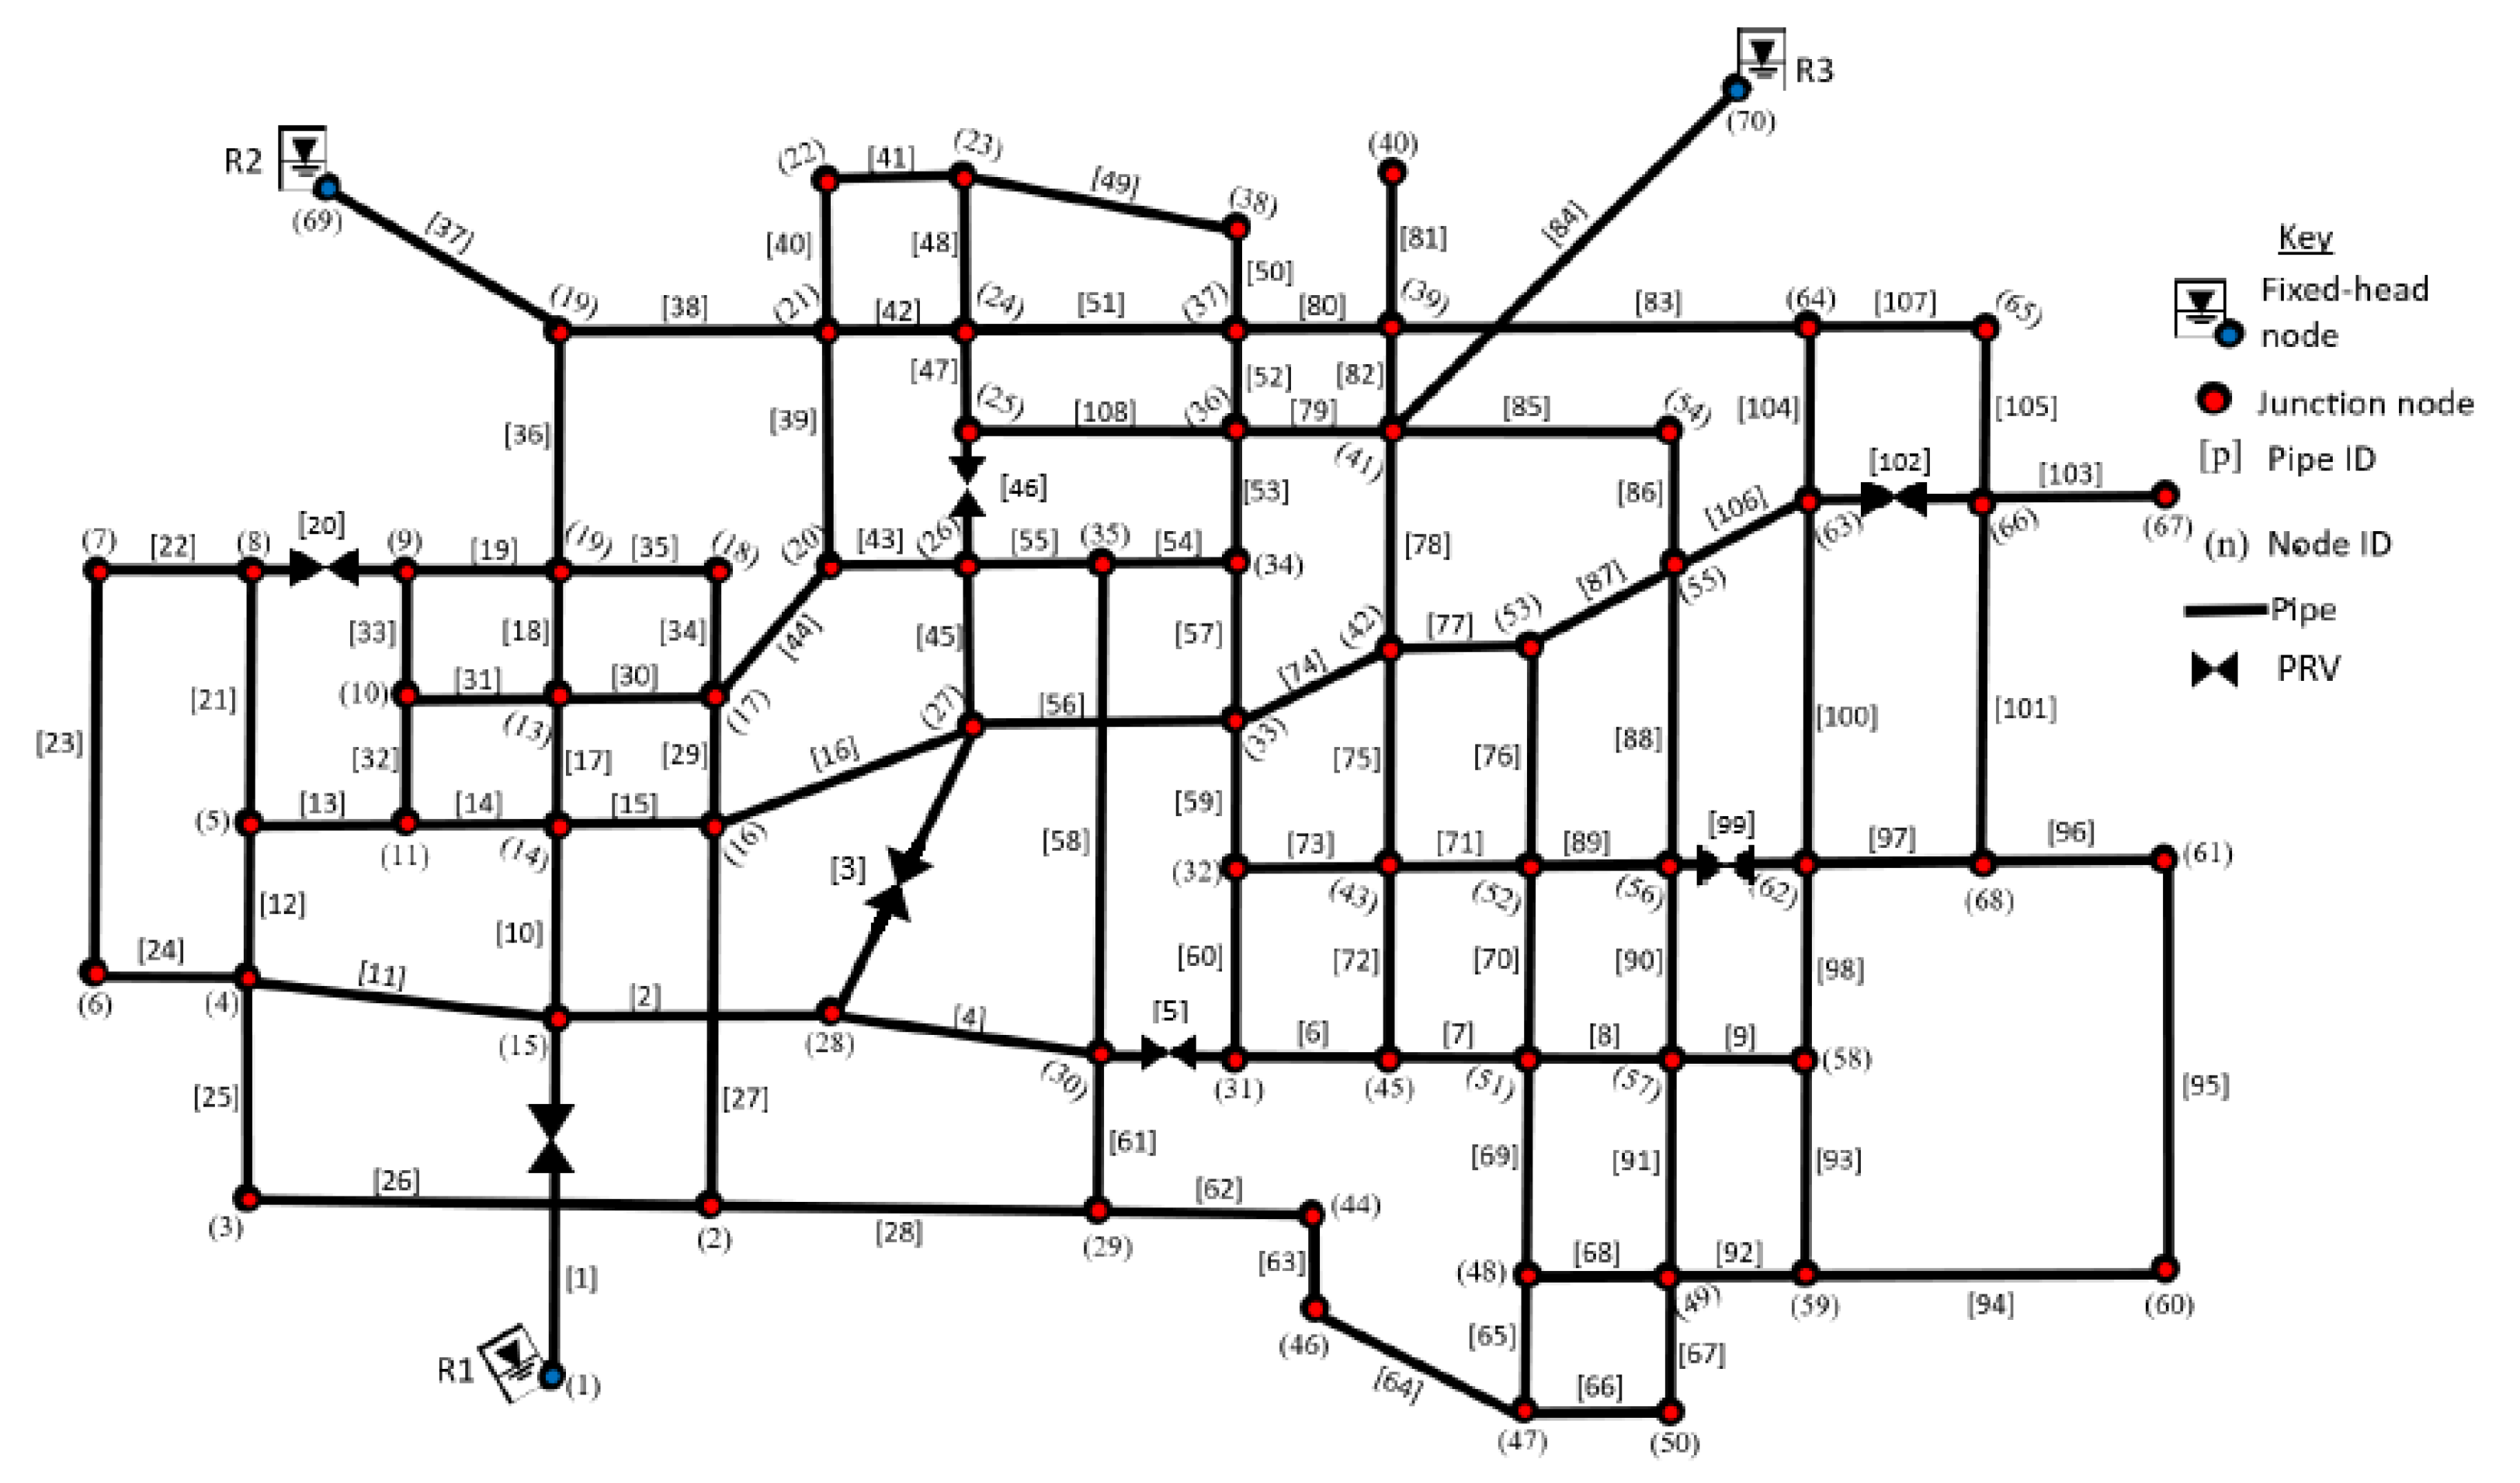
Figure 3 presents a schematic of the test case used. The network has 108 pipes and 70 nodes. Three nodes (1, 69, 70) are the fixed head nodes or supply nodes. Seven (7) PRVs are installed in pipes 1, 3, 5, 20, 46, 99 and 102 of the WDN. Parameters of the case study network can be found in Appendix A.
Application of Algorithm 1 with the maximum and minimum residential demand pattern in [36] identified node 59 as the critical node. The sensitivity index rankings are presented in Table 1 for maximum and minimum demand.
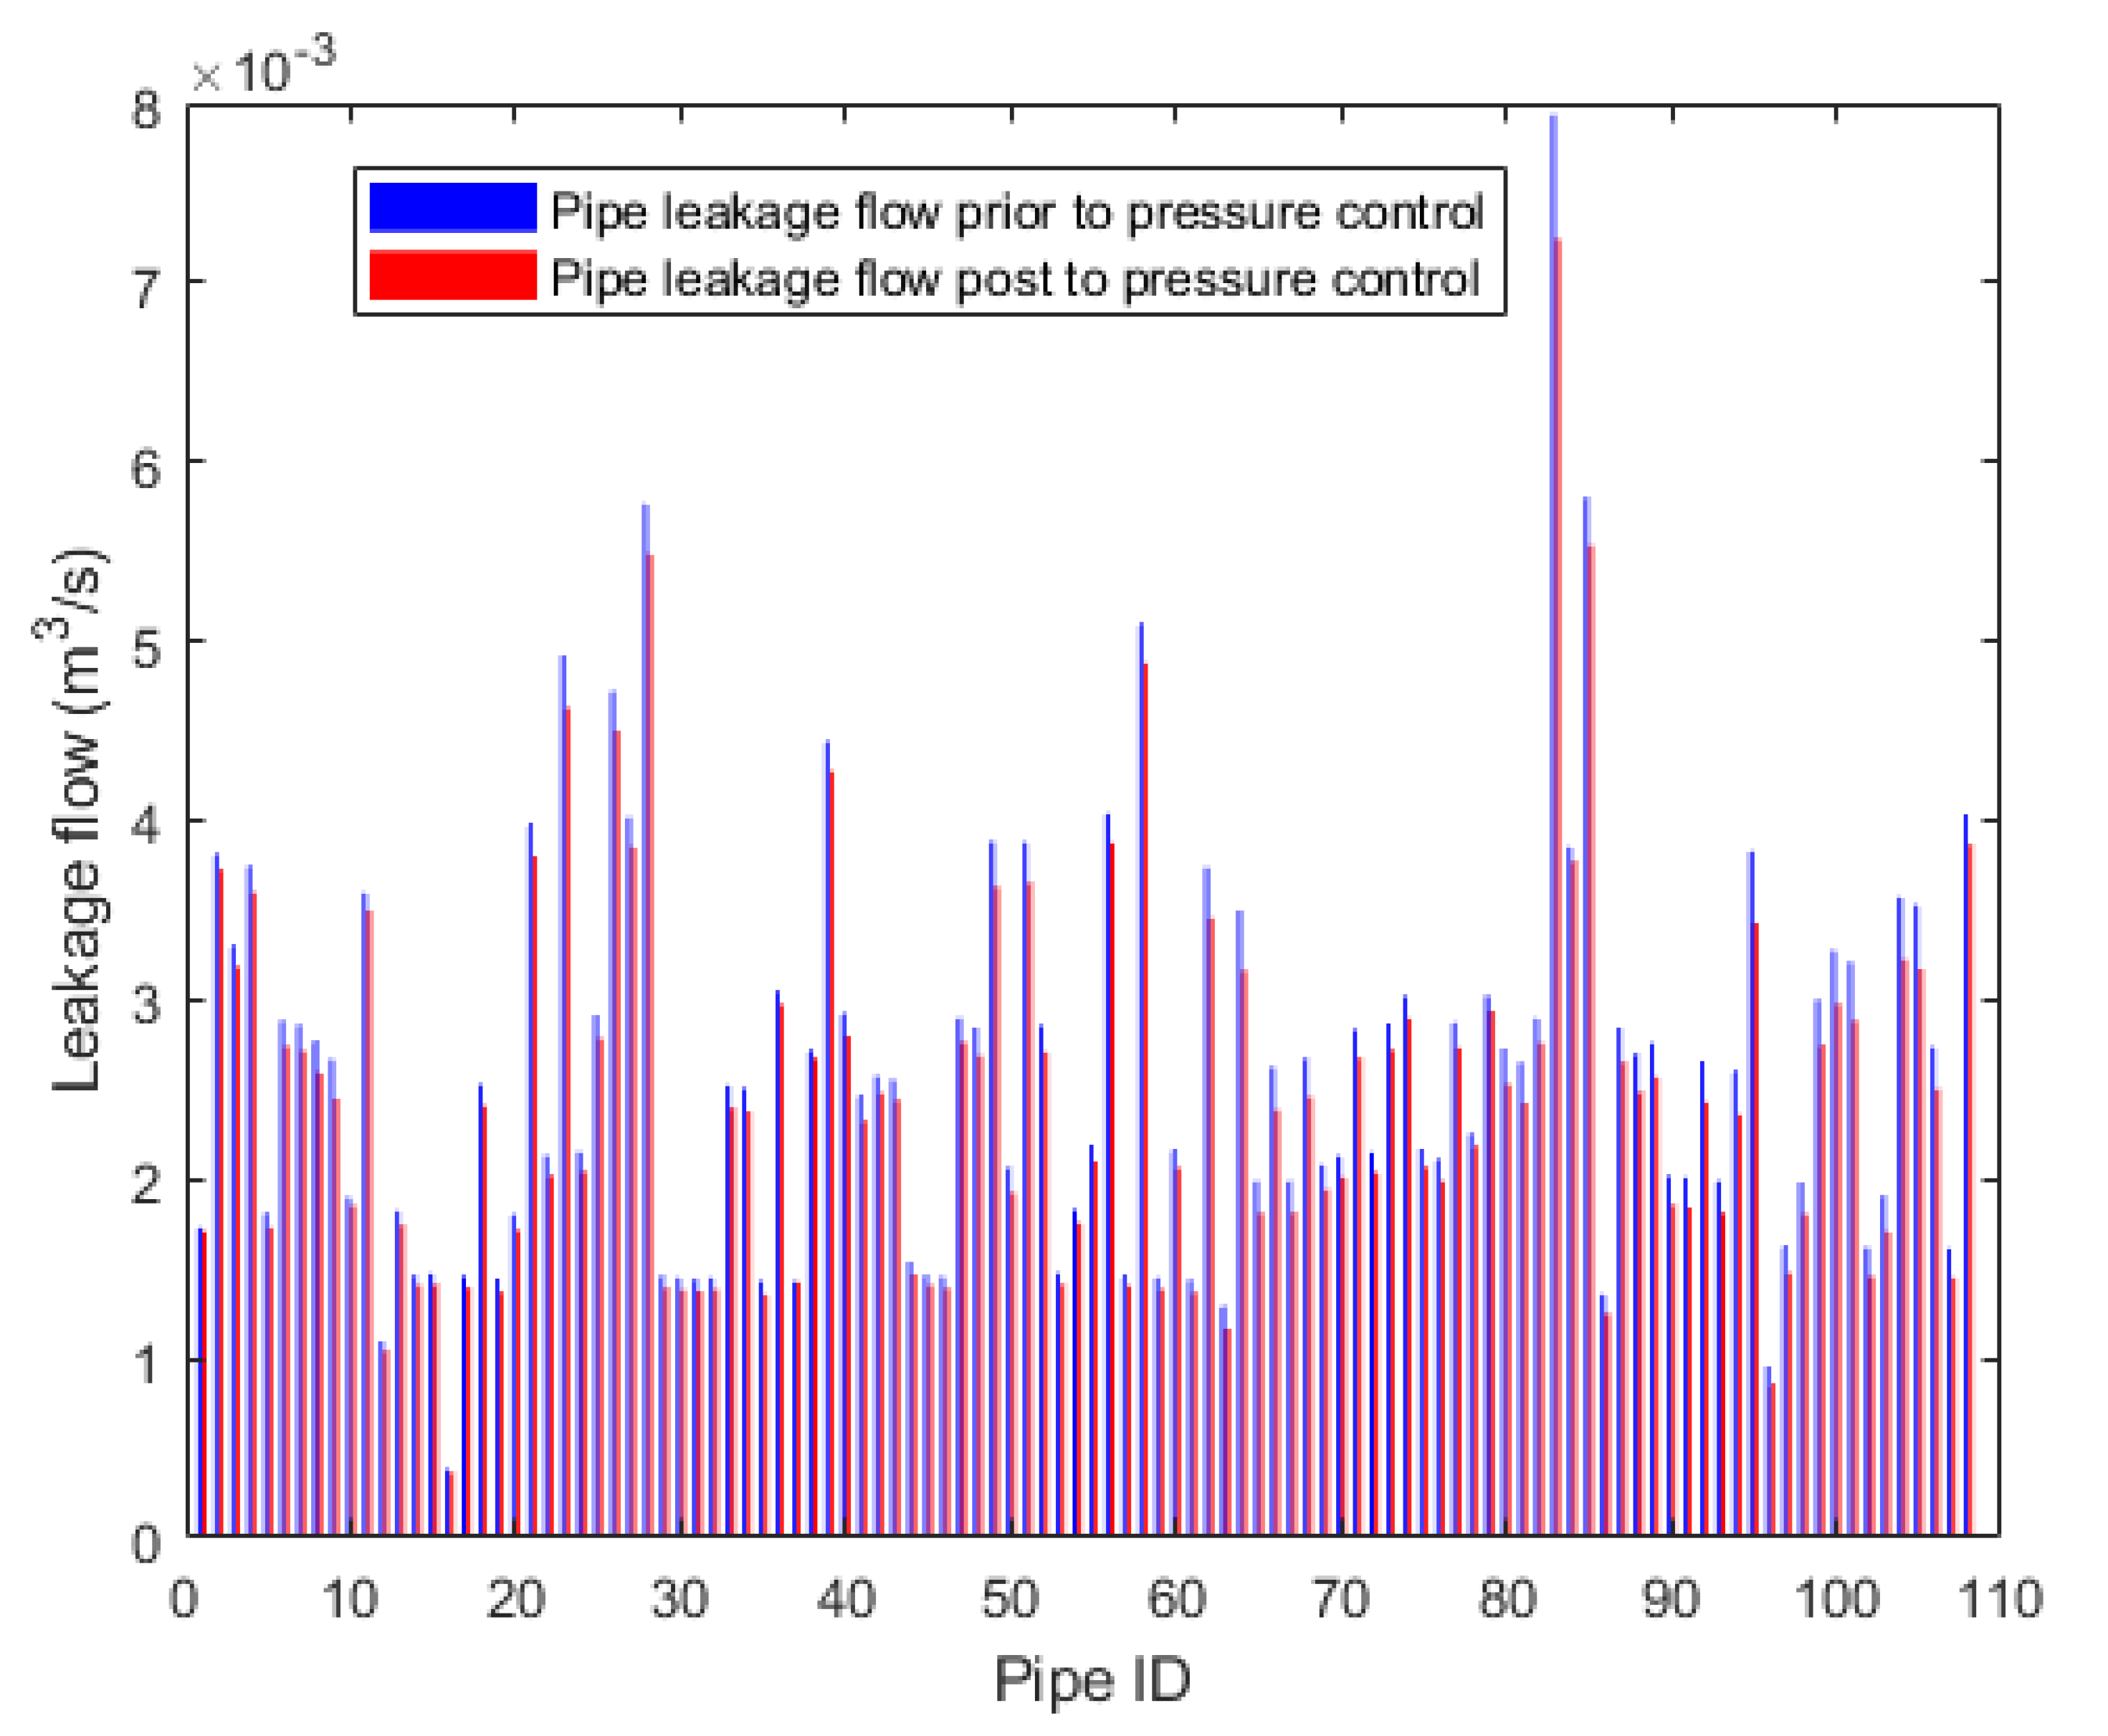
Evidently, it can be seen that the maximum demand yields the highest sensitivity index. This can be attributed to a dip in pressure head and therefore leading to a higher . The flow in normal pipes and leakage flows are shown in Figure 4.
It can be seen that the leak is in fact a fraction of the total flow. However, given the scarcity of water resources, these losses cannot be afforded. Furthermore, since it occurs continuously over time, the effect of this loss could be detrimental. Moreover, these leaks could introduce infections into the network should the pressure not be properly managed and if there are inflows through the orifices [11].
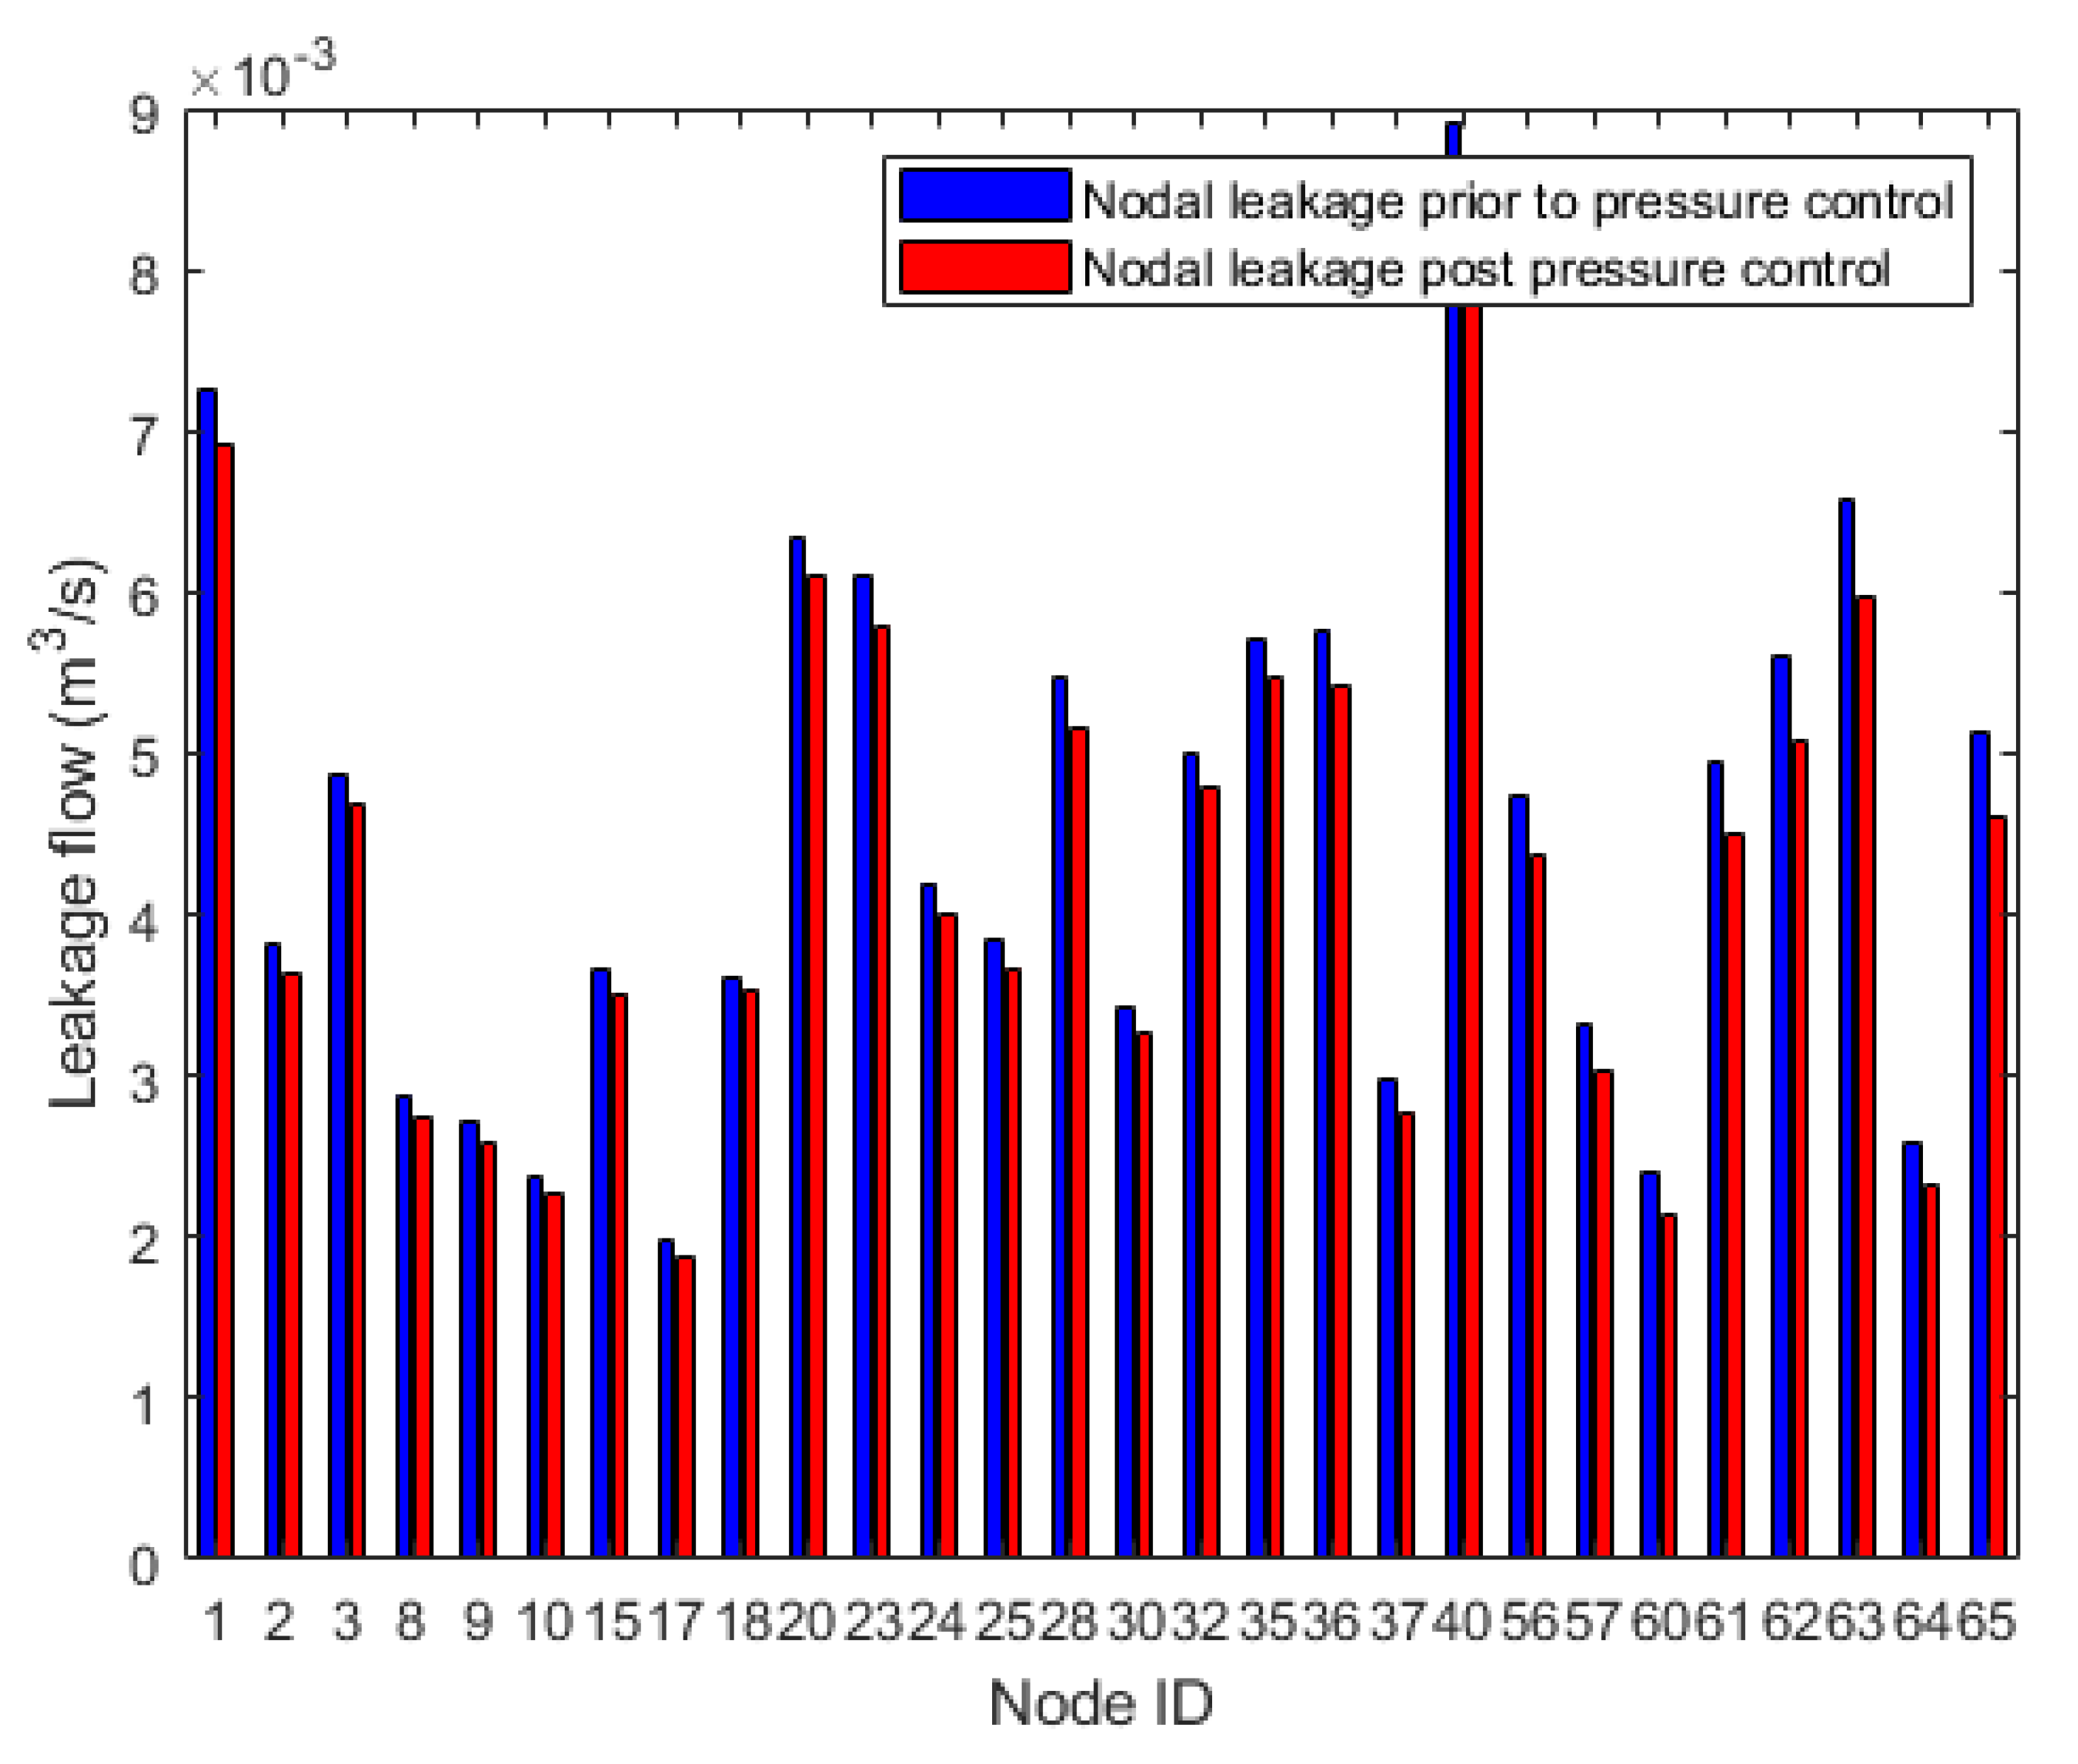
Figure 5 shows the effect of the implementation of the control scheme proposed. Evidently, the flow through the pipes is reduced. This can be attributed to the fact that pressure-reducing valves (PRVs) reduce the effective diameter of the pipes where they are installed. The reduced flow in the pipes leads to reduced leakage flows. Moreover, unnecessary flows are alleviated and therefore reduce the stresses commonly confronting the pipes with low nodal withdrawals. Nodal leakage flows are presented in Figure 6. It can be seen that the leakage flows through the nodes are reduced. This is the direct evidence of pressure control interventions. The results support various studies carried out in the literature [12,13,35,37,38]. It can further be seen that nodes with the highest leakages prior to pressure control have the greatest reduction in leakage flow post the implementation of the proposed scheme. The largest reduction from Figure 6 stands at 10.64% while the lowest is at 1.71%. As expected, the node with the highest leakage flow reduction is at a lower stream of the PRV (Pipe 102). The node with the lowest decrease (Node 18) has no PRV connected to it. Nevertheless, this shows that few PRVs connected in the network affect the operation of the system.
Among the methods reviewed in [39,40], it was evident that machine-learning-based techniques would play a huge role in the future of WDN management. Nevertheless, the methods then relied heavily on the existence of the huge dataset of measurements to build the model. The reinforcement learning scheme applied in this work does not require previous information (flows along the pipes and pressure heads at withdrawal nodes) to operate the network optimally. The scheme relies heavily on the interaction with the system and the reward receives. The model-free emulator for WDNs applied in this work, also provides an avenue to resolve the computational issues commonly raised by various authors [41,42].
6. Conclusions
In this work, the impact of pressure control on leakage flows is investigated. A novel model-free control scheme was proposed and implemented in a simulated WDS. An emulator is used to avoid the computational complexities raised previously in the literature. Evidently, the method proposed in this work has the capacity to emulate and produce PRV settings to control the pressure. The pressure control scheme applied in this work has effectively reduced the leakages in the water supply system. This could be attributed to the relationship between water and pressure at the withdrawal points. It was found that the highest percentage reduction peaked at 10.64% for a node that is directly connected to the PRV. The proposed is also effective for nodes that are remote to PRVs, with a minimum 1.71% leakage reduction recorded for these nodes. In addition, the minimisation of the leakages could reduce the rate at which the orifices expands. Moreover, the scheme proposed in this work does not rely on prior knowledge of the system to propose the control settings. Unlike the supervised and unsupervised learning schemes, reinforcement learning learns and improves as it interacts with the system under control.
Future research could be directed on the development of the quadratic approximation on measurements obtained from a real network and the application of a reinforcement learning controller.
Author Contributions
The authors contributed equally to this work. All authors have read and agreed to the published version of the manuscript.
Funding
This research received no external funding.
Institutional Review Board Statement
Not applicable.
Informed Consent Statement
Not applicable.
Acknowledgments
This research work was supported by the French South African Institute of Technology (F’SATI), Tshwane University of Technology, Pretoria, South Africa.
Conflicts of Interest
The authors declare no conflict of interest.
Appendix A

Table A1.
Pipe data for case study network 2.
| Pipe ID | Start Node | End Node | Length (m) | Diameter (mm) | Chw | Pipe ID | Start Node | End Node | Length (m) | Diameter (mm) | Chw |
|---|---|---|---|---|---|---|---|---|---|---|---|
| 1 | 1 | 15 | 1000 | 0.6 | 120 | 55 | 26 | 35 | 600 | 0.15 | 100 |
| 2 | 15 | 28 | 1000 | 0.45 | 120 | 56 | 27 | 33 | 1100 | 0.25 | 120 |
| 3 | 28 | 27 | 894 | 0.45 | 120 | 57 | 33 | 34 | 400 | 0.15 | 100 |
| 4 | 28 | 30 | 1020 | 0.45 | 120 | 58 | 30 | 35 | 1400 | 0.15 | 100 |
| 5 | 30 | 31 | 500 | 0.45 | 120 | 59 | 33 | 32 | 400 | 0.15 | 100 |
| 6 | 31 | 45 | 800 | 0.45 | 120 | 60 | 31 | 32 | 600 | 0.15 | 100 |
| 7 | 45 | 51 | 800 | 0.45 | 120 | 61 | 30 | 29 | 400 | 0.15 | 100 |
| 8 | 51 | 57 | 800 | 0.2 | 120 | 62 | 29 | 44 | 1100 | 0.15 | 100 |
| 9 | 57 | 58 | 800 | 0.2 | 120 | 63 | 44 | 46 | 400 | 0.15 | 100 |
| 10 | 15 | 14 | 500 | 0.25 | 120 | 64 | 46 | 47 | 1077 | 0.15 | 100 |
| 11 | 15 | 4 | 949 | 0.25 | 120 | 65 | 48 | 47 | 600 | 0.15 | 100 |
| 12 | 4 | 5 | 300 | 0.25 | 120 | 66 | 47 | 50 | 800 | 0.15 | 100 |
| 13 | 11 | 5 | 500 | 0.25 | 120 | 67 | 49 | 50 | 600 | 0.15 | 100 |
| 14 | 14 | 11 | 400 | 0.25 | 120 | 68 | 49 | 48 | 800 | 0.15 | 100 |
| 15 | 14 | 16 | 400 | 0.25 | 120 | 69 | 51 | 48 | 600 | 0.15 | 100 |
| 16 | 16 | 27 | 104 | 0.25 | 120 | 70 | 51 | 52 | 600 | 0.25 | 120 |
| 17 | 14 | 13 | 400 | 0.25 | 120 | 71 | 52 | 43 | 800 | 0.20 | 120 |
| 18 | 13 | 12 | 700 | 0.25 | 120 | 72 | 45 | 43 | 600 | 0.15 | 100 |
| 19 | 12 | 9 | 400 | 0.25 | 120 | 73 | 43 | 32 | 800 | 0.20 | 120 |
| 20 | 9 | 8 | 500 | 0.25 | 120 | 74 | 33 | 42 | 825 | 0.25 | 120 |
| 21 | 8 | 5 | 1100 | 0.25 | 120 | 75 | 42 | 43 | 600 | 0.15 | 100 |
| 22 | 8 | 7 | 600 | 0.15 | 120 | 76 | 53 | 52 | 600 | 0.25 | 120 |
| 23 | 6 | 7 | 1400 | 0.15 | 120 | 77 | 42 | 53 | 800 | 0.25 | 120 |
| 24 | 4 | 6 | 600 | 0.15 | 100 | 78 | 41 | 42 | 600 | 0.25 | 120 |
| 25 | 3 | 4 | 800 | 0.15 | 100 | 79 | 41 | 36 | 800 | 0.25 | 120 |
| 26 | 3 | 2 | 1300 | 0.15 | 100 | 80 | 37 | 39 | 800 | 0.25 | 120 |
| 27 | 16 | 2 | 1100 | 0.20 | 120 | 81 | 39 | 40 | 800 | 0.15 | 120 |
| 28 | 2 | 29 | 1600 | 0.15 | 100 | 82 | 41 | 39 | 800 | 0.15 | 100 |
| 29 | 16 | 17 | 400 | 0.20 | 120 | 83 | 39 | 64 | 2400 | 0.25 | 120 |
| 30 | 17 | 13 | 400 | 0.20 | 120 | 84 | 70 | 41 | 2262 | 0.45 | 120 |
| 31 | 13 | 10 | 400 | 0.20 | 120 | 85 | 41 | 54 | 1600 | 0.15 | 100 |
| 32 | 10 | 11 | 400 | 0.15 | 120 | 86 | 55 | 54 | 400 | 0.20 | 120 |
| 33 | 10 | 9 | 700 | 0.15 | 100 | 87 | 53 | 55 | 825 | 0.25 | 120 |
| 34 | 18 | 17 | 700 | 0.15 | 100 | 88 | 56 | 55 | 800 | 0.20 | 120 |
| 35 | 12 | 18 | 400 | 0.15 | 100 | 89 | 52 | 56 | 800 | 0.20 | 120 |
| 36 | 19 | 12 | 800 | 0.15 | 100 | 90 | 57 | 56 | 600 | 0.20 | 120 |
| 37 | 69 | 19 | 806 | 0.45 | 120 | 91 | 57 | 49 | 600 | 0.20 | 120 |
| 38 | 19 | 21 | 700 | 0.25 | 120 | 92 | 49 | 59 | 800 | 0.20 | 120 |
| 39 | 21 | 20 | 1200 | 0.15 | 100 | 93 | 58 | 59 | 600 | 0.15 | 100 |
| 40 | 21 | 22 | 800 | 0.15 | 100 | 94 | 59 | 60 | 800 | 0.15 | 100 |
| 41 | 22 | 23 | 700 | 0.15 | 100 | 95 | 60 | 61 | 1200 | 0.15 | 100 |
| 42 | 21 | 24 | 700 | 0.25 | 120 | 96 | 68 | 61 | 300 | 0.15 | 100 |
| 43 | 20 | 26 | 700 | 0.20 | 120 | 97 | 62 | 68 | 500 | 0.15 | 100 |
| 44 | 17 | 20 | 424 | 0.20 | 120 | 98 | 58 | 62 | 600 | 0.15 | 100 |
| 45 | 27 | 26 | 400 | 0.25 | 120 | 99 | 56 | 62 | 900 | 0.20 | 120 |
| 46 | 26 | 25 | 400 | 0.25 | 120 | 100 | 63 | 62 | 1000 | 0.15 | 100 |
| 47 | 24 | 25 | 800 | 0.25 | 120 | 101 | 66 | 68 | 1000 | 0.15 | 100 |
| 48 | 24 | 23 | 800 | 0.25 | 120 | 102 | 63 | 66 | 500 | 0.25 | 120 |
| 49 | 23 | 38 | 1118 | 0.25 | 120 | 103 | 66 | 67 | 600 | 0.25 | 120 |
| 50 | 38 | 37 | 600 | 0.25 | 120 | 104 | 63 | 64 | 1100 | 0.25 | 120 |
| 51 | 24 | 37 | 1100 | 0.15 | 100 | 105 | 66 | 65 | 1100 | 0.15 | 100 |
| 52 | 37 | 36 | 800 | 0.15 | 100 | 106 | 55 | 63 | 825 | 0.25 | 120 |
| 53 | 34 | 36 | 400 | 0.15 | 100 | 107 | 64 | 65 | 500 | 0.15 | 120 |
| 54 | 34 | 35 | 500 | 0.15 | 100 | 108 | 25 | 36 | 1100 | 0.25 | 120 |
Table A2.
Node data for case study network 2.
| Node ID | Elevation (m) | Demand (L/s) | Node ID | Elevation (m) | Demand (L/s) |
|---|---|---|---|---|---|
| 1 | 90 | Source Node | 36 | 57 | 0 |
| 2 | 78 | 5.00 | 37 | 55 | 0 |
| 3 | 72 | 5.00 | 38 | 56 | 15.0 |
| 4 | 63 | 15.0 | 39 | 62 | 10.0 |
| 5 | 60 | 20.0 | 40 | 57 | 10.0 |
| 6 | 60 | 10.0 | 41 | 62 | 0.0 |
| 7 | 64 | 10.0 | 42 | 55 | 0.0 |
| 8 | 65 | 10.0 | 43 | 49 | 10.0 |
| 9 | 65 | 0.0 | 44 | 55 | 15.0 |
| 10 | 55 | 20.0 | 45 | 50 | 0.0 |
| 11 | 61 | 0 | 46 | 58 | 0.0 |
| 12 | 65 | 15.0 | 47 | 55 | 10.0 |
| 13 | 55 | 20.0 | 48 | 50 | 0.0 |
| 14 | 61 | 0 | 49 | 48 | 5.0 |
| 15 | 69 | 10.0 | 50 | 50 | 0.0 |
| 16 | 62 | 0 | 51 | 49 | 5.0 |
| 17 | 55 | 20.0 | 52 | 46 | 15.0 |
| 18 | 62 | 15.0 | 53 | 53 | 0.0 |
| 19 | 74 | 0 | 54 | 59 | 0.0 |
| 20 | 55 | 0 | 55 | 56 | 10.0 |
| 21 | 70 | 0 | 56 | 47 | 10.0 |
| 22 | 72 | 5.0 | 57 | 44 | 5.0 |
| 23 | 70 | 20.0 | 58 | 42 | 10.0 |
| 24 | 66 | 15.0 | 59 | 45 | 0.0 |
| 25 | 59 | 30.0 | 60 | 40 | 5.0 |
| 26 | 55 | 0 | 61 | 45 | 10.0 |
| 27 | 58 | 20.0 | 62 | 48 | 5.0 |
| 28 | 67 | 0 | 63 | 55 | 0.0 |
| 29 | 63 | 0 | 64 | 68 | 30.0 |
| 30 | 62 | 40.0 | 65 | 68 | 5.0 |
| 31 | 58 | 0.0 | 66 | 55 | 0.0 |
| 32 | 51 | 0 | 67 | 55 | 30.0 |
| 33 | 51 | 15.0 | 68 | 45 | 0.0 |
| 34 | 55 | 0 | 69 | 90 | Source Node |
| 35 | 55 | 0 | 70 | 90 | Source Node |
References
- Bargiela, A. On-Line Monitoring of Water Distribution Networks. Ph.D. Thesis, Durham University, Durham, UK, 1984. [Google Scholar]
- Adedeji, K.B.; Hamam, Y.; Abe, B.T.; Abu-Mahfouz, A.M. Leakage detection and estimation algorithm for loss reduction in water piping networks. Water 2017, 9, 773. [Google Scholar] [CrossRef] [Green Version]
- McKenzie, R.S.; Siqalaba, Z.; Wegelin, W. The State of Non-Revenue Water in South Africa (2012); Water Research Commission: Pretoria, South Africa, 2012. [Google Scholar]
- Thornton, J.; Sturm, R.; Kunkel, G. Water Loss Control; McGraw Hill Professional: New York, NY, USA, 2008. [Google Scholar]
- Adedeji, K.B.; Hamam, Y.; Abe, B.T.; Abu-Mahfouz, A.M. Pressure management strategies for water loss reduction in large-scale water piping networks: A review. In Advances in Hydroinformatics; Springer: Cham, Switzerland, 2018; pp. 465–480. [Google Scholar]
- Nicolini, M. Localization of Emerging Leakages in Water Distribution Systems: A Complex Networks Approach. Adv. Sci. Technol. Eng. Syst. J. 2019, 4, 276–284. [Google Scholar] [CrossRef] [Green Version]
- Taha, A.W.; Sharma, S.; Lupoja, R.; Fadhl, A.N.; Haidera, M.; Kennedy, M. Assessment of water losses in distribution networks: Methods, applications, uncertainties, and implications in intermittent supply. Resour. Conserv. Recycl. 2020, 152, 104515. [Google Scholar]
- Charalambous, B.; Foufeas, D.; Petroulias, N. Leak detection and water loss management. Water Util. J. 2014, 8, 25–30. [Google Scholar]
- Hindi, K.; Hamam, Y. Pressure control for leakage minimization in water supply networks Part 1: Single period models. Int. J. Syst. Sci. 1991, 22, 1573–1585. [Google Scholar] [CrossRef]
- Hindi, K.; Hamam, Y. Pressure control for leakage minimization in water supply networks: Part 2. Multi-period models. Int. J. Syst. Sci. 1991, 22, 1587–1598. [Google Scholar] [CrossRef]
- Puust, R.; Kapelan, Z.; Savic, D.; Koppel, T. A review of methods for leakage management in pipe networks. Urban Water J. 2010, 7, 25–45. [Google Scholar] [CrossRef]
- Dai, P.D.; Li, P. Optimal pressure regulation in water distribution systems based on an extended model for pressure reducing valves. Water Resour. Manag. 2016, 30, 1239–1254. [Google Scholar] [CrossRef]
- Gupta, A.; Bokde, N.; Marathe, D.; Kulat, K. Leakage Reduction in Water Distribution Systems with Efficient Placement and Control of Pressure Reducing Valves Using Soft Computing Techniques. Eng. Technol. Appl. Sci. Res. 2016, 7, 1528–1534. [Google Scholar] [CrossRef]
- Patelis, M.; Kanakoudis, V.; Kravvari, A. Pressure Regulation vs. Water Aging in Water Distribution Networks. Water 2020, 12, 1323. [Google Scholar] [CrossRef]
- Marsili, V.; Zarbo, R.; Alvisi, S.; Franchini, M. Laboratory analysis of a piston-actuated pressure-reducing valve under low flow conditions. Water 2020, 12, 940. [Google Scholar] [CrossRef] [Green Version]
- Dai, P.D. Optimal Pressure Management in Water Distribution Systems Using an Accurate Pressure Reducing Valve Model Based Complementarity Constraints. Water 2021, 13, 825. [Google Scholar] [CrossRef]
- Van Zyl, J. Introduction to Oeration and Maintenance of Water Distribution Systems; Water Research Commission: Gezina, South Africa, 2014. [Google Scholar]
- McKenzie, R.; Wegelin, W. Implementation of pressure management in municipal water supply systems. In Proceedings of the EYDAP Conference “Water: The Day After”, Athens, Greece, 6–8 November 2009. [Google Scholar]
- Campisano, A.; Modica, C.; Vetrano, L. Calibration of proportional controllers for the RTC of pressures to reduce leakage in water distribution networks. J. Water Resour. Plan. Manag. 2011, 138, 377–384. [Google Scholar] [CrossRef]
- Sankar, G.S.; Narasimhan, S.; Narasimhan, S. Online model predictive control of municipal water distribution networks. In Computer Aided Chemical Engineering; Elsevier: Amsterdam, The Netherlands, 2012; Volume 31, pp. 1622–1626. [Google Scholar]
- Wang, D.l.; Wang, A.m. The Pressure Control on Non-negative Pressure Water Supply Based on the Fuzzy PID Control. In Proceedings of the 2009 International Joint Conference on Artificial Intelligence, Hainan, China, 25–26 April 2009; pp. 140–143. [Google Scholar]
- Peng, X.; Xiao, L.; Mo, Z.; Liu, G. The variable frequency and speed regulation constant pressure water supply system based on PLC and fuzzy control. In Proceedings of the Measuring Technology and Mechatronics Automation, 2009. ICMTMA’09. International Conference on IEEE, Zhangjiajie, China, 11–12 April 2009; Volume 1, pp. 910–913. [Google Scholar]
- Galuppini, G.; Magni, L.; Creaco, E. Stability and robustness of real-time pressure control in water distribution systems. J. Hydraul. Eng. 2020, 146, 04020023. [Google Scholar] [CrossRef]
- Sankar, G.S.; Kumar, S.M.; Narasimhan, S.; Narasimhan, S.; Bhallamudi, S.M. Optimal control of water distribution networks with storage facilities. J. Process. Control 2015, 32, 127–137. [Google Scholar] [CrossRef]
- Keedwell, E.; Khu, S.T. A novel evolutionary meta-heuristic for the multi-objective optimization of real-world water distribution networks. Eng. Optim. 2006, 38, 319–333. [Google Scholar] [CrossRef]
- Kallesøe, C.S.; Jensen, T.N.; Wisniewski, R. Adaptive reference control for pressure management in water networks. In Proceedings of the 2015 European Control Conference (ECC), Linz, Austria, 15–17 July 2015; pp. 3268–3273. [Google Scholar]
- Liberatore, S.; Sechi, G. Location and calibration of valves in water distribution networks using a scatter-search meta-heuristic approach. Water Resour. Manag. 2009, 23, 1479–1495. [Google Scholar] [CrossRef]
- Bello, O.; Hamam, Y.; Djouani, K. Coagulation process control in water treatment plants using multiple model predictive control. Alex. Eng. J. 2014, 53, 939–948. [Google Scholar] [CrossRef] [Green Version]
- Nerantzis, D.; Pecci, F.; Stoianov, I. Optimal control of water distribution networks without storage. Eur. J. Oper. Res. 2020, 284, 345–354. [Google Scholar] [CrossRef]
- Galuppini, G.; Creaco, E.; Magni, L. A gain scheduling approach to improve pressure control in water distribution networks. Control Eng. Pract. 2020, 103, 104612. [Google Scholar] [CrossRef]
- Galuppini, G.; Creaco, E.; Magni, L. Sum-of-delay models for pressure control in Water Distribution Networks. Control Eng. Pract. 2021, 113, 104844. [Google Scholar] [CrossRef]
- Diao, K.; Farmani, R.; Fu, G.; Butler, D. Vulnerability assessment of water distribution systems using directed and undirected graph theory. In Proceedings of the 11th International Conference on Hydroinformatics, New York, NY, USA, 17–21 August 2014; pp. 1–8. [Google Scholar]
- Page, P.R.; Abu-Mahfouz, A.M.; Mothetha, M.L. Pressure management of water distribution systems via the remote real-time control of variable speed pumps. J. Water Resour. Plan. Manag. 2017, 143, 04017045. [Google Scholar] [CrossRef] [Green Version]
- Page, P.R.; Abu-Mahfouz, A.M.; Yoyo, S. Parameter-less remote real-time control for the adjustment of pressure in water distribution systems. J. Water Resour. Plan. Manag. 2017, 143, 04017050. [Google Scholar] [CrossRef] [Green Version]
- Fontana, N.; Giugni, M.; Glielmo, L.; Marini, G.; Zollo, R. Real-time control of pressure for leakage reduction in water distribution network: Field experiments. J. Water Resour. Plan. Manag. 2018, 144, 04017096. [Google Scholar] [CrossRef]
- Letting, L.K.; Hamam, Y.; Abu-Mahfouz, A.M. Estimation of water demand in water distribution systems using particle swarm optimization. Water 2017, 9, 593. [Google Scholar] [CrossRef] [Green Version]
- Nicolini, M. Optimal pressure management in water networks: Increased efficiency and reduced energy costs. In Proceedings of the Defense Science Research Conference and Expo (DSR) 2011, Singapore, 3–5 August 2011; pp. 1–4. [Google Scholar]
- Mosetlhe, T.C.; Hamam, Y.; Du, S.; Monacelli, E.; Yusuff, A.A. Towards Model-Free Pressure Control in Water Distribution Networks. Water 2020, 12, 2697. [Google Scholar] [CrossRef]
- Mosetlhe, T.; Hamam, Y.; Du, S.; Alayli, Y. Artificial neural networks in water distribution systems: A literature synopsis. In Proceedings of the 2018 International Conference on Intelligent and Innovative Computing Applications (ICONIC), Mon Tresor, Mauritius, 6–7 December 2018; pp. 1–5. [Google Scholar]
- Mosetlhe, T.C.; Hamam, Y.; Du, S.; Monacelli, E. A Survey of Pressure Control Approaches in Water Supply Systems. Water 2020, 12, 1732. [Google Scholar] [CrossRef]
- Hamam, Y.; Hindi, K. Optimised on-line leakage minimisation in water piping networks using neural nets. In Proceedings of the IFIP Working Conference, Dagschul, Germany, 28 September–1 October 1992; Volume 28, pp. 57–64. [Google Scholar]
- Rao, Z.; Salomons, E. Development of a real-time, near-optimal control process for water-distribution networks. J. Hydroinform. 2007, 9, 25–37. [Google Scholar] [CrossRef] [Green Version]
Figure 1.
Reinforcement learning controller.

Figure 2.
Value Iteration Algorithm.

Figure 3.
Case Study Water Distribution Network.

Figure 4.
The actual flow and the leakage flow through the pipes.

Figure 5.
Pipe leakages prior to and post pressure control.

Figure 6.
Nodal leakages prior to and post pressure control.

Table 1.
Ranking of the nodes for minimum and maximum demand.
| Minimum Demand | Maximum Demand | ||
|---|---|---|---|
| Node | Sensitivity Index | Node | Sensitivity Index |
| 59 | 2.168 | 59 | 2.409 |
| 64 | 2.145 | 64 | 2.384 |
| 61 | 1.917 | 61 | 2.130 |
| 48 | 1.836 | 48 | 2.040 |
| 56 | 1.741 | 56 | 1.935 |
| 21 | 1.252 | 21 | 1.391 |
| 50 | 1.216 | 50 | 1.352 |
Publisher’s Note: MDPI stays neutral with regard to jurisdictional claims in published maps and institutional affiliations. |
© 2021 by the authors. Licensee MDPI, Basel, Switzerland. This article is an open access article distributed under the terms and conditions of the Creative Commons Attribution (CC BY) license (https://creativecommons.org/licenses/by/4.0/).
Share and Cite
MDPI and ACS Style
Mosetlhe, T.C.; Hamam, Y.; Du, S.; Monacelli, E. Appraising the Impact of Pressure Control on Leakage Flow in Water Distribution Networks. Water 2021, 13, 2617. https://0-doi-org.brum.beds.ac.uk/10.3390/w13192617
AMA Style
Mosetlhe TC, Hamam Y, Du S, Monacelli E. Appraising the Impact of Pressure Control on Leakage Flow in Water Distribution Networks. Water. 2021; 13(19):2617. https://0-doi-org.brum.beds.ac.uk/10.3390/w13192617
Chicago/Turabian StyleMosetlhe, Thapelo C., Yskandar Hamam, Shengzhi Du, and Eric Monacelli. 2021. "Appraising the Impact of Pressure Control on Leakage Flow in Water Distribution Networks" Water 13, no. 19: 2617. https://0-doi-org.brum.beds.ac.uk/10.3390/w13192617
Note that from the first issue of 2016, this journal uses article numbers instead of page numbers. See further details here.