Article

Vulnerability Assessment as a Basis for Sanitary Zone Delineation of Karst Groundwater Sources—Blederija Spring Case Study

by
Vladimir Živanović
*,
Nebojša Atanacković
and
Saša Stojadinović
Faculty of Mining and Geology, University of Belgrade, Đušina 7, 11000 Belgrade, Serbia
*
Author to whom correspondence should be addressed.
Submission received: 17 August 2021 / Revised: 28 September 2021 / Accepted: 29 September 2021 / Published: 6 October 2021
(This article belongs to the Special Issue Groundwater Vulnerability to Pollution Assessment)

Abstract

:
The application of groundwater vulnerability methods has great importance for the sanitary protection zones delineation of karstic sources. Source vulnerability assessment of karst groundwater has mainly relied on the European approach (European Cooperation in Science and Technology—COST action 620), which includes analysis of the K factor, which refers to water flow through the saturated zone of the karst system. In the paper, two approaches to groundwater vulnerability assessment have been applied, COP + K and TDM (Time-Dependent Model) methods, to produce the most suitable source vulnerability map that can be transformed into sanitary protection zones maps. Both methods were tested on the case example of Blederija karst spring in Eastern Serbia. This spring represents a classical karst spring with allogenic and autogenic recharge. Dual aquifer recharge points out the necessity for the inclusion of the vulnerability assessment method created especially for the assessment of karst groundwater. Obtained vulnerability maps show similar results, particularly in the spring and the ponor areas, and these zones are most important for future protection. The COP + K method brings out three vulnerability classes that can be directly transformed into three sanitary protection zones. Contrary to the previous one, the TDM method uses water travel time as a vulnerability degree. The results show that the final map can be easily used to define sanitary zones considering different national legislation.

1. Introduction

Protection of groundwater sources is a complex task that requires implementing measures that are sometimes expensive and hard to apply. In situations when a contaminant reaches the saturated zone of the karst aquifer, it is necessary to implement remediation measures that can last for years. Therefore, preventive measures are a basis for sustainable groundwater exploitation. That is particularly important for groundwater sources used for public water supply, where protection is carried out by establishing multi-level sanitary protection zones (SPZ) in which different degrees of restrictive policy are applied. These zones usually cover areas where groundwater flows toward intake structures such as wells, tapping structures of the springs, galleries, and others.
The number of sanitary zones depends on several factors like local legislation, hydrogeological conditions, aquifer vulnerability, exploitation capacity, etc. [1]. Usually, three zones are established [2,3]: Immediate, Inner, and Outer sanitary protection zone. In some countries, additional zones such as resource protection zone or zone of the entire catchment area are being used [3]. These zones protect the area of future water supply sources and ensure the long-term sustainability of groundwater quality.
Delineation of sanitary protection zones is a multidisciplinary process that usually requires specialists of other technically oriented disciplines like chemistry, microbiology, agriculture, spatial planning, administration, and others [2]. The delineation process inherits a significant level of uncertainty because factors that control the size of zones may vary over space and sometimes even in a time as well.
Protection of groundwater sources is especially difficult in karst terrains [4]. Even in the case of the existence of a thick protective layer, the karst aquifer can be easily contaminated if the aquifer is recharging through ponors or via sinking streams. In such circumstances, detail exploration is required to access karst-specific features. Several facts should be considered [5]: aquifer recharge could be very fast; groundwater velocities are generally high compared to other types of aquifers; the residence time is relatively short; hydrogeological anisotropy is highly pronounced; and as a result of the previously mentioned, the attenuation capacity of karst is limited.
Various criteria are used in sanitary zone delineation [6]: horizontal distance, horizontal flow time, recharge conditions, and attenuation capacity. Based on these conditions, several approaches are generally being applied [7]: delineation based on fixed radius and water travel time, delineation based on risk assessment, and a delineation based on groundwater vulnerability. The first approach is widely being used for all types of aquifers. The immediate zone is usually delineated with a fixed radius, while the other two zones are determined considering the horizontal water travel time. The risk assessment approach for zone delineation is currently being used in Netherland. A health-based target [8] of a maximum acceptable infection risk of one per 10,000 persons per year associated with drinking-water consumption is used in this approach [7]. This kind of assessment could be used for intergranular aquifers but may be difficult for other types.
The groundwater vulnerability assessment concept has existed for more than 50 years [9]. The idea was to describe how groundwater is vulnerable to contaminants released at the surface as a function of geological, hydrological, and hydrogeological environmental conditions. Groundwater vulnerability maps have been widely used as a base for groundwater protection, mainly for spatial planning and water management, risk assessment, and groundwater source protection [6,10]. Methods for vulnerability assessment are widely being used for the protection of karst aquifers. As Ivan and Madl-Szonyi [11] stated, 17 vulnerability assessment methods specially designed for karst areas were developed during the period 2000–2014. Most of them are designed according to the European approach [12], which is not a method but rather a framework for vulnerability and risk mapping developed by the Working Groups of COST Action 620 [13].
Although most existing methods are meant for resource vulnerability, some were specially designed for source protection. The Irish groundwater protection scheme [14] is one of the first approaches for groundwater source protection based on vulnerability. Zone delineation is based on the origin–pathways–target conceptual model, where the sanitary zones map is obtained by combining the resource vulnerability map with the source protection areas map [3]. The EPIK method [15] is the first vulnerability assessment method developed to protect karst areas. Even though it was designed for resource protection, groundwater vulnerability was directly converted into sanitary protection zones.
Previously mentioned methods represent an essential basis for developing several source-based vulnerability assessment methods used for sanitary zoning in karst areas. The Slovene approach [16,17] is one of the methods fully aligned with the “European approach” conceptual model developed to protect karst aquifers and springs in Slovenia. The PaPRIKa method [18] has been developed in France for resource and source protection. Assessment of source vulnerability considers the groundwater travel time, and as a result, four isochrones (12, 24, 36, and 48 h) are proposed, resulting in four source vulnerability maps showing source vulnerability as a function of time. Another method that is fully aligned with the “European approach” is the COP + K method [19] which presents an extension of the COP method [20] designed for the protection of karst groundwater sources. One of the recently developed methods for karst resource and source protection is the TDM method [21]. When this method is being applied, the vulnerability is presented as a water travel time, taking into account vertical and horizontal groundwater travel time toward the spring or a well, including the travel time of surface water toward the ponor zones.
There are many case examples of sanitary zone delineation using vulnerability assessment methods. COP + K method was successfully applied to Sierra de Libar in Spain [19]. Marin and Andreo [22] also presented how the COP + K method can be applied for the sanitary protection of Villanueva del Rosario spring in Spain. The Slovene approach was initially developed for the protection of Podstenjšek springs [17] and later applied to protect the catchment area of karst springs in the Rečica river [23]. Marin et al. [24] compare the results of the application of COP + K and Slovene approach in the area of Orehek Karst Aquifer in Slovenia. The PaPRIKa method was applied at several study areas in France, in Normandy [25], in southwest France [18], and in Western Pyrenees [26]. TDM method was initially applied for the protection of the Crnica karst spring in Eastern Serbia [21] and later was applied to protect two intergranular groundwater sources [27].
The main aim of this work is to demonstrate the application of COP + K and TDM methods designed for sanitary zone delineation in the catchment area of Blederija karst springs located in Eastern Serbia. The idea was to show the applicability of both methods, highlight the differences in the determination of main parameters, and demonstrate the usage of vulnerability maps to determine source protection zones.

2. Materials and Methods

2.1. Applied Methodology
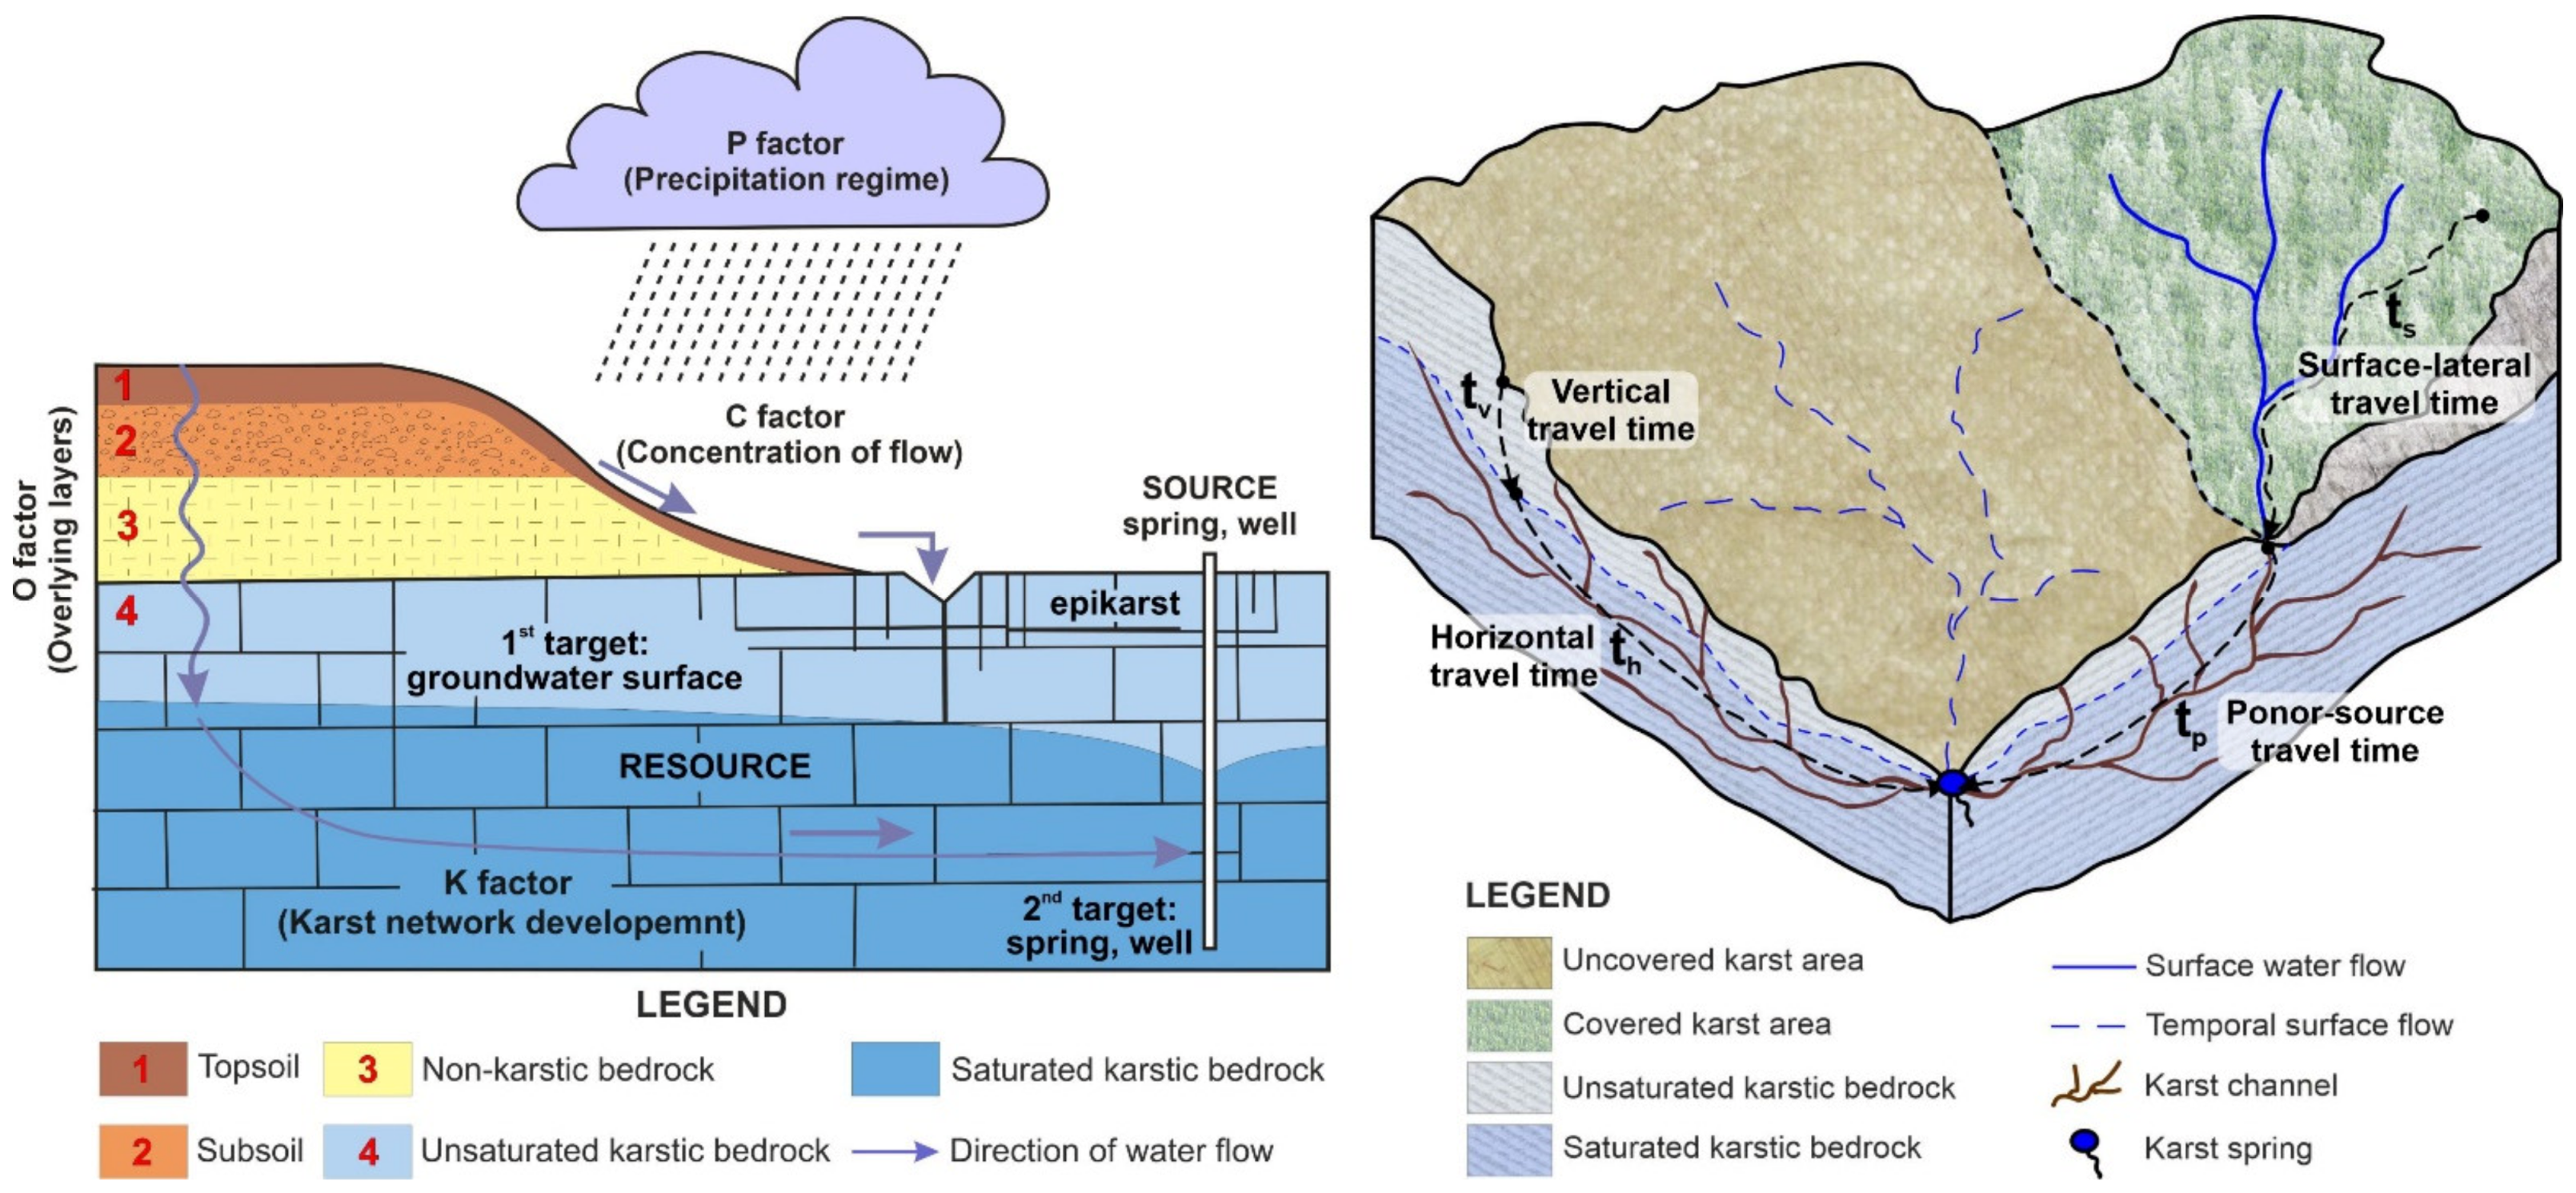
The COP + K method [19] and TDM method [21] are source groundwater vulnerability methods developed to produce vulnerability maps for the protection of karst groundwater sources (Figure 1). Both methods can be applied to a non-karstic environment, but the specific infiltration conditions are considered in karst areas. As proposed by the “European Approach” (pp. 108–112 in [13]), both methods consider three main components for karst groundwater vulnerability assessments: Overlying layers (O), Precipitation regime (P), and Infiltration conditions (C). Therefore, a resource vulnerability map is initially being created. The fourth component, Development of karst network (K), is also taken into account to produce the source vulnerability map. Differences between applied methods are also significant, mainly during the evaluation of the level of vulnerability where the TDM method tends to present the obtained results as a function of water travel time rather than the semi-quantitative index value.

2.2. COP + K

The COP method was developed in the framework of the COST 620 project as a tool for karst groundwater vulnerability assessment. Groundwater vulnerability is defined using three parameters [20]: C—Concentration of flow, O—Overlying parameters, and P—Precipitation. COP vulnerability index is calculated as COPindex = Cscore·Oscore·Pscore (Figure 1, left).
The O factor combines the protective role of soil cover (OS) and lithology (OL). The soils cover subfactor depends on the thickness and texture of the soil. The protective function of different lithological layers in the unsaturated zone is assessed by defining each layer’s thickness (m) and lithology and fracturation (ly). Confining conditions (cn) are additionally analyzed. The O factor is calculated by summing the OS and OL subfactor. The C factor depends on infiltration conditions. It is differently assessed for ponor’s catchments and areas with diffuse infiltration. Inside the ponor’s catchment, three subfactors are assessed: distance to the ponor (dh), distance to the sinking stream (ds), and slope and vegetation subfactor (sv). The surface karst features (sf subfactor) and the Slope and vegetation subfactor (sv) are assessed for the rest of the area. The precipitation (P) factor is evaluated by the amount of annual precipitation (PQ) and temporal distribution of precipitation (PI).
The source vulnerability within the COP + K method [19] is defined by assessing the K factor, which refers to horizontal groundwater flow in the saturated zone. This factor is defined by assessing the groundwater travel time (t subfactor), Information on karst network (n), and Contribution and connection subfactor (r). The K factor, which is obtained by multiplying these three subfactors, is later combined with the COP resource vulnerability index, and the final COP + K source vulnerability score is obtained.

2.3. TDM Method

The time-dependent model (TDM) for groundwater source protection zoning [21] is developed at the Faculty of Mining and Geology at the University of Belgrade. It considers three main components (Figure 1, right): surface water travel time (ts) for areas in the source catchment where surface runoff is predominant, vertical travel time (tv) through the unsaturated zone or the overlying low-permeability strata in the case of a confined aquifer, and horizontal travel time (th) through the saturated zone to the intake groundwater sources. The total travel time (ttot) of surface water and groundwater, as well as of potential contaminants from the ground surface to the source, can be estimated: ttot = ts + tp (for ponor catchment area where tp is the water travel time from ponor to the spring) or ttot = tv + th (for the rest of the area).
In the ponor catchment’s area, the surface-lateral travel time (ts) is calculated and represents flow from any specific point within the catchment area to a ponor. Surface water flow usually consists of sheet flow, shallow concentrated flow, and channel flow [28]. All flow types depend on the flow length, terrain slope and roughness, and precipitation intensity. Travel time is usually calculated by applying hydrology analysis in GIS tools.
The rest of the catchment area is characterized by diffuse infiltration where water travel time depends on the unsaturated zone’s characteristics and the precipitation regime. Vertical travel time (tv) is calculated following the Time-Input method [29]. Two components are analyzed: Time factor based on the travel times of water flow through sediments and hard rocks in unsaturated zones and Input factor, which represents the recharge rate calculated spatially as the difference between precipitation, evapotranspiration, and surface runoff.
Horizontal travel time (th) represents the travel from a point in the saturated zone to the spring. This component should include both matrix and fissured flow toward the channels with turbulent flow and fast flow via the karst channels.
For the catchment area of a ponor zone within the karstic part (Figure 1), the Total travel time ttot is calculated as the sum of surface-lateral travel time (ts) and travel time from the ponor to the groundwater source (tp). In the rest of the spring catchment, ttot is calculated as the sum of vertical travel time (tv) and horizontal travel time (th).

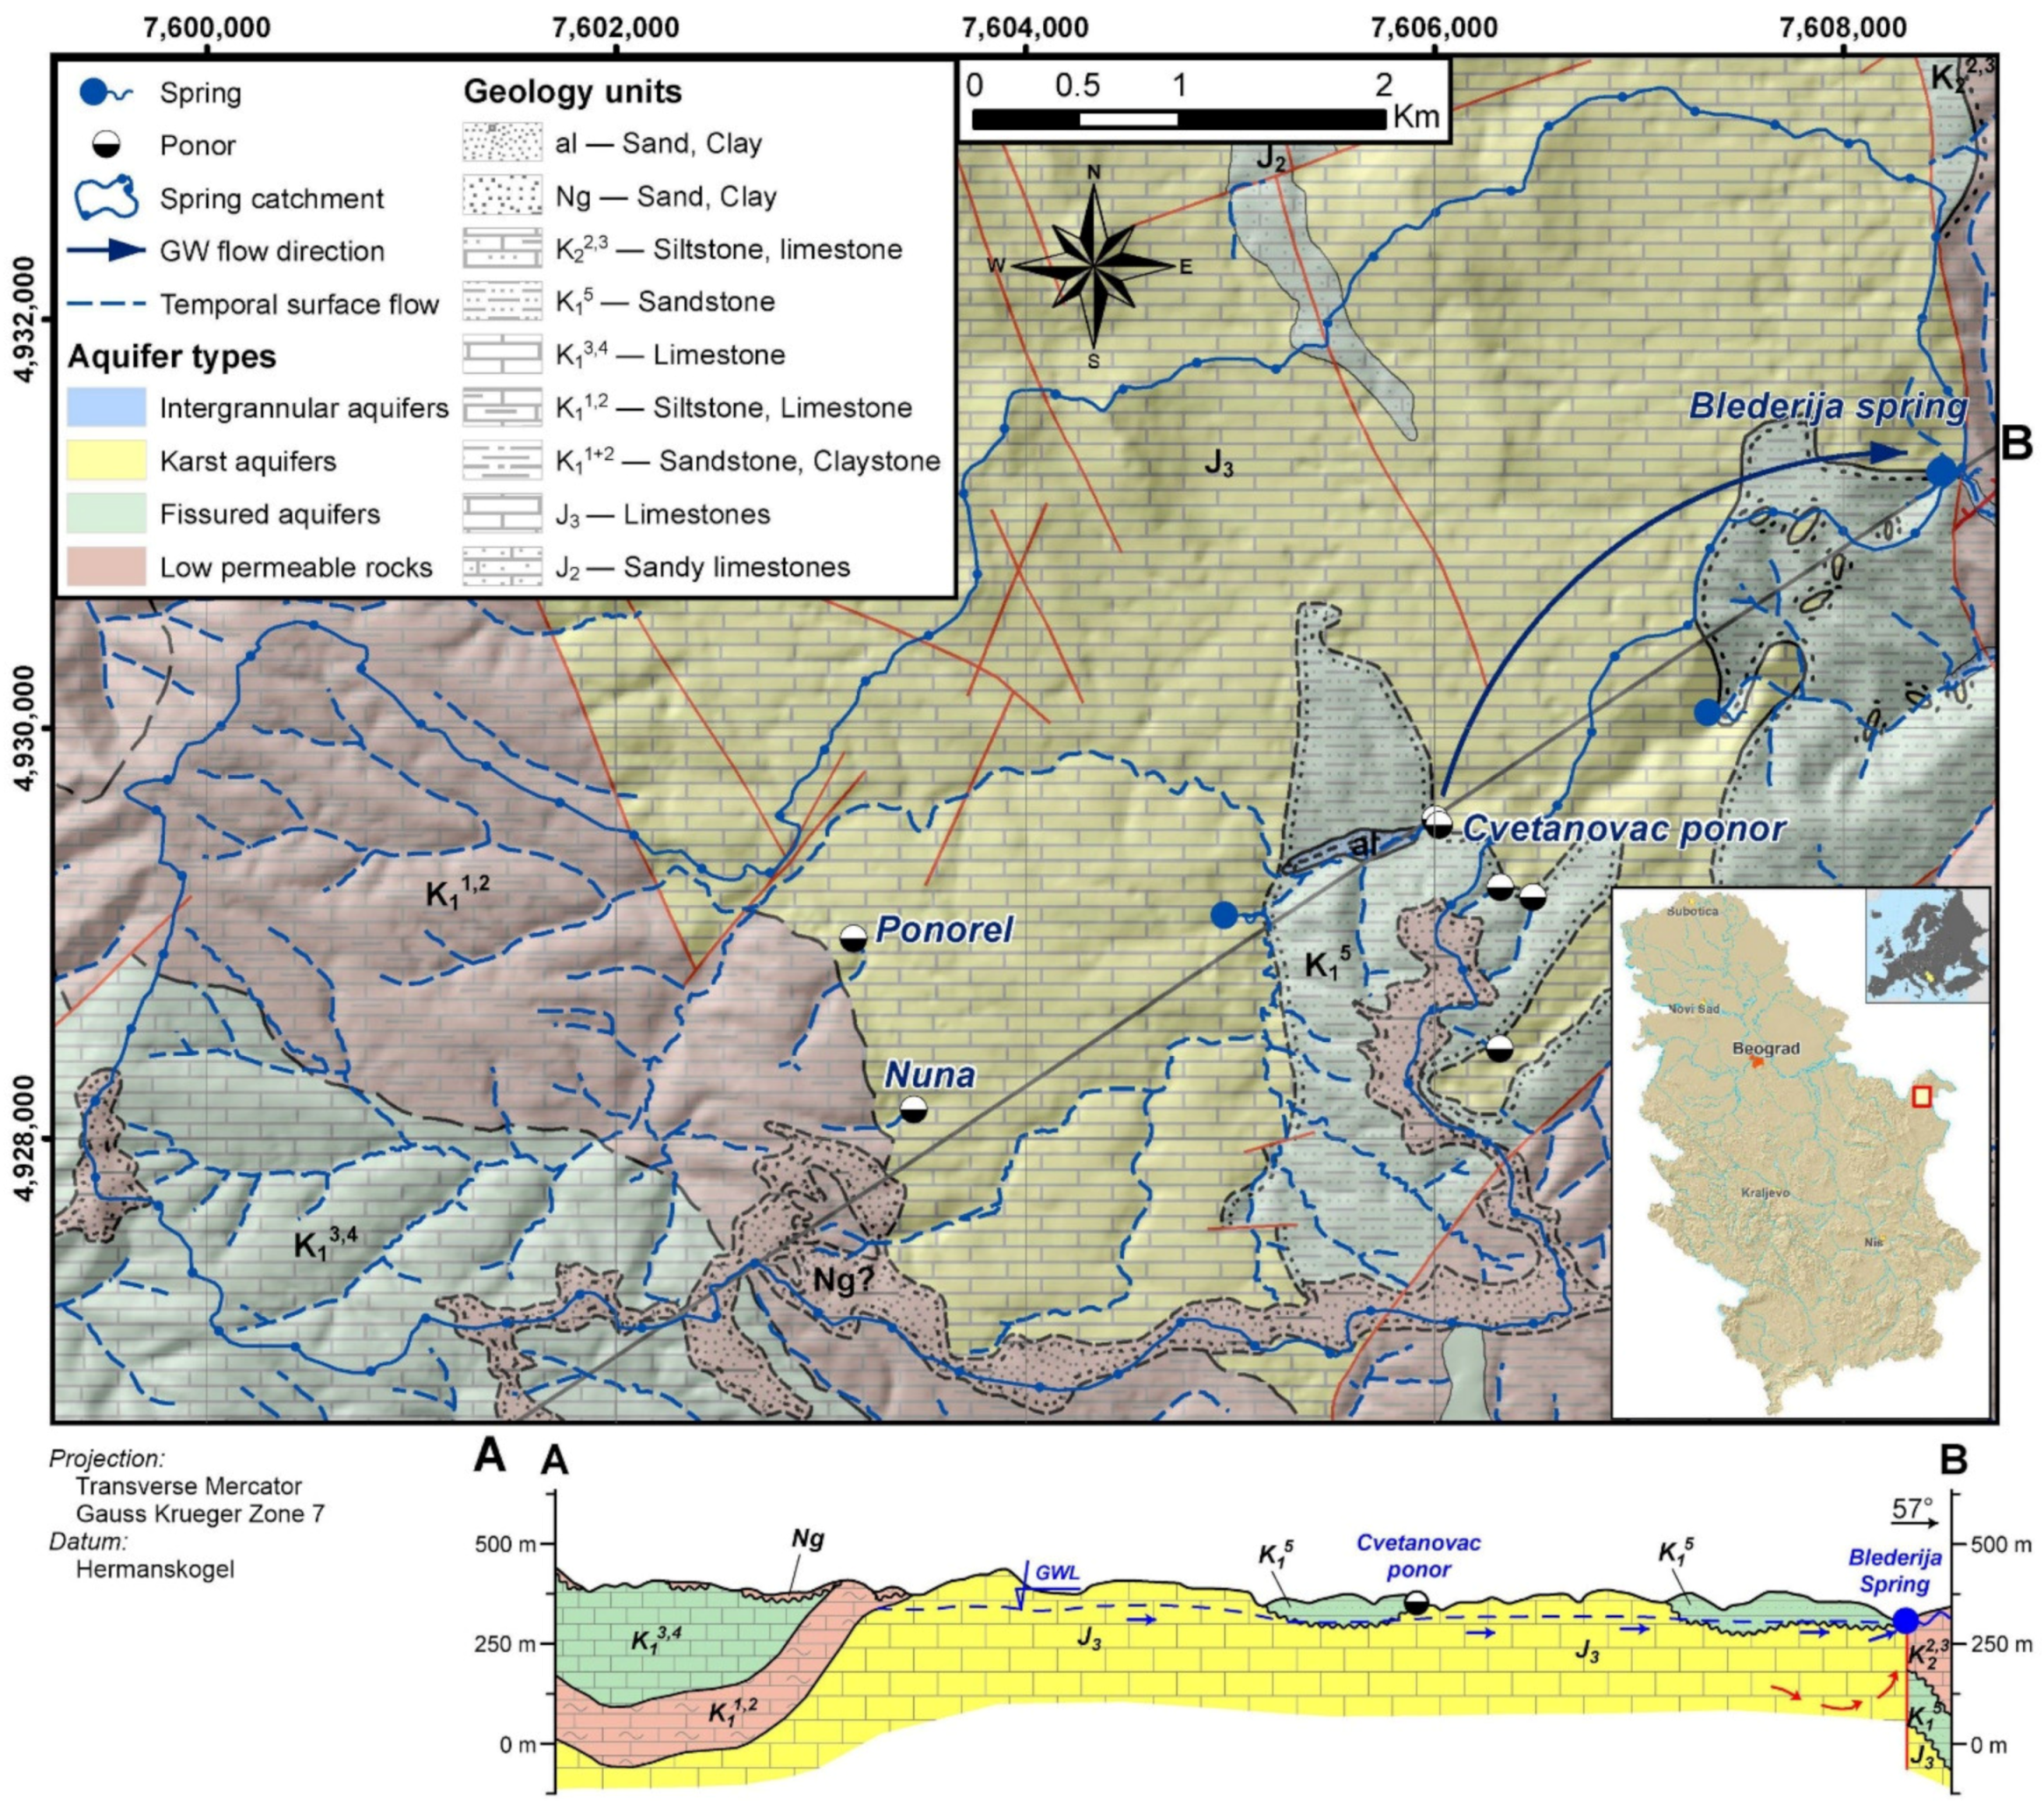
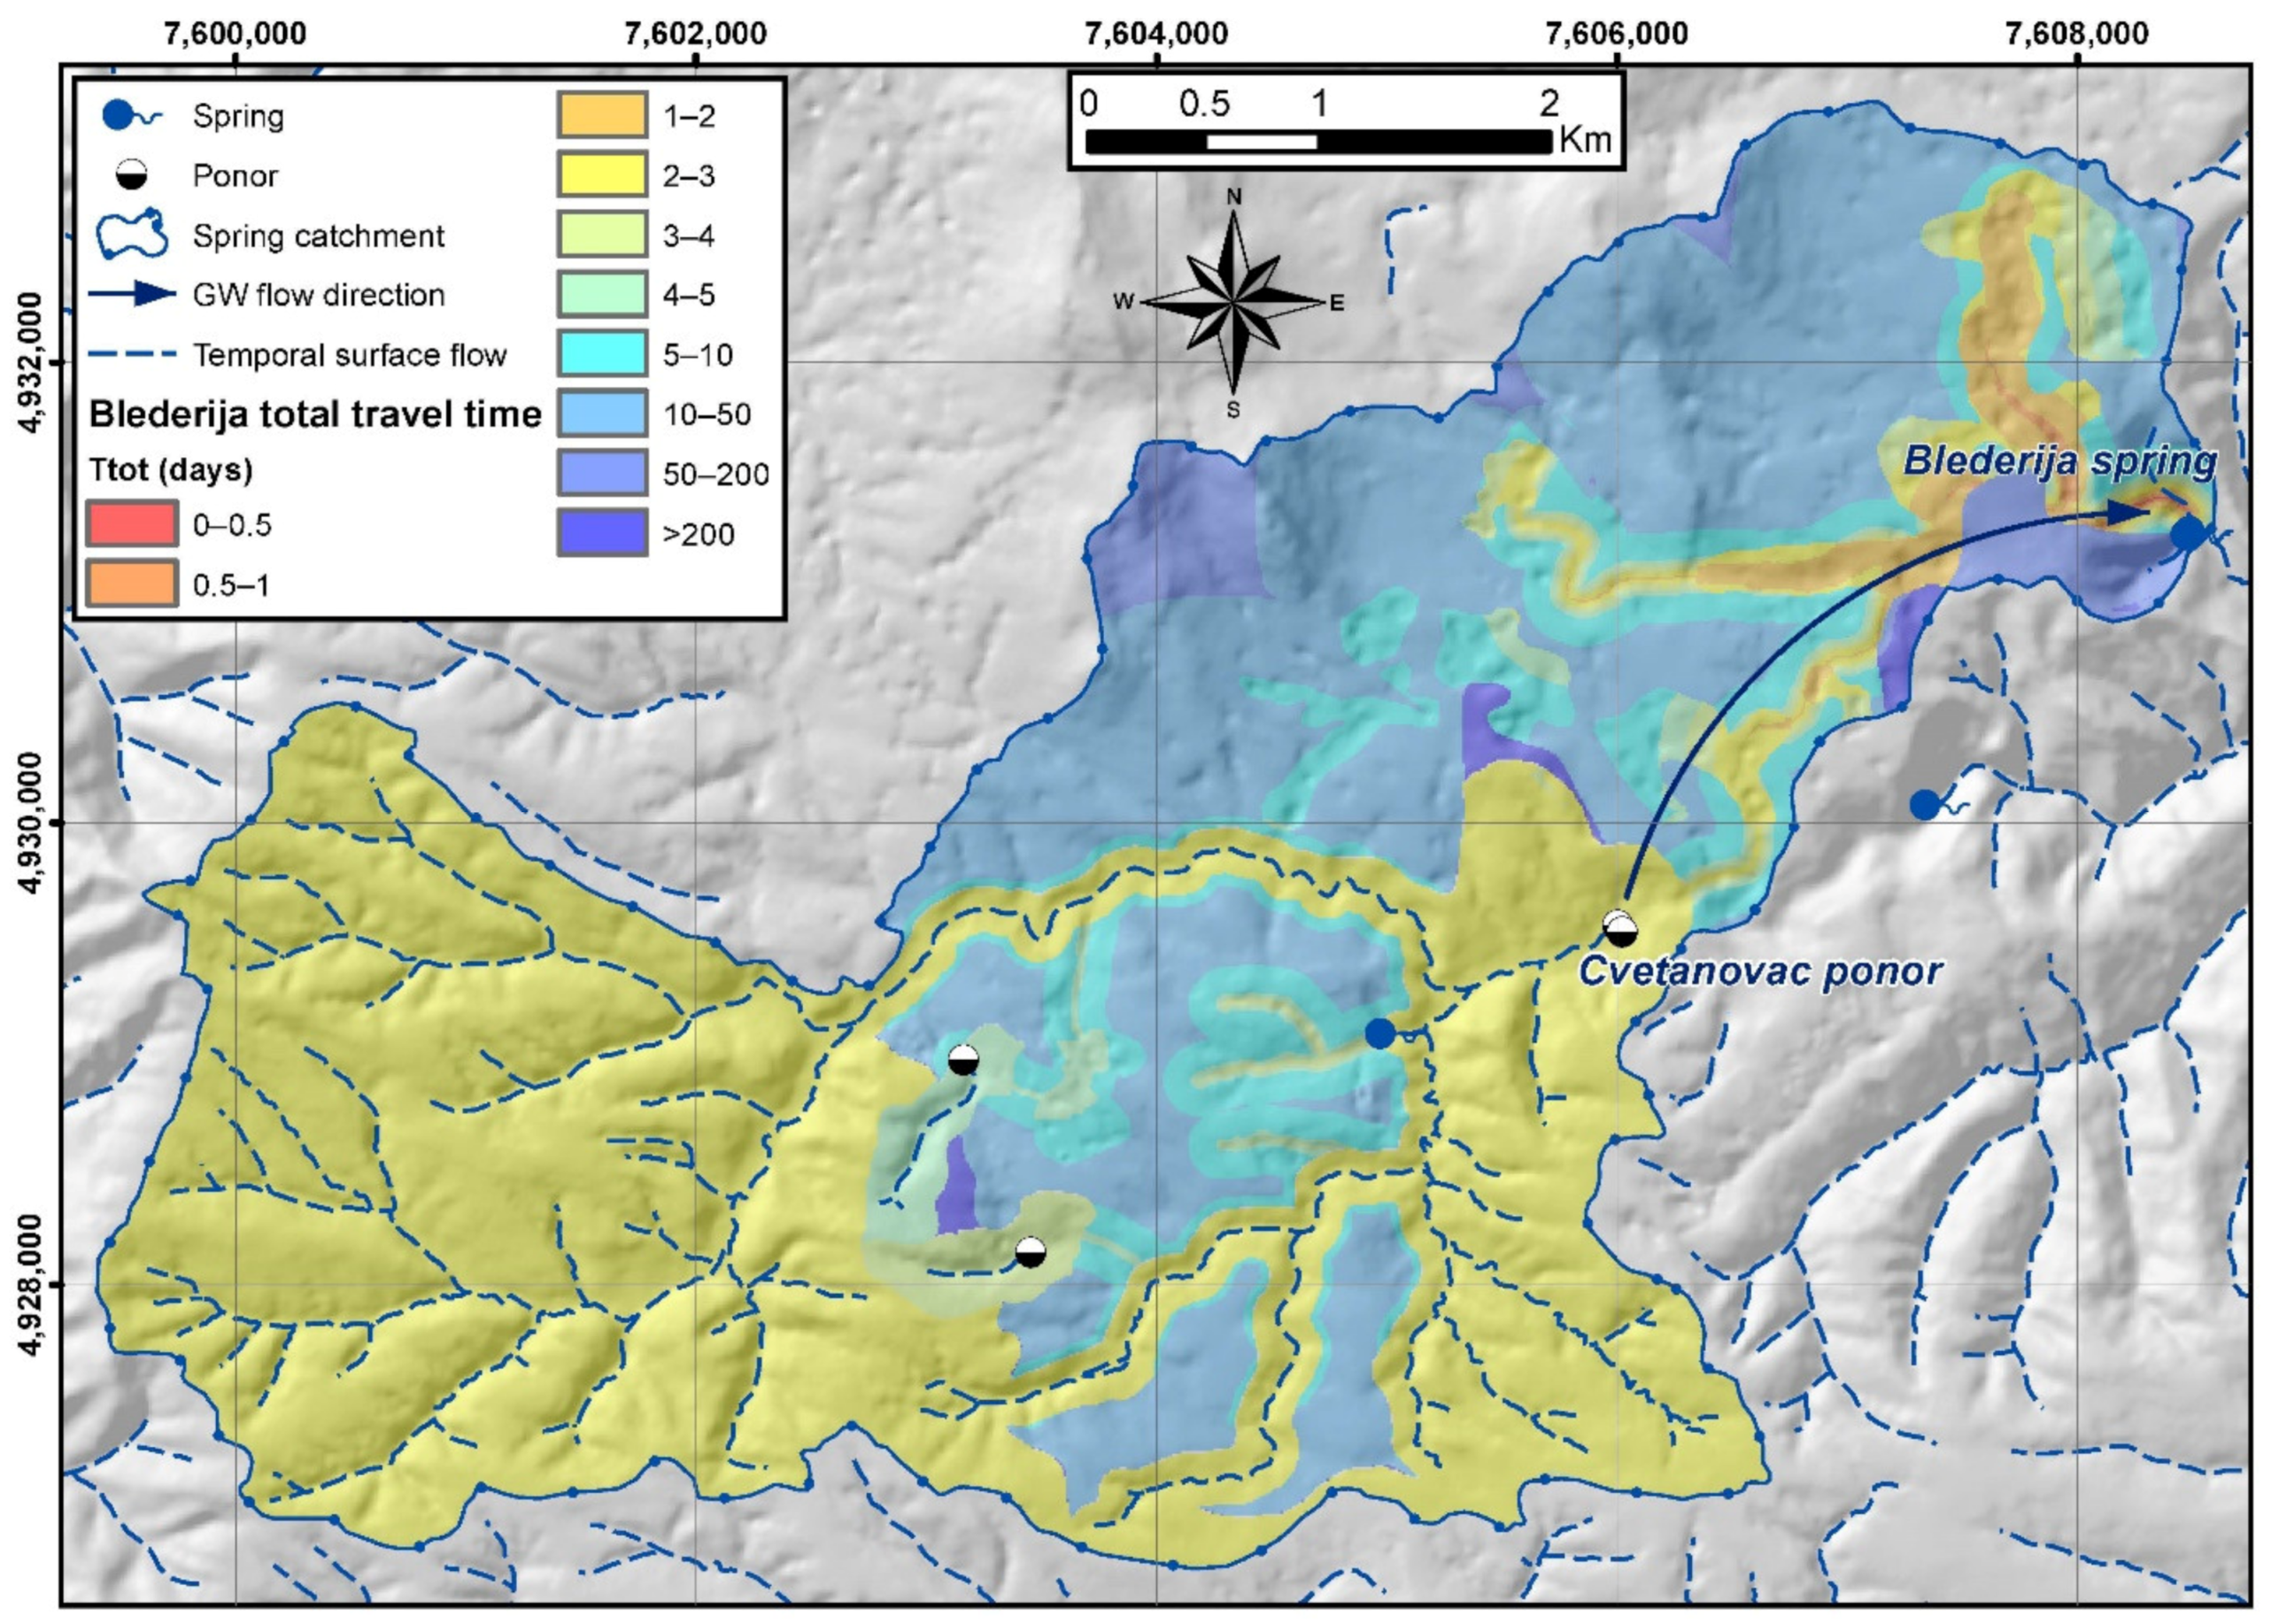
2.4. Study Area and Description of the Test Site

The study area covers the catchment area of Blederija karst spring, which drains part of the Miroč karst massif in the Carpatho-Balkanides of Eastern Serbia. The spring catchment, which covers 31 km², is a typical binary type of a karst hydrogeological system [30] with the karstic part formed in fractured and highly-karstified massive Upper Jurassic limestones [31]. The eastern part of the spring catchment area is built of low permeable Cretaceous clastic rocks (Figure 2), enabling a network of surface streams. These streams sink as they enter the karstic area. The most significant stream is the Ravna Reka stream which completely sinks via the ponor Cvetanovac, particularly during the high-water flows. During low water conditions, most of the streams dry, especially in the karst area.
The discharge zone of the spring is located at the contact of Jurassic karstified limestones and low permeable Cretaceous sandstones. The spring is of the barrier type and presents a typical diffuse karst spring with several zones of discharging [32]. The first two discharge points are very close (15 m apart), while the third one emerges about 40 m downstream. The first (cold) spring appears in the streambed from several openings. The measured temperature of this spring is between 9.3 and 11.9 °C. The second spring discharges from a small cave with temperatures between 8.1 and 18.5 °C. The third one appears as a submerged spring. Based on thermo-vision measuring, it is cold water. The sum capacity of the springs varies between 35 and 4640 L/s with an average flow of 256 L/s for the period 2011–2018.
Annual precipitation ranges from 584 mm to 1153 mm, with an annual mean temperature of 10.8 °C (2011–2018). The study area is mainly covered by broadleaf forest, while the dominant soil type is rendzina. Terrain elevations in the area of the Blederija spring drop to 188 m a.s.l. and in the central parts of the study area exceed 550 m a.s.l. Morphologically, the most significant part of catchment (around 70%) is karstic relief. Predominant karst features are numerous dolines with an average density of 25 dolines per square kilometer [34]. Several dry valleys also intersect the karst plateau.
The dye test results conducted during 2013 proved the connection between the Cvetanovac ponor and the Blederija spring. Tracer appeared at the spring after 2.5 days with an average groundwater speed of 0.014 m/s at the hydraulic gradient of 0.044 [32].

3. Results

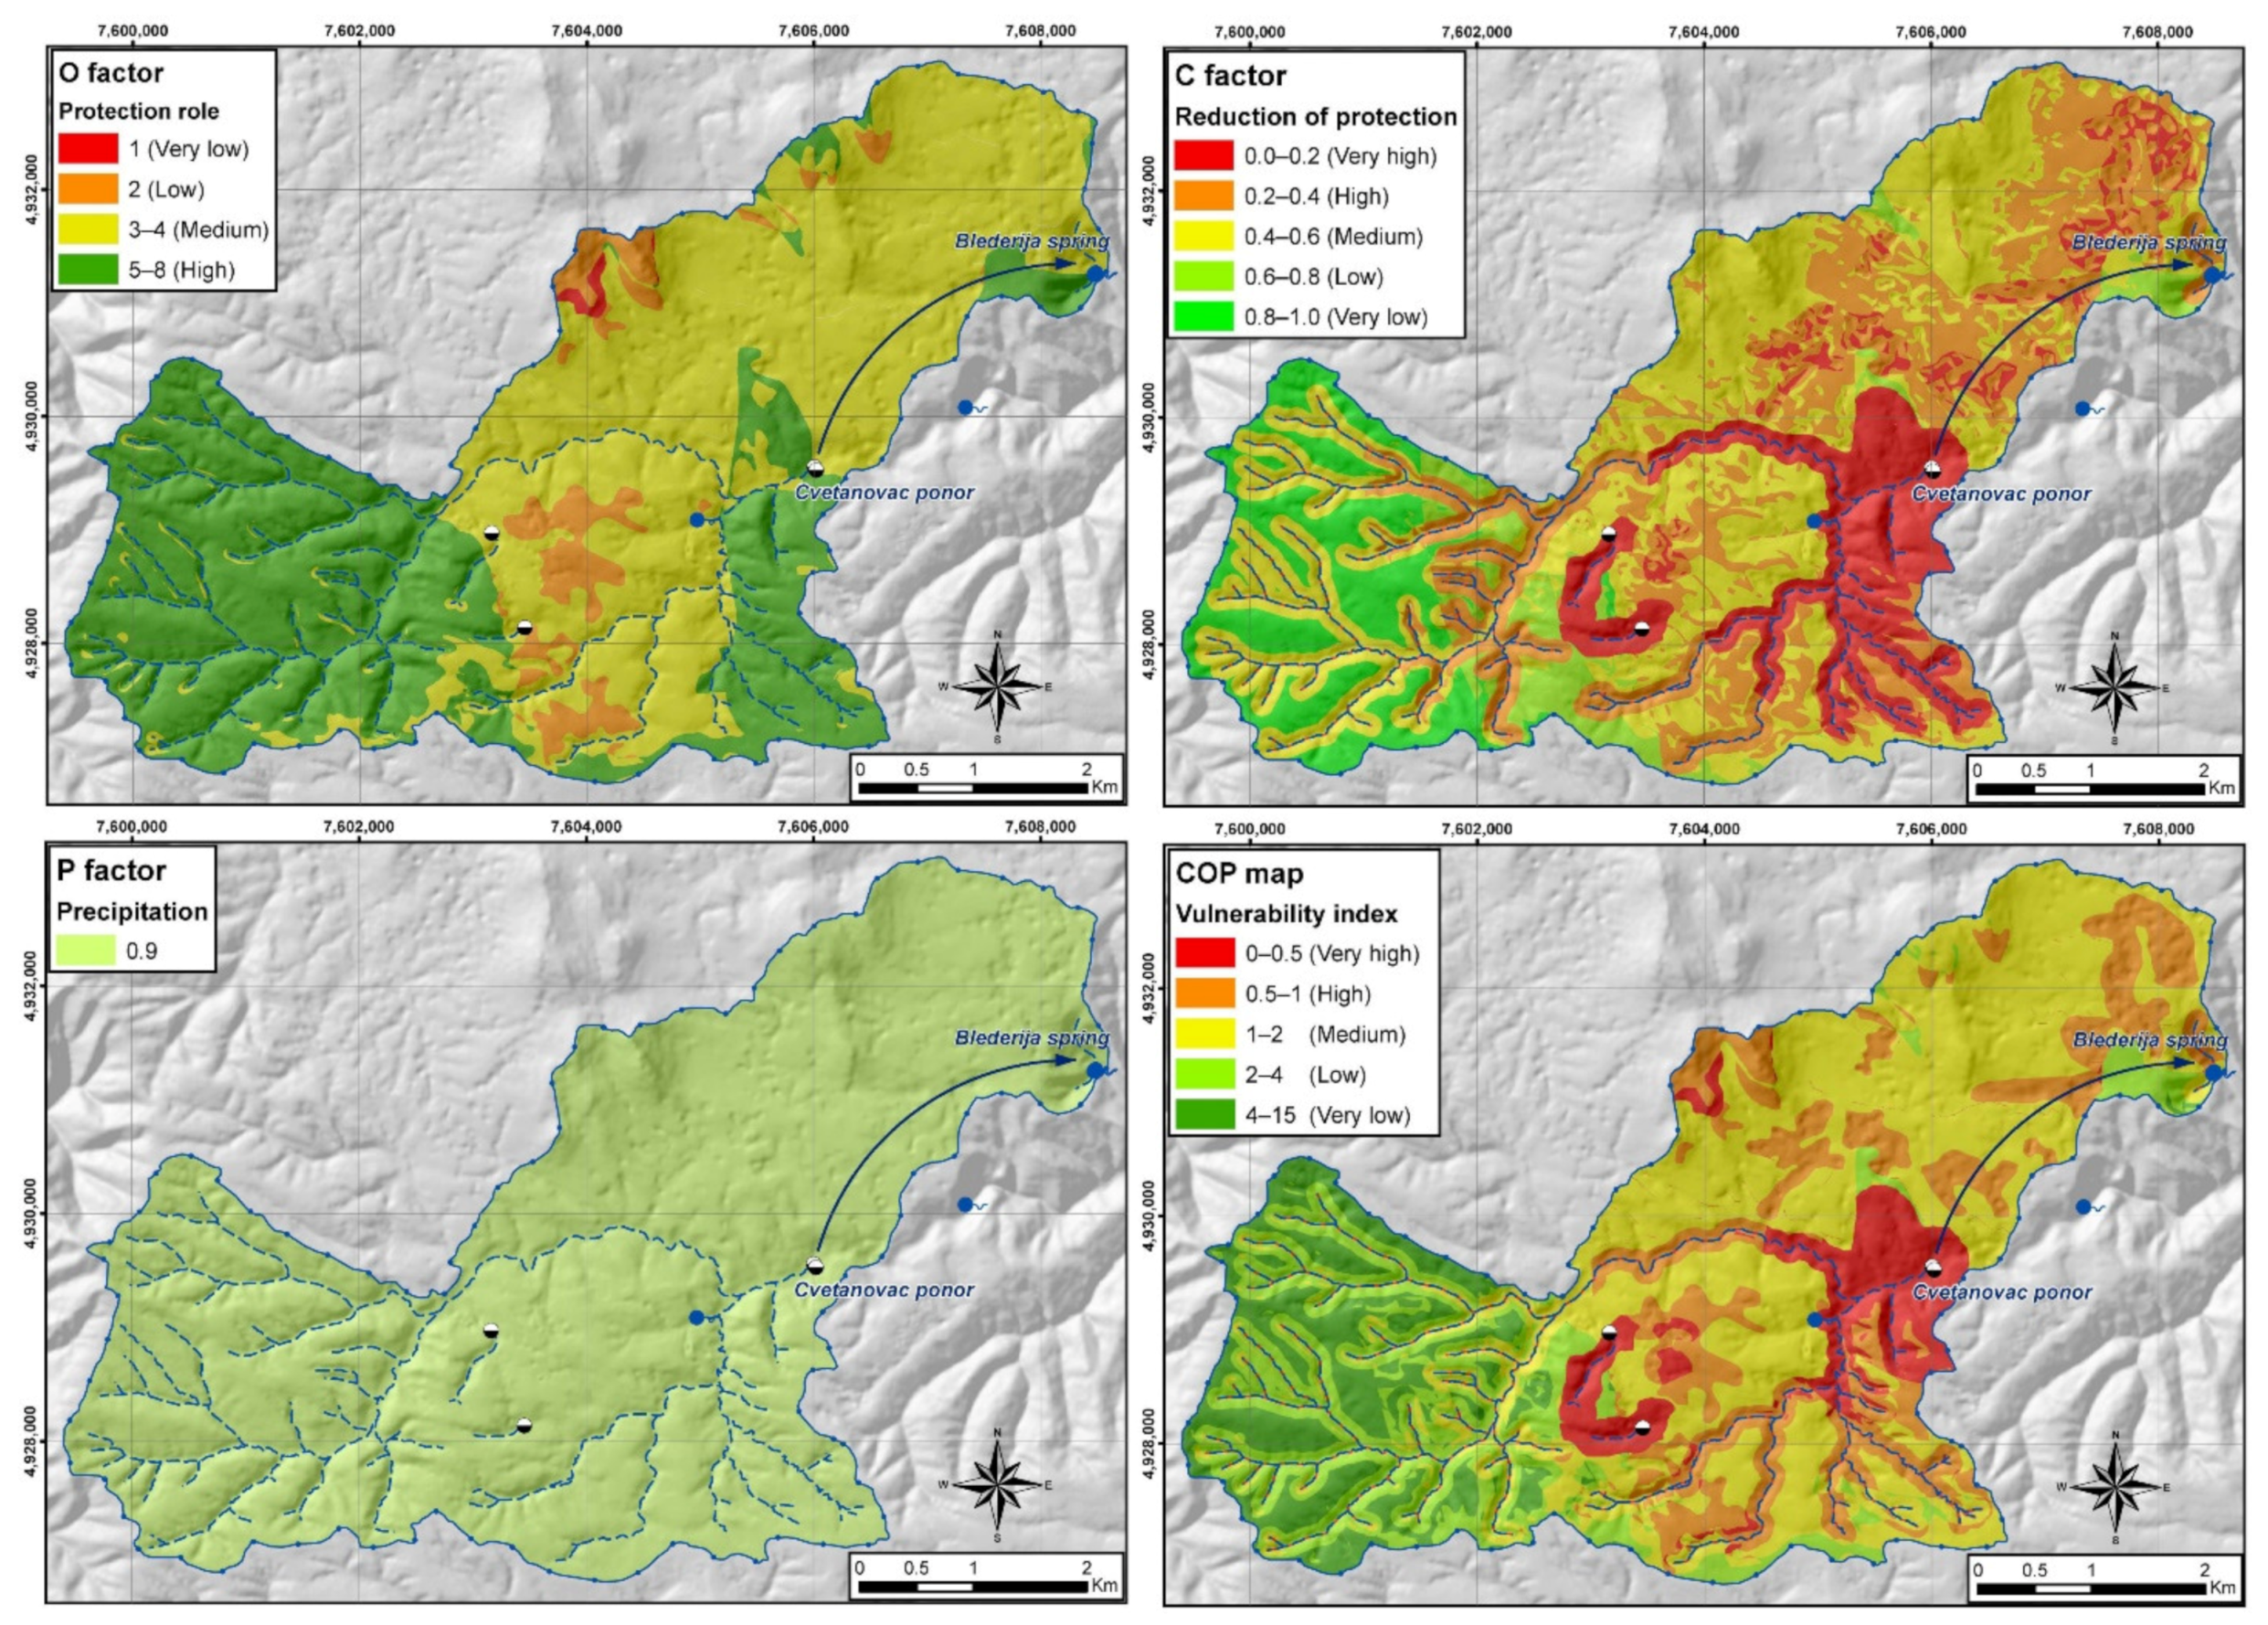
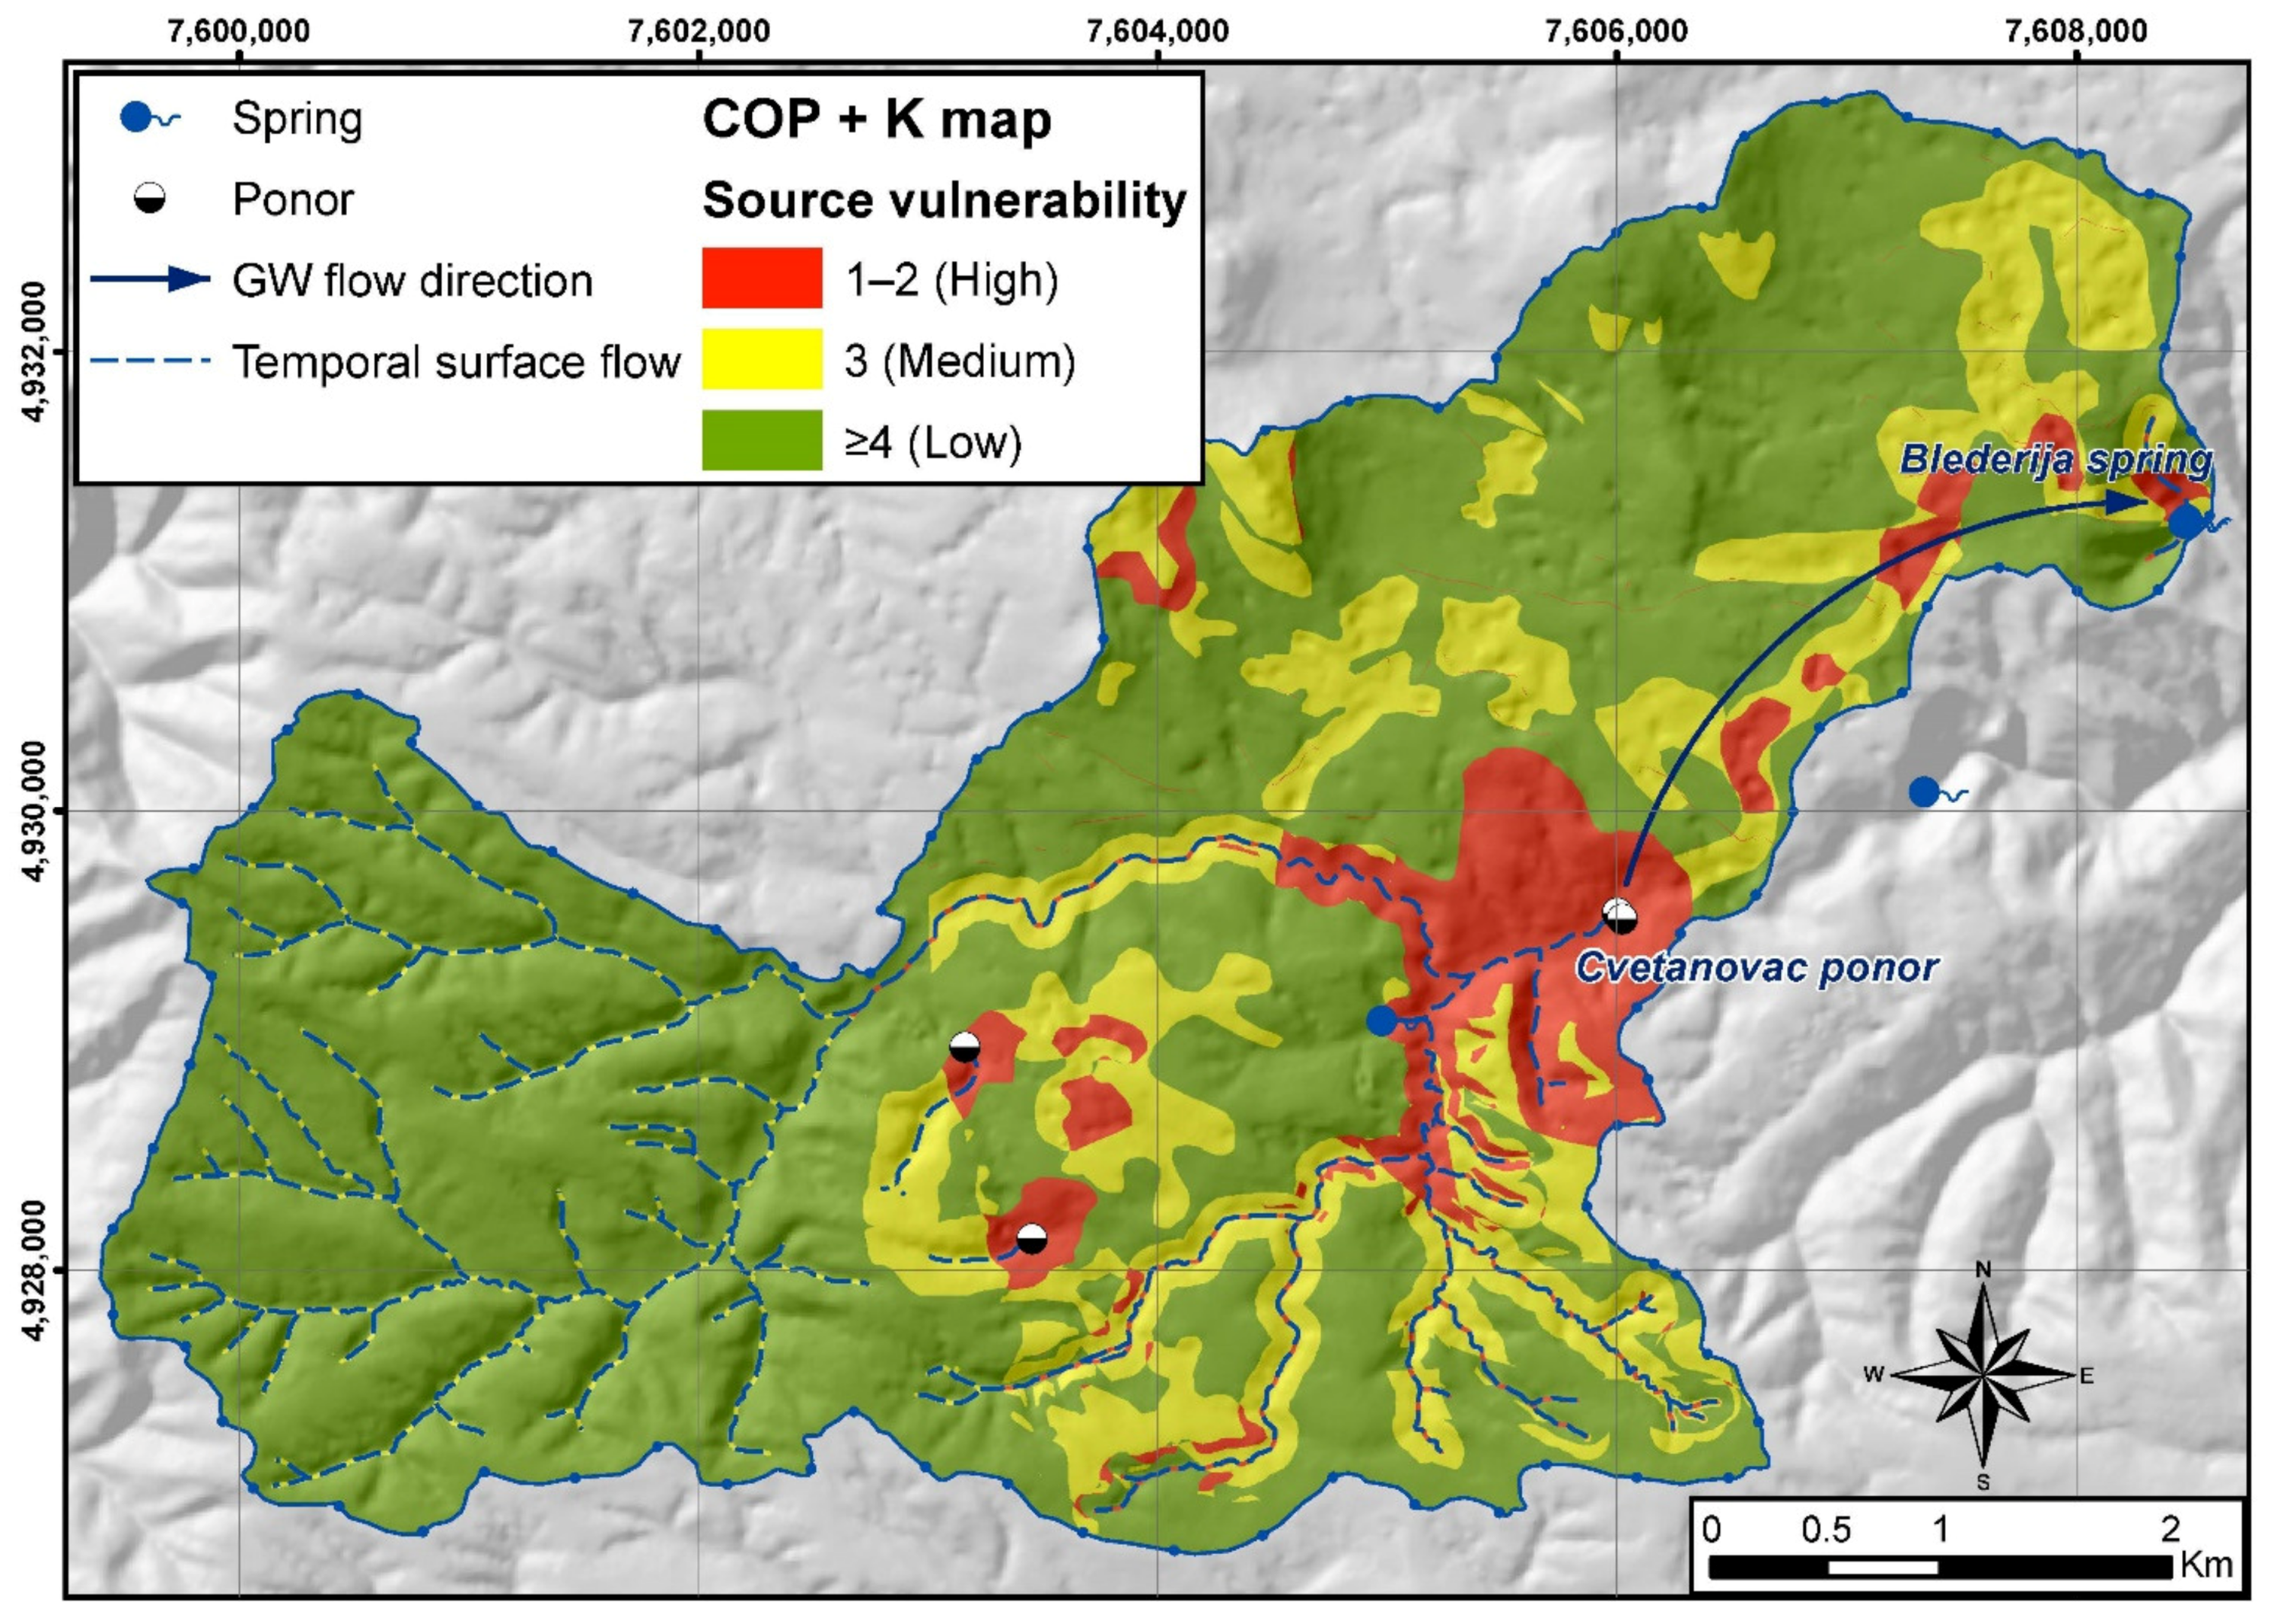
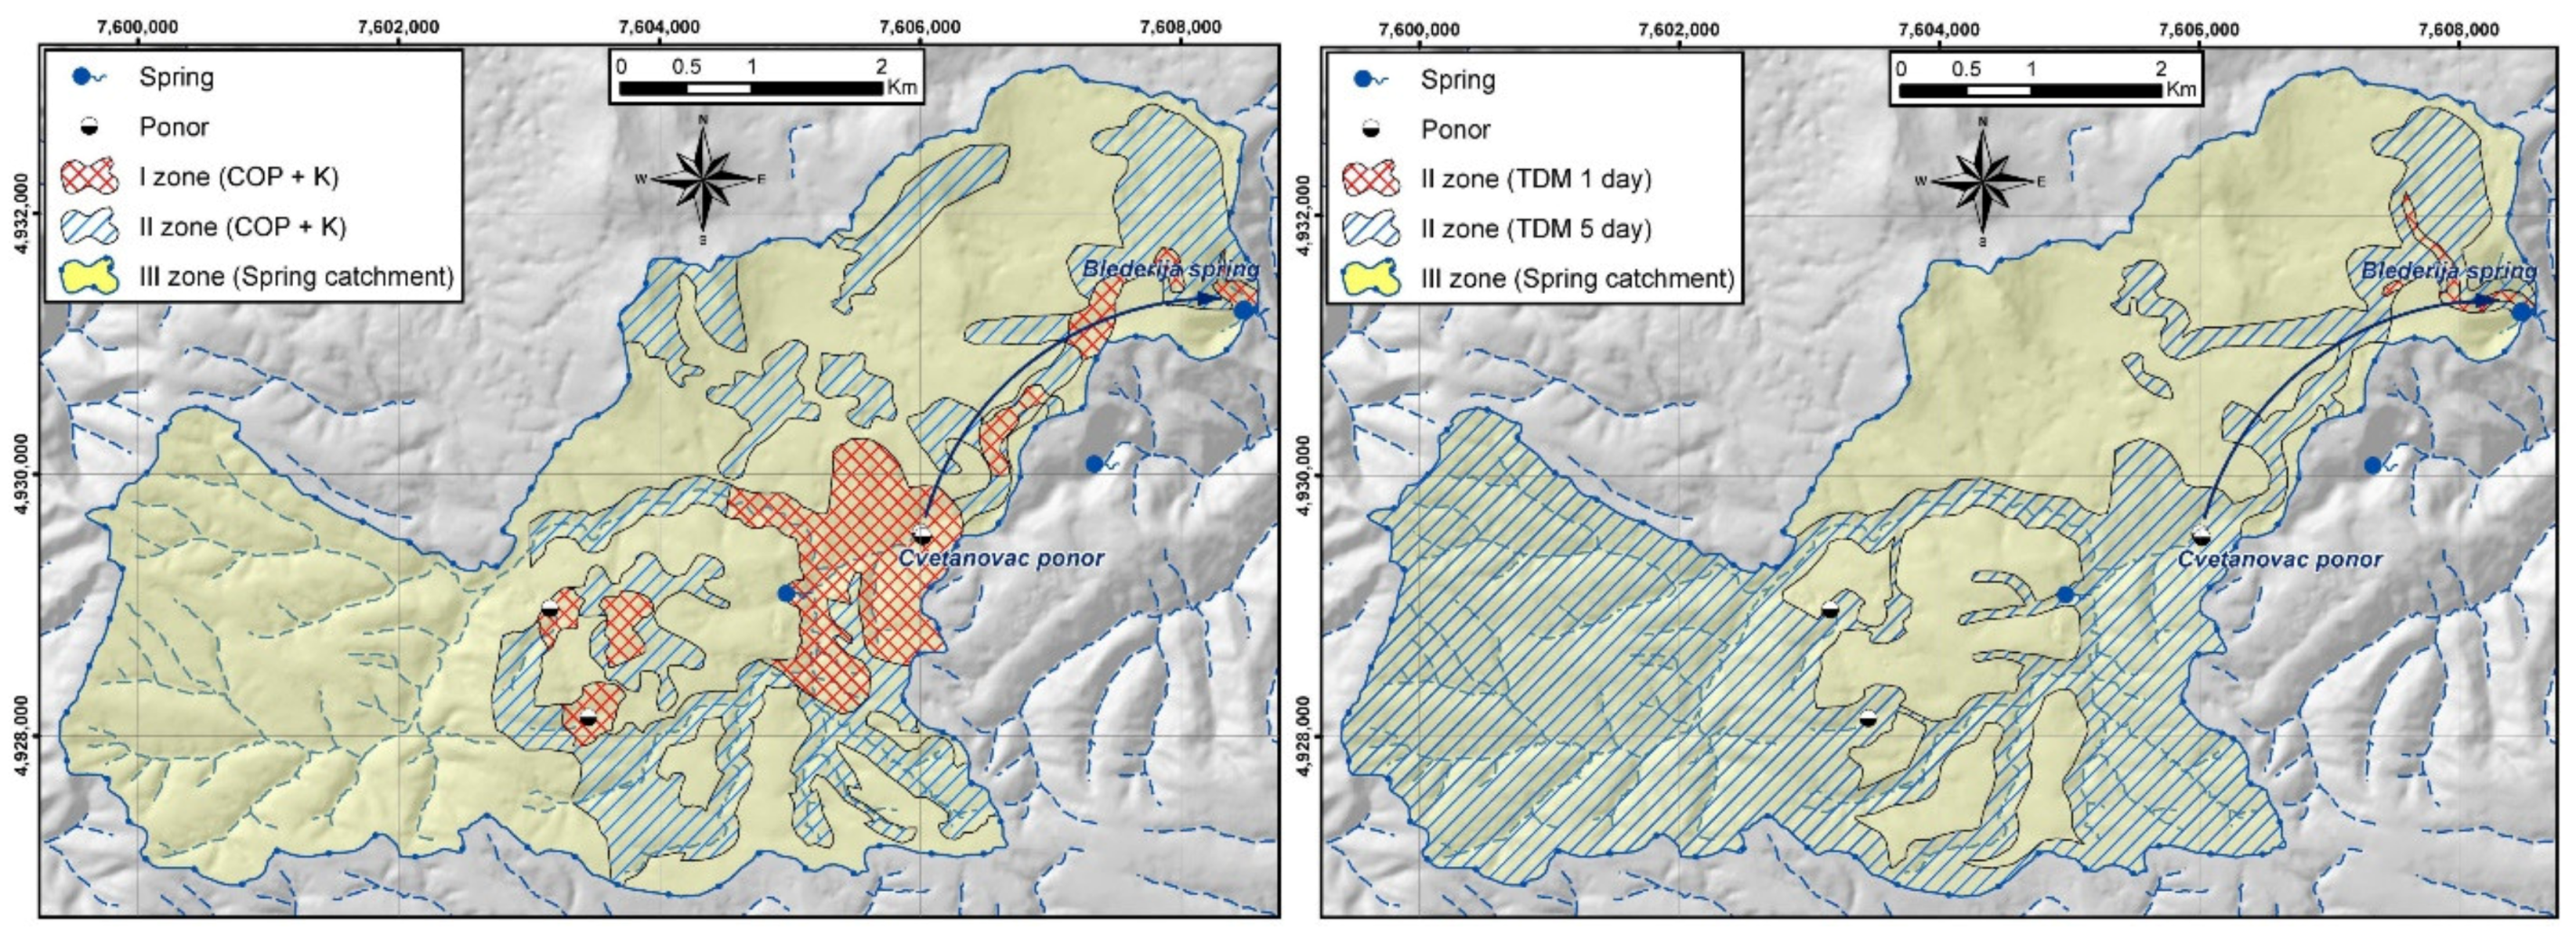
3.1. Application of COP + K Method

The initial step in applying the COP + K method was assessing of the O, C, and P parameters. The O parameter consists of OS and OL parameters which refer to the protection role of soil and rocks above the groundwater level. Based on a pedological map of the research area [35], the areas are characterized primarily by OS values of 1 (rendzina on soil) or 2 (brown acid soil). Soil is not present at only small parts of karst terrain (OS = 0). OL values range between 10 and 3500. The highest values are assigned for the western part of the catchment (non-karstic part) and the middle part in the area upstream of ponor Cvetanovac, where low permeable Cretaceous sediments cover the karst aquifer [33]. The rest of the catchment is mainly characterized by relatively low OL values due to the presence of uncovered karstic rocks. The O parameter map (Figure 3) shows the high protection role of the unsaturated zone (low groundwater vulnerability) where karstic rocks are not present or are covered. The karstic part of the catchment is predominantly characterized by medium vulnerability, mainly due to the deep groundwater level and the presence of well-developed soil.
The concentration of flow factor (C) was assessed separately for ponor catchments (Cvetanovac, Nuna, and Ponorel ponors) and the rest of the area. In the ponor catchment, the distance to ponors (topographic map 1:25,000), vegetation type [36,37], and slope degree (Digital Elevation Model DEM, 10 × 10 mxm cells) were assessed to evaluate the degree of bypassing of the protective role of the unsaturated zone. For the rest of the area, the C parameter was assessed according to the presence of surface karst features (geology map 1:25,000 and field observations), vegetation, and slope degree (Figure 3).
The P parameter was calculated as one value (0.9) for the entire area considering the minor spatial differences in annual rainfall and precipitation intensity (precipitation data used from state meteorological station Miroč for period 1993–2013).
The COP resource vulnerability map distinguished a very high vulnerability class in the immediate ponor catchments, the limestone outcrops in the northern part of the spring catchment, and the immediate zone around streams that contribute to ponor catchment. A high vulnerability class is also present in the zone of sinking streams and karstic areas with pronounced karst surface features. Medium vulnerability is associated with the rest of the karstic area, while the low and the very low vulnerabilities are present in areas with allogenic recharge and parts of the karst massif covered by low permeable rocks.
Assessment of K factor map included preparation of three maps which depend on different properties of horizontal groundwater movement [19]: Groundwater travel time (t subfactor), Information on karst network (n), and Contribution and connection subfactor (r). Three classes are distinguished on the first map (Kt map): t < 1, 1–10, >10 days (Figure 4) based on water travel time through the main channels (dye test results) and taking into account water filtration through rock matrix porosity. The second subfactor depends on the development of the karst network, which is similar to the K factor at the EPIK method [15]. The smallest value of 1 was assigned to the area with evident karst channel (from ponor to spring), while the value of 3 was calculated in the rest of the karst area [33]. The third subfactor r considers the contribution of different parts of the aquifer to spring. The close spring catchment with autogenic recharge is rated with value 1, and the rest with values 3 and 5. The K factor map is obtained by multiplication of values of previously defined subfactors (Figure 4).
The final COP + K source vulnerability map (Figure 5) was produced as a combination of COP and K maps. Initially, the COP resource map was classified into five classes with values from 1 to 5, while the K map was classified into three classes with 0 to 2. The sum of both values resulted in the COP + K index, where values vary between 1 and 7. According to the authors of the COP + K method [19], the highest source vulnerability corresponds to the area with COP + K values of 1 and 2. In the case of Blederija spring, the highest source vulnerability values were obtained for immediate ponor areas, the area where the main karst conduit passes, and the part of the karst area with very high resource vulnerability. Areas with the COP + K index of 3 are characterized as medium source vulnerability, and these areas are mainly associated with parts of the karst system with high resource vulnerability. The rest of the area is characterized with COP + K values between 4 and 7, and therefore, these parts of the spring catchment area have low source vulnerability.

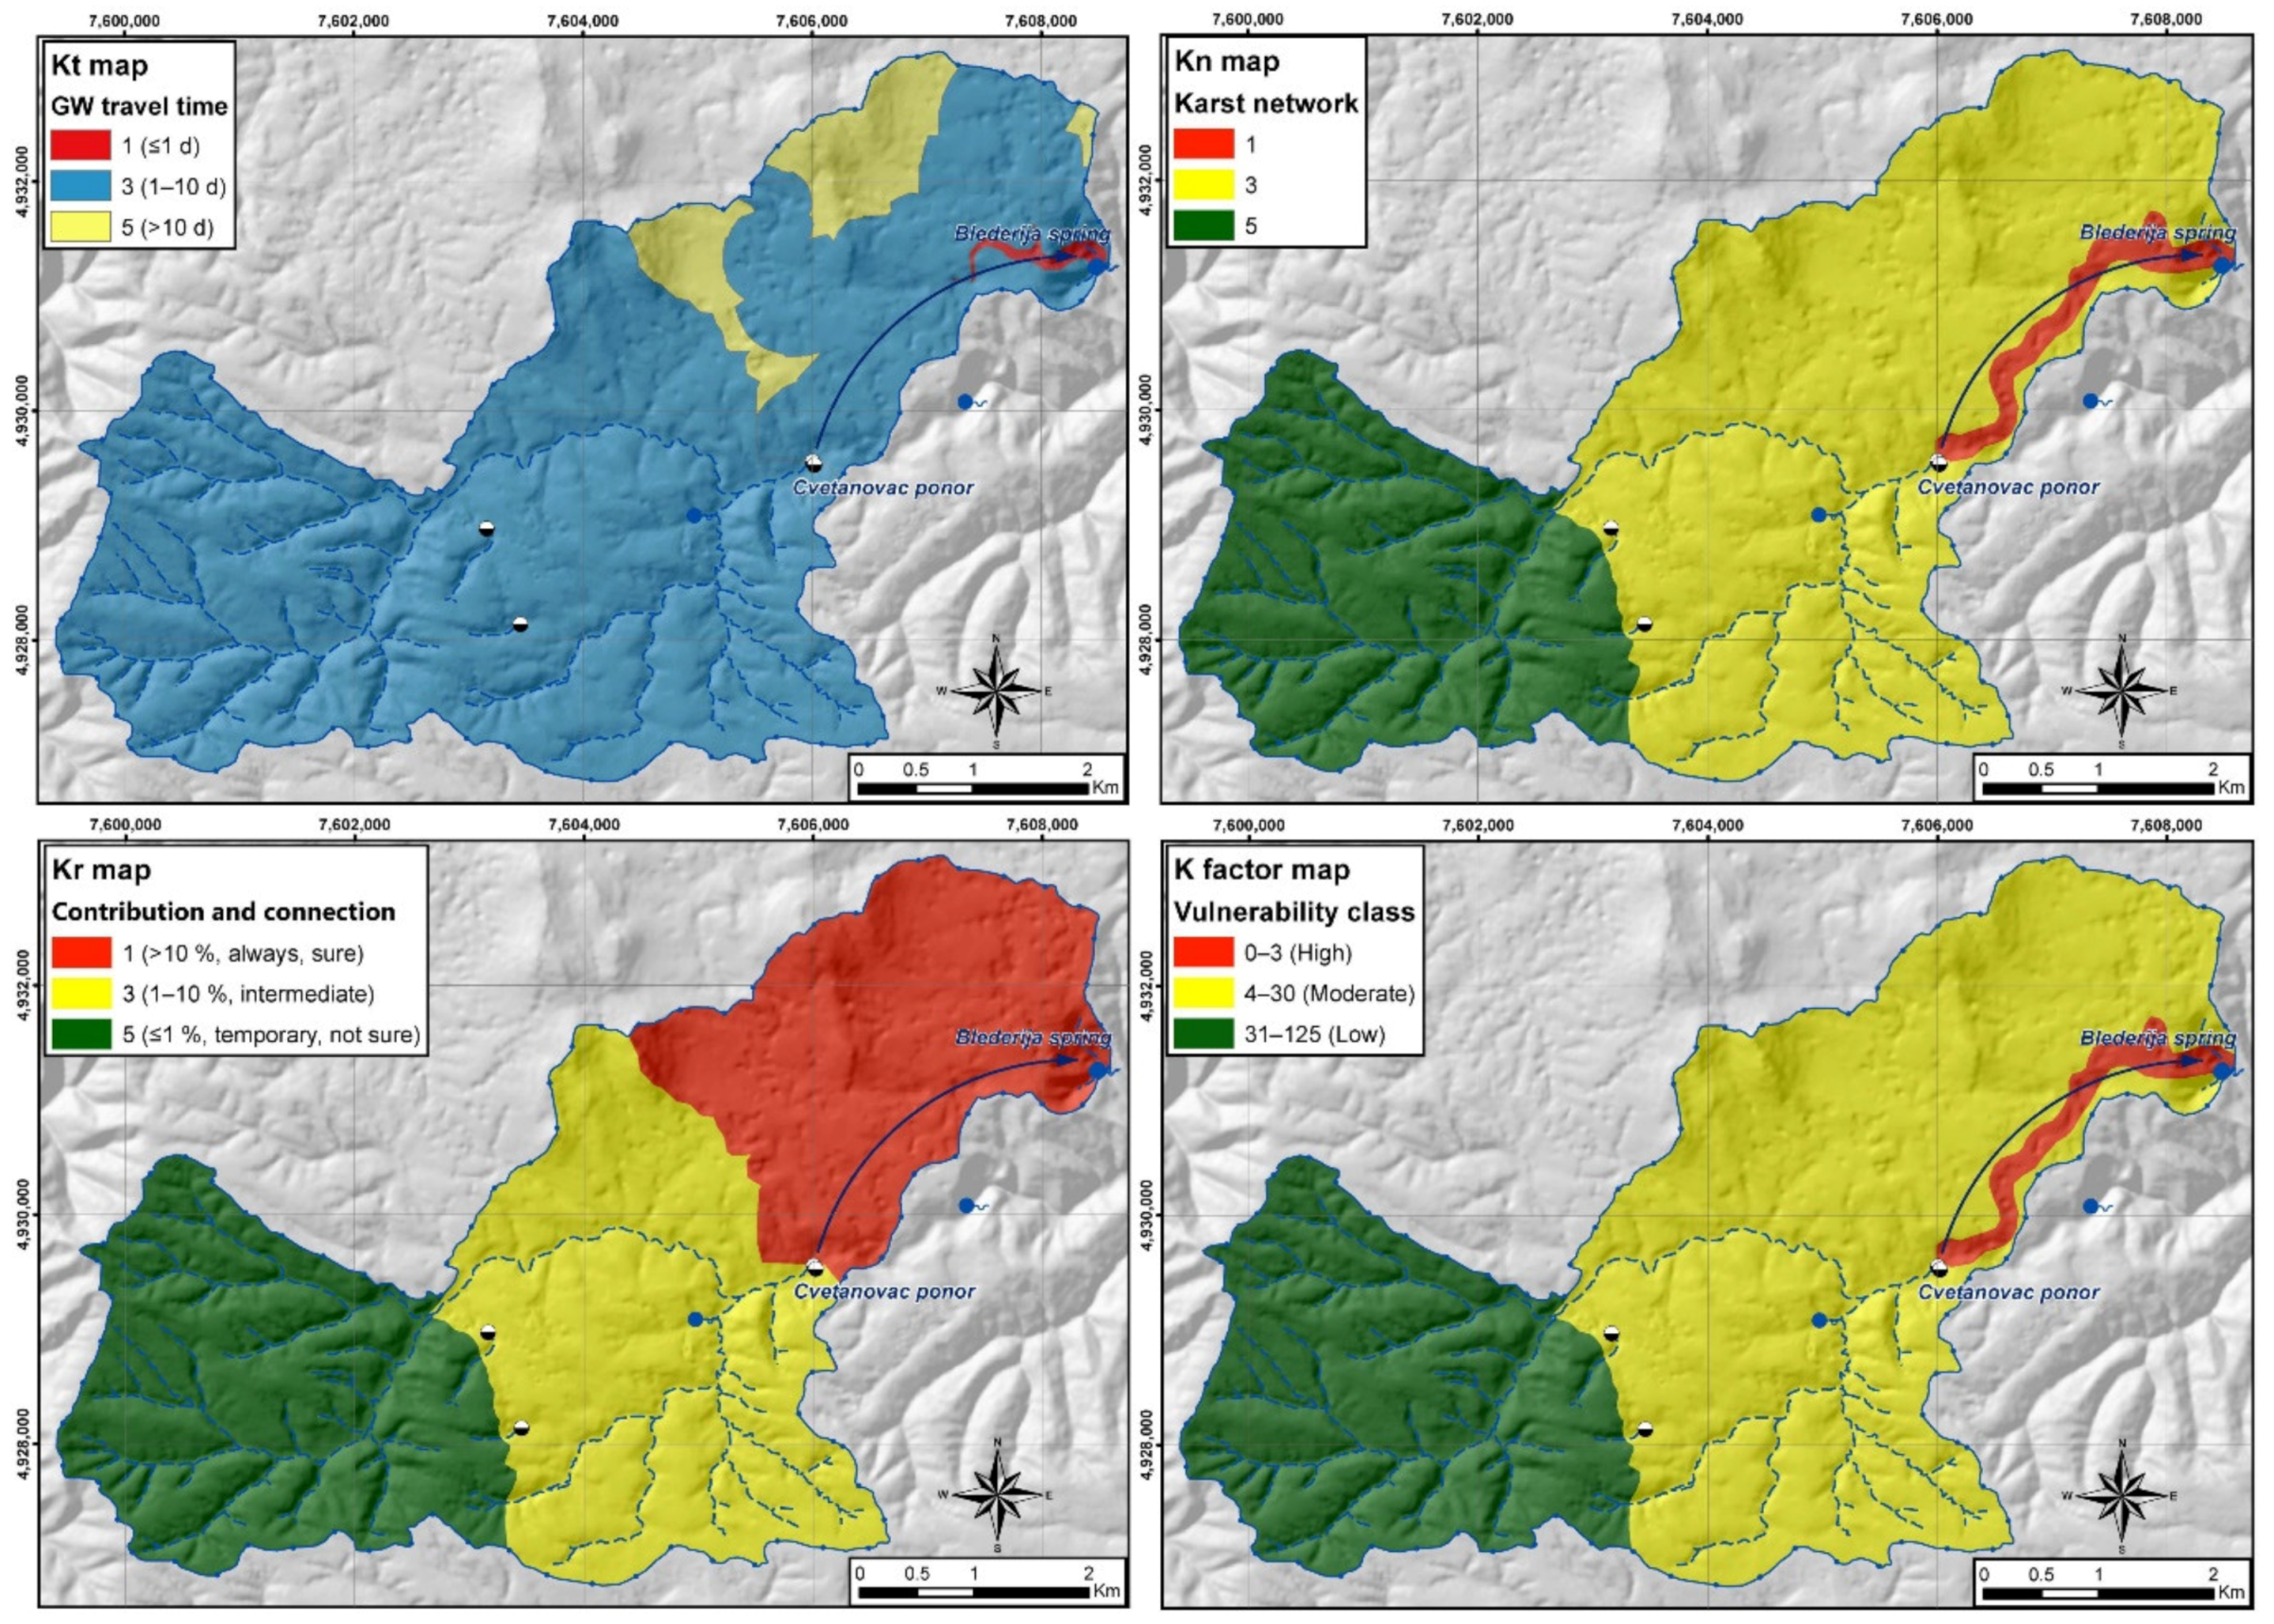
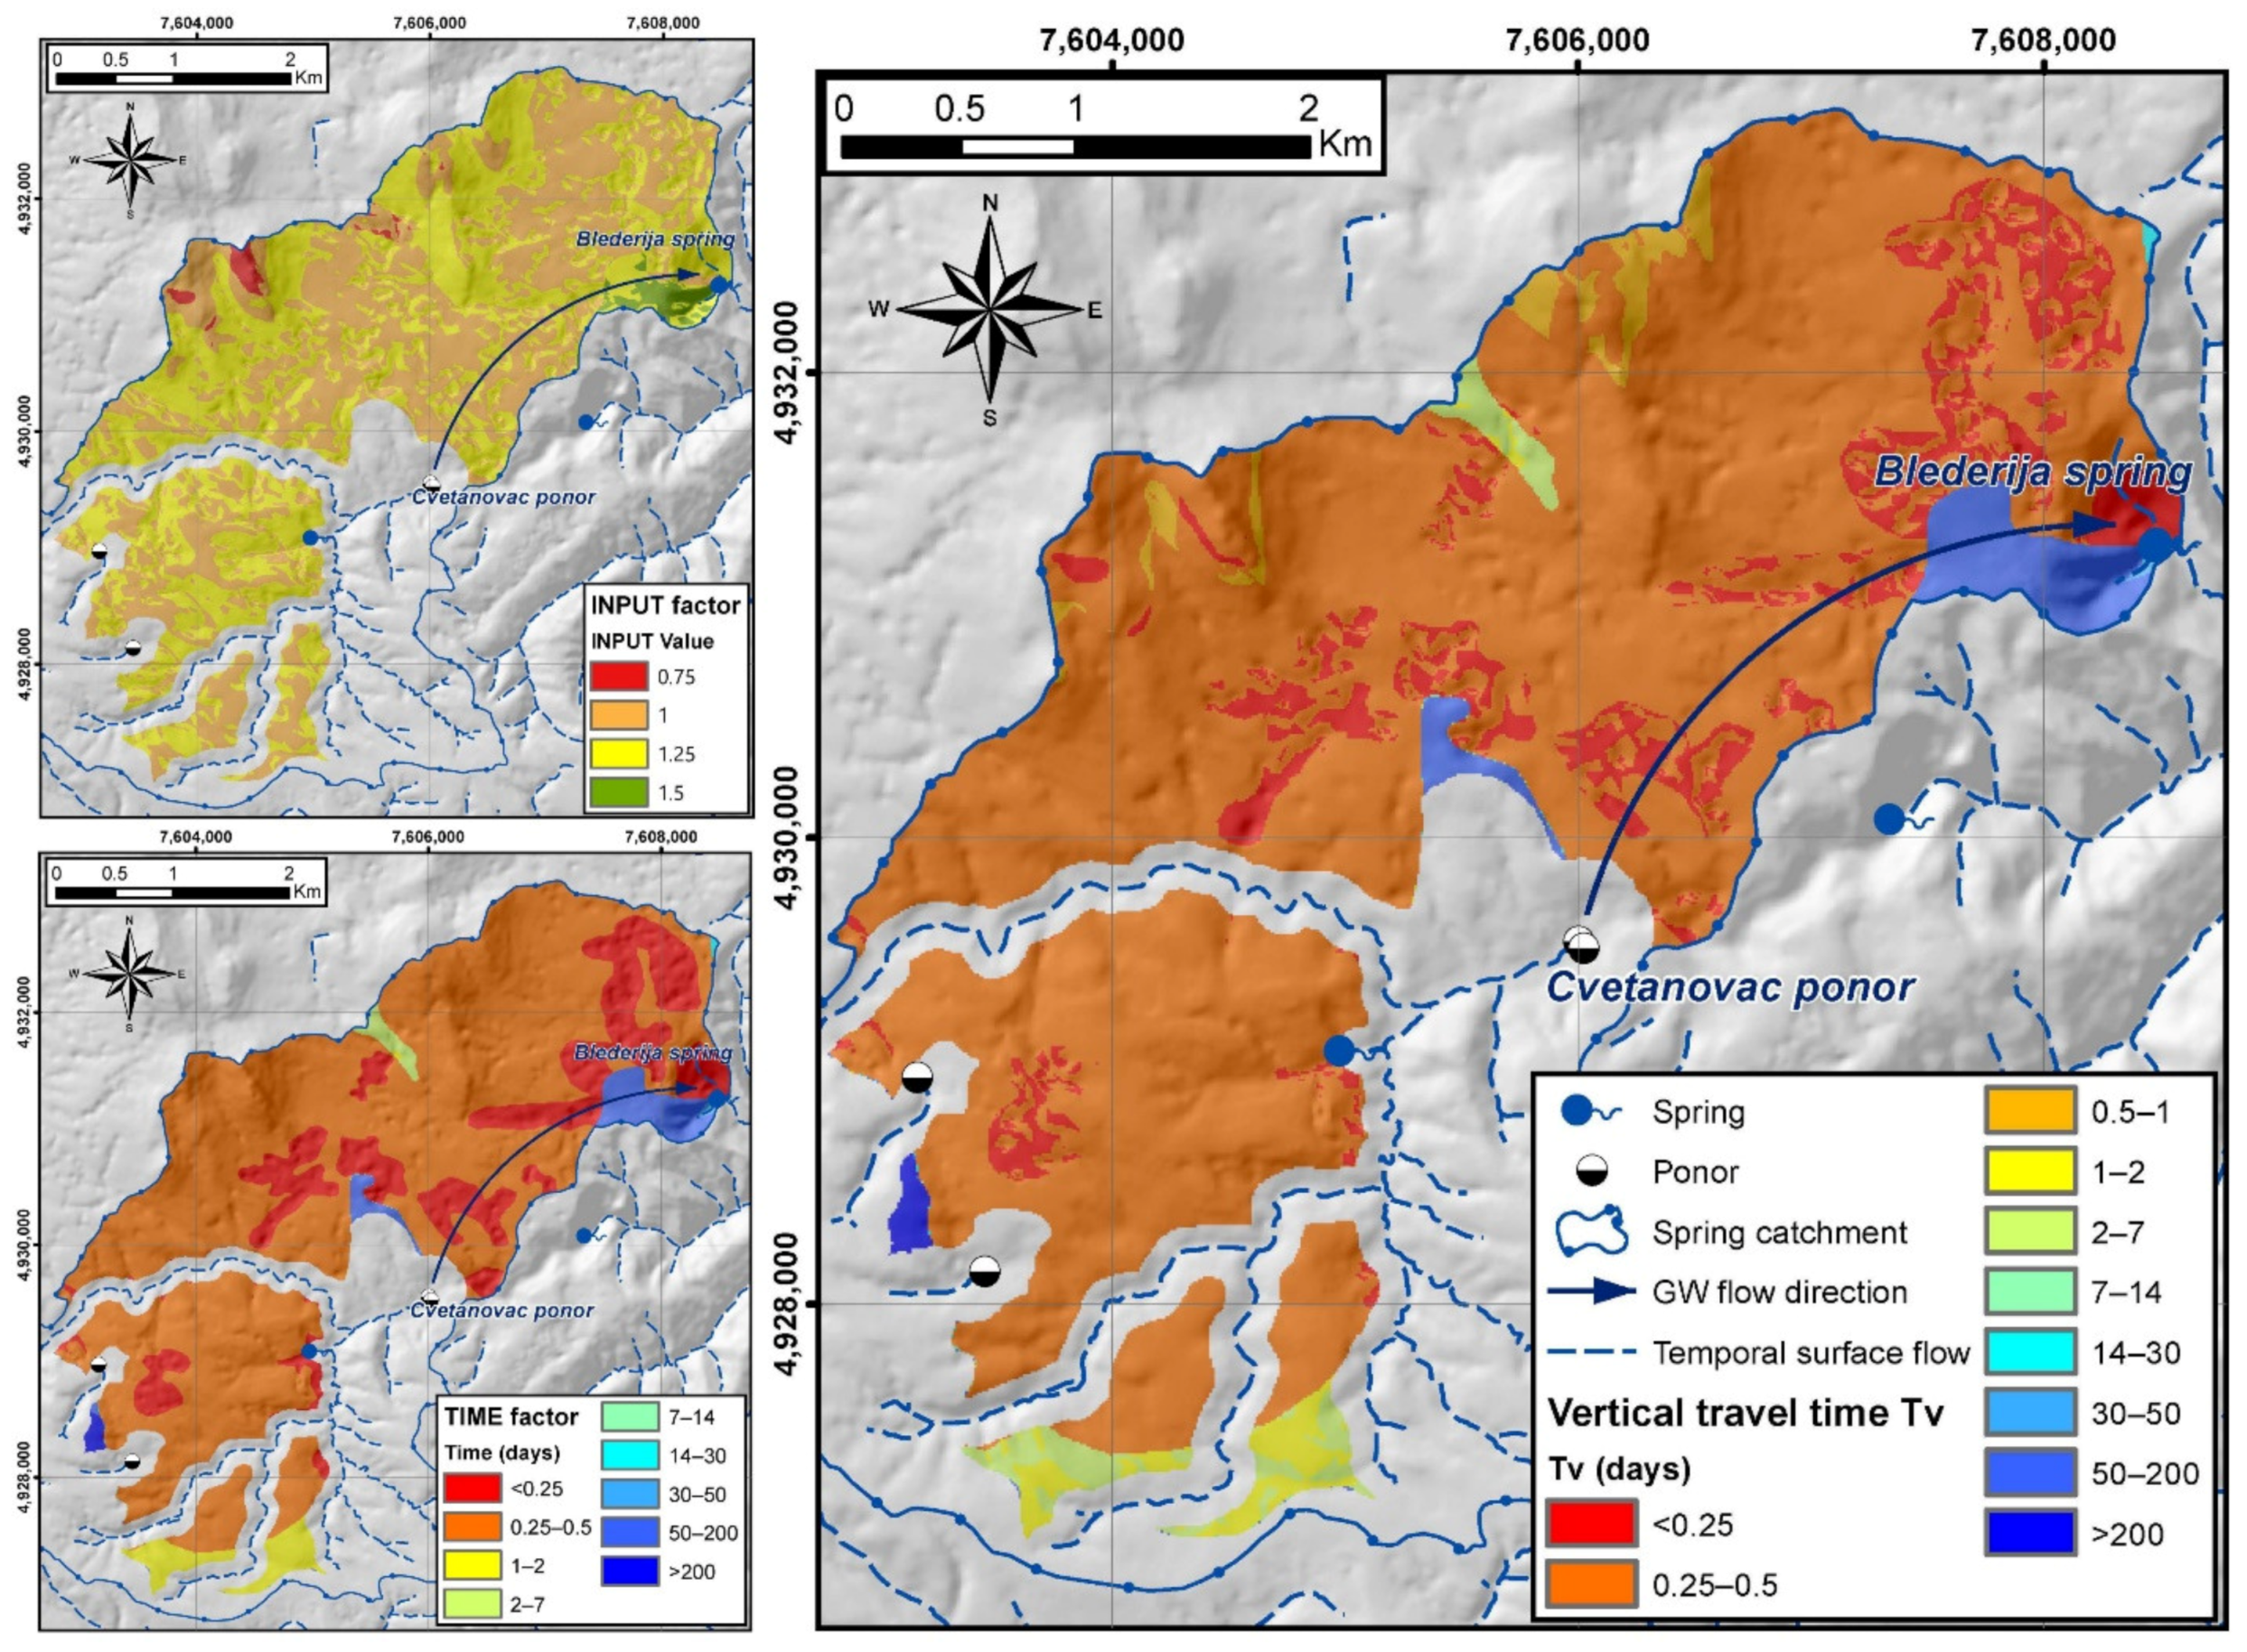
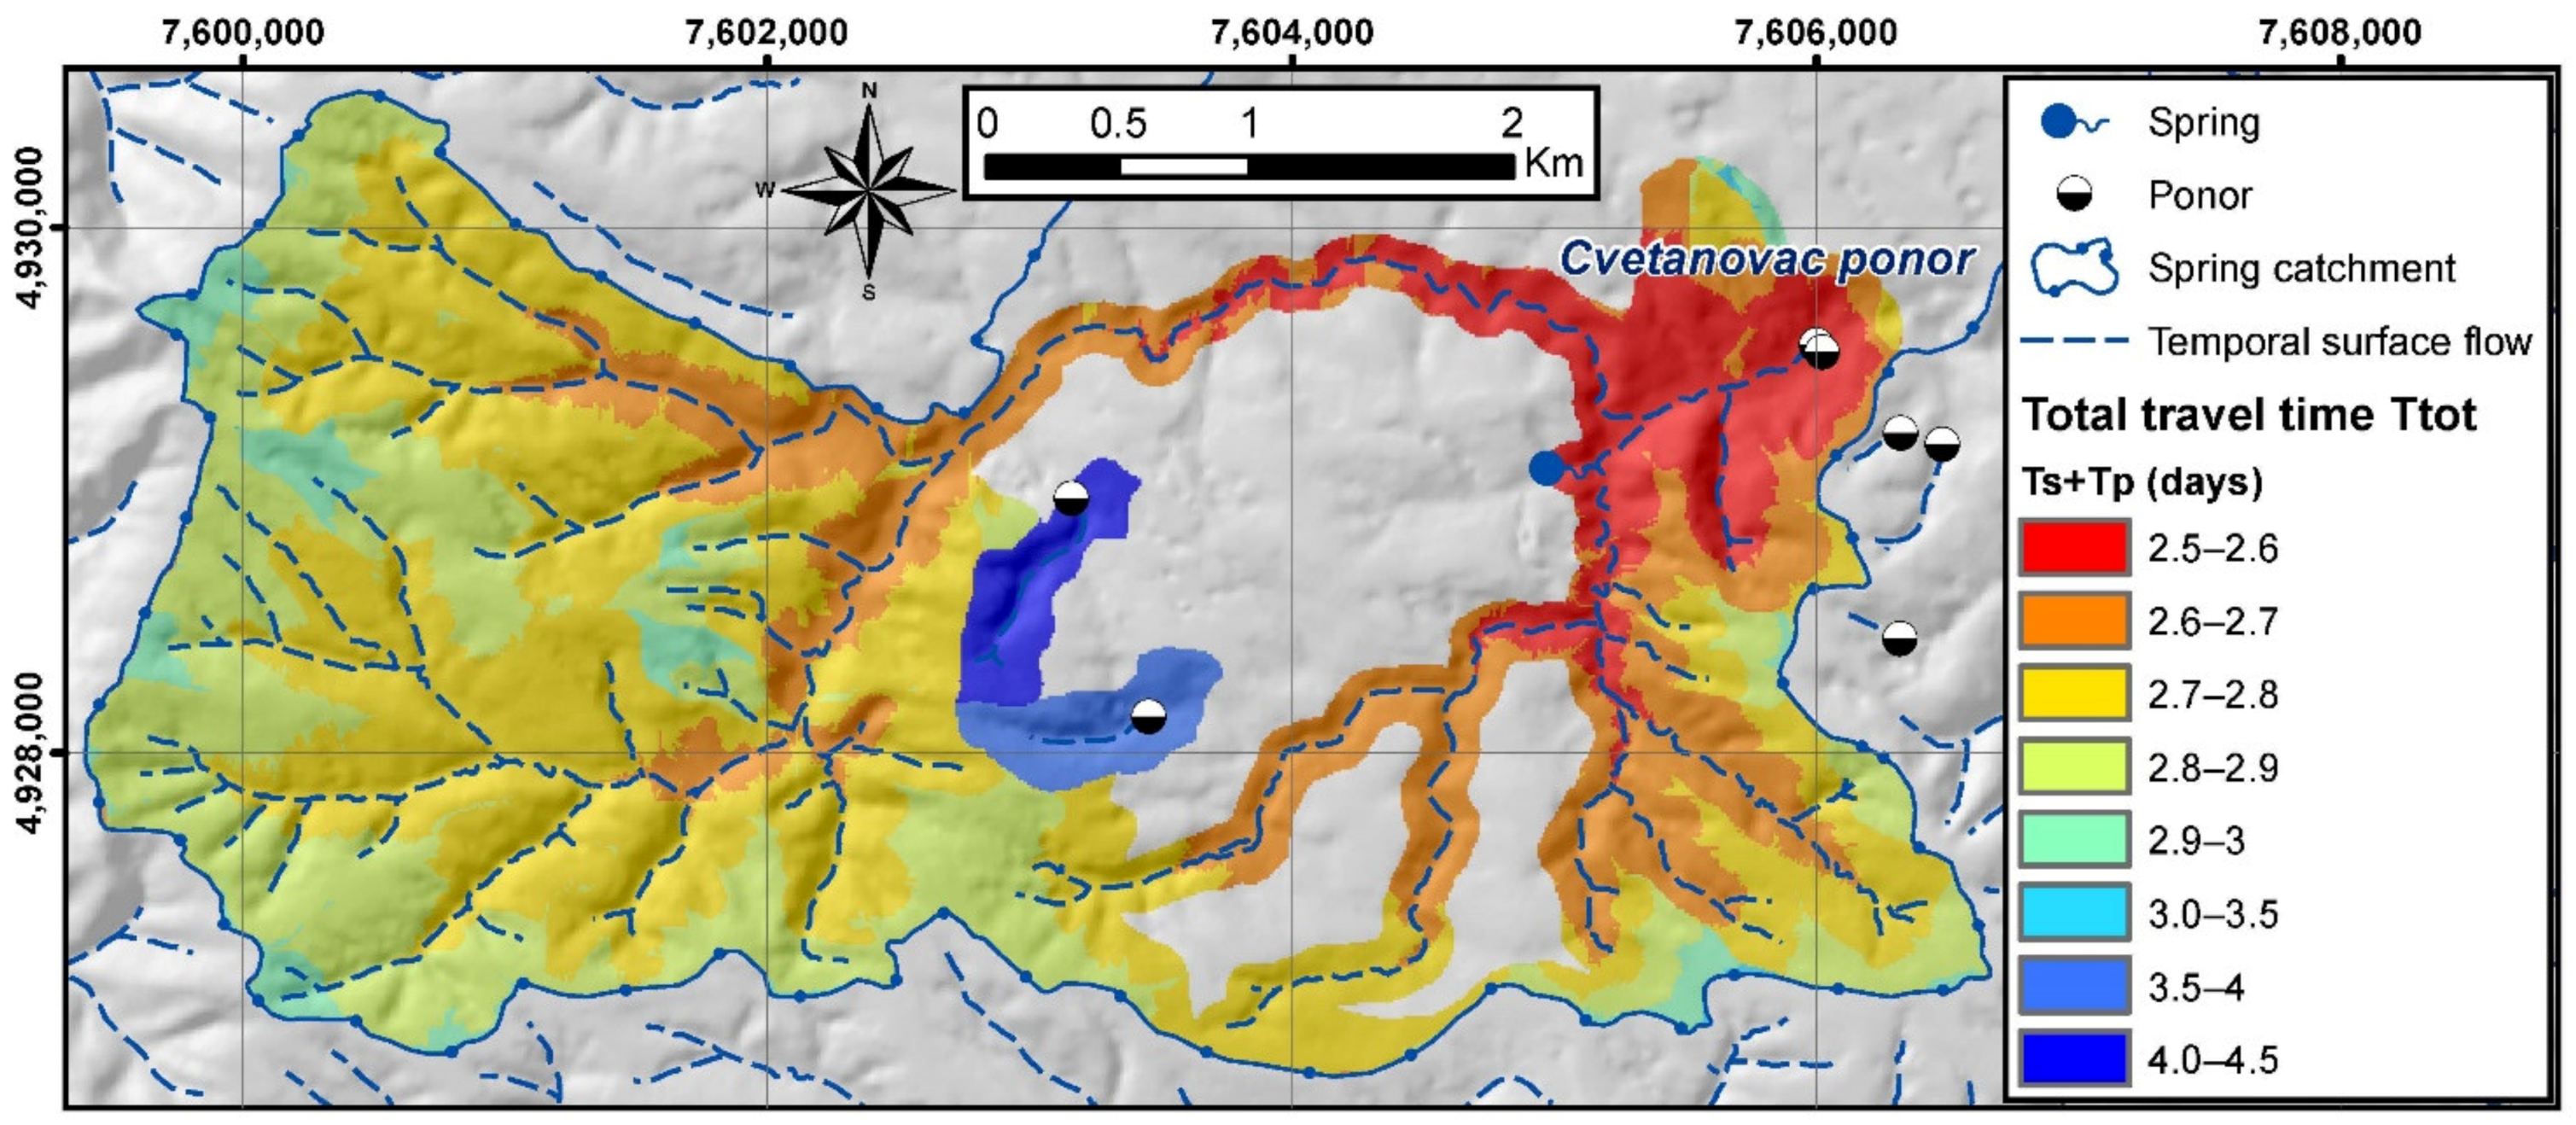
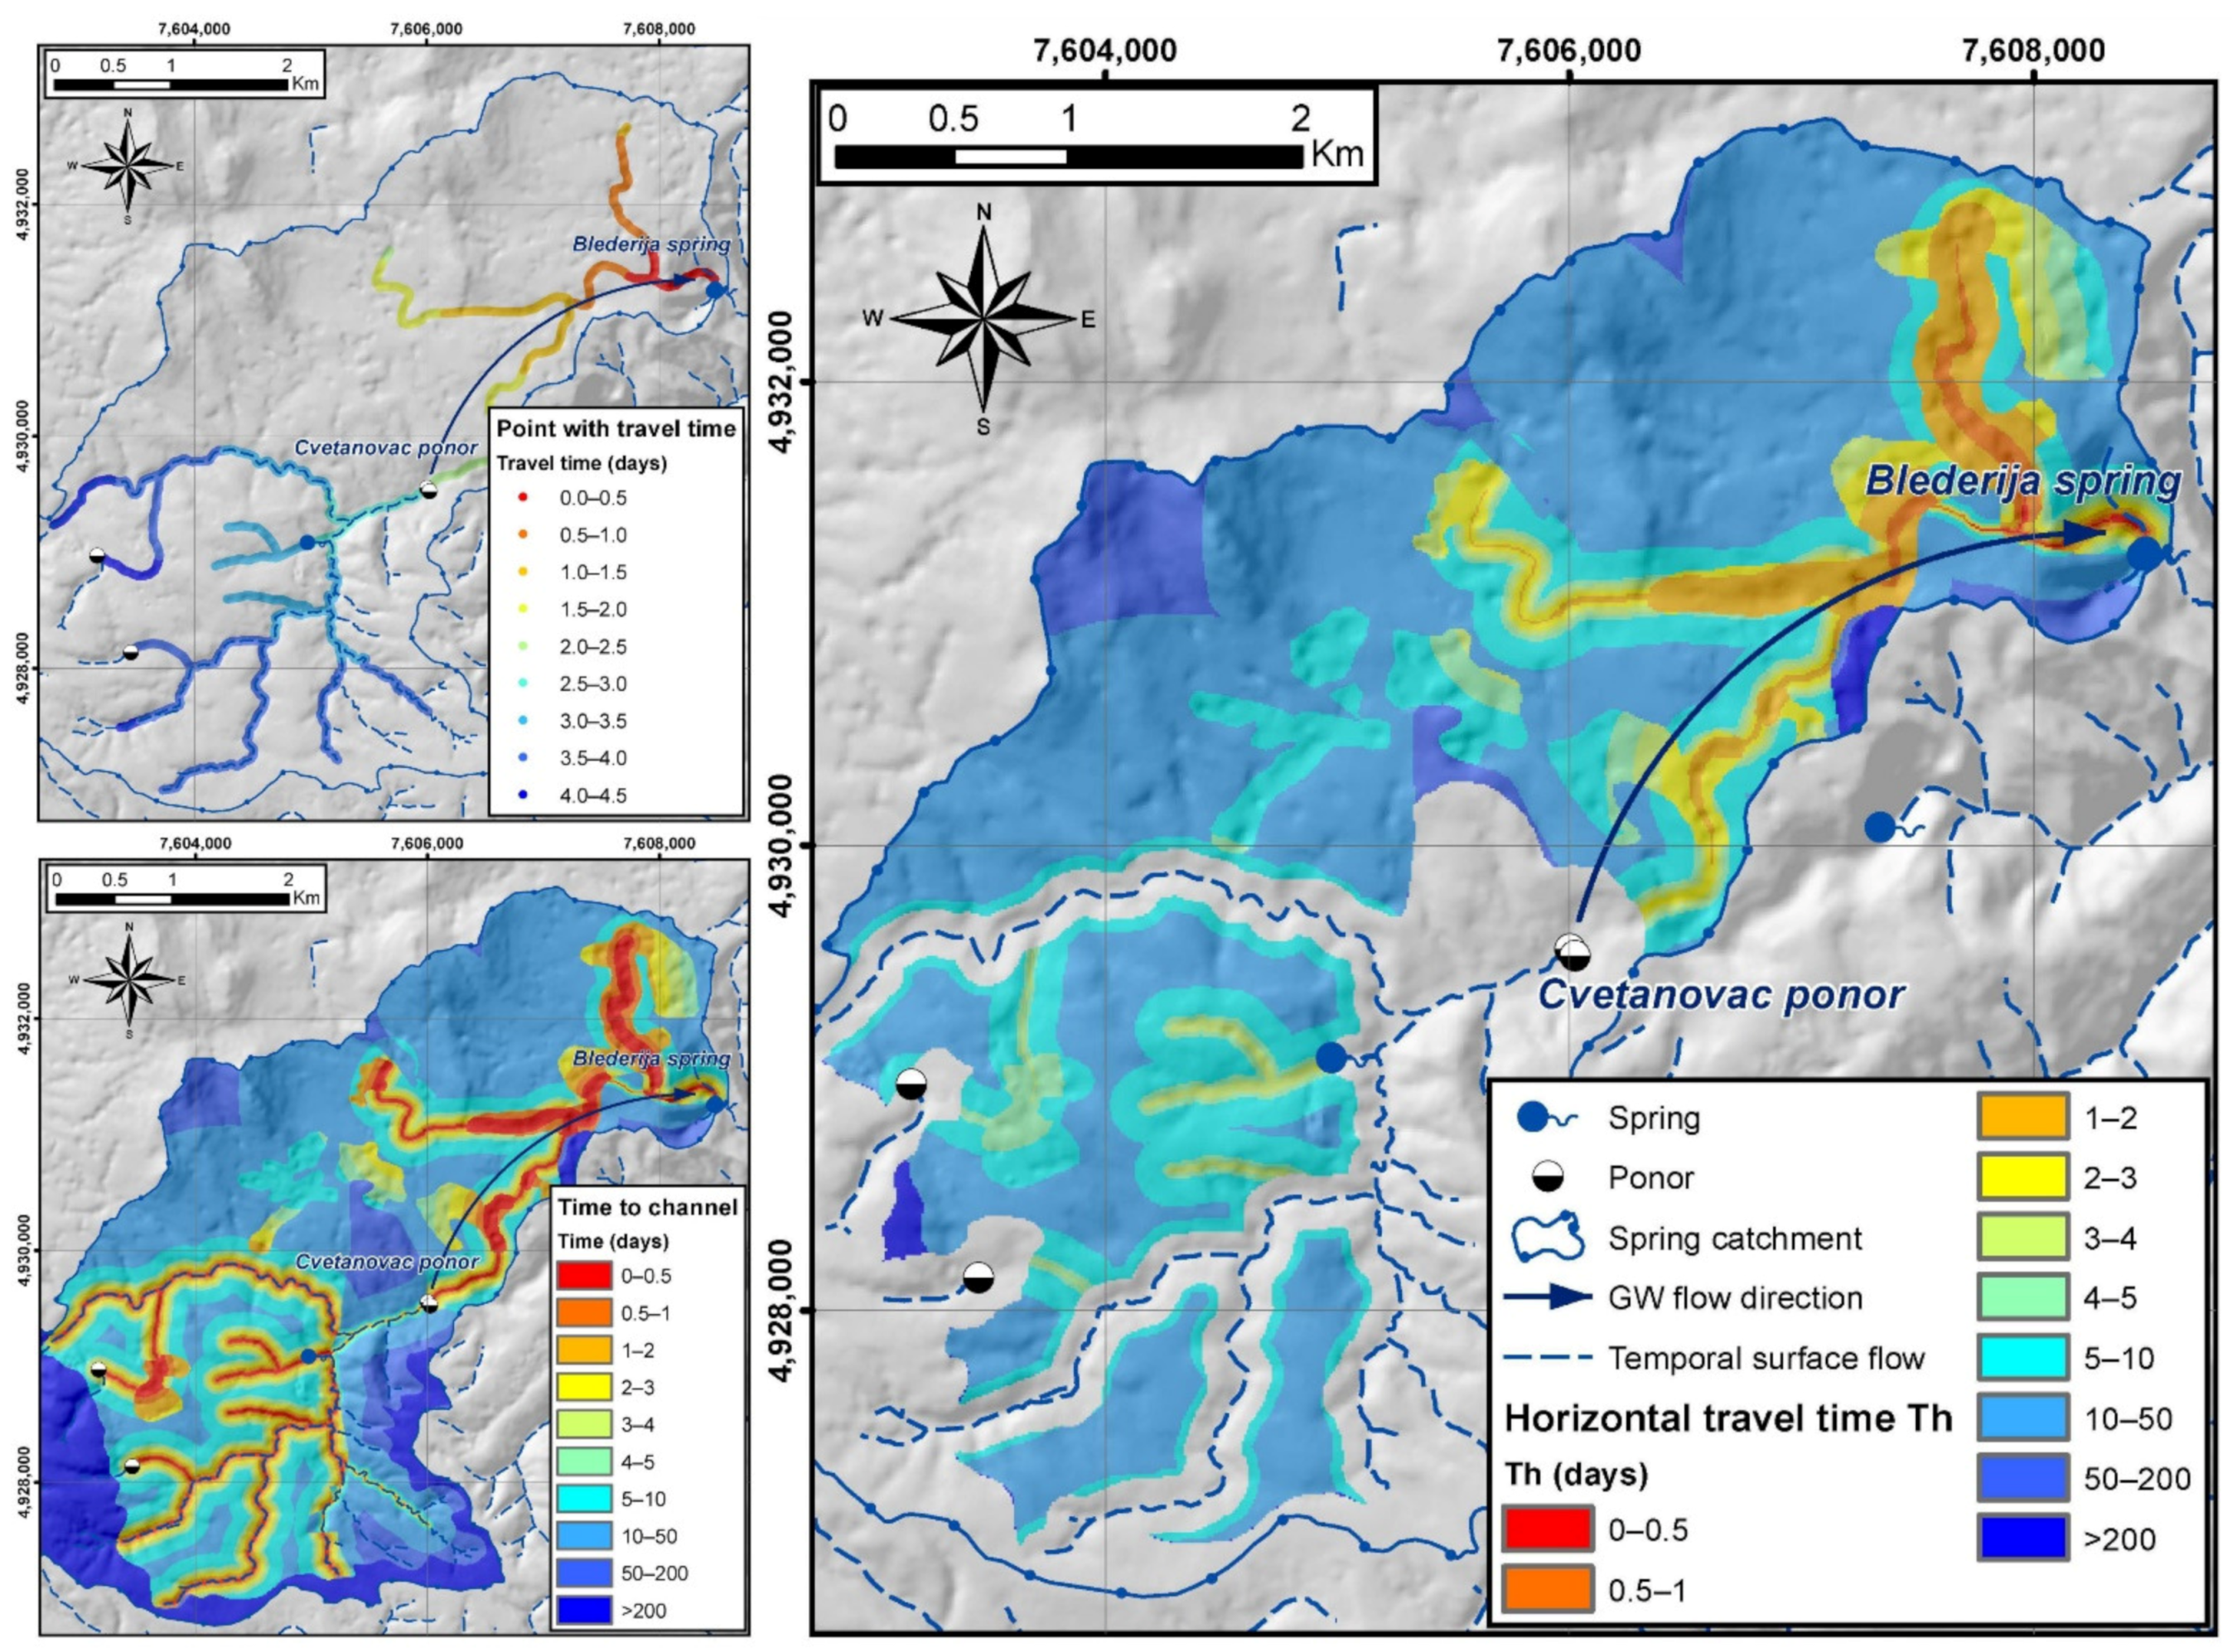
3.2. Application of TDM Method

Application of TDM method for assessment of groundwater source vulnerability included assessment of three components of water travel time: vertical tv and surface ts water travel time (together representing the resource groundwater vulnerability) and horizontal water travel time component (th) which is necessary for source protection.
Assessment of vertical travel time tv included preparation of several different maps (precipitation, terrain orientation, slope, vegetation, soil type, and thickness) as a basis for calculating the spatial distribution of annual recharge. The same spatial database as with the COP + K method was used for calculation of these parameters. The calculated annual recharge was mainly between 200 and 600 mm, and spatial differences mainly resulted from changes in sun radiation and vegetation cover values. This map was later transformed into the INPUT parameter, reflecting the influence of diffuse infiltration on water travel time through the unsaturated zone (Figure 6).
The second component of vertical travel time is the TIME parameter which considers the time needed for water to travel from the surface to the groundwater level. Soil and unconsolidated sediment thickness and hydraulic conductivity were initially used to assess the water travel time through these sediments [35]. Then, rock thickness, conductivity, faulting, and bedding were assessed to calculate water travel time through consolidated sediments [33]. Both travel times resulted in the water total travel time through the unsaturated zone (TIME parameter) presented in Figure 6. The produced map shows that up to 12 h is needed for infiltrated water to travel from the surface to the groundwater level in the area of uncovered karst. Small parts of carbonate rocks covered by rocks and sediments with lower conductivity values are characterized by significantly higher TIME values (more than 50 days). Vertical travel time tv was obtained by overlaying the TIME and INPUT maps and multiplying both values at each point (Figure 6). Similar to the TIME map, the vertical travel time map shows that less than one day is needed for surface water to travel through the unsaturated zone on the way to the water level in the area of uncovered karst.
For the ponor’s catchments area, it was supposed that water and thus potential contaminants could travel much faster as surface runoff. Therefore, surface water travel time was calculated for these areas. This parameter represents the time needed from any point from the ponors catchment to travel to the ponor itself. Three different surface flow components were assessed: sheet flow, shallow concentrated flow, and channel flow. These components were assessed based on terrain slope (derived from DEM), roughness properties [36], precipitation amount (Miroč station rain data), and flow length (derived from DEM). Conducted analysis shows that it takes up to 15 h for surface water to travel from the farthest point in the catchment to the ponor in case of heavy rains. These surface travel times were then increased for dye testing travel time (2.5 days from ponor Cvetanovac to Blederija spring) to simulate total travel time (ttot) from any point in the catchment area of the ponor to the spring (Figure 7). For two small ponors located at the western part of the catchment, surface water travel times were increased with higher water travel time (≈4 days) since more time is needed for infiltrated water to travel to Cvetanovac ponor and then to Blederija spring.
Horizontal travel time was assessed for areas where groundwater is traveling through the saturated zone of the karst system toward the springs. The main channel from Cvetanovac ponor to Blederija spring was initially assessed based on geological and geomorphological site settings [32,33]. Then, travel times and flow velocities were estimated using the results of a conducted dye tracing experiment. A similar procedure was then applied to assess flow velocities and travel times through subsequent confluent channels. Travel time from each point through the matrix system toward the nearest channel was calculated using the Euclidian distance with initial water flow velocities of 0.2 m/h [38]. The horizontal travel time was calculated as a combination of diffuse horizontal water flow time and water time from the nearest conduit point to Blederija spring (Figure 8). The map shows that up to 5 days is needed for groundwater to travel from areas near the main channels and highly karstified areas. Up to 200 days is needed for water to travel through the karst system, considering the filtration through small fissures and karst conduits. This part of the water flow contributes to and feeds the spring during the recession periods.
The final groundwater source vulnerability map was obtained by combining all three water flow components (Figure 9). As presented in Figure 1, the Total water travel time ttot for the ponor catchment represents the time needed for surface water to travel to the ponor and then from the ponor to the spring. For the rest of the spring catchment where diffuse infiltration prevails, ttot was calculated by adding the horizontal water travel time th to vertical water travel time tv. The final map shows that spring Blederija is most vulnerable in the immediate spring area. The map also shows that the spring is highly vulnerable from the ponor catchment since surface water and thus potential contaminants could travel very fast, in less than three days to the spring. For the karst areas with diffuse infiltration, usually up to 50 days is needed for water to infiltrate to the water level and later to move to the spring. The highest values (>200 days) are calculated where karst is covered by younger Cretaceous or Neogene sediments.

4. Discussion

Both COP + K and TDM methods are primarily created for assessing groundwater source vulnerability. Therefore, the final maps are meant to be used for groundwater source protection and should be a basis for delineating sanitary protection zones.
Both maps resulted in similarities but also differences in the evaluation of groundwater vulnerability. The highest vulnerability was calculated for the area near the springs, in the immediate area of ponors, and highly karstified parts of the karst terrains. The application of both methods has shown that higher vulnerability does not have to be a function of groundwater source proximity. Higher vulnerability should be assigned for zones with concentrated infiltration where the protection role of unsaturated zone is significantly decreased, so fast flow of water and potential contaminants can be expected.
In order to make a better comparison of obtained vulnerability maps, it is necessary to compare maps of particular parameters used in the calculations. The O parameter of the COP map refers to the Vertical travel time (tv) map for the areas with diffuse infiltration. The TDM method produced a map where vulnerability is relatively high for the complete area (tv < 1 day) except for parts of the system where low permeable rocks cover limestones (Figure 6). The O map brings medium vulnerability (Figure 3) for the majority of the area due to different evaluations of the protection role of the soil.
For areas with concentrated infiltration (ponor catchment), the TDM method excludes diffuse infiltration and assumes that complete surface water infiltrates through active ponors. Therefore, for these areas, the Surface water travel time (ts) map should be compared with the COP vulnerability map (Figure 3). Both maps show high vulnerability in the immediate ponor’s zone (up to 2 km from the ponor point). A significant difference is obtained for the non-karstic area west of the catchment. The vulnerability of this area is primarily low and very low according to the COP method, which is a result of the great distance to the ponor point (>3500 m). Surface water travel time (ts) map for the same area shows high vulnerability since less than one day is needed for the surface water to travel from the most distant areas to the ponor location.
K factor map (Figure 4) and Horizontal travel time (th) map (Figure 8) are used for estimation of natural protection of saturated zone during the filtration of groundwater toward the spring. Both maps show high vulnerability for the area of the main karst channel, from the ponor to the spring. Similar vulnerability is calculated for the majority of the area with diffuse infiltration where medium vulnerability is obtained for K factor and Horizontal water travel time (th) is between 10 and 50 days as a result of slow karst water filtration. The K factor shows low vulnerability for areas with allogenic recharge (non-karstic, western part of the catchment), while this area appears as medium to high vulnerability with the TDM method because of short surface water travel time.
Further comparison of obtained vulnerability maps is difficult because the COP + K method produces strict vulnerability classes [6], while the TDM method defines the vulnerability as a water travel time. Vulnerability classes obtained by different methods can be compared by reclassifying and implementing geostatistical analysis [39], but in this case, the TDM can serve more as a validation method for the vulnerability map obtained by the COP + K method.
Validation of obtained vulnerability maps at the scale of groundwater source catchment is very limited or almost impossible [40]. Long-term spring flow and water quality observations, isotope analysis, natural tracers, and water budgeting could help in a better understanding of hydrogeological properties of the karst system [12]. However, spatial validation of vulnerability maps is possible only by conducting dye-trace experiments at different points of the source catchment [41]. Dye tracer travel time and recovery rate could directly confirm the vulnerability degree obtained by applying the COP + K method and water travel time obtained by applying the TDM method. Nevertheless, this kind of investigation requires significant time and resources to validate several points, and thus detailed validation was out of the scope of this study.
Conducted vulnerability assessment points out that both methods are highly applicable for karst terrains. Specific karst features are being considered and results strongly depend on the type of groundwater recharge. In the case of other types of aquifers, the COP + K method is applicable for assessing the intrinsic vulnerability but has a limitation in assessing source vulnerability for non-karstic aquifers. This is due to the estimation of the K factor, which is primarily designed for the assessment of karst saturated zone filtration. On the other hand, the TDM method has already been applied for vulnerability assessment of intergranular aquifers [27], and therefore, this method has broader applicability.
Since one of the aims of this paper was to use vulnerability assessment in sanitary zone protection, vulnerability maps from both methods were used for zone delineation. Application of the COP + K method results in the determination of three different vulnerability classes which can be easily transformed into sanitary protection zones: High vulnerability for I SPZ, medium vulnerability for II SPZ, and low vulnerability for III SPZ inside the catchment of the groundwater source. This approach is very similar to the EPIK method [15] designed in Switzerland for sanitary zone delineation based on vulnerability classes.
A proposal for sanitary zone delineation for the Blederija groundwater source was prepared based on vulnerability maps obtained by the COP + K method (Figure 10, left). I SPZ covers areas near the spring as well as the immediate zone of ponor Cvetanovac. This way, zones with intense infiltration are emphasized, considering that these are areas where contamination can occur very fast. Parts of the karst system with allogenic recharge (western part of the catchment) are recognized as III SPZ because of low vulnerability resulting from a significant distance from the ponor.
Application of this concept of sanitary zone delineation could require changes in local legislation because water travel time is being used as a fundamental approach in many European countries [42].
Application of the TDM method results in vulnerability which is presented as a time needed for water and potential contaminants to travel from the surface to the spring. Thus, delineation is more straightforward since the vulnerability map can be easily transformed into sanitary protection map regarding the local legislative. Two scenarios are presented in Figure 10, right (II SPZ is based on 1-day and 5-day water travel time). 1-day SPZ covers only the area near the spring. 5-day SPZ covers a much bigger area, including the entire catchment of ponor Blederija, from where water can travel from any point to the spring in less than five days.
The TDM method compared to the COP + K method gives more accessible results to understand and use for sanitary zone delineation. Nevertheless, it should be mentioned that COP + K addresses the contribution and connection subfactor (r), so distant and small ponor catchments do not have to be as usually recognized with high vulnerability.
Obtained results point out that applying different vulnerability assessment methods serves as a good base for sanitary zone delineation. Due to legislative limitations, the vulnerability classes cannot be directly transferred into sanitary zones, but vulnerability maps show where the protection measures should be strict. This approach could be beneficial compared to standard travel-time delineation methods where large areas could be assigned as II SPZ when the protection role of the unsaturated zone is not considered.

5. Conclusions

The presented case study and application of COP + K and TDM methods highlight the necessity of perceiving different factors during the delineation of source sanitary protection zones. It particularly relates to karst groundwater sources where the specific infiltration conditions and protection role of the unsaturated zone need to be analyzed. The benefit of applying karst groundwater vulnerability assessments is evident since many assessed parameters describe the specific flow of water through the karst system.
Applying different vulnerability assessment methods in karst terrains usually results in significant differences, but both methods resulted in similar results in the current case. Both vulnerability maps show that the highest vulnerability classes were calculated for the areas near the spring Blederija and the immediate area of ponor Cvetanovac. The essential difference between obtained vulnerability maps is the way how the vulnerability is expressed and presented. The COP + K method clearly defines three vulnerability classes, while the TDM method shows the groundwater vulnerability through water travel time, where each point in the spring’s catchment shows how much time is needed for surface water to reach the spring.
Hence, the delineation of sanitary protection zones is much easier when the TDM method is being used. III SPZ usually covers the complete source catchment, while the II SPZ is mainly defined through water travel time (12 h, 1 day, 5 days, 10 days, 50 days, etc.) Therefore, different vulnerability classes can be easily transformed into a sanitary protection zone map.
Although the application of vulnerability assessment represents a significant advance in delineating sanitary protection zones in karst terrains, there are still possibilities for further improvement. A precise evaluation of the contribution of the different parts of the catchment or impact of dilution during high water events, or even changes in catchment size during the year, are some of the specific karst features that should be addressed in the future. Significant improvement could be made by application of these vulnerability assessment methods at well-investigated groundwater source catchments. In such circumstances, part of field experiments could be used only for final map validation and may potentiate further calibration of proposed methods.

Author Contributions

The paper was prepared by joint efforts of all authors. Conceptualization, V.Ž.; methodology, V.Ž. and N.A.; software, V.Ž. and S.S.; validation, V.Ž. and N.A.; data curation, V.Ž. and S.S.; writing—original draft preparation, V.Ž.; writing—review and editing, V.Ž., N.A. and S.S.; visualization, V.Ž. and S.S.; supervision, N.A. All authors have read and agreed to the published version of the manuscript.

Funding

This research received no external funding.

Institutional Review Board Statement

Not applicable.

Informed Consent Statement

Not applicable.

Conflicts of Interest

The authors declare no conflict of interest.

References

  1. European Commission. Common Implementation Strategy for the Water Framework Directive (2000/60/EC)—Guidance Document No. 16—Guidance on Groundwater in Drinking Water Protected Areas; European Commission: Luxembourg, 2007. [Google Scholar]
  2. Van Waegeningh, H.G. Overview of the protection of groundwater quality. In Theoretical Background, Hydrogeology and Practice of Groundwater Protection Zones. International Contributions to Hydrogeology, IAH; Matthess, G., Foster, S.S.D., Skinner, A.C.H., Eds.; Heise Hanover: Hanover, Germany, 1985; pp. 159–166. [Google Scholar]
  3. Goldscheider, N. Delineation of spring protection zones. In Groundwater Hydrology of Springs: Engineering, Theory, Management, and Sustainability; Kresic, N., Stevanovic, Z., Eds.; Elsevier: Amsterdam, The Netherlands, 2010; pp. 305–338. [Google Scholar]
  4. Ford, D.; Williams, P. Karst Hydrogeology and Geomorphology; Wiley: Hoboken, NJ, USA, 2007. [Google Scholar]
  5. Milanovic, P. Geological Engineering in KARST, Dams, Reservoirs, grouting, Groundwater Protection, Water Tapping, Tunnelling; Zebra Publishing Ltd.: Belgrade, Serbia, 2000. [Google Scholar]
  6. Foster, S.; Hirata, R.; Gomes, D.; D’Elia, M.; Paris, M. Groundwater Quality Protection, A Guide for Water Utilities, Municipal Authorities, and Environment Agencies; The International Bank for Reconstruction and Development/The World Bank: Washington, DC, USA, 2002. [Google Scholar]
  7. Chave, P.; Howard, G.; Schijven, J.; Appleyard, S.; Fladerer, F.; Schimon, W. Groundwater protection zones. In Protecting Groundwater for Health, Managing the Quality of Drinking-Water Sources; Schmoll, O., Howard, G., Chilton, J., Chorus, I., Eds.; IWA: London, UK, 2006; p. 678. [Google Scholar]
  8. WHO. Guidelines for Drinking-Water Quality: Fourth Edition Incorporating the First Addendum; World Health Organization: Geneva, Switzerland, 2017; License: CC BY-NC-SA 3.0 IGO. [Google Scholar]
  9. Margat, J. Vulnerabilite des Nappes d’eau Souterrune a la Pollution (Groundwater Vulnerability to Contamination—In French). Bases De Al Cartographie Doc. 68 SGC198 HYD; BRGM: Orleans, France, 1968; p. 10. [Google Scholar]
  10. Vrba, J.; Zaporozec, A. (Eds.) Guidebook on Mapping Groundwater Vulnerability, International Contributions to Hydrogeology (IAH); H. Heise: Hannover, Germany, 1994; p. 131. [Google Scholar]
  11. Ivan, V.; Madl-Szonyi, J. State of the art of karst vulnerability assessment: Overview evaluation and outlook. Environ. Earth. Sci. 2017, 76, 112. [Google Scholar] [CrossRef]
  12. Daly, D.; Dassargues, A.; Drew, D.; Dunne, S.; Goldscheider, N.; Neale, S.; Popescu, I.; Zwahlen, F. Main concepts of the “European approach” to karst-groundwater-vulnerability assessment and mapping. Hydrogeol. J. 2002, 10, 340–345. [Google Scholar] [CrossRef] [Green Version]
  13. Zwahlen, F. COST Action 620 Vulnerability and Risk Mapping for the Protection of Carbonate (Karst) Aquifers; Office for Official Publications of the European Communities: Brussels, Belgium, 2004. [Google Scholar]
  14. Department of the Environment and Local Government. GSI (1999) Groundwater Protection Schemes; Department of the Environment and Local Government, Environmental Protection Agency, Geological Survey of Ireland: Dublin, Ireland, 1999; ISBN 1-899702-22-9.
  15. Doerfliger, N.; Zwahlen, F. EPIK: A new method for outlining of protection areas in karstic environment. In Karst Waters and Environmental Impacts; Gunay, G., Johnoson, A., Eds.; Balkema: Rotterdam, The Netherlands, 1995. [Google Scholar]
  16. Ravbar, N. Vulnerability and Risk Mapping for the Protection of Karst Waters in Slovenia—Application to the Catchment of the Podstenjšek Springs. Ph.D. Thesis, University of Nova Gorica, Nova Gorica, Slovenia, 2007. [Google Scholar]
  17. Ravbar, N.; Goldscheider, N. Proposed Methodology of Vulnerability and Contamination Risk Mapping for the Protection of Karst Aquifers in Slovenia. Acta Carsol. 2007, 36. [Google Scholar] [CrossRef] [Green Version]
  18. Kavouri, K.; Plagnes, V.; Tremoulet, J.; Dörfliger, N.; Rejiba, F.; Marchet, P. PaPRIKa: A method for estimating karst resource and source vulnerability—application to the Ouysse karst system (southwest France). Hydrogeol. J. 2011, 19, 339–353. [Google Scholar] [CrossRef]
  19. Andreo, B.; Ravbar, N.; Vías, J.M. Source vulnerability mapping in carbonate (karst) aquifers by extension of the COP method: Application to pilot sites. Hydrogeol. J. 2009, 17, 749–758. [Google Scholar] [CrossRef]
  20. Vías, J.M.; Andreo, B.; Perles, M.J.; Carrasco, F.; Vadillo, I.; Jiménez, P. Proposed method for groundwater vulnerability mapping in carbonate (karstic) aquifers: The COP method. Hydrogeol. J. 2006, 14, 912–925. [Google Scholar] [CrossRef]
  21. Živanović, V.; Jemcov, I.; Dragišić, V.; Atanacković, N.; Magazinović, S. Karst groundwater source protection based on the time-dependent vulnerability assessment model: Crnica springs case study, Eastern Serbia. Environ. Earth Sci. 2016, 75, 1224. [Google Scholar] [CrossRef]
  22. Marín, A.I.; Andreo, B. Delineating Source Protection Zones of Karst Springs—The Case Study of Villanueva del Rosario Spring (Southern Spain). In Advances in Research in Karst Media; Andreo, B., Carrasco, F., Durán, J., LaMoreaux, J., Eds.; Springer: Berlin/Heidelberg, Germany, 2010; pp. 317–322. [Google Scholar] [CrossRef]
  23. Ravbar, N.; Petric, M.; Blatnik, M.; Svara, A. A multi-methodological approach to create improved indicators for the adequate karst water source protection. Ecol. Indic. 2021, 126, 107693. [Google Scholar] [CrossRef]
  24. Marín, A.I.; Ravbar, N.; Kovačič, G.; Andreo, B.; Petrič, M. Application of Methods for Resource and Source Vulnerability Mapping in the Orehek Karst Aquifer, SW Slovenia. In H2Karst Research in Limestone Hydrogeology; Mudry, J., Zwahlen, F., Bertrand, C., LaMoreaux, J.W., Eds.; Springer: Berlin, Germany, 2014; pp. 139–150. [Google Scholar] [CrossRef]
  25. Plagnes, V.; Kavouri, K.; Huneau, F.; Fournier, M.; Jaunat, J.; Pinto-Ferreira, C.; Leroy, B.; Marchet, P.; Dörfliger, N. PaPRIKa, the French Multicriteria Method for Mapping the Intrinsic Vulnerability of Karst Water Resource and Source—Two Examples (Pyrenees, Normandy); Springer: Berlin/Heidelberg, Germany, 2010; pp. 323–328. [Google Scholar] [CrossRef]
  26. Huneau, F.; Jaunat, J.; Kavouri, K.; Plagnes, V.; Rey, F.; Dörfliger, N. Intrinsic vulnerability mapping for small mountainous karst aquifers, implementation of the new PaPRIKa method to Western Pyrenees (France). Eng. Geol. 2013, 161, 81–93. [Google Scholar] [CrossRef]
  27. Živanovic, V.; Jemcov, I.; Dragišić, V.; Atanacković, N. Sanitary protection zoning of groundwater sources in unconsolidated sediments based on a Time-Dependent Model. In Groundwater Vulnerability and Pollution Risk Assessment; Witkowski, A.J., Jakóbczyk-Karpierz, S., Czekaj, J., Eds.; CRC Press/Taylor and Francis Group: London, UK, 2020; pp. 39–51. [Google Scholar]
  28. USDA. Conservation Engineering Division (1986) Urban Hydrology for Small Watersheds, National Resources Conservation Service; The U.S. Department of Agriculture (USDA): Washington, DC, USA, 1975.
  29. Kralik, M.; Keimel, T. Time-input, an innovative groundwater-vulnerability assessment scheme: Application to an alpine test site. Environ. Geol. 2003, 44, 679–686. [Google Scholar] [CrossRef]
  30. Marsaud, B. Structure et Fonctionnment de la Zone Noyee des Karst a Partir des Resultats Expe’Rimentaux. Ph.D. Thesis, Universite Paris XI, Paris, France, 1996. [Google Scholar]
  31. Stevanović, Z.; Dragišić, V.; Dokmanović, P.; Mandić, M. Hydrogeology of Miroč Karst Massif, Eastern Serbia, Yugoslavia. Theor. Appl. Karstol. 1996, 9, 89–95. [Google Scholar]
  32. Živanović, V.; Dragišić, V.; Jemcov, I.; Atanacković, N. Hydraulic behaviour of a subthermal karst spring—Blederija spring, Eastern Serbia. In Karst without Boundaries; Stevanović, Z., Krešić, N., Kukurić, N., Eds.; CRC Press/Taylor and Francis Group: London, UK, 2016; pp. 259–268. [Google Scholar] [CrossRef]
  33. Bogdanović, P.; Marković, D.; Dragić, D.; Rakić, M.; Babović, M.; Rajčević, D.; Popović, V.; Milojević, L. Osnovna Geološka Karta SFRJ 1:100,000, List Donji Milanovac L34-129 (Basic Geological Map of SFRY 1:100,000, Donji Milanovac Sheet—In Serbian); Federal Geological Survey: Belgrade, Yugoslavia, 1973. [Google Scholar]
  34. Ćalić, J.; Miroč, K.; Greben, V. Speleološki Objekti Nacionalnog Parka Đerdap; JP Nacionalni Park Đerdap: Donji Milanovac, Serbia, 2015; pp. 61–71. (In Serbian) [Google Scholar]
  35. Tanasijevic, Đ.; Antonović, G.; Aleksić, Ž. Pedološka karta SFRJ 1:50,000, Listovi Dobra 4, Kladovo 3, Donji Milanovac 2, Negotin 1 (Basic Pedological Map of SFRY 1:50,000, Dobra 4, Kladovo 3, Donji Milanovac 2, Negotin 1 Sheets—in Serbian); Military Geographical Institute: Belgrade, Yugoslavia, 1973.
  36. CLC. Copernicus Land MONITORING Services. CORINE Map. Available online: https://land.copernicus.eu/pan-european/corine-land-cover/clc2018 (accessed on 16 September 2021).
  37. United States Geological Survey, Department of the Interior. LANDSAT-7. Available online: https://earthexplorer.usgs.gov (accessed on 16 September 2021).
  38. Teutsch, G.; Sauter, M. Groundwater modelling in karst terrains: Scale effects, data acquisition and field validation. In Proceedings of the Third Conference on Hydrogeology, Ecology, Monitoring, and Management of Groundwater in Karst; Quinlan, J., Ed.; US EPA: Nashville, TN, USA, 1991; pp. 17–34. [Google Scholar]
  39. Neukum, C.; Hötzl, H. Standardization of vulnerability maps. Environ. Geol. 2007, 51, 689–694. [Google Scholar] [CrossRef]
  40. Neukum, C. Overview on methods and applications for the validation of vulnerability assessments. Grundwasser 2013, 18, 15–24. [Google Scholar] [CrossRef]
  41. Marín, A.I.; Rodríguez, J.F.M.; Barberá, J.A.; Fernández-Ortega, J.; Mudarra, M.; Sánchez, D.; Andreo, B. Groundwater vulnerability to pollution in karst aquifers, considering key challenges and considerations: Application to the Ubrique springs in southern Spain. Hydrogeol. J. 2021, 29, 379–396. [Google Scholar] [CrossRef]
  42. Parise, M.; Ravbar, N.; Živanović, V.; Mikszewski, A.; Kresic, N.; Mádl-Szőnyi, J.; Kukurić, N. Hazards in Karst and Managing Water Resources Quality. In Karst Aquifers—Haracterization and Engineering, Professional Practice in Earth Sciences; Stevanovic, Z., Ed.; Springer: Berlin, Germany, 2015. [Google Scholar]
Figure 1. Conceptual model for vulnerability assessment using COP + K—left [28] and TDM method—right.
Water 13 02775 g001
Figure 2. Hydrogeology map and vertical hydrogeological section AB of the Blederija Spring catchment area ([33], modified).
Water 13 02775 g002
Figure 3. Resource groundwater vulnerability map obtained by application of COP method.
Water 13 02775 g003
Figure 4. K factor map for source groundwater vulnerability.
Water 13 02775 g004
Figure 5. Source groundwater vulnerability map obtained by application of COP + K method.
Water 13 02775 g005
Figure 6. Vertical travel time (tv) through the unsaturated zone.
Water 13 02775 g006
Figure 7. Total travel time (ttot) in the ponor’s catchment area.
Water 13 02775 g007
Figure 8. Horizontal travel time (th) through the saturated zone.
Water 13 02775 g008
Figure 9. Map of total water travel time to the Blederija spring.
Water 13 02775 g009
Figure 10. Sanitary zones based on COP + K method (left) and TDM method (right).
Water 13 02775 g010
Publisher’s Note: MDPI stays neutral with regard to jurisdictional claims in published maps and institutional affiliations.

