
Protection and Guidance of Downstream Moving Fish with Electrified Horizontal Bar Rack Bypass Systems

 , , , and
Abstract
:1. Introduction
1.1. Protection and Guidance of Downstream Moving Fish
1.2. Fish Response to Electric Stimuli
- Indifference zone, where fish behavior is not influenced by the electric field.
- Repulsion zone, where fish react by escaping or seeking refuge.
- Attraction zone, where fish are approaching the anode either due to anodic taxis (electric field stimulates the central nervous system and/or the muscles) or forced swimming (effect of the electric field on the autonomic nervous system).
- Narcosis zone, where fish are immobilized but their muscles are relaxed, and the fish can breath.
- Tetanus zone, where fish are immobilized, muscles contract strongly and breathing stops. It may take a fish several minutes to recover from this state, and this zone may lead to severe injuries.
1.3. Goals of the Study
2. Materials and Methods
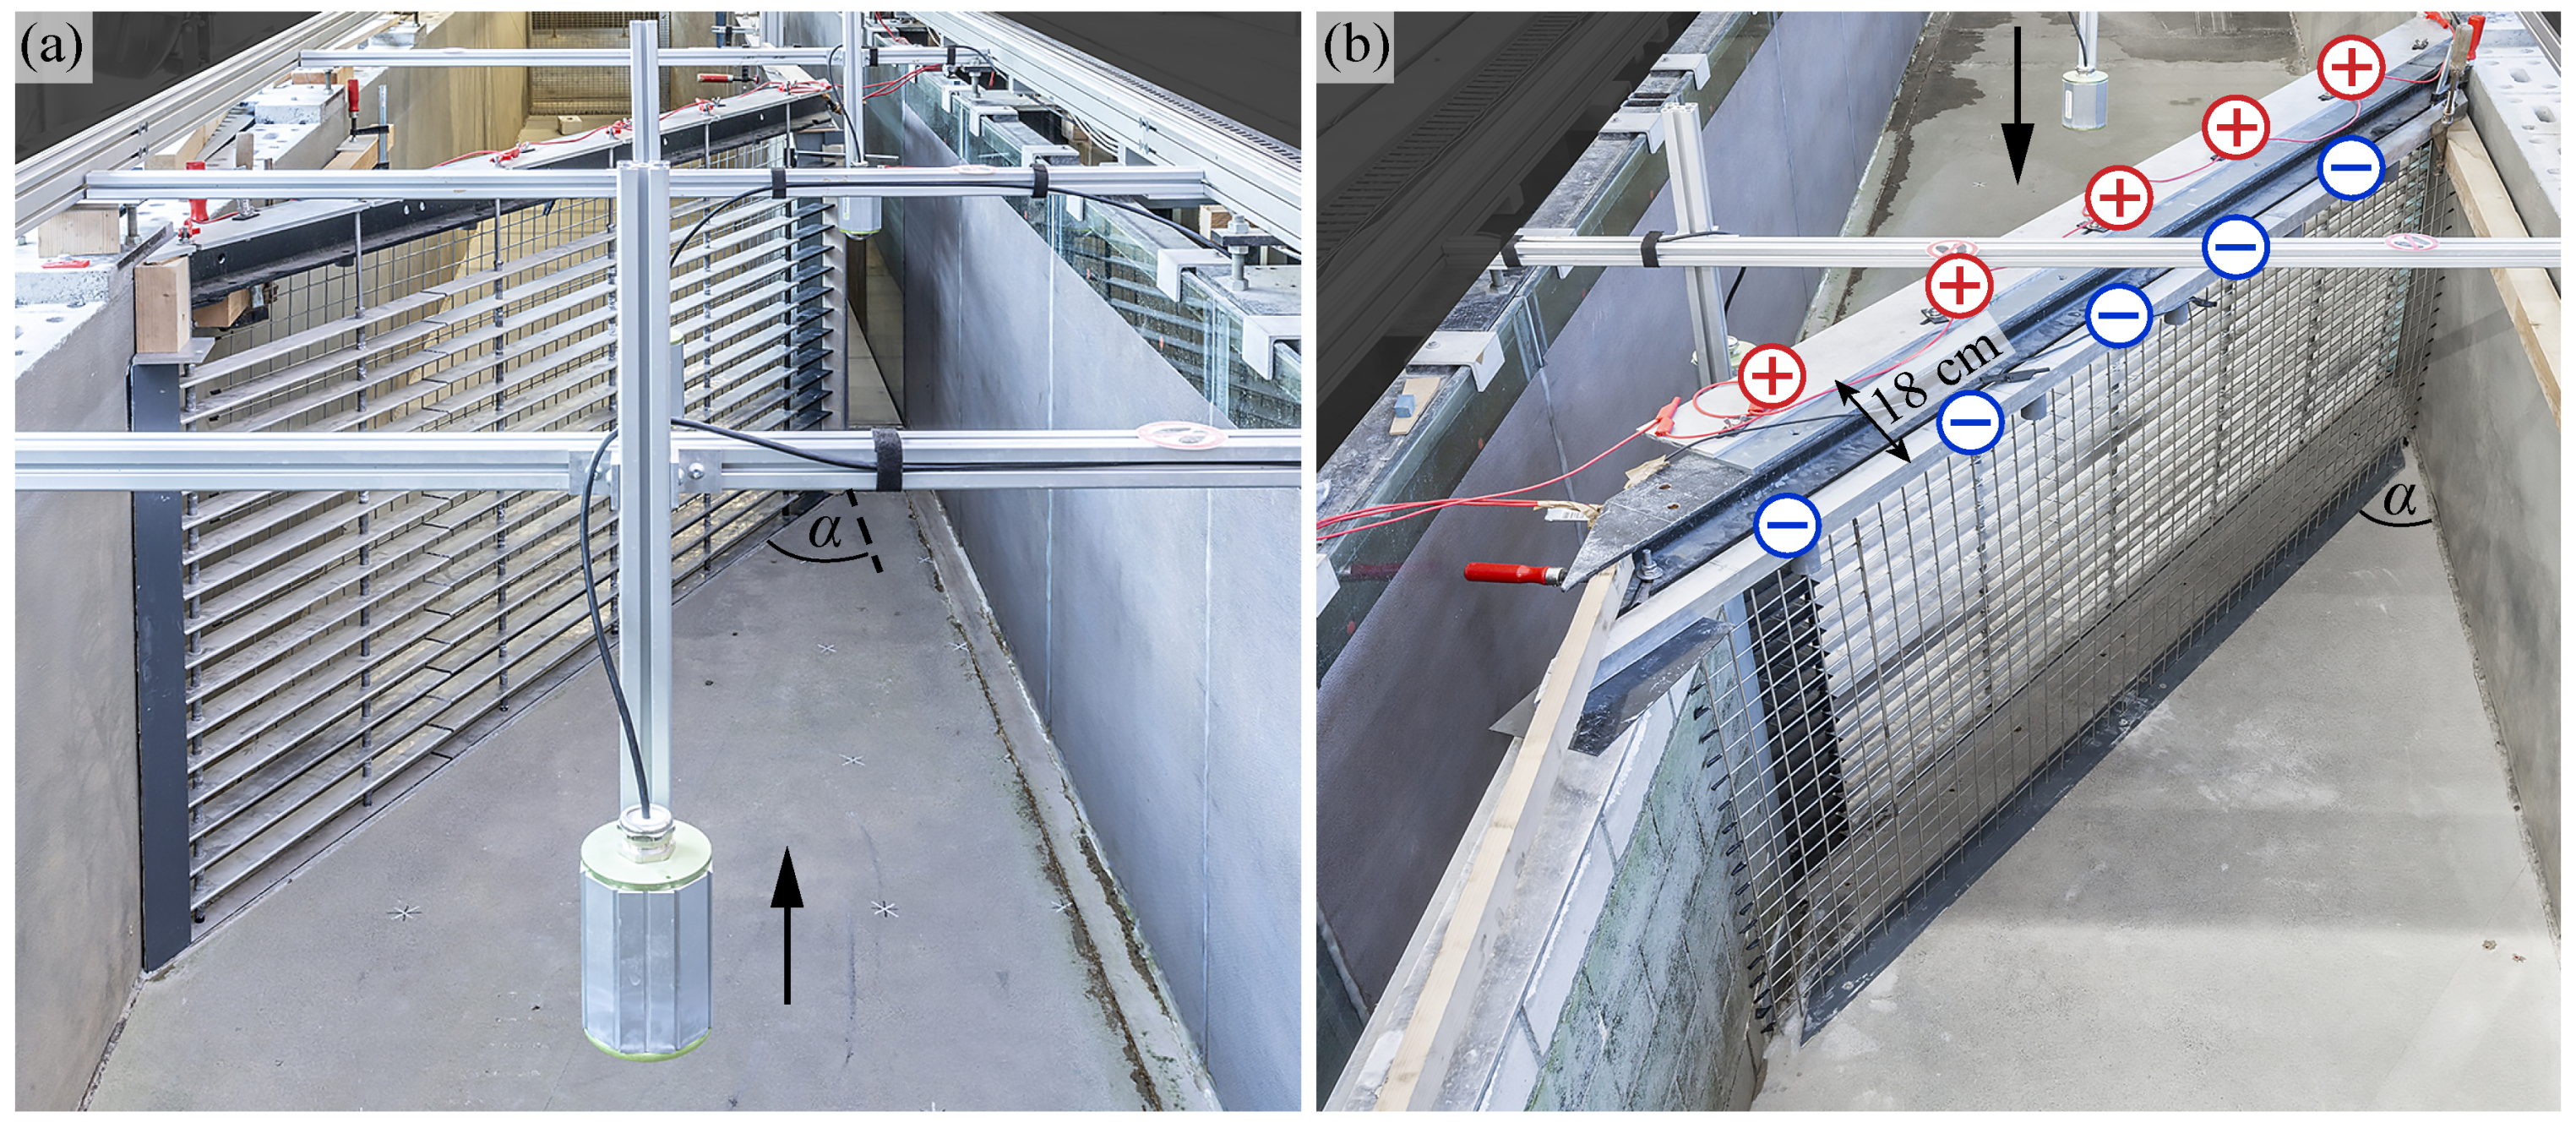
2.1. Experimental Setup
2.2. Experimental Procedure
2.2.1. Electric Field Measurements
2.2.2. Live Fish Tests
2.3. Parameter Range and Test Program
2.4. Data Analysis
2.4.1. Fish Guidance and Protection Efficiency
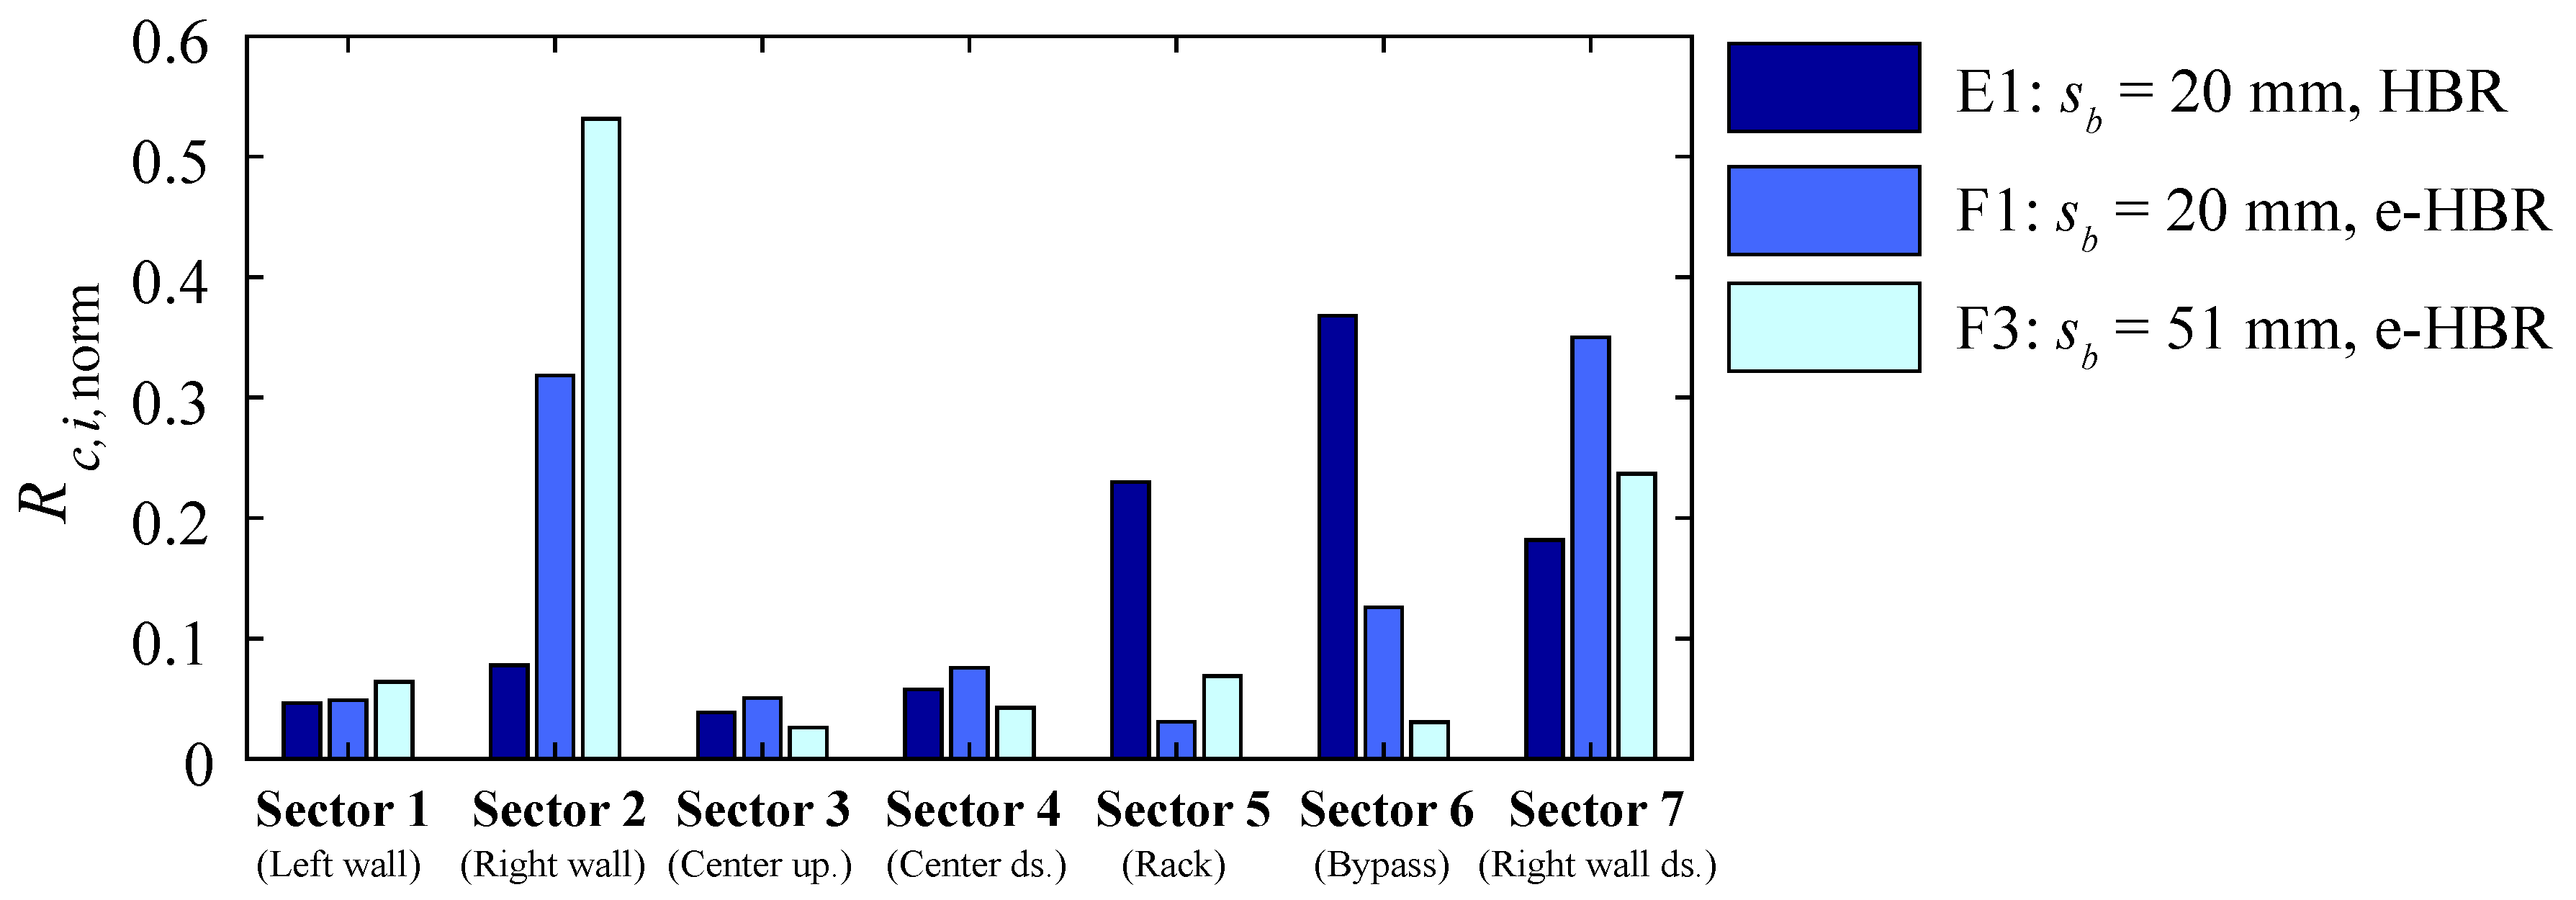
2.4.2. Sector Analysis
2.4.3. Statistical Analysis and Data Limitations
3. Results
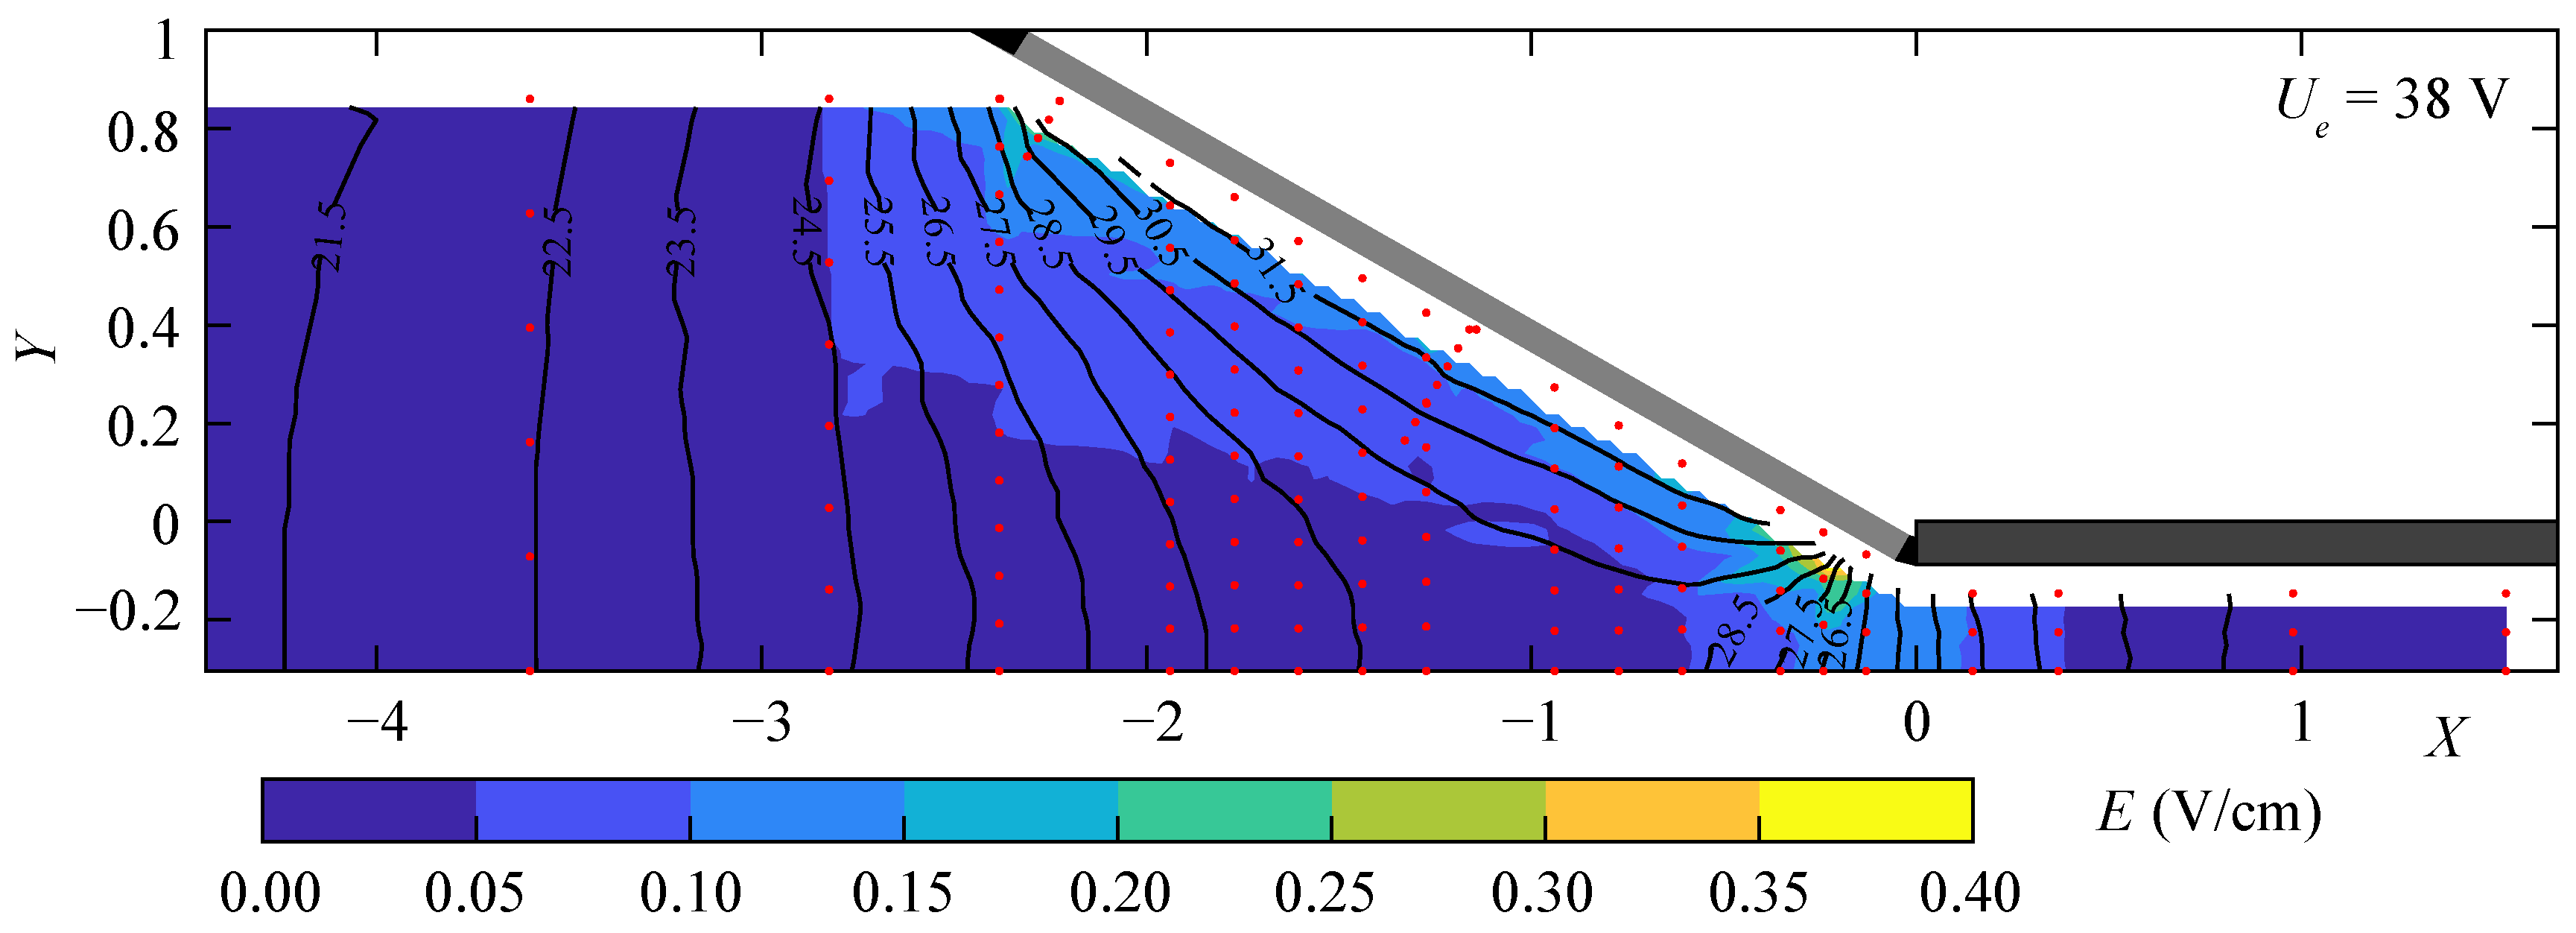
3.1. Measurements of the Electric Field
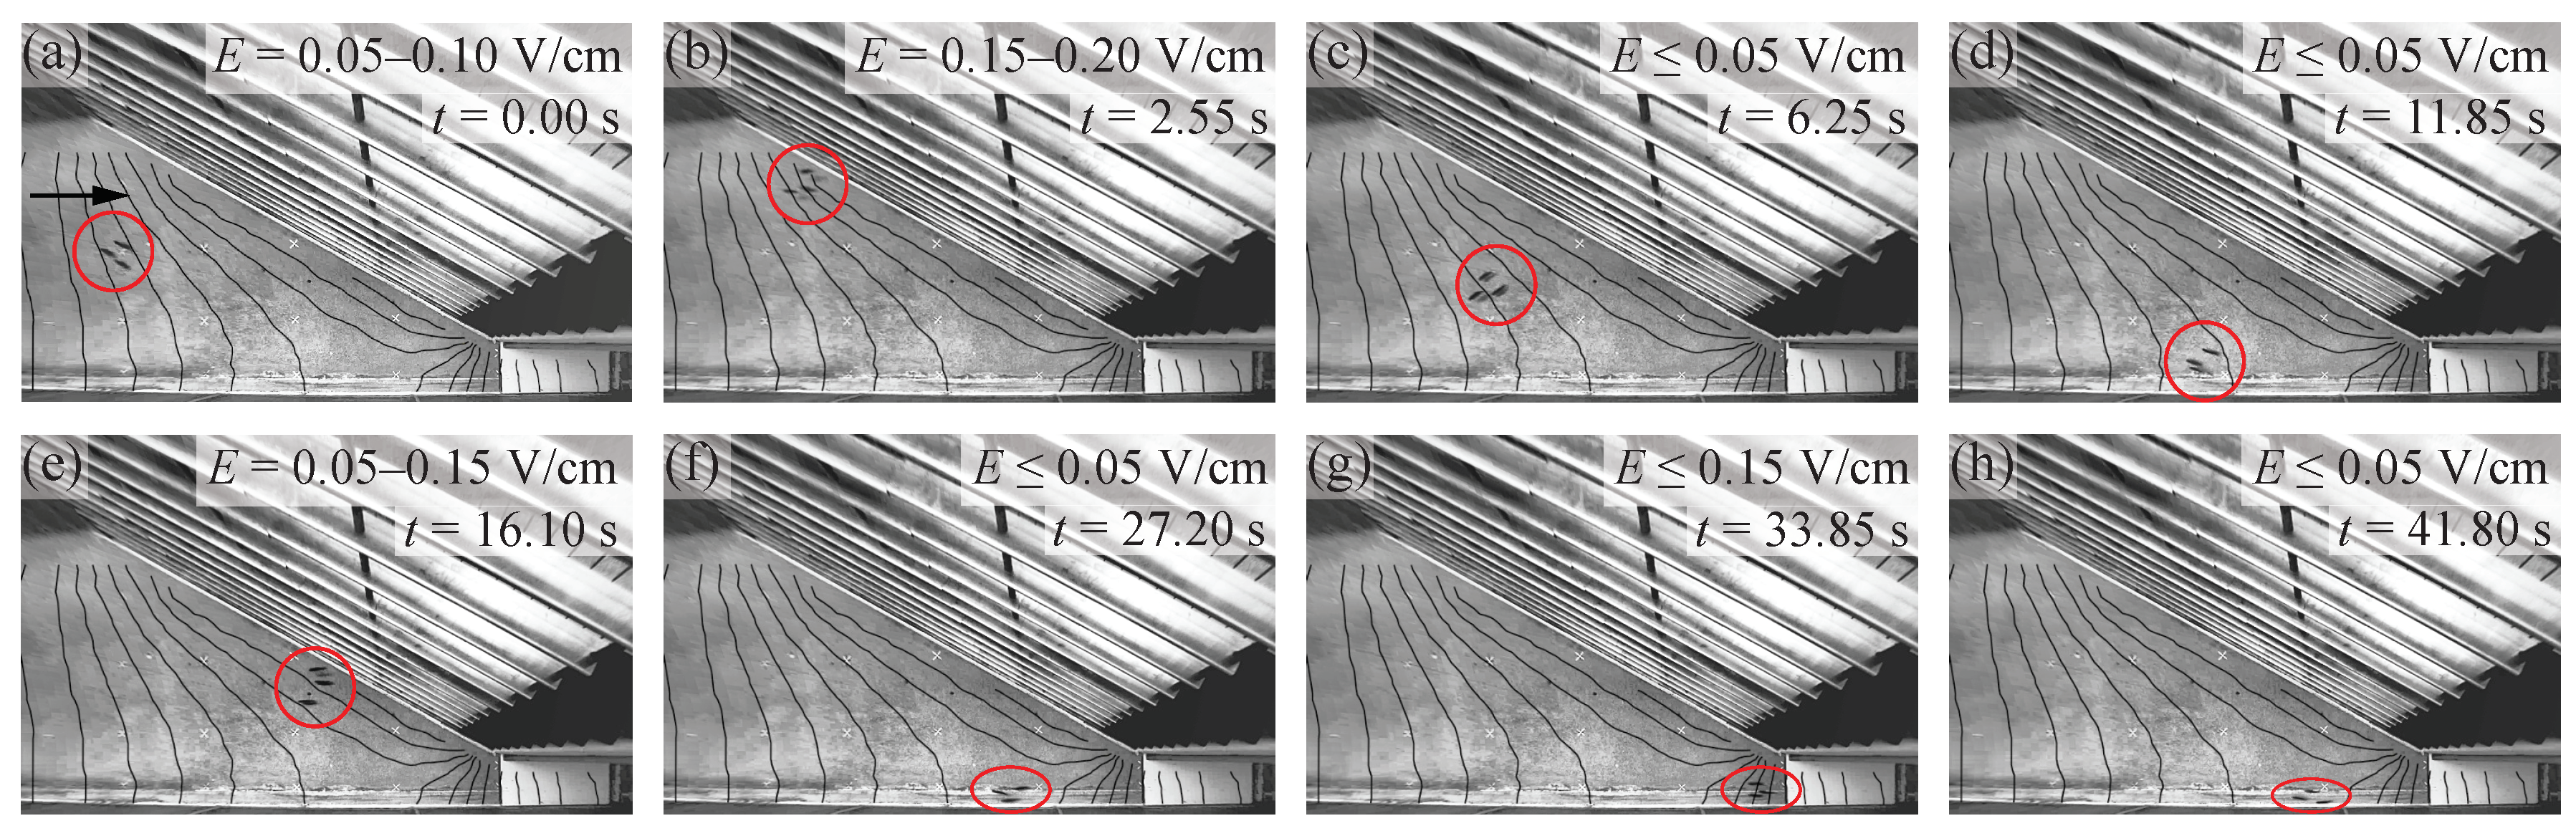
3.2. Fish Behavior, Protection and Guidance
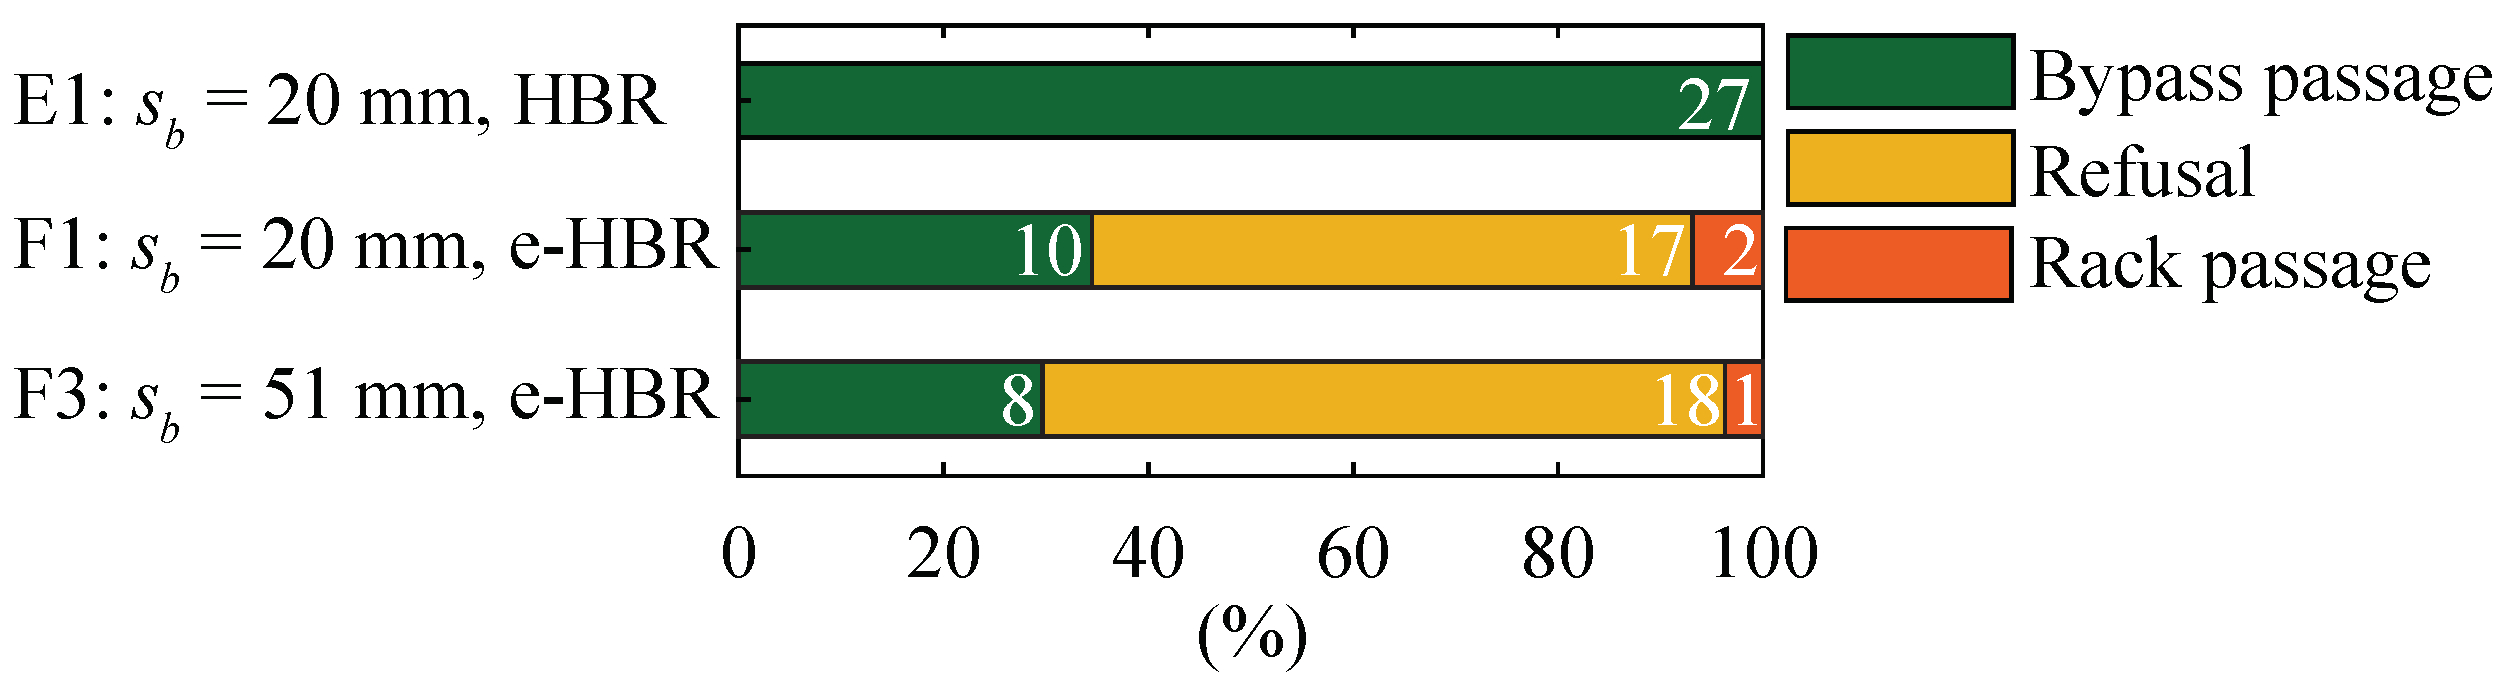
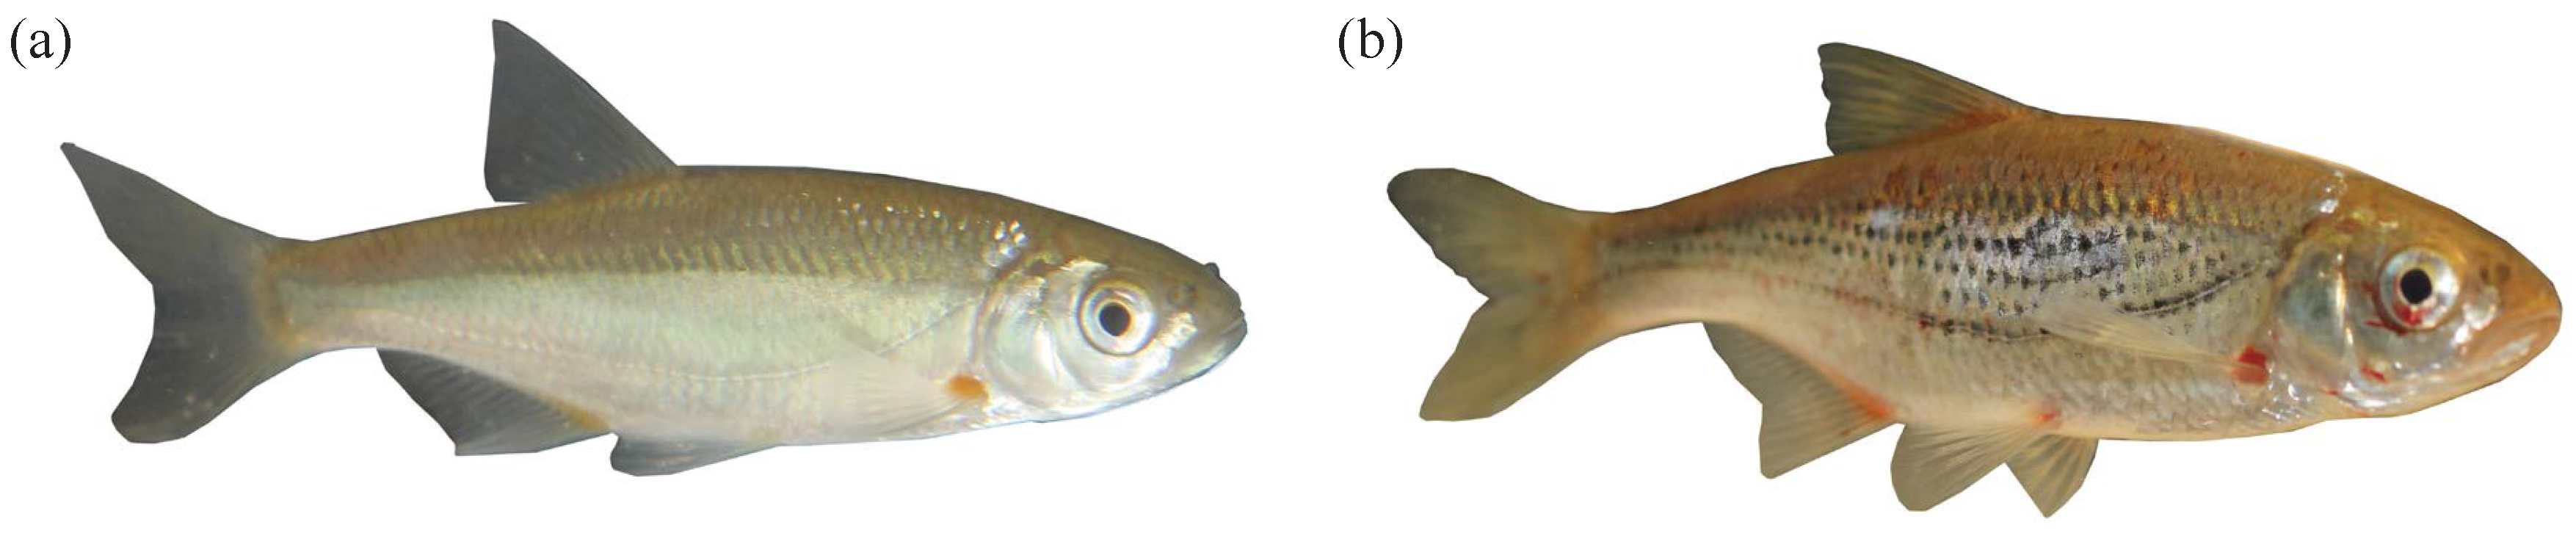
3.2.1. Spirlin
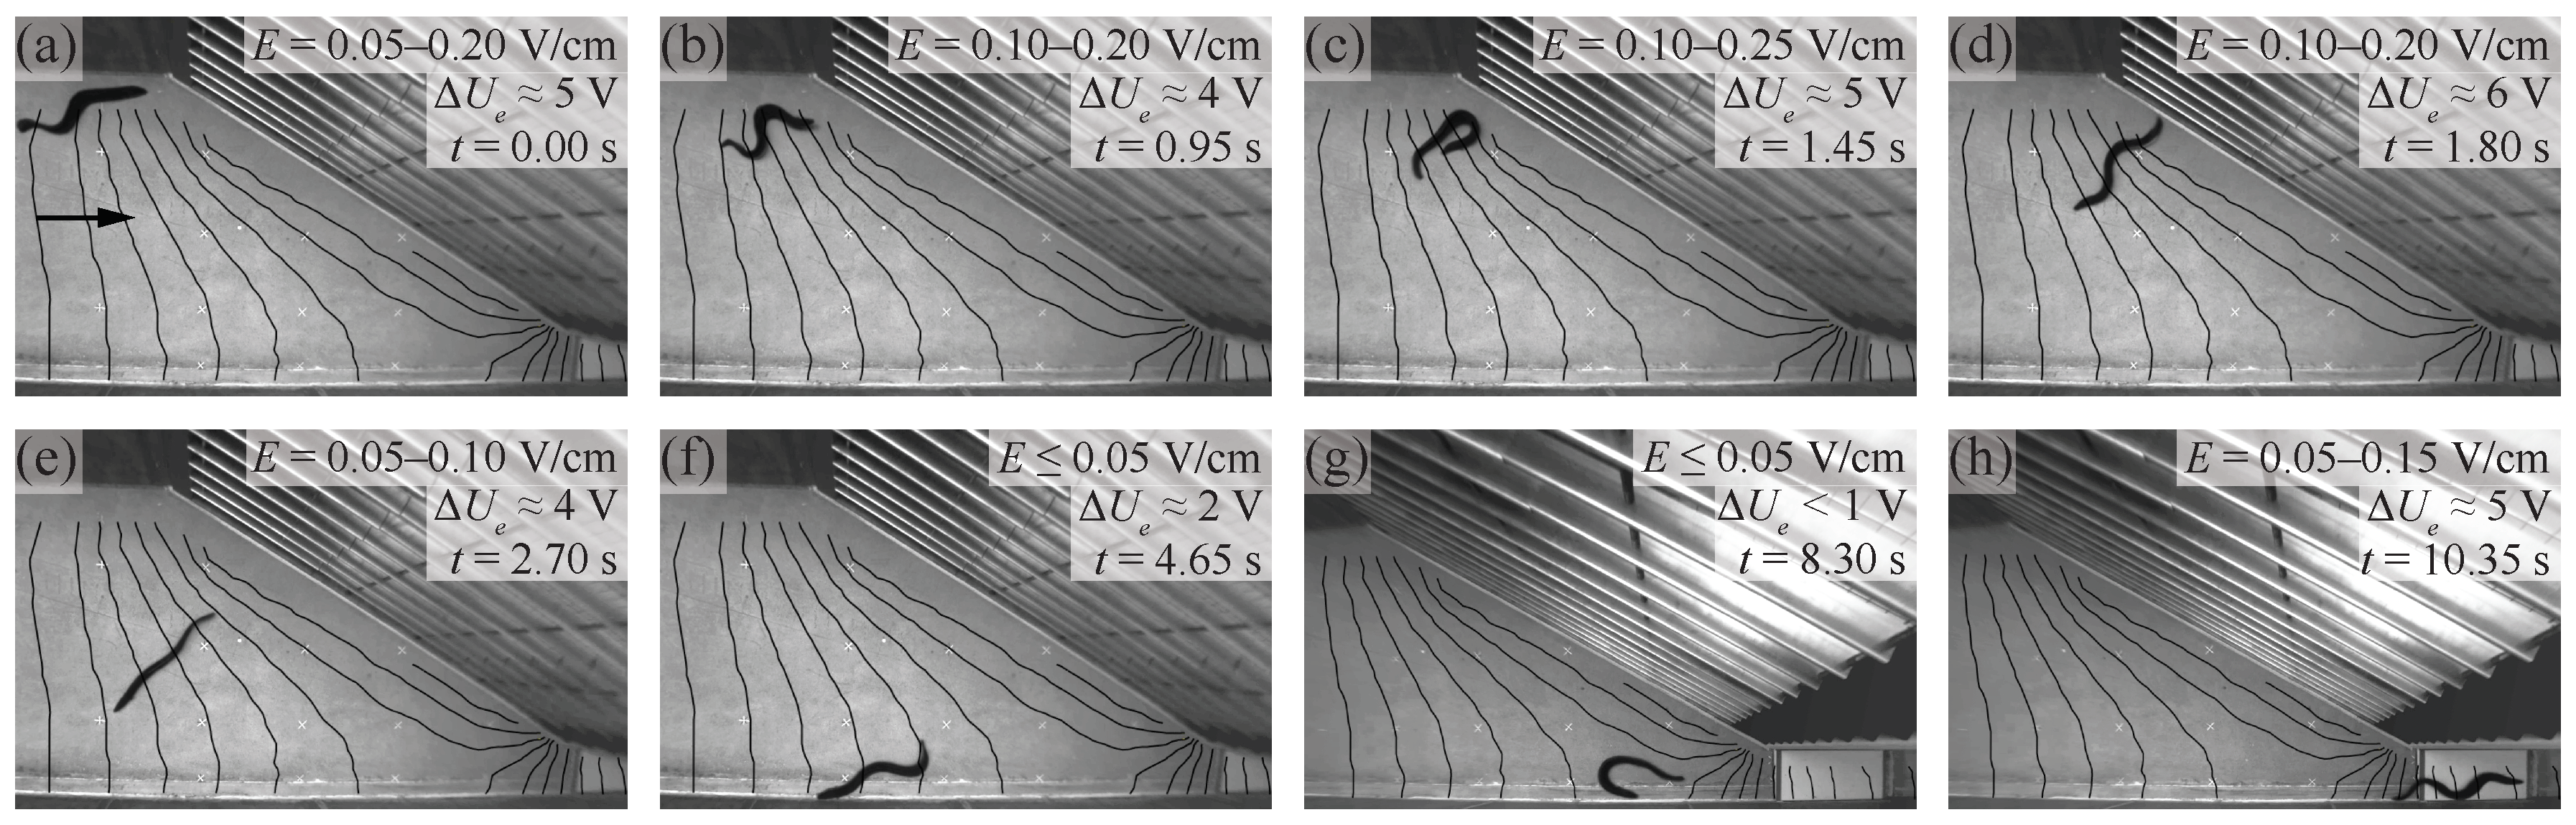
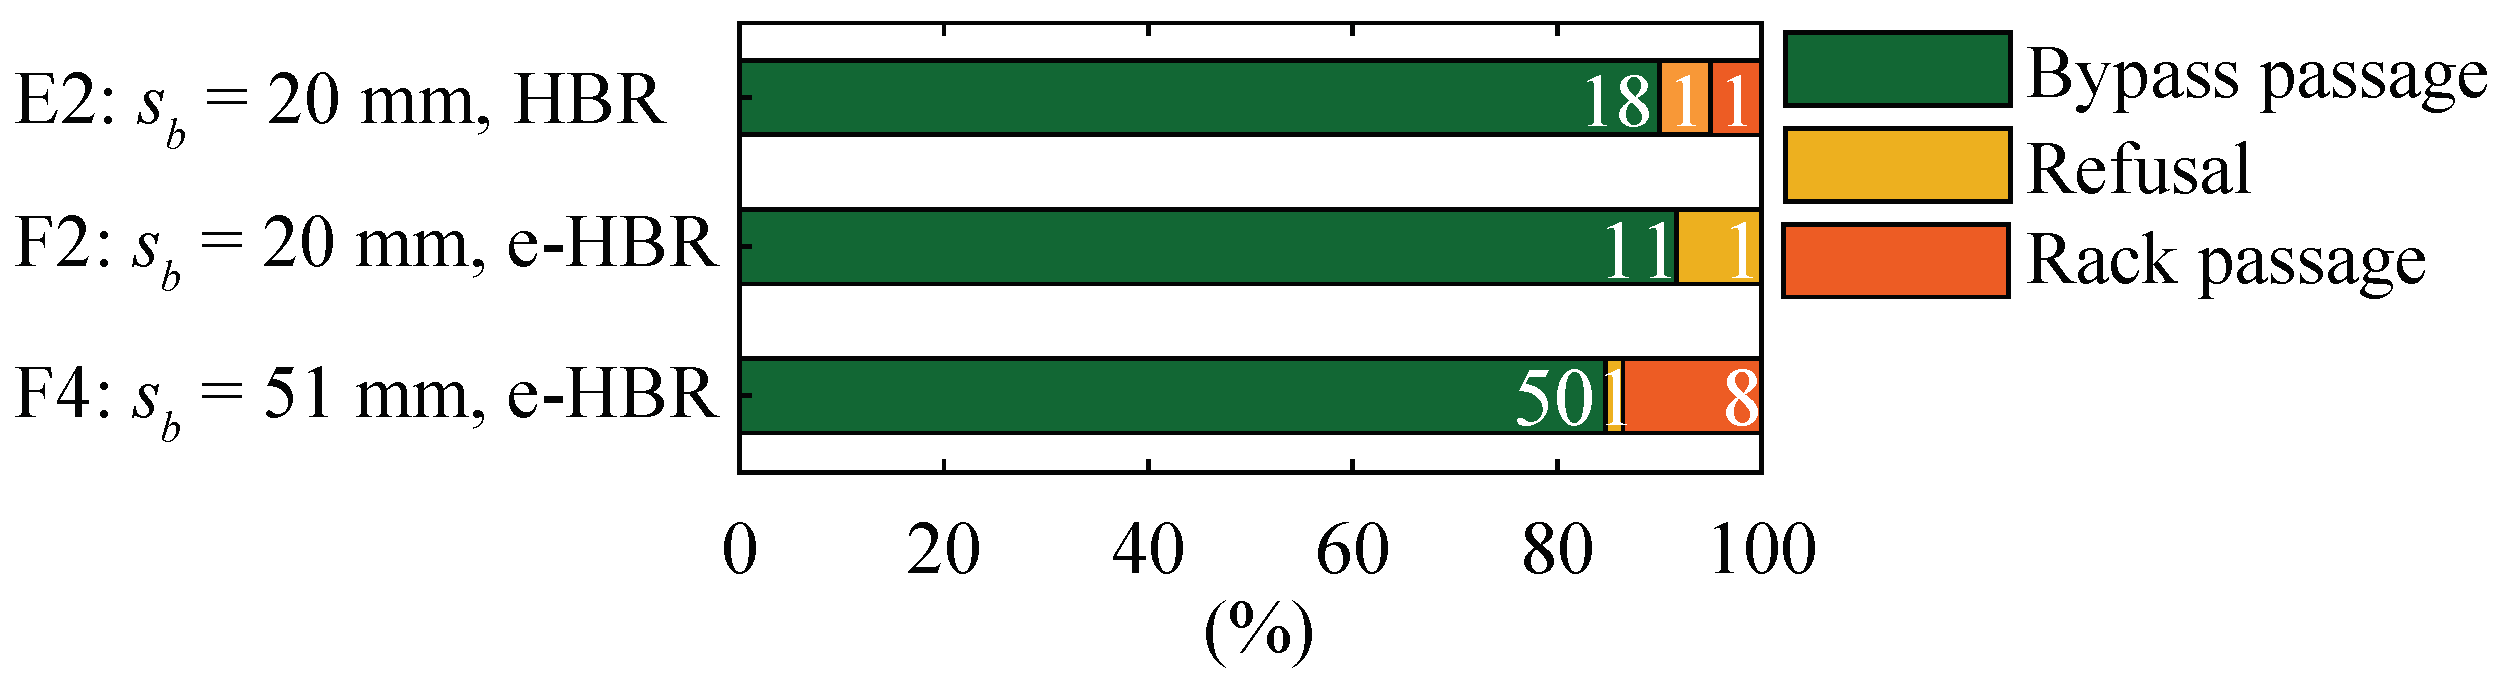
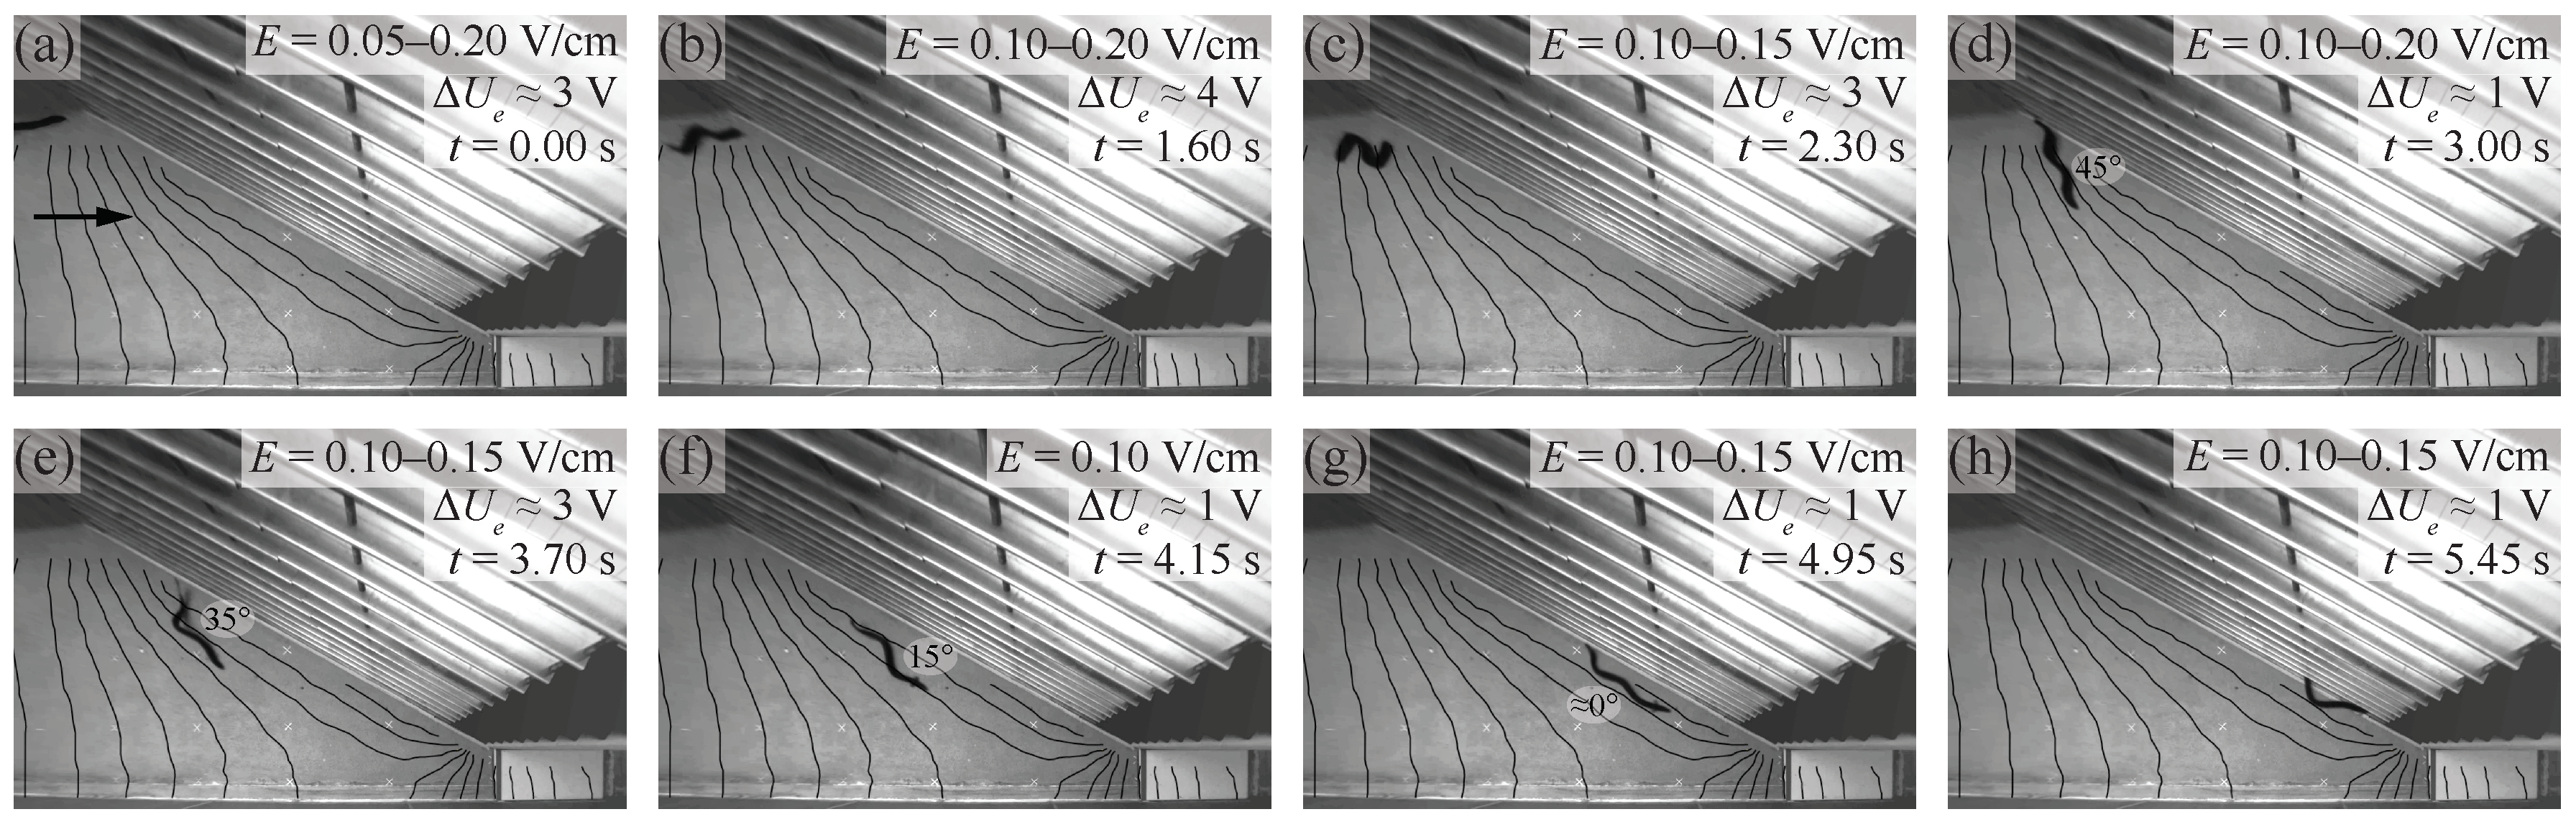
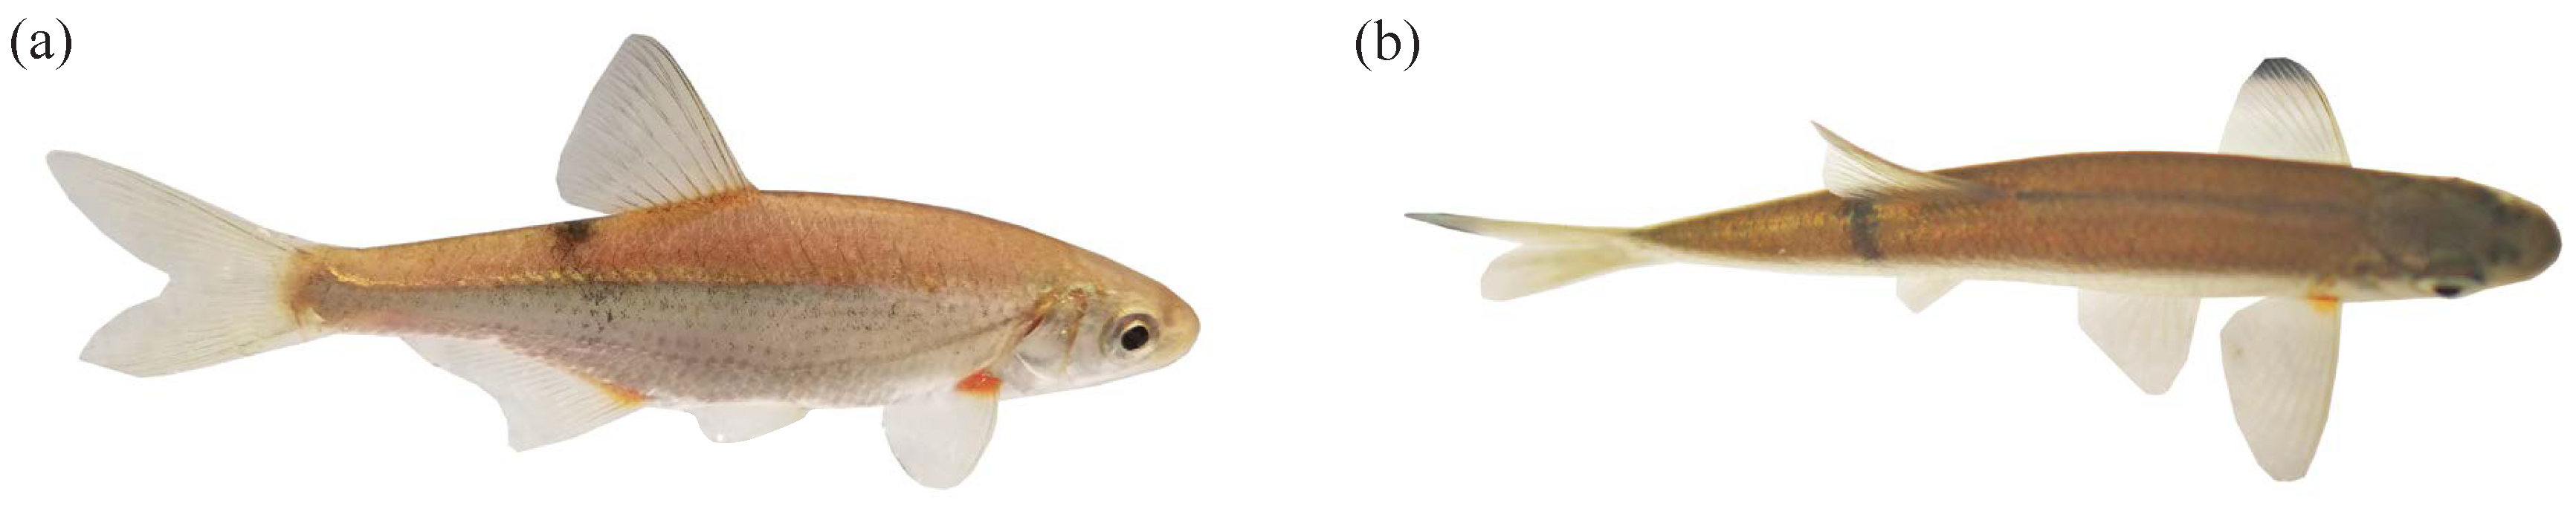
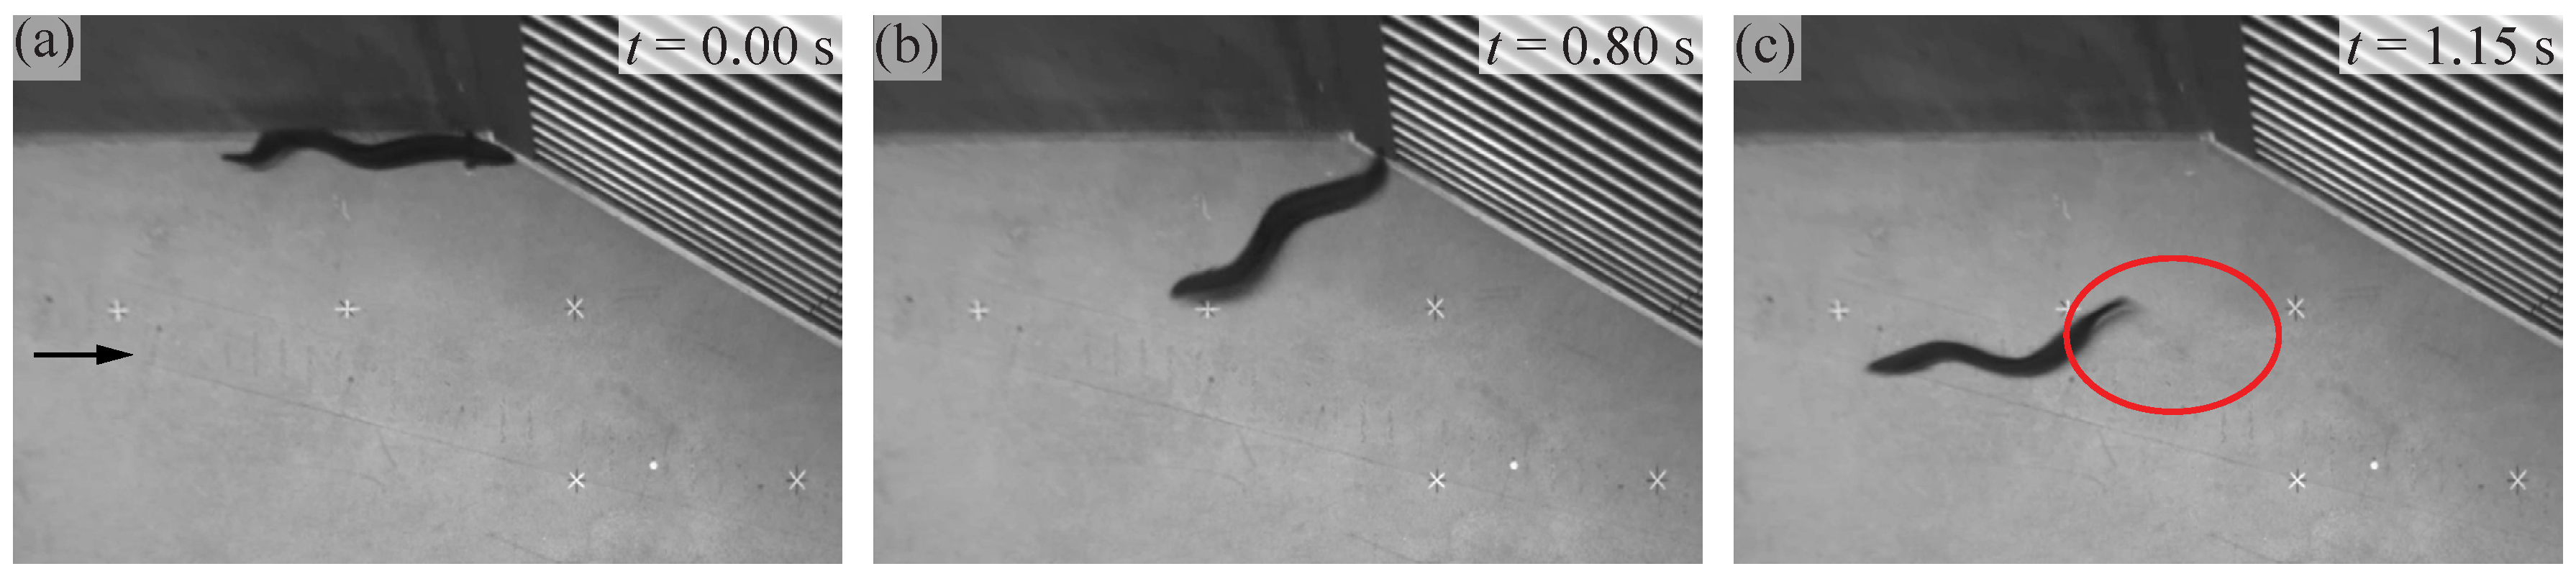
3.2.2. European Eel
3.3. Fish Injuries
4. Discussion
4.1. Fish Protection and Guidance Efficiency
- Only fish that passed through the rack or swam into the bypass were counted. All other fish placed in a given experiment were counted as refusals. This approach was used with PIT tag antennas in the bypass and downstream of the rack by [22] and with direct observation by [7,21,34]. The FPE was overestimated, as it did not account for fish that were inactive and never approached the rack. The FGE is difficult to evaluate, as this method does not account for inactive fish, nor for fish swimming directly into the bypass without rack contact.
- A distinction between active fish (entering the area upstream of the rack) and inactive fish was made. All fish that entered the bypass were counted as bypass passages, all active fish that neither passed through the rack nor the bypass were counted as refusals. This approach was used here for e-HBRs. It is also generally used in monitoring campaigns in the field. In a laboratory setting, the FGE may be overestimated, since the bypass is large compared to the length of the rack and certain individuals may directly swim into the bypass along the channel walls without interacting with the rack.
- A distinction was made between active (entering the area upstream of the rack) and inactive fish. Only fish that interact with the rack before entering the bypass were counted as bypass passages; all active fish that neither passed through the rack nor the bypass were counted as refusals. This approach leads to the most conservative estimate of FGE and FPE. It was used here for the HBR, and by [9,35].
4.2. Limitations of the Statistical Analysis
4.3. Electrification Setup and Layout
4.4. Fish Protection at Large Bar Spacings
4.5. Implications for Practical Application
5. Conclusions and Outlook
- The HBR with = 20 mm protected and guided all tested spirlin (FPE = FGE = 100%). For the e-HBR with = 51 mm a FPE of 96% was achieved, which is comparable to the HBR with = 20 mm. The FGE was significantly reduced for the e-HBR (20 mm and 51 mm) compared to the HBR (20 mm). This is due to the electric field in front of the rack and an unfavorable electric field in front of the bypass.
- Eels were well protected with the HBR with = 20 mm (FGE = 90%, FPE = 95%). The e-HBR with = 51 mm had a high FPE and FGE of 86% comparable to the HBR with = 20 mm. For a bar spacing of = 20 mm, no significant differences in FGE and FPE could be observed between the HBR and e-HBR. Eels may therefore have reacted less sensitively to the electric field in front of the bypass or were more motivated to move downstream than spirlin.
- The reactions of fish to electric fields with a horizontal voltage gradient as used in this study depends on their swimming orientations. To avoid this, a setup creating voltage gradients in vertical direction may be considered in the development of further electrification schemes for fish guidance racks.
- The electrode setup studied here leads to an electric field strength up to 0.35 V/cm at the transition from the barrier to the bypass, which compromises bypass acceptance. The setup therefore needs to be improved in further studies.
- The e-HBR caused fish injuries even for a low applied voltage of = 38 V due to the electrode arrangement, which led to maximal voltage gradients of 2.1 V/cm downstream of the rack. Future studies should therefore report not only the applied voltage but also the voltage gradient and applied pulse pattern in order to make different studies comparable. In addition, the electric field should preferably be quantified by measurements or simulations.
Supplementary Materials
Author Contributions
Funding
Institutional Review Board Statement
Informed Consent Statement
Data Availability Statement
Conflicts of Interest
Abbreviations
| e-HBR | Electrified horizontal bar rack |
| FGE | Fish guidance efficiency |
| FPE | Fish protection efficiency |
| gpDC | Gated bursts pulsed direct current |
| HBR | Horizontal bar rack |
| HBR-BS | Horizontal bar rack bypass system |
| HPP | Hydropower plant |
| pDC | Pulsed direct current |
| Area of the sector i (m2) | |
| Total area of sectors 1–7 (m2) | |
| D | Duty cycle (%) |
| E | Voltage gradient or electric field strength (V/cm) |
| Approach flow depth (upstream) (m) | |
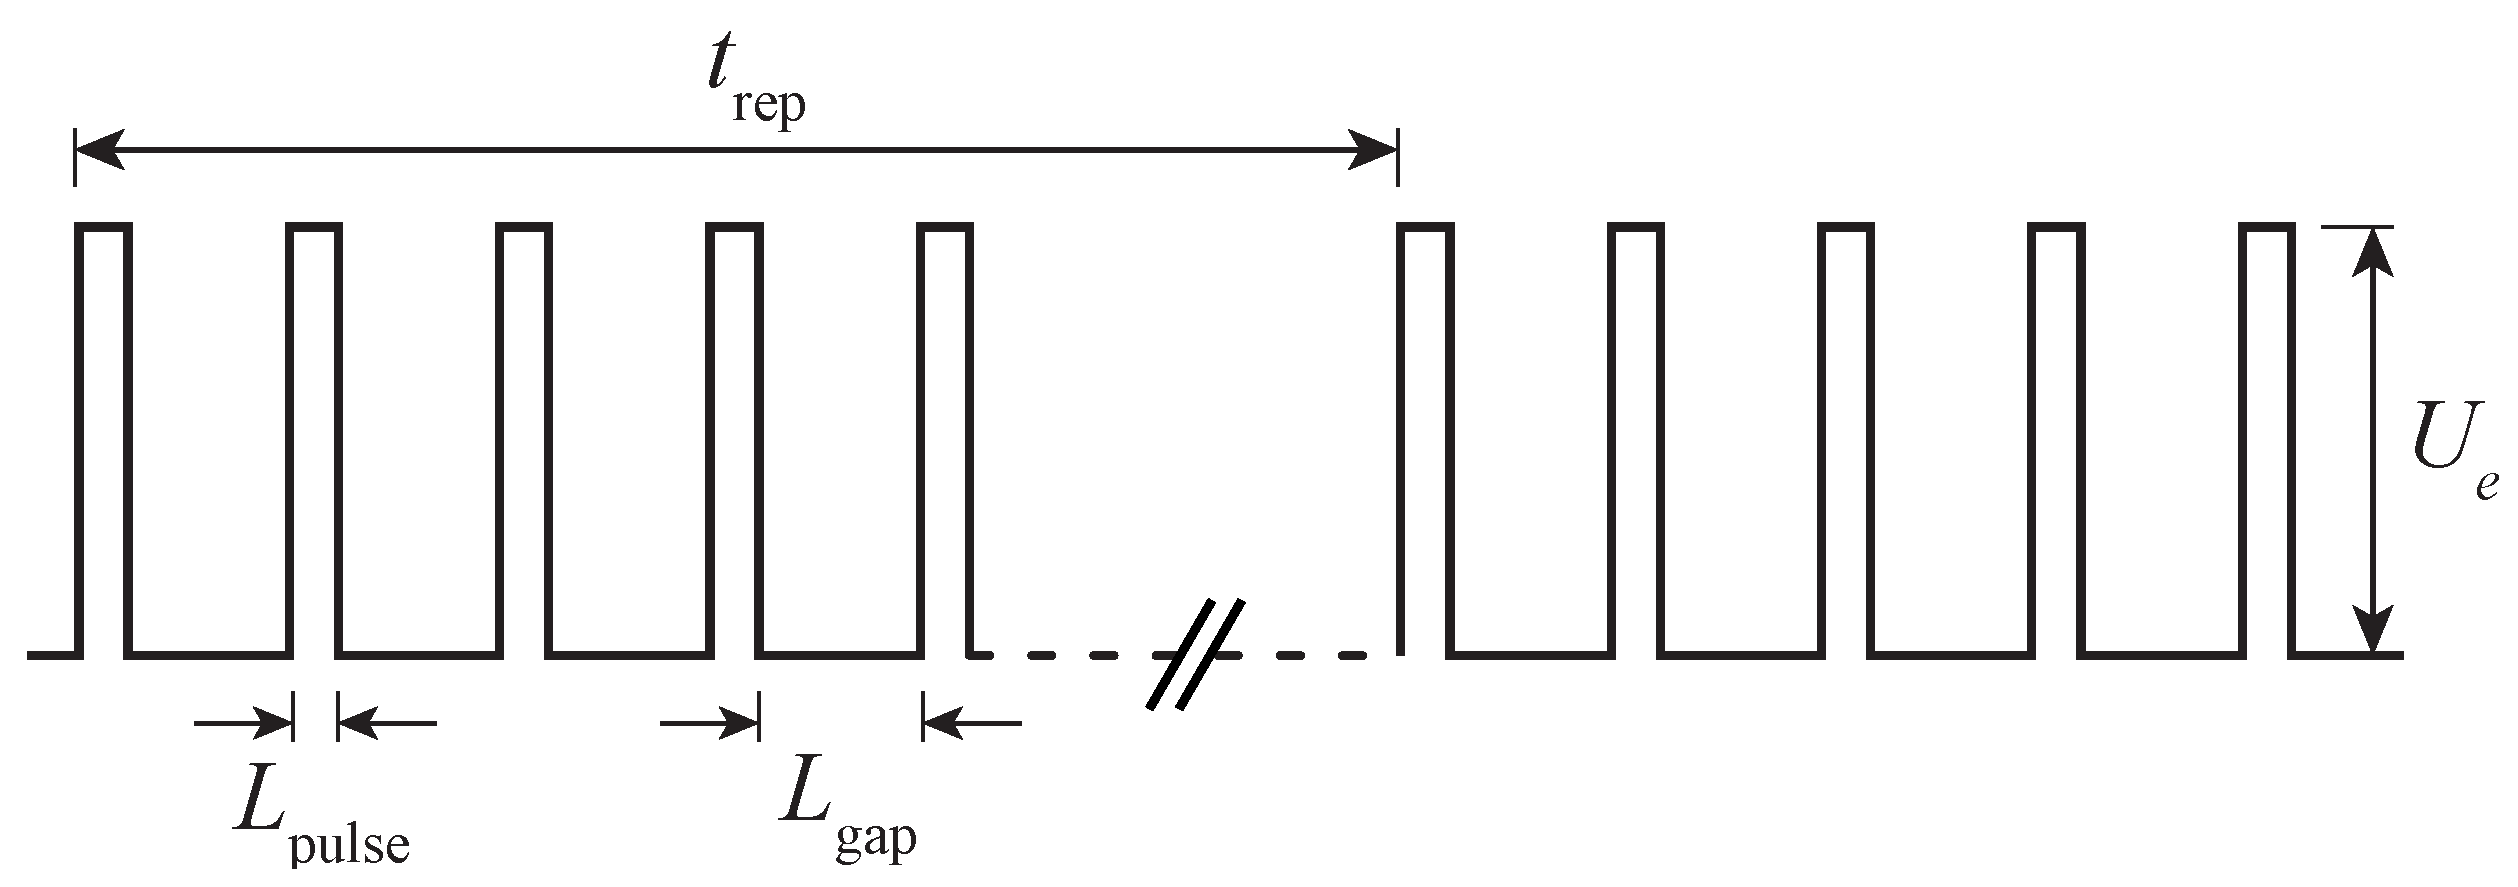
| Gap length (ms) | |
| Pulse length (ms) | |
| N | Total number of fish (–) |
| n | Number of active fish used in the analysis (–) |
| Number of fish entering the bypass (–) | |
| Number of pulses within a pulse group (–) | |
| Number of fish passing through the rack (–) | |
| Number of fish refusing the HBR-BS (–) | |
| Total approach flow discharge (m3/s) | |
| Residence coefficient of the sector i (–) | |
| Normalized residence coefficient of the sector i (–) | |
| Clear bar spacing (m) | |
| t | Time, starting at the first screenshot (s) |
| Repetition time (ms) | |
| Time the fish j spent in sector i (s) | |
| Total time the fish j spent in any of sectors 1–7 | |
| T | Water temperature (°C) |
| Total fish length (m) | |
| Voltage (V) | |
| Mean approach flow velocity from continuity (m/s) | |
| Flow velocity at the bypass inlet (m/s) | |
| Downstream channel width (m) | |
| Upstream channel width (m) | |
| x, y, z | Coordinates in streamwise, transversal, and vertical direction (m) |
| X, Y, Z | Normalized coordinates, , , and |
| Horizontal approach flow angle | |
| Significance level of the -test | |
| Body voltage (V) |
References
- Lucas, M.; Baras, E. Migration of Freshwater Fishes; Blackwell Science: Oxford, UK, 2001. [Google Scholar]
- Čada, G. The development of advanced hydroelectric turbines to improve fish passage survival. Fisheries 2001, 26, 14–23. [Google Scholar] [CrossRef]
- Lange, K.; Meier, P.; Trautwein, C.; Schmid, M.; Robinson, C.T.; Weber, C.; Brodersen, J. Basin-scale effects of small hydropower on biodiversity dynamics. Front. Ecol. Environ. 2018, 16, 397–404. [Google Scholar] [CrossRef]
- Larinier, M.; Travade, F. Downstream migration: Problems and facilities. Bull. Fr. Pêche Piscic. 2002, 364, 181–202. [Google Scholar] [CrossRef] [Green Version]
- Turnpenny, A.; O’Keeffe, N. Screening for Intake and Outfalls: A Best Practice Guide; Report SC030231; Environment Agency: Bristol, UK, 2005.
- USBR. Fish Protection at Water Diversions—A Guide for Planning and Designing Fish Exclusion Facilities; Water resources technical publication; U.S. Department of the Interior, Bureau of Reclamation: Denver, CO, USA, 2006.
- Kriewitz, C. Leitrechen an Fischabstiegsanlagen: Hydraulik und fischbiologische Effizienz. In VAW-Mitteilungen 230; Boes, R.M., Ed.; VAW-Mitteilung, Laboratory of Hydraulics, Hydrology and Glaciology (VAW), ETH Zurich: Zurich, Switzerland, 2015; (In German). [Google Scholar] [CrossRef]
- Ebel, G. Fischschutz und Fischabstieg an Wasserkraftanlagen—Handbuch Rechen- und Bypasssysteme. Ingenieurbiologische Grundlagen, Modellierung und Prognose, Bemessung und Gestaltung, 2nd ed.; Büro für Gewässerökologie und Fischereibiologie Dr. Ebel: Halle (Saale), Germany, 2016. (In German) [Google Scholar]
- Meister, J. Fish protection and guidance at water intakes with horizontal bar rack bypass systems. In VAW-Mitteilungen 258; Boes, R., Ed.; VAW-Mitteilung, Laboratory of Hydraulics, Hydrology and Glaciology (VAW), ETH Zurich: Zurich, Switzerland, 2020. [Google Scholar] [CrossRef]
- DWA. Fish Protection Technologies and Downstream Fishways. In Dimensioning, Design, Effectiveness Inspection; DWA German Association for Water, Wastewater and Waste: Hennef, Germany, 2005. [Google Scholar]
- Hefti, D. Wiederherstellung der Fischauf- und -Abwanderung bei Wasserkraftwerken. Checkliste Best Practice; Technical report; Bundesamt für Umwelt BAFU: Bern, Switzerland, 2012; Available online: www.bafu.admin.ch/uw-1210-d (accessed on 9 September 2021).
- Meister, J.; Fuchs, H.; Beck, C.; Albayrak, I.; Boes, R. Head Losses of Horizontal Bar Racks as Fish Guidance Structures. Water 2020, 12, 475. [Google Scholar] [CrossRef] [Green Version]
- Meister, J.; Selz, O.; Beck, C.; Peter, A.; Albayrak, I.; Boes, R. Fish protection and fish guidance with horizontal bar rack bypass systems. Ecol. Eng. 2021. under review. [Google Scholar]
- Miehls, S.; Sullivan, P.; Twohey, M.; Barber, J.; McDonald, R. The future of barriers and trapping methods in the sea lamprey (Petromyzon marinus) control program in the Laurentian Great Lakes. Rev. Fish Biol. Fish. 2020, 30, 1–24. [Google Scholar] [CrossRef] [Green Version]
- Beaumont, W. Electricity in Fish Research and Management—Theory and Practice, 2nd ed.; John Wiley & Sons, Ltd.: Chichester, UK, 2016. [Google Scholar]
- O’Farrell, M.; Burger, C.; Crump, R.; Smith, K. Blocking or guiding upstream-migrating fish: A commentary on the success of the graduated field electric fish barrier. In International Fish Screening Techniques; Turnpenny, A., Horsfield, A., Eds.; WIT Press: Southampton, UK, 2014; pp. 165–175. [Google Scholar]
- Johnson, N.; Miehls, S. Guiding out-migrating juvenile sea lamprey (Petromyzon marinus) with pulsed direct current. River Res. Appl. 2013, 30, 1146–1156. [Google Scholar] [CrossRef]
- Parasiewicz, P.; Wiśniewolski, W.; Mokwa, M.; Zioła, S.; Prus, P.; Godlewska, M. A low-voltage electric fish guidance system—NEPTUN. Fish. Res. 2016, 181, 25–33. [Google Scholar] [CrossRef]
- Strakhov, V. The electric fish barrier ERZU-1, choice and calculation of parameters. Tr. Koordin. Sov. Gidrotekhn. 1965, 24, 67–68. (In Russian) [Google Scholar]
- Pavlov, D. Structures Assisting the Migrations of Non-Salmonid Fish: USSR; FAO Fisheries Technical Paper 308; Food and Agriculture Organization of the United Nations (FAO), Fisheries Department: Rome, Italy, 1989.
- Berger, C. Rechenverluste und Auslegung von (Elektrifizierten) Schrägrechen Anhand Ethohydraulischer Studien. Ph.D. Thesis, Institut für Wasserbau und Wasserwirtschaft, Technische Universität Darmstadt, Darmstadt, Germany, 2018. (In German). [Google Scholar]
- Tutzer, R.; Röck, S.; Walde, J.; Zeiringer, B.; Unfer, G.; Führer, S.; Brinkmeier, B.; Haug, J.; Aufleger, M. Ethohydraulic experiments on the fish protection potential of the hybrid system FishProtector at hydropower plants. Ecol. Eng. 2021, 171, 106370. [Google Scholar] [CrossRef]
- Egg, L.; Pander, J.; Mueller, M.; Geist, J. Effectiveness of the electric fish fence as a behavioural barrier at a pumping station. Mar. Freshw. Res. 2019, 70, 1459. [Google Scholar] [CrossRef]
- Snyder, D. Invited overview: Conclusions from a review of electrofishing and its harmful effects on fish. Rev. Fish Biol. Fish. 2003, 13, 445–453. [Google Scholar] [CrossRef]
- Henry, T.; Grizzle, J.; Johnston, C.; Osborne, J. Susceptibility of Ten Fish Species to Electroshock-Induced Mortality. Trans. Am. Fish. Soc. 2004, 133, 649–654. [Google Scholar] [CrossRef]
- Bird, D.; Cowx, I. The selection of suitable pulsed currents for electric fishing in waters. Fish. Res. 1993, 18, 363–376. [Google Scholar] [CrossRef]
- Briggs, A.; Dean, J.; Boase, J.; Kocovsky, P.; Luoma, J. Optimum Electrofishing Waveforms and Parameters to Induce Immobilization of Juvenile Grass Carp. N. Am. J. Fish. Manag. 2019, 39, 705–713. [Google Scholar] [CrossRef]
- Albayrak, I.; Detert, M. 3D Fish Tracking System. In Deliverable D2.2 Horizon 2020 Research Programme FIThydro: Working Basis of Solutions, Models, Tools and Devices and Identification of Their Application Range on a Regional and Overall Level to Attain Self-Sustained Fish Populations; 2019; pp. 26–30. Available online: https://www.fithydro.eu/deliverables-tech/ (accessed on 9 September 2021).
- Fithydro Wiki 3D Fish Tracking System. Available online: https://www.fithydro.wiki/index.php/3D_fish_tracking_system (accessed on 26 August 2021).
- Kammerlander, H.; Schlosser, L.; Zeiringer, B.; Unfer, G.; Zeileis, A.; Aufleger, M. Downstream passage behavior of potamodromous fishes at the fish protection and guidance system “Flexible Fish Fence”. Ecol. Eng. 2020, 143, 105698. [Google Scholar] [CrossRef]
- Detert, M.; Schütz, C.; Czerny, R. Development and Tests of a 3D Fish-Tracking Videometry System for an Experimental Flume. In Proceedings of the River Flow 2018 Conference, Lyon-Villeurbanne, France, 5–8 September 2018. [Google Scholar] [CrossRef]
- Detert, M. Fishtracking. 2020. Available online: https://eth.swisscovery.slsp.ch/permalink/41SLSP_ETH/lshl64/alma99117342109505503 (accessed on 9 September 2021).
- Adam, B.; Lehmann, B. Ethohydraulik—Grundlagen, Methoden und Erkenntnisse; Springer: Heidelberg, Germany, 2011. (In German) [Google Scholar]
- Albayrak, I.; Boes, R.M.; Kriewitz-Byun, C.R.; Peter, A.; Tullis, B.P. Fish guidance structures: Hydraulic performance and fish guidance efficiencies. J. Ecohydraulics 2020, 5, 113–131. [Google Scholar] [CrossRef]
- Beck, C.; Albayrak, I.; Meister, J.; Peter, A.; Selz, O.; Leuch, C.; Vetsch, D.; Boes, R. Swimming Behavior of Downstream Moving Fish at Innovative Curved-Bar Rack Bypass Systems for Fish Protection at Water Intakes. Water 2020, 12, 3244. [Google Scholar] [CrossRef]
- Harrison, X.A. A comparison of observation-level random effect and Beta-Binomial models for modelling overdispersion in Binomial data in ecology & evolution. PeerJ 2015, 3, e1114. [Google Scholar] [CrossRef] [Green Version]
- Jens, G. Plädoyer für den 20 mm-Turbinenrechen. Das Wassertriebwerk 1987, 36, 145–147. [Google Scholar]
- Berg, R. Gutachterliche Stellungnahme zu Fischschäden durch den Betrieb der Wasserkraftanlage Am letzten Heller; Langenargen (Institut für Seenforschung und Fischereiwesen): Langenargen, Germany, 1987; p. 34. [Google Scholar]
- Adam, B.; Schwevers, U.; Dumont, U. Beiträge zum Schutz abwandernder Fische-Verhaltensbeobachtungen in einem Modellgerinne. Solingen 1999, 16, 63. [Google Scholar]
- Silva, A.; Lucas, M.; Castro-Santos, T.; Katopodis, C.; Baumgartner, L.; Thiem, J.; Aarestrup, K.; Pompeu, P.; O’Brien, G.; Braun, D.; et al. The future of fish passage science, engineering, and practice. Fish Fish. 2018, 19, 340–362. [Google Scholar] [CrossRef] [Green Version]


| Test | D | Fish Species | N | n | ||||||||
|---|---|---|---|---|---|---|---|---|---|---|---|---|
| (mm) | (V) | (ms) | (ms) | (−) | (ms) | (%) | ) (cm) | (−) | (−) | (%) | ||
| E1 | 20 | - | - | - | - | - | - | Spirlin | 8.1–10.7 (9.6, 0.7) | 33 | 33 | 100 |
| E2 | 20 | - | - | - | - | - | - | Eel | 41.2–82.8 (65.2, 10.2) | 26 | 23 | 88 |
| F1 | 20 | 38 | 0.3 | 7 | 5 | 200 | 0.75 | Spirlin | 8.9–13.8 (10.9, 1.0) | 36 | 29 | 81 |
| F2 | 20 | 38 | 0.3 | 7 | 5 | 200 | 0.75 | Eel | 45.4–84.2 (65.1, 9.2) | 15 | 12 | 80 |
| F3 | 51 | 38 | 0.3 | 7 | 5 | 200 | 0.75 | Spirlin | 7.4–11.4 (8.9, 0.9) | 51 | 27 | 53 |
| F4 | 51 | 38 | 0.3 | 7 | 5 | 200 | 0.75 | Eel | 42.9–87.4 (68.1, 8.6) | 72 | 59 | 82 |
Publisher’s Note: MDPI stays neutral with regard to jurisdictional claims in published maps and institutional affiliations. |
© 2021 by the authors. Licensee MDPI, Basel, Switzerland. This article is an open access article distributed under the terms and conditions of the Creative Commons Attribution (CC BY) license (https://creativecommons.org/licenses/by/4.0/).
Share and Cite
Meister, J.; Moldenhauer-Roth, A.; Beck, C.; Selz, O.M.; Peter, A.; Albayrak, I.; Boes, R.M. Protection and Guidance of Downstream Moving Fish with Electrified Horizontal Bar Rack Bypass Systems. Water 2021, 13, 2786. https://0-doi-org.brum.beds.ac.uk/10.3390/w13192786
Meister J, Moldenhauer-Roth A, Beck C, Selz OM, Peter A, Albayrak I, Boes RM. Protection and Guidance of Downstream Moving Fish with Electrified Horizontal Bar Rack Bypass Systems. Water. 2021; 13(19):2786. https://0-doi-org.brum.beds.ac.uk/10.3390/w13192786
Chicago/Turabian StyleMeister, Julian, Anita Moldenhauer-Roth, Claudia Beck, Oliver M. Selz, Armin Peter, Ismail Albayrak, and Robert M. Boes. 2021. "Protection and Guidance of Downstream Moving Fish with Electrified Horizontal Bar Rack Bypass Systems" Water 13, no. 19: 2786. https://0-doi-org.brum.beds.ac.uk/10.3390/w13192786