2. Materials and Methods
2.1. Case Study Description: Alcanena Industrial Sewer System
The municipality of Alcanena (central region of Portugal), is a territory known for the presence of several tanning industries, occupying a total area of about 127 km².
The City has a Regulation on Urban Wastewater Sanitation Services (RUWS), which establishes parameters and thresholds for industrial wastewater discharge into the sewer system. According to this Regulation, industrial users are categorised into seven classes, depending on their effluent pollution loads. Four of those classes refer to the tanning industry, according to the various processes they employ, ranging from units that process raw hides to units with a complete cycle, with hair removal, liming, dyeing and other leather finishing activities. Maximum daily thresholds for total sulfides to be rejected are also variable, according to industry class, between 0 and 30 mg S/L. However, one point sample admissible values vary between 15 and 100 mg S/L. These thresholds are significantly higher than other sulfide discharge thresholds for sewers found in the literature, ranging from 1–5 mg S/L in Australia and Finland, to 10 mg S/L in China (Beijing) or Egypt, and 5–35 mg S/L in Ireland [
15].
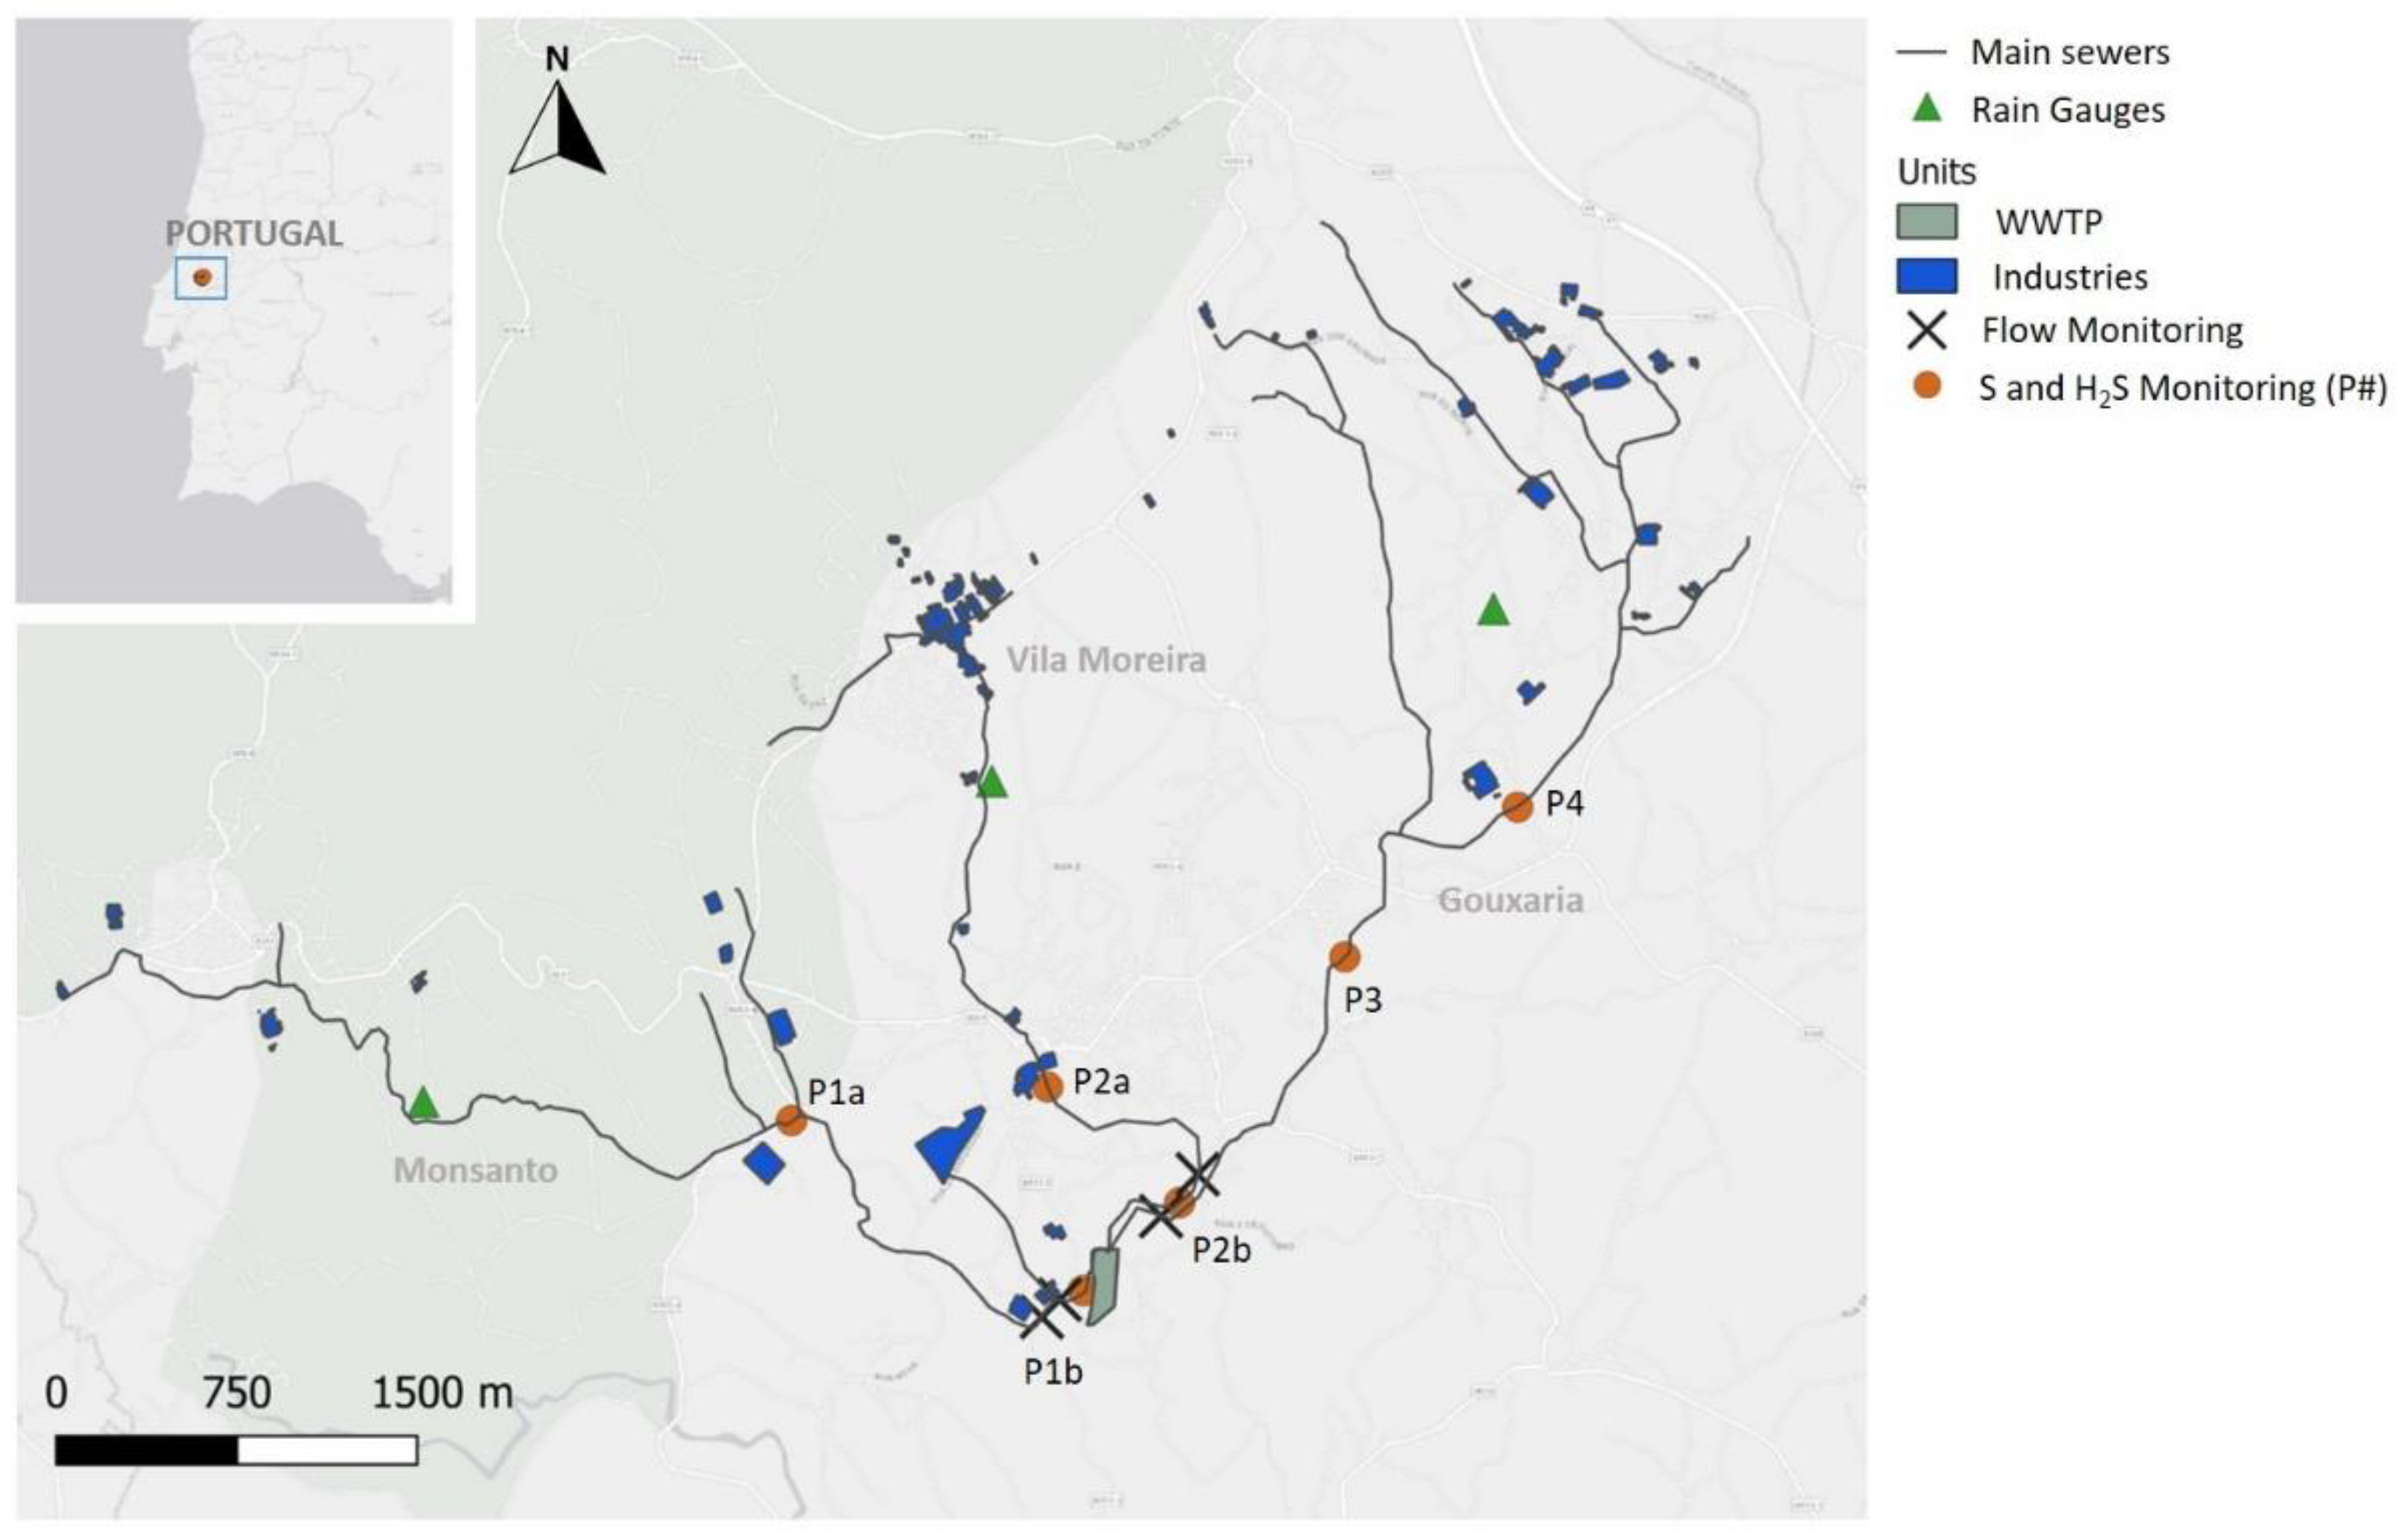
Effluents generated in the region are conveyed to the wastewater treatment plant (WWTP) through separate domestic and industrial sewer systems, whose main trunk sewers run in parallel. In summary, the industrial system comprises three main trunk sewers (
Figure 1): (i) the Monsanto system, with 8768 m of total length and 219 manholes, (ii) the Vila Moreira system with a total length of 5413 m, with 124 manholes, and (iii) the Gouxaria system with a length of 11 538 m, with 263 manholes.
At each of the main trunk sewers, a permanent monitoring station is installed, at a location of about 10 min conveyance time to the WWTP.
Domestic and industrial wastewater are conveyed to the Alcanena WWTP, which was designed for a 10,000 m3/day capacity, with an organic load equivalent to 400,000 inhabitants. Domestic flows account solely for around 2.5% of the total organic load flowing into the Plant and around 20% of the total flow.
The Alcanena WWTP has two distinct headworks for industrial and domestic effluents. One of the industrial effluent lines only operates between 1 a.m. and 3 a.m., the period during which tanneries may discharge effluents resulting from liming operations. Given the characteristics of these effluents, prior to the first stage of biological treatment, they are submitted to a sulfide treatment stage, through oxidation by pure oxygen. Subsequently, the biological treatment using activated sludge is carried out in two stages. In the first treatment stage, industrial effluent from the preliminary treatment is conveyed to two equalisation tanks equipped with an aeration system (air diffusers), to promote initial degradation of organic matter. This effluent is then submitted to chemical treatment, by coagulation-flocculation, with addition of lime, iron chloride as coagulant and a polyelectrolyte, and sent for primary clarification.
For the second biological treatment stage, effluent from the first stage is then joined with inflowing domestic effluents. Similar to the previous stage, it consists of a biological treatment process using activated sludge, with carbon and nitrogen removal, through an anoxic tank followed by three aerated tanks, with nitrate and sludge recirculation systems. Afterwards, the effluent is conveyed to the secondary clarifiers, before being discharged into the Ribeira do Carvalho.
Excess sludge is sent for thickening, dewatering and chemical stabilisation prior to being sent to landfill.
2.2. Field Monitoring and Analytical Methods
Field work, comprising sample collection and on site measurements, was carried out during the period of 20 June–29 July 2020, at the locations depicted in
Figure 1.
Initial adjustments were made after the first week, due to difficulties in collecting samples, and locations P1a and P2a were replaced with locations P1b and P2b for the remainder of the campaign. Simultaneous gas and liquid phase parameters were monitored, as follows:
Hydraulic parameters: wastewater inflow (Q), flow depth (h), flow velocity (v).
Wastewater quality: pH, total sulfides (ST), dissolved sulfides (SD), dissolved oxygen (DO), chemical oxygen demand (COD), temperature (T).
Sewer headspace: hydrogen sulfide (H2S).
After initial site adjustments, 3 to 4 wastewater grab samples were collected daily, during a total of 12 days, at 4 locations within the sewer network (P1 to P4), as well as at the WWTP inlet. Collection hours at each location were defined according to the timeframe for industrial wastewater discharge, taking into account the average wastewater conveyance time within the system.
Hydraulic parameters were measured using four Nivus (Eppingen, Germany) ultrasonic flowmeters installed by a specialised company (Contimetra). Three rain gauges with GPRS data communication (1 min time step and maximum intensity of 7.0 mm/min capacity) were also installed within the system, by the same company, to allow analysis of dry and wet weather inflows.
Wastewater samples were collected with an automatic sampler, while headspace H2S was monitored by means of a fixed probe (H2S BE Alphasense, Microtronics, Great Notley, UK, 0–2000 ppm, max. 3900 ppm) installed inside the selected manholes. Onsite parameter determination was carried out immediately after sample collection, using multi-parameter probes (LDO101, Hach, Colorado, USA) for DO (±0.1 mg/L), T (±0.3 °C) and pH. Samples were immediately transported to the laboratory and analysed. Preservation of samples for sulfide content analysis was carried out by adding a zinc acetate solution (0.2 mL 2M per 100 mL of sample) to sample bottles.
COD content was determined by Method APHA 5220 C (closed reflux titrimetric method). Total and dissolved sulfide content (ST and SD) was determined according to Method APHA 4500-S2. All analytical procedures were carried out by the wastewater utility AQUANENA, at the WWTP laboratory.
2.3. Sewer Process Model
Aerosept+ has been used for sulfide and H
2S simulation in domestic sewers in several locations in the past years. The model was initially developed by Matos [
40] and subsequently complemented by several studies, as to include specific DO and H
2S relationships in drops [
37,
44] or integration with other hydraulic models [
45].
AeroSept+ is an empirical model, which in cases of limited data, has demonstrated to provide comparable results with more complex models, under less available resources [
30], and was therefore considered as a more suitable approach.
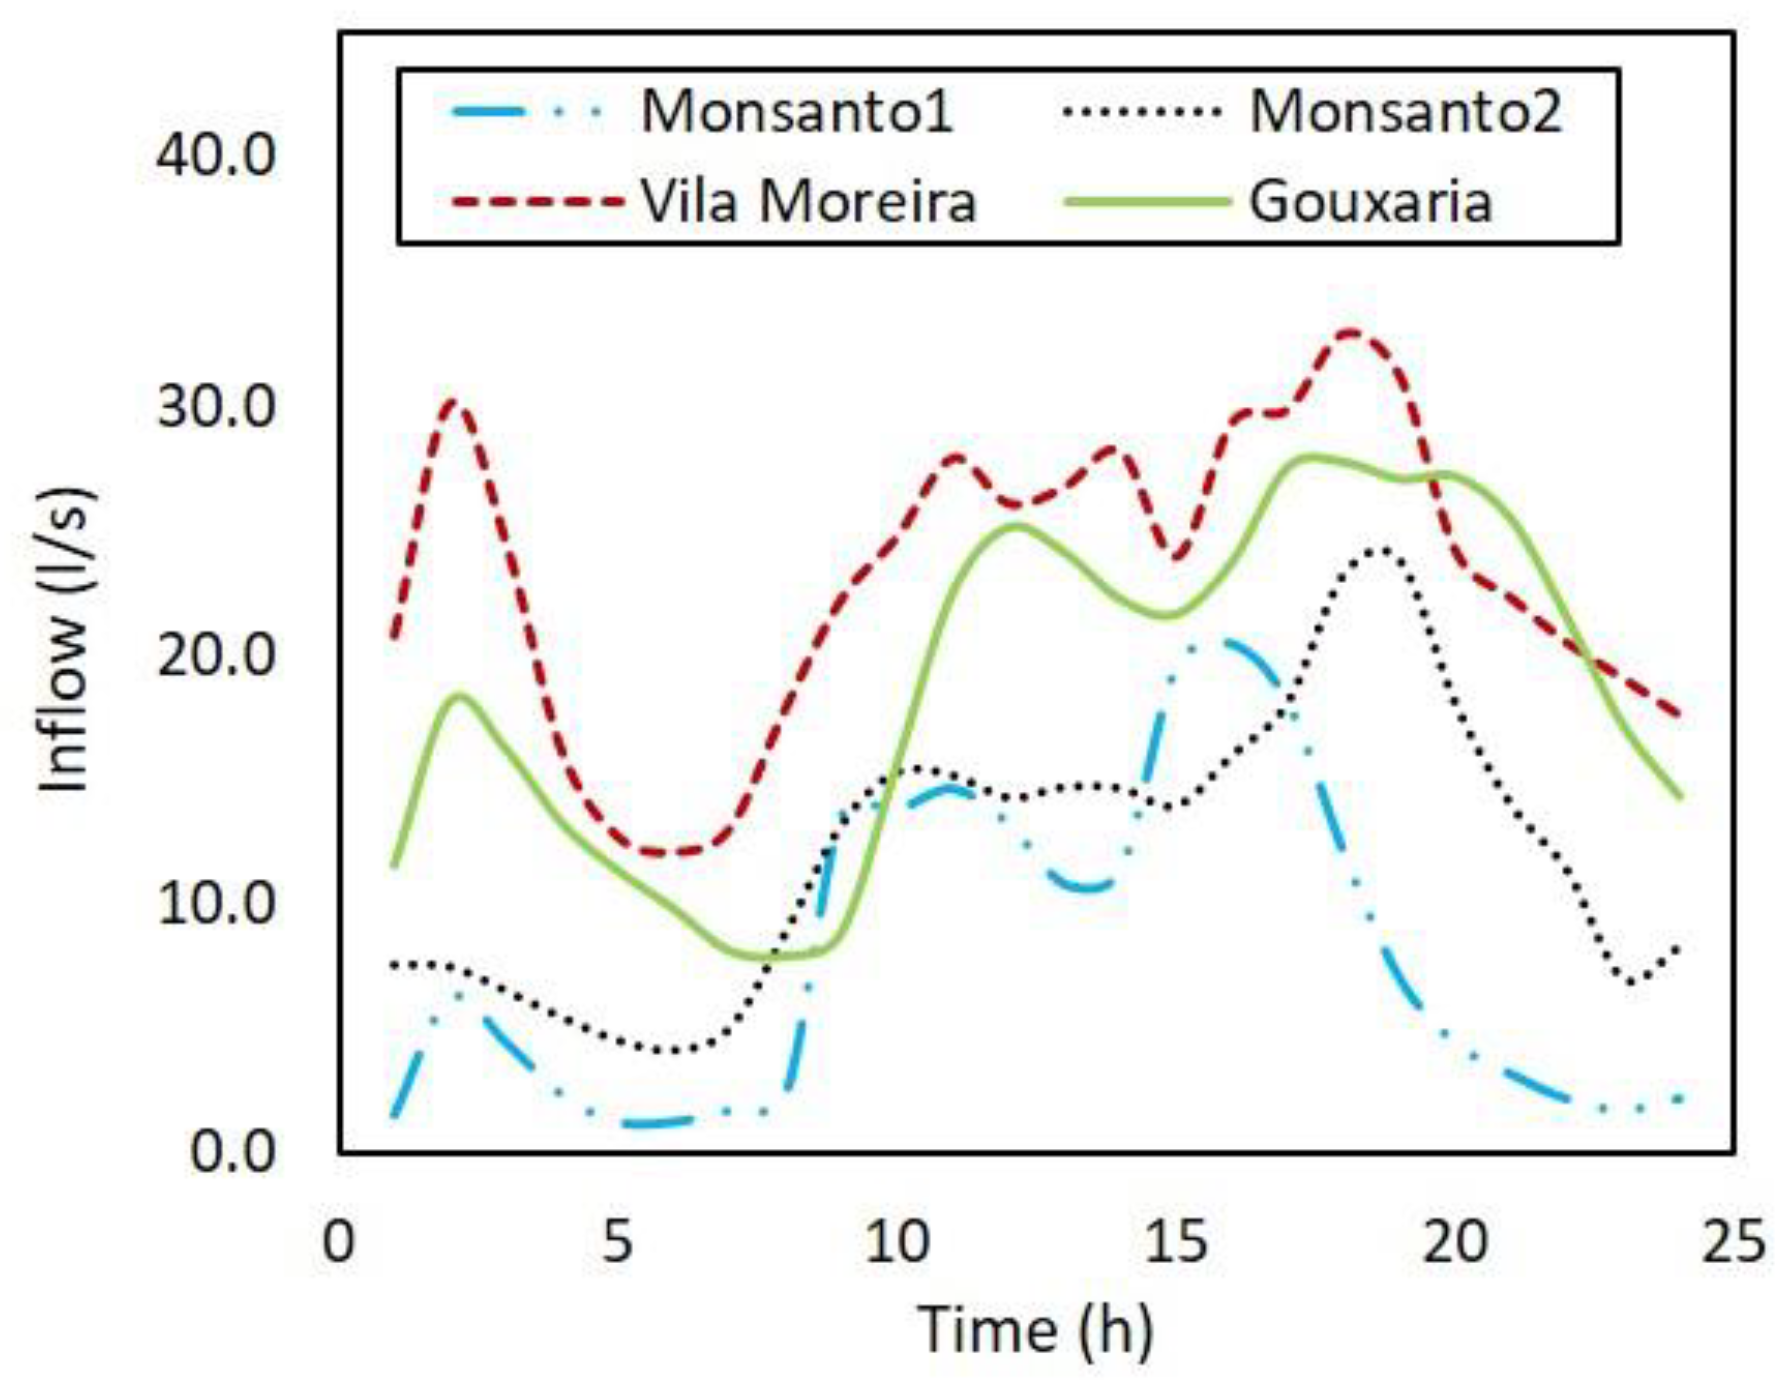
The model was applied to the three main trunk sewers (Monsanto, Gouxaria and Vila Moreira). Around 40% of industrial units are monitored by the utility, and therefore those wastewater flows were input directly in the model. For the remaining fraction, a dry weather pattern was created (
Figure 2), based on data from each of the installed flow meters, evenly distributed to model nodes where those industries were located. It was assumed that those industries had no additional sulfide inflows, according to historical knowledge by the utility.
Since it was found relevant, the model was specifically adjusted for this study, to allow different inflow BOD5 concentrations, as it originally did with sulfide inflows, in order to differentiate tanning industry contributions from the remaining ones.
The model was calibrated against measurements obtained at the locations shown in
Figure 1 during the period of 20–29 July 2020, for parameters of DO, S
T, S
D and H
2S. Key calibration parameter was found to be the empirical constant ‘m’ of the Pomeroy and Parkhurst formulation (usually considered equal to 0.96 or 0.64 in domestic wastewaters). In this case, the optimal calibration value was found to be 0.32, which was obtained by changing ‘m’ in increments of 0.05 until the minimum global error was observed between simulated and measured data, at locations P1 to P4. The parameter ‘fp’ was also found to significantly influence the model results, at the higher and lower ends of the used range (0.10 to 0.90). This is an empirical parameter used in the equation that estimates H
2S flow through the gas film layer in unsubmerged sewer walls. ‘fp’ values closer to 1 reflect absence of H
2S flow from the headspace to sewer walls.
A similar study [
45] used empirical constants ‘M’ and ‘fp’ in the formulations instead, to calibrate a model based on AeroSept+ to the domestic wastewater system of the city of Murcia, Spain, keeping ‘m’ constant at 0.7. Constants ‘M’ and ‘m’ are used in forecasting the maximum theoretical sulfide concentration attainable in a sewer stretch.
Since it was not feasible to measure BOD5 at the outlets of all industrial units in the region, input BOD5 was estimated taking into account the average BOD5 values monitored at the WWTP inlet during 2020, namely 3033 ± 1084 mg O2/L (data supplied by the utility AQUANENA). As such, BOD5 inputs to the model varied from 2000 to 4000 mg O2/L.
After calibration, the model was run for eight scenarios consisting of varying industrial effluent sulfide concentration and pH values, for different hours of the day, as shown in
Table 1. Scenarios were defined taking into account sulfide discharge thresholds defined in the RUWS for the tanning industry classes (namely 30 and 100 mg/L), but also taking into account the obtained results for pH and S
T obtained during field work.
Furthermore, a sensitivity analysis was carried out in order to evaluate how much model output values are affected by changes in input values. For that purpose, a deterministic sensitivity analysis approach was employed, where key parameters were assigned high and low values, varying in percentage increments from mean values (shown in
Table 2).
In addition, model performance was further evaluated by two model evaluation statistics, the root mean squared error (RMSE) between observed (
Ymeas) and simulated values (
Ymodel), as to translate forecasting accuracy (FA), as well as the percent bias (PBias), which are obtained by Equations (1) and (2) [
45,
46].
2.4. Lab Scale Experiments for Iron Chloride Dosage
Presence of high sulfide contents in the Alcanena sewer system has resulted in several constraints for the utility, namely: (a) numerous odour-related complaints by the neighbouring population, (b) high O2 consumption at WWTP preliminary treatment with inefficient results in terms of sulfide oxidation, (c) interference with downstream biological treatment. As such, experiments were carried out, in order to assess optimal sulfide abatement strategies, for dosing at locations in the sewer network, upstream of the WWTP.
While sulfide precipitation is assumed to occur with fast kinetics, actual conversion and reaction rates vary with wastewater type, especially at shorter reactions times [
17,
19].
Therefore, two sets of iron salts dosage experiments were carried out, one using a standard solution of known sulfide content (ST = 50 mg/L) and one using raw wastewater collected at the WWTP inlet (ST = 118.8 mg/L). A custom exploratory experimental design was selected, where variable parameters were iron chloride (III) dosage (ratios of 1.5:1, 2.75:1 and 4:1, mol:mol) and reaction time (30 s, 300 s and 600 s). Reaction times were selected as to simulate the HRT corresponding to dosage immediately upstream of the WWTP inlet, or at monitoring stations existing in each of the main trunk sewers.
Iron chloride (FeCl3) was selected not only due to its known efficiency, but also because it is already used by the utility in WWTP processes.
Samples containing sulfide and iron solutions were pumped in separate lines and injected into a closed container, continuously stirred for the defined experiment durations. pH and sulfide content were measured immediately afterwards, using the same methods as described for field work.
3. Results
3.1. Field Campaign
Wastewater quality parameters are summarised in
Table 3 for contextualisation purposes. Results are presented in terms of average (µ) and standard deviation (σ).
Overall, great variability in most parameters was observed. COD and ST concentrations were much higher than those found in typical domestic wastewater, and with exception of site P1b, DO was consistently low, indicating its depletion along the sewer, due to likely oxidation of sulfide and other pollutants. The SD/ST ratio was also found to be low for some samples and locations, sometimes under 1%, which may be due to the type of sulfur compound being rejected to the effluents.
High concentration of ST, associated with a highly alkaline environment (pH values over 10), is characteristic of an effluent from liming processes in the tanning industry, which in the Alcanena system is expected to be discharged between 1 am and 3 am. Nonetheless, the dissolved fraction of sulfides (SD), especially H2S in the liquid phase, is arguably the most relevant, given its ability to be released as hydrogen sulfide gas into the sewer headspace (thus causing corrosion issues, extreme odours and potentially toxic environments). In fact, maximum concentrations of SD of 192.5 mg/L and 259.9 mg/L were measured in P3 and P4, respectively (both sampling sites located at Gouxaria trunk sewer). At Monsanto trunk sewer, SD concentration peaked at 169 mg/L (P1b), while at Vila Moreira results were much lower, with SD peaking at 10.1 mg/L (P2b).
These results evidenced that spatial and temporal variability of sulfide concentration in the sewer is quite relevant in this system.
It should also be noted that samples collected in the initial days of the campaign presented overall lower pollutant loads, indicating that some of the industrial units might have not been in full operation in late June (possibly due to COVID-19 pandemic derived restrictions).
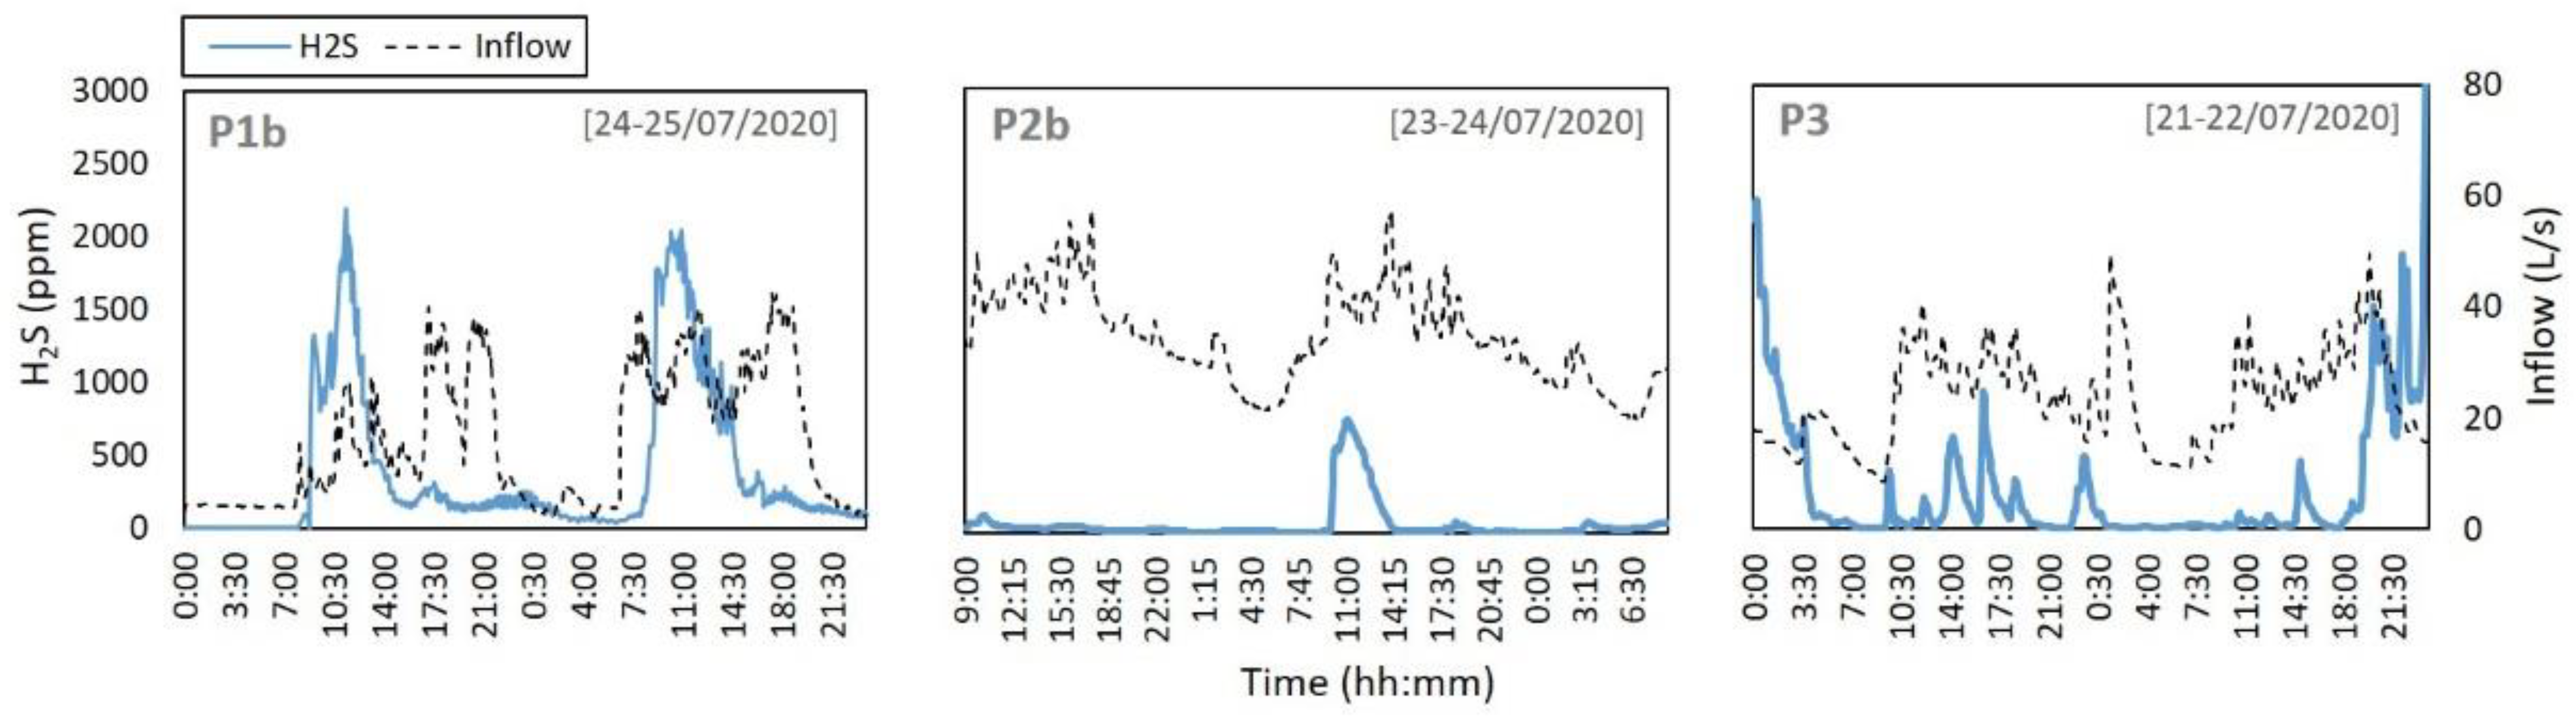
H
2S in the sewer headspace during the monitoring period evidenced significant concentrations, at times over 3000 ppm. Several measurements were carried out continuously, during 5-min time steps.
Figure 3 depicts H
2S concentration and wastewater inflow results for 2 consecutive days at P1 to P3 locations (P4 was not included since no flow meters were installed at that section).
While it can be clear that on certain occasions H
2S peaks at the sewer headspace are related to the wastewater inflow occurring at the moment within the sewer pipe, several wastewater inflow events can be observed that do not translate in an increase in H
2S within the system. This indicates that wastewater discharges may have occurred where sulfide was not present, and H
2S in the system can be expected to correlate heavily with the timing of tanning industry discharges. In addition, it is known that headspace pollutant concentrations are also heavily influenced by ventilation parameters, such as wastewater drag, turbulence, wind speed, fluctuations in wastewater levels, buoyancy, temperature and headspace pressurisation [
13], which illustrate the complexity in addressing and accurately modelling these processes.
Notwithstanding, it is clear that both wastewater sulfide content and gas phase H
2S clearly exceed common values found in sewers reported in the literature. For comparison purposes, field studies in other wastewater systems in Portugal evidenced S
D concentrations of 3.7 ± 1.0 mg/L, originating H
2S peaks of about 40 ppm in the sewer headspace at Meco wastewater system [
13]. In a study carried out at another coastal city, Ericeira, S
D contents at a domestic trunk sewer evidenced maximum concentrations of about 12–15 mg/L, and H
2S gas peaks of 100–250 ppm [
10]. In the Costa do Estoril wastewater drainage system, Mourato et al. [
37] reported total sulfide concentrations of 0.3 ± 0.7 mg/L, with maximum observed concentrations of 5 mg/L.
3.2. Modelling Results
3.2.1. Model Performance
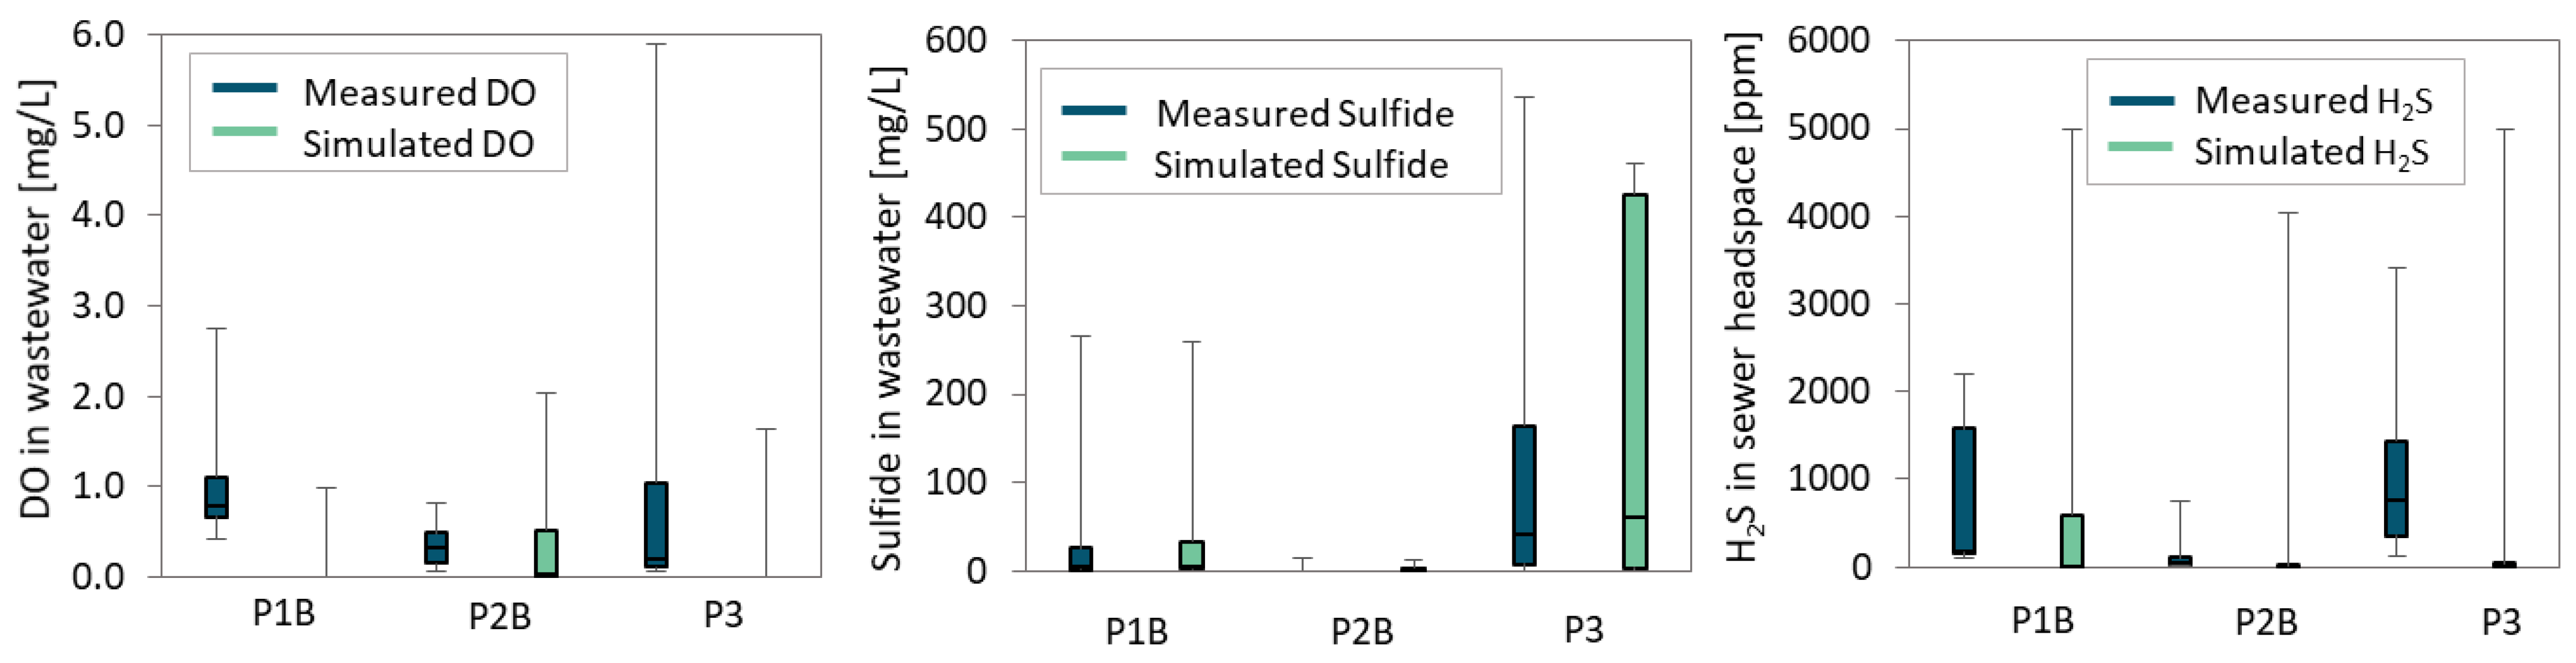
Calibration results regarding measured and simulated concentrations of DO, S
T and headspace H
2S are shown in
Figure 4, for the three monitored sections P1b, P2b and P3.
Overall, agreement between measured and simulated values seems to be satisfactory, falling in the same order of magnitude, especially when considering the high variability of measurements obtained in the industrial system. However, some differences may be observed, regarding all three parameters. These differences are mostly due to the time of sampling and uncertainties regarding BOD5 concentration in the system. Seeing as most industries have a fixed schedule for effluent discharge (night period), some grab samples evidenced null contents of sulfide, while others presented extremely elevated concentrations. This non-homogeneous distribution in time is more complex to replicate in a steady-state model.
In order to fit the high median sulfide concentrations, the model seems to under predict DO concentration to some extent, mostly visibly in P1b and P3, which could also be partially attributed to sampling errors. However, the prediction capability for sulfide and H2S seems to improve, with simulated median concentrations falling within the 25th and 75th percentiles of measured values.
Median results for measured and predicted total sulfide present a variation of 2% for P1b, 31% for P2b and 35% for P3. Similarly, the variation between median concentrations for measured and predicted headspace H2S were of 18% for P1b, 46% for P2b and 32% for P3.
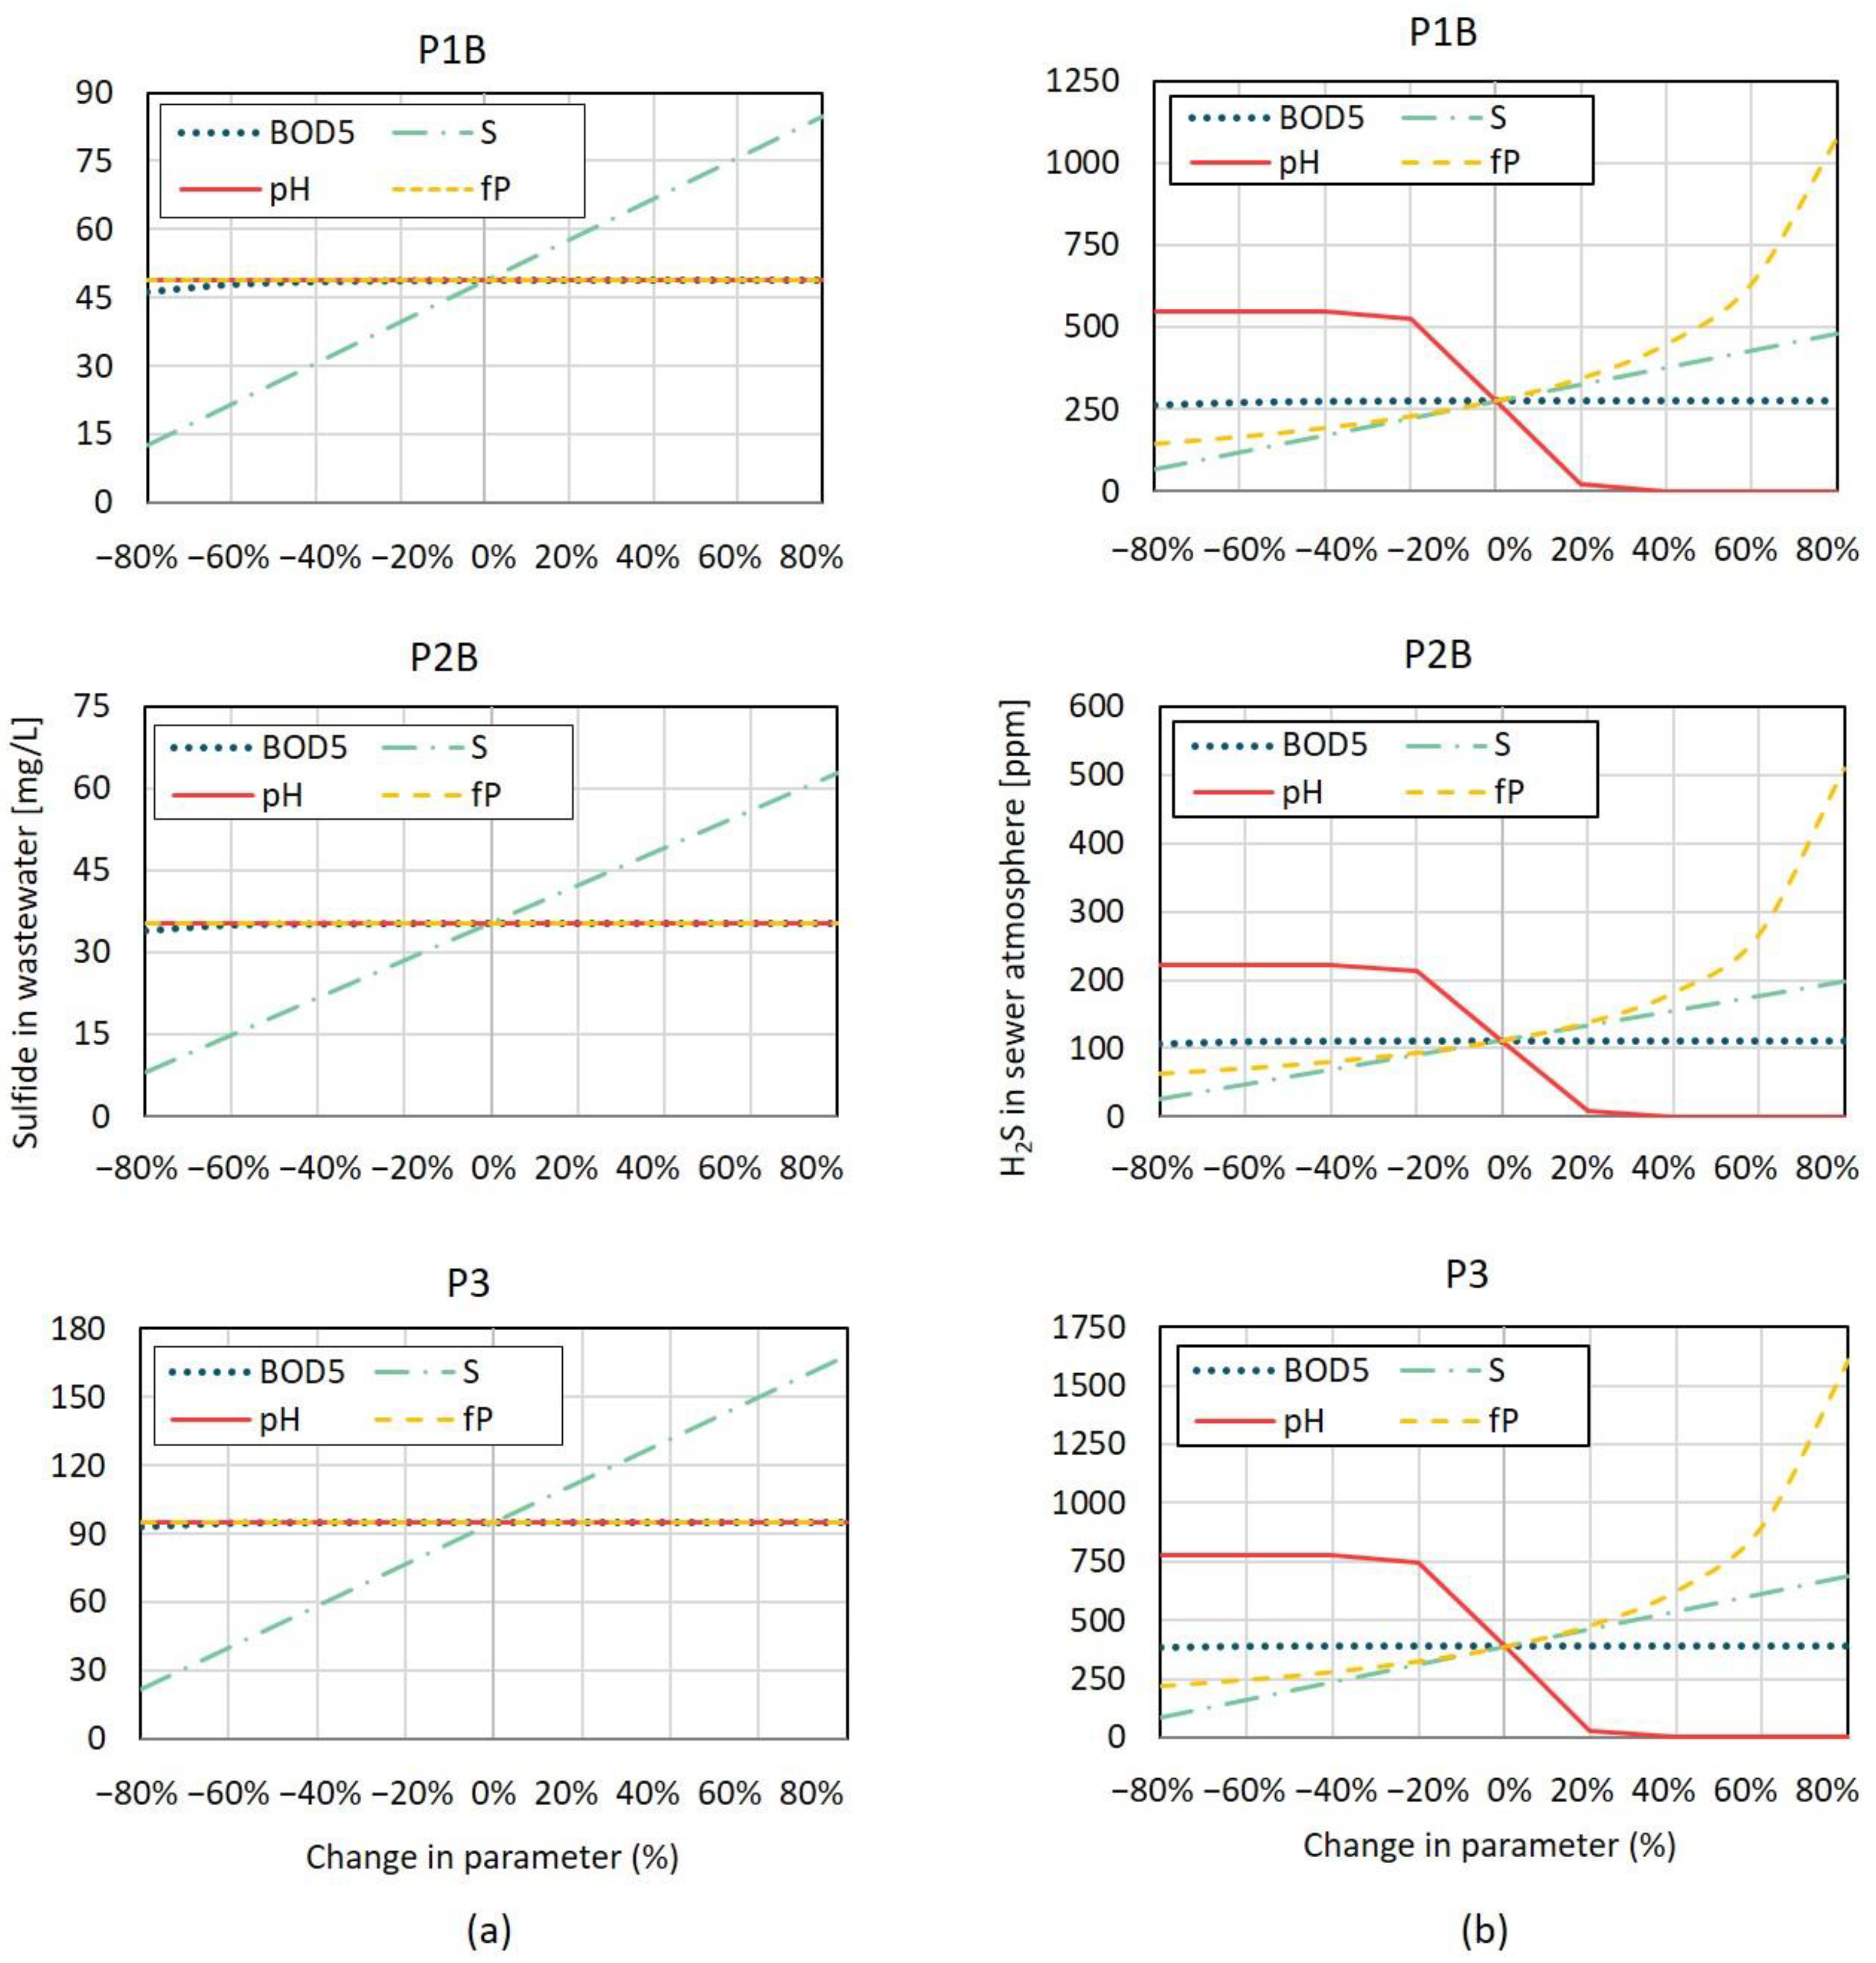
Results of the sensitivity analysis carried out are plotted in
Figure 5. It can be observed that model S
T concentration values are clearly more influenced by input S
T at nodes receiving effluents from tanneries than by any of the other input parameters, namely pH, BOD
5 concentration or ‘fp’.
These results can be expected to some extent, given that sulfide contents in these industrial effluents are much higher than typical domestic effluents, and result mostly from direct discharges rather than biological generation. Therefore, parameters like BOD5 (as a proxy for biomass substrate) or pH, which influence the outcomes of biological sulfide build-up models, are not as relevant as the physical and chemical transformations that occur in the industrial system.
When analysing the influence of the same parameters on H
2S headspace concentration (
Figure 5b, it is clearly observable that both pH and ‘fp’ also have a great influence in model results, in addition to S
T input at industry connection nodes. pH, being a measure of the hydrogen ion activity, is important to analyse chemical reactions and equilibria for contaminants having ionisable H
+ or OH. According to Matos [
40], for pH values below 5, ionisable forms of sulfide are practically inexistent and H
2S in the liquid stage is predominant, allowing for its maximum potential release into the sewer headspace in gas form. HS
− and H
2S are present simultaneously for pH ranges from 5 to 12, while for pH values over 12 HS
− concentration becomes negligible and S
2− is more likely to occur. This explains the variation in H
2S headspace concentration with changes in pH values, with nearly no H
2S mass transfer processes for high pH values (over 10).
Regarding the influence of ‘fp’ in model results, values closer to 1 indicate no H
2S gas diffusion occurs in the thin film in unsubmerged sewer walls, resulting in higher H
2S concentration within the sewer headspace, as observed in
Figure 5b.
Table 4 shows forecasting accuracy (FA) and percent bias (PBias) for the three main trunk sewers modelled. Values closer to zero indicate better model performance. Overall, both statistics demonstrate better modelling results for sulfide in wastewater than H
2S in the sewer headspace. Results for P2B indicate a superior forecasting accuracy in this node, while model results for H
2S in P3 present the least satisfactory performance.
Previous studies have considered model results satisfactory for PBias values in the range of ±55% [
45,
46]. In this study, the percent bias statistic is within the range of maximum error for a quality modelling result at all three locations, however FA seems to indicate a worse model performance for headspace gas in P1B and P3.
3.2.2. Scenario Analysis
Scenarios were simulated as a complement to model sensitivity analysis, but also as a way to evaluate whether the model could provide insight into probable sulfide concentrations discharged by industrial units.
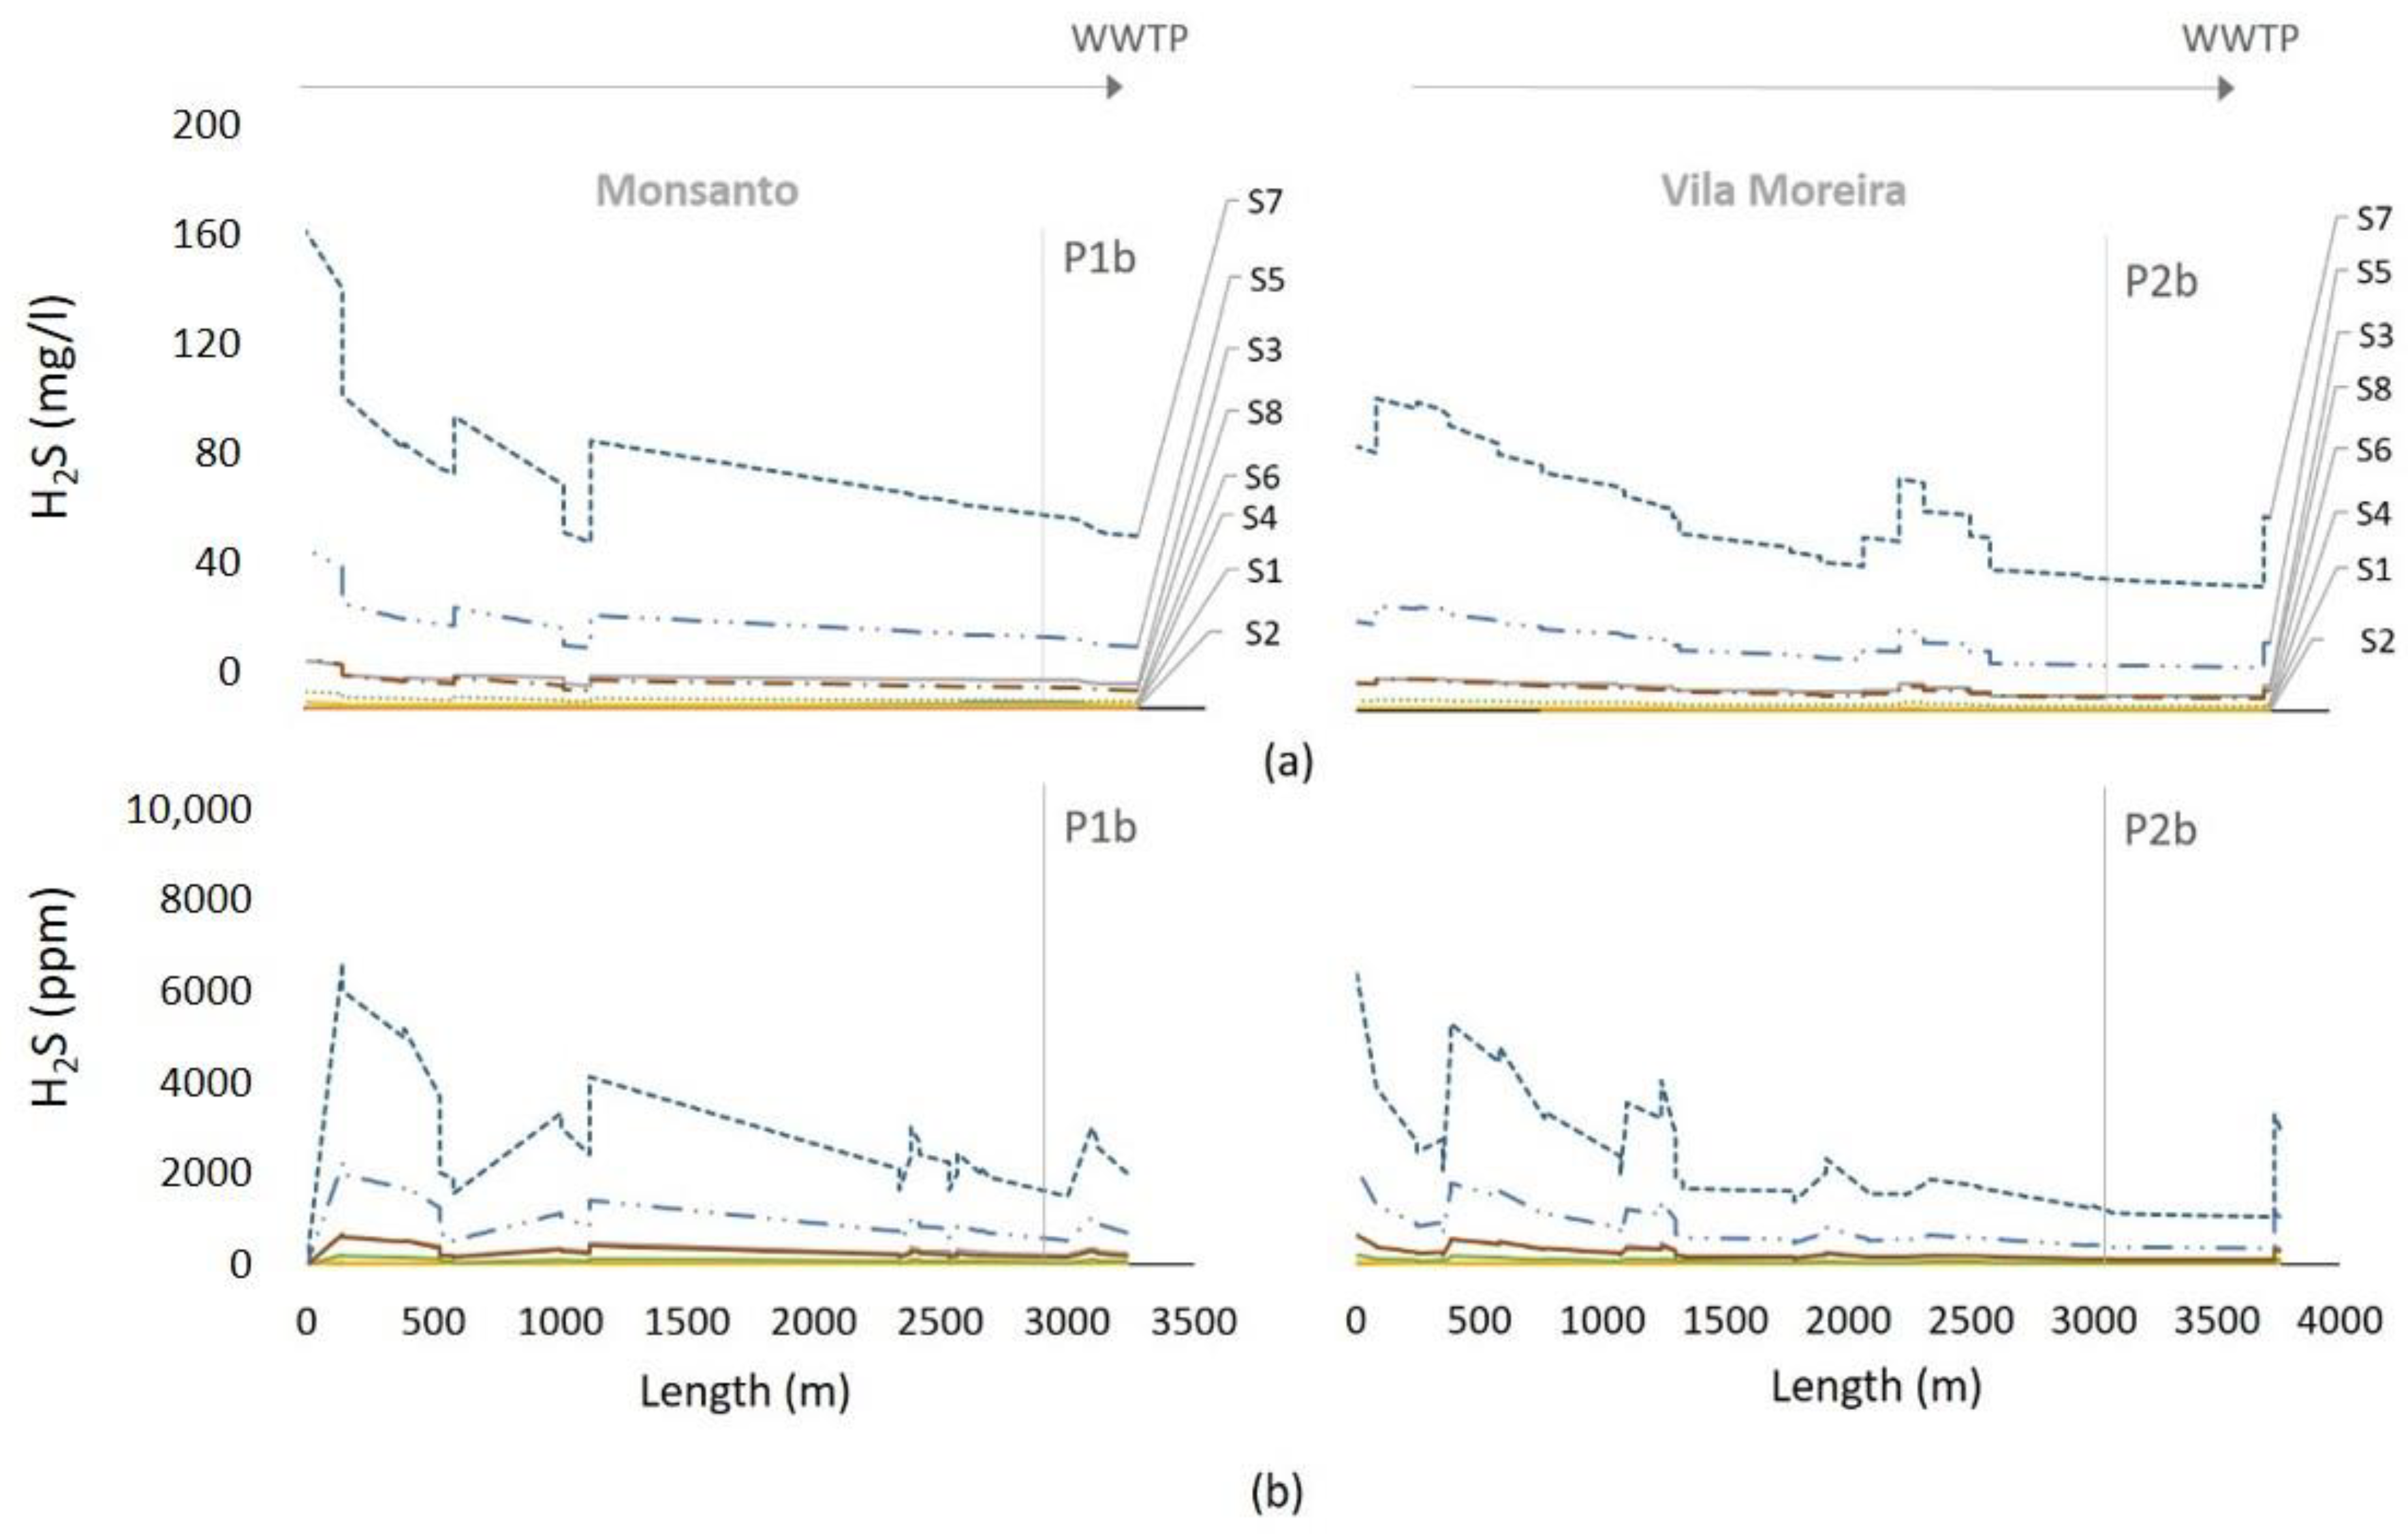
Figure 6 depicts simulation results for H
2S
L in the wastewater and H
2S in the sewer headspace, for all eight scenarios.
If sulfides are not present in industrial inflows (scenarios S1 and S2), aerobic conditions will prevail throughout most of the system, for all three trunk sewers. Septic conditions would only be expected near the WWTP inlet, with ST concentration of around 1.6 mg/L.
The remaining scenarios (S3 to S8) resulted in septic conditions along most of the length of the simulated sewer stretches. Whatever the scenario, wastewater reaches the WWTP inlet with significant sulfide contents, of around 100 mg/L in case of scenarios S7 and S8. In fact, scenario S7 (S = 300 mg/L and pH = 6) clearly led to extremely high concentrations of sulfide within the wastewater, and H2S in the sewer headspace, peaking at 7000–10,000 ppm in Monsanto and Vila Moreira, and nearly 25,000 ppm at the Gouxaria trunk sewer. The results in Gouxaria may be explained by the fact that industries other than tanneries (where sulfide inflow was considered null) are almost inexistent in that system, when compared with Monsanto and Vila Moreira.
3.3. Sulfide Abatement
Results from the experiments in sulfide abatement by reaction with FeCl
3 are shown in
Table 5. S
D and pH in the samples after FeCl
3 dosage at different ratios and reactions times are presented.
Both for the standard solution and the raw effluent sample, FeCl3 dosage ratio of 4:1 allowed sulfide precipitation until there was practically no SD in the effluent, regardless of the reaction time. On the other hand, dosage of 1.5:1 seemed insufficient for significant SD abatement, although in this case, it seems to depend on reaction time for experiments B. In fact, a reaction time of 30 s resulted in a SD concentration of 16.7 mg/L in the final effluent, which sill corresponds to a removal rate of about 85%. Increasing reaction time to 600 s, led to higher sulfide abatement, resulting in a concentration of 5.6 mg/L, or 95% removal.
The central point of the experiment (i.e., 2.75:1 dosage ratio for 300 s) seemed to yield satisfactory sulfide abatement rates, of over 96%. While the remaining sulfide in the dissolved fraction (4.3 mg/L in raw wastewater sample) is still likely to cause some H2S release onto the sewer headspace upstream, it may be sufficiently low to undergo efficient oxidation at the WWTP, thus improving the system’s performance in terms of downstream biological processes and odour emission.
Another aspect worth mentioning, is that it is known that pH affects stoichiometric ratios and sulfide conversions [
3,
19,
47]. In the standard solution, even though there was an attempt to adjust pH to approximate wastewater levels, final pH was lower than that of raw wastewater. As such, at lower pH, sulfide conversion is much lower (consistent with the abovementioned studies), and therefore sulfide contents after the experiment were higher, even though initial sulfide content in those samples was lower.
4. Discussion
Regarding research question 1 set out in this study, field work revealed sulfide contents in the industrial effluent of several orders of magnitude higher than those typically found in domestic effluents. This means aggravated risks in terms of human gas exposure and system asset management.
Knowledge of concentration levels of harmful substances and duration of exposure is essential for accurate risk assessment. Nonetheless, it is reported that H
2S concentrations of over 700–1000 ppm may cause instant death [
40], and several regulatory frameworks and guidelines on workplace safety practices exist, recommending maximum exposure limits to H
2S ranging from 5 to 10 ppm in a work shift, to a maximum 50 ppm of instant exposure [
13]. H
2S peaks in the Alcanena industrial sewage system often exceeded a 2000–3000 ppm range, indicating a potential serious threat to utility workers.
Regarding potential corrosion risks, it is known that, in practice, plastic pipes in the Alcanena system are not subjected to H
2SO
4-induced corrosion. However, manholes, which are often made of concrete, metallic structures (ladders and covers) and equipment (monitoring probes and dosing pumps) are exposed to H
2S and may be prone to corrosion, thus requiring additional protective measures to prevent a significant decrease in durability. In [
12], a summary of corrosion rates and lifetimes of concrete sewer pipes in various drainage systems is presented. Based on studies carried out in different cities around the world, presented corrosion rates of concrete pipes are in the range of 2.0–10 mm.year
−1, which translates into lifetimes of about 20–70 years. Although no consideration is made regarding average sulfide contents in those systems, it is logic to assume they fall into the range of typical domestic effluent concentrations, much lower than those observed in Alcanena. This corroborates the need for additional measures for sulfide control, in order to expand the lifetime of employed materials.
The second research question to address in this paper refers to AeroSept+ forecasting capabilities for a full-scale industrial system receiving tannery effluents. In that regard, modelling results seemed to yield satisfactory conclusions regarding the overall system behaviour, in terms of sulfide and H2S evolution within the sewers. While it seems complex to replicate the high temporal variability in DO and ST concentrations, agreement between median values of measured and simulated parameters is relatively satisfactory, with differences under 35%.
Comparing AeroSept+ simulation results for liquid phase with maximum values registered in the monitoring campaigns (July 14 to 28), it appears that in the Monsanto system, total sulfide concentration (266 mg S/L in July 27 at 9 am) exceeded the simulated values even in the worst case scenario S7 (maximum ST inflow of 100 mg S/L). This seems to indicate that sulfide concentration in industrial effluents may have exceeded the regulatory thresholds, i.e., that the weighted sulfide concentration from all industrial outlets would most likely have been greater than 300 mg S/L, given the expected abatement along the route.
Simulations for Vila Moreira showed that scenarios S3 and S4 (ST = 30 mg/L), yielded the closest results (about 20 mg S/L) to observed S concentrations at that location (about 14 mg S/L), which shows that industrial effluents may have been in compliance with defined thresholds in this trunk sewer.
Simulation results for Gouxaria are somewhat distant from those obtained during field work, which reached a maximum of almost 500 mg S/L on July15 at 9:00 am, whereas scenarios S7 and S8 only resulted in maximum sulfide concentration of about 150 mg S/L. In other words, sulfide content in discharged effluents during that period, may have been higher than admissible, i.e., over 100 mg S/L.
Maximum values were generally recorded around 9:00 am, reflecting the impact of liming operation discharges made between 1:00 am and 3:00 am. However, there is a significant time lag not predicted by the hydraulic model calculation, since the travel time in the system is less than 3 h. Pollutant dispersion may result in a delay in peak concentrations to the most downstream sections. On the other hand, in downstream sewer sections which occasionally operate as full flowing pipes, flow velocities decrease and hydraulic retention time (HRT) within the system increases, which may perhaps be the most probable reason for that observation.
Regarding H2S in the sewer headspace, maximum concentrations of about 2000 ppm were registered in Monsanto trunk sewer. This means that scenario S7 simulation results are the closest to field observations, with a peak concentration of approximately 2500 ppm. The same was observed in Gouxaria, where S7 resulted in a peak concentration of approximately 3500 ppm, close to the maximum observed value of nearly 3000 ppm. However, in the Vila Moreira system, model results yielded approximately 1200 ppm of H2S within the sewer headspace, which is quite lower than the maximum registered value of 4000 ppm.
In summary, S7 seems to better simulate the maximum concentration values of ST and H2S measured in the monitoring campaigns. This situation seems to confirm that it is reasonable to assume that at least a part of industrial units may have discharged effluents with concentrations of total sulfides greater than the admissible 100 mg S/L.
Concerning model accuracy, the model seems to present better results for liquid phase than H
2S in the sewer headspace. A possible explanation for this difference is the fact that H
2S was monitored in continuous, and S
T was determined from grab samples. Another relevant aspect is that gas movement in sewers is known to be mostly affected by wastewater drag, wind reduction, airflow differences caused by section reductions or sudden slope changes, turbulence induced by pumping stations or drop structures, pressure differences, buoyancy and temperature differentials [
41]. Most empirical models, like Aerosept+, assume average air velocity is related to hydraulic parameters, namely water surface width, water velocity and headspace pipe perimeter, which may suffice to provide a ballpark figure in the same order of magnitude, but may be insufficient to accurately predict gas phase results with high reliability. These results illustrate that this modelling approach may provide reliable results for sulfide estimation in wastewater, however the complexities associated with gas phase and sewer ventilation modelling justify further research on the subject. Nonetheless, modelling results demonstrate that even with limited field data it is possible to obtain a satisfactory evaluation of system performance with little investment and time allocation. This approach may be especially useful in developing countries and in regions where physical and human resources are scarce and field monitoring, real-time control and asset management are complex challenges for utilities.
In view of the work carried out, as well as of the records of operation constraints and complaints derived from the presence of sulfides within the Alcanena industrial system, a holistic approach should be considered for sulfide abatement and control. As such, solutions should be considered for source control, as well as for chemical dosage stations at the three trunk sewers, in order to minimise infrastructure corrosion, release of foul odours, toxic atmospheres and disturbance of the efficiency of the WWTP.
It becomes clear that sulfide control is necessary within the system, and abatement experiments generally evidenced that increasing dosages of iron chloride and reaction times may lead to beneficial results in terms of soluble sulfide removal from the industrial effluent. This indicates that dosage at the existing monitoring stations, with a travel time of about 10 min to the WWTP, may be advantageous in sulfide precipitation. These exploratory results seem to point toward a dosage ratio of about 2.75:1 (mol), since this resulted in removal of about 96% of sulfide, which allows to shed some light on research question 3 defined for this study. The recommend strategy is, therefore, the implementation of a PID controller, able to control dosage of iron chloride based on real-time measurements of sulfide at the monitoring stations, until it reaches desired levels at the WWTP inlet. This system may require additional calibration/tuning in situ once it is implemented, and more work is recommended for dosage optimisation in real time.
5. Conclusions
Information regarding H2S concentration in sewer systems, as well as regarding the best available minimisation measures, is one great concern in asset management for wastewater utilities. Therefore, existence of modelling tools for system management under budget and resource constraints is of growing importance. An existing model (AeroSept+) was adapted and calibrated for use in simulating sulfide and H2S contents in an industrial sewer system, receiving mostly industrial effluents from tanneries with high sulfide contents. Characterisation of such effluents in industrial sewer systems was found scarce in the literature, especially regarding concentration of sulfide and H2S and its impacts. Under this study, industrial effluents in the Alcanena industrial system, presented maximum dissolved sulfide concentrations of over 250 mg/L, leading to H2S peaks of over 3000 ppm, clearly higher than those usually observed in domestic sewer systems.
The model was adapted to allow for different BOD5 inputs, and the key calibration parameter was found to be the empirical constant ‘m’ of the Pomeroy and Parkhurst formulation. Eight scenarios were simulated, considering different inflow pH and sulfide values, and the work undertaken showed that the model was capable of generally reproducing sulfide and hydrogen sulfide concentrations, albeit with some uncertainty. Future work could focus on using localised calibration parameters, as more monitoring data become available.
Another relevant aspect of the work is the optimisation of iron chloride dosage for sulfide abatement, in a highly loaded industrial wastewater. Several dosages and reaction times were tested, indicating that a ratio of 2.75:1 may be sufficient to induce significant sulfide abatement in the sewers, prior to the WWTP inlet. This is expected to contribute to odour reduction and improvement of downstream treatment processes, especially in terms of minimisation of necessary oxygen for sulfide oxidation, as well as improvement of biological processes. Further developments of this work should focus on local calibration of dosage controls, based on real-time upstream sulfide concentration, to validate its effect on abatement up to the WWTP inlet. On a broader view, research efforts should focus on improving the accuracy of ventilation and gas phase modelling in expedite sewer quality models.
The work highlighted the importance of modelling tools as an aid for asset and risk management, as well as the need for reporting full-scale data on sulfide and H2S transformations in sewers receiving industrial effluents.


