Article

Combining Precision Viticulture Technologies and Economic Indices to Sustainable Water Use Management

by
Adele Finco
1,
Deborah Bentivoglio
1,*,
Giulia Chiaraluce
1,
Matteo Alberi
2,3,
Enrico Chiarelli
2,3,
Andrea Maino
2,3,
Fabio Mantovani
2,3,
Michele Montuschi
2,3,
Kassandra Giulia Cristina Raptis
2,3,
Filippo Semenza
2,3,
Virginia Strati
2,3,
Filippo Vurro
4,
Edoardo Marchetti
4,
Manuele Bettelli
4,
Michela Janni
4,
Emiliano Anceschi
5,
Carlo Sportolaro
5 and
Giorgia Bucci
5
1
Department of Agricultural, Food and Environmental Sciences (D3A), Polytechnic University of the Marche (UNIVPM), Via Brecce Bianche, 60131 Ancona, Italy
2
Department of Physics and Earth Sciences, University of Ferrara, Via Giuseppe Saragat, 44122 Ferrara, Italy
3
INFN, Ferrara Section, Via Giuseppe Saragat, 44122 Ferrara, Italy
4
Institute of Materials for Electronics and Magnetism, National Research Council (IMEM-CNR), Parco Area Delle Scienze 37/A, 43124 Parma, Italy
5
Gruppo Filippetti, Via Guglielmo Marconi, 60015 Ancona, Italy
*
Author to whom correspondence should be addressed.
Submission received: 8 April 2022 / Revised: 3 May 2022 / Accepted: 4 May 2022 / Published: 6 May 2022
(This article belongs to the Special Issue Applications of Remote Sensing in Agricultural Water Management)

Abstract

:
The scarcity of water due to climate change is endangering worldwide the production, quality, and economic viability of growing wine grapes. One of the main mitigation measures to be adopted in the viticulture sector will be an adequate irrigation strategy. Irrigation involves an increasing demand for water, a natural limited resource with increasing availability problems for the foreseeable future. Therefore, the development of a precision irrigation system, which is able to manage the efficient use of water and to monitor the crop water stress, is an important research topic for viticulture. This paper, through the analysis of a case study, aims to describe the prototype of a software platform that integrates data coming from different innovative remote and proximal sensors to monitor the hydric stress status of the vineyard. In addition, by using a cost analysis of grape cultivation and implementing economic indices, this study examines the conditions by which irrigation strategies may be economically justified, helping the decision-making process. By combining different sensors, the platform makes it possible to assess the spatial and temporal variability of water in vineyards. In addition, the output data of the platforming, matched with the economic indices, support the decision-making process for winemakers to optimize and schedule water use under water-scarce conditions.

1. Introduction

Despite the fact that global wine grape production has grown steadily over the past 20 years, climate change has emerged as a driver of transformation in wine regions, resulting in a range of impacts [1]. Since it can potentially influence vine yield and quality [2,3], climate change is expected to pose a strong impact on wine production, threatening the sustainability of the winemaking sector [4,5]. In the Mediterranean region, the rising temperatures are severely affecting yields and crop production mainly due to prolonged drought events [6,7]. Consequently, water availability is becoming a major concern also for the viticulture sector, where generally water was not considered an essential input for yield quality and quantity. Indeed, nowadays, improving water use efficiency (Objective 6, Target 6.4) and the need for solutions to increase the sustainability and resilience of agricultural systems to climate change (Objective 2, Target 2.4) are included in the 17 sustainable development goals defined by the United Nations Agenda 2030 [8].
In Europe, below 10% of the total area devoted to vineyards is irrigated, but the tendency toward irrigation is increasing to mitigate the effects of climate change and of a more stressful environment [9]. Due to recent climate change impacts, irrigation practice in viticulture is becoming a reality in Mediterranean regions (including Italy) to control the water conditions of the vine. These regions may become excessively dry for high-quality winemaking or even unsuitable for grapevine growth without sufficient irrigation [10]. As a consequence, regions under higher water scarcity conditions need to improve grapevine water use efficiency to secure sustainability. The extension of the sustainability paradigm and the growing interest and awareness of its managers led the most important organization of the sector, the International Organisation of Vine and Wine (OIV), to adopt the definition and principles of sustainability applied to viticulture (Sustainable viticulture is defined by the OIV as a “global strategy on the scale of the grape production and processing systems, incorporating at the same time the economic sustainability of structures and territories, producing quality products, considering requirements of precision in sustainable viticulture, risks to the environment, products safety and consumer health and valuing of heritage, historical, cultural, ecological and landscape aspects”) [11,12].
In recent years, different approaches have been used to cope with water use efficiency, such as the use of drought-tolerant rootstocks, clones and/or varieties, improved training systems or increased row spaces, and irrigation applications [13,14,15]. Although winegrowers still prioritize canopy and soil management and changes in harvest date and winemaking techniques over water management, the use of irrigation in vineyards has become inevitable in historically nonirrigated areas due to the warming trends [16]. Considering the climatic changes and the previous experiences of the last winegrowing campaigns, supplementary irrigation is now in fact considered a necessity, and as such it is no longer a variable or discretionary element of the production specification legislation. This evidence is confirmed by the Consolidated Wine Act (Legge 12 dicembre 2016, n. 238: Disciplina organica della coltivazione della vite e della produzione e del commercio del vino (Testo Unico Vino)), which emphasizes that it is possible to use supplementary irrigation in compliance with the limited maximum unit yield per hectare envisaged for each typology of wine produced under a disciplined regime. Consequently, for correct water management, in addition to the optimization of irrigation systems, the implementation of precision viticulture technologies and decision support systems are necessary, paying close attention to aspects such as profitability, costs, and sustainability [17,18,19,20,21]. The capability to continuously and precisely monitor the response of vineyards to water stress, through the use of digital technologies for the assessment of the plant water status is a key component to quickly reacting to critical climatic conditions. Water stress has different impacts in relation to the growth phases of the grape. These technologies allow for the rationalization of the emergency irrigation practice to improve the quality of the grapes and correct situations of imbalance. Several studies have explored various methods and techniques to measure vineyard water use and stress [22]. In recent years, new proximal and remote sensing techniques have become widespread since they allow a noninvasive and site-specific evaluation of plant water stress dynamics in a timely manner in the complex system soil–plant environment [23]. However, research studies on the detection of water stress in vineyards with the combined use of multiple sensors are limited, introducing a challenge regarding the alignment of these sensors [24]. In addition, the simultaneous management of different kinds of data at the same time, which are by their very nature highly variable, cannot be quickly handled with a common database. Thus, the main novelty of the paper is a description of a digital platform allowing the interoperability of different sensors and data. The development of such a platform is the aim of the Operational Group SMART VITIS financed by Rural Development Program (RDP) Marche 2014/2020, submeasure 16.1. The platform consisting of a set of application modules and infrastructural technologies was conceived and developed to provide advanced cloud services in the field of smart technologies and the Internet of Things (IoT) for optimizing data management. Finally, several studies have assessed the efficiency of the use of water from a productive standpoint [25,26,27,28,29]. However, few studies have evaluated this efficiency from an economic perspective, including the evaluation of indices of economic efficiency, which could serve as a support for decision making [30]. Based on these premises, this study, through the analysis of a case study, aims to describe the prototype of a software platform that integrates data coming from different innovative remote and proximal sensors in order to offer innovative services and support systems to farmers for optimizing and scheduling water use. In addition, the evaluation of economic indices underlines the conditions by which irrigation strategies may be economically sustainable, helping the decision-making process. The remainder of the paper is divided as follows: Section 2 presents materials and methods; then the results are presented and discussed in Section 3, and Section 4 ends with conclusions.

2. Materials and Methods
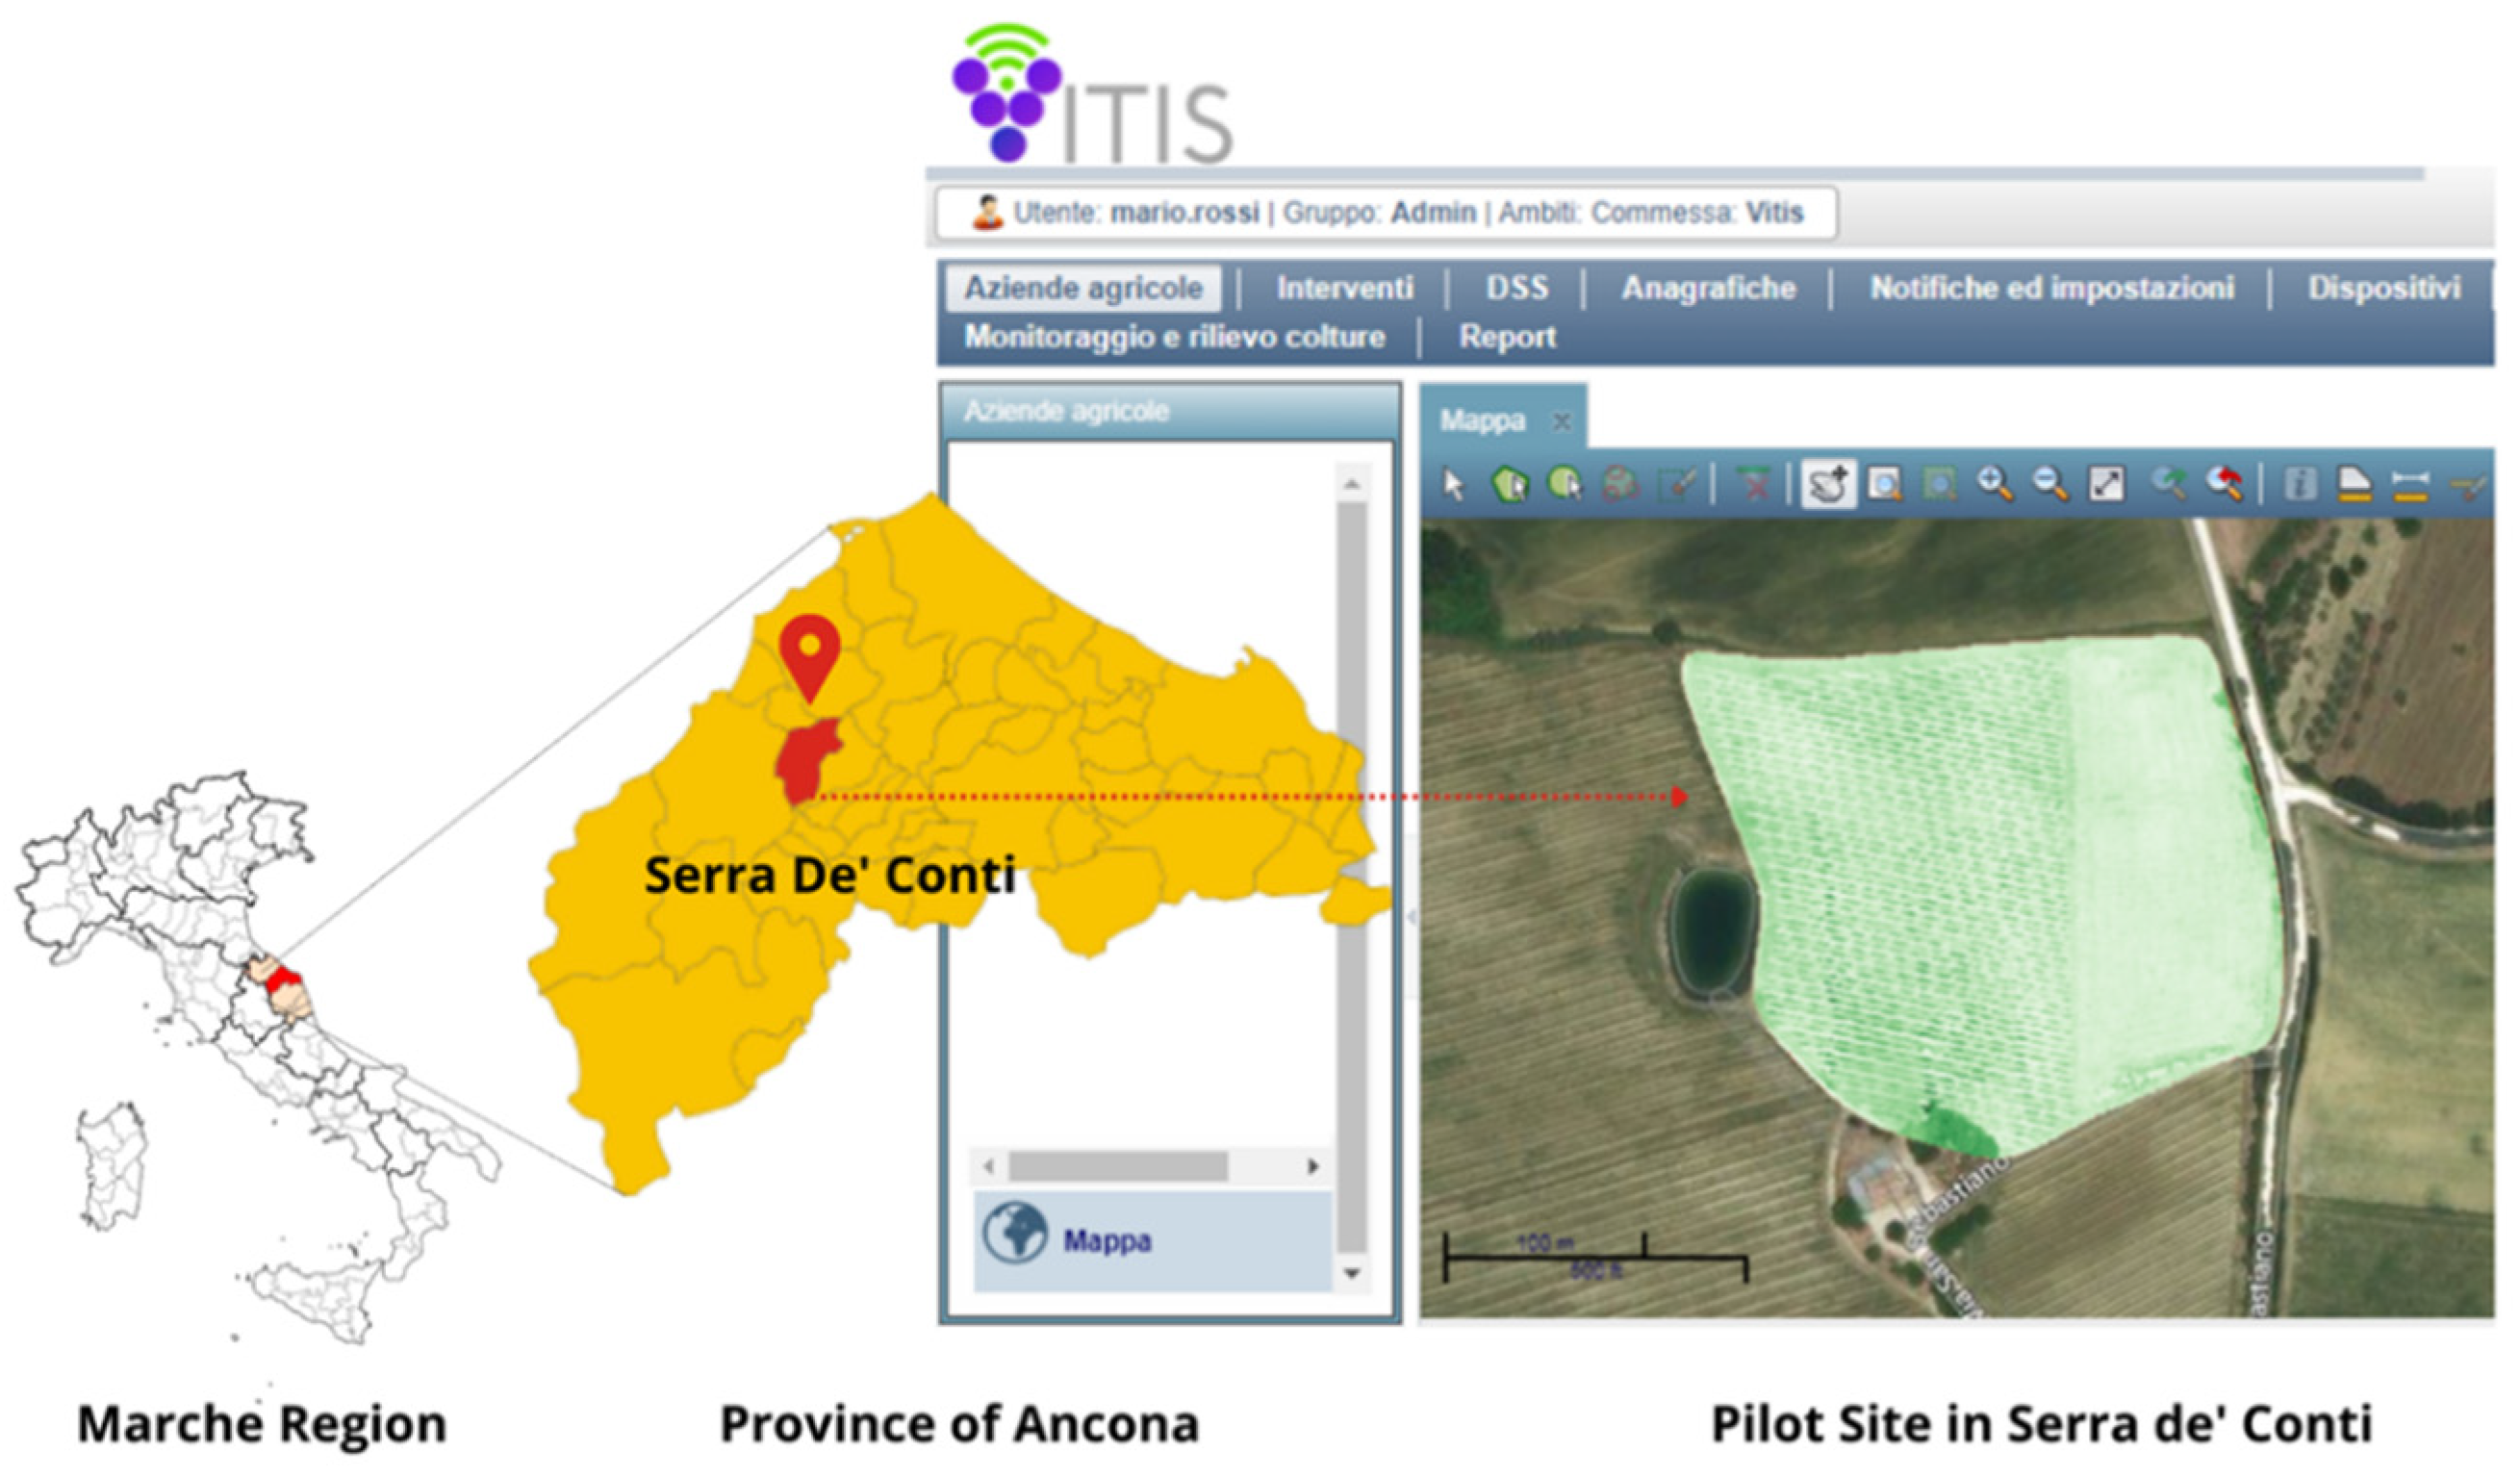
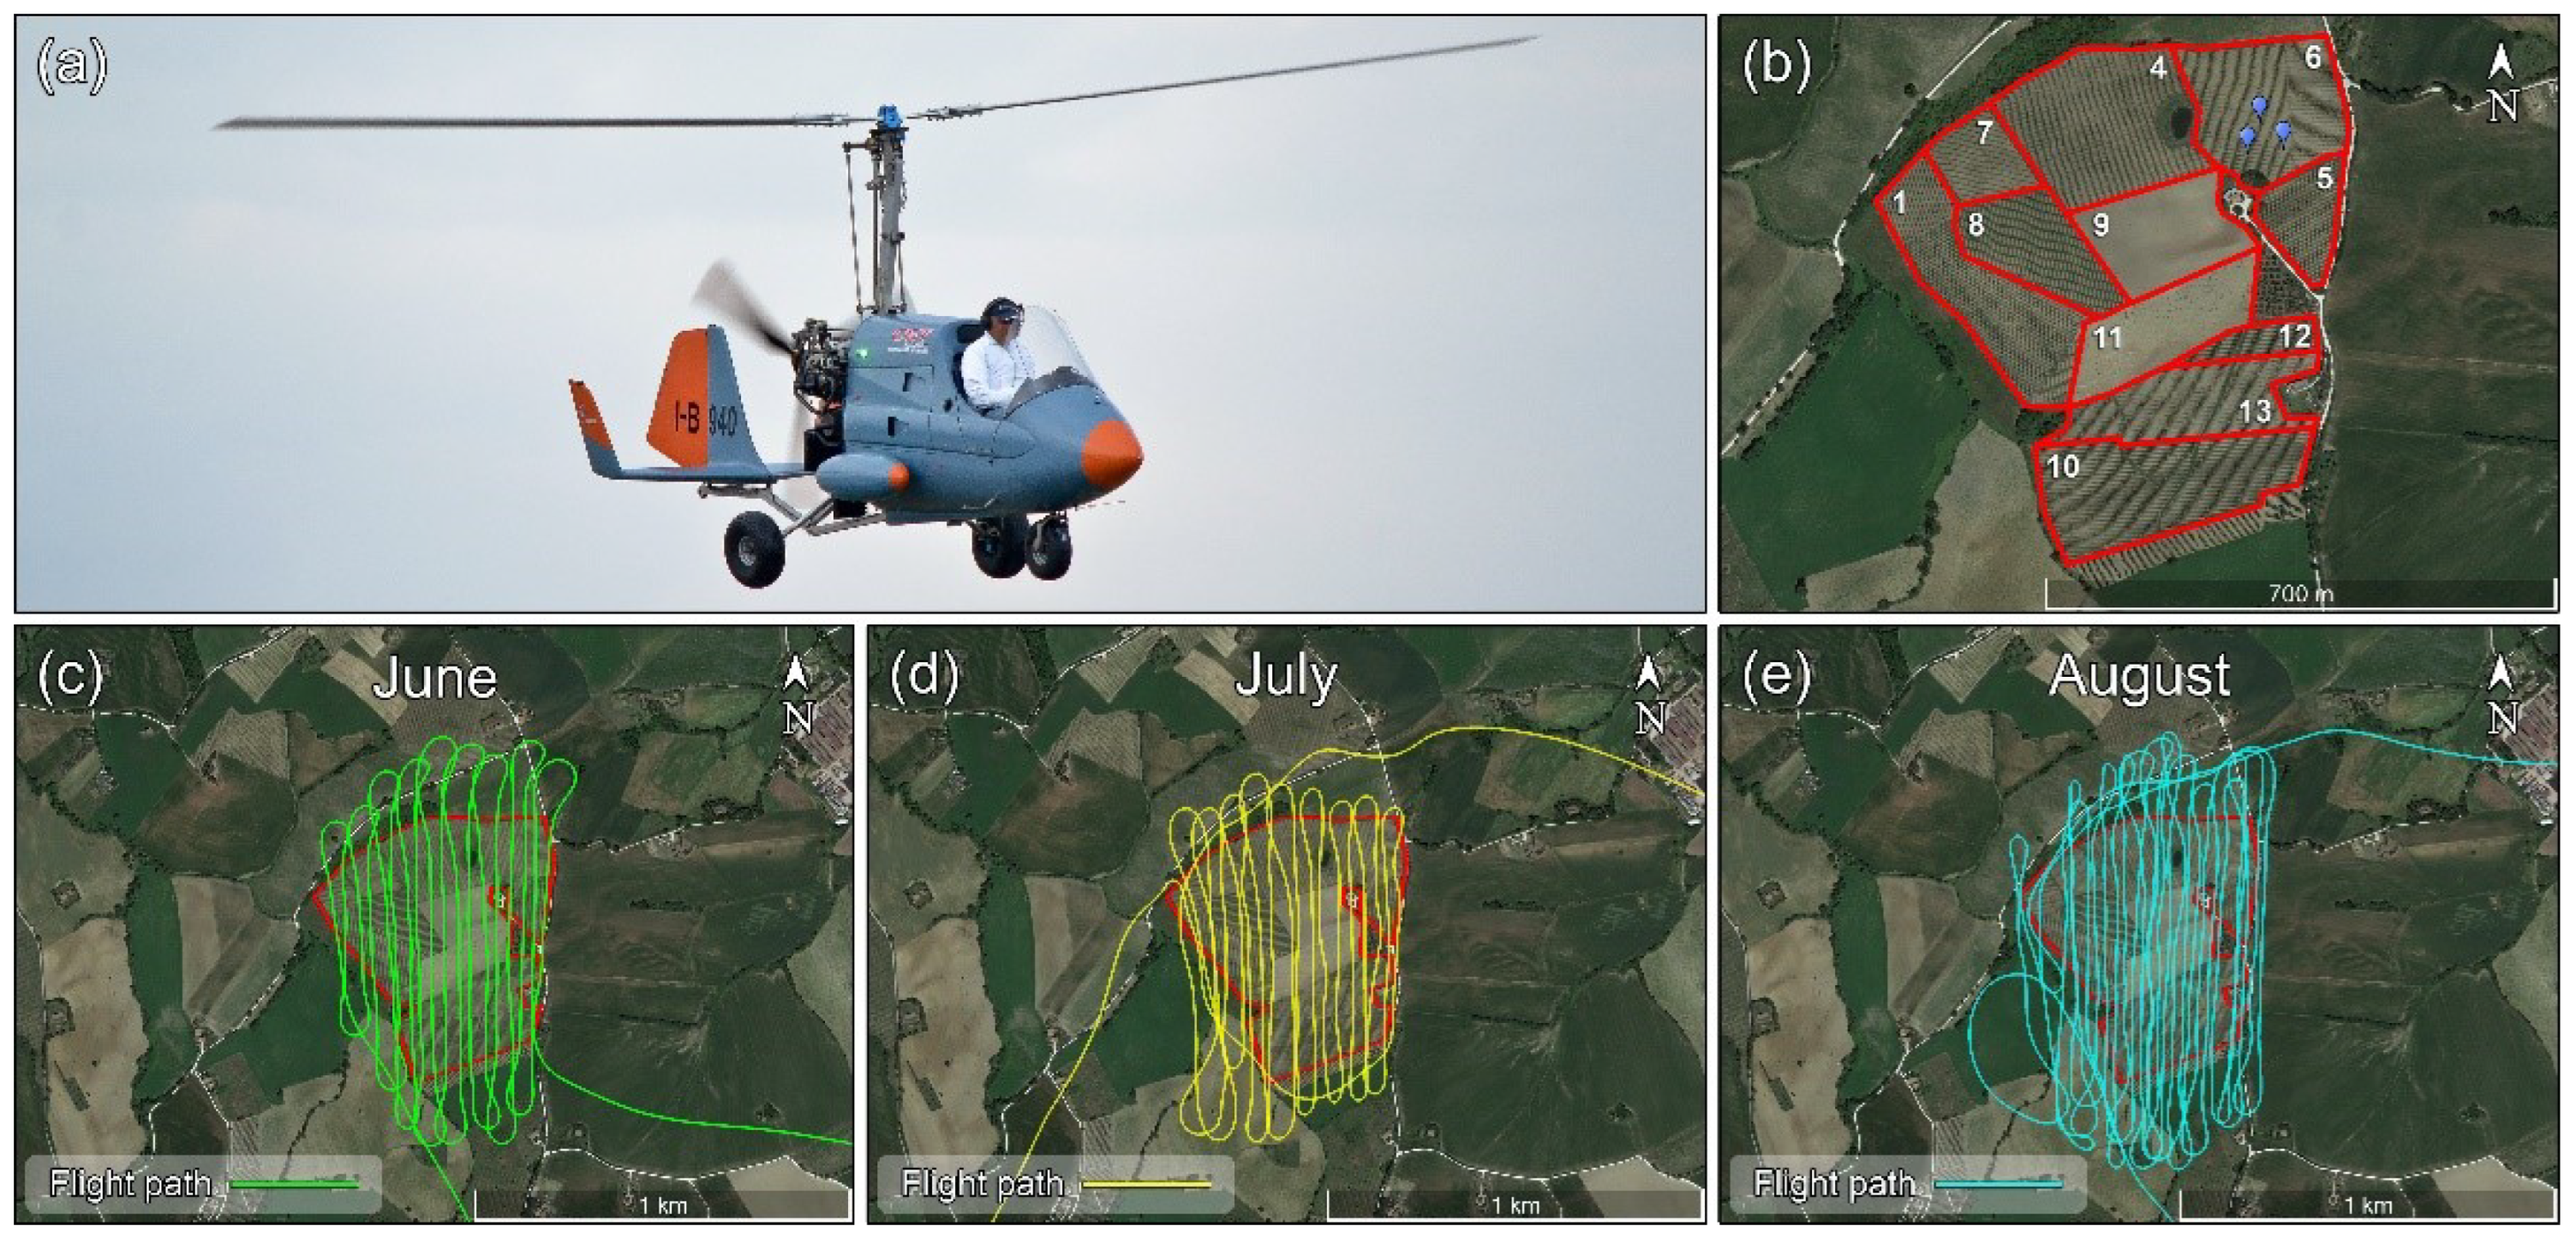
An accurate estimation of the grapevine water status is required to optimize water management in vineyards. In this section, new technologies for water monitoring in vineyards, including proximal and remote sensing and a prototype of a digital platform, will be briefly described. Because of the increasing water deficits occurring due to climate change and a decrease not only in the quality and the yield of vineyards but also in the profitability and sustainability of wine production, an economic analysis is needed. Thus, this section also provides a description of useful economic indicators.

2.1. Study Area

The case study winery is located in the Marche Region (Central Italy) near the municipality of Serra De’ Conti (43°33′19″ N, 13°03′36″ E, 175 m a.s.l.) and extends for about 30 ha (Figure 1). The area is devoted exclusively to Verdicchio grapes under organic management. The vine is grown according to the simple Guyot method, with an average yield of 100–110 q/ha. From the pedological point of view, the surrounding area is characterized by calcaric regosols, while the vineyard is located in a silt–clay soil (42% clay, 43% silt). Average measured water content parameters for the specific pilot vineyard are: field capacity 550 mm; available water 225 mm; and wilting point 125 mm. Currently, the vineyard does not have an irrigation system; however, due to climate change, which has led to water stress in 2007, 2011, 2017, and 2018, the winery is deciding to implement an irrigation system as well as for the neighboring plots.
For the purpose of the study, the trial was carried out on a plot of about 3.3 ha particularly sensitive to water stress.

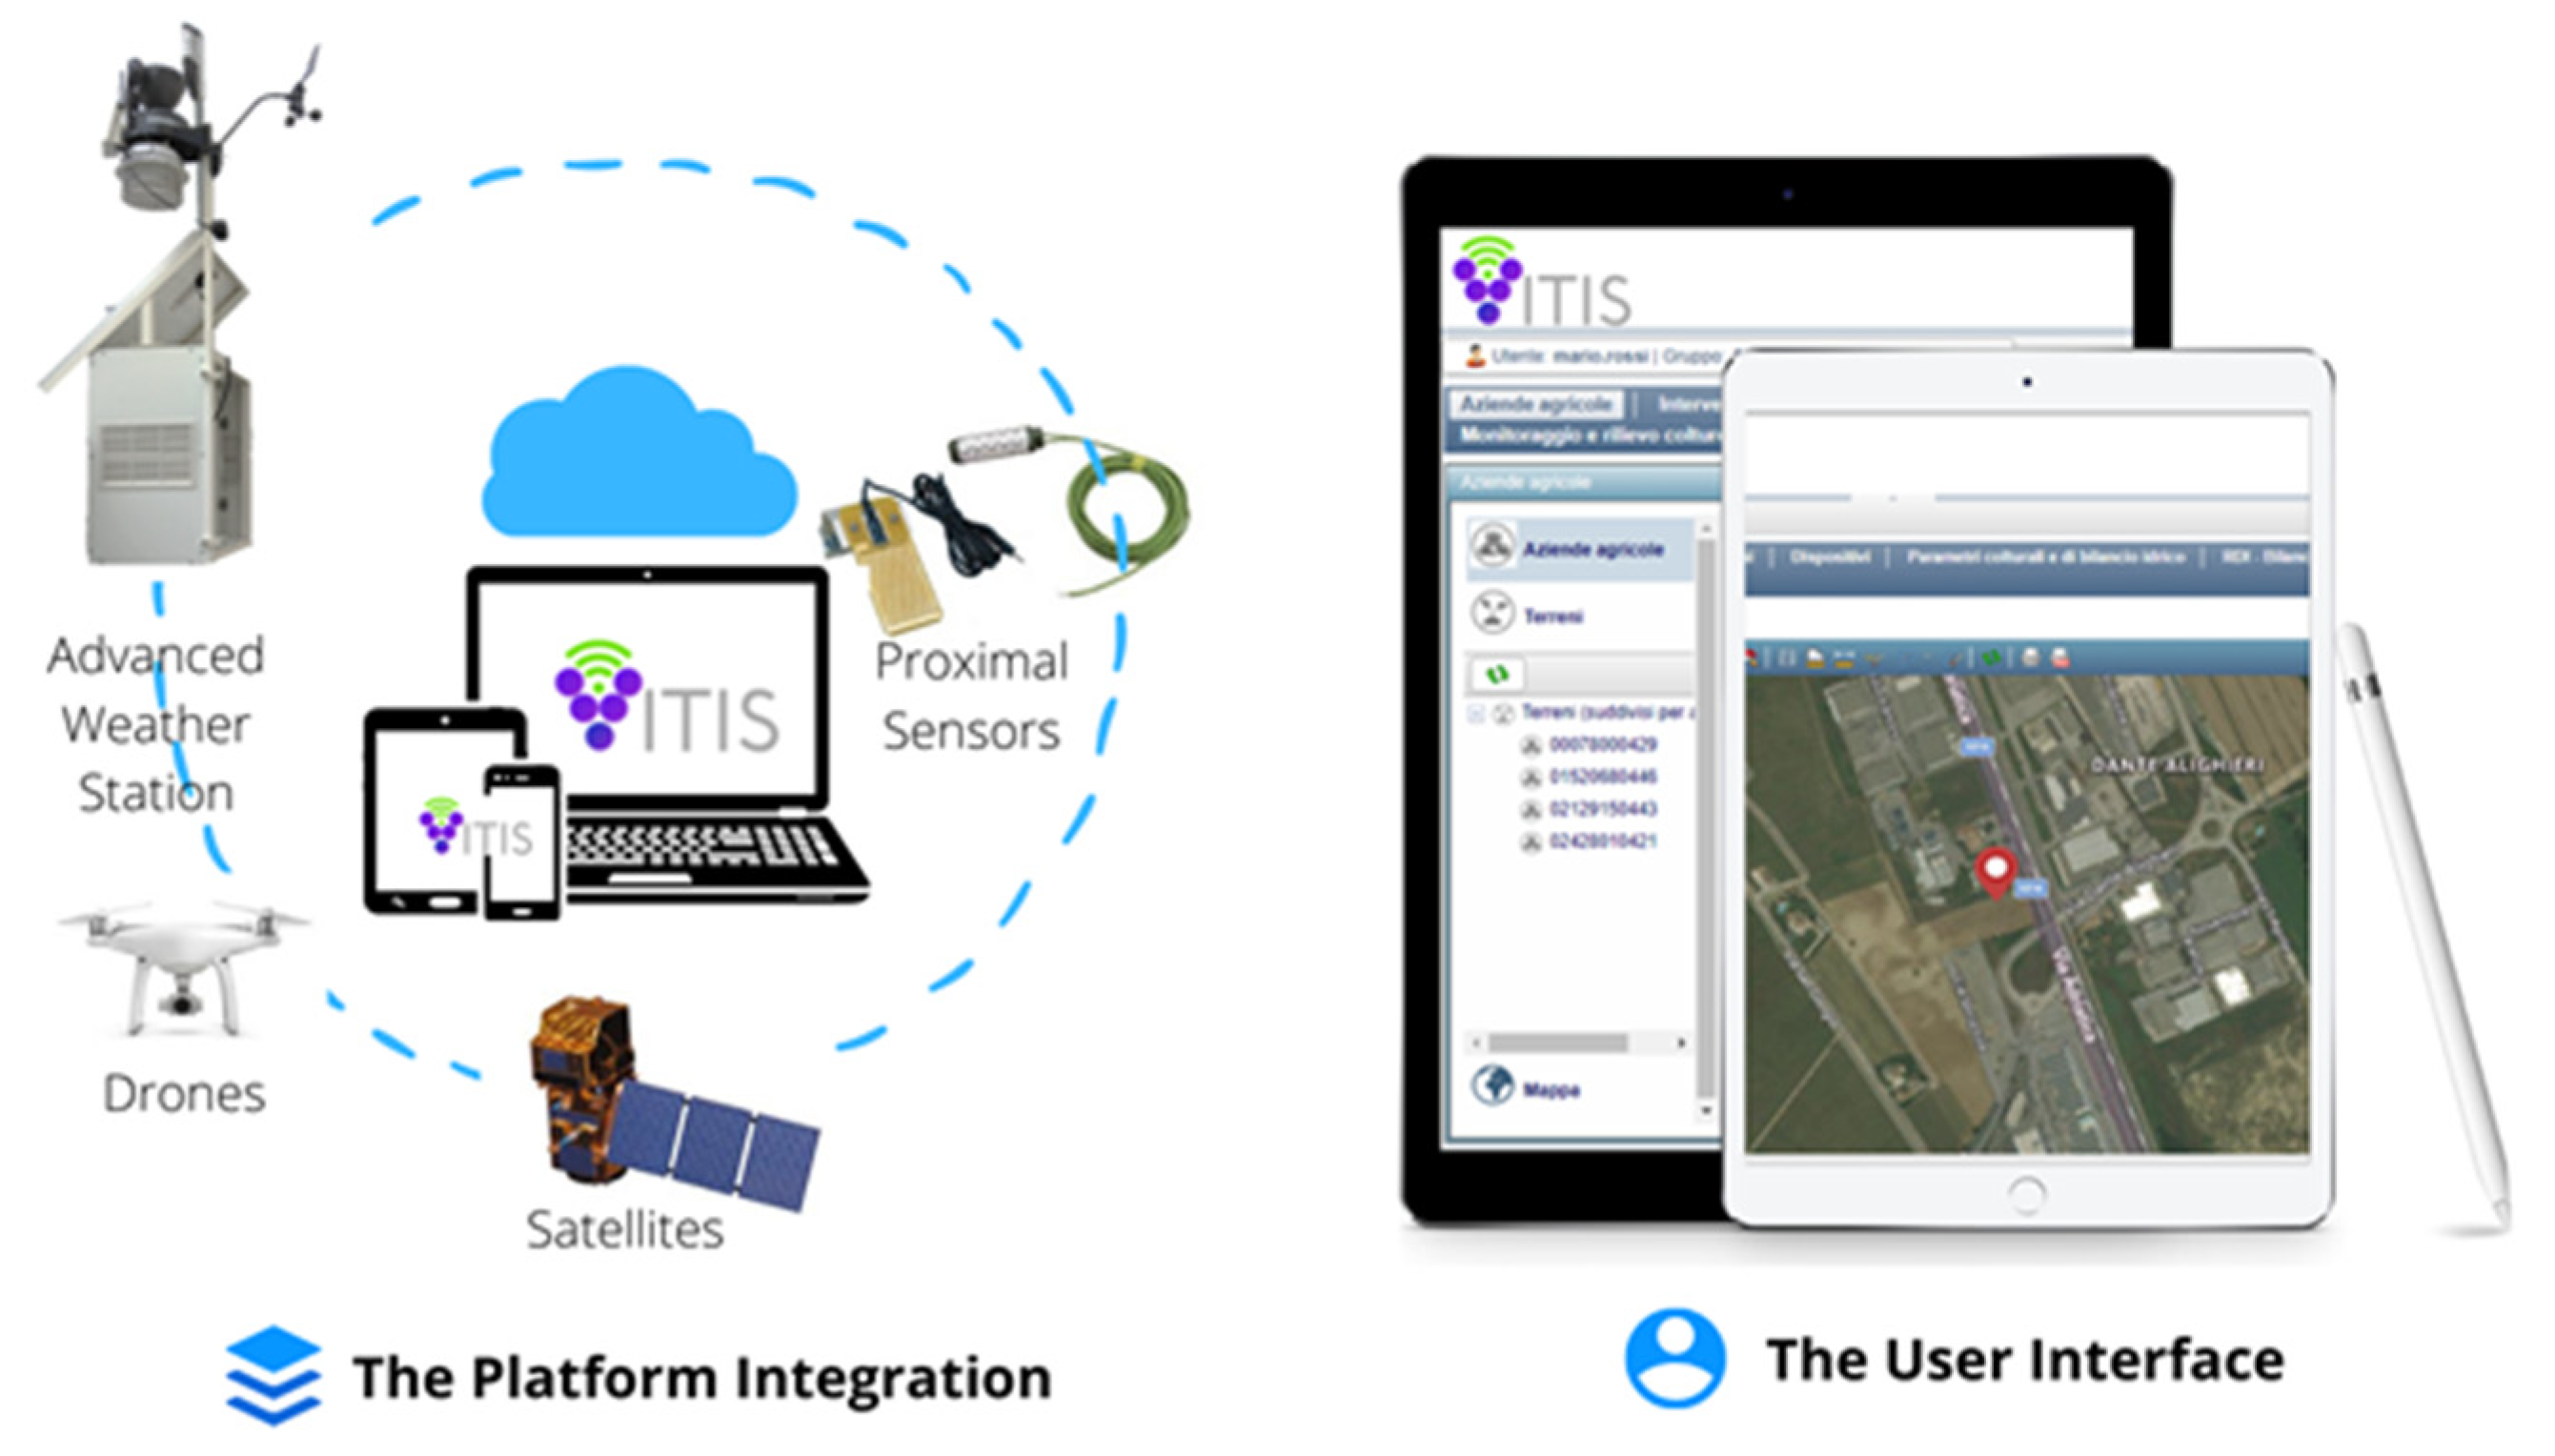
2.2. The Smart Vitis Platform Prototype

The Smart Vitis Platform, developed by Evolvea, established an IoT-based smart platform for the management of infield parameters, such as the vegetative growth and soil features for vineyards, i.e., the estimation of soil water content, an important aspect for vineyards to obtain high-quality production. In Precision Agriculture (PA), it is mandatory to have a Decision Support System that must cover some basic features: (i) obtain data from multiple data streams and save them in a unique archive prior to application of data fusion and analysis; (ii) show georeferenced (map) data and apply spatial queries; (iii) show information of multiple data and map layers; and (iv) identify correlations also using visual utilities and design shapes and patterns to support scheduling of operation tasks. Based on these premises, the project developed a Smart IoT Platform meeting the following requirements:
  • Cloud-ready: docker container, self-contained independent modules, micro service architecture, API Rest, http/https, and kubernetes;
  • Enterprise class: vertical and horizontal scalability, ESB, HA Ready, Hadoop, Cassandra, GraphDB, EDMS: Alfresco + Activiti, and Rule Engine;
  • Open: Java, html5, css, jscript, and S.O. linux;
  • Secure: Saml—OAuth2, centralized identity provider for UI, API Rest, and MQTT;
  • Multitenant: integrates by design multitenancy and data isolation;
  • Standard: language, protocols, integration patterns—Rest, MQTT, AMQP, OGC, and SOA;
  • Extensible: definition of module interfaces that can be developed by partners and plugged in, integrated with Industrial Electronic devices Modbus, EtherNet-IP, and TwinCat;
  • Robust: integrated IaaS real-time monitoring, HA proxy, and clusters;
  • Simple: Configuration drawing graphs, widgets, bundles in solution marketplace for a quick deploy, and wizard.
The Vitis Platform is an innovative system for global integration, standardization, and processing of big data extracted from different data sources (Figure 2):
  • External data sources (i.e., weather station data networks, time-series satellite data archive, and water supply management networks, …);
  • Data acquired in real time from distributed smart sensors (drones, smart electronic leaf, …) through intelligent networks (wireless battery-powered smart networks);
  • Precision farming tools and agricultural smart vehicles;
  • Business management software (i.e., field books and crop data management registries and databases).
The processing capacity of the Smart Vitis platform allows for a proactive monitoring thanks to the implementation of intelligent predictive algorithms and logics; the development of forecast risk scenarios, analysis, reporting and control dashboards; and the generation of alerts, warnings, and risk bulletins.
As for the project objective of vineyard water monitoring, the platform can integrate a long-term vineyard block map and cadastral data attributes (vine type, variety, form, density, …), season data (weather and soil sensor data, operations, and phenology), field-scouting data and photos, and remotely-sensed survey map data. All of the season’s data and sensor measurements are stored for detailed assessment by advanced users, while summary reports and aggregate indicators and alerts are extracted for entry-level users. Maps in raster format (e.g., vegetation indices, soil variability, multispectral image stacks, …) can be loaded and overlaid to field borders and sensor data.
Moreover, the platform is able to show subarea delimitation: field subareas can be identified in vineyards in the presence of soil, canopy (vigor), temperature, or other variability. Remotely-sensed data types for the project included multiple forms of remotely-sensed, high-resolution, multiband images that were acquired and tested for intra-and-inter-block variability and discrimination of canopy. Once identified, subareas can be useful for different applications, e.g., to support selective harvesting; for differential application of inputs and management practices; to improve vineyard homogeneity; to reduce or maintain production costs; and for strategic field sampling, vineyard design, or experimentation (Figure 3).
The specific application aims of the prototype, though, were the calculation of irrigation parameters and water availability monitoring. In addition to soil water content sensors, a specific index (Crop Water Stress Index—CWSI) was calculated from thermal imaging to show water stress distribution in pilot fields (see Section 3.2). Moreover, in vivo biosensors were used in specific sample rows for continuous monitoring of vineyard health and water status (see Section 3.3).
For each subzone mapped in the platform, customizable functions are available to calculate site-specific and full-season dynamic water requirements. The water requirement calculation equation is based on potential evapotranspiration (Etp) and crop evapotranspiration (ETc), using both local weather station data or regional weather and climate grid data, with adjustments for crop coefficient (Kc). The coefficients applied are varied according to season phase and crop phenology [31,32,33], while different soil texture parameters can be adjusted for each subarea in functions of water balance (Figure 4). Subareas can be delimited by users on the integrated web–gis interface, according to interpretation of field variability shown in remotely-sensed index maps or adjusted, for instance, according to existing or forecasted drip line layouts.
In addition to reading Etp and ETc data grouped for different time intervals, users can trigger a preset function to calculate estimated water balance parameters on a daily basis for each field subarea. Water availability (or deficit) maps are provided as a result. Real-time data of soil water content from multilevel sensors are also shown, providing ground proofing for estimated water availability or ETc.
Users can also input irrigation volumes in the balance calculation and assess the effect of irrigation with real-time water content levels from sensor data. As an alternative, users can simulate the effects of different levels of irrigation on the overall water balance, even defining a specific section of the field for such simulation. Soil, canopy, or crop variability and irrigation line layouts can also be considered for subarea delimitation. All sensor measurements are accessible for detailed assessment, and water stress alerts are produced and stored throughout the season.
Since Reduced Deficit Irrigation (RDI) is, for various reasons, a common approach to irrigation in vineyards in the Mediterranean climate, in addition to the irrigation volume needed to reach full soil capacity, the system also automatically calculates two different levels of suboptimal RDI volumes (40% and 70%). Field scouting and field survey data are also stored and allow for a comparison of sensor data with actual plant conditions.
To further acquire information toward a fine tuning of water needs, an in vivo experimental sensor named Bioristor was used to monitor in real time continuously and directly the real amount of water needed by the plants to maintain a correct health status. Although not yet integrated in the Smart Vitis platform, the Bioristor output suggests useful information on the dynamics of water use in grapevines during growth, development, and production.

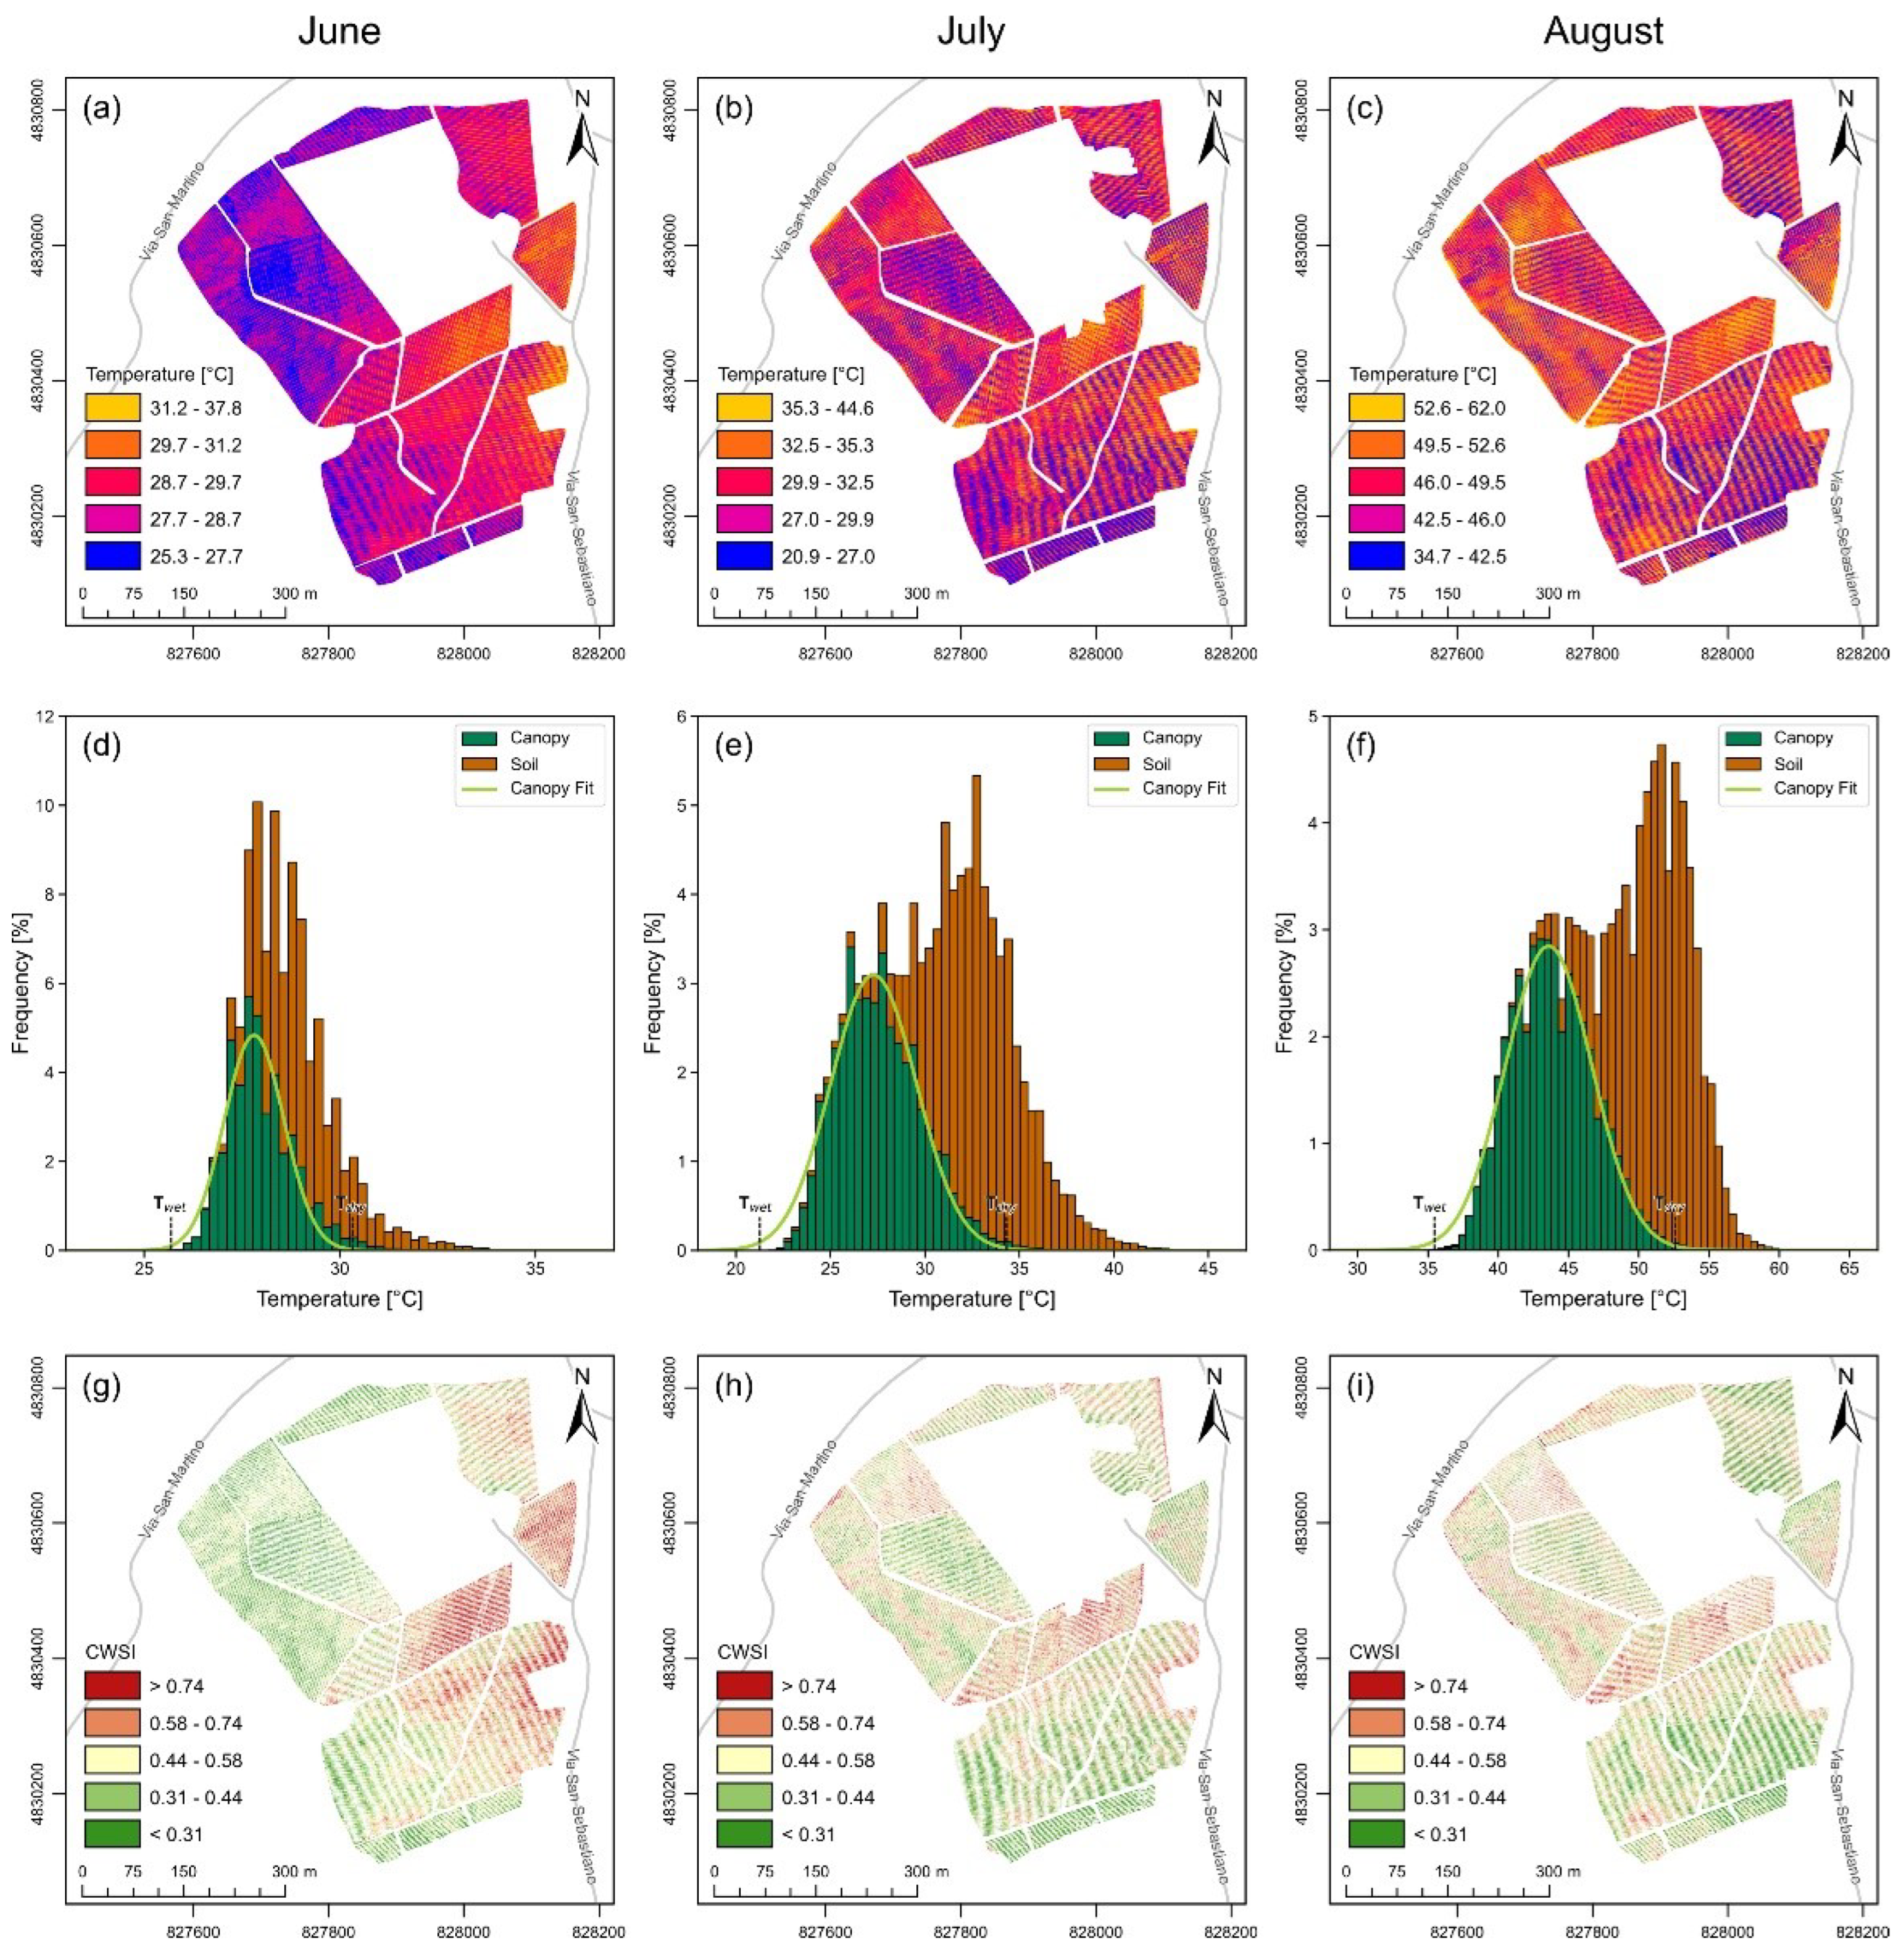
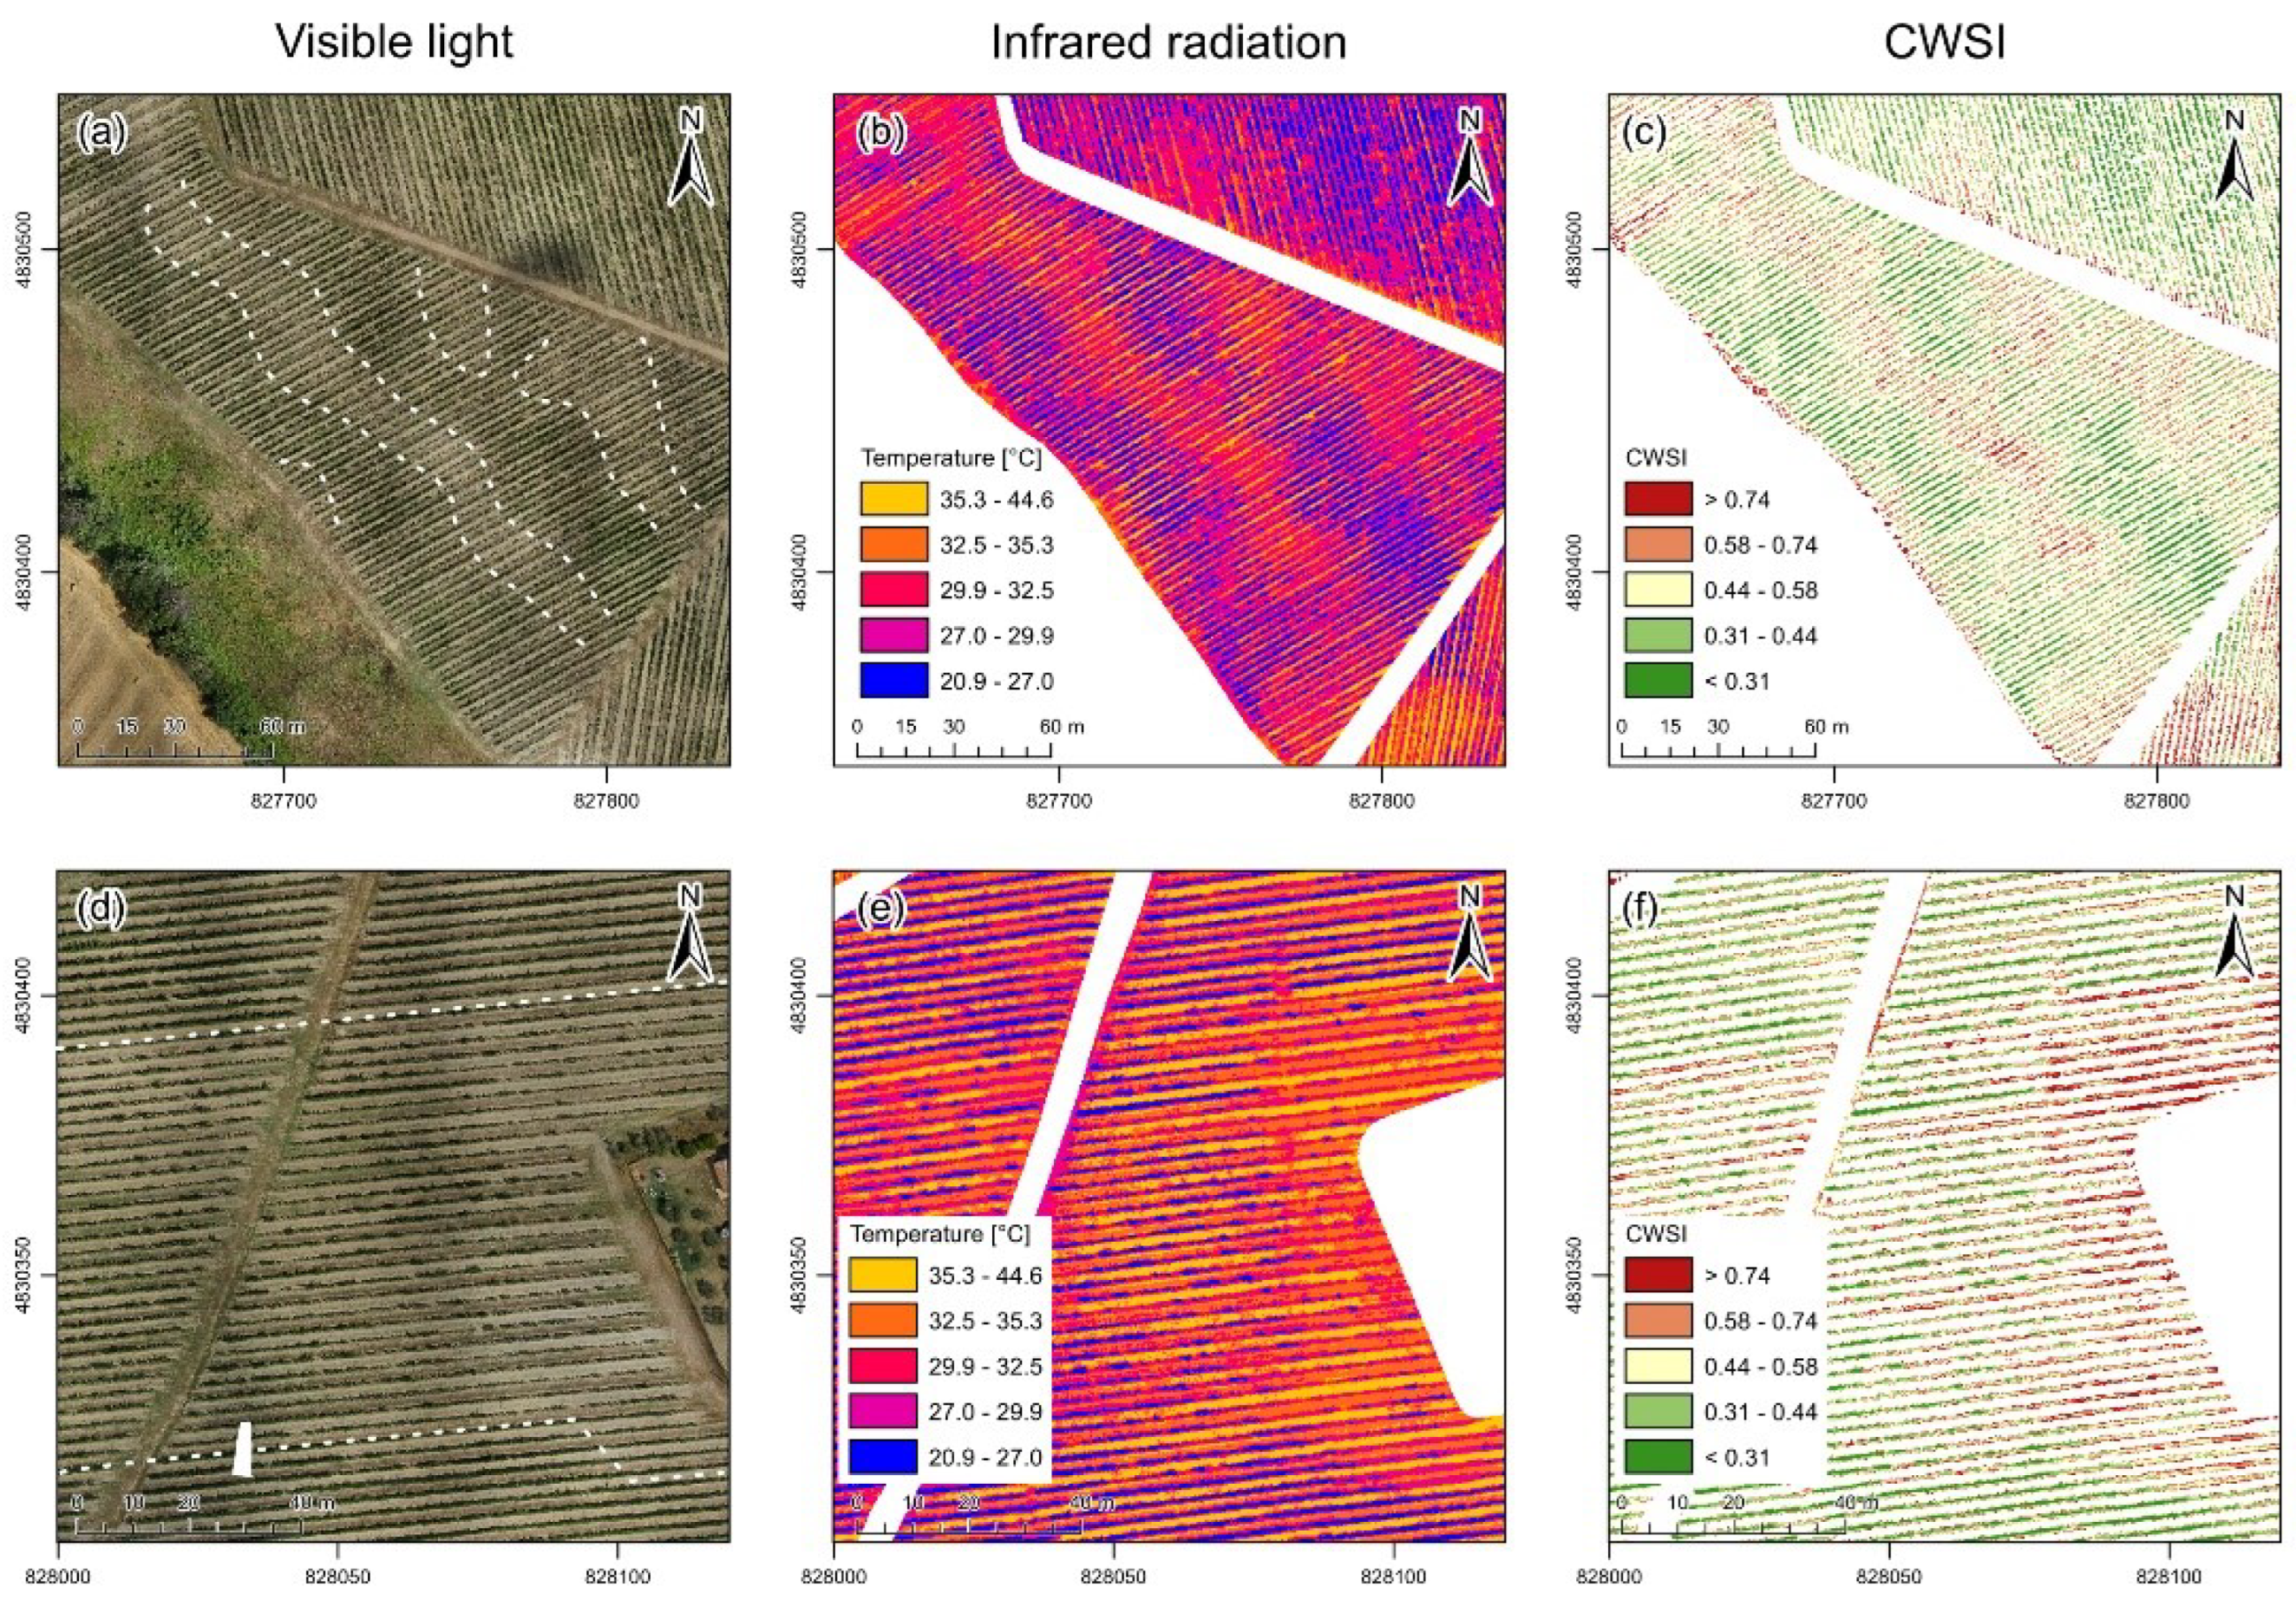
2.3. Aerial Thermal Imagery and Crop Water Stress Index

Nowadays, monitoring the hydric stress status is a key practice in vineyards. Plant water stress can be linked to thermal measurements since the stomatal opening of leaves is adapted to control the transpiration rate and consequently leads to variations in canopy temperature [34]. Three airborne thermal surveys were performed in the 2021 season during the phenological phases of flowering (BBCH 69, 8 June), preveraison (BBCH 77, 5 July), and preripening (BBCH 83, 20 August) (Figure 5c–e). Each survey covered the entire study area (Figure 5b) in less than 30 min using the Radgyro (Figure 5a), an experimental aircraft equipped with a rugged pc to remotely control a wide range of mounted sensors and cameras [35].
Thermal data were acquired by a short-wave infrared camera (OPTRIS Pi 450) with an optical resolution of 382 × 288 pixels, a focal length of 8 mm, a spectral range of 7500–13,000 nm, and a thermal resolution of 0.04 °C. Simultaneous ancillary RGB images were also taken by a 24.3-megapixel Sony Alpha 7 RGB with a focal length of 35 mm. At ~100 m flight height, the ground field of view of the infrared camera was 119 × 90 m2. Flying at ~100 km/h with a framerate of 1 Hz, the longitudinal overlap of the thermal images of 70% allowed for an effective photogrammetric processing. The distance between the survey flight lines was planned to be less than 30 m, guaranteeing the same overlap in the transverse direction. The water stress levels were extracted from canopy temperature data using the CWSI [36], an environment normalized index defined as (Equation (1)):
CWSI = T c   T wet T dry   T wet
where Tc is the measured canopy temperature, Twet is the temperature of a wet reference leaf (non-stressed condition), and Tdry is the temperature of a dry reference leaf (completely stressed condition).

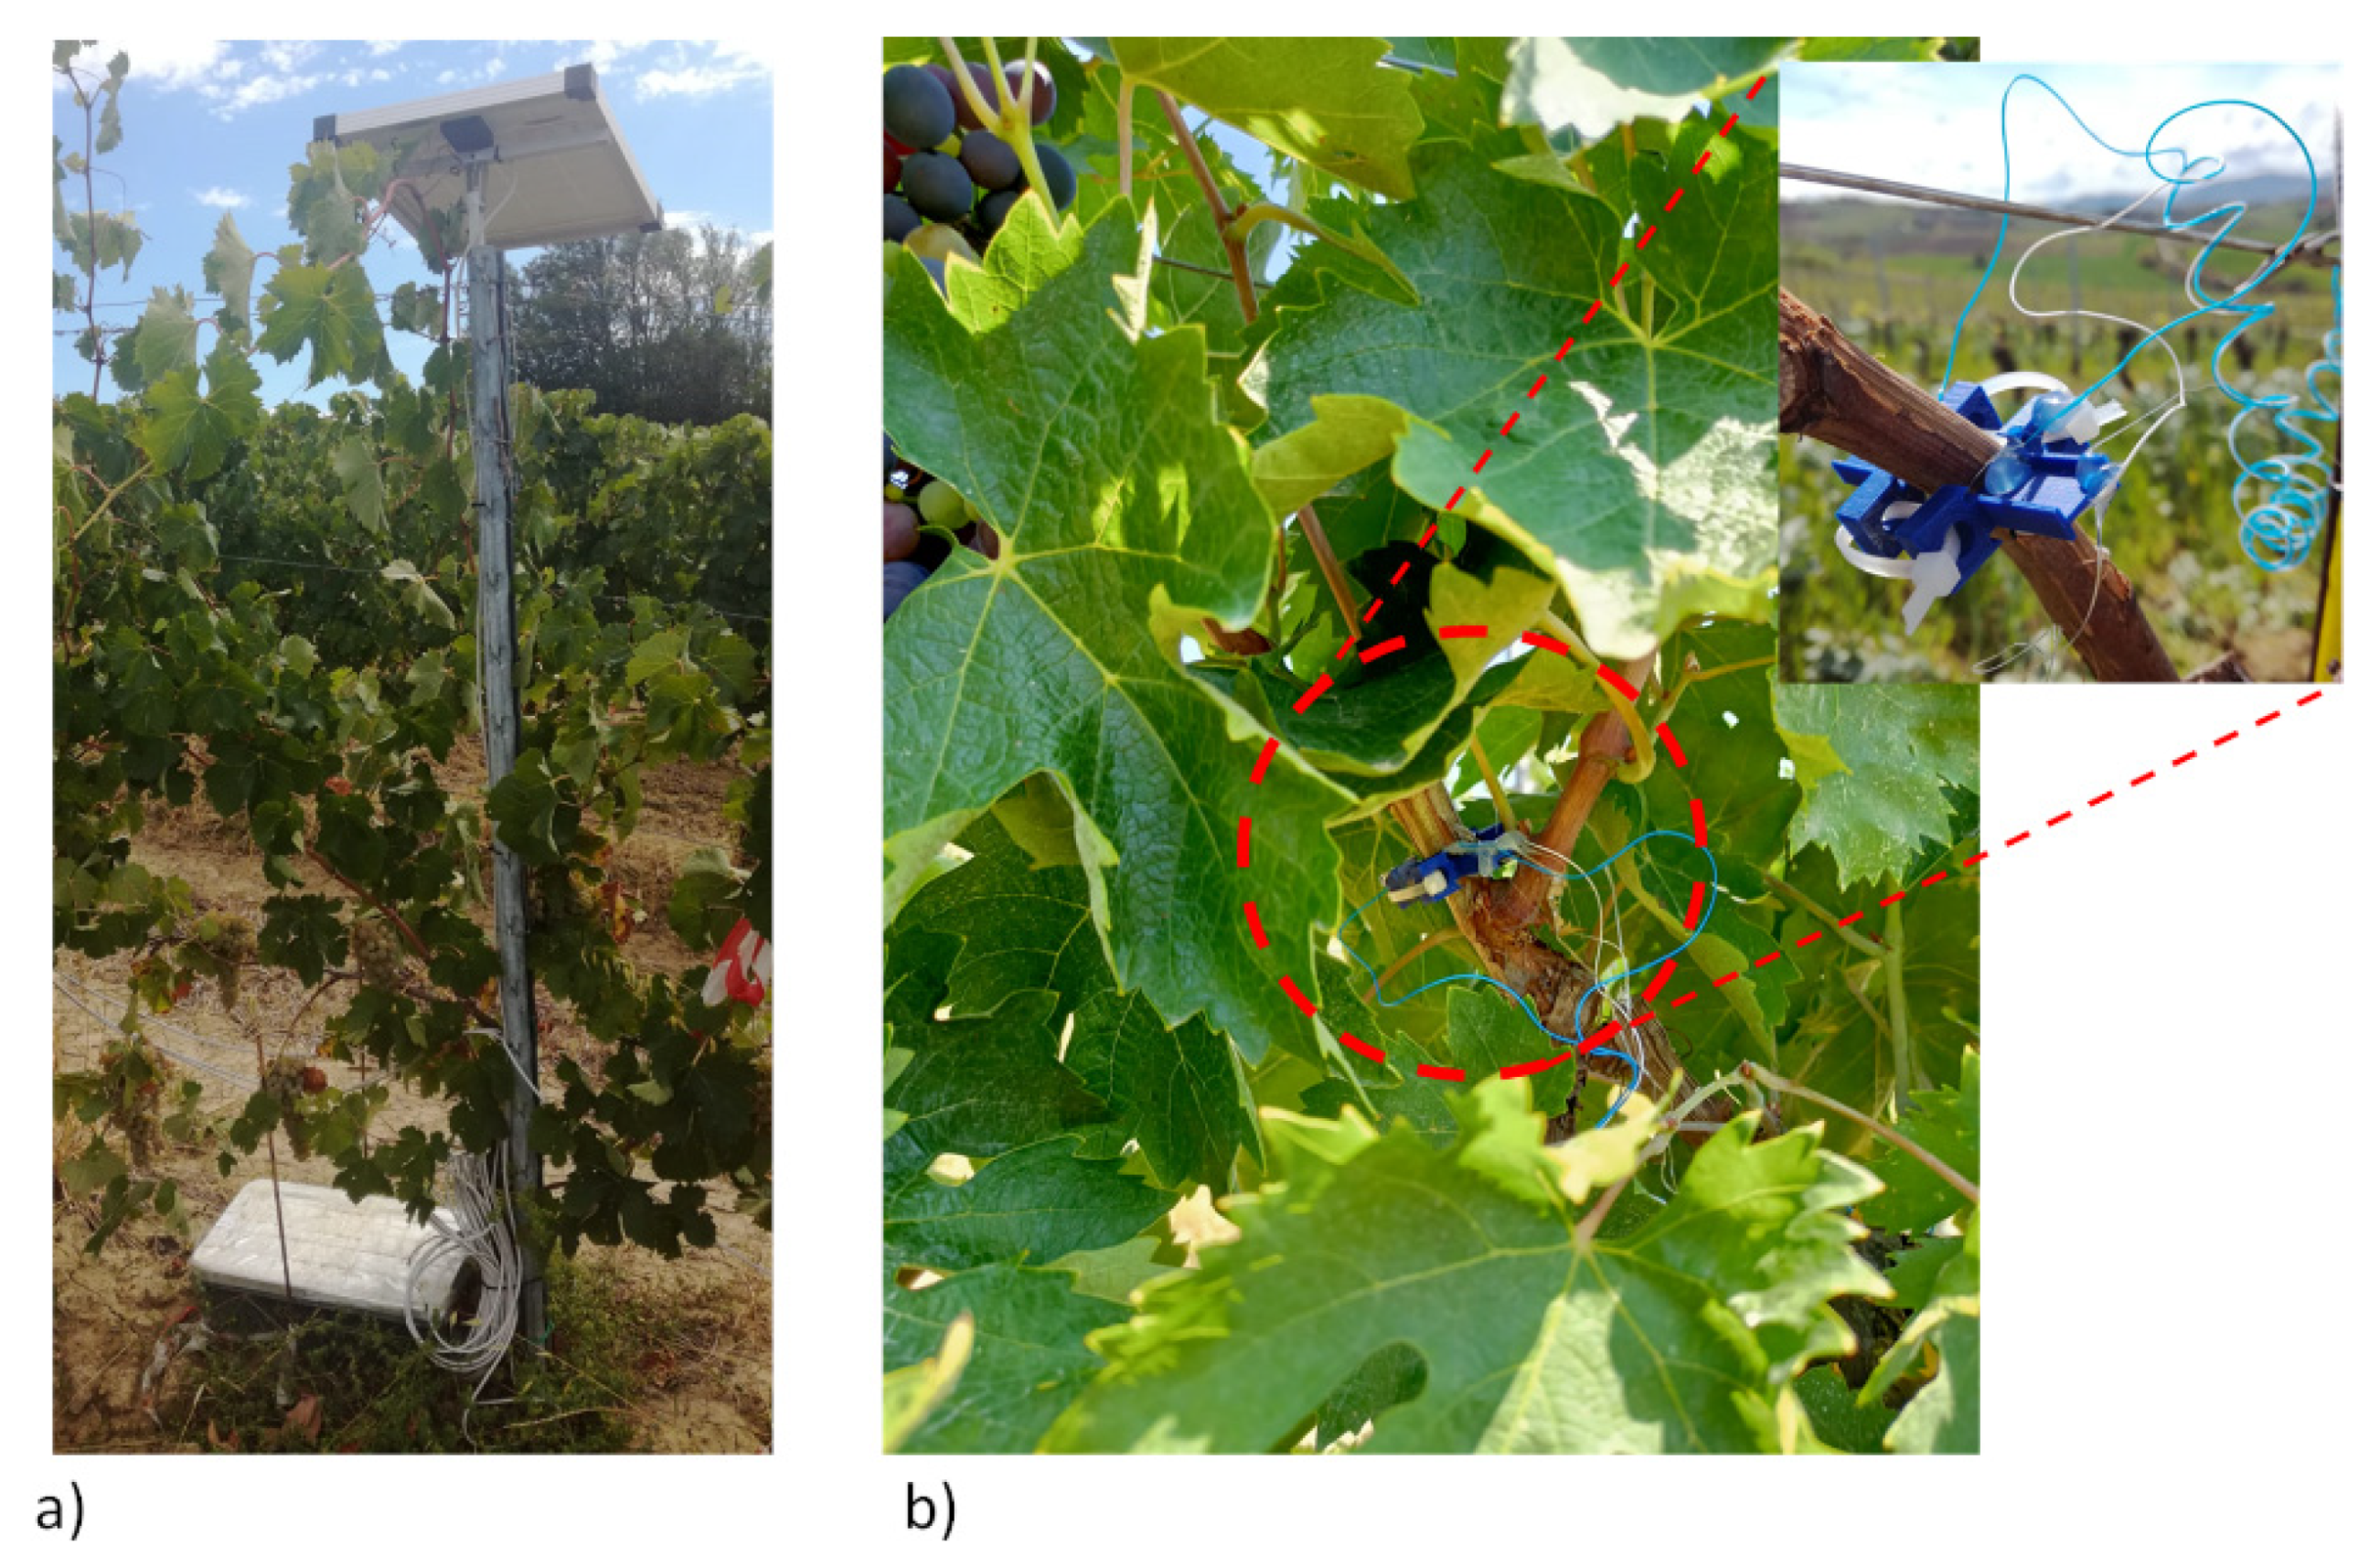
2.4. In Vivo Monitoring of Vines through Bioristor

Bioristor was prepared as described by Janni et al. (2019) [37]. Two textile fibers were treated by soaking for 5 min in aqueous poly (3,4-ethylenedioxythiophene) doped with polystyrene sulfonate (Clevios PH1000, Starck GmbH, Munich, Germany) after which a treatment with concentrated sulfuric acid (95%) was performed. Fibers were then baked at 130 °C for 45 min in three different steps. Finally, the whole process, from deposition to heat treatment, was repeated 3 times to complete the preparation. Before functionalization, each thread was cleaned by plasma–oxygen cleaner treatment (Femto, Diener electronic, Ebhausen/Germany) to increase its wettability and to facilitate the adhesion of the aqueous conductive polymer solution.
Bioristor was operated by applying a constant voltage (Vds = −0.1 V) across the main transistor channel, along with a positive voltage at the gate (Vg = 0.5 V), which led to a decrease in channel conductivity due to the cation pushed from the electrolyte into the channel; the resulting current (Ids) was monitored continuously.
The main parameter, the sensor response (R), proportional to the cations present in the electrolyte, was given by the expression (Equation (2)):
|Ids − Ids0|/Ids0
where Ids0 represented the current across the channel when Vg = 0.
The calculated R value was analyzed with MATLAB and Excel 2016 to smooth day/night oscillation.
To match soil water content data with Bioristor data, the water content in the depth ranged from 5 cm to 55 cm, sensed by Sentek multilevel probes, was collected in both pilot fields.
To acquire the Bioristor signal, an IoT control unit was developed through the Arduino DUE system and connected to a battery powered by a photovoltaic panel to ensure continuity of measurement. Bioristor data were saved locally on a micro-SD memory card and transferred to a remote cloud via 4G connection. This setup allowed for a maximization of the signal-to-noise ratio with customized electronic circuits to amplify Bioristor signals as well as local analysis of the raw data. Each unit reads up to 4 sensors.

2.5. Economic Indicators

The modification of production processes due to the climate variability and extreme events may lead to economic impacts for the wine sector [38]. Thus, the economic evaluation is crucial to ensure the present and future economic and environmental sustainability of the wine industry and of the vineyard crops. To achieve this goal, we performed a preliminary vineyard cost/benefit analysis to calculate certain economic indices. Since in the plot of the Vitis project irrigation had not yet been applied, but emergency irrigation had already been performed in neighboring plots, in the following part, a simulation of the impact of irrigation costs on the total costs incurred will be conducted in this study. In fact, given the rainfall reduction and the rising temperature, the company is planning for the next few years to carry out emergency irrigation also in the studied vineyard.
A comparison of yields, costs, and economic indices was performed over two years. In detail, vineyards potentially irrigated by supplemental irrigation in 2021 were compared with vines grown without irrigation in 2020. The costs related to irrigation refer to the real costs of the neighboring plot in which supplementary irrigation was carried out. All the data were collected with a questionnaire. In detail and in relation to the variable costs, we included expenses that the company incurred annually for cultivation operations. The expense items that make up the variable costs of the farm under study are listed below:
  • Pruning;
  • Branch removal;
  • Binding;
  • Green pruning;
  • Thinning;
  • Phytosanitary treatments;
  • Agricultural processing;
  • Fertilization and weeding;
  • Harvest;
  • Vineyard maintenance;
  • Machine maintenance;
  • Irrigation;
  • Other.
Each variable cost item is made up internally of the costs for labor, machinery (fuel and maintenance), and technical means in the operations that require it.
For the fixed costs, we included depreciation, administrative and management costs, overheads, and also costs related to irrigation, including systems maintenance and the water consortium tax. Finally, the production trends were evaluated to highlight the different effects of environmental conditions, cultivar, and cultivation technique. All these data collected were used to estimate both the Water Productivity (WP) and the Economic Water Productivity (EWP) indices. The combined evaluation of EWP and WP provides a detailed background for the assessment of the water use efficiency [39]. The WP, referred to as water use efficiency, can be defined as the relationship between crop output and the amount of water used in crop production. In detail, WP is the ratio between crop yield obtained (Ya) and water use expressed in kg m−3. In this paper, the WP is defined as follows (Equation (3)):
WP = Ya/Eta
Eta is the crop consumptive water use given by (Equation (4)):
Eta = P + I + C − R − D ± ΔS
where:
  • P = precipitation (mm);
  • I = irrigation water applied (mm);
  • C = upward capillary rise (mm);
  • R = Runoff (mm);
  • D = Deep percolation (mm);
  • ΔS = change in root zone soil moisture (mm).
WP is an important indicator that quantifies the effect of water management [40]. The implementation of suitable methods for early detection of crop water stress before irreversible damage to the crops occurs is vital to improve WP [41]. Indeed, a high WP may also result when a crop is water stressed. It is important to underline that the estimation of the components of ETa, as a major element in irrigation process and the driving factor in forming crop yield and WP, is not easy to perform; in this framework, PA that utilizes digital techniques can play a significant role. In this study, the water amount used by the crops was determined by computing actual evapotranspiration from remote and nonremote sensing approaches in real time and site-specific. An accurate estimation of the evapotranspiration is therefore crucial for a water-saving practice in viticulture. However, since the objective of the winegrower is to achieve high profit, it is therefore important to consider the economic issue related to the water productivity [42]. Thus, the concept of crop water productivity can refer to the actual yield or to its economic value. Replacing the numerator of Equation (3) with the monetary value of Ya, the EWP index can be calculated. The EWP was studied by Hellegers and Perry [43] and Immerzeel et al. [44]. It has lately gained attention in the context of Payment for Environmental Services (PES) [45]. In detail, EWP is the ratio between the profit produced by the crop along the growing season and the total amount of water consumed expressed as Eta (Equation (5)):
EWP = profit/Eta
The profit in the above equation is defined by multiplying beneficial biomass and the market price minus the variable and fixed costs, that is (Equation (6)):
Profit= (P ∗ Y − B ∗ Y − C)
where:
  • Y = Yield of crop (kg/ha);
  • P = Market price received for crop (EUR/kg);
  • B = Variable production cost of crop (EUR/kg);
  • C = Fixed production cost of crop (EUR/ha).
In the case of EWP < 0, the costs of production exceed the benefits of production. It is, however, important to note that the EWP is very sensitive to market prices that may vary and lead to a substantial increase in production due to market and supply and demand economics. This indicator is suitable for making decisions on the irrigation management of woody crops. In particular, it is especially useful for winegrowers who have to make decisions on how to manage irrigation in the most profitable way. A precise calculation of EWP, however, can only be performed at the end of the season when the revenue and costs are known. The revenue, in fact, is given by the yield market value, and for calculating the total costs, the fixed and variable costs should be known. This curtails the use of EWP for decision making on on-farm irrigation, since the economic assessment is performed before the start of the irrigation season. The assessment is particularly challenging when the yield value depends on quality, as is the case for many woody crops, and when the price of some of the inputs (e.g., energy) varies substantially from one season to another and even during the growing period [39].

3. Results and Discussion

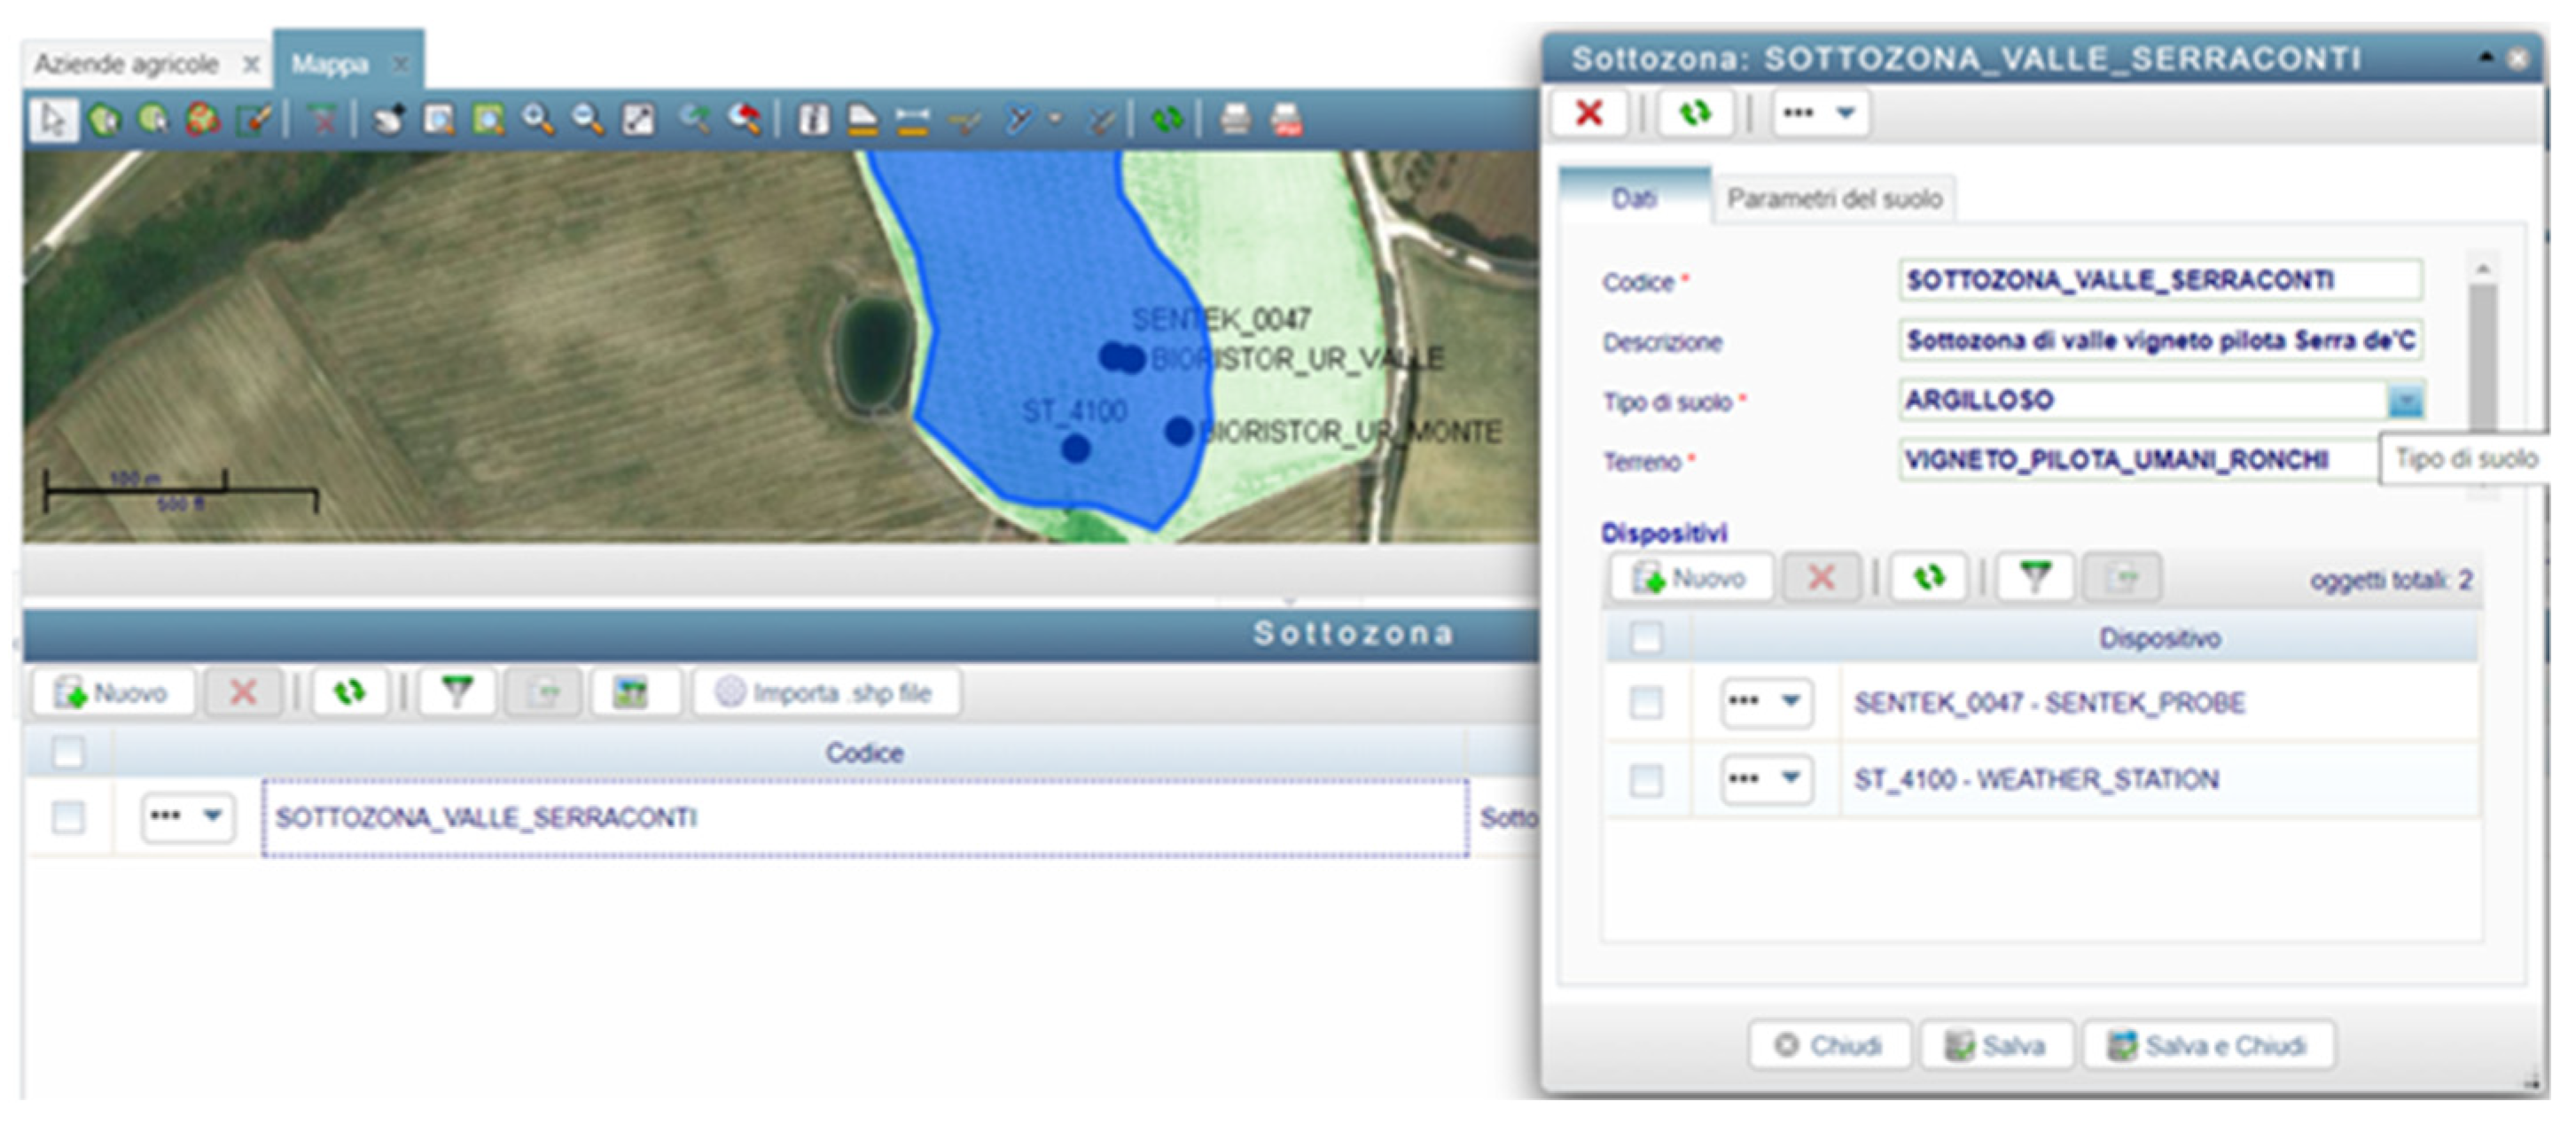
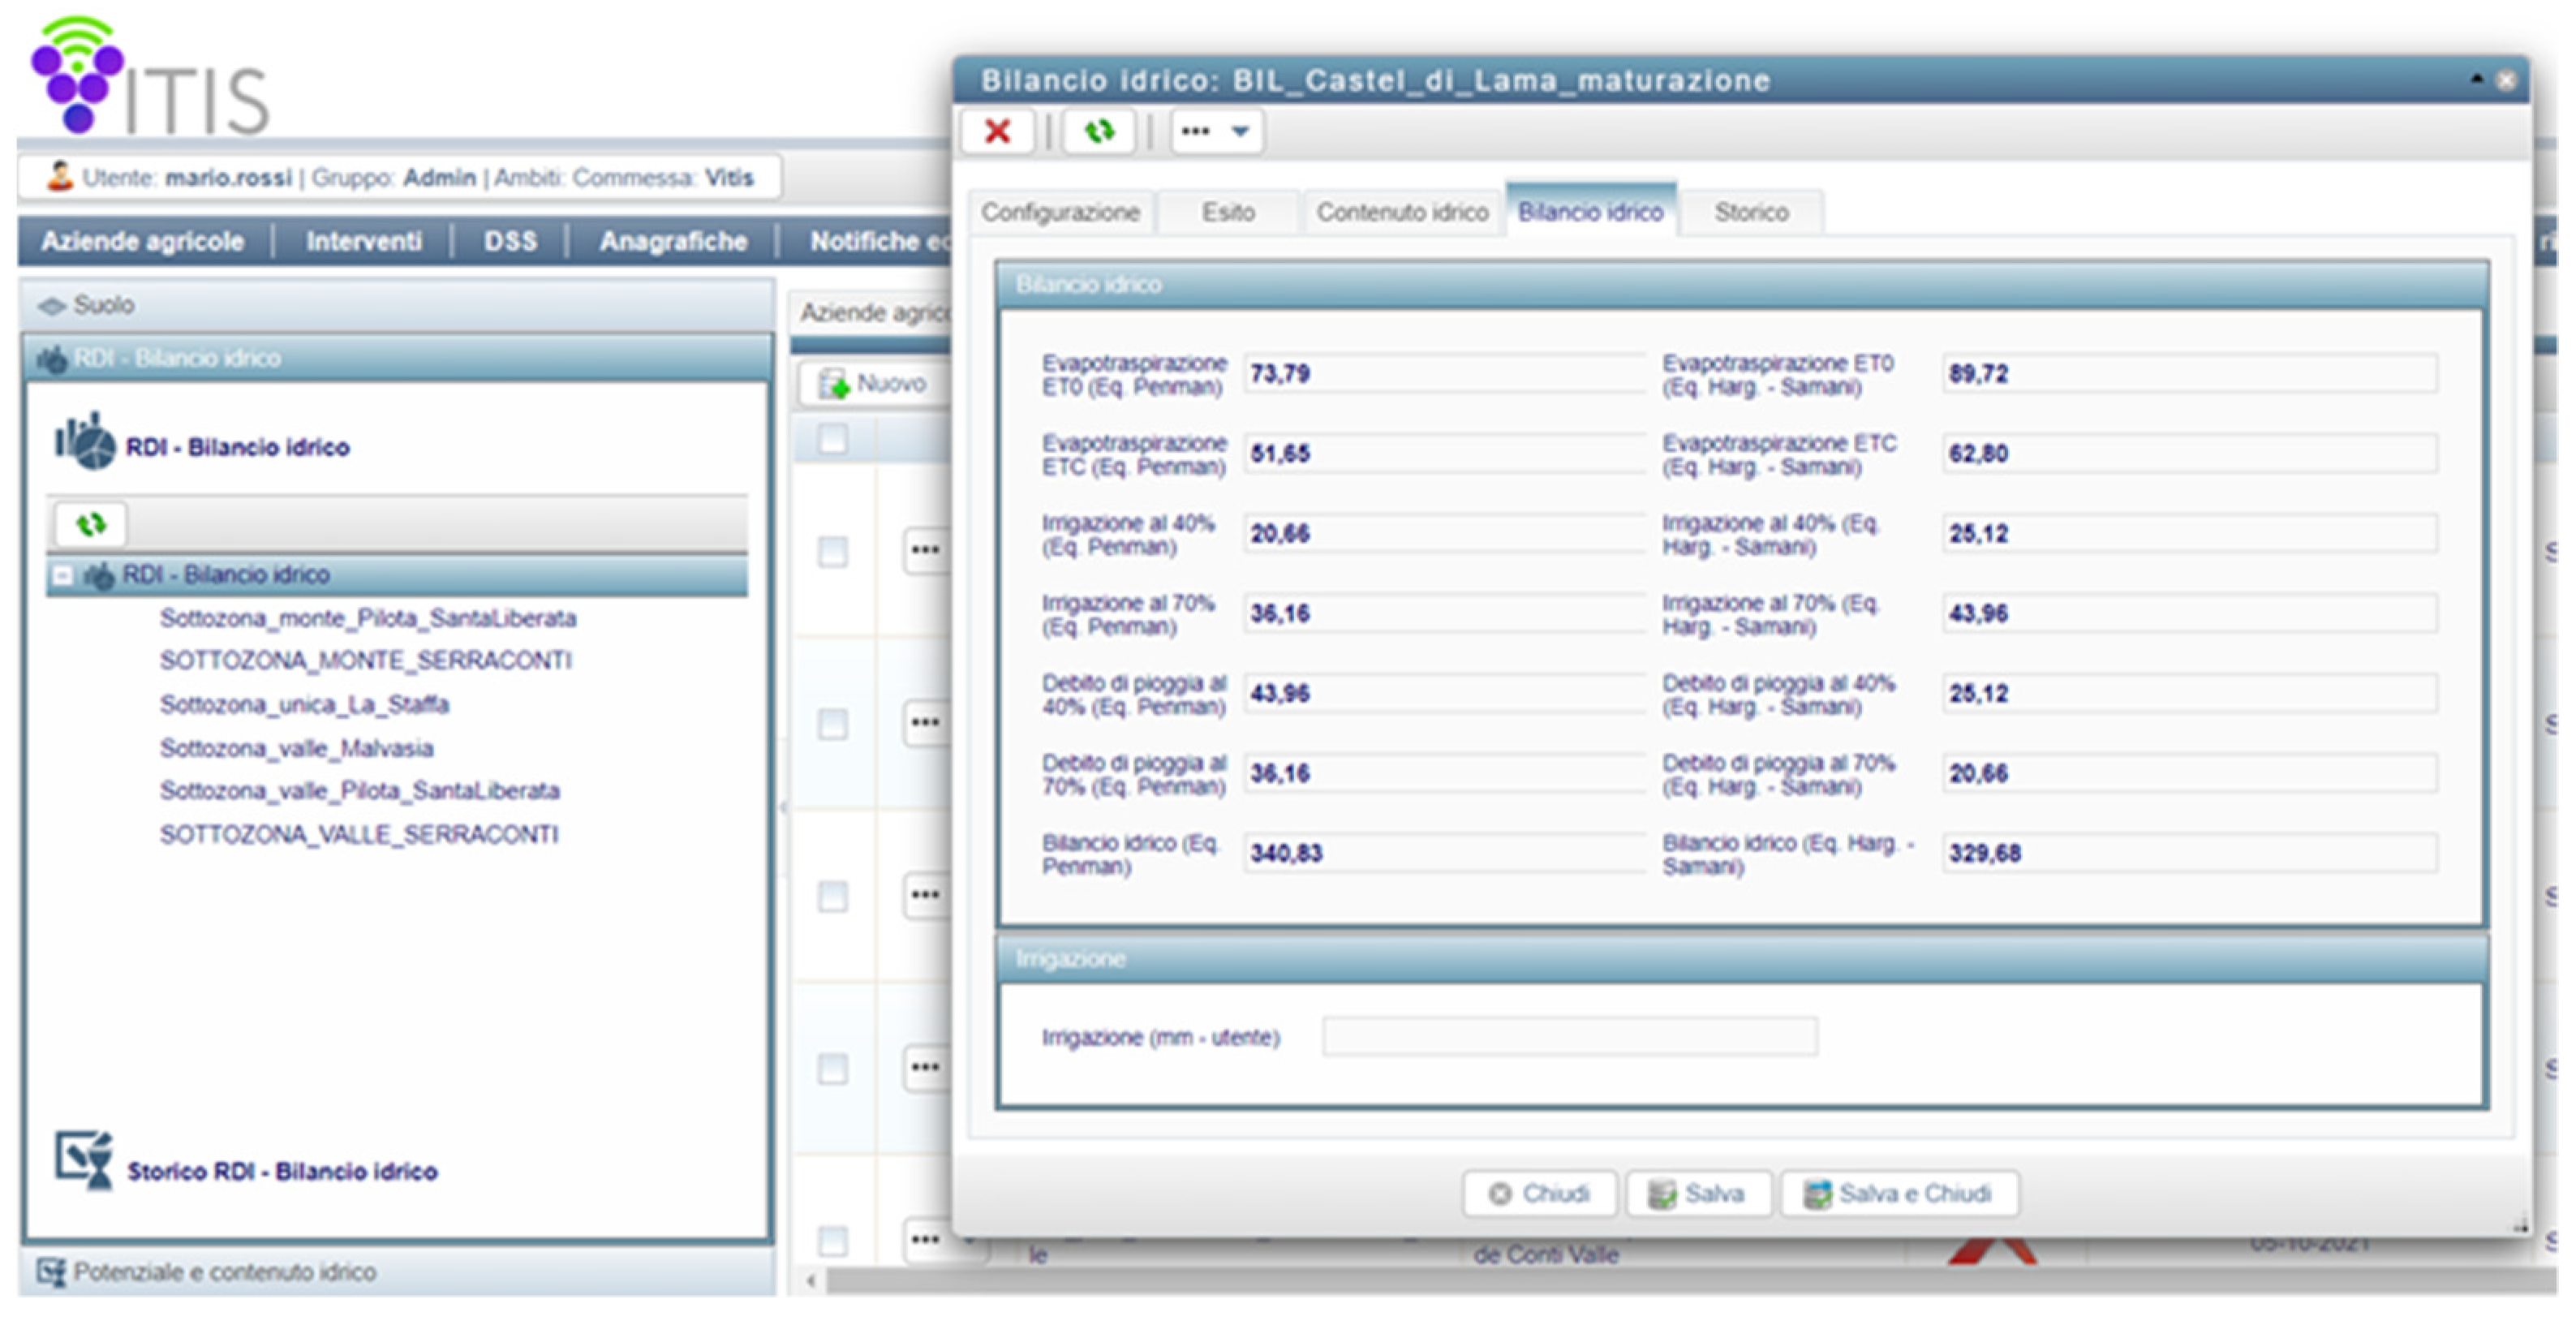
3.1. Smart Vitis Platform Output

The water requirement calculation, based on potential evapotranspiration (Etp) and crop evapotranspiration (ETc), was developed and made available in the software environment using local weather station data (specific weather field station in the pilot vineyard). Two sample subareas with different soil texture and condition parameters were set for a specific water capacity assessment in the pilot field. The subareas were delimited according to the interpretation of soil and canopy variability shown in remotely sensed index maps. For each subarea, a distinct function for the calculation of dynamic water balance was run on a daily basis with a preset adjustment of ETc parameters for various vineyard phenology intervals. Daily water availability (or deficit) figures in mm were calculated (see Figure 4) and stored in the system for the full 2021 season, and figures are currently being calculated for the 2022 season together with two different levels of suboptimal RDI volumes. Actual real-time soil water content from multilevel sensors is also being currently monitored. Extensive data collected and stored cannot be shown in this article; the counter list includes about 38 sensor datasets for each station, while custom aggregated data reports can be designed within the system.
Until now, there has been a focus on better determining evapotranspiration and its variables. In general, the monitoring of water demand is typically accomplished by measuring reference ET rather than actual ET. Indeed, methods used to determine actual ET are usually limited for reasons of costs, available technologies, and requisite user skills. The platform allows estimating site-specific and specific actual ET. These data provided by the platform are essential to determine the economic indices.

3.2. Monitoring Crop Water Stress through Airborne Thermal Imaging

The temperature values acquired during the airborne surveys were extracted at one-second intervals as numerical matrices and then converted to in. tiff format with a custom software. The obtained images were processed with a commercial photogrammetry software (Agisoft Metashape Professional 1.6.4) for the alignment and the orthorectification to produce a single coherent high-resolution orthomosaic (ground sample distance < 13 cm) for each survey. Three coregistered maps of the ground temperature measured during each survey were then obtained through a manual georeferencing process (Figure 6a–c).
Vine rows are distinguishable in all three temperature maps due to their temperature values being lower than the surrounding soil thanks to the transpiration mechanisms of the vine leaves regulating their temperature. Pure canopy pixels can thus be separated from pure soil ones on the basis of their recorded temperature through the use of a spatial mask. Among different approaches, the best results were obtained by adopting the method modified from [46], which compares median-filtered thermal images at two different scales, one chosen to represent vineyard row width and the other one to also incorporate soil pixels. In particular, we used mean filters with sizes of 5 × 5 pixels and 25 × 25 pixels (tailored to our ground resolution) to construct the masks needed to distinguish canopy (green bars in Figure 6d–f) from soil pixel temperature frequency distributions (orange bars) and to extract statistical parameters (Table 1). Considering only the canopy pixels, the temperature frequency distributions can be fitted with Gaussian functions (light green curves in Figure 6d–f), providing the best estimates of their mean values and standard deviations as 27.8 ± 0.8 °C, 27.3 ± 2.3 °C, and 43.6 ± 3.1 °C for the June, July, and August surveys, respectively. The resulting mean values are compatible at 1σ level with true average values of the canopy distributions (Table 1), ensuring the reliability of the fits.
The CWSI (Equation (1)) was derived for pure vine pixels following the method pro-posed in Bian et al. (2019) [47], which defines Tdry and Twet as the average of the lowest and highest 0.5% canopy temperature values (Table 1). The index shows average values among the three crop stages compatible at 1σ level. Different temperature ranges do not therefore bias the CWSI values, since the index is constructed by normalizing the observed canopy temperature values for the range (Twet, Tdry) of the analyzed dataset. Displaying exclusively canopy pixels by using the previously obtained masks, we created CWSI maps (Figure 6g–i) that highlight structures also visible in thermal maps (Figure 6a–c) and identify water-stressed areas through high index values. An explicative case is given by plot 11: this was planted in 2020 and features grapevines that are more than a decade younger with respect to the others and therefore require higher amounts of water. The analysis of the CWSI maps can be used for subzoning a vineyard for the purpose of high-quality wine production by means of rational managing and harvesting [48].
The RGB orthomosaics obtained from the photographic images, analogous to the thermal orthomosaics, show some structures (outlined with dotted white lines in Figure 7a,d) common to both the temperature and CWSI maps. Focusing on the RGB maps, the lighter color seen in Figure 7a,d reflects a lower canopy density imputable to water stress. The presence of a clay formation in plot 1 (Figure 7a–c), outcropping in a NW–SE narrow-shaped feature, lowers the soil’s water retention ability, impacting vegetation growth and increasing vine canopy temperature and water stress. The RGB, thermal, and CWSI maps can also show the effects of different plant conditions: an example is given by plot 13 (Figure 7d–f) that, despite being implanted in the same year and with the same vine variety of the bordering plots 10 and 12, suffered from a disease since implantation. This caused plant underdevelopment (Figure 7d) reflected in a higher canopy temperature (Figure 7e) and higher water stress (Figure 7f) of the grapevines in plot 13 compared to those in the adjacent plots.
As demonstrated by recent studies comparing CWSI derived from remote sensing thermal imaging with direct measurements of plant water stress [49,50,51], the obtained results prove the viability of using airborne thermal surveys to quickly map an entire vineyard to pinpoint water-stressed areas.

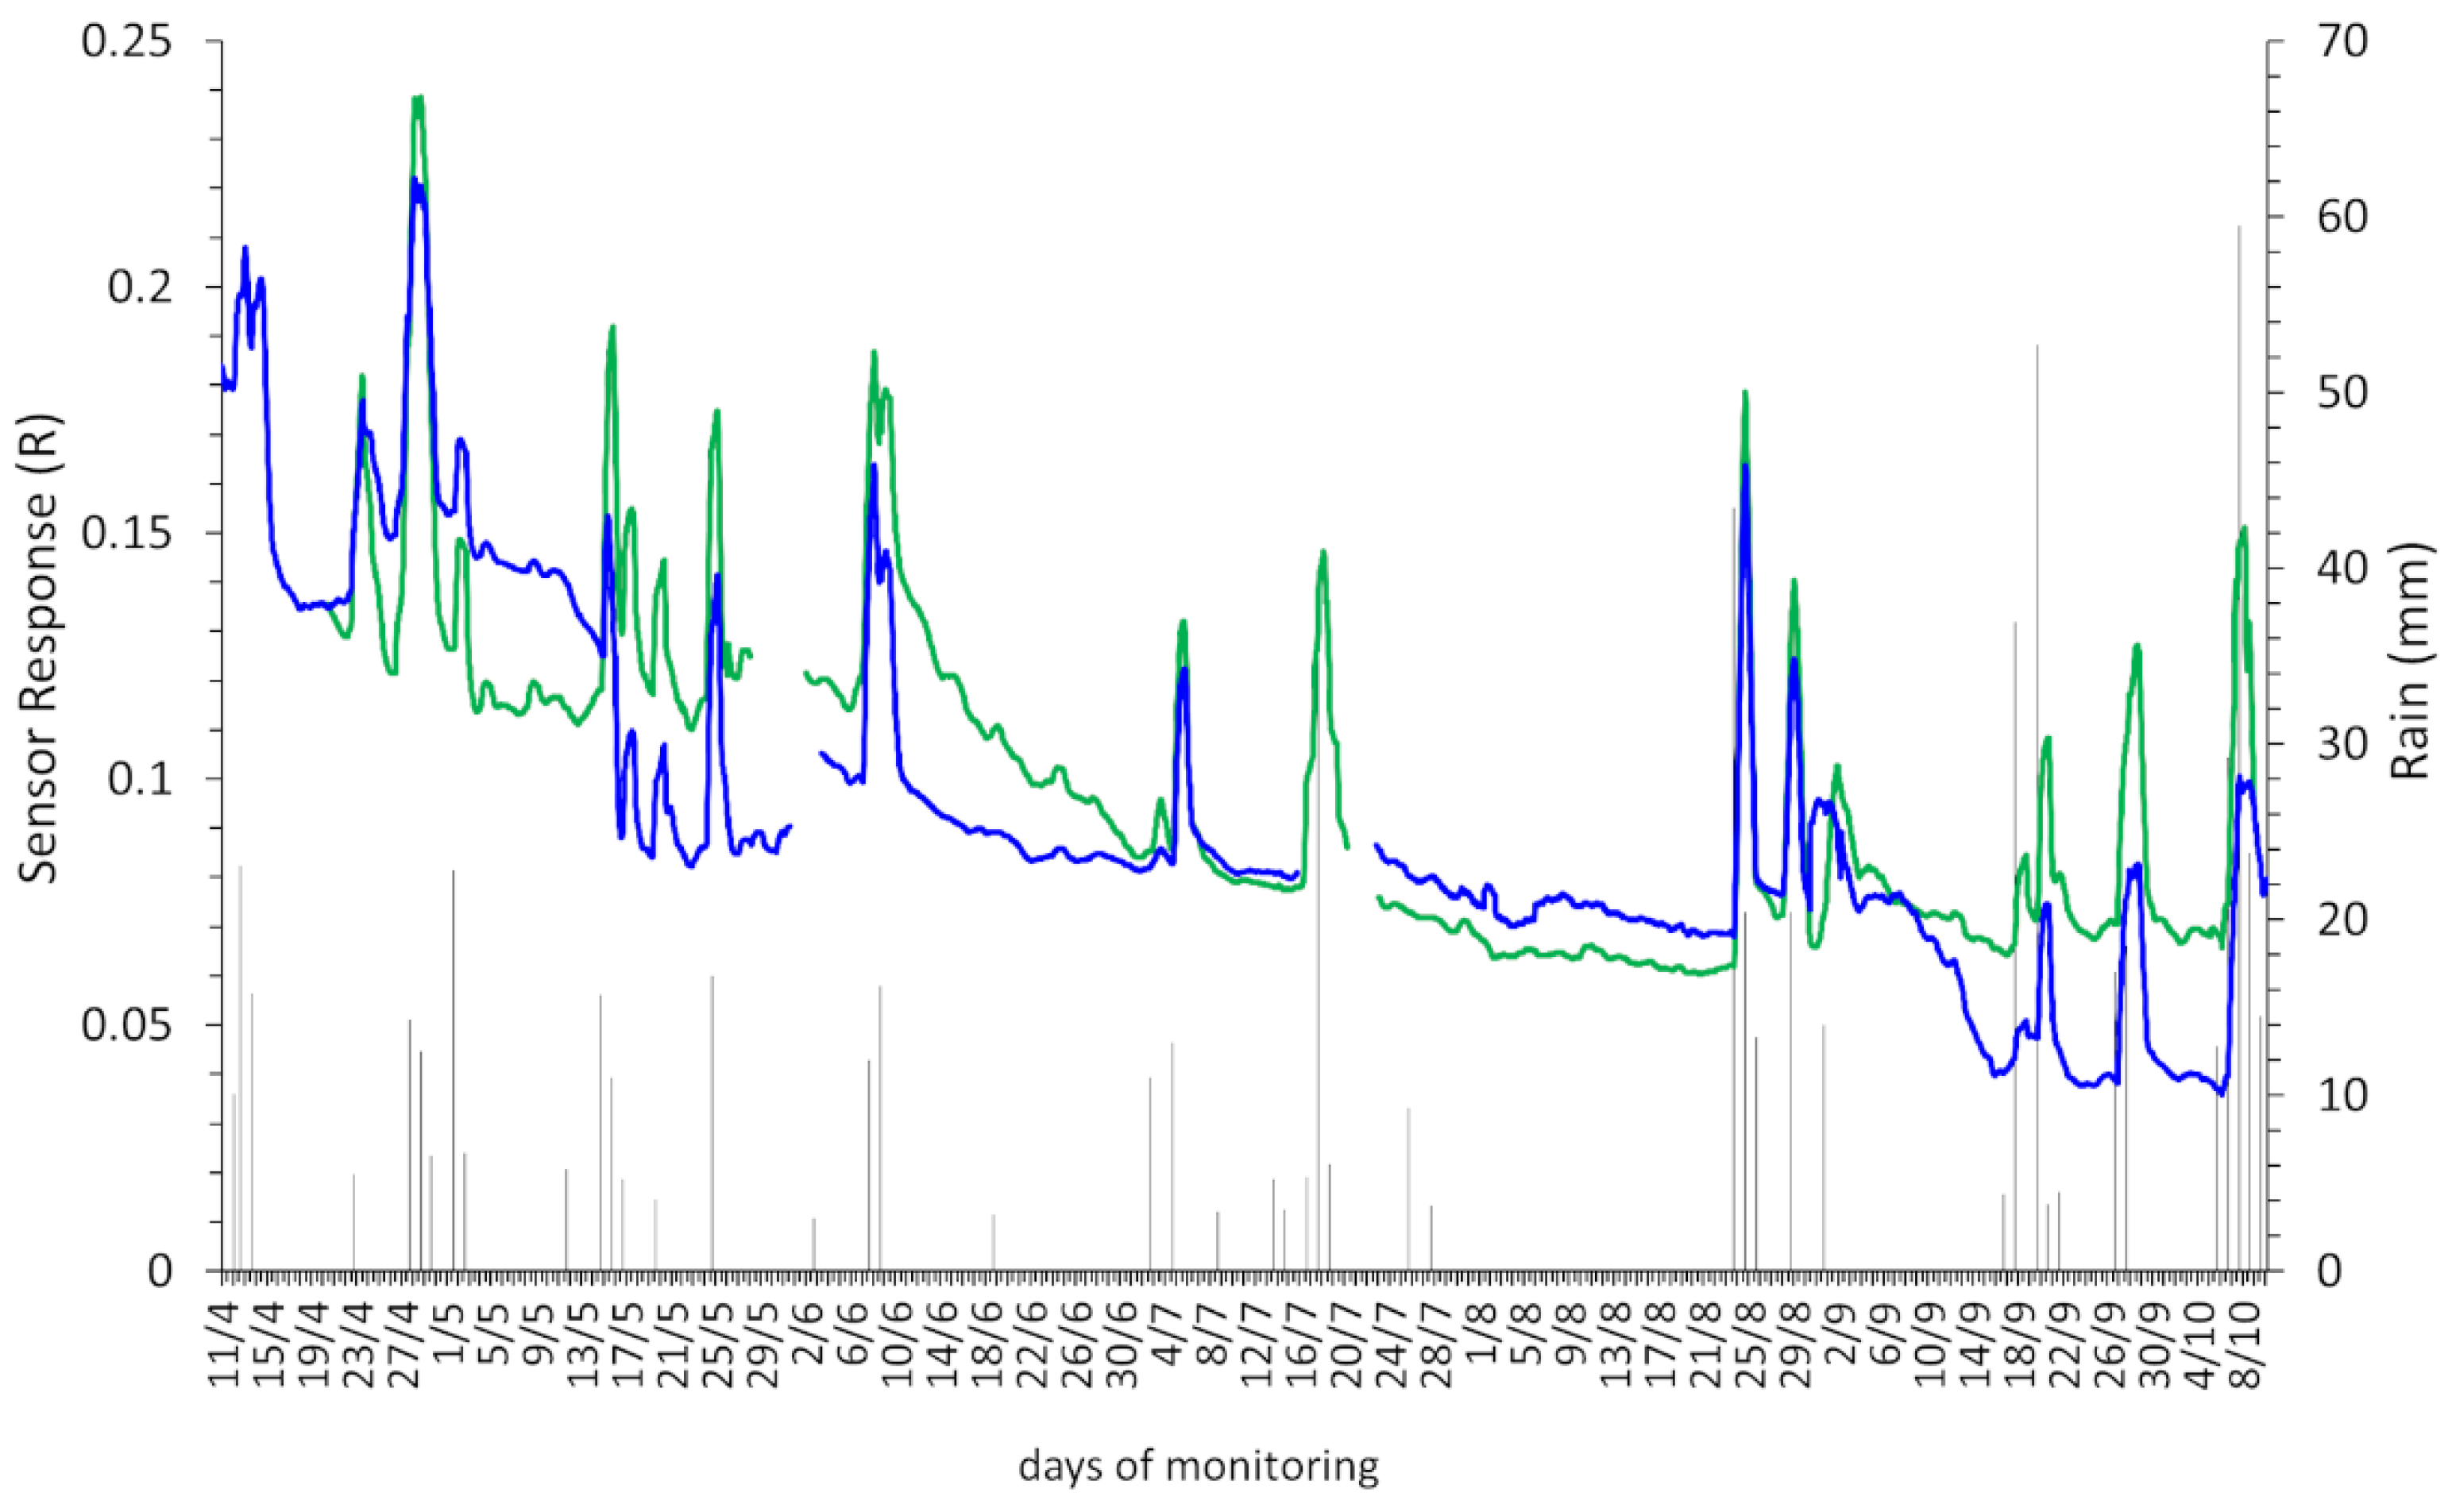
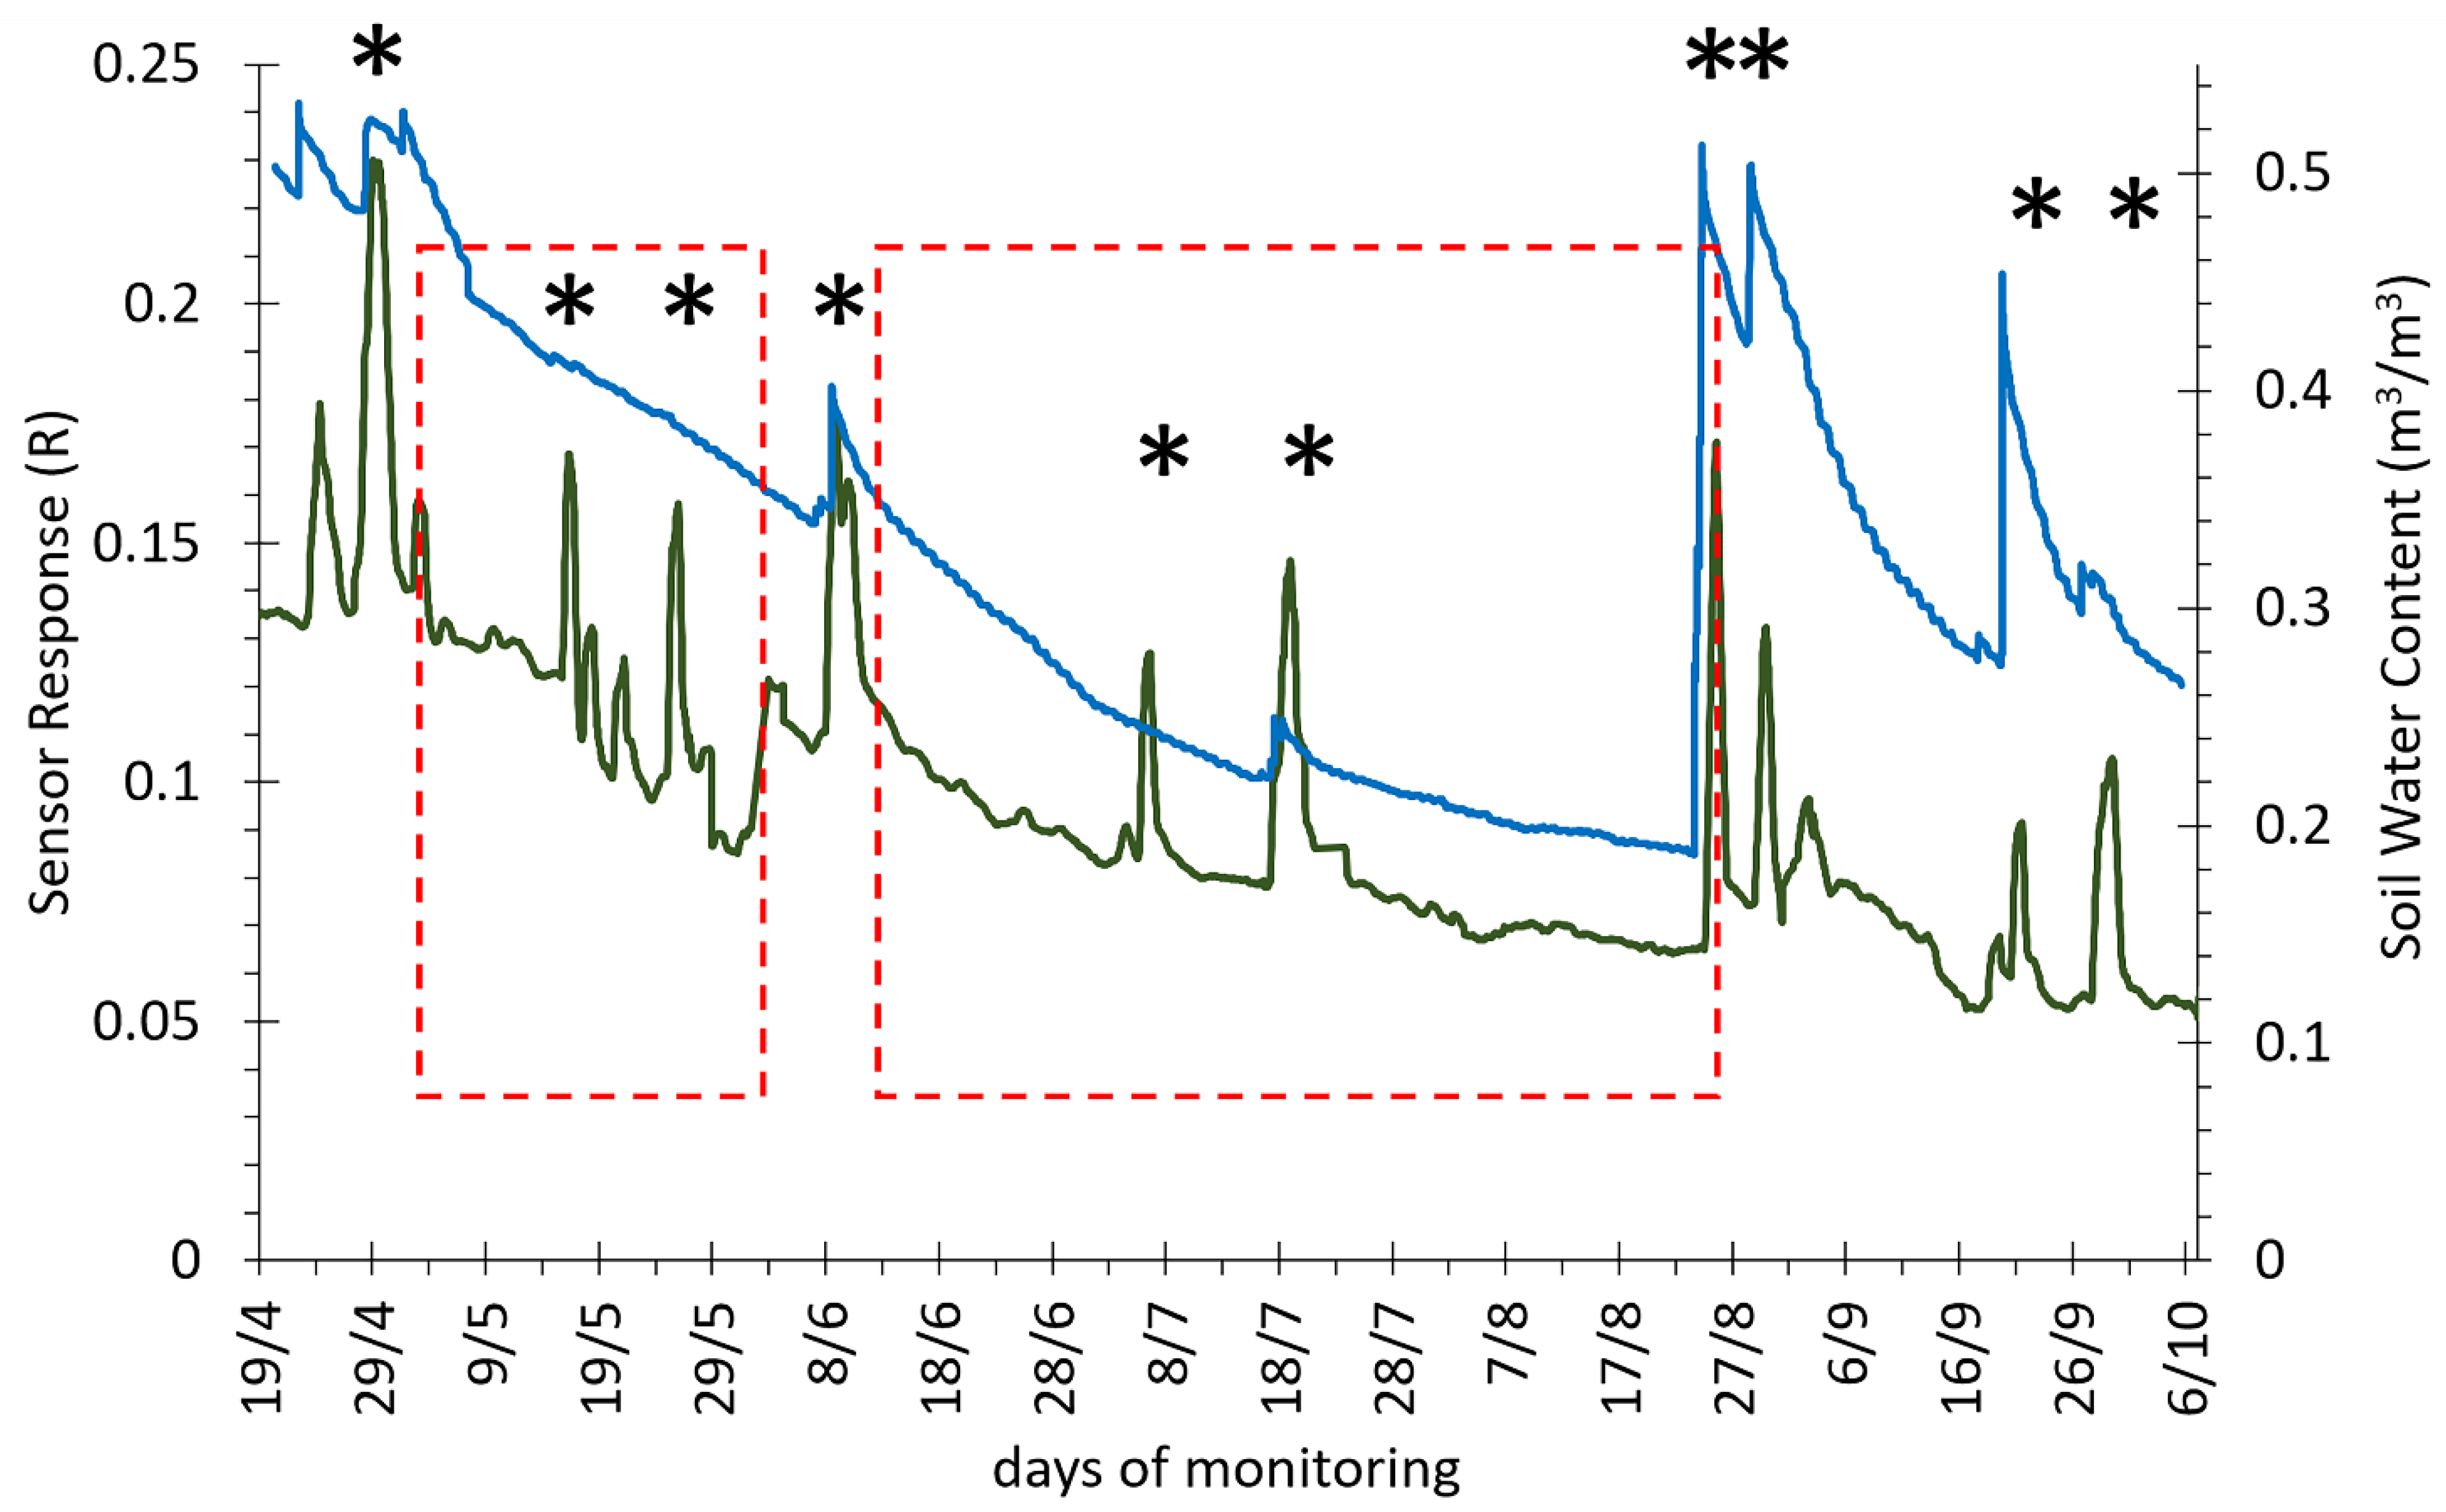
3.3. In Vivo Biosensors for the Continuous Monitoring of Vineyard Health and Water Status

Notwithstanding the efficacy of current sensor technologies available in vineyard management [52,53,54,55], the possibility to monitor the water status directly from inside plants can significantly improve the efficiency of water use in viticulture. To this end, an in vivo biosensor that is highly biocompatible, biomimetic and low cost, namely Bioristor, was developed by the National Research Council [56]. The sensor is an Organic Electrochemical Transistor (OECT) made of textile fibers functionalized with a conductive polymer that makes it possible to specifically read the concentration of cations dissolved in an electrolyte solution [57]. The application of Bioristor in plants allowed us to monitor the changes occurring in the cation concentration in the plant sap in vivo, in real time and continuously, giving a direct indication of the plant health status. The high compatibility of the textile threads allowed for a prolonged monitoring over the growing season [58]. The application of Bioristor enabled the early detection of drought stress in tomato and saline stress in Arundo donax [59], together with the detection of the effects of the changing environment conditions, such as Vapor Pressure Deficit (VPD) of specific responses in plants also affecting yields and plant development. The changes in the cation concentration are expressed by the changing in the slope of the sensor response thanks to the doping and dedoping of the transistor channel [37,60].
Here, Bioristor was applied for the first time for the continuous monitoring of real production vineyards. Eight sensors were inserted in two-year-old cane branches just after budburst (BBCH stage 09–11), enabling the continuous monitoring for 150 days (Figure 8a,b).
A first important result was the high reproducibility of the sensor response observed within sensors supporting the efficacy of Bioristor in monitoring vineyards (Figure 9).
The analysis of R (Table S1, Supplementary Materials) reports the presence of high peaks (ex. 8/6, 8/7) corresponding to the occurrence of rainy events (Figure 10, black asterisks). The rapid increases in the R response as a result of decreasing VPD values with an increase in relative air humidity (RH%) [60] strongly affects the plant transpiration and leads to an accumulation of ions in the sap contained in the transpiration stream.
In the first days of measurements in April, although the soil probe reported the occurrence of a reduction of the water available in the soil, probably due to the intense root water absorption, Bioristor reported stable values of the sensor response R in the range of a plant in a correct water status (Figure 10).
Within six months of continuous monitoring, Bioristor detected mainly two periods of drought stress, identified as the decreasing slope of R that rapidly decreased. The first one was early in May (red box, Figure 10), and a second prolonged drought stress occurred from 6 June to mid-August that was mitigated only by the heavy rainy events that occurred at the end of August. The negative trend of R indicates the occurrence of a block of the transpiration process, associated with a rapid reallocation of the ions contained in the plant sap in the cell vacuoles to maintain a high osmotic level in the cells surrounding the vascular tissues [37]. When compared with the data acquired with the soil probe for the soil water monitoring (Figure 10, blue line), the soil probe revealed the earlier onset of drought from mid-April, while the sensor response clearly indicates that the defense response triggered as a different accumulation and flow of ions in the plant sap occurred only at the beginning of May. Moreover, maybe because of the soil depth chosen for the soil probe data, no variation was observed in the soil water content even after the occurrence of rainy events that were correctly recorded by Bioristor.
Two key phenological phases were impacted by the water shortage identified with Bioristor: the flowering time and the veraison both strongly affecting yields and quality (Figure 10).
On the contrary, it is well known that mild or moderate water deficits generally favor the accumulation of sugar and some phenolic compounds in grapes [61], suggesting that based on the Bioristor data, a mild irrigation could have been scheduled during the summer promoting a consistent production maintaining the highest quality of the grapes.

3.4. Economics Results

In this subsection, the main results of the economic analysis are presented. The costs relating to the year 2021 refer to the real costs recorded in the company through the questionnaire to which the real costs of irrigation incurred in the neighboring plots were added. In detail, the variable costs of irrigation, which are represented by energy, labor, and maintenance, are equal to 160 EUR/ha. On the other hand, the fixed costs were found to have a much larger amount than that of variable costs, for a total of 600 EUR/ha (200 EUR/ha for the depreciation of the irrigation system and 400 EUR/ha for the annual water-providing consortium fee). In summary, the total cost of irrigation is equal to 760 EUR/ha. Our results are in line with the literature and highlight total irrigation costs per hectare between EUR 400 and EUR 800 [30,62] (Table 2). The cost analysis shows that irrigation costs account for 30% of the total fixed costs and about 12% of total variable costs.
Analyzing the production trends (Table 3), if the winery had decided to irrigate the plot, due to the water stress detected by the sensors, the production levels would have remained in line with 2020. In fact, the real yield of this plot was 86 q/ha, a much lower value compared to the previous year due to the drought that affected the harvest season.
Finally, the economic indices are shown in the following table (Table 4).
WP represents the kg of grapes produced per unit of water depleted [63]. Results in Table 3 show that with irrigation the WP decreases. Indeed, a high WP is obtained when a crop is water-stressed. This stress condition impacts the yield and the quality of grapes. Indeed, irrigation allows for the standardization of yield and grape quality over the years, especially when rainfall is too low [64]. Nevertheless, different effects on grapevine yield and quality components depend on different factors. Supplementary irrigation may be used to modulate vine water stress levels. In this context, it is useful to define irrigation volume based on crop evapotranspiration. However, plant water stress depends not only on the fraction of water consumption replaced in the soil but also on soil water holding capacity, growing conditions, and so on [65]. However, the results show that EWP decreased and became negative when irrigation was included. In fact, the water costs represent 8% of the total costs. It is, however, important to remember that the EWP is very sensitive to market prices. Overall, this indicator allows for a cost/benefit analysis showing that for each euro invested the winegrower will have a return of at least 0,6 euros in 2020, while in 2021, the index reports a negative value due to a lower yield and relatively high production costs. These results led to improving irrigation scheduling and management. The goal of the application of precision techniques is to bring economic and environmental benefits through the efficient use of crop inputs, such as water, and the organization of business activities [66].

4. Conclusions and Perspectives

In this paper, remote and proximal sensing data managed by the Smart Vitis platform, in combination with economics analysis, was shown to be a useful irrigation planning tool to face climate change in the wine sector, preserving the water resource.
This paper describes an IoT-enabled cloud management platform developed to manage and control the water use efficiency in a pilot vineyard in the Marche Region (Central Italy). The Smart Vitis platform was implemented by integrating physical sensors in the field, multispectral images, and software modules, and it is able to integrate different functions for vineyard mapping and the decision support system in water management as well as to calculate irrigation parameters and monitor water availability. Spatial variability in water stress levels (CWSI index), vigor maps of pilot fields, and in vivo biosensors were used in specific sample rows for monitoring vineyard health and water status. High-resolution CWSI maps of an entire vineyard obtained from airborne thermal surveys can be used to create prescription maps, easily displayable in the platform, for scheduling irrigations that account for the spatial variability of grapevine water stress. In particular, the focus on plots 1 and 13 outlined in Section 3.1 showed that CWSI maps can be used as a screening tool to identify problematic areas. In addition, with the aid of additional information (e.g., photogrammetric maps and vegetation indices), the different underlying causes can be uncovered and eventually treated. At the same time, the application of a novel in vivo sensor can help in fine tuning supplementary irrigation based on real plant needs to prevent yield losses by maintaining the highest quality of grape production. The developed water requirement functions were run in the platform software environment using local weather station data (specific weather field station and soil sensors in the pilot vineyard), which enabled the identification and setting of sample subareas with different conditions. Parameters were set for specific water capacity assessments in the pilot field, based on soil and canopy variability detected from remotely-sensed parameters and interpretation index maps. The current calculation of the dynamic water balance was run on a daily scale with a preset adjustment of ETc parameters for various vineyard phenology intervals. Real-time soil water content and estimated water availability (or deficit) figures and RDI volumes were stored in the system for the past season.
Considering that water is becoming a scarce resource and that its use has a significant impact on the production cost of the grapes as demonstrated above, it is important to suggest to the wine entrepreneur how to manage and optimize this input, also considering the sustainable schemes that are now spreading in the wine sector (i.e., the EQUALITAS scheme). In combination with agronomic observation, the economic analysis carried out through appropriate indicators based on the evapotranspiration detected by the platform can improve decision making in pursuit of farm economic and environmental objectives. We believe that the information obtained in this interdisciplinary study can be used for the development of the best irrigation management practices and the adoption of precision irrigation systems for wine grapes. There are a few noteworthy limitations of this study. Firstly, the case study winery is currently not equipped with a precision irrigation system that can be paired with the prototype of the platform. The implementation of a precision irrigation system can make it possible to automatically irrigate the vineyard based on the real water stress of the plants as revealed by sensors. Secondly, in the economic analysis, the investment costs of the management system (platform and sensors) were not considered because it is a prototype. Future investigation should evaluate these aspects.

Supplementary Materials

The following supporting information can be downloaded at: https://0-www-mdpi-com.brum.beds.ac.uk/article/10.3390/w14091493/s1, Table S1: Daily mean of the sensor response (R) and of the soil water content (m3/m3) for the entire time of measurements.

Author Contributions

The authors participating in this research study provided the following contributions: Introduction, A.F., D.B. and G.C.; Smart Vitis platform development, methodology, and results, E.A., C.S. and G.B.; In vivo Bioristor monitoring and data analysis, F.V., E.M., M.B. and M.J.; Aerial thermal imagery and crop water stress index methodology, M.A., A.M., F.M. and K.G.C.R.; Software, M.A., E.C., A.M. and M.M.; Formal Analysis, M.A., E.C., A.M., M.M. and K.G.C.R.; Investigation, M.A., E.C., A.M. and F.M.; Data Curation, M.A. and V.S.; Visualization, K.G.C.R. and F.S.; Economic analysis methodology and results A.F., D.B. and G.C. All authors contributed to the conclusions. Review and editing of final version of the manuscript, D.B. and G.C. Funding acquisition, A.F., D.B., C.S., E.A. and G.B. All authors have read and agreed to the published version of the manuscript.

Funding

This work was supported by the Rural Development Program (RDP) of the Marche Region 2014–2020, which financed the Operational Group (OP) SMART VITIS—Intelligent and Sustainable Viticulture (ID N° 29008-).

Data Availability Statement

Not applicable.

Acknowledgments

The authors wish to thank all the partners of the Operational Group (OP) SMART VITIS—Intelligent and Sustainable Viticulture (ID N° 29008-)—financed by RDP Marche 2014/2020, submeasure 16.1. “Support for the establishment and management of EIP operational groups on agricultural productivity and sustainability”. We also wish to thank the winery Umani Ronchi for providing data and support to the research. Finally, the authors would like to acknowledge the support FAR 2021–2022 of the University of Ferrara, Mauro Antongiovanni and Claudio Pagotto.

Conflicts of Interest

The authors declare no conflict of interest.

References

  1. Upton, E.; Nielsen-Pincus, M. Climate Change and Water Governance: Decision Making for Individual Vineyard Owners in Global Wine Regions. Front. Clim. 2021, 3, 55. [Google Scholar] [CrossRef]
  2. Kenny, G.J.; Harrison, P.A. The effects of climate variability and change on grape suitability in Europe. J. Wine Res. 1992, 3, 163–183. [Google Scholar] [CrossRef]
  3. Jones, G.V.; White, M.A.; Cooper, O.R.; Storchmann, K. Climate change and global wine quality. Clim. Chang. 2005, 73, 319–343. [Google Scholar] [CrossRef]
  4. Hannah, L.; Roehrdanz, P.R.; Ikegami, M.; Shepard, A.V.; Shaw, M.R.; Tabor, G.; Zhi, L.; Marquet, P.A.; Hijmans, R.J. Climate change, wine, and conservation. Proc. Natl. Acad. Sci. USA 2013, 110, 6907–6912. [Google Scholar] [CrossRef] [Green Version]
  5. Fraga, H. Climate change: A new challenge for the winemaking sector. Agronomy 2020, 10, 1465. [Google Scholar] [CrossRef]
  6. Fader, M.; Shi, S.; von Bloh, W.; Bondeau, A.; Cramer, W. Mediterranean irrigation under climate change: More efficient irrigation needed to compensate for increases in irrigation water requirements. Hydrol. Earth Syst. Sci. 2016, 20, 953–973. [Google Scholar] [CrossRef] [Green Version]
  7. Tombesi, S.; Frioni, T.; Poni, S.; Palliotti, A. Effect of water stress “memory” on plant behavior during subsequent drought stress. Environ. Exp. Bot. 2018, 150, 106–114. [Google Scholar] [CrossRef]
  8. United Nations. The Sutainable Development Agenda. Available online: https://www.un.org/sustainabledevelopment/development-agenda/ (accessed on 26 April 2022).
  9. Costa, J.M.; Vaz, M.; Escalona, J.; Egipto, R.; Lopes, C.; Medrano, H.; Chaves, M.M. Modern viticulture in southern Europe: Vulnerabilities and strategies for adaptation to water scarcity. Agric. Water Manag. 2016, 164, 5–18. [Google Scholar] [CrossRef]
  10. Fraga, H.; Malheiro, A.C.; Moutinho-Pereira, J.; Santos, J.A. An overview of climate change impacts on European viticulture. Food Energy Secur. 2012, 1, 94–110. [Google Scholar] [CrossRef]
  11. International Organization of Vine and Wine. Resolution CST 1/2008. Guidelines for Sustainable Vitiviniculture: Production, Processing and Packaging of Products. 2008. Available online: http://www.oiv.int/oiv/cms/index (accessed on 1 March 2022).
  12. Hayes, P.; Graça, A.; de la Fuente, M.; Bois, B.; Andrag, A.; Savage, C.; Corbett-Milward, J.; Koundouras, S. Sustainable Use of Water in Winegrape Vineyards. 2021. Available online: https://www.oiv.int/public/medias/7949/2021-oiv-collective-expertise-document-sustainable-use-of-wa.pdf (accessed on 24 February 2022).
  13. Dry, P.R.; Loveys, B.R. Factors influencing grapevine vigour and the potential for control with partial rootzone drying. Aust. J. Grape Wine Res. 1998, 4, 140–148. [Google Scholar] [CrossRef]
  14. Flexas, J.; Galmes, J.; Galle, A.; Gulias, J.; Pou, A.; Ribas-Carbo, M.; Tomas, M.; Medrano, H. Improving water use efficiency in grapevines: Potential physiological targets for biotechnological improvement. Aust. J. Grape Wine Res. 2010, 16, 106–121. [Google Scholar] [CrossRef]
  15. van Leeuwen, C.; Destrac-Irvine, A.; Dubernet, M.; Duchêne, E.; Gowdy, M.; Marguerit, E.; Pieri, P.; Parker, A.; de Rességuier, L.; Ollat, N. An update on the impact of climate change in viticulture and potential adaptations. Agronomy 2019, 9, 514. [Google Scholar] [CrossRef] [Green Version]
  16. Neethling, E.; Petitjean, T.; Quénol, H.; Barbeau, G. Assessing local climate vulnerability and winegrowers’ adaptive processes in the context of climate change. Mitig. Adapt. Strateg. Glob. Chang. 2017, 22, 777–803. [Google Scholar] [CrossRef]
  17. Johnson, L.F.; Roczen, D.E.; Youkhana, S.K.; Nemani, R.R.; Bosch, D.F. Mapping vineyard leaf area with multispectral satellite imagery. Comput. Electron. Agric. 2003, 38, 33–44. [Google Scholar] [CrossRef]
  18. Rossi, V.; Salinari, F.; Poni, S.; Caffi, T.; Bettati, T. Addressing the implementation problem in agricultural decision support systems: The example of vite.net®. Comput. Electron. Agric. 2014, 100, 88–99. [Google Scholar] [CrossRef]
  19. Orsini, R.; Basili, D.; Belletti, M.; Bentivoglio, D.; Bozzi, C.A.; Chiappini, S.; Conti, C.; Galli, A.; Giorgini, E.; Fiorentini, M.; et al. Setting of a precision farming robotic laboratory for cropping system sustainability and food safety and security: Preliminary results. IOP Conf. Ser. Earth Environ. Sci. 2019, 275, 012021. [Google Scholar] [CrossRef]
  20. Bucci, G.; Bentivoglio, D.; Belletti, M.; Finco, A.; Anceschi, E. Implementing the Sustainable Development Goals with a digital platform: Experiences from the vitivinicultural sector. In Proceedings of the 2020 IEEE International Workshop on Metrology for Agriculture and Forestry, Trento, Italy, 4–6 November 2020; pp. 119–123. [Google Scholar]
  21. Bellvert, J.; Mata, M.; Vallverdú, X.; Paris, C.; Marsal, J. Optimizing precision irrigation of a vineyard to improve water use efficiency and profitability by using a decision-oriented vine water consumption model. Precis. Agric. 2021, 22, 319–341. [Google Scholar] [CrossRef]
  22. Knipper, K.R.; Kustas, W.P.; Anderson, M.C.; Alfieri, J.G.; Prueger, J.H.; Hain, C.R.; Gao, F.; Yang, Y.; McKee, L.G.; Nieto, H.; et al. Evapotranspiration estimates derived using thermal-based satellite remote sensing and data fusion for irrigation management in California vineyards. Irrig. Sci. 2019, 37, 431–449. [Google Scholar] [CrossRef]
  23. Matese, A.; Baraldi, R.; Berton, A.; Cesaraccio, C.; Di Gennaro, S.F.; Duce, P.; Facini, O.; Mameli, M.G.; Piga, A.; Zaldei, A. Estimation of water stress in grapevines using proximal and remote sensing methods. Remote Sens. 2018, 10, 114. [Google Scholar] [CrossRef] [Green Version]
  24. Soubry, I.; Patias, P.; Tsioukas, V. Monitoring Vineyards with UAV and Multi-sensors for the assessment of Water Stress and Grape Maturity. J. Unmanned Veh. Syst. 2017, 5, 37–50. [Google Scholar] [CrossRef] [Green Version]
  25. Romero, P.; García García, J.; Botía Ordaz, P. Cost-benefit analysis of a regulated deficit-irrigated almond orchard under subsurface drip irrigation conditions in South-eastern Spain. Irrig. Sci. 2006, 24, 175–184. [Google Scholar] [CrossRef]
  26. Dichio, B.; Xiloyannis, C.; Sofo, A.; Montanaro, G. Effects of post-harvest regulated deficit irrigation on carbohydrate and nitrogen partitioning, yield quality and vegetative growth of peach trees. Plant Soil 2007, 290, 127–137. [Google Scholar] [CrossRef]
  27. Hussain, I.; Turral, H.; Molden, D.; Ahmad, M. Measuring and enhancing the value of agricultural water in irrigated river basins. Irrig. Sci. 2007, 25, 263–282. [Google Scholar] [CrossRef]
  28. Salvador, R.; Martínez-Cob, A.; Cavero, J.; Playán, E. Seasonal on-farm irrigation performance in the Ebro basin (Spain): Crops and irrigation Systems. Agric. Water Manag. 2011, 98, 577–587. [Google Scholar] [CrossRef] [Green Version]
  29. García García, J.; Contreras López, F.; Usai, D.; Visani, C. Economic assessment and socioeconomic evaluation of water use efficiency in artichoke cultivation. Open J. Account. 2013, 2, 45–52. [Google Scholar] [CrossRef] [Green Version]
  30. Romero Azorin, P.; Garcia Garcia, J. The Productive, economic, and social efficiency of vineyards using combined drought-tolerant rootstocks and efficient low water volume deficit irrigation techniques under Mediterranean semiarid conditions. Sustainability 2020, 12, 1930. [Google Scholar] [CrossRef] [Green Version]
  31. Farahani, H.J.; Howell, T.A.; Shuttleworth, W.J.; Bausch, W.C. Evapotranspiration: Progress in measurement and modeling in agriculture. Trans. ASABE 2007, 50, 1627–1638. [Google Scholar] [CrossRef]
  32. Farg, E.; Arafat, S.M.; Abd El-Wahed, M.S.; El-Gindy, A.M. Estimation of evapotranspiration ETc and crop coefficient Kc of wheat, in south Nile Delta of Egypt using integrated FAO-56 approach and remote sensing data. Egypt. J. Remote Sens. Space Sci. 2012, 15, 83–89. [Google Scholar] [CrossRef] [Green Version]
  33. Hassan, D.F.; Abdalkadhum, A.J.; Mohammed, R.J.; Shaban, A. Integration remote sensing and meteorological data to monitoring plant phenology and estimation crop coefficient and evapotranspiration. J. Ecol. Eng. 2022, 23, 325–335. [Google Scholar] [CrossRef]
  34. Tanner, C.B. Plant temperatures. Agron. J. 1963, 55, 210–211. [Google Scholar] [CrossRef]
  35. Baldoncini, M.; Alberi, M.; Bottardi, C.; Minty, B.; Raptis, K.G.C.; Strati, V.; Mantovani, F. Airborne Gamma-Ray Spectroscopy for Modeling Cosmic Radiation and Effective Dose in the Lower Atmosphere. IEEE Trans. Geosci. Remote Sens. 2018, 56, 823–834. [Google Scholar] [CrossRef]
  36. Idso, S.B.; Jackson, R.D.; Pinter Jr, P.J.; Reginato, R.J.; Hatfield, J.L. Normalizing the stress-degree-day parameter for environmental variability. Agric. Meteorol. 1981, 24, 45–55. [Google Scholar] [CrossRef]
  37. Janni, M.; Coppede, N.; Bettelli, M.; Briglia, N.; Petrozza, A.; Summerer, S.; Vurro, F.; Danzi, D.; Cellini, F.; Marmiroli, N.; et al. In Vivo Phenotyping for the Early Detection of Drought Stress in Tomato. Plant Phenomics 2019, 2019, 1–10. [Google Scholar] [CrossRef] [PubMed] [Green Version]
  38. Pomarici, E.; Seccia, A. Economic and Social Impacts of Climate Change on Wine Production. Ref. Modul. Food Sci. 2016, 2.1, 1–8. [Google Scholar]
  39. Fernández, J.E.; Alcon, F.; Diaz-Espejo, A.; Hernandez-Santana, V.; Cuevas, M.V. Water use indicators and economic analysis for on-farm irrigation decision: A case study of a super high density olive tree orchard. Agric. Water Manag. 2020, 237, 106074. [Google Scholar] [CrossRef]
  40. Pereira, L.S.; Cordery, I.; Iacovides, I. Improved indicators of water use performance and productivity for sustainable water conservation and saving. Agric. Water Manag. 2012, 108, 39–51. [Google Scholar] [CrossRef]
  41. Ezenne, G.I.; Jupp, L.; Mantel, S.K.; Tanner, J.L. Current and potential capabilities of UAS for crop water productivity in precision agriculture. Agric. Water Manag. 2019, 218, 158–164. [Google Scholar] [CrossRef]
  42. Rodrigues, G.C.; Pereira, L.S. Assessing economic impacts of deficit irrigation as related to water productivity and water costs. Biosyst. Eng. 2009, 103, 536–551. [Google Scholar] [CrossRef] [Green Version]
  43. Hellegers, P.J.; Perry, C.J. Can irrigation water use be guided by market forces? Theory and practice. Water Resour. Dev. 2006, 22, 79–86. [Google Scholar] [CrossRef]
  44. Immerzeel, W.A.; Droogers, P. Calibration of a distributed hydrological model based on satellite evapotranspiration. J. Hydrol. 2008, 349, 411–424. [Google Scholar] [CrossRef]
  45. Hellegers, P.J.G.J.; Soppe, R.; Perry, C.J.; Bastiaanssen, W.G.M. Combining remote sensing and economic analysis to support decisions that affect water productivity. Irrig. Sci. 2009, 27, 243–251. [Google Scholar] [CrossRef]
  46. Wassenaar, T.; Baret, F.; Robbez-Masson, J.-M.; Andrieux, P.J.A. Sunlit soil surface extraction from remotely sensed imagery of perennial, discontinuous crop areas; the case of Mediterranean vineyards. Agronomie 2001, 21, 235–245. [Google Scholar] [CrossRef]
  47. Bian, J.; Zhang, Z.; Chen, J.; Chen, H.; Cui, C.; Li, X.; Chen, S.; Fu, Q.J.R.S. Simplified evaluation of cotton water stress using high resolution unmanned aerial vehicle thermal imagery. Remote Sens. 2019, 11, 267. [Google Scholar] [CrossRef] [Green Version]
  48. Bellvert, J.; Zarco-Tejada, P.J.; Girona, J.; Fereres, E. Mapping crop water stress index in a ‘Pinot-noir’ vineyard: Comparing ground measurements with thermal remote sensing imagery from an unmanned aerial vehicle. Precis. Agric. 2014, 15, 361–376. [Google Scholar] [CrossRef]
  49. Baluja, J.; Diago, M.P.; Balda, P.; Zorer, R.; Meggio, M.; Morales, F.; Tardaguila, J. Assessment of vineyard water status variability by thermal and multispectral imagery using an unmanned aerial vehicle (UAV). Irrig. Sci. 2012, 30, 511–522. [Google Scholar] [CrossRef]
  50. Bellvert, J.; Marsal, J.; Girona, J.; Zarco-Tejada, P.J. Seasonal evolution of crop water stress index in grapevine varieties determined with high-resolution remote sensing thermal imagery. Irrig. Sci. 2015, 33, 81–93. [Google Scholar] [CrossRef]
  51. Santesteban, L.G.; Di Gennaro, S.F.; Herrero-Langreo, A.; Miranda, C.; Royo, J.B.; Matese, A. High-resolution UAV-based thermal imaging to estimate the instantaneous and seasonal variability of plant water status within a vineyard. Agric. Water Manag. 2017, 183, 49–59. [Google Scholar] [CrossRef]
  52. Bonfante, A. LCIS DSS—An irrigation supporting system for water use efficiency improvement in precision agriculture: A maize case study. Agric. Syst. 2019, 176, 102646. [Google Scholar] [CrossRef]
  53. Bramley, R.G.V. Precision Viticulture: Managing vineyard variability for improved quality outcomes. In Understanding and Managing Wine Quality and Safety; Reynolds, A.G., Ed.; Woodhead Publishing: Cambridge, UK, 2010; pp. 445–480. [Google Scholar]
  54. Sozzi, M.; Kayad, A.; Marinello, F.; Taylor, J.; Tisseyre, B. Comparing vineyard imagery acquired from Sentinel-2 and Unmanned Aerial Vehicle (UAV) platform. OENO One 2020, 54, 189. [Google Scholar] [CrossRef] [Green Version]
  55. Brook, A.; De Micco, V.; Battipaglia, G.; Erbaggio, A.; Ludeno, G.; Catapano, I.; Bonfante, A. A smart multiple spatial and temporal resolution system to support precision agriculture from satellite images: Proof of concept on Aglianico vineyard. Remote Sens. Environ. 2020, 240, 111679. [Google Scholar] [CrossRef]
  56. Coppedè, N.; Villani, M.; Gentile, F. Diffusion Driven Selectivity in Organic Electrochemical Transistors. Sci. Rep. 2014, 4, 4297. [Google Scholar] [CrossRef] [PubMed] [Green Version]
  57. Tarabella, G.; Villani, M.; Calestani, D.; Mosca, R.; Iannotta, S.; Zappettini, A.; Coppedè, N. A single cotton fiberorganic electrochemical transistor for liquid electrolyte saline sensing. J. Mater. Chem. 2012, 22, 23830. [Google Scholar] [CrossRef]
  58. Coppedè, N.; Janni, M.; Bettelli, M.; Maida, C.L.; Gentile, F.; Villani, M.; Ruotolo, R.; Iannotta, S.; Marmiroli, N.; Marmiroli, M.; et al. An in vivo biosensing, biomimetic electrochemical transistor with applications in plant science and precision farming. Sci. Rep. 2017, 7, 16195. [Google Scholar] [CrossRef] [PubMed] [Green Version]
  59. Janni, M.; Cocozza, C.; Brilli, F.; Pignatelli, S.; Vurro, F.; Coppedè, N.; Bettelli, M.; Calestani, D.; Loreto, F.; Zappettini, A. Real-time monitoring of Arundo donax response to saline stress through the application of in vivo sensing technology. Sci. Rep. 2021, 11, 18598. [Google Scholar]
  60. Vurro, F.; Janni, M.; Coppedè, N.; Gentile, F.; Manfredi, R.; Bettelli, M.; Zappettini, A. Development of an In Vivo Sensor to Monitor the Effects of Vapour Pressure Deficit (VPD) Changes to Improve Water Productivity in Agriculture. Sensors 2019, 19, 4667. [Google Scholar] [CrossRef] [PubMed] [Green Version]
  61. Yang, C.; Menz, C.; Fraga, H.; Costafreda-Aumedes, S.; Leolini, L.; Ramos, M.C.; Molitor, D.; van Leeuwen, C.; Santos, J.A. Assessing the grapevine crop water stress indicator over the flowering-veraison phase and the potential yield lose rate in important European wine regions. Agric. Water Manag. 2022, 261, 107349. [Google Scholar] [CrossRef]
  62. Boatto, V.; Barisan, L.; Teo, G. Valutazione della risorsa irrigua di soccorso nella produzione del Conegliano Valdobbiadene Prosecco DOCG 1. Aestimum 2017, 70, 31. [Google Scholar]
  63. Teixeira, A.D.C.; Bastiaanssen, W.G.M.; Bassoi, L.H. Crop water parameters of irrigated wine and table grapes to support water productivity analysis in the São Francisco river basin, Brazil. Agric. Water Manag. 2007, 94, 31–42. [Google Scholar] [CrossRef]
  64. Santos, J.A.; Fraga, H.; Malheiro, A.C.; Moutinho-Pereira, J.; Dinis, L.T.; Correia, C.; Moriondo, M.; Leolini, L.; Dibari, C.; Costafreda-Aumedes, S.; et al. A Review of the Potential Climate Change Impacts and Adaptation Options for European Viticulture. Appl. Sci. 2020, 10, 3092. [Google Scholar] [CrossRef]
  65. Barbagallo, M.G.; Vesco, G.; Di Lorenzo, R.; Lo Bianco, R.; Pisciotta, A. Soil and regulated deficit irrigation affect growth, yield and quality of ‘Nero d’Avola’grapes in a semi-arid environment. Plants 2021, 10, 641. [Google Scholar] [CrossRef]
  66. Finco, A.; Bucci, G.; Belletti, M.; Bentivoglio, D. The economic results of investing in precision agriculture in durum wheat production: A case study in central Italy. Agronomy 2021, 11, 1520. [Google Scholar] [CrossRef]
Figure 1. Geographical setting and plot of the study area.
Water 14 01493 g001
Figure 2. Smart Vitis platform integration and the user interface.
Water 14 01493 g002
Figure 3. Field subareas identified in the map interface and associated data in the Smart Vitis Platform.
Water 14 01493 g003
Figure 4. The demonstrative prototype of the Smart Vitis platform.
Water 14 01493 g004
Figure 5. (a) Radgyro, the aircraft used for the airborne surveys. (b) Plot subdivision (red lines) of the study area. White numbers identify each plot. Blue pins mark the positions of the Bioristor IoT control units installed. (ce) June, July, and August flight paths over the study area (outlined in red). The average distance of the flight lines is ~35 m for the June flight, ~30 m for the July flight, and ~25 m for the August flight.
Water 14 01493 g005
Figure 6. (ac) Vineyard temperature maps for the June, July, and August surveys, respectively. (df) cumulative temperature histograms showing canopy pixel (green) and soil pixel (orange) contributions and Gaussian fit of the canopy distribution (light green) for the June, July, and August surveys, respectively. (gi) CWSI maps of canopy pixels for the June, July, and August surveys, respectively. Cartographic reference system WGS 84, UTM Zone 32N.
Water 14 01493 g006
Figure 7. Selected portions of the July orthomosaics showing common structures in (ad) visible light, (be) infrared radiation, and (cf) CWSI index. Dotted white lines in (ad) outline the structures also apparent in the infrared and CWSI maps. Cartographic reference system WGS 84, UTM Zone 32N.
Water 14 01493 g007
Figure 8. Bioristor installation in grapevines. (a) IoT control unit. (b) Bioristor installed in two-year-old cane branches.
Water 14 01493 g008
Figure 9. Sensor response R. The curves represent the mean of 4 sensors for each control unit installed (blue and green lines). Black histograms represent the rainy event expressed in mm.
Water 14 01493 g009
Figure 10. Plot of the Bioristor sensor response (R) recorded in Serra de’ Conti and of the soil water content recorded by the soil probe installed. The black line indicates the sensor response R. The blue line indicates the soil water. The red box indicates the occurrence of a prolonged drought stress event (9/5 to 17/8). Black asterisks indicate the occurrence of rainy events.
Water 14 01493 g010
Table 1. Canopy temperature and CWSI statistics for the June, July, and August surveys.
JuneJulyAugust
Canopy Temperature (°C)Max34.644.659.6
Min25.320.934.7
Mean28.027.643.8
St. Dev.0.92.33.0
Tdry30.334.352.6
Twet25.721.335.5
CWSIMean0.500.480.49
St. Dev.0.190.170.17
Table 2. Cost details (EUR/ha).
Cultivation Operation20202021
VARIABLE COSTSPruning479534
Branch removal703770
Binding406353
Green pruning11161329
Thinning47-
Phytosanitary treatments10421040
Agricultural processing439709
Fertilization and weeding633592
Harvest12361391
Vineyard mantainance106162
Machinery manteinance128199
Irrigation-160 *
Other18590
TOTAL65207327
Cost items
FIXED COSTSDepreciation10001000
Administration and management150150
Overheads800800
Irrigation-600 *
TOTAL19502550
TOTAL COSTS84709877
* Estimated.
Table 3. Yield of vineyard (q/ha).
202020212021 *
Yield11386103
* Estimated.
Table 4. WP and EWP indices.
20202021 *
WP (kg/m3)6.25.1
EWP (EUR/m3)0.6−0.3
* Estimated.
Publisher’s Note: MDPI stays neutral with regard to jurisdictional claims in published maps and institutional affiliations.

