Article

Riverine Inputs Impact the Diversity and Population Structure of Heterotrophic Fungus-like Protists and Bacterioplankton in the Coastal Waters of the South China Sea

1
Center for Marine Environmental Ecology, School of Environmental Science and Engineering, Tianjin University, Tianjin 300072, China
2
College of Life Sciences, Zhejiang University, Hangzhou 310058, China
3
Key Laboratory of Systems Bioengineering (Ministry of Education), Tianjin University, Tianjin 300072, China
4
Center for Biosafety Research and Strategy, Tianjin University, Tianjin 300072, China
*
Authors to whom correspondence should be addressed.
Submission received: 22 March 2022 / Revised: 6 May 2022 / Accepted: 13 May 2022 / Published: 15 May 2022
(This article belongs to the Special Issue Diversity and Dynamics of Microbial Communities in Marine Ecosystems)

Abstract

:
Labyrinthulomycetes protists (LP) play an important role in ocean carbon cycling with an ubiquitous presence in marine ecosystems. As one of the most important environmental factors, salinity is known to regulate their diverse metabolic activities. However, impacts of salinity gradient on their distribution and ecological functions in natural habitats remain largely unknown. In this study, the dynamics of LP abundance and community structure were examined in the surface water of plume, offshore, and pelagic habitats in the South China Sea (SCS). The highest (5.59 × 10⁵ copies L−1) and lowest (5.28 × 10⁴ copies L−1) abundance of LP were found to occur in the waters of plume and pelagic habitats, respectively. Multiple dimensional scaling (MDS) analysis revealed a strong relationship between salinity and LP community variation (p < 0.05, rho = 0.67). Unexpectedly, relative low LP diversity was detected in the brackish water samples of the plume. Moreover, our results indicated the genus Aplanochytrium dominated LP communities in offshore and pelagic, while Aurantiochytrium and Ulkenia were common in the plume. Physiological and metabolic features of these genera suggested that LP ecological functions were also largely varied along this salinity gradient. Clearly, the salinity gradient likely regulates the diversity and functional partitioning of marine protistan micro-eukaryotes in the world’s oceans.

1. Introduction

Changes in marine environmental factors influence the growth rate of individual microbial taxa, shape various microbial communities, and, in turn, affect the biogeochemical functions of microbes in different marine habitats [1,2,3,4,5]. In the coastal area, the riverine inputs largely change the environmental factors of seawaters. Among these factors, a salinity gradient is generally obvious and thus regarded as a sign of environmental gradients [2,6,7]. In fact, salinity itself is one of the most important environmental parameters to affect various biological aspects of microbes [8,9,10,11,12]. Particularly, salinity gradient is known to significantly affect the community and diversity of marine microbes. For instance, Beta-proteobacteria and Actinobacteria dominate bacterial communities in estuaries, while Alpha- and Gamma-proteobacteria occur largely in the oceanic waters [11,13,14,15]. Beta-diversity analyses (such as MDS and NMDS ) of some previous studies have revealed strong relationships (p < 0.001, r > 0.7) between salinity and bacterioplankton communities [8,14]. From estuary to open ocean, it can be separated into several different habitats such as estuarine (salinity < 30‰), offshore (depth < 200 m and salinity > 30‰), and epipelagic (depth > 200 m and salinity > 30‰). Bacterioplankton communities were also found to be different in these different habitats [8,14]. Moreover, salinity change was found to largely affect the bacterioplankton diversity of both their populations and functional genes in the coastal area of the East China Sea [16]. Phytoplankton and zooplankton communities are also greatly affected by salinity gradient [17,18,19,20]. Particularly, as the salinity exceeds 3‰, freshwater phytoplankton and zooplankton have been reported to disappear rapidly [18,19]. The richness and Shannon index of phytoplankton and zooplankton were found to be relatively low in brackish waters, suggesting that the low salinity suppresses their diversity [17,20]. Traditionally, heterotrophic micro-eukaryotes (i.e., protists and fungi) were generally considered to benefit from the relative vacancy of the brackish ecological niches from other microplankton groups. Their richness and/or Shannon diversity have always been reported to be high in estuary/plume waters/sediments [20,21,22]. For example, along the salinity gradient of Rhode Island, the observed fungal richness in plume marsh (113 OTUs in 99% similar) was 1.4-fold higher than that in salt marsh (79 OTUs) [22]. Recently, in the Pearl River-influenced region, one study also uncovered the species number of protists in the plume (905 OTUs in 95% similar, salinity 18‰) was higher than that of pelagic (762 OTUs, salinity 34‰) and freshwaters (692 OTUs, salinity 0‰) [23], suggesting that most of the micro-eukaryotes can adapt to the less-saline environment.
As a major group of marine heterotrophic micro-eukaryotes, Labyrinthulomycetes protists (LP) have attracted increased attention in recent years. Due to their high cell volume (average 212.5 µm3) and carbon content (96.4 pg C per cell) [24], LP are usually found with high biomass in coastal and oceanic ecosystems (occasionally exceeding that of bacterioplankton), and thus considered to be a major significant contributor to the secondary production [25,26,27,28]. LP are well-known for their diverse nutrition models (e.g., saprophyte, parasite, bacterivory, and even herbivory) in diverse marine habitats [29,30,31]. In coastal and pelagic waters, they have been shown to display significant temporal and spatial variations in community levels in both coastal and pelagic waters (such as the coastal zone of Bohai Sea, Osaka Bay, and pelagic zone of the South China Sea) [25,26,32]. Particularly, LP have been reported to display distinct depth-related or seasonal-related (e.g., insolation and temperature) ecotype partitioning, suggesting their unique adaptive ability to environmental gradients [25,26,27,32,33].
Salinity has been reported to largely regulate the growth, life cycle, and even diverse metabolic activities of culturable LP strains [34,35,36,37]. It has been reported to affect the production and motility of LP zoospores [37]. For example, when the salinity increased from 7.5‰ to 20‰, the rate of zoospores’ production and motility of Aurantiochytrium mangrovei sp. KF6 decreased from 90% to 50%, and, the zoospores’ motility of Thraustochytrium striatum sp. KF9 increased by more than 60% [37]. Thus, different LP strains seem to have different preference and tolerance to salinity levels. In addition, salinity has been reported to affect the biomass and high-valued bioproducts’ (e.g., DHA and squalene) accumulation of Aurantiochytrium strains [34,35,36,38]. However, little is known about the impact of salinity gradients on the distribution and ecological functions of LP communities in natural marine environments.
The Pearl River has the second largest discharge volume (~336 km3 per year) among rivers in China and its outflow largely influences the South China Sea (SCS) [39,40,41]. The discharge of Pearl River has obvious seasonality and most of it occurs disproportionately (about 80% of the annual discharge) in summer [39,40,41]. Therefore, during the summer, the horizontal extension of the Pearl River-influenced SCS region is advected eastward, generating a series of habitats with a distinct salinity gradient [42,43], which provided us with an ideal system to study the changes of LP along the salinity gradient. In this study, the abundance and community structure of LP in the Pearl River-influenced SCS surface waters were investigated along a plume, offshore, and pelagic gradient during two summer cruises (2016 and 2018). Further, the abundance and diversity variation of bacterioplankton along the same environmental gradient was assessed and performed as a control. The ultimate goal of the current study was to understand the impacts of riverine inputs on the distribution and ecological function of Labyrinthulomycetes protists.

2. Materials and Methods

2.1. Seawater Sampling

Seawater samples were collected from surface waters of offshore and pelagic ocean during two summer cruises (May–June 2016 and June–August 2018) of the South China Sea (Figure 1, Table S1). At each station, two liters of water were collected by a Sea Bird CTD rosette sampler and filtered through 0.22 μm polycarbonate Isopore membrane filters (Millipore, USA). The resulting filters were frozen at −80 °C until further use. For the flow cytometric (FCM) analysis of the bacterioplankton, 1.5 mL of seawater was transferred into a 2 mL cryovial in triplicate, fixed with 0.22 μm filtered glutaraldehyde (0.5% final concentration), and incubated for 15 min at 4 °C.
Temperature and salinity at each station were measured with their respective probes equipped with the Sea Bird CTD rosette sampler. The plume stations were defined using the method proposed by previous reports and included those offshore stations with salinity less than 32.5‰ [42,44].

2.2. Quantification of LP and Bacterioplankton

The total genomic DNA of individual filters was extracted using a Water DNA kit (OMEGA, Norcross, GA, USA) according to the manufacturer’s protocol. Using the LP-specific primers (SYBR-ThrF and SYBR-ThrR), the abundance of 18S rRNA genes of LP was determined by qPCR method as described previously [45]. Plasmids containing genes of interest were used to construct the standard curve. The qPCR reactions were performed on an CFX ConnectTM Real-Time System (Bio-Rad, Richmond, CA, USA) in 20 μL reaction containing 10 μL of ChamQ SYBR Green Supermix (Vazyme, China), 0.5 μL of each primer (5 μM), 8 μL of sterile Milli-Q water, and 1 μL of pre-diluted (10×) template DNA. The qPCR program was set for initial denaturation at 95 °C for 3 min, followed by 40 cycles of 30 s at 95 °C and 30 s at 60 °C [45]. Melting curve analysis was then performed after 40 cycles by heating the samples from 65 °C to 95 °C to confirm the specificity of primer pairs.
To determine bacterioplankton abundance, water samples were stained with SYBR-I Green solution (1:500 dilution) and counted with a FACS Calibur flow cytometer (BD-Biosciences, Franklin Lakes, NJ, USA) following the procedures described in a previous study [25]. Yellow-green, fluorescent polystyrene latex beads (Molecular Probes, Eugene, OH, USA) were added to individual FCM sample as an internal standard.

2.3. High-Throughput Sequencing Analysis

A total of 30 water samples were selected for the diversity analysis of LP and bacterioplankton along the salinity gradient (Table S2). Barcoding LP-specific primers, LABY-A (5′-GGGATCGAAGATGATTAG-3′) and LABY-Y (5′-CWCRAACTTCCTTCCGGT-3) were used for the high-throughput sequencing of LP 18S rRNA genes [46]. The 25 μL PCR reaction mixture contained 12.5 μL of Taqmix (Takara Bio, Otsu, Japan), 1 μL (10 μM) each of the barcoding primers, 1 μL of template DNA, and 9.5 μL sterile Milli Q water. The PCR reactions were carried out using the following protocol: 95 °C for 5 min, 35 cycles of 60 s at 95 °C, 60 s at 52 °C, and 60 s at 72 °C, with a final extension at 72 °C for 20 min [27]. The V3–V4 region of bacterial 16S rRNA gene was amplified using the universal primers 338F (ACTCCTACGGGAGGCAGCA) and 806R (GGACTACHVGGGTWTCTAAT) [47]. The 25 μL PCR reaction contained 12.5 μL of Taqmix (Takara Bio, Japan), 1 μL (10 μM) each of the barcoding primers, 1 μL of template DNA, and 9.5 μL sterile Milli Q water. The PCR reactions were used in the following protocol: 95 °C for 3 min, 35 cycles of 30 s at 95 °C, 30 s at 55 °C, and 45 s at 72 °C, with a final extension at 72 °C for 10 min [48].
PCR products from triplicate reactions for each sample were combined, purified with TIANquick Midi Purification Kit (Beijing, China), and then quantified with NanoDrop (Thermo Scientific, Waltham, MA, USA) and sequenced on the Illumina Miseq platform at Allwegene Tech Company (Beijing, China).

2.4. Bioinformatics and Statistical Analysis

Sequence analysis was performed with QIIME 2 [49]. Raw sequences were trimmed to remove primer and adapters’ sequences were trimmed with CUTADAPT [50]. The plugin DADA2 was used for further quality trimming, denoising, paired-end read merging, and removing chimeras [51]. Taxonomy of the resulting amplicon sequence variants (ASVs) was assigned using SILVA SSU rRNA database (version 138). Singleton ASVs were then excluded from the feature table. The alpha-diversity indices (observed ASVs numbers, Shannon index calculated based on natural logarithm) were calculated using the diversity plugin of QIIME 2, with an even subsampling depth of 9690.
Multiple dimensional scaling (MDS) analysis of different samples was performed with the vegan package in R 3.4.2 (R Core Team, 2017). Pairwise.wilcox test after the Kruskal–Wallis test was used to evaluate the significant levels of the abundance and diversity differences of LP and bacterioplankton among different habitats.

3. Results

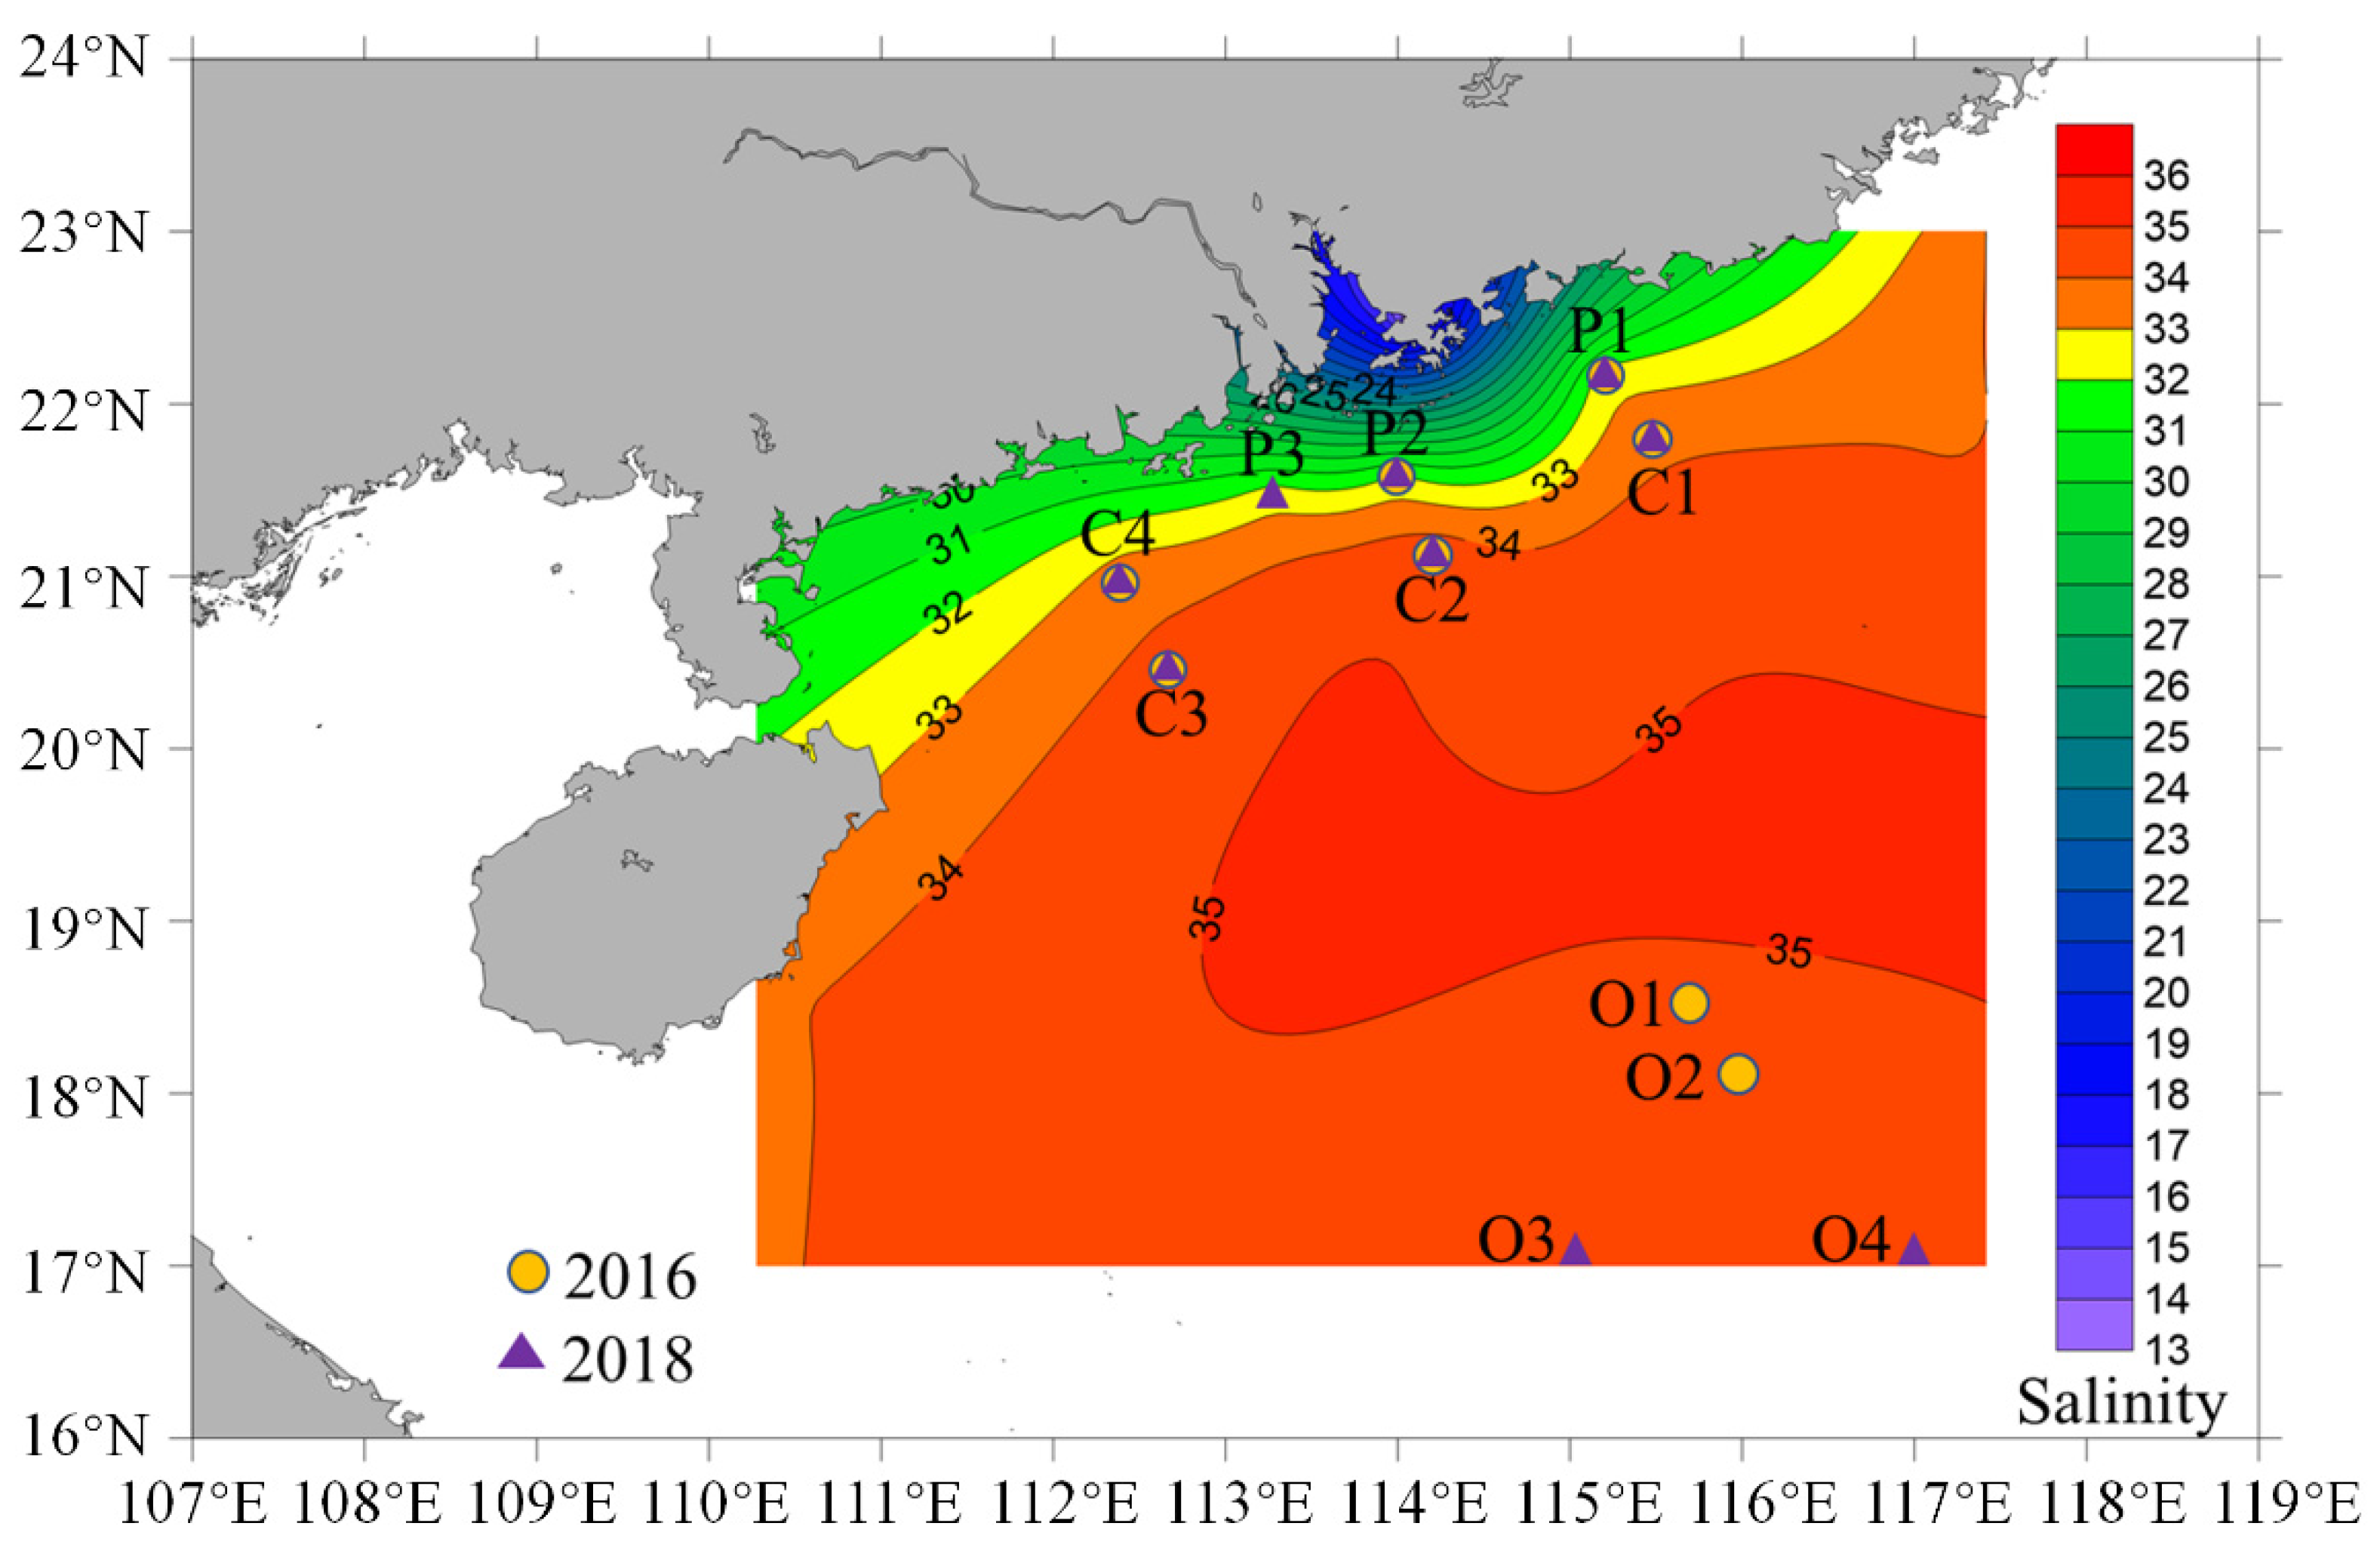
3.1. Environmental Characterization of the Study Area

In both of the 2016 and 2018 cruises, a clear salinity gradient was evident from the Pearl River plume (in the range of 31.72–32.50‰ and 31.79–32.20‰, respectively) to the open ocean of the South China Sea (in ranges of 34.11–34.58‰ and 33.71–33.78‰, respectively) (Figure 1, Table S1). The Pairwise.wilcox test further indicated that the salinity of plume habitat was significantly lower (p < 0.01) than that of the offshore and pelagic habitats, while no significant difference (p > 0.05) at their salinity level was observed between the offshore and pelagic habitats. Compared with the salinity gradient, the gradient of temperature from plume to the open ocean was not obvious (Table S1). Indeed, the temperatures of all samples were mostly ranged from 28 to 29 °C. No significant temperature difference (p > 0.05, Pairwise.wilcox test) was found among the plume, offshore, and pelagic habitats.

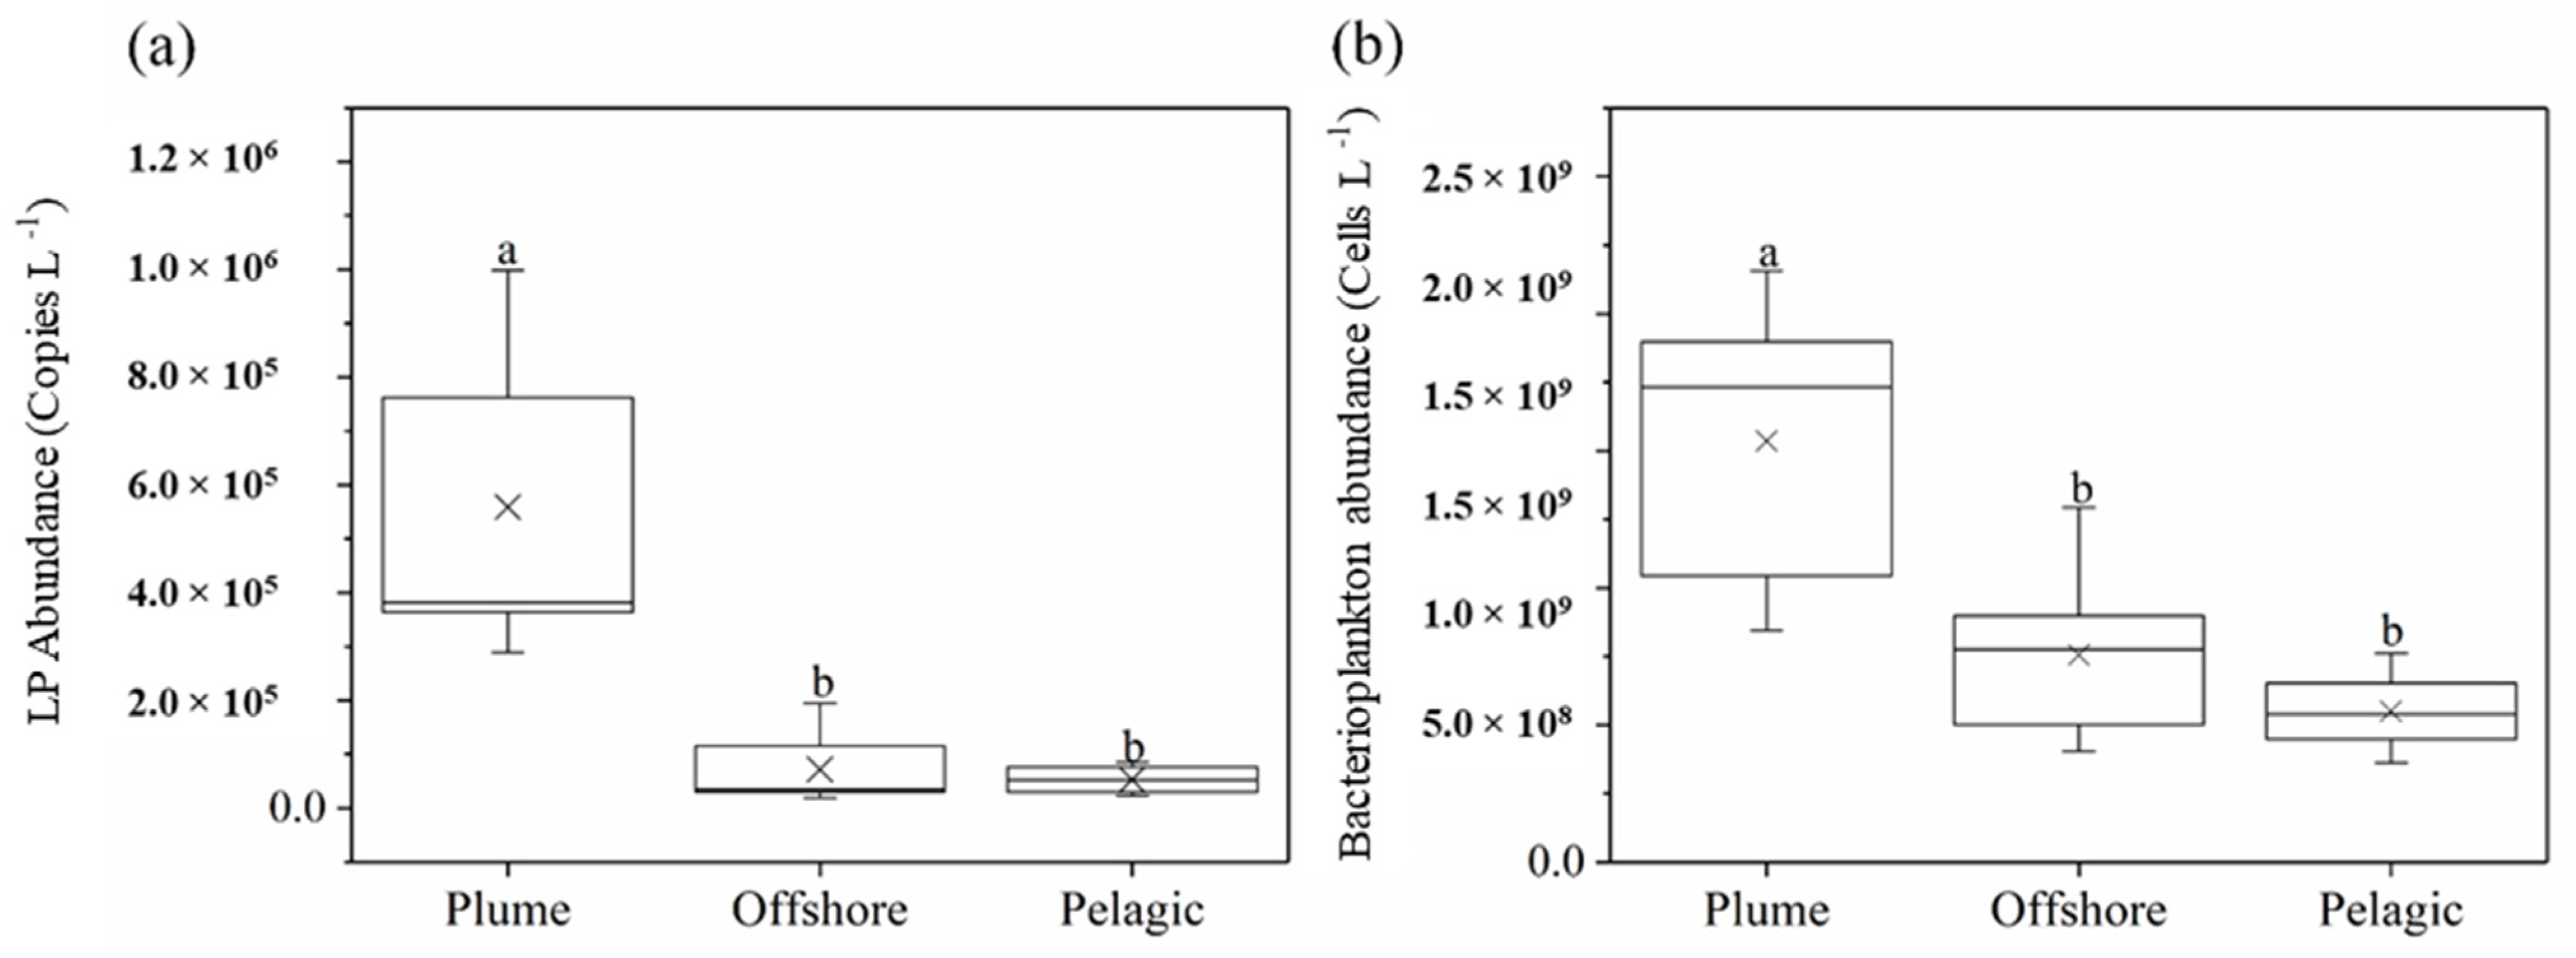
3.2. LP Abundance Dynamics along the Salinity Gradient

No significant difference (p > 0.05, Pairwise.wilcox test) was detected in the LP abundance of the same habitat (plume, offshore or pelagic) between the two cruises (Figure 2a). However, LP abundance was found to display significant differences (p < 0.05, Pairwise.wilcox test) among three different habitats. The highest (5.59 × 10⁵ copies L−1) and lowest (5.28 × 10⁴ copies L−1) average LP abundance was detected in the waters of plume and pelagic, respectively, with the middle LP abundance (7.14 × 10⁴ copies L−1) detected in the offshore waters (Figure 2a). The bacterioplankton abundance along the plume to the pelagic gradient displayed a similar pattern as that of the LP (Figure 2b). The highest (1.54 × 10⁹ cells L−1) and the lowest (5.51 × 10⁸ cells L−1) bacterioplankton abundance occurred in the surface waters of the plume and the pelagic waters, respectively.

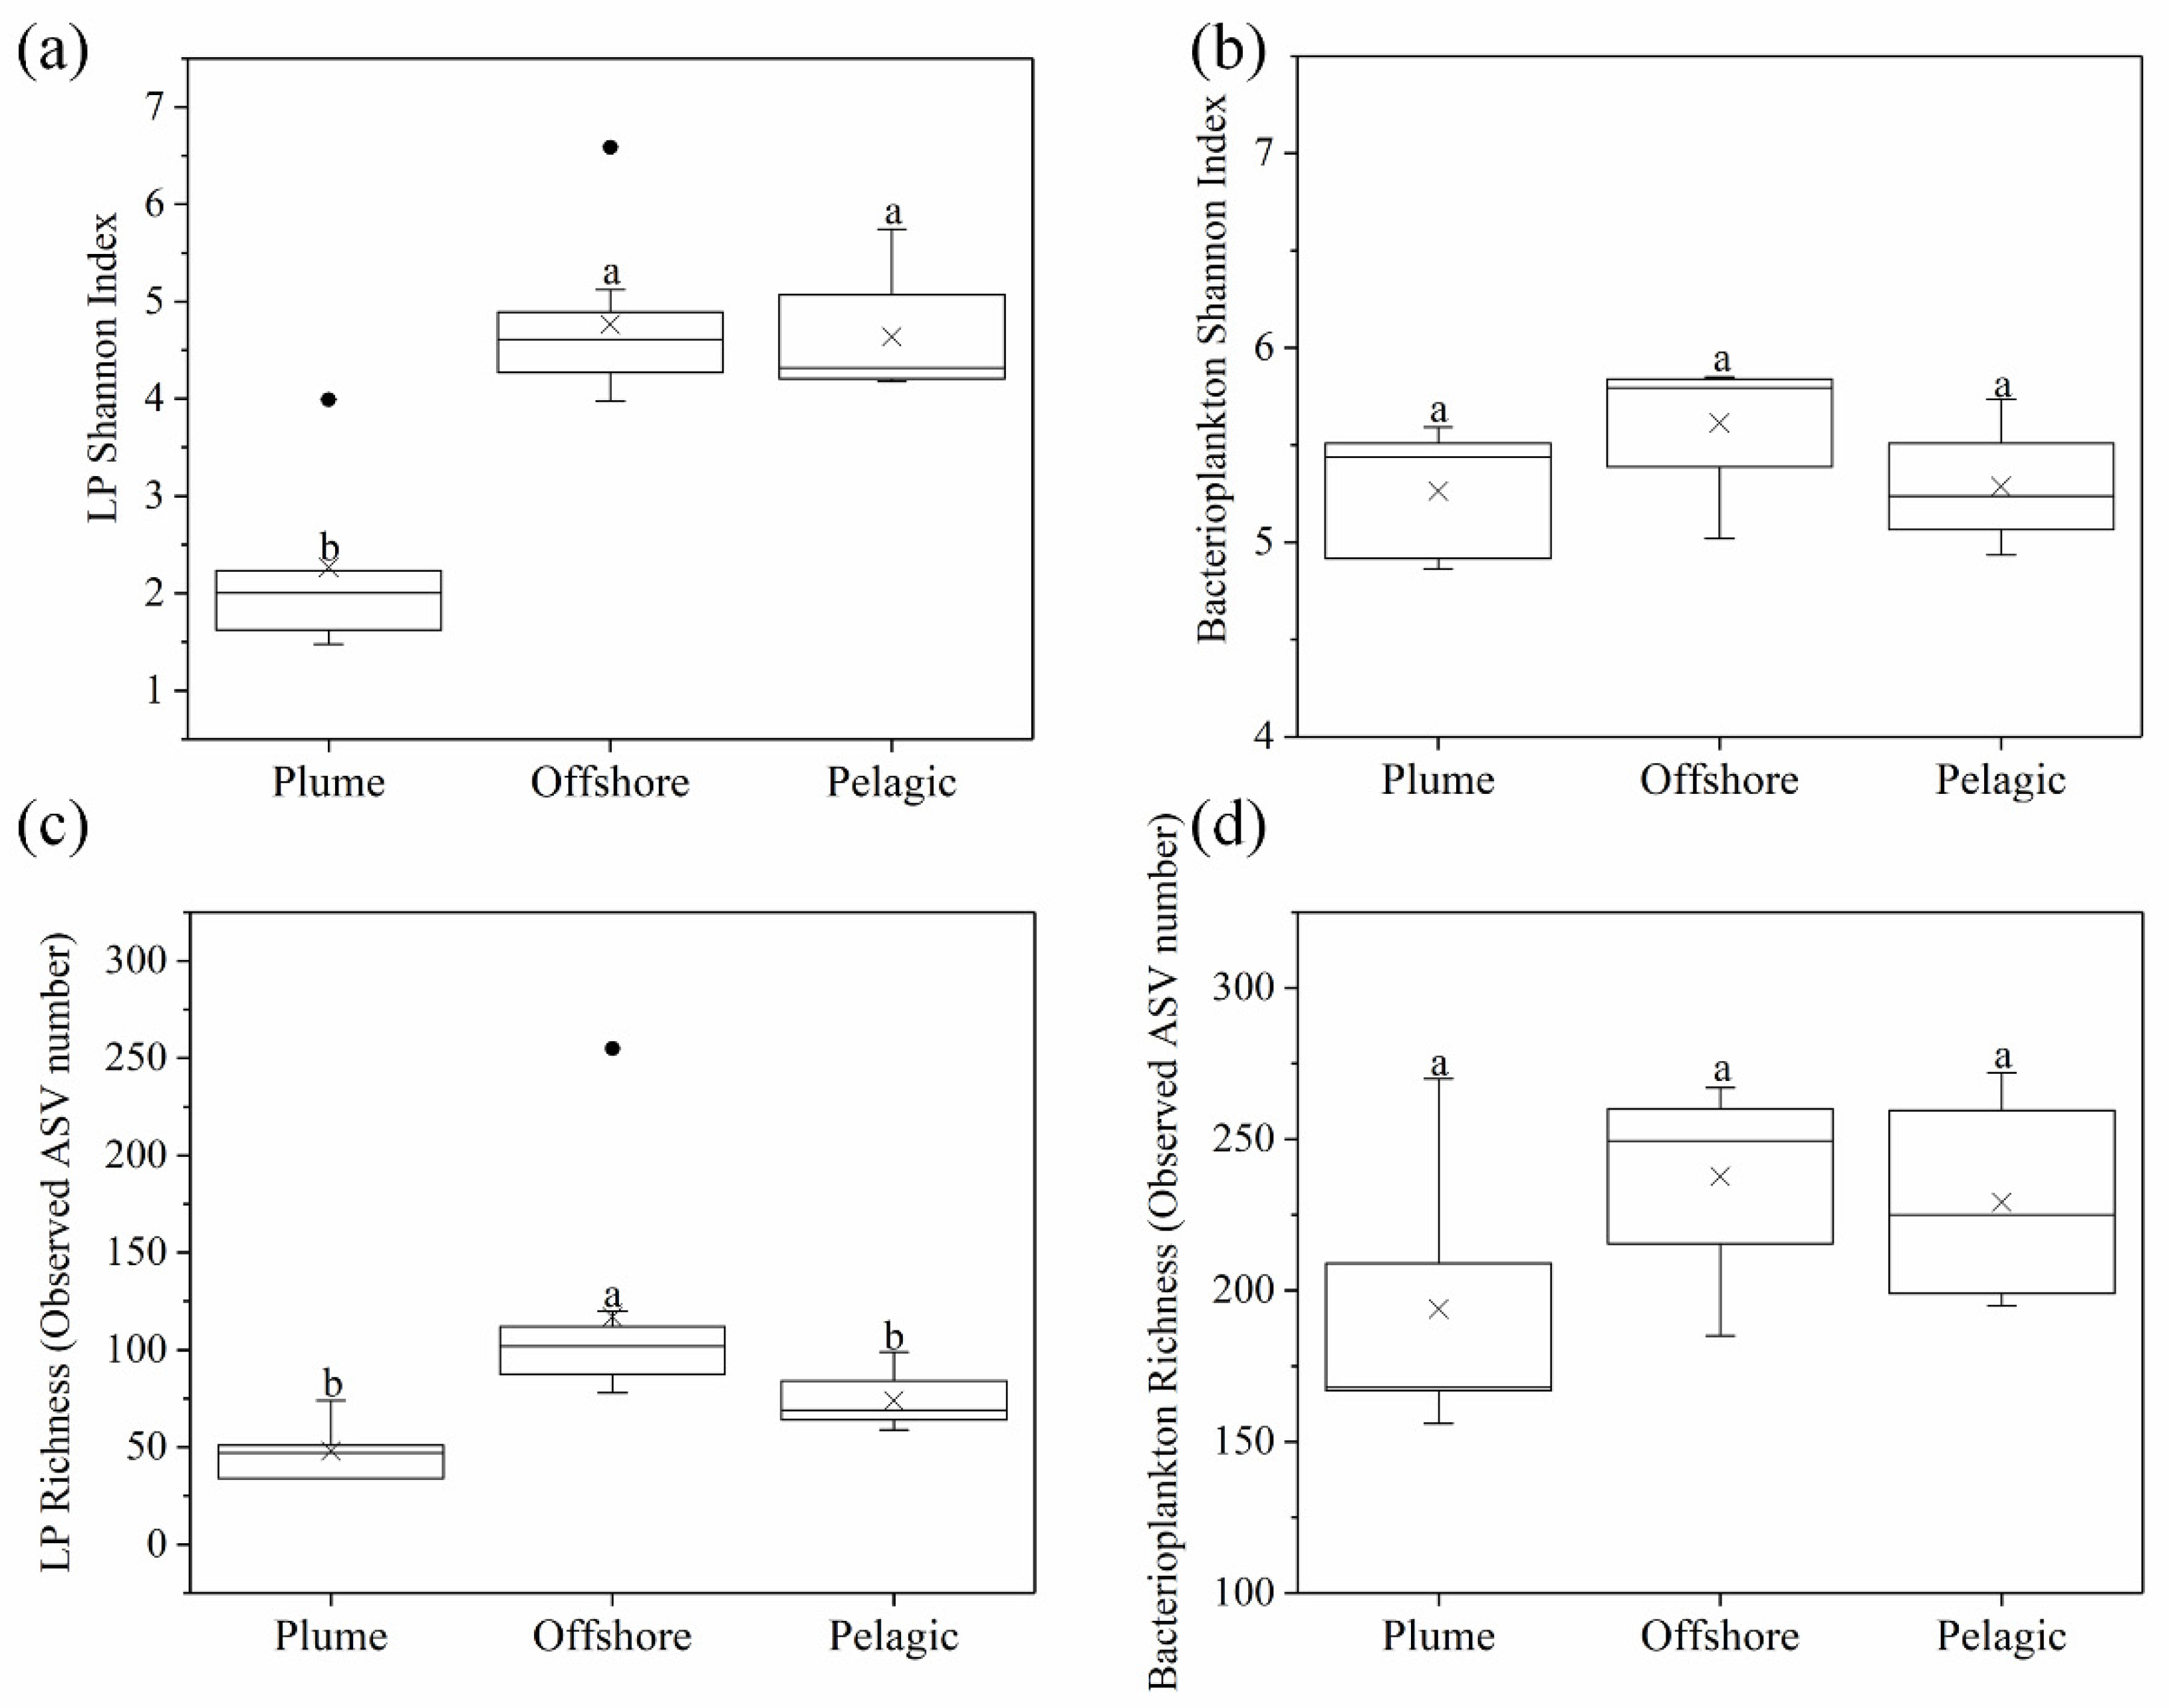
3.3. Impact of the Salinity Gradient on the Diversity of LP

To understand the impact of the salinity gradient on the diversity of the LP communities, LP-specific (Laby-A and Laby-Y) and bacterial universal (338F and 806R) primers were used for high-throughput sequencing analysis for a total of 30 samples. A total of 652,463 and 399,426 sequences were obtained for LP and bacterioplankton, respectively. These sequences were clustered into 806 LP ASVs and 1,230 bacterioplankton ASVs, respectively.
Alpha-diversity analyses did not detect significant differences in the species richness and Shannon index of bacterioplankton among three habitats (Figure 3b,d). However, LP richness and Shannon diversity varied significantly (p < 0.05, Pairwise.wilcox test) among three different habitats (Figure 3a,c). Notably, although the plume region was found with the highest LP abundance, the species richness and Shannon diversity (in average, 48 ASVs and 2.26, respectively) of the region were much lower than those of the offshore (in average 117 ASVs and 4.76, respectively) and pelagic (in average, 74 ASVs and 4.64, respectively) (Figure 3a,c).
Metric Multidimensional Scaling (MDS) analysis revealed significant differences (permutation MANOVA, p < 0.05) in both bacterioplankton and LP communities among different habitats (Figure 4). High correlations between Dimension 1 and salinity were also uncovered in both LP (absolute Spearman’s rho = 0.67, p < 0.05) and bacterioplankton (absolute Spearman’s rho = 0.76, p < 0.05) MDS analysis, suggesting their community variations have a strong relationship with the salinity change. Comparatively, no significant correlations were detected between Dimension 1 and temperature in both LP (absolute Spearman’s p = 0.6871 > 0.05) and bacterioplankton (absolute Spearman’s p = 0.0974 > 0.05) MDS analyses, suggesting the water temperature did not affect the microplankton communities’ variations in this study. Further permutation MANOVA analysis showed the bacterioplankton community structure in the plume, offshore, and pelagic was significantly different from each other (p < 0.05, permutation MANOVA) (Table S3). Thus, bacterioplankton communities can be separated into three different groups (plume, offshore, and pelagic) along the Pearl River salinity gradient, which was consistent with the results of several previous studies carried out in the habitats with obvious salinity gradients, including the Delaware Bay, Oregon, and Changjiang coast [8,11,52]. Although LP communities in the plume were still significantly different from those in the offshore and pelagic (p < 0.05, permutation MANOVA), their communities in offshore and pelagic unexpectedly displayed no significant difference (p > 0.05, permutation MANOVA) (Table S4). Thus, LP was likely to be separated into two groups along the salinity gradient: plume and oceanic (including offshore and pelagic).
To better understand the response of LP communities to the salinity change, we classified individuals of the ASVs based on the location where they exhibited their maximum average relative abundance of sequences. The results indicated only 3% and 5% plume sequences were identical to those ASVs derived from samples from offshore and pelagic regions, respectively (Figure 5). Thus, the plume region harbored different LP populations from those of oceanic (offshore and pelagic) regions. On the other hand, plume ASVs accounted for 23% and 13% of the sequences of the offshore and pelagic communities, respectively (Figure 5). Therefore, more plume ASVs were found in oceanic environments in comparison to the plume regions.

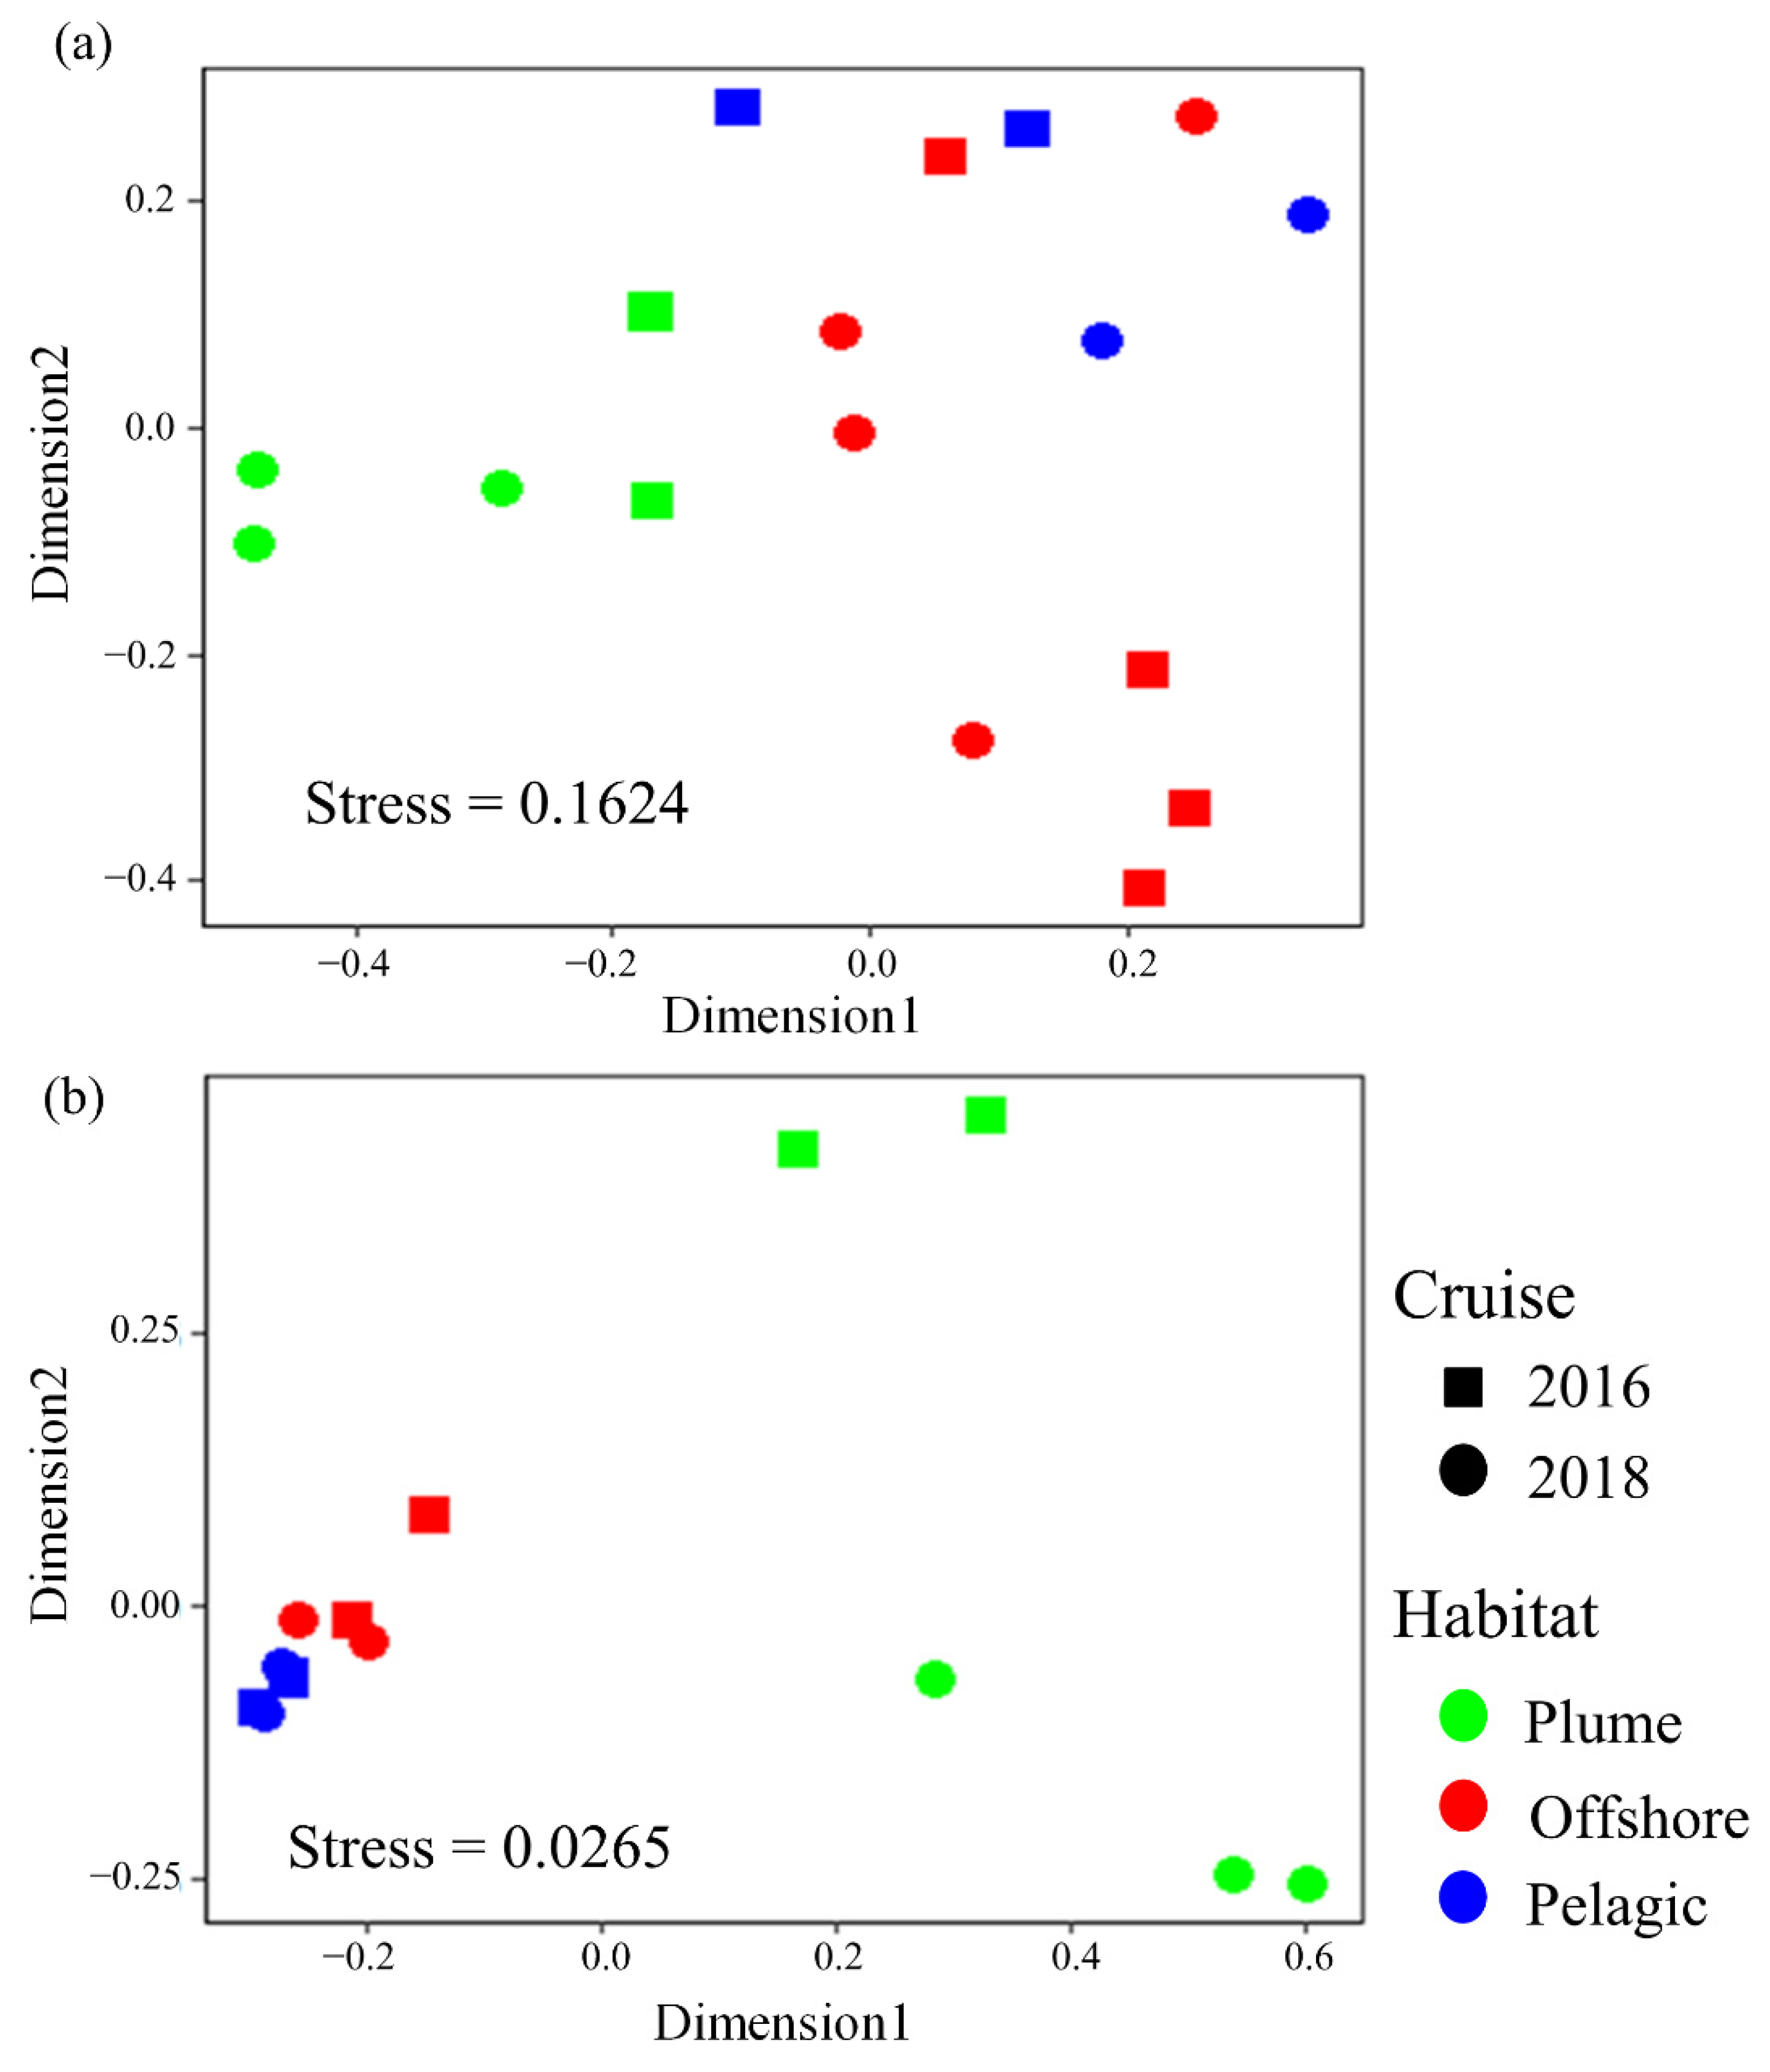
3.4. Composition of Dominant LP ASVs in Different Habitats

To understand the ecological function change within the LP communities along the salinity gradient, dominant ASVs of each habitat (Top 50 ASVs) were examined and annotated on the genera level. In the present study, the genus composition of LP changed along the salinity gradient. Aplanochytrium, Ulkenia, and Aurantiochytrium were the dominant genera (relative abundance more than 10% of the total sequences) of the plume (Figure 6a), which accounted for 27.6%, 17.9%, and 11.0% of the total plume sequences, respectively. While in the offshore and pelagic, only Aplanochytrium was the dominant genus (Figure 6a). In fact, Aplanochytrium accounted for 21.8% and 32.9% of the total sequences in offshore and pelagic waters, respectively, which exceeded the sum of all other annotated genera in the offshore and pelagic habitats. Based on the further Venn analysis, most of offshore-specific and pelagic-specific dominant ASVs were also annotated as Aplanochytrium. Comparatively, plume specialists were mostly annotated as Ulkenia and Aurantiochytrium. Overall, these results suggested that LP composition varied along the salinity gradient.

4. Discussion

The abundance of LP and bacterioplankton have been reported to be higher in the coastal environments than the oceanic waters [15,25,27,45,53,54,55]. Thus, it was no surprise that LP/bacterioplankton abundance in the offshore zone were all nearly 1.4-fold higher than that of those from pelagic waters (Figure 2a). However, compared to the 2-fold increase of bacterioplankton average abundance from offshore waters to plume waters, the average abundance of LP increased more than 7-fold along the same environmental gradient (Figure 2), suggesting the special significance of plume to LP abundance. Interestingly, in the summer of 2015, one study revealed the average LP molecular abundance (3.45 × 10⁶ copies L−1) in the Pearl River estuary adjacent to the plume habitat of this study, was nearly 6-fold higher than that of plume [45]. Water salinity in the Pearl River estuary ranged from 13‰ to 20‰, which was also significantly lower than the salinity level of plume (~31‰). Results of the culturable strains indicated that the salinity levels for the optimum growth of most culturable LP strains ranged from 15‰ to 30‰ [34,35,56], which was much closer to the salinity level of the estuary and plume. Thus, the lowered salinity in the estuary and plume may enhance the growth speed of the majority of LP communities and finally increase their abundance. In addition, LP tended to release zoospores after physical changes in their environment (such as inoculation into fresh liquid medium) [32,57]. Thus, the physical changes caused by riverine inputs may act as a stimulus of LP to release zoospores and finally, form the spikes of LP in plume/estuary. Furthermore, LP abundance generally displayed significant positive correlations with NO₃⁻ or Chl-a in coastal areas [25,27,45,58]. Previous studies have revealed the concentrations of both NO3 and Chl-a were negatively correlated with the salinity level near the Pearl River estuary [9,42,59]. Therefore, the low salinity level is generally associated with the high levels of NO₃⁻and Chl-a, which usually supported the high abundance of the LP communities. In other words, the variation of LP abundance, which resulted from the salinity gradient, likely was ascribed to the indirect impacts of other environmental factors.
The lower alpha-diversity was detected in the plume than that of the offshore and pelagic, however, was not consistent with general fungi/protists’ diversity patterns along the salinity gradient [20,21,22,23], suggesting most of LP were adaptable to the high-salinity environment while sensitive to the low-salinity environment. Moreover, although a lot of studies have reported a decrease in an LP growth rate with a decrease in NaCl concentration in media, most of the culturable strains could still accumulate more than 50% of their highest culturable biomass in low-salt media (as low as 0 NaCl) [35,60]. However, our results suggested that only few LP can adapt to the low-salinity environment, which conflicted with the previous culturable results. The limitation of separation habitats of these culturable strains may be one reason for this phenomenon. In fact, most of the culturable LP strains were isolated from estuary or mangrove areas [61]. As they are living in a low-salinity environment, these culturable strains were likely to adapt to low-salinity environments. In addition, although some studies tried to isolate LP from offshore (such as offshore areas of Japan and Norway) [62,63,64] and saline (such as saline environments of the Argentinean continental shelf) seawaters [65], the salinity equivalent used in their culture progress was usually only 50%–70% of the seawater (salinity 15‰–21‰) [62,63,64,65]. Considering the sensitivity of oceanic LP to the low-salinity environment (Figure 3), it was possible that only low-salinity adaptive LP may be isolated by these studies.
At the genus level, plume LP communities were characterized by their high relative abundance of Aurantiochytrium and Ulkenia. Some previous studies have isolated a lot of Aurantiochytrium strains from mangrove and coastal habitats [66,67,68]. In the Pearl River estuary, one previous study also revealed more than 50% of the LP isolated were annotated as Aurantiochytrium [67]. Thus, it was no surprise to find a high abundance of Aurantiochytrium in the plume (Figure 6). Comparatively, Ulkenia was first found with surprisingly tremendous relative abundance in the plume (Figure 6). One previous study has revealed that Ulkenia zoospores were associated with the bottom of naturally turbid estuaries and may swim away from high light intensities [69]. Although light intensity was not measured in our study, due to the input of the river, the plume region was obviously more turbid than the oceanic environment to attract Ulkenia zoospores. Consistent with the well-documented osmotrophic modes of Aurantiochytrium and Ulkenia [54], these protists could play an important role as decomposers of riverine detritus. Comparatively, Aplanochytrium was found more important in the LP communities of the offshore and pelagic ocean. Aplanochytrium was characterized by the ability to prey on living diatoms through the specialized ectoplasmic nets [70]. This suggested that these protists may play different ecological roles in different habitats.

5. Conclusions

This study provided a comprehensive description of the abundance, diversity, and community structure of an important unicellular heterotrophic eukaryotes group, Labyrinthulomycete protists (LP), along a plume to pelagic gradient of the South China Sea. The salinity gradient was found not only to have affected the LP diversity level, but also controlled their community structure. While contrary to expectations, LP diversity in the plume was significantly lower (p < 0.05) than that of offshore and pelagic habitat. With the analysis of dominant ASVs’ composition in each habitat, our study further revealed differential dominant LP genera composition among plume and oceanic, and provided new perspectives on their potential change of ecological functions along the salinity gradient.

Supplementary Materials

The following supporting information can be downloaded at https://www.mdpi.com/article/10.3390/w14101580/s1, Table S1 Sampling stations and environmental parameters; Table S2: Sampling stations for LP and bacterioplankton diversity, Table S3: Pairwise comparisons for bacterioplankton composition using permutation MANOVA, Table S4: Pairwise comparisons for LP composition using permutation MANOVA.

Author Contributions

Conceptualization, G.W. and M.B.; methodology, S.W. and M.B.; software, M.B.; validation, M.B., K.S. and Y.H.; formal analysis, S.W.; investigation, S.W.; resources, M.B.; data curation, M.B.; writing—original draft preparation, M.B., G.W. and S.W.; writing—review and editing, G.W. and Y.H.; visualization, M.B.; supervision, G.W.; project administration, G.W.; funding acquisition, G.W. All authors have read and agreed to the published version of the manuscript.

Funding

This research was funded by National Natural Science Foundation (NSFC), grant number 32170063.

Institutional Review Board Statement

Not applicable.

Informed Consent Statement

Not applicable.

Data Availability Statement

The LP and bacteria SRA sequencing data are available in NCBI’s database under BioProject PRJNA818263 and PRJNA818281, respectively.

Conflicts of Interest

The funders had no role in the design of the study; in the collection, analyses, or interpretation of data; in the writing of the manuscript, or in the decision to publish the results.

References

  1. Nemergut, D.R.; Costello, E.K.; Hamady, M.; Lozupone, C.; Jiang, L.; Schmidt, S.K.; Fierer, N.; Townsend, A.R.; Cleveland, C.C.; Stanish, L.; et al. Global patterns in the biogeography of bacterial taxa. Environ. Microbiol. 2011, 13, 135–144. [Google Scholar] [CrossRef] [PubMed]
  2. Bartl, I.; Liskow, I.; Schulz, K.; Umlauf, L.; Voss, M. River plume and bottom boundary—Hotspots for nitrification in a coastal bay? Estuar. Coast. Shelf Sci. 2018, 208, 70–82. [Google Scholar] [CrossRef]
  3. Wu, K.; Dai, M.; Li, X.; Meng, F.; Chen, J.; Lin, J. Dynamics and production of dissolved organic carbon in a large continental shelf system under the influence of both river plume and coastal upwelling. Limnol. Oceanogr. 2017, 62, 973–988. [Google Scholar] [CrossRef]
  4. Henley, S.F.; Cavan, E.L.; Fawcett, S.E.; Kerr, R.; Monteiro, T.; Sherrell, R.M.; Bowie, A.R.; Boyd, P.W.; Barnes, D.K.A.; Schloss, I.R.; et al. Changing biogeochemistry of the Southern Ocean and its ecosystem implications. Front. Mar. Sci. 2020, 7, 581. [Google Scholar] [CrossRef]
  5. Fuhrman, J.A. Microbial community structure and its functional implications. Nature 2009, 459, 193–199. [Google Scholar] [CrossRef]
  6. Frigstad, H.; Kaste, Ø.; Deininger, A.; Kvalsund, K.; Christensen, G.; Bellerby, R.G.J.; Sørensen, K.; Norli, M.; King, A.L. Influence of riverine input on Norwegian coastal systems. Front. Mar. Sci. 2020, 7, 332. [Google Scholar] [CrossRef]
  7. Telesh, I.V.; Khlebovich, V.V. Principal processes within the estuarine salinity gradient: A review. Mar. Pollut. Bull. 2010, 61, 149–155. [Google Scholar] [CrossRef]
  8. Fortunato, C.S.; Herfort, L.; Zuber, P.; Baptista, A.M.; Crump, B.C. Spatial variability overwhelms seasonal patterns in bacterioplankton communities across a river to ocean gradient. ISME J. 2012, 6, 554–563. [Google Scholar] [CrossRef]
  9. Zhang, Y.; Zhao, Z.; Dai, M.; Jiao, N.; Herndl, G.J. Drivers shaping the diversity and biogeography of total and active bacterial communities in the South China Sea. Mol. Ecol. 2014, 23, 2260–2274. [Google Scholar] [CrossRef]
  10. Wang, Z.; Juarez, D.L.; Pan, J.F.; Blinebry, S.K.; Gronniger, J.; Clark, J.S.; Johnson, Z.I.; Hunt, D.E. Microbial communities across nearshore to offshore coastal transects are primarily shaped by distance and temperature. Environ. Microbiol. 2019, 21, 3862–3872. [Google Scholar] [CrossRef]
  11. Campbell, B.J.; Kirchman, D.L. Bacterial diversity, community structure and potential growth rates along an estuarine salinity gradient. ISME J. 2013, 7, 210–220. [Google Scholar] [CrossRef] [PubMed] [Green Version]
  12. Lozupone, C.A.; Knight, R. Global patterns in bacterial diversity. Proc. Natl. Acad. Sci. USA 2007, 104, 11436–11440. [Google Scholar] [CrossRef] [PubMed] [Green Version]
  13. Hu, Y.O.O.; Karlson, B.; Charvet, S.; Andersson, A.F. Diversity of Pico- to Mesoplankton along the 2000 km salinity gradient of the Baltic Sea. Front. Microbiol. 2016, 7, 679. [Google Scholar] [CrossRef] [PubMed]
  14. Herlemann, D.P.R.; Labrenz, M.; Jürgens, K.; Bertilsson, S.; Waniek, J.J.; Andersson, A.F. Transitions in bacterial communities along the 2000 km salinity gradient of the Baltic Sea. ISME J. 2011, 5, 1571–1579. [Google Scholar] [CrossRef] [Green Version]
  15. Zhang, Y.; Jiao, N.; Cottrell, M.T.; Kirchman, D.L. Contribution of major bacterial groups to bacterial biomass production along a salinity gradient in the South China Sea. Aquat. Microb. Ecol. 2006, 43, 233–241. [Google Scholar] [CrossRef] [Green Version]
  16. Wang, Y.; Rui, Z.; He, Z.; Van, N.; Zheng, Q.; Zhou, J.; Jiao, N. Functional gene diversity and metabolic potential of the microbial community in an estuary-shelf environment. Front. Microbiol. 2017, 8, 1153. [Google Scholar] [CrossRef]
  17. Muylaert, K.; Sabbe, K.; Vyverman, W. Changes in phytoplankton diversity and community composition along the salinity gradient of the Schelde estuary (Belgium/The Netherlands). Estuar. Coast. Shelf Sci. 2009, 82, 335–340. [Google Scholar] [CrossRef]
  18. Bessudova, A.Y.; Sorokovikova, L.M.; Firsova, A.D.; Kuz’mina, A.Y.; Tomberg, I.V.; Likhoshway, Y.V. Changes in phytoplankton community composition along a salinity gradient from the lower Yenisei River to the Kara Sea, Russia. Bot. Mar. 2014, 57, 225–239. [Google Scholar] [CrossRef]
  19. Nielsen, D.L.; Brock, M.A.; Vogel, M.; Petrie, R. From fresh to saline: A comparison of zooplankton and plant communities developing under a gradient of salinity with communities developing under constant salinity levels. Mar. Freshw. Res. 2008, 59, 549–559. [Google Scholar] [CrossRef]
  20. Telesh, I.; Schubert, H.; Skarlato, S. Life in the salinity gradient: Discovering mechanisms behind a new biodiversity pattern. Estuar. Coast. Shelf Sci. 2013, 135, 317–327. [Google Scholar] [CrossRef]
  21. Telesh, I.V.; Schubert, H.; Skarlato, S.O. Revisiting Remane’s concept: Evidence for high plankton diversity and a protistan species maximum in the horohalinicum of the Baltic Sea. Mar. Ecol. Prog. Ser. 2011, 421, 1–11. [Google Scholar] [CrossRef] [Green Version]
  22. Mohamed, D.J.; Martiny, J.B. Patterns of fungal diversity and composition along a salinity gradient. ISME J. 2011, 5, 379–388. [Google Scholar] [CrossRef] [PubMed]
  23. Li, R.; Jiao, N.; Warren, A.; Xu, D. Changes in community structure of active protistan assemblages from the lower Pearl River to coastal Waters of the South China Sea. Eur. J. Protistol. 2018, 63, 72–82. [Google Scholar] [CrossRef] [PubMed]
  24. Sen, B.; Li, J.; Lu, L.; Bai, M.; Wang, G. Elemental composition and cell mass quantification of cultured thraustochytrids unveil their large contribution to marine carbon pool. Mar. Drugs 2021, 19, 493. [Google Scholar] [CrossRef] [PubMed]
  25. Xie, N.; Sen, B.; Song, Z.; Zhao, Y.; Chen, Z.; Shi, W.; Zhang, Y.; Zhang, J.; Johnson, Z.I.; Wang, G. High phylogenetic diversity and abundance pattern of Labyrinthulomycete protists in the coastal waters of the Bohai Sea. Environ. Microbiol. 2018, 20, 3042–3056. [Google Scholar] [CrossRef]
  26. Bai, M.; Xie, N.; He, Y.; Li, J.; Collier, J.L.; Hunt, D.E.; Johnson, Z.I.; Jiao, N.; Wang, G. Vertical community patterns of Labyrinthulomycetes protists reveal their potential importance in the oceanic biological pump. Environ. Microbiol. 2022, 24, 1703–1713. [Google Scholar] [CrossRef]
  27. Liu, Y.; Singh, P.; Liang, Y.; Li, J.; Xie, N.; Song, Z.; Daroch, M.; Leng, K.; Johnson, Z.I.; Wang, G. Abundance and molecular diversity of thraustochytrids in coastal waters of southern China. FEMS Microbiol. Ecol. 2017, 93, fix070. [Google Scholar] [CrossRef]
  28. Damare, V.; Raghukumar, S. Abundance of thraustochytrids and bacteria in the equatorial Indian Ocean, in relation to transparent exopolymeric particles (TEPs). FEMS Microbiol. Ecol. 2008, 65, 40–49. [Google Scholar] [CrossRef] [Green Version]
  29. Raghukumar, S. Bacterivory: A novel dual role for thraustochytrids in the sea. Mar. Biol. 1992, 113, 165–169. [Google Scholar] [CrossRef]
  30. Raghukumar, S.; Damare, V.S. Increasing evidence for the important role of Labyrinthulomycetes in marine ecosystems. Bot. Mar. 2011, 54, 3–11. [Google Scholar] [CrossRef] [Green Version]
  31. Ragan, M.A.; MacCallum, G.S.; Murphy, C.A.; Cannone, J.J.; Gutell, R.R.; McGladdery, S.E. Protistan parasite QPX of hard-shell clam Mercenaria mercenaria is a member of Labyrinthulomycota. Dis. Aquat. Org. 2000, 42, 185–190. [Google Scholar] [CrossRef] [PubMed] [Green Version]
  32. Ueda, M.; Nomura, Y.; Doi, K.; Nakajima, M.; Honda, D. Seasonal dynamics of culturable thraustochytrids (Labyrinthulomycetes, Stramenopiles) in estuarine and coastal waters. Aquat. Microb. Ecol. 2015, 74, 187–204. [Google Scholar] [CrossRef]
  33. Xie, N.; Hunt, D.E.; Johnson, Z.I.; He, Y.; Wang, G. Annual partitioning patterns of Labyrinthulomycetes protists reveal their multifaceted role in marine microbial food webs. Appl. Environ. Microbiol. 2021, 87, e01652-20. [Google Scholar] [CrossRef] [PubMed]
  34. Leano, E.M.; Gapasin, R.S.J.; Polohan, B.; Vrijmoed, L.L.P. Growth and fatty acid production of thraustochytrids from Panay mangroves, Philippines. Fungal Divers. 2003, 12, 111–122. [Google Scholar]
  35. Wang, Q.; Sen, B.; Liu, X.; He, Y.; Xie, Y.; Wang, G. Enhanced saturated fatty acids accumulation in cultures of newly-isolated strains of Schizochytrium sp. and Thraustochytriidae sp. for large-scale biodiesel production. Sci. Total Environ. 2018, 631, 994–1004. [Google Scholar] [CrossRef]
  36. Zhang, A.; Xie, Y.; He, Y.; Wang, W.; Sen, B.; Wang, G. Bio-based squalene production by Aurantiochytrium sp. through optimization of culture conditions, and elucidation of the putative biosynthetic pathway genes. Bioresour. Technol. 2019, 287, 121415. [Google Scholar] [CrossRef]
  37. Tsu, C.K.M.; Fan, K.W.; Chow, R.K.K.; Jones, E.B.G.; Vrijmoed, L.L.P. Zoospore production and motility of mangrove thraustochytrids from Hong Kong under various salinities. Mycoscience 2012, 53, 1–9. [Google Scholar] [CrossRef]
  38. Patel, A.; Rova, U.; Christakopoulos, P.; Matsakas, L. Simultaneous production of DHA and squalene from Aurantiochytrium sp. grown on forest biomass hydrolysates. Biotechnol. Biofuels 2019, 12, 1–12. [Google Scholar] [CrossRef]
  39. Ou, S.; Zhang, H.; Wang, D. Dynamics of the buoyant plume off the Pearl River Estuary in summer. Environ. Fluid. Mech. 2009, 9, 471–492. [Google Scholar] [CrossRef] [Green Version]
  40. Ye, F.; Guo, W.; Shi, Z.; Jia, G.; Wei, G. Seasonal dynamics of particulate organic matter and its response to flooding in the Pearl River Estuary, China, revealed by stable isotope (δ13 C and δ15 N) analyses. J. Geophys. Res.-Oceans 2017, 122, 6835–6856. [Google Scholar] [CrossRef]
  41. Zhang, S.R.; Lu, X.X.; Higgitt, D.L.; Chen, C.T.A.; Sun, H.G.; Han, J.T. Water chemistry of the Zhujiang (Pearl River): Natural processes and anthropogenic influences. J. Geophys. Res.-Earth 2007, 112, f01011. [Google Scholar] [CrossRef]
  42. Xu, J.; Li, X.; Shi, Z.; Li, R.; Li, Q. Bacterial carbon cycling in the river plume in the northern South China Sea during summer. J. Geophys. Res.-Oceans 2018, 123, 8106–8121. [Google Scholar] [CrossRef]
  43. Li, J.; Jiang, X.; Jing, Z.; Li, G.; Chen, Z.; Zhou, L.; Zhao, C.; Liu, J.; Tan, Y. Spatial and seasonal distributions of bacterioplankton in the Pearl River Estuary: The combined effects of riverine inputs, temperature, and phytoplankton. Mar. Pollut. Bull. 2017, 125, 199–207. [Google Scholar] [CrossRef] [PubMed]
  44. Gan, J.; Li, L.; Wang, D.; Guo, X. Interaction of a river plume with coastal upwelling in the northeastern South China Sea. Cont. Shelf Res. 2009, 29, 728–740. [Google Scholar] [CrossRef]
  45. Bai, M.; Sen, B.; Wang, Q.; Xie, Y.; He, Y.; Wang, G. Molecular detection and spatiotemporal characterization of Labyrinthulomycete protist diversity in the coastal waters along the Pearl River Delta. Microb. Ecol. 2019, 77, 394–405. [Google Scholar] [CrossRef]
  46. Collado-Mercado, E.; Radway, J.C.; Collier, J.L. Novel uncultivated labyrinthulomycetes revealed by 18S rDNA sequences from seawater and sediment samples. Aquat. Microb. Ecol. 2010, 58, 215–228. [Google Scholar] [CrossRef]
  47. Wang, J.; Qin, X.; Guo, J.; Jia, W.; Wang, Q.; Zhang, M.; Huang, Y. Evidence of selective enrichment of bacterial assemblages and antibiotic resistant genes by microplastics in urban rivers. Water Res. 2020, 183, 116113. [Google Scholar] [CrossRef]
  48. Zhang, X.; Tian, X.; Ma, L.; Feng, B.; Liu, Q.; Yuan, L.; Fan, C.; Huang, H.; Huang, H.; Yang, Q. Biodiversity of the symbiotic bacteria associated with toxic marine dinoflagellate Alexandrium tamarense. J. Biosci. Med. 2015, 3, 23–28. [Google Scholar] [CrossRef] [Green Version]
  49. Bolyen, E.; Rideout, J.R.; Dillon, M.R.; Bokulich, N.A.; Abnet, C.C.; Al-Ghalith, G.A.; Alexander, H.; Alm, E.J.; Arumugam, M.; Asnicar, F. Reproducible, interactive, scalable and extensible microbiome data science using QIIME 2. Nat. Biotechnol. 2019, 37, 852–857. [Google Scholar] [CrossRef]
  50. Martin, M. Cutadapt removes adapter sequences from high-throughput sequencing reads. EMBnet. J. 2011, 17, 10–12. [Google Scholar] [CrossRef]
  51. Callahan, B.J.; McMurdie, P.J.; Rosen, M.J.; Han, A.W.; Johnson, A.J.A.; Holmes, S.P. DADA2: High-resolution sample inference from Illumina amplicon data. Nat. Methods 2016, 13, 581–583. [Google Scholar] [CrossRef] [PubMed] [Green Version]
  52. Feng, B.W.; Li, X.R.; Wang, J.H.; Hu, Z.Y.; Meng, H.; Xiang, L.Y.; Quan, Z.X. Bacterial diversity of water and sediment in the Changjiang estuary and coastal area of the East China Sea. FEMS Microbiol. Ecol. 2009, 70, 80–92. [Google Scholar] [CrossRef] [PubMed]
  53. Nakai, R.; Naganuma, T. Diversity and Ecology of Thraustochytrid Protists in the Marine Environment. In Marine Protists: Diversity and Dynamics; Ohtsuka, S., Suzaki, T., Horiguchi, T., Suzuki, N., Not, F., Eds.; Springer Japan: Tokyo, Japan, 2015; pp. 331–346. [Google Scholar]
  54. Marchan, L.F.; Chang, K.J.L.; Nichols, P.D.; Mitchell, W.J.; Polglase, J.L.; Gutierrez, T. Taxonomy, ecology and biotechnological applications of thraustochytrids: A review. Biotechnol. Adv. 2018, 36, 26–46. [Google Scholar] [CrossRef] [PubMed]
  55. Baltar, F.; Arístegui, J.; Gasol, J.M.; Hernández-León, S.; Herndl, G.J. Strong coast–ocean and surface–depth gradients in prokaryotic assemblage structure and activity in a coastal transition zone region. Aquat. Microb. Ecol. 2007, 50, 63–74. [Google Scholar] [CrossRef] [Green Version]
  56. Nagano, N.; Taoka, Y.; Honda, D.; Hayashi, M. Optimization of culture conditions for growth and docosahexaenoic acid production by a marine thraustochytrid, Aurantiochytrium limacinum mh0186. J. Oleo Sci. 2009, 58, 623–628. [Google Scholar] [CrossRef] [PubMed] [Green Version]
  57. Yokoyama, R.; Honda, D. Taxonomic rearrangement of the genus Schizochytrium sensulato based on morphology, chemotaxonomic characteristics, and 18S rRNA gene phylogeny (Thraustochytriaceae, Labyrinthulomycetes): Emendation for Schizochytrium and erection of Aurantiochytrium and Oblongichytrium gen. nov. Mycoscience 2007, 48, 199–211. [Google Scholar]
  58. Kimura, H.; Sato, M.; Sugiyama, C.; Naganuma, T. Coupling of thraustochytrids and POM, and of bacterio-and phytoplankton in a semi-enclosed coastal area: Implication for different substrate preference by the planktonic decomposers. Aquat. Microb. Ecol. 2001, 25, 293–300. [Google Scholar] [CrossRef] [Green Version]
  59. Qiu, D.; Huang, L.; Zhang, J.; Lin, S. Phytoplankton dynamics in and near the highly eutrophic Pearl River Estuary, South China Sea. Cont. Shelf Res. 2010, 30, 177–186. [Google Scholar] [CrossRef]
  60. Shabala, L.; McMeekin, T.; Shabala, S. Thraustochytrids can be grown in low-salt media without affecting PUFA production. Mar. Biotechnol. 2013, 15, 437–444. [Google Scholar] [CrossRef]
  61. Lyu, L.; Wang, Q.; Wang, G. Cultivation and diversity analysis of novel marine thraustochytrids. Mar. Life Sci. Technol. 2021, 3, 263–275. [Google Scholar] [CrossRef]
  62. Jakobsen, A.N.; Aasen, I.M.; Strom, A.R. Endogenously synthesized (-)-proto-quercitol and glycine betaine are principal compatible solutes of Schizochytrium sp. strain S8 (ATCC 20889) and three new isolates of phylogenetically related thraustochytrids. Appl. Environ. Microbiol. 2007, 73, 5848–5856. [Google Scholar] [CrossRef] [PubMed] [Green Version]
  63. Huang, J.; Aki, T.; Yokochi, T.; Nakahara, T.; Honda, D.; Kawamoto, S.; Shigeta, S.; Ono, K.; Suzuki, O. Grouping newly isolated docosahexaenoic acid-producing thraustochytrids based on their polyunsaturated fatty acid profiles and comparative analysis of 18S rRNA genes. Mar. Biotechnol. 2003, 5, 450–457. [Google Scholar] [CrossRef] [PubMed]
  64. Wilkens, S.L.; Maas, E.W. Development of a novel technique for axenic isolation and culture of thraustochytrids from New Zealand marine environments. J. Appl. Microbiol. 2012, 112, 346–352. [Google Scholar] [CrossRef] [PubMed]
  65. Rosa, S.M.; Galvagno, M.A.; Vélez, C.G. Adjusting culture conditions to isolate thraustochytrids from temperate and cold environments in southern Argentina. Mycoscience 2011, 52, 242–252. [Google Scholar] [CrossRef]
  66. Bagul, V.P.; Annapure, U.S. Isolation of fast-growing thraustochytrids and seasonal variation on the fatty acid composition of thraustochytrids from mangrove regions of Navi Mumbai, India. J. Environ. Manag. 2021, 290, 112597. [Google Scholar] [CrossRef]
  67. Liu, Y.; Singh, P.; Sun, Y.; Luan, S.; Wang, G. Culturable diversity and biochemical features of thraustochytrids from coastal waters of Southern China. Appl. Microbiol. Biotechnol. 2014, 98, 3241–3255. [Google Scholar] [CrossRef]
  68. Ou, M.C.; Yeong, H.Y.; Pang, K.L.; Phang, S.M. Fatty acid production of tropical thraustochytrids from Malaysian mangroves. Bot. Mar. 2016, 59, 321–338. [Google Scholar] [CrossRef]
  69. Amon, J.P.; French, K.H. Photoresponses of the marine protist Ulkenia sp. zoospores to ambient, artificial and bioluminescent light. Mycologia 2004, 96, 463–469. [Google Scholar] [CrossRef]
  70. Hamamoto, Y.; Honda, D. Nutritional intake of Aplanochytrium (Labyrinthulea, Stramenopiles) from living diatoms revealed by culture experiments suggesting the new prey–predator interactions in the grazing food web of the marine ecosystem. PLoS ONE 2019, 14, e0208941. [Google Scholar] [CrossRef]
Figure 1. Map of sampling stations in the South China Sea. Plume stations: P1–P3; Offshore stations: C1–C4; Pelagic stations: O1–O4.
Water 14 01580 g001
Figure 2. Abundances of LP (a) and bacterioplankton (b) along a plume to pelagic gradient in the South China Sea in 2016 and 2018. Statistical analysis was done by Pairwise.wilcox test after the Kruskal–Wallis test. The multiplication sign inside each box represents the median. The significant differences of different habitats were indicated with different letters.
Water 14 01580 g002
Figure 3. Alpha diversity index of LP and bacterioplankton across the salinity gradient: (a) LP Shannon index; (b) Bacterioplankton Shannon index; (c) LP Observed ASVs numbers; (d) Bacterioplankton Observed ASVs numbers. The multiplication sign inside each box represents the median value and the circles represent the outliers. Statistical significance was analyzed by Pairwise.wilcox test after the Kruskal–Wallis test. The significant differences are indicated by different letters.
Water 14 01580 g003
Figure 4. LP community variations across salinity gradient: (a) MDS analysis of LP communities; (b) MDS analysis of bacterioplankton. Different colors were used to distinguish the sampling habitats. Plume, Offshore and Pelagic were marked in green, red and blue, respectively.
Water 14 01580 g004
Figure 5. Percentage of sequences in LP ASVs classified by location. The rare category represents sequences belonging to ASV that make up to less than 0.1% of the total number of sequences from each corresponding location.
Water 14 01580 g005
Figure 6. Genus composition of the dominant (Top 50 abundant) LP ASVs along the salinity gradient: (a) Average relative abundance of LP genera across different habitats; (b) Venn analysis of the dominant ASVs of different habitats. The percentage of the pie chart means the genera composition of the specific dominant ASVs in different habitats.
Water 14 01580 g006
Publisher’s Note: MDPI stays neutral with regard to jurisdictional claims in published maps and institutional affiliations.

