
Spatial and Temporal Variability of Rainfall Trends in Response to Climate Change—A Case Study: Syria

 , , , and
Abstract
:1. Introduction
2. Study Area and Data Preparation
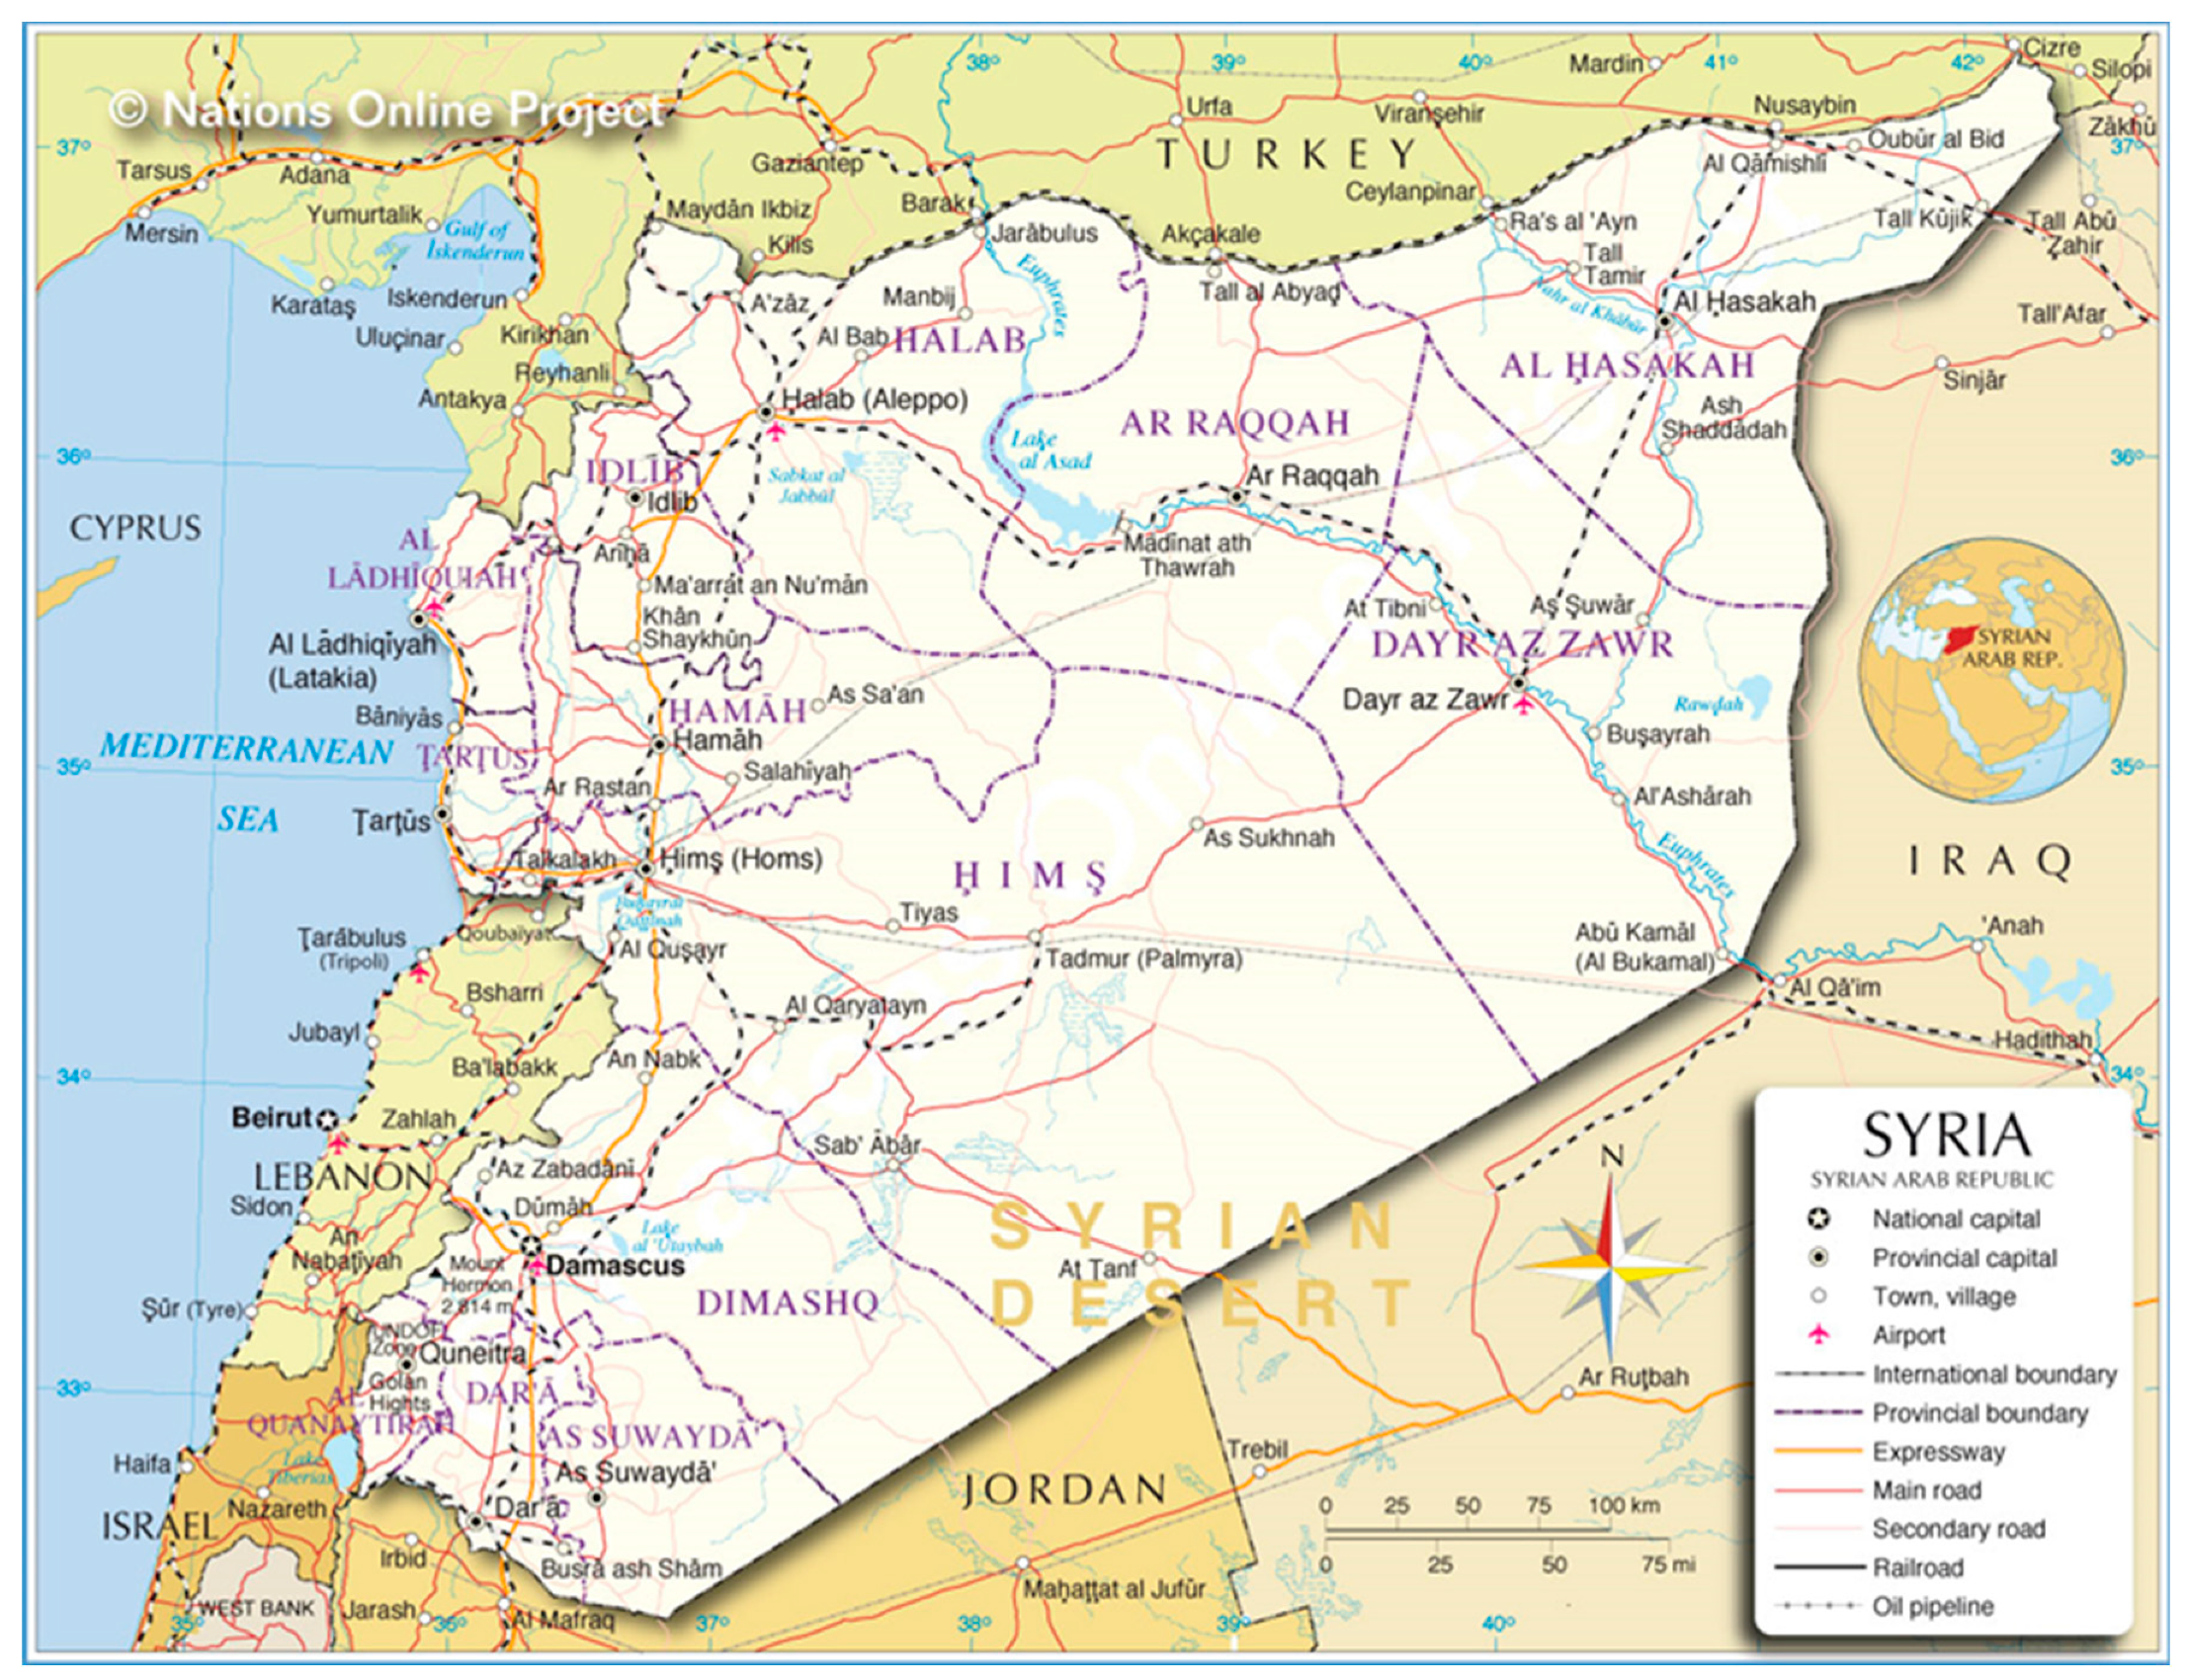
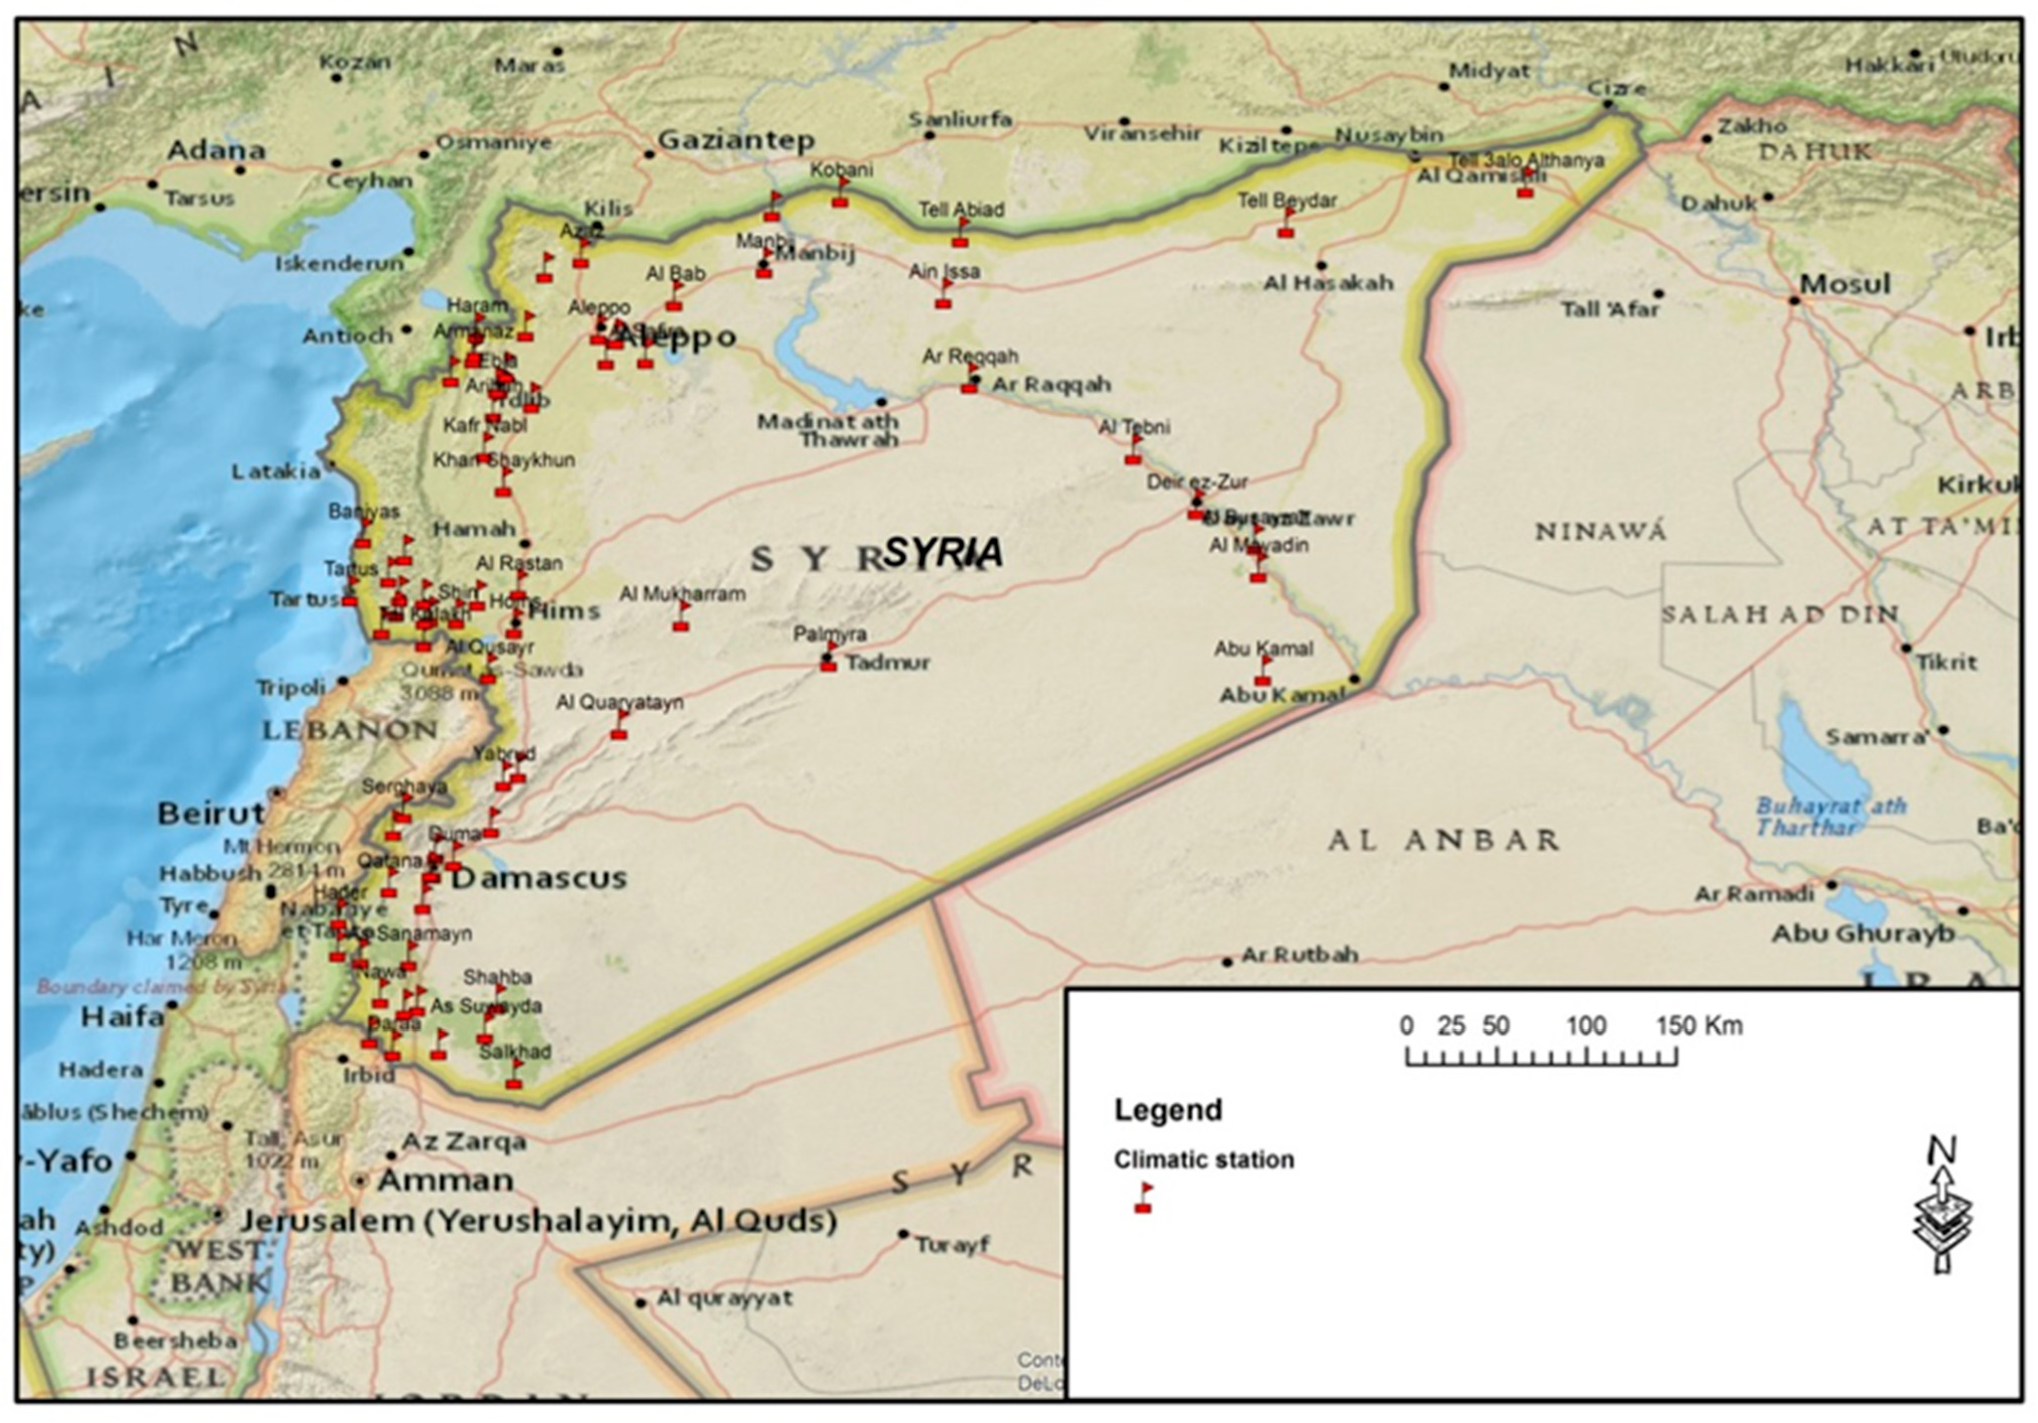
2.1. Study Area
2.2. Rainfall Data
3. Methodology
- For trend detection, slope-based tests such as least squares linear regression (referred to as LR) and Sen’s robust slope estimator (referred to as SS) were utilized (Sen, 1968) [39].
- For trend detection, rank-based tests such as Mann–Kendall (referred to as MK) and Spearman rank correlation (referred to as SRC) were utilized [40].
4. Results and Discussion
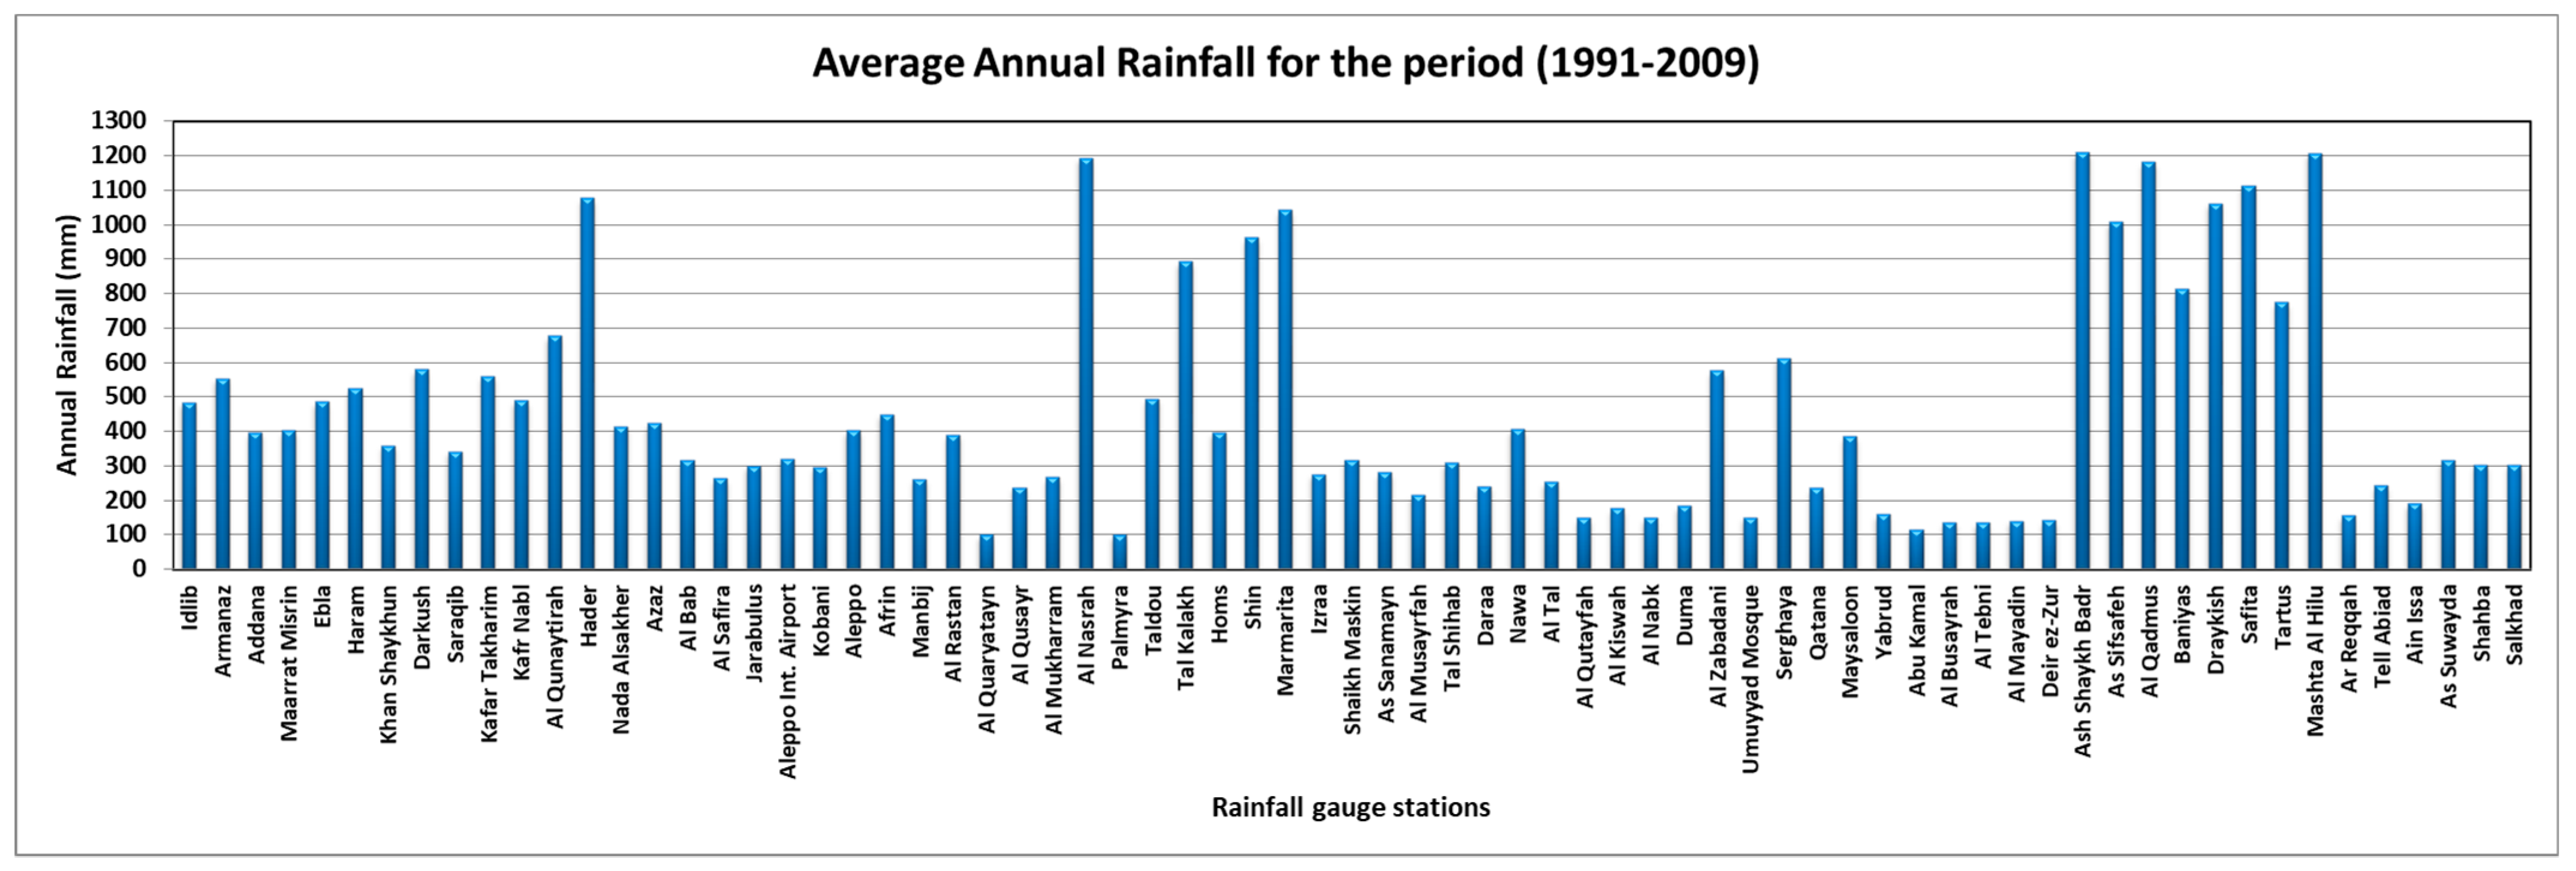
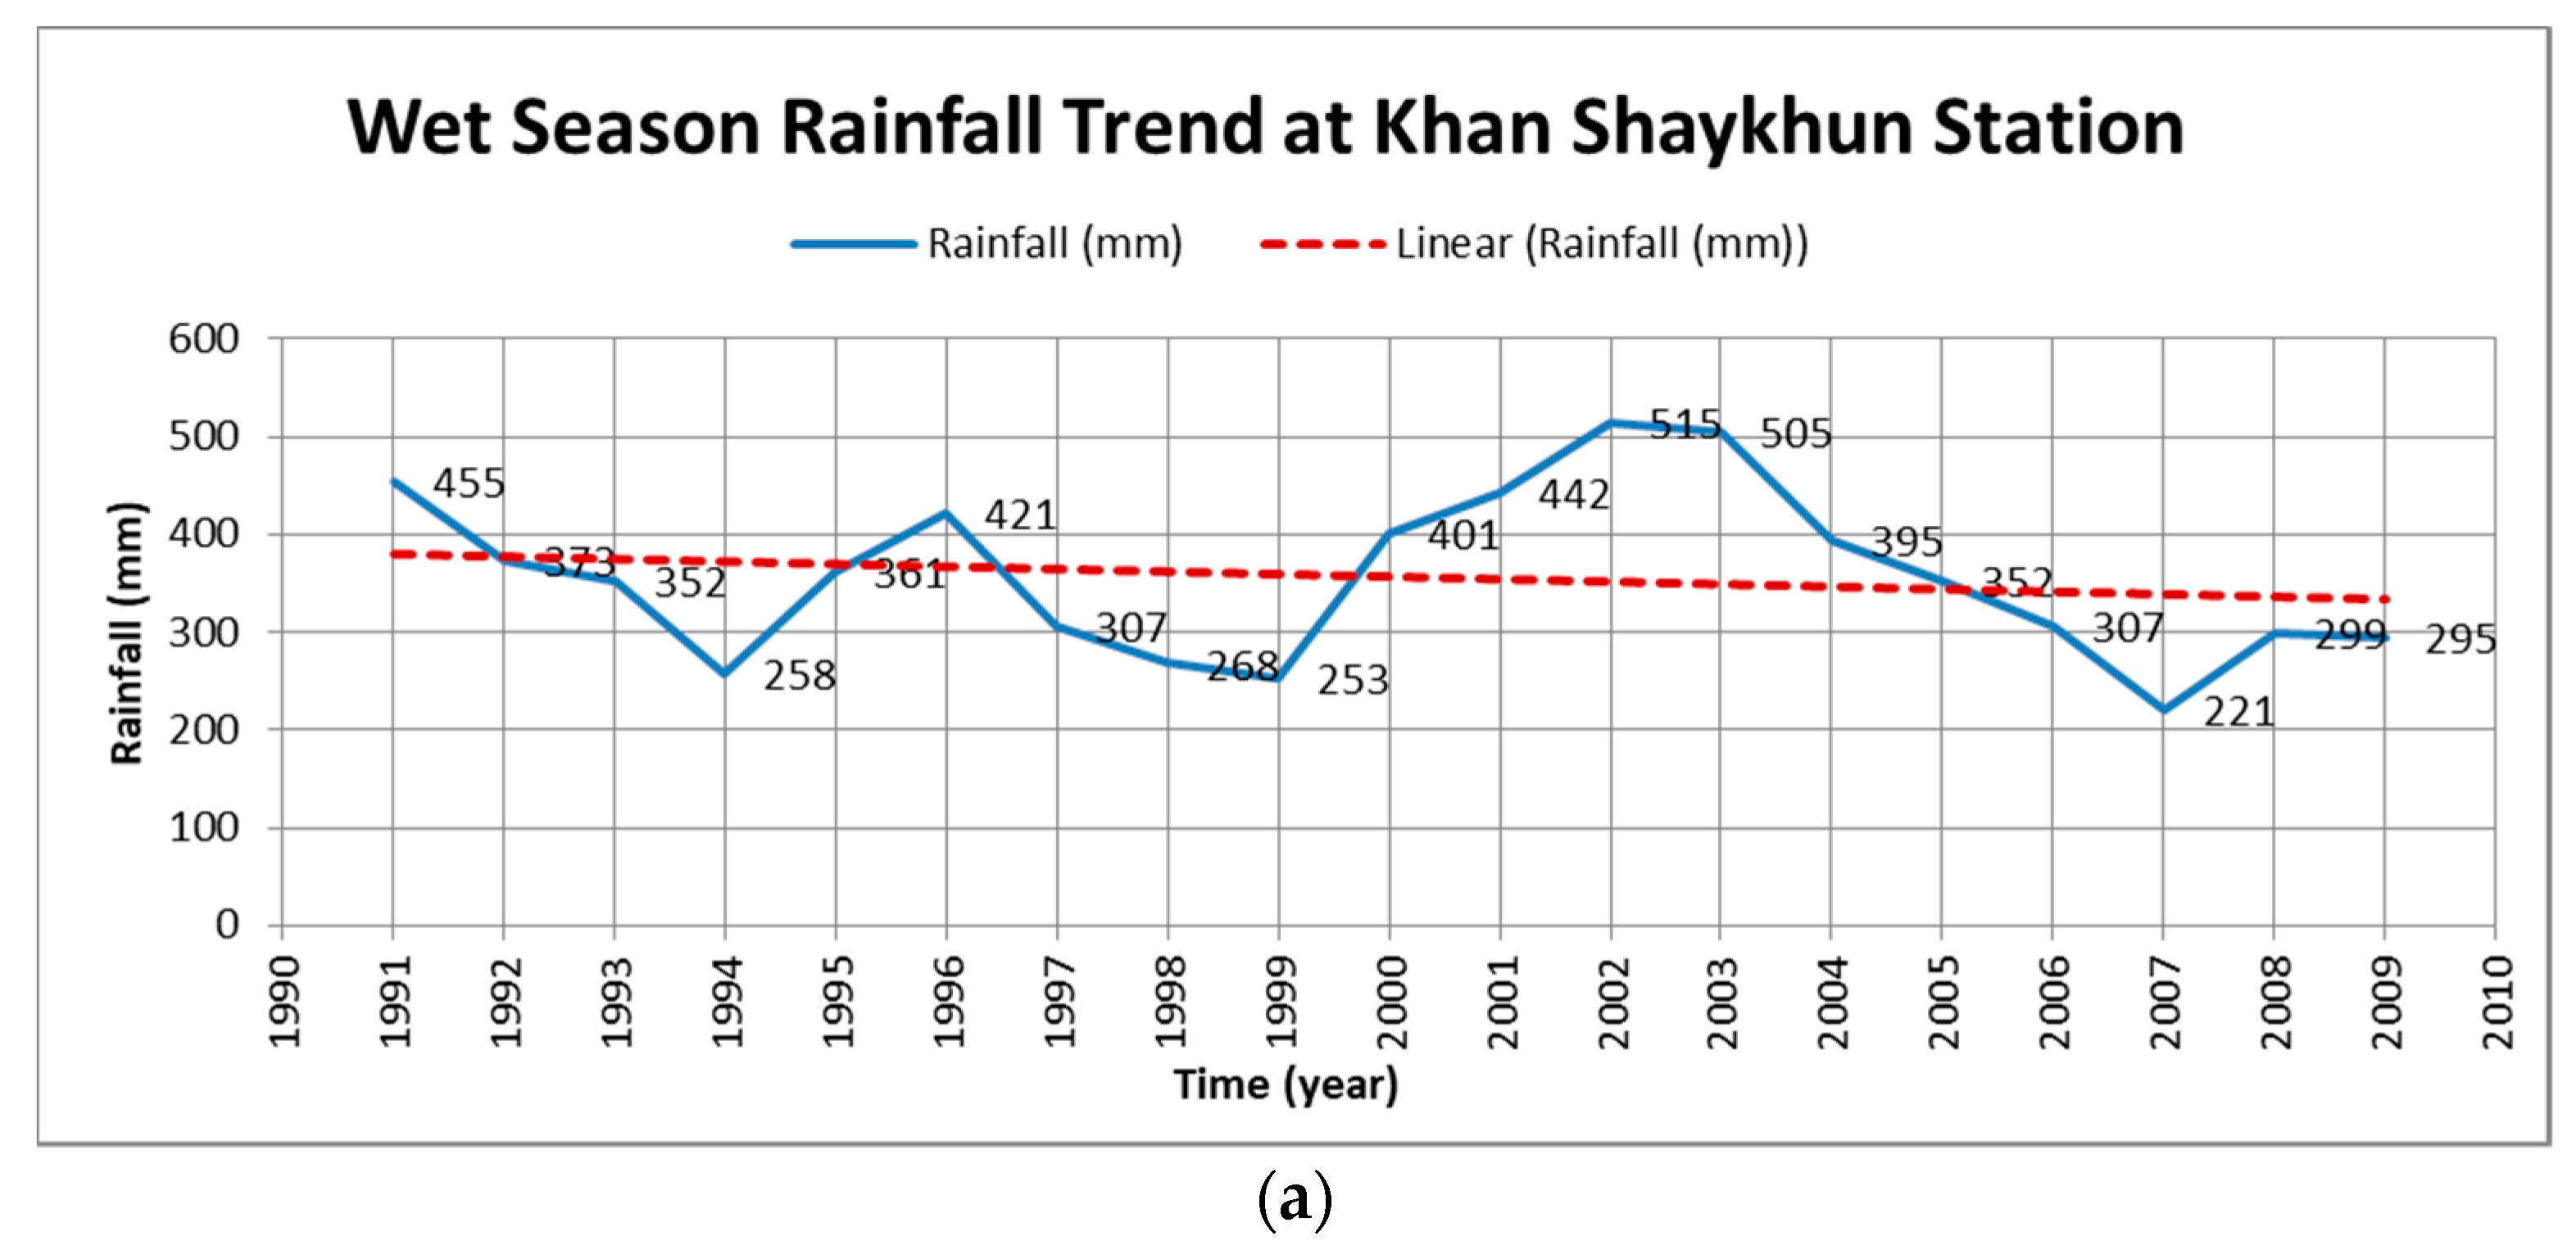
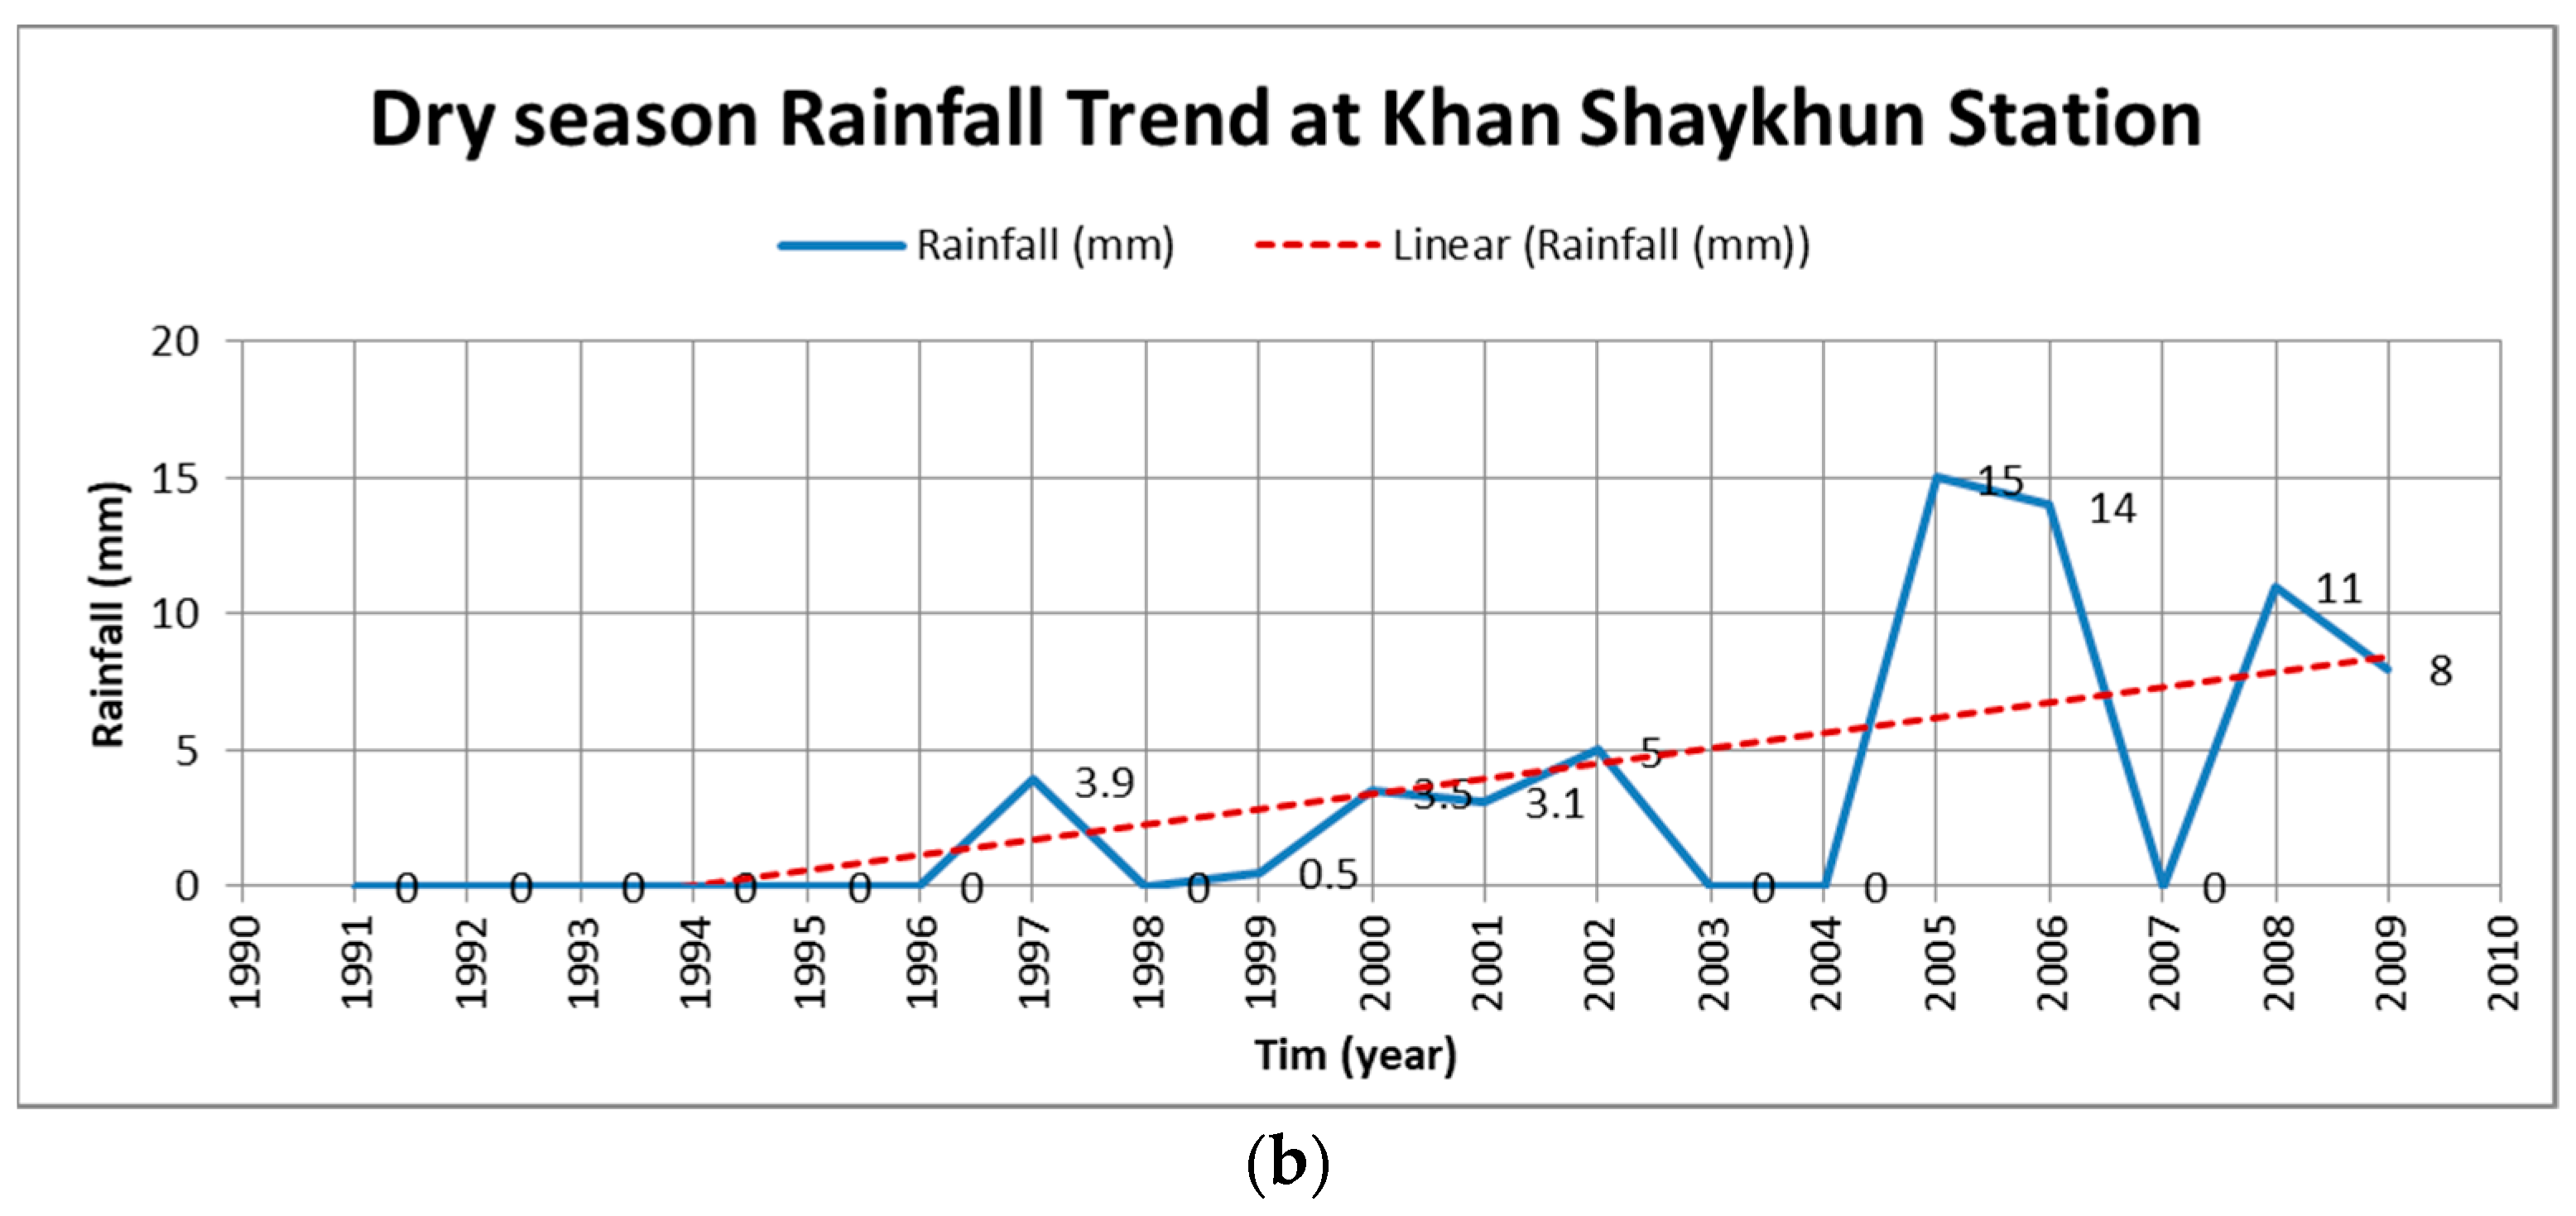
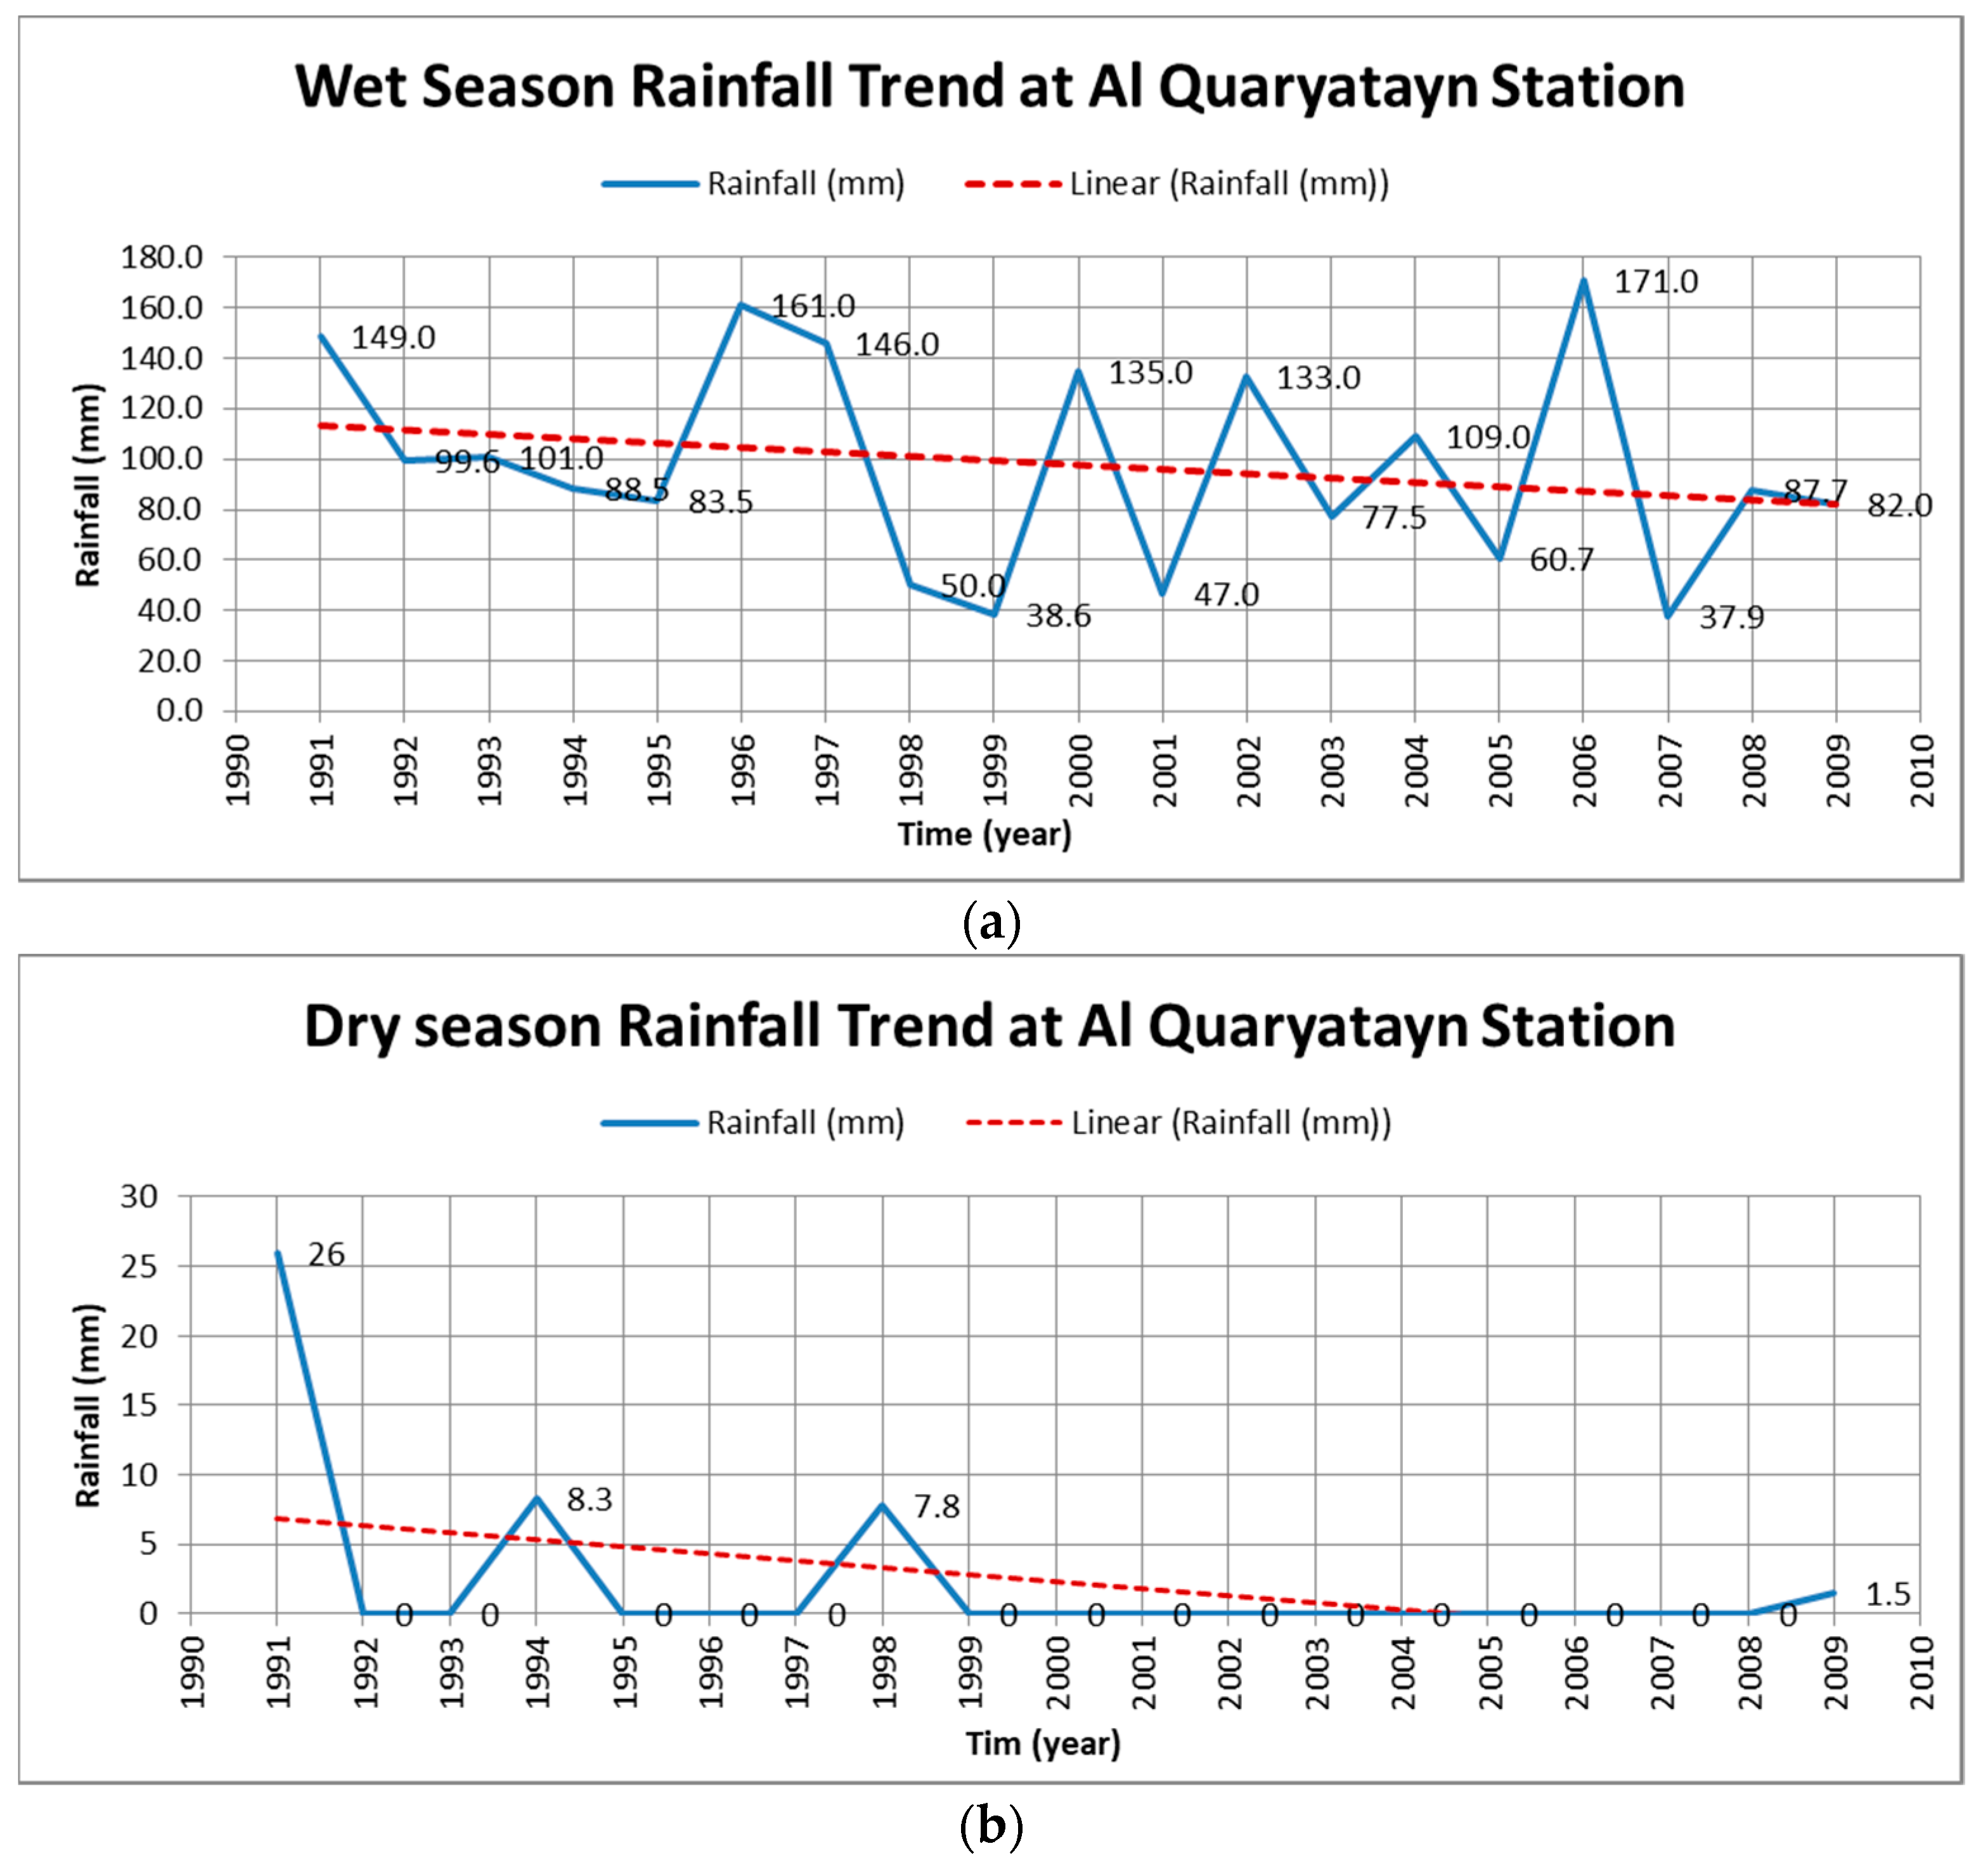
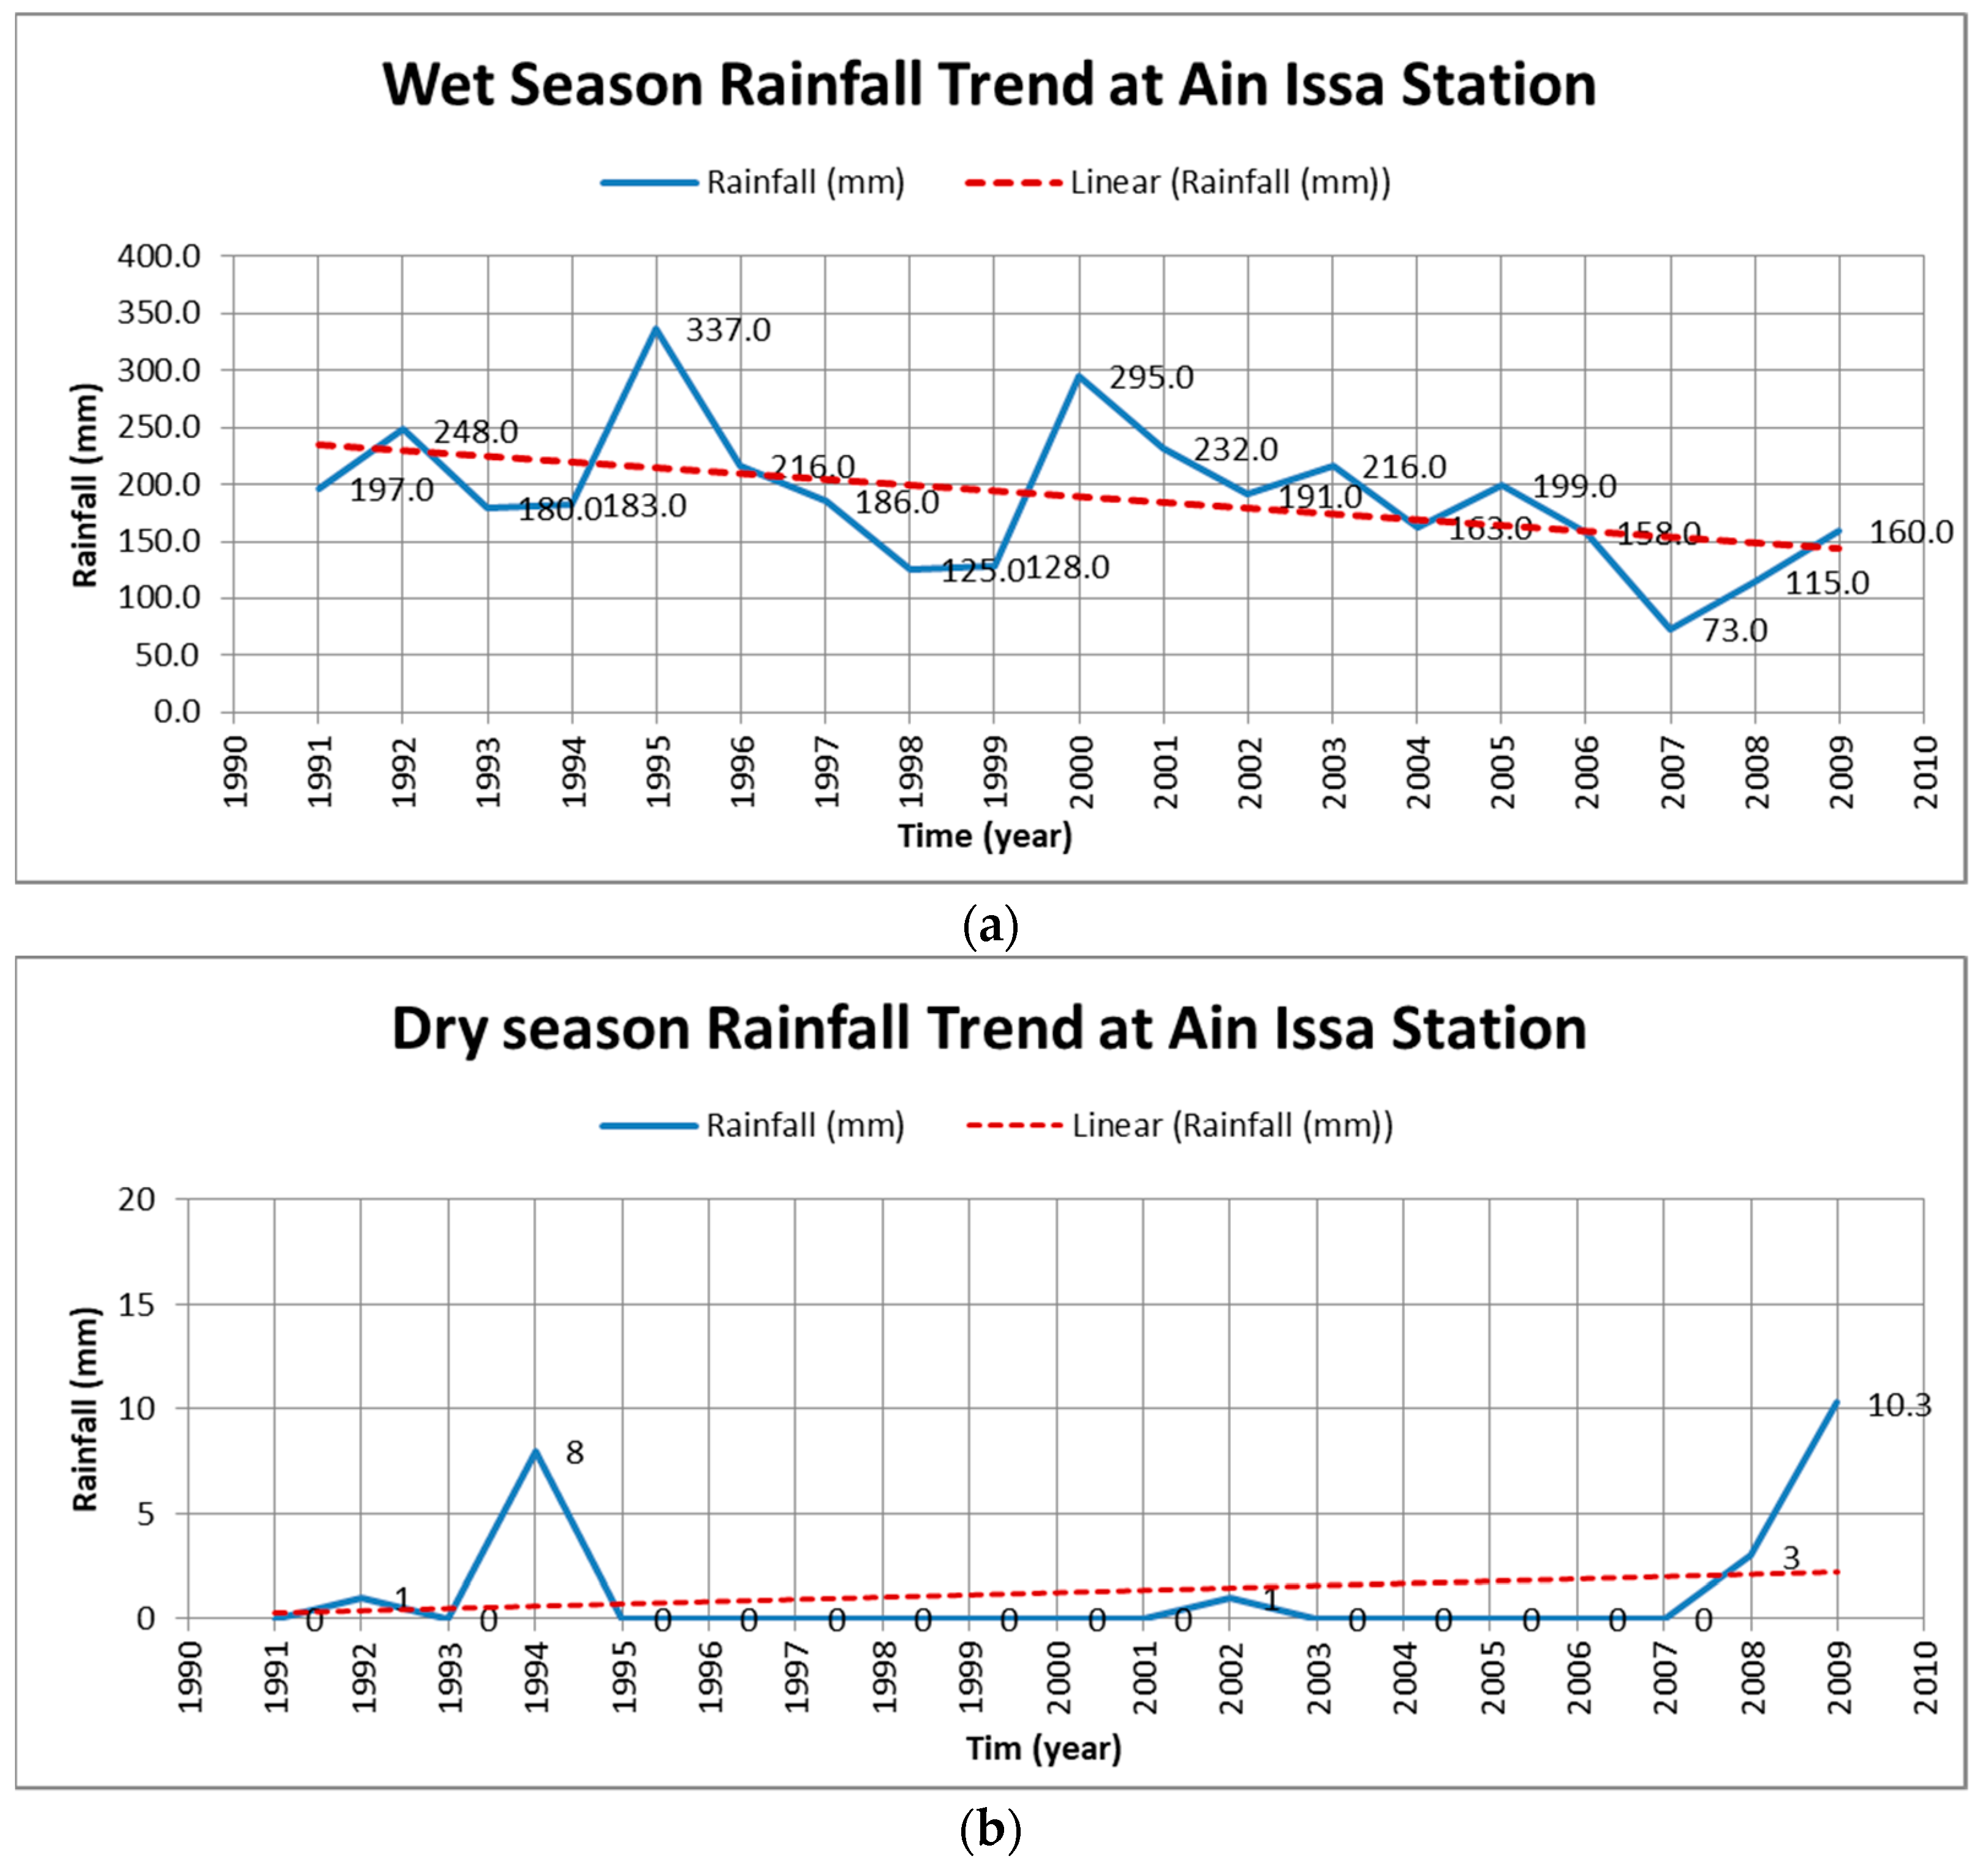
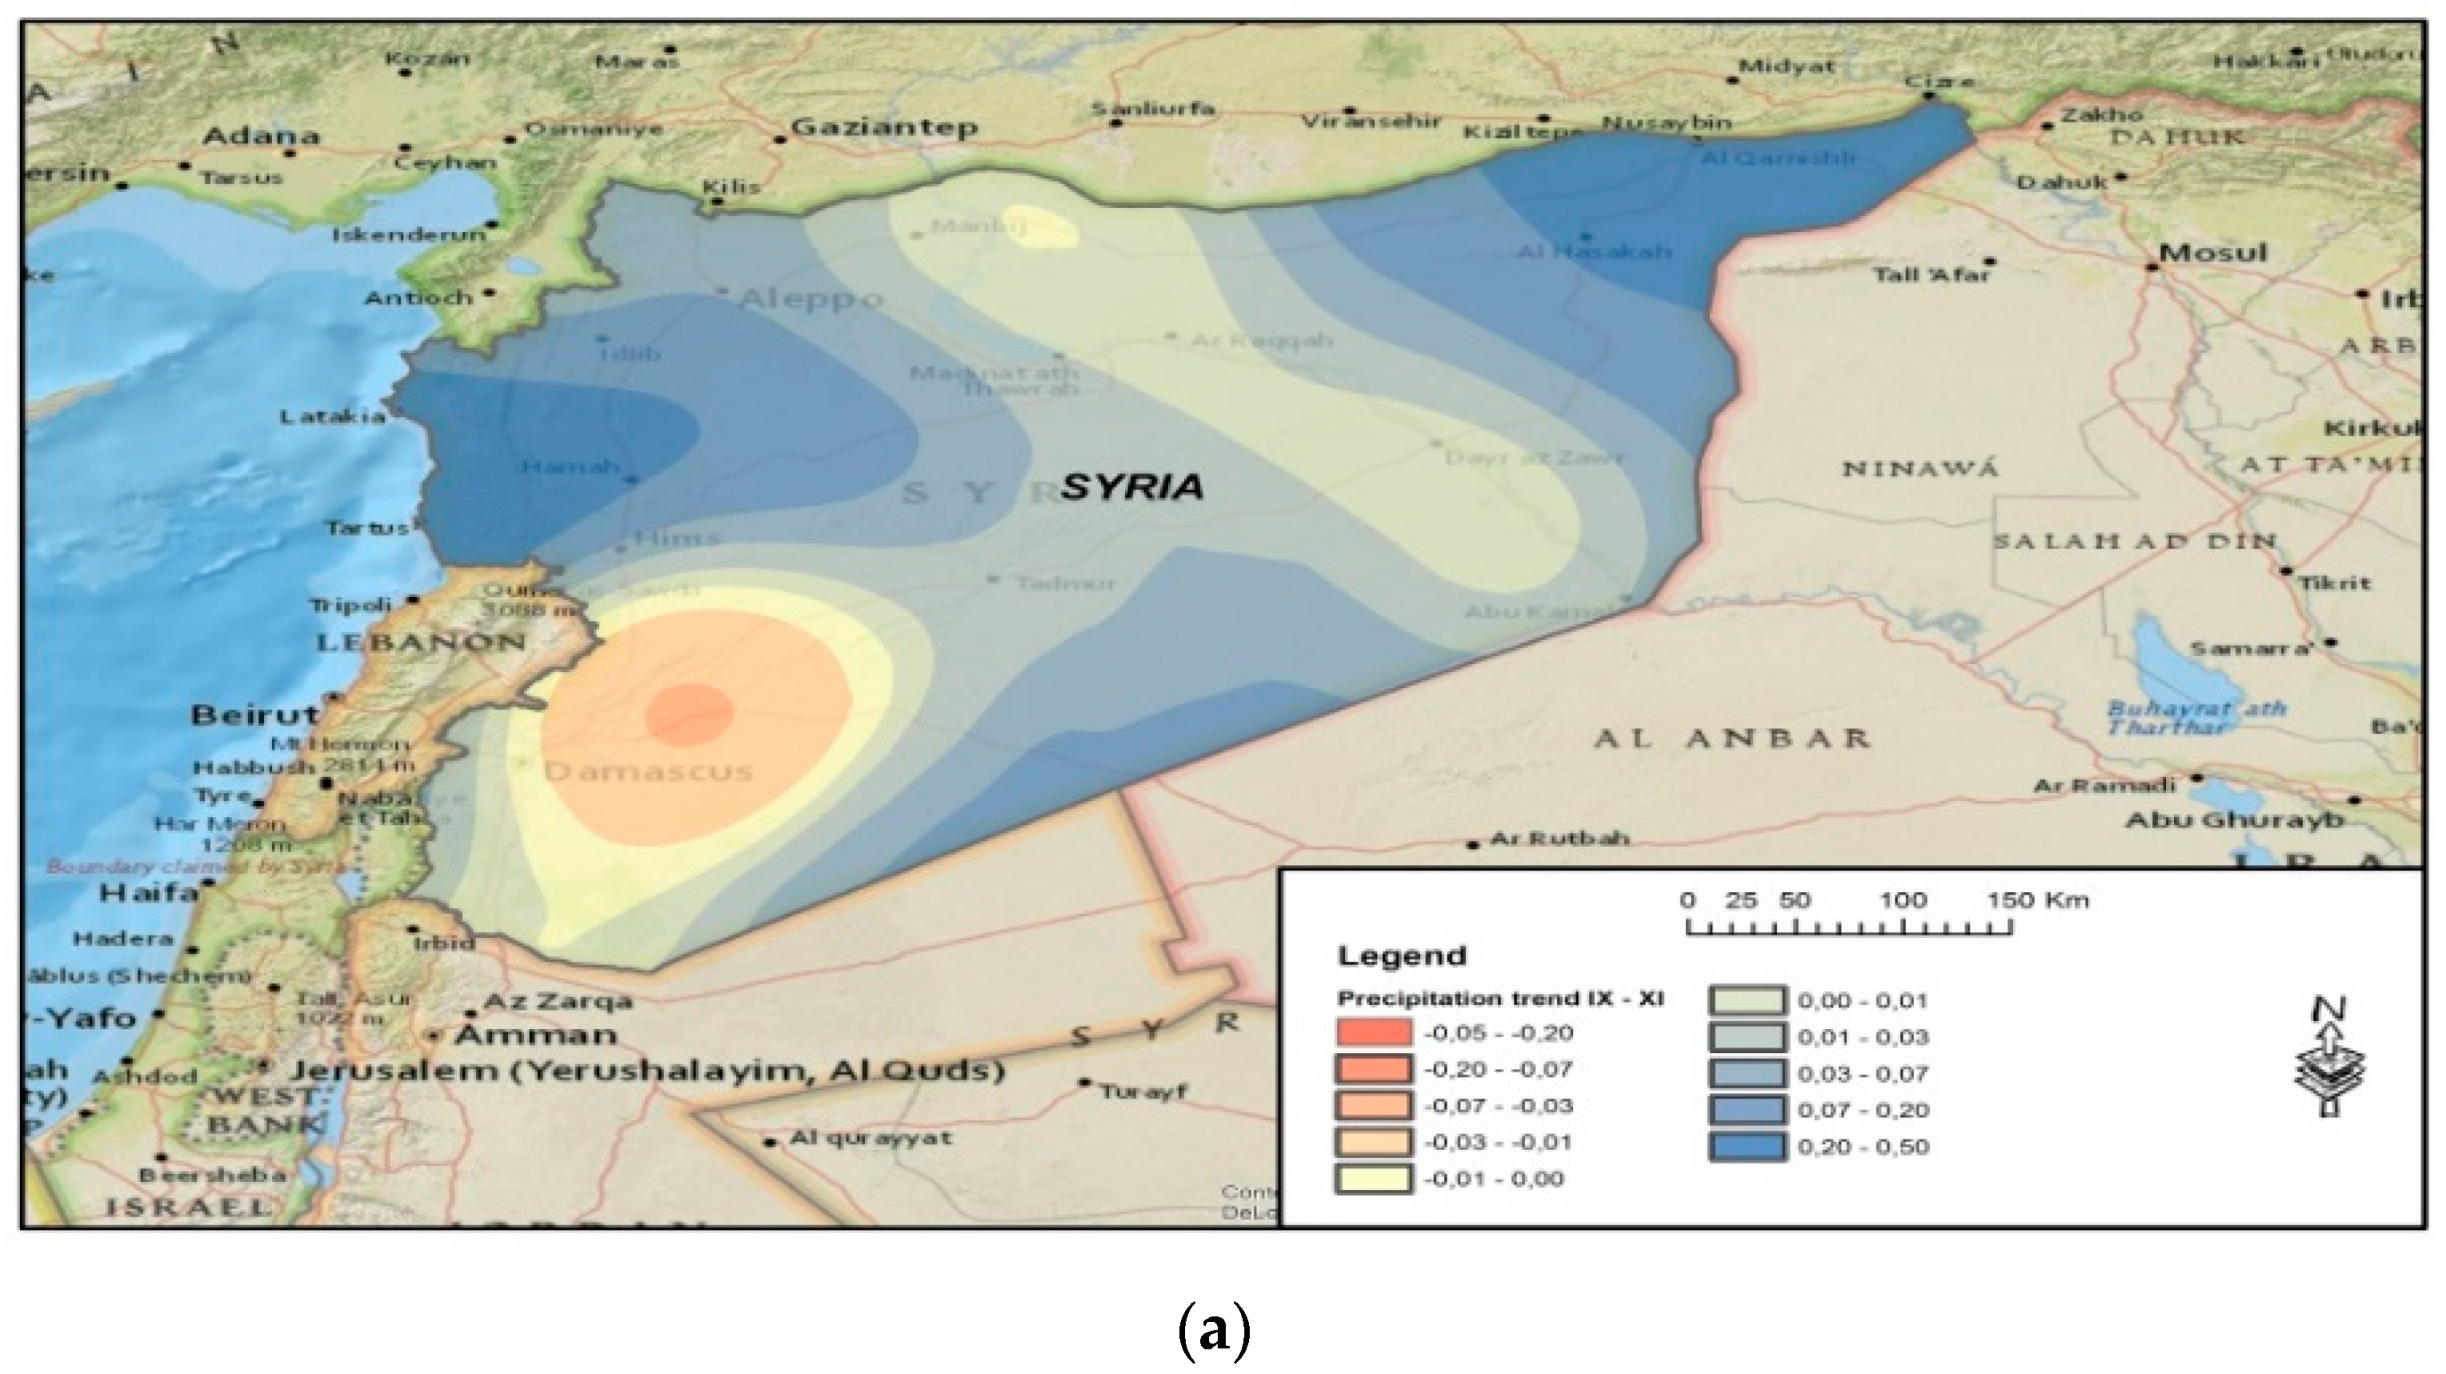
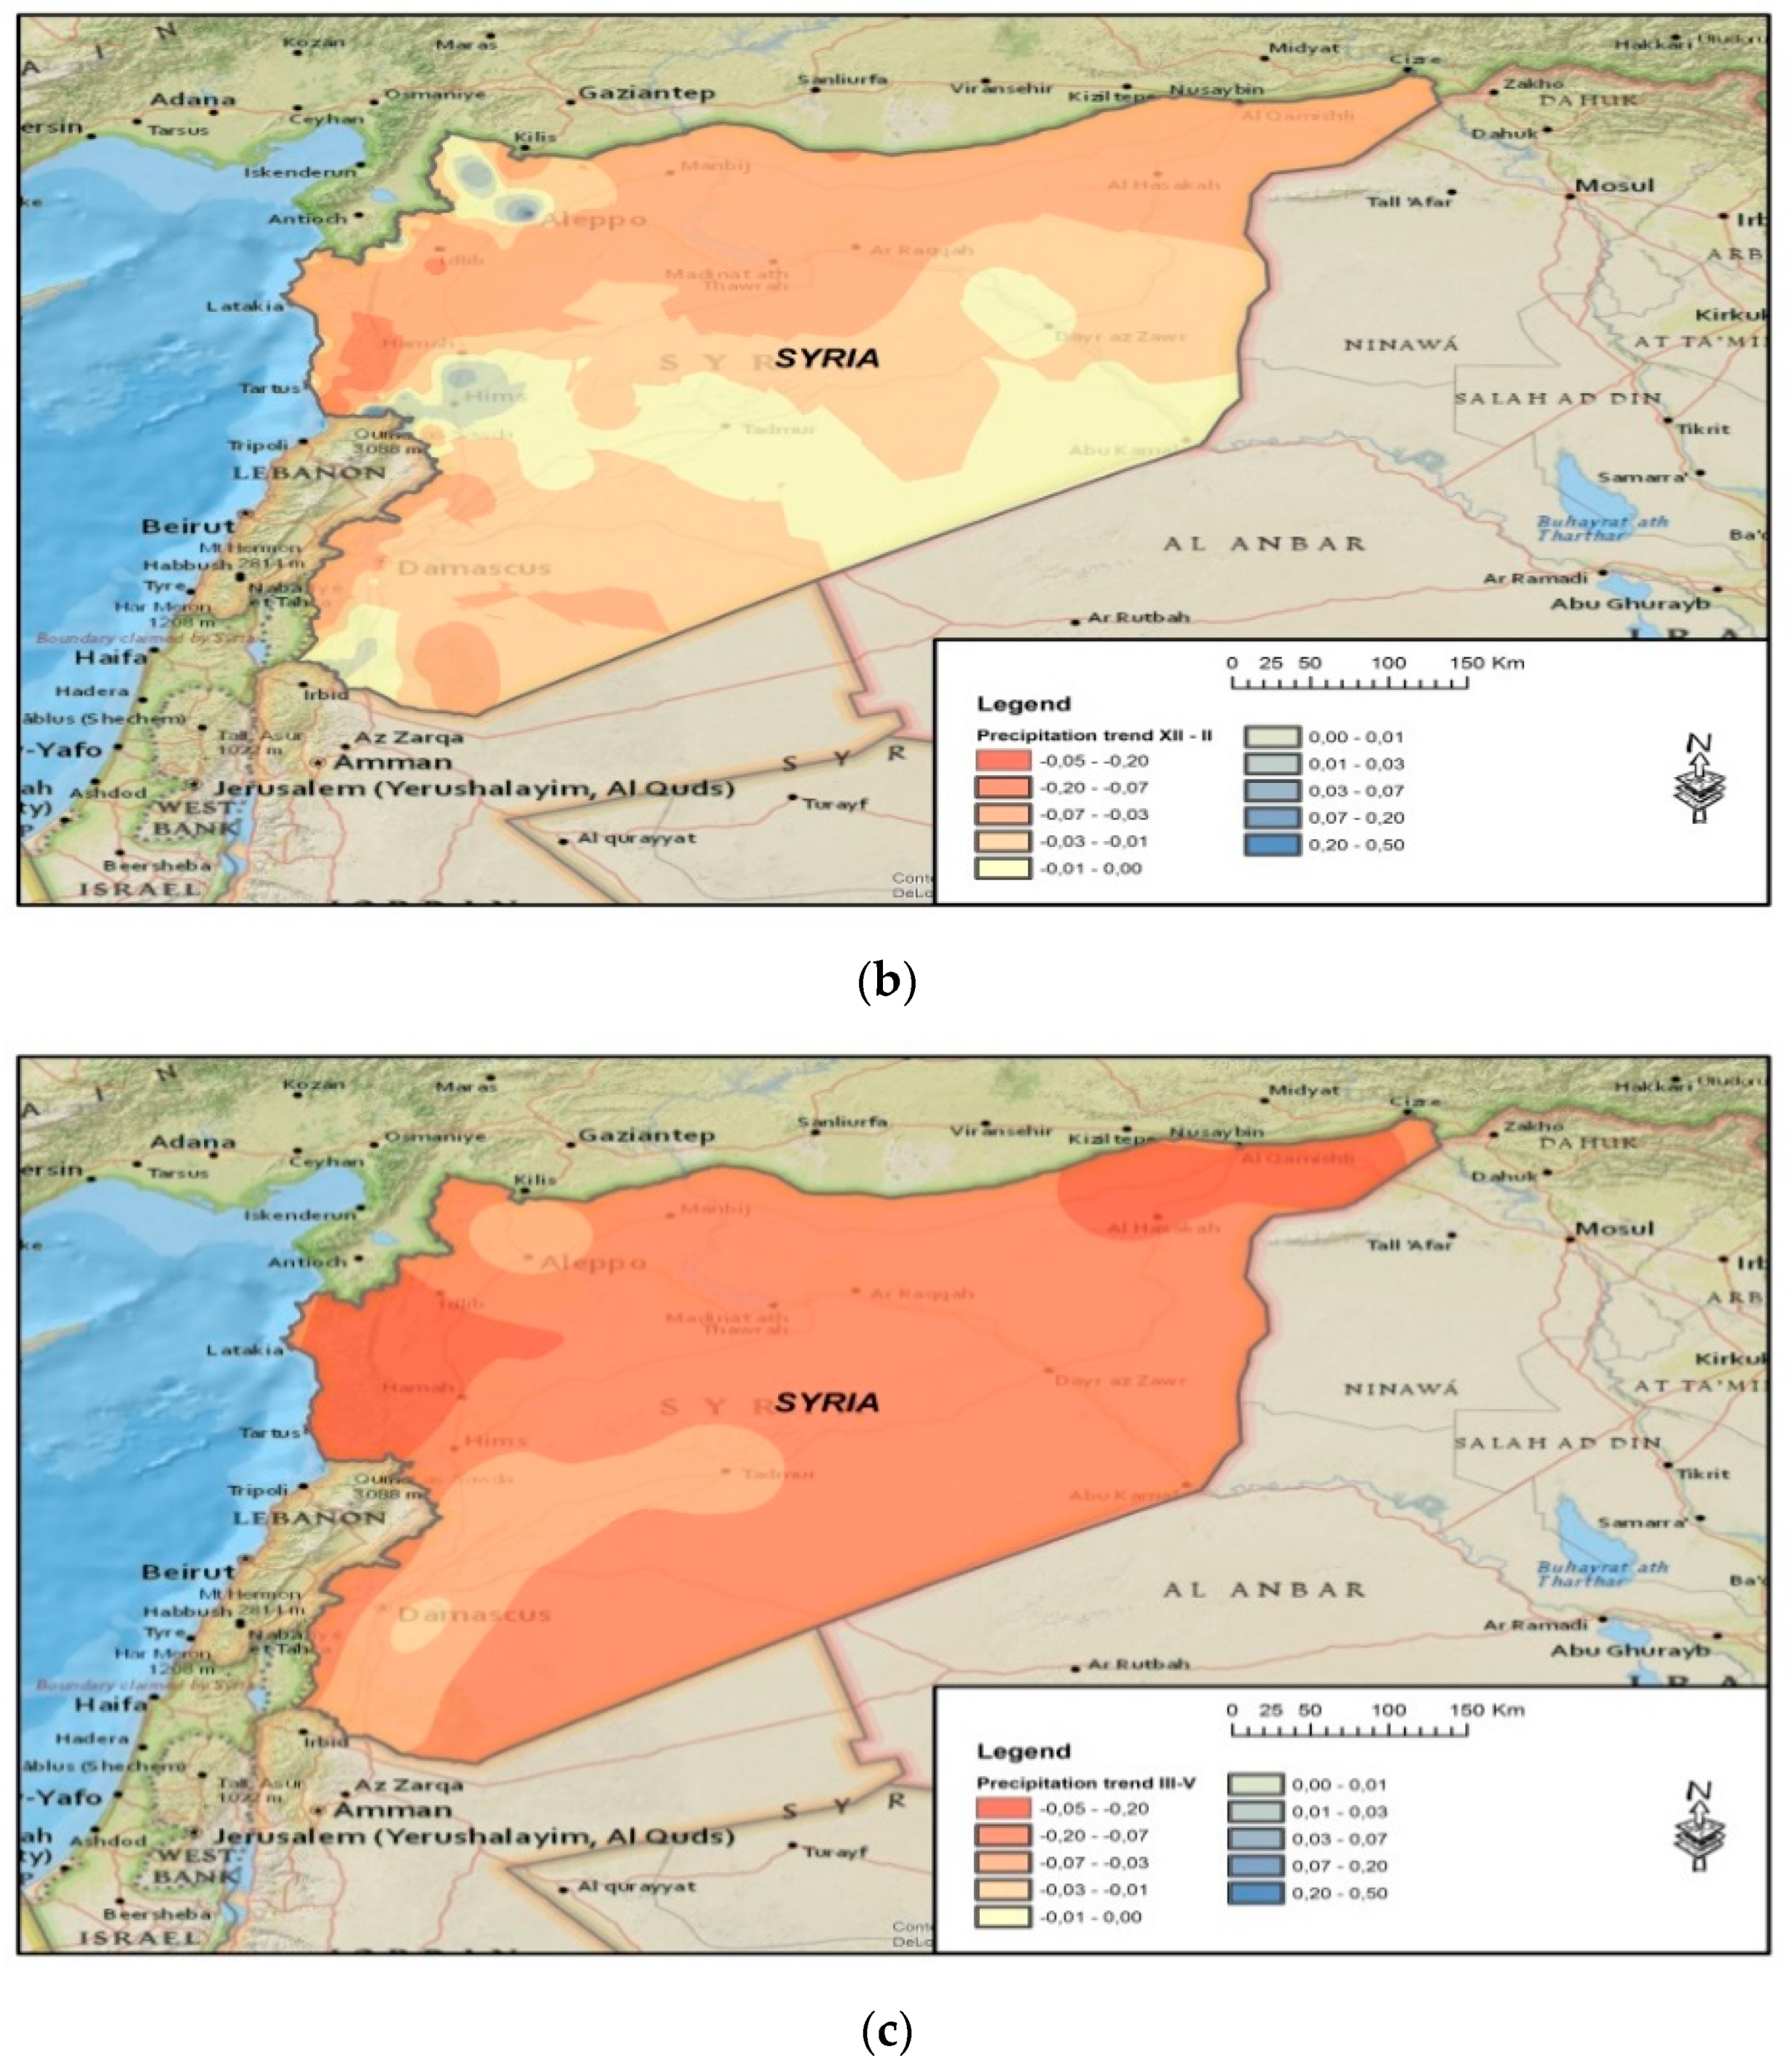
4.1. Rainfall Trends in Syria
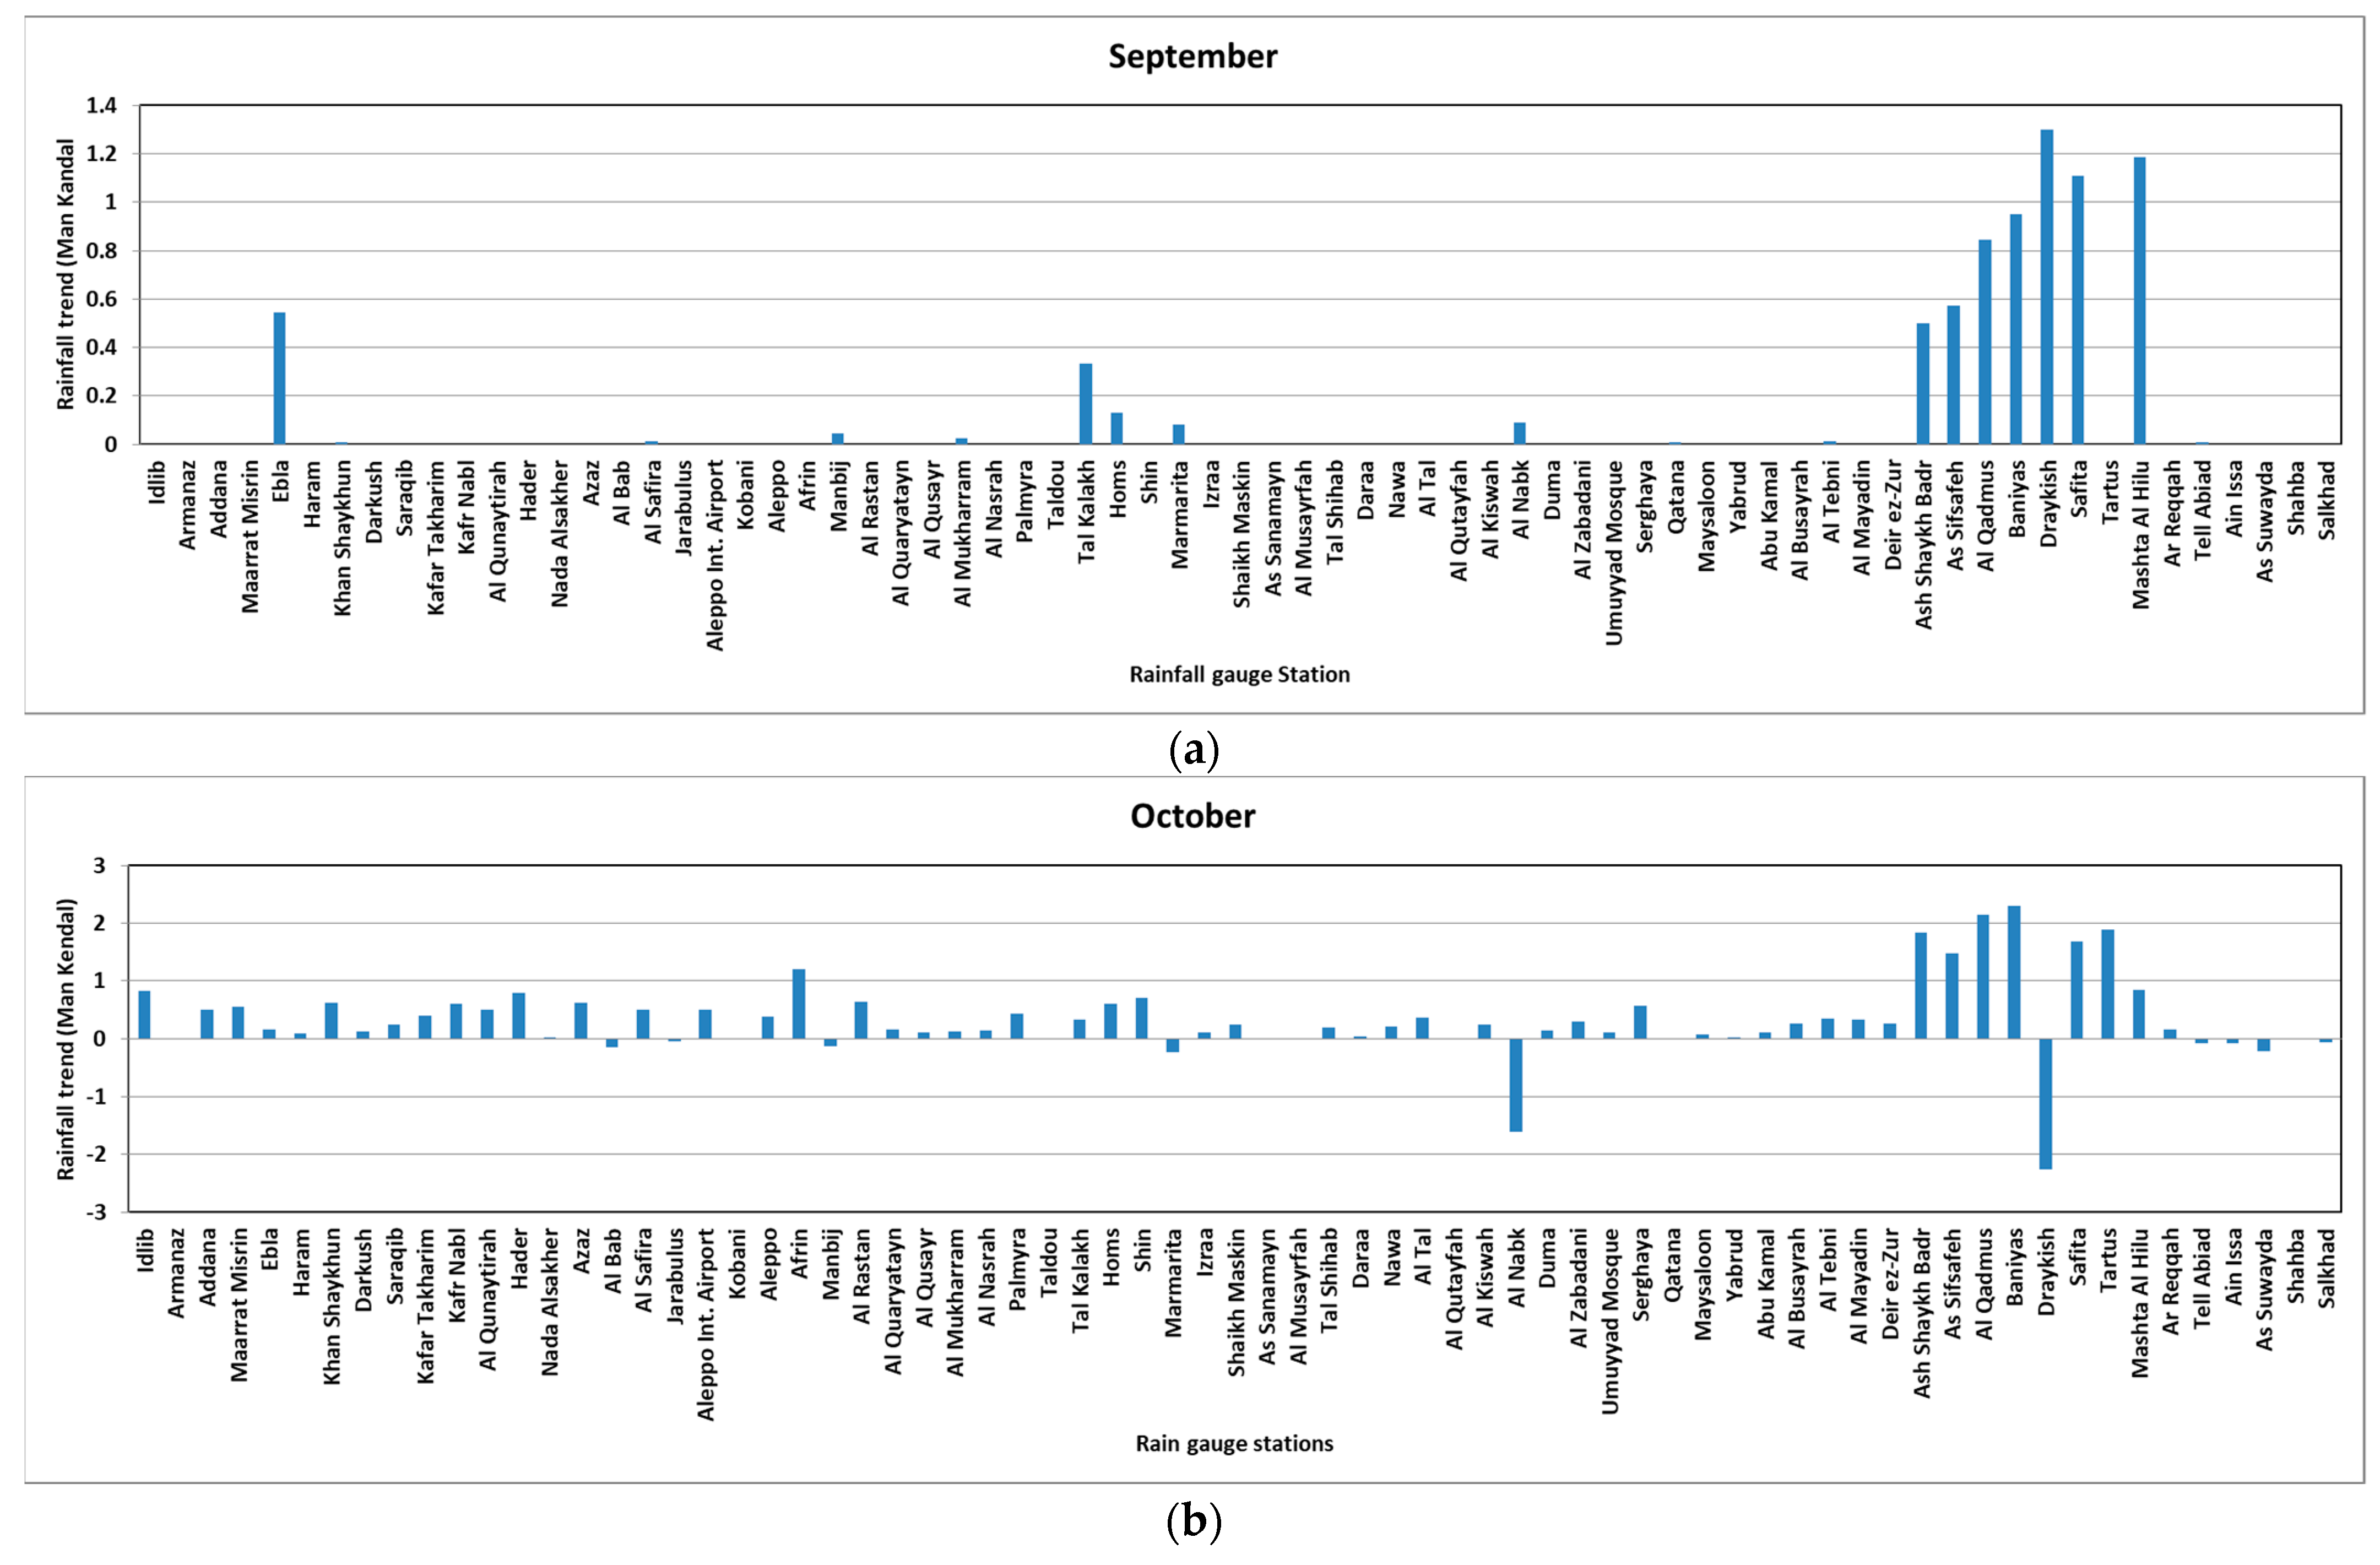
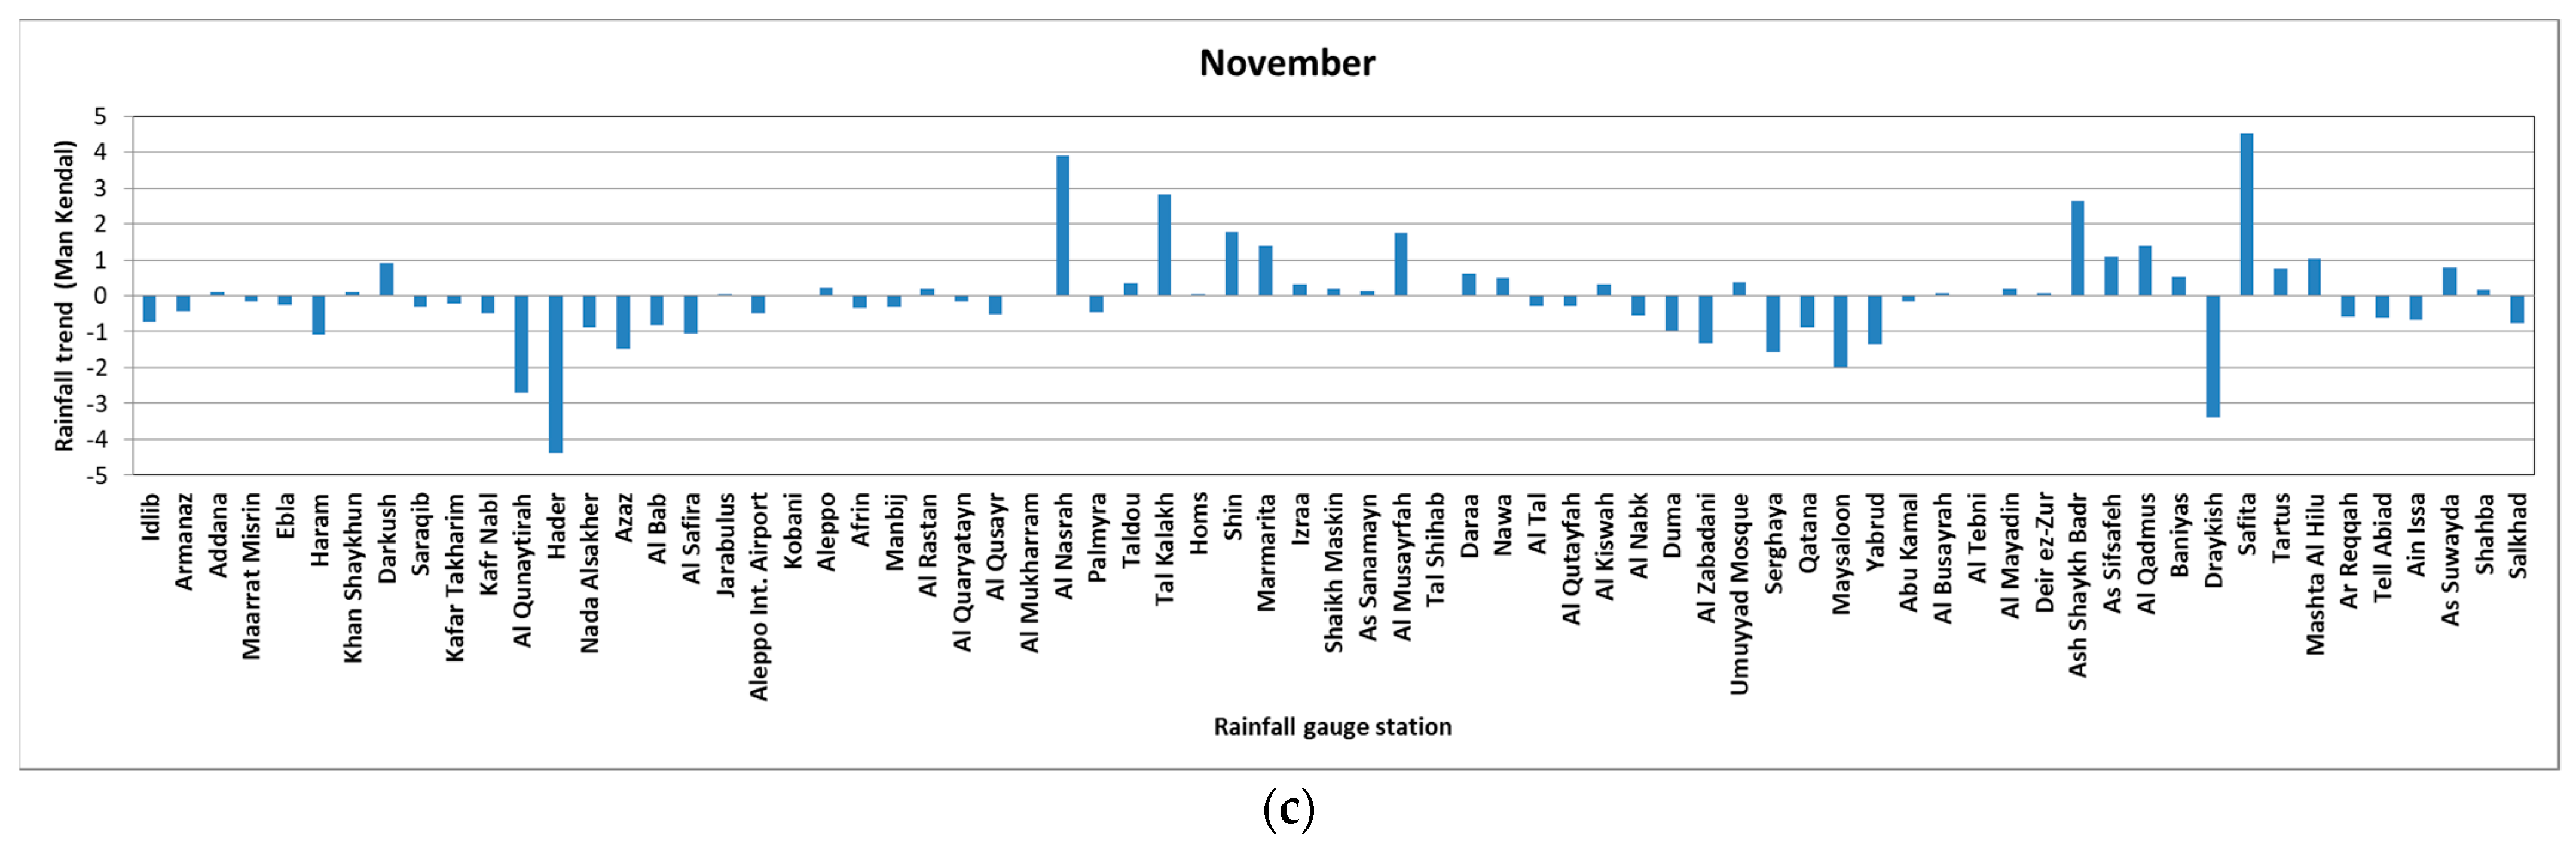
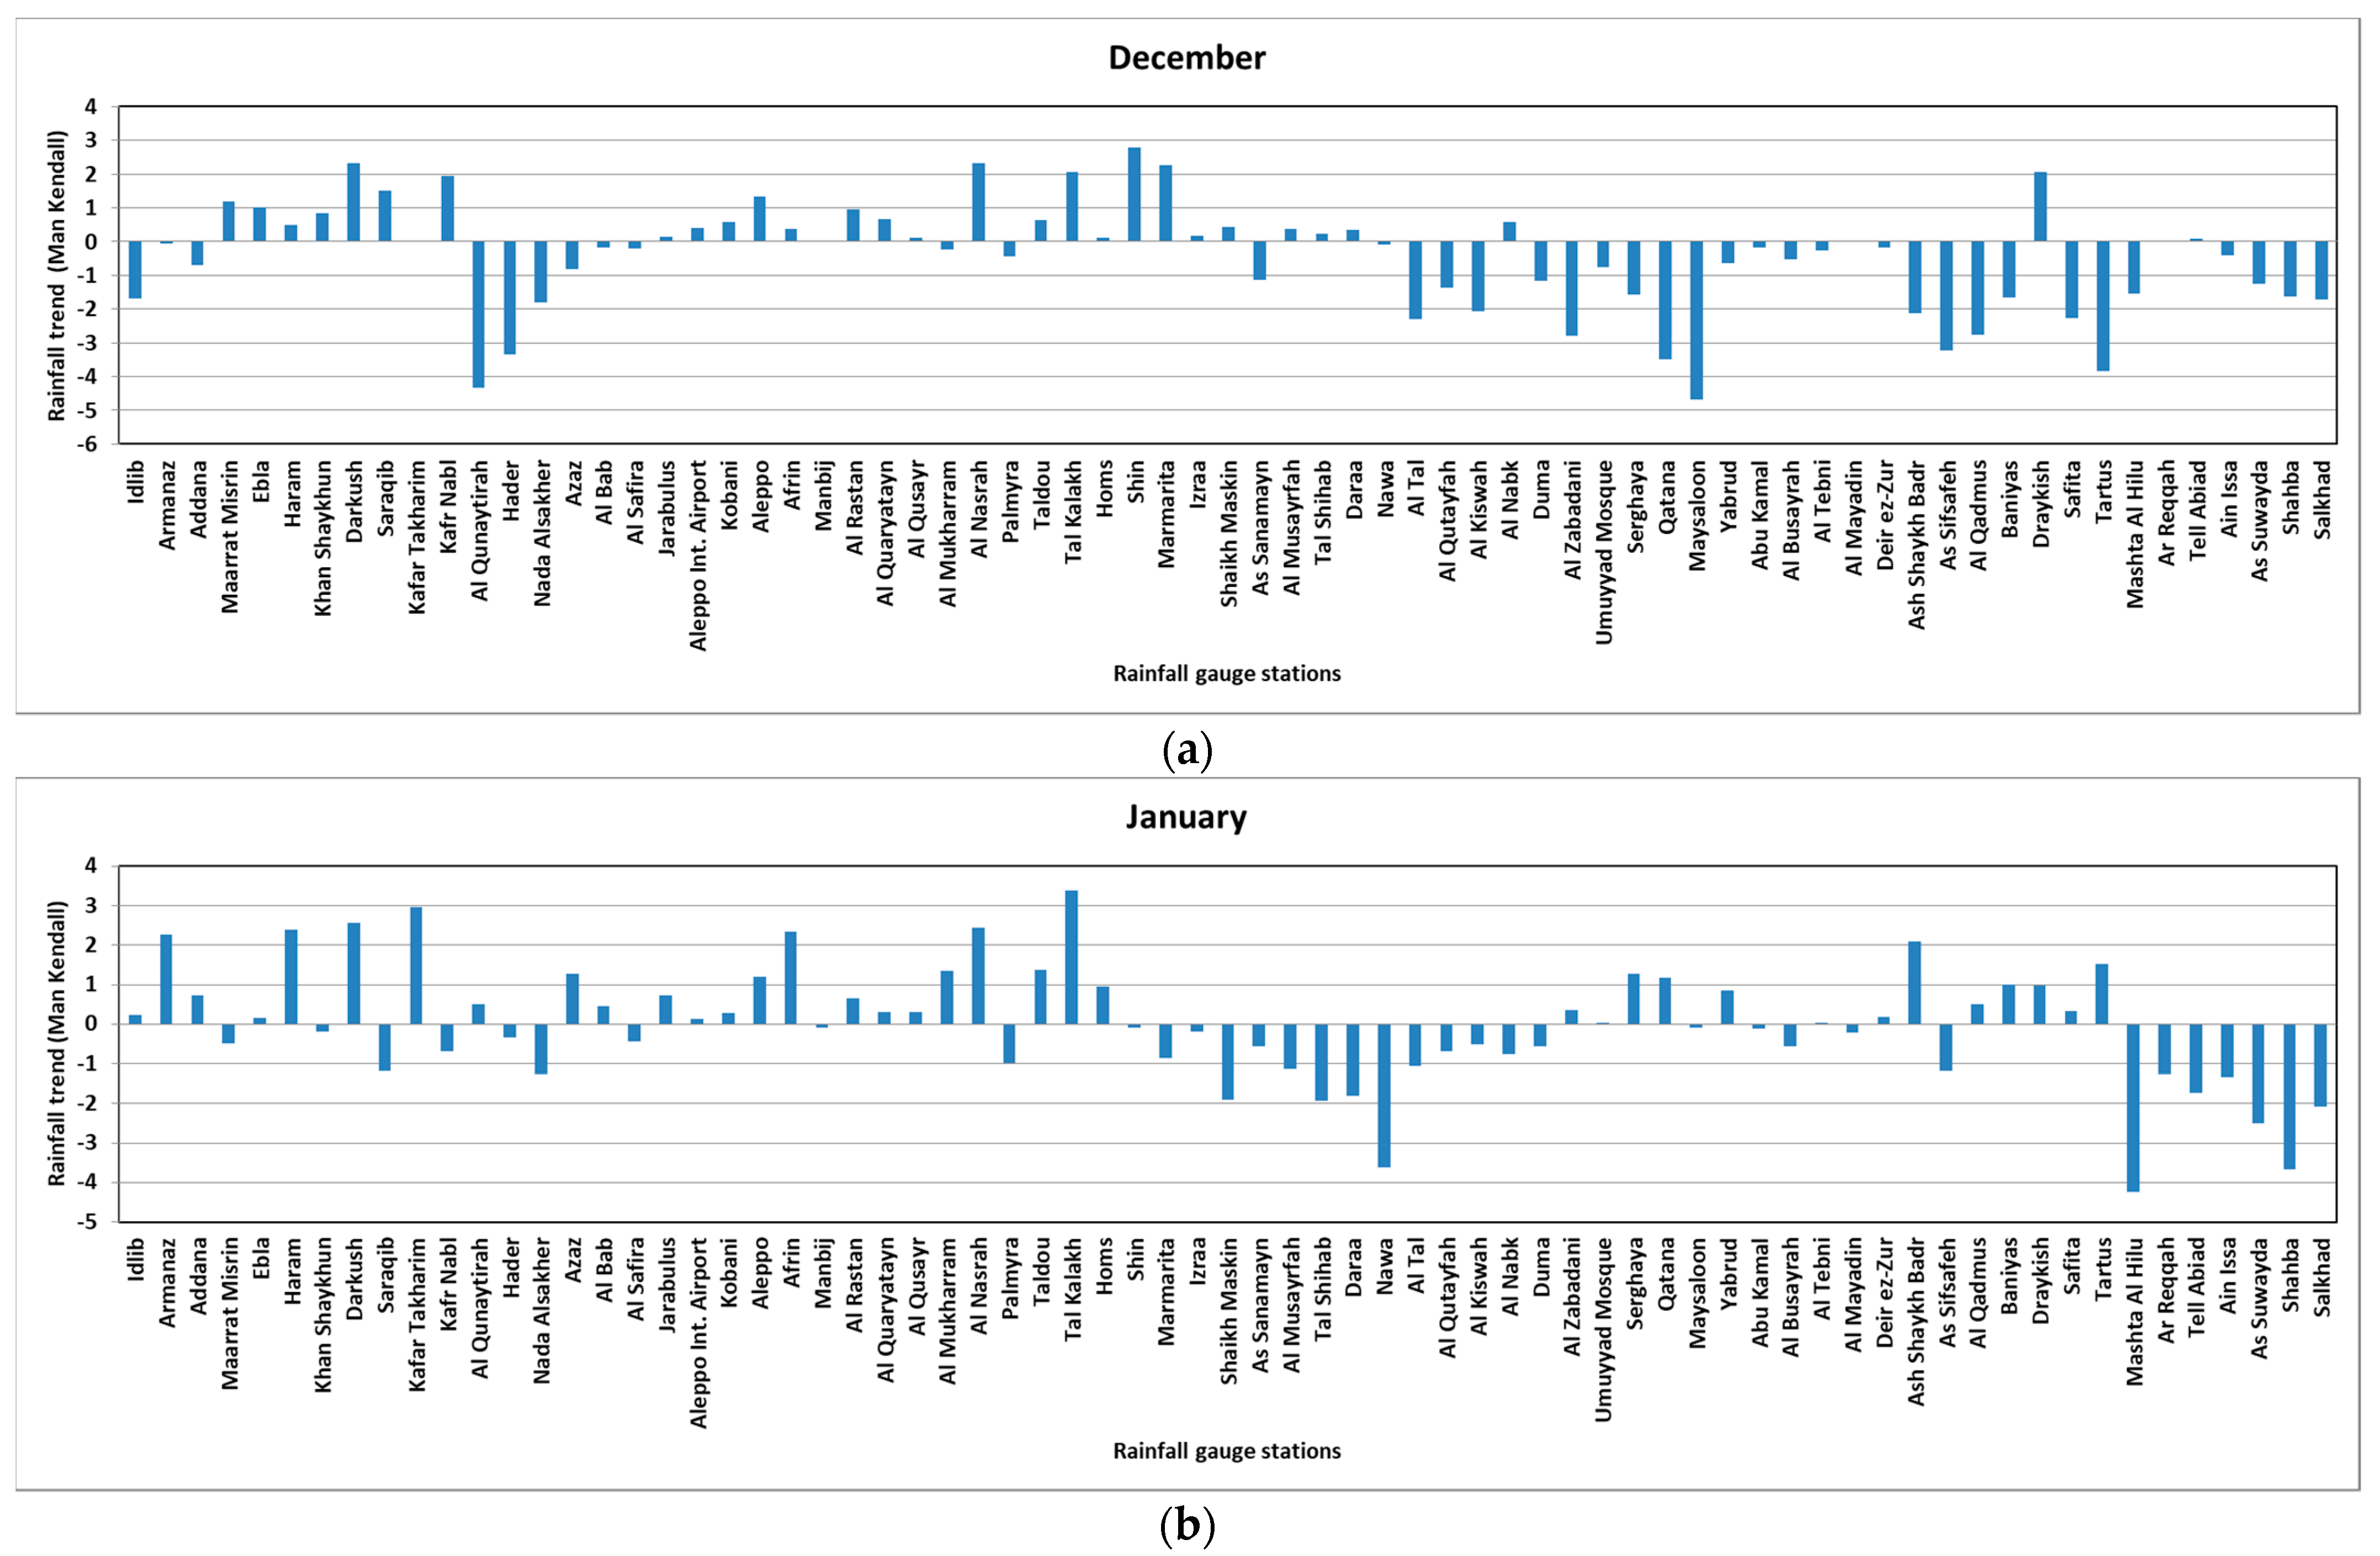
4.2. Mann–Kendal Results
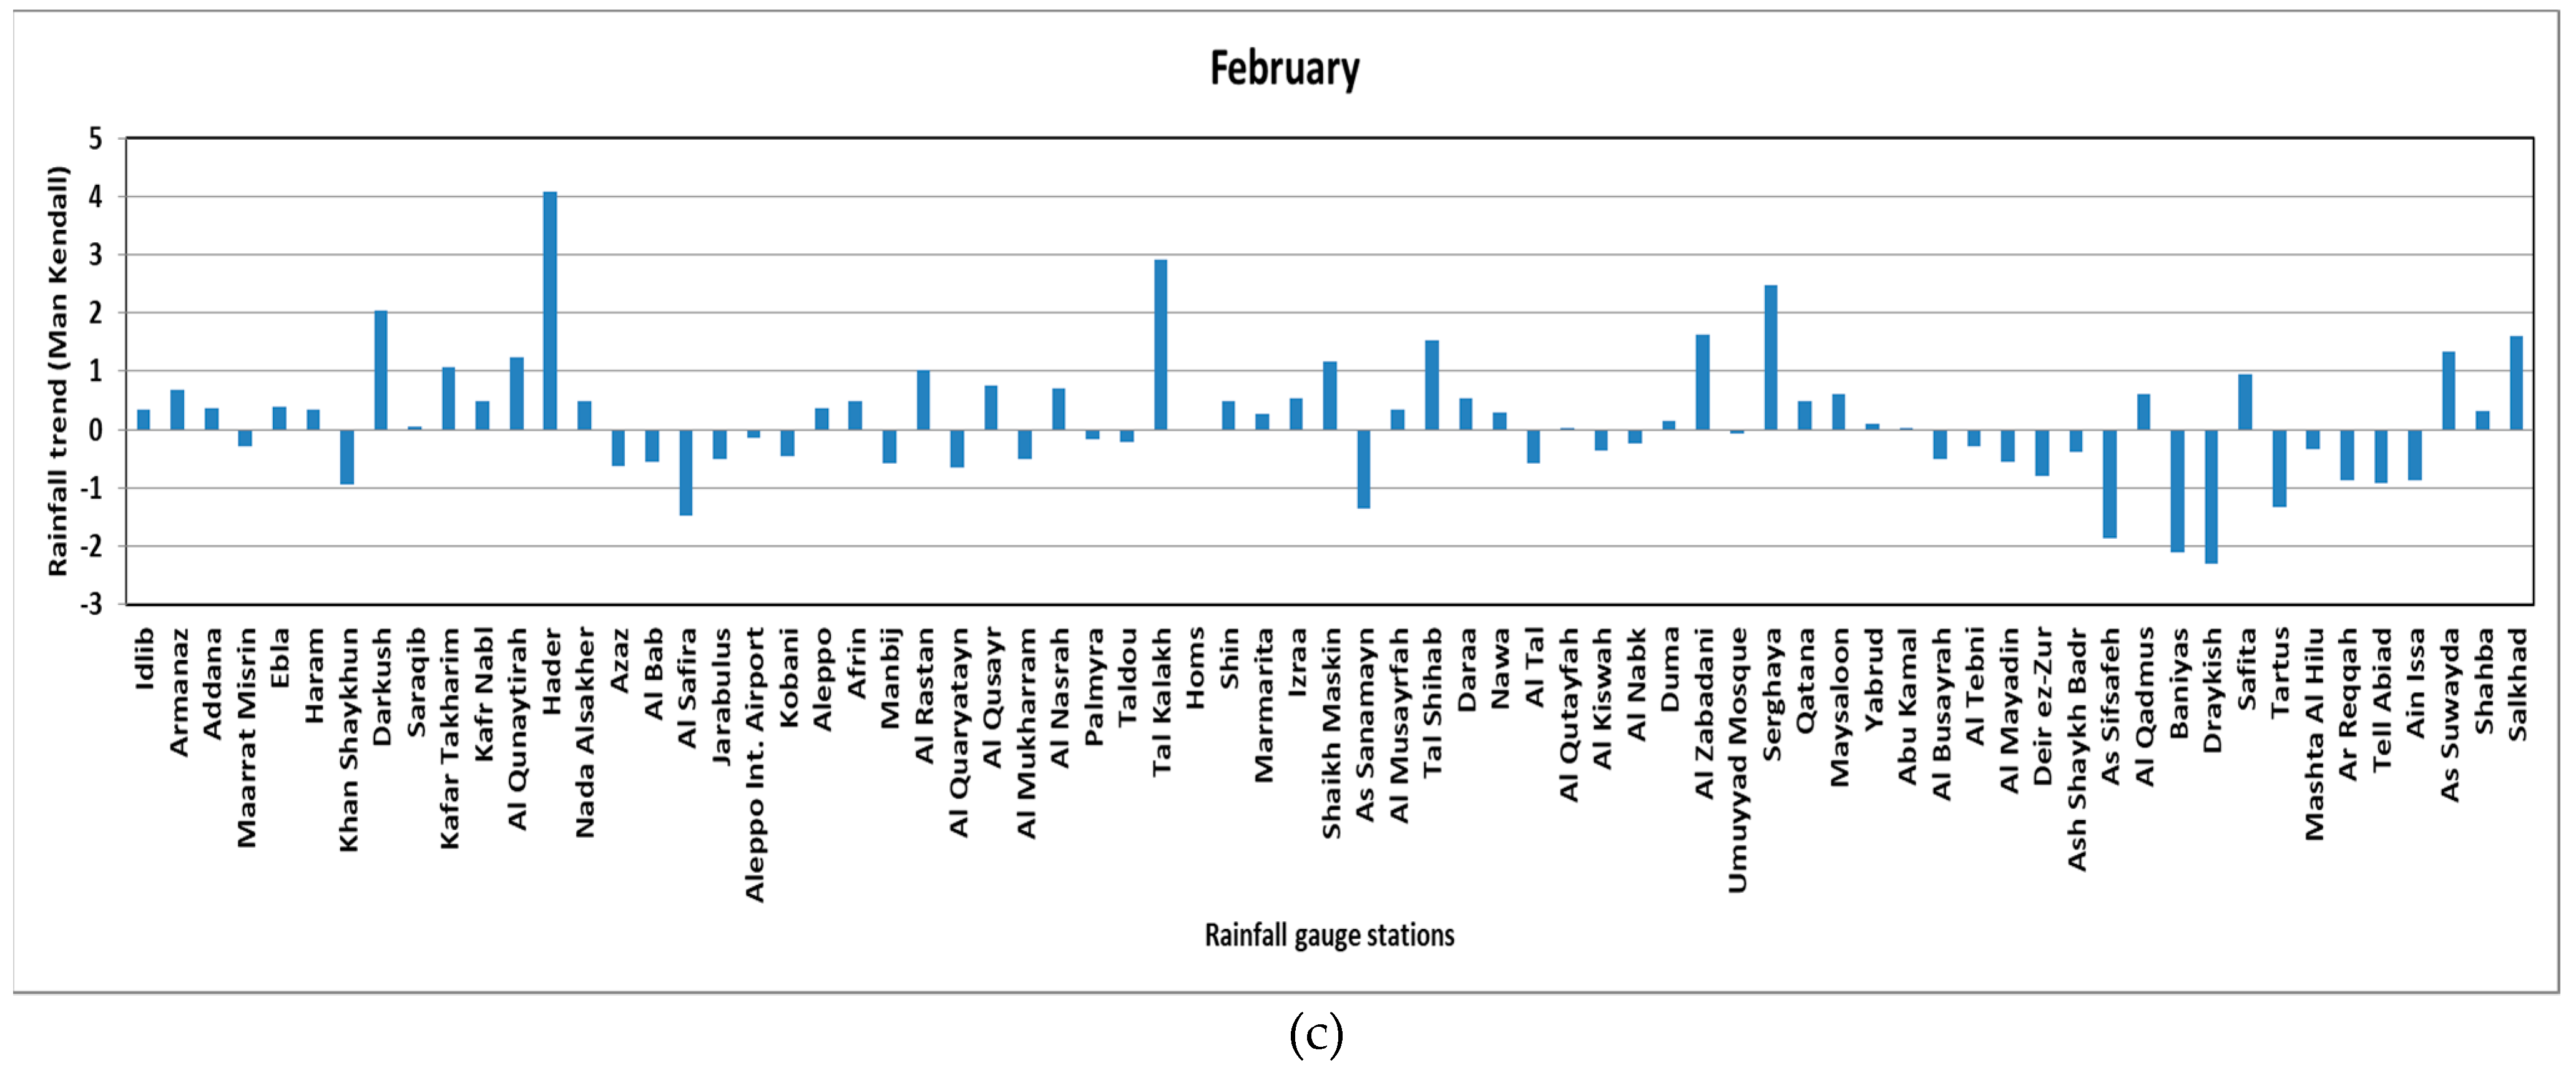
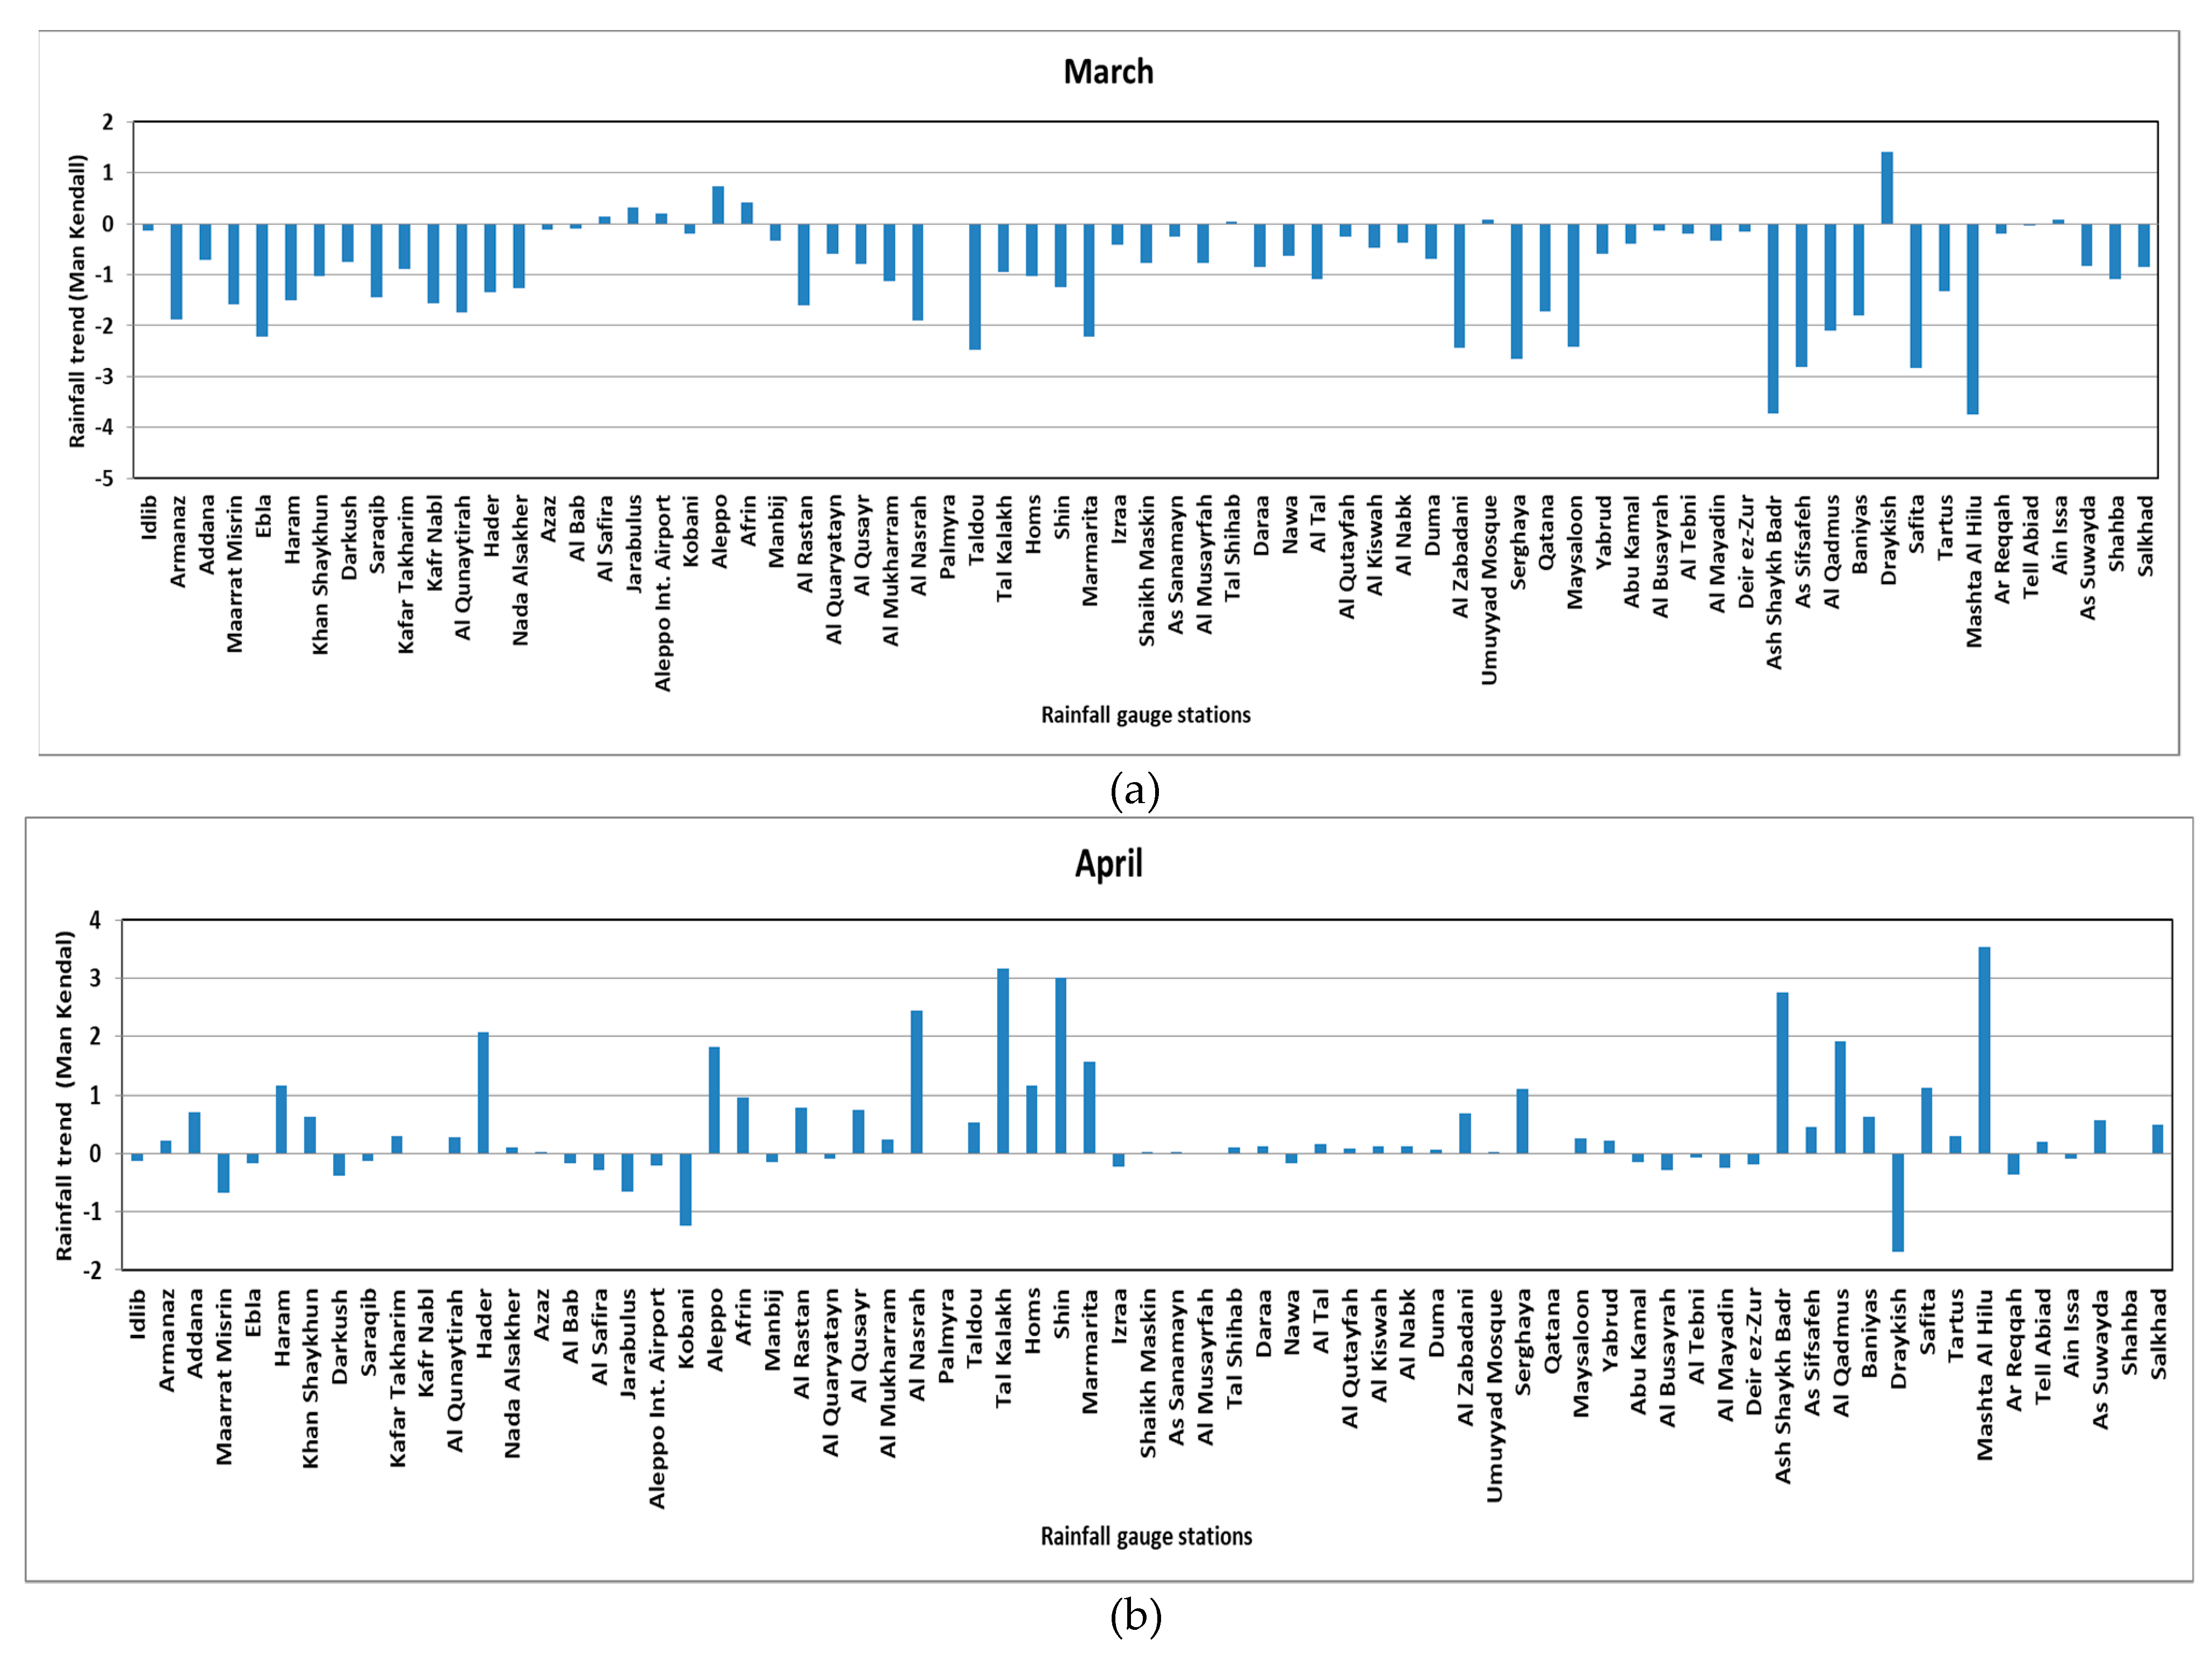
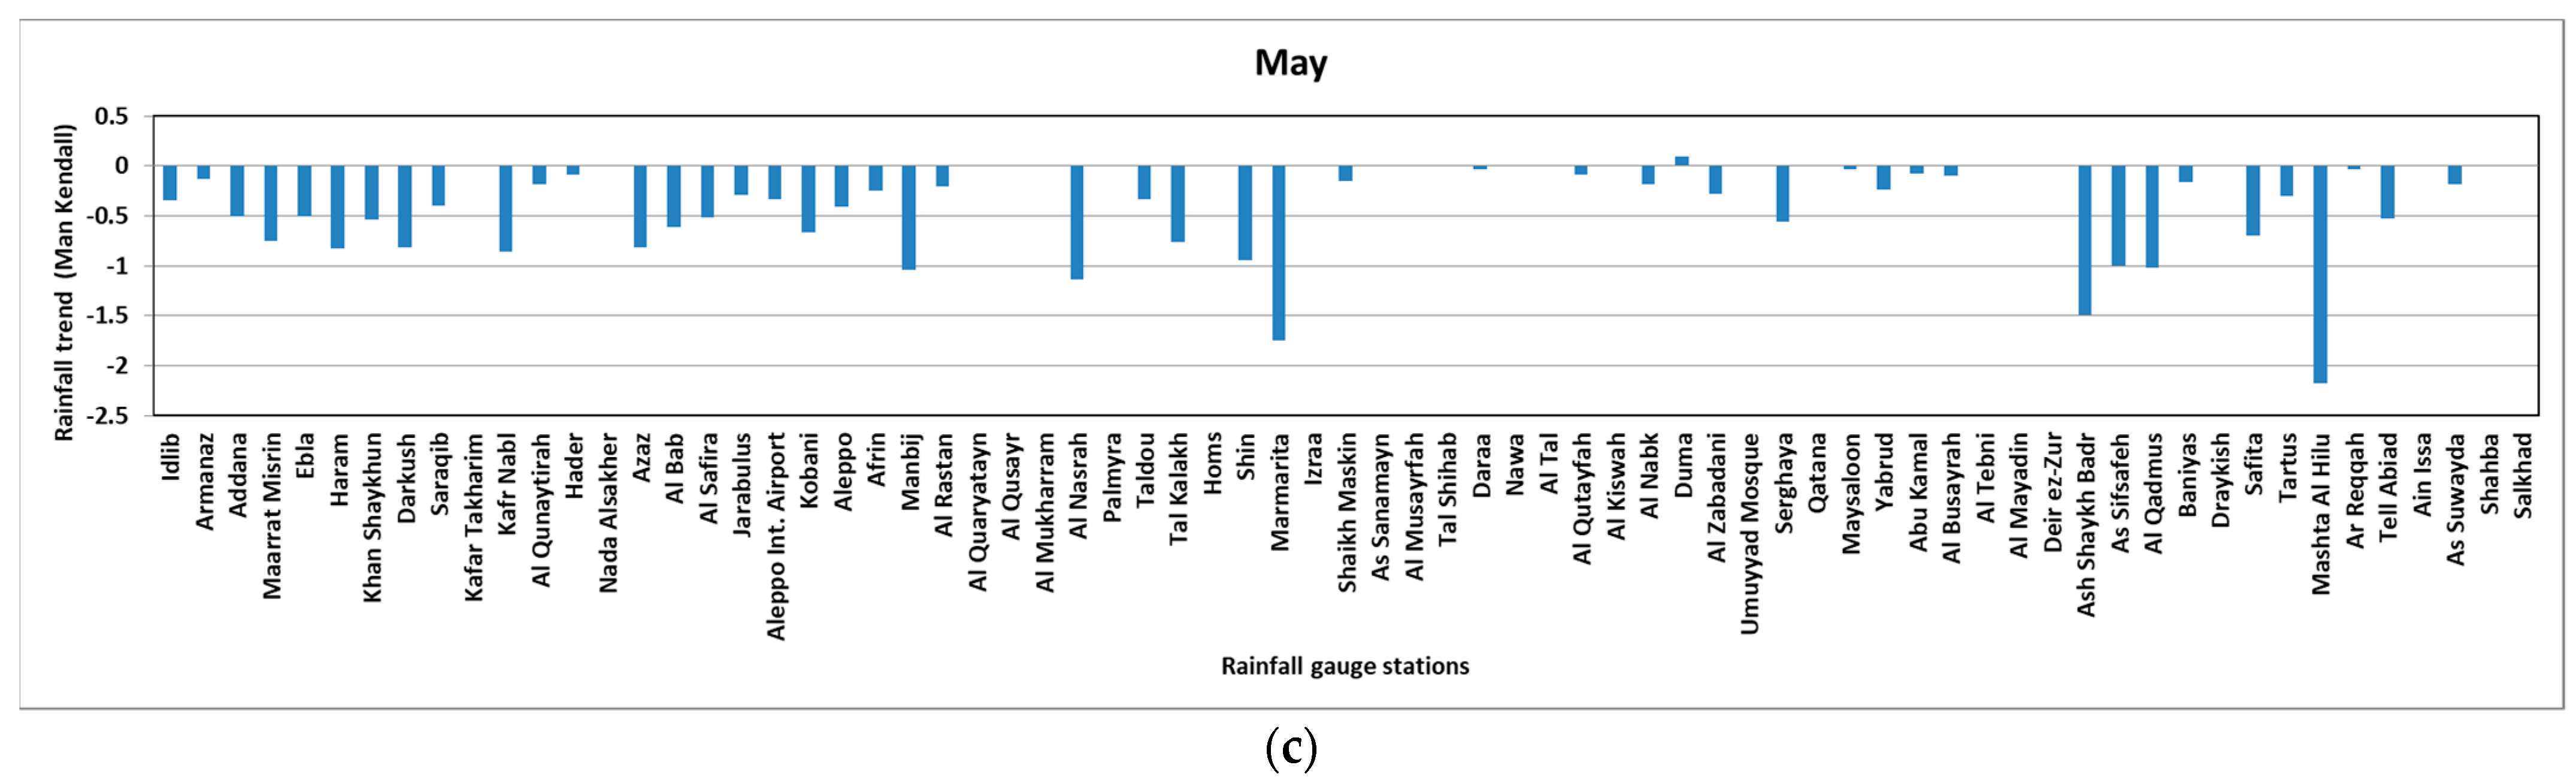
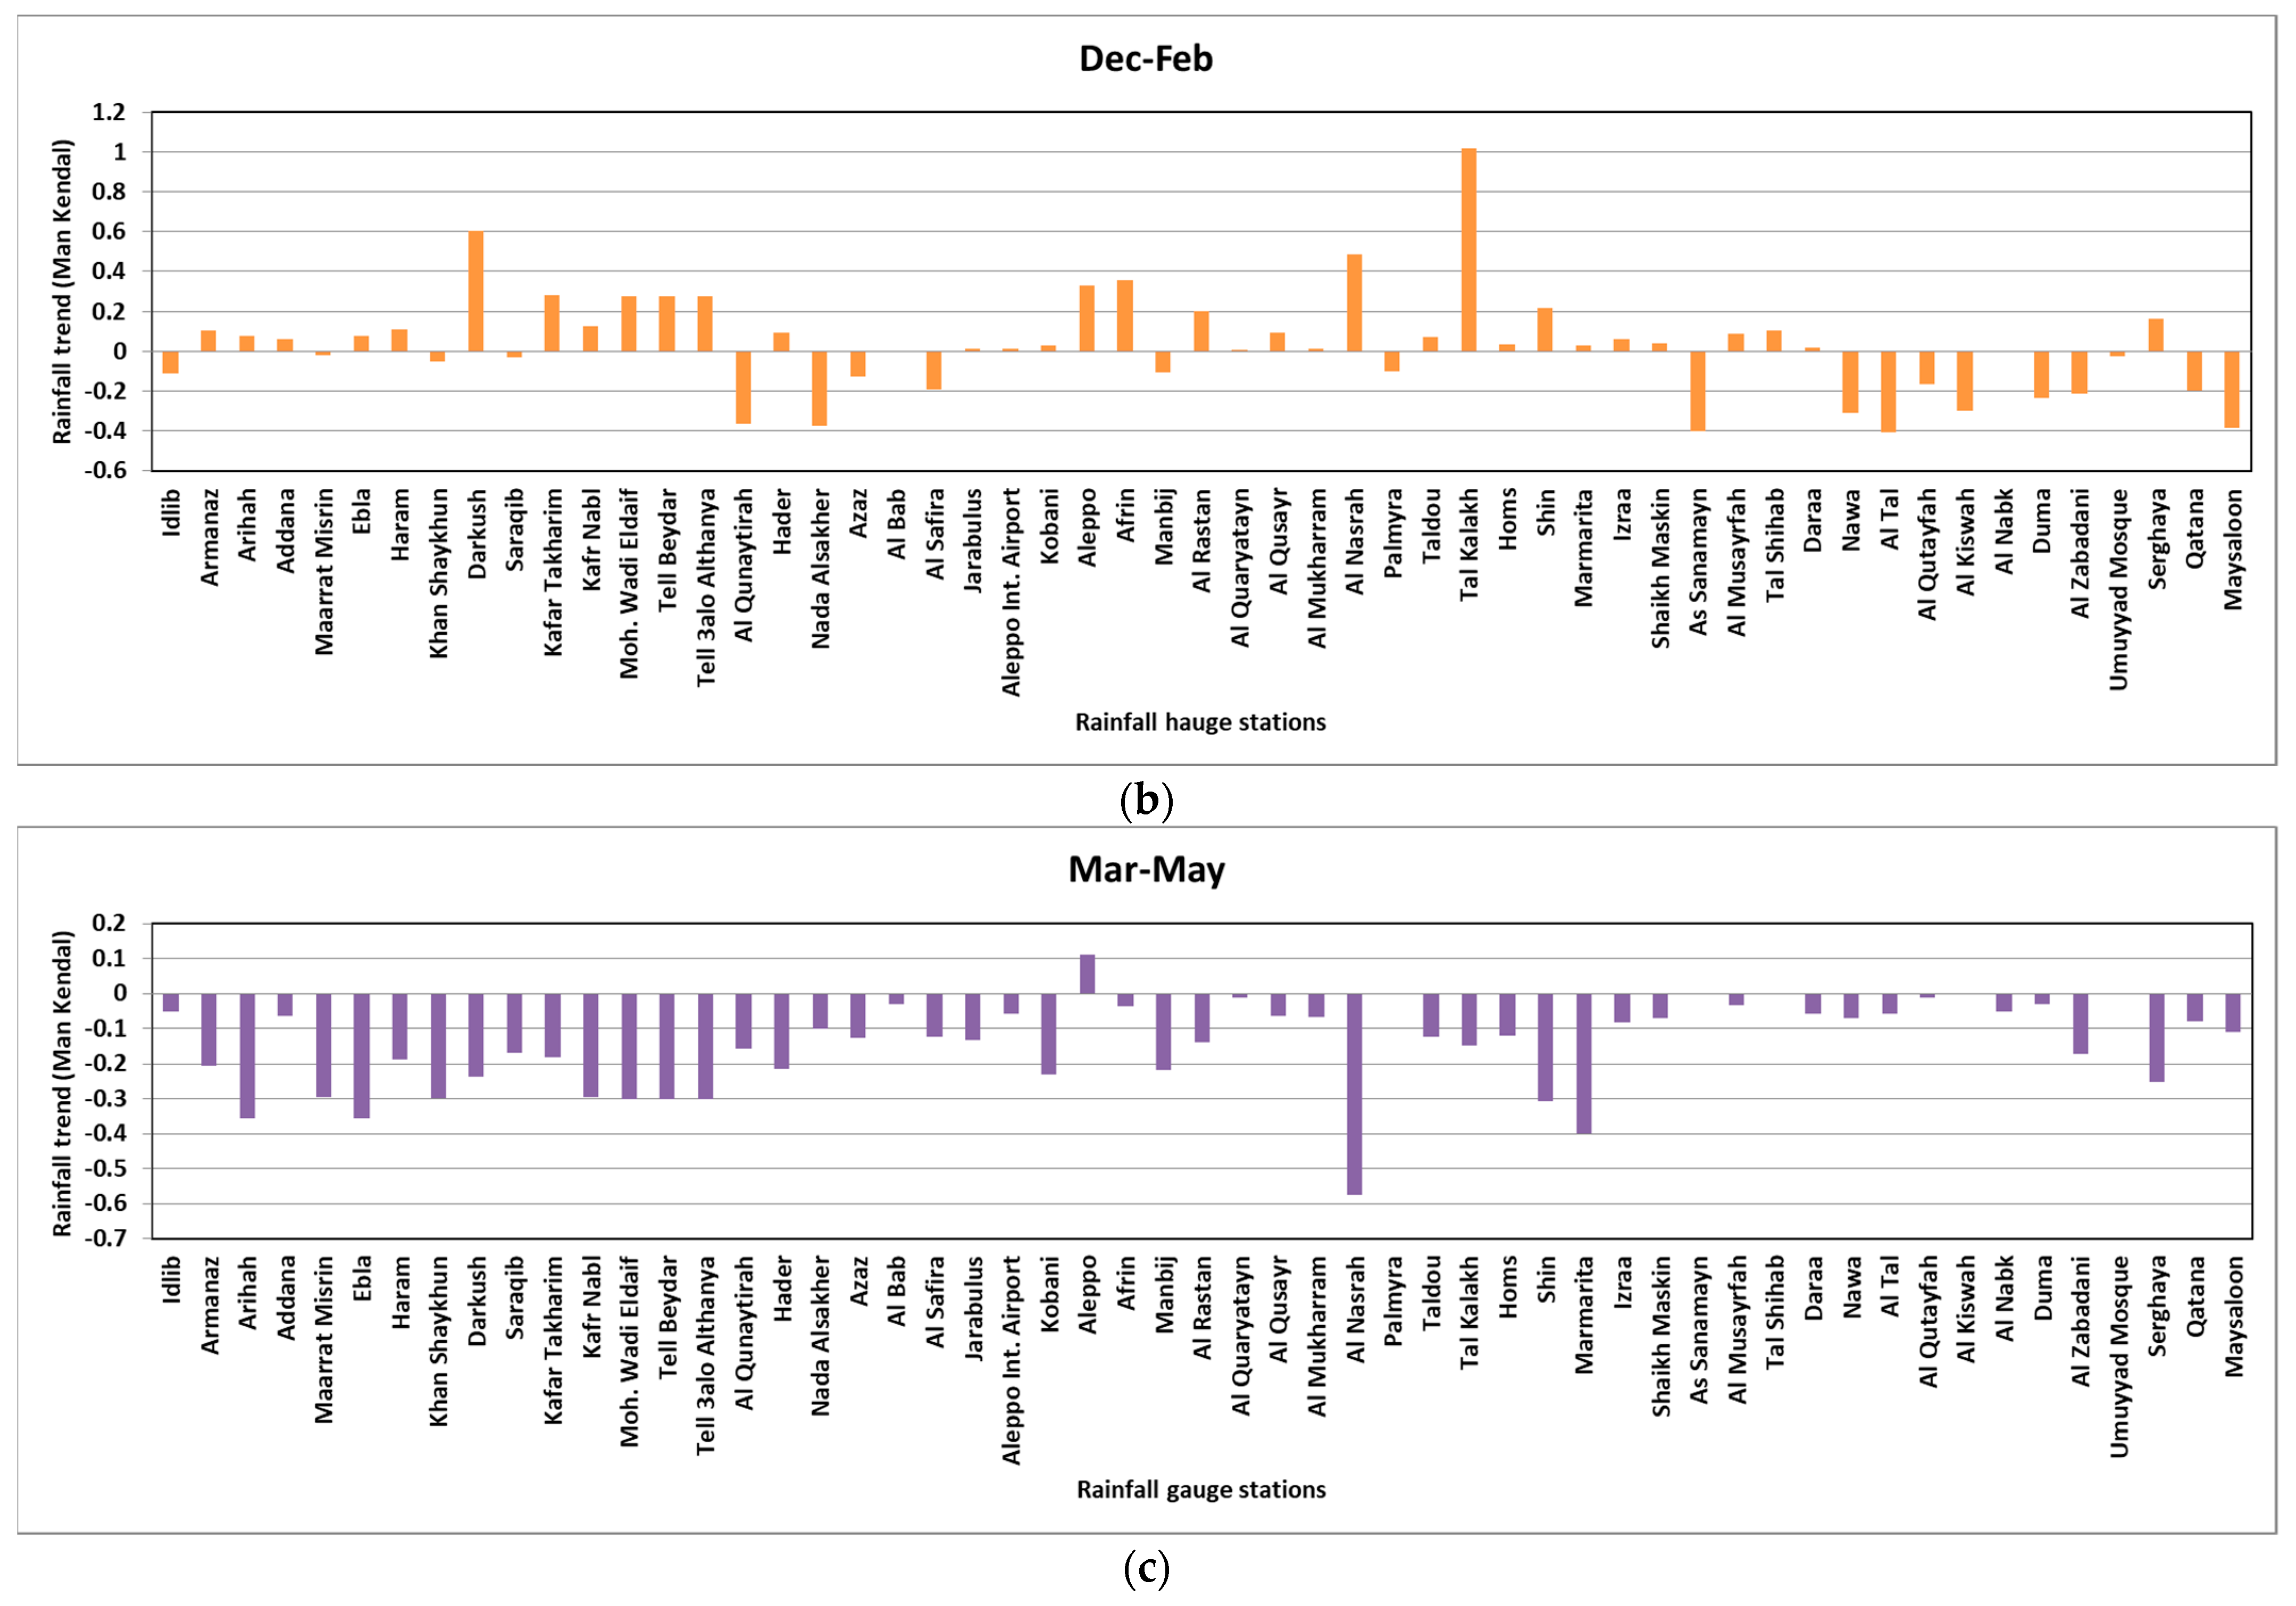
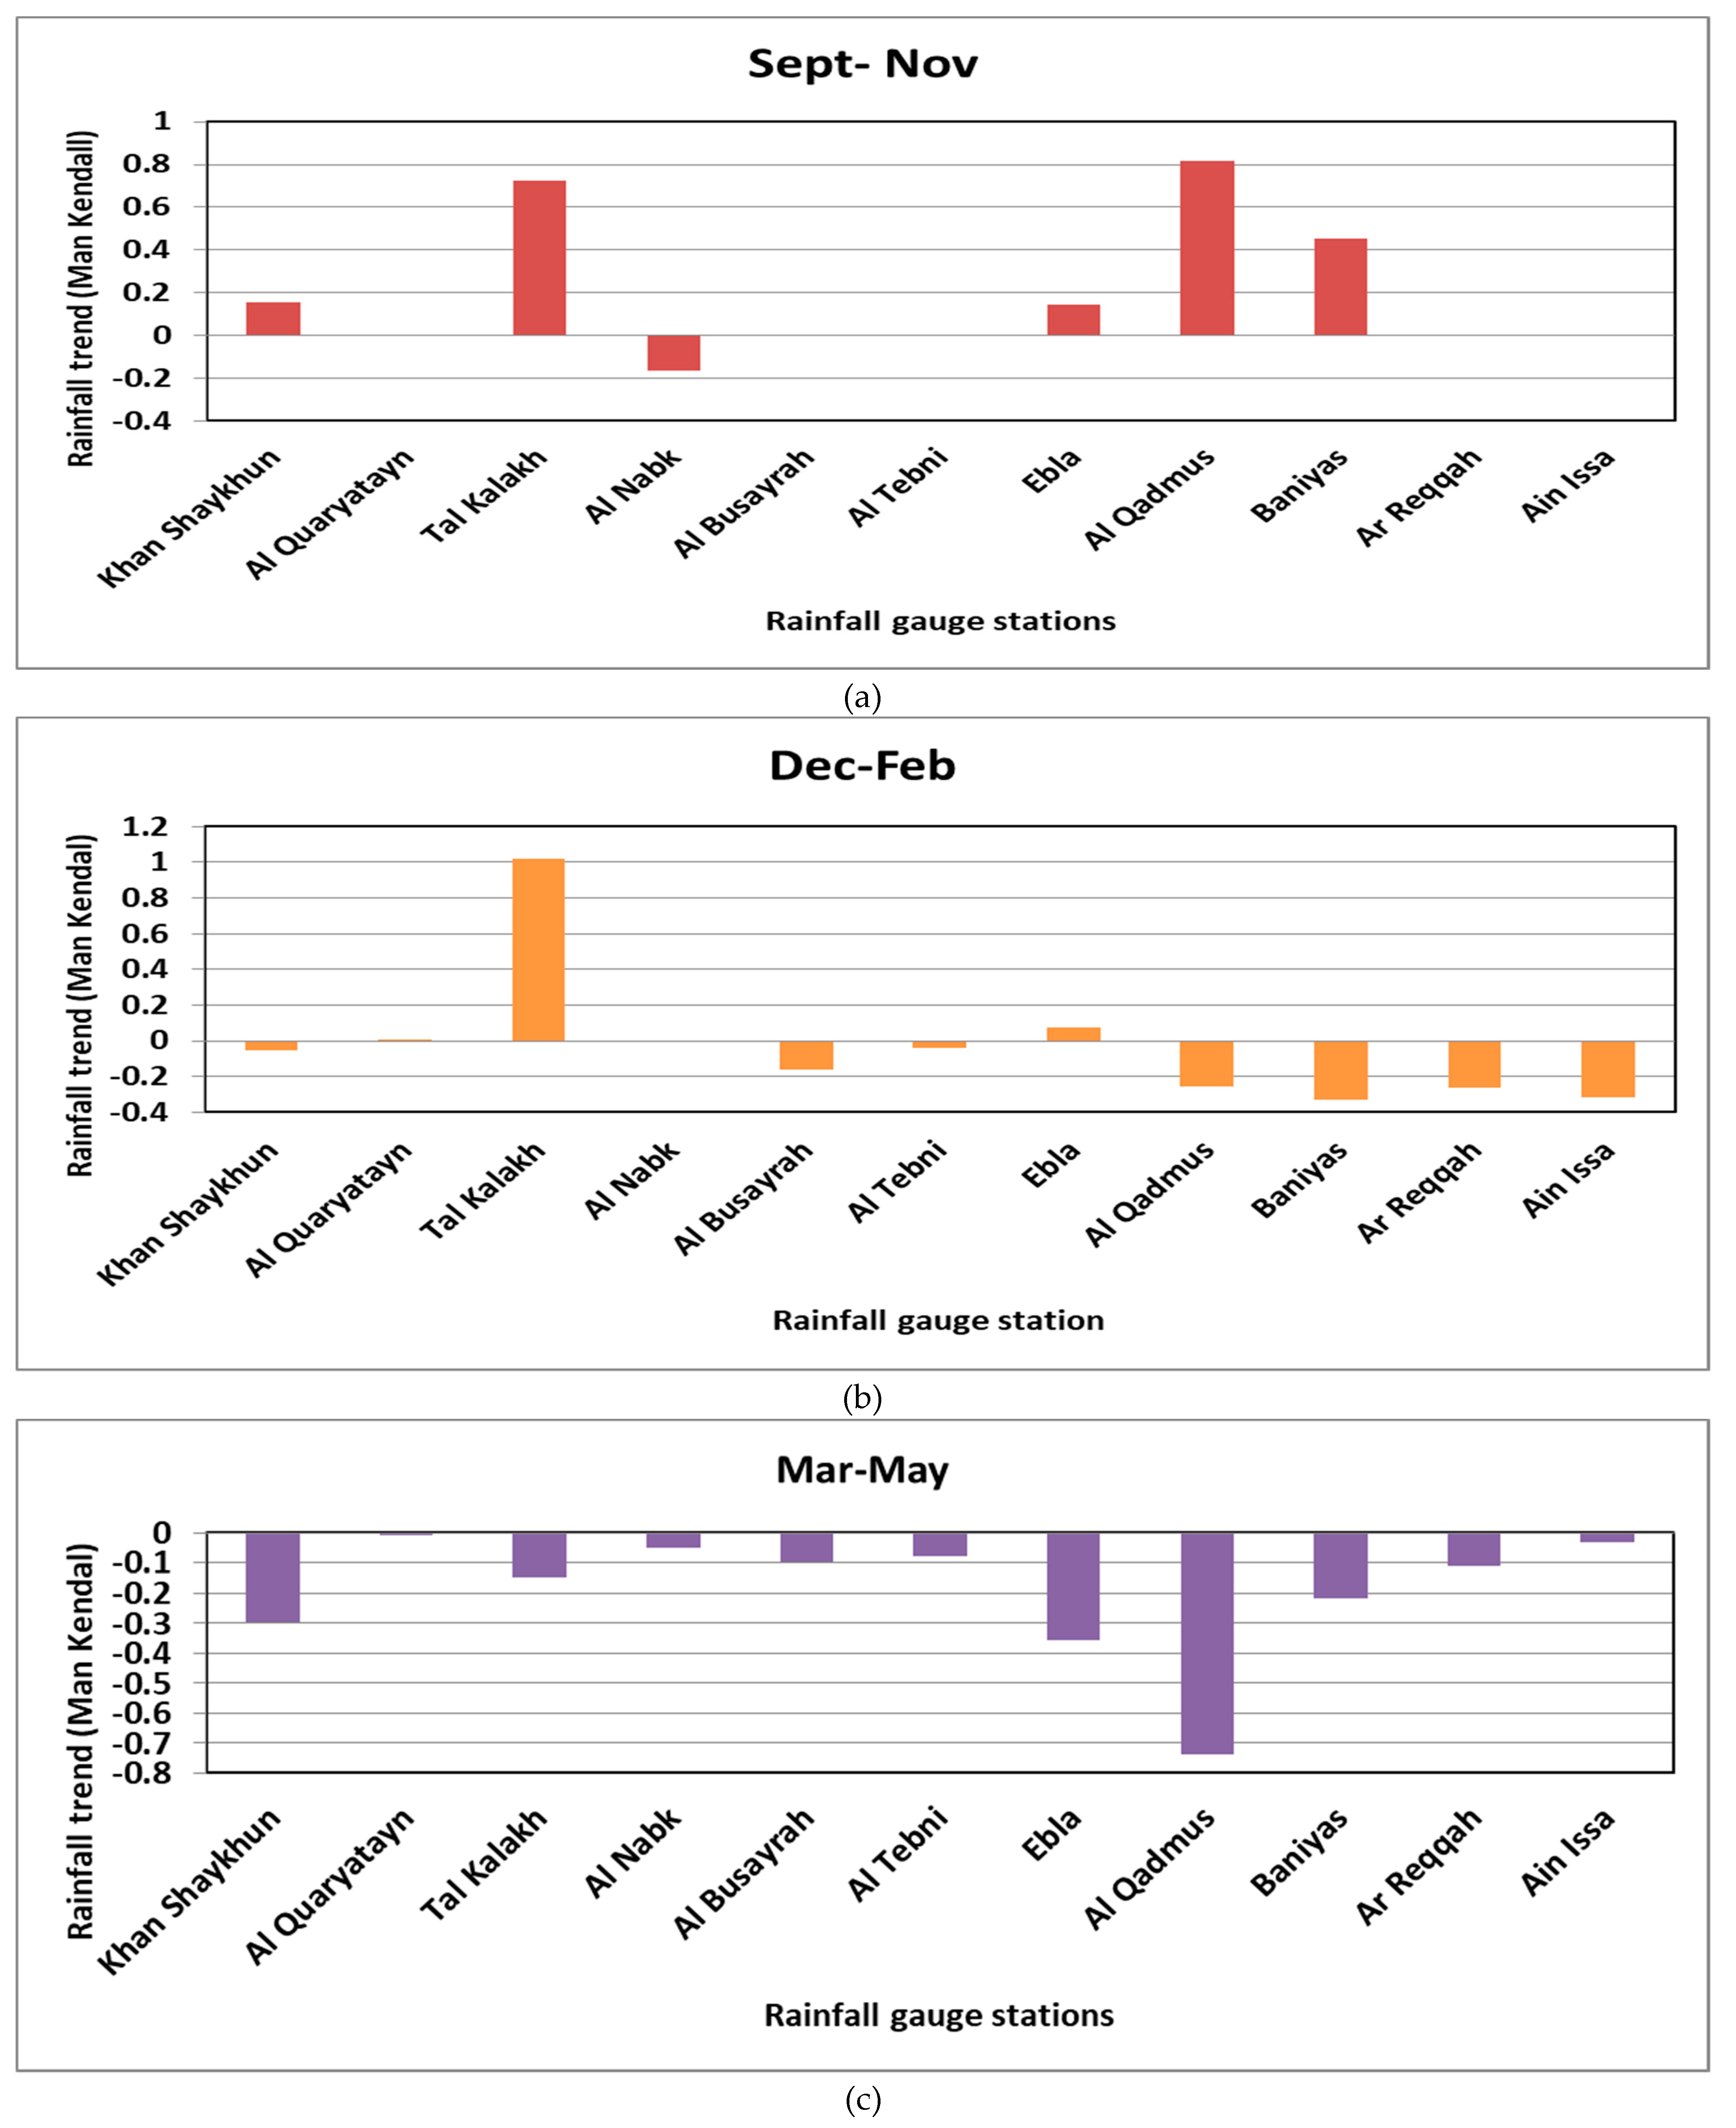
4.2.1. Result of Rainfall Analysis by Mann–Kendall for Monthly Trends
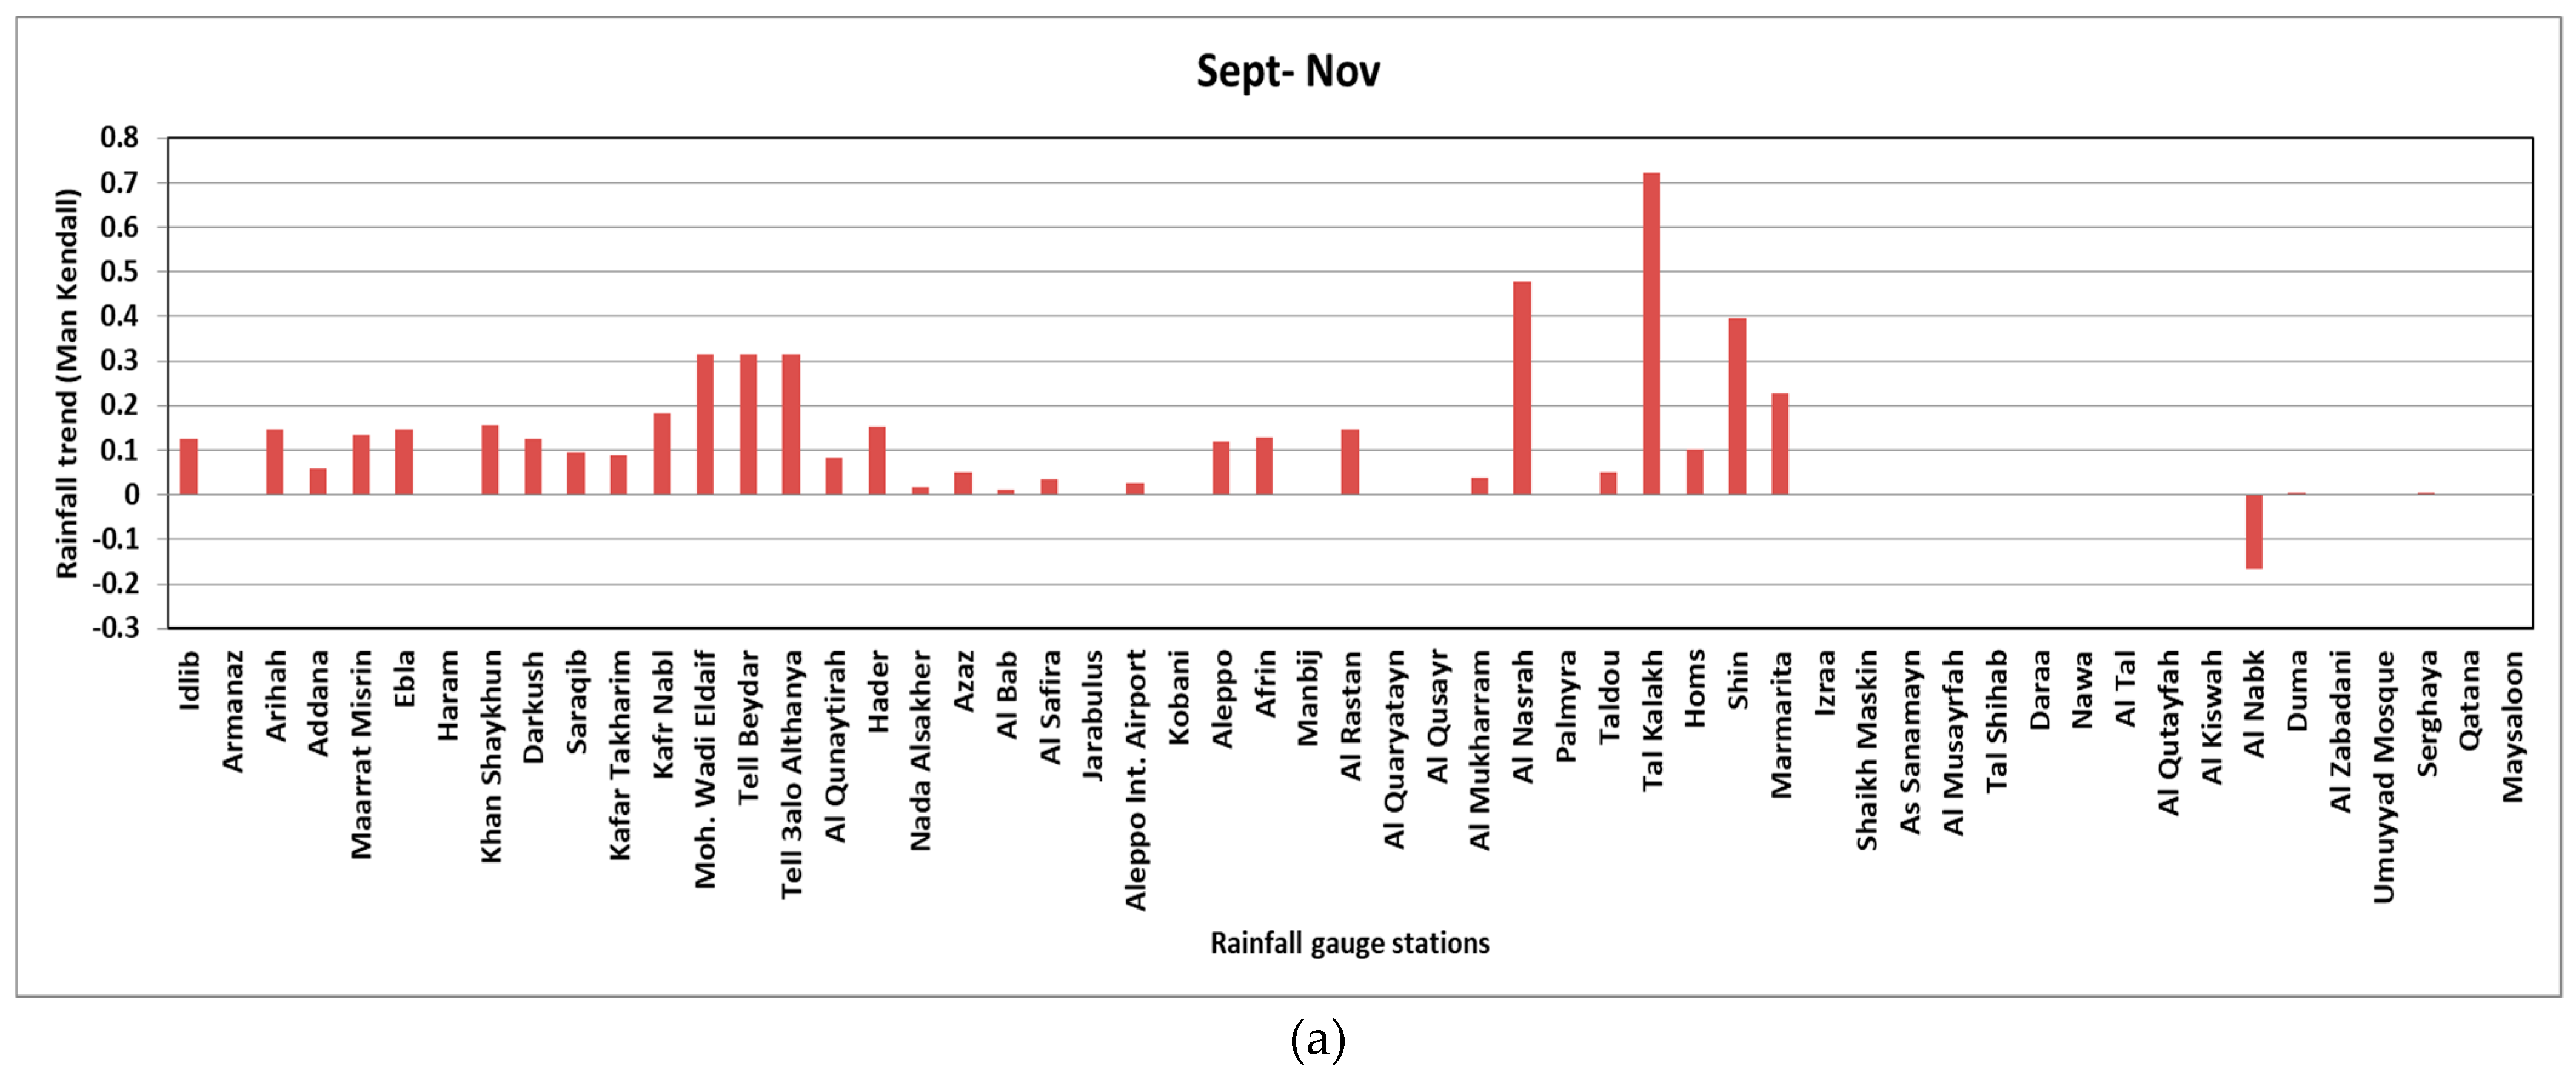
4.2.2. Results of Rainfall Analysis by Mann–Kendall for Long Periods
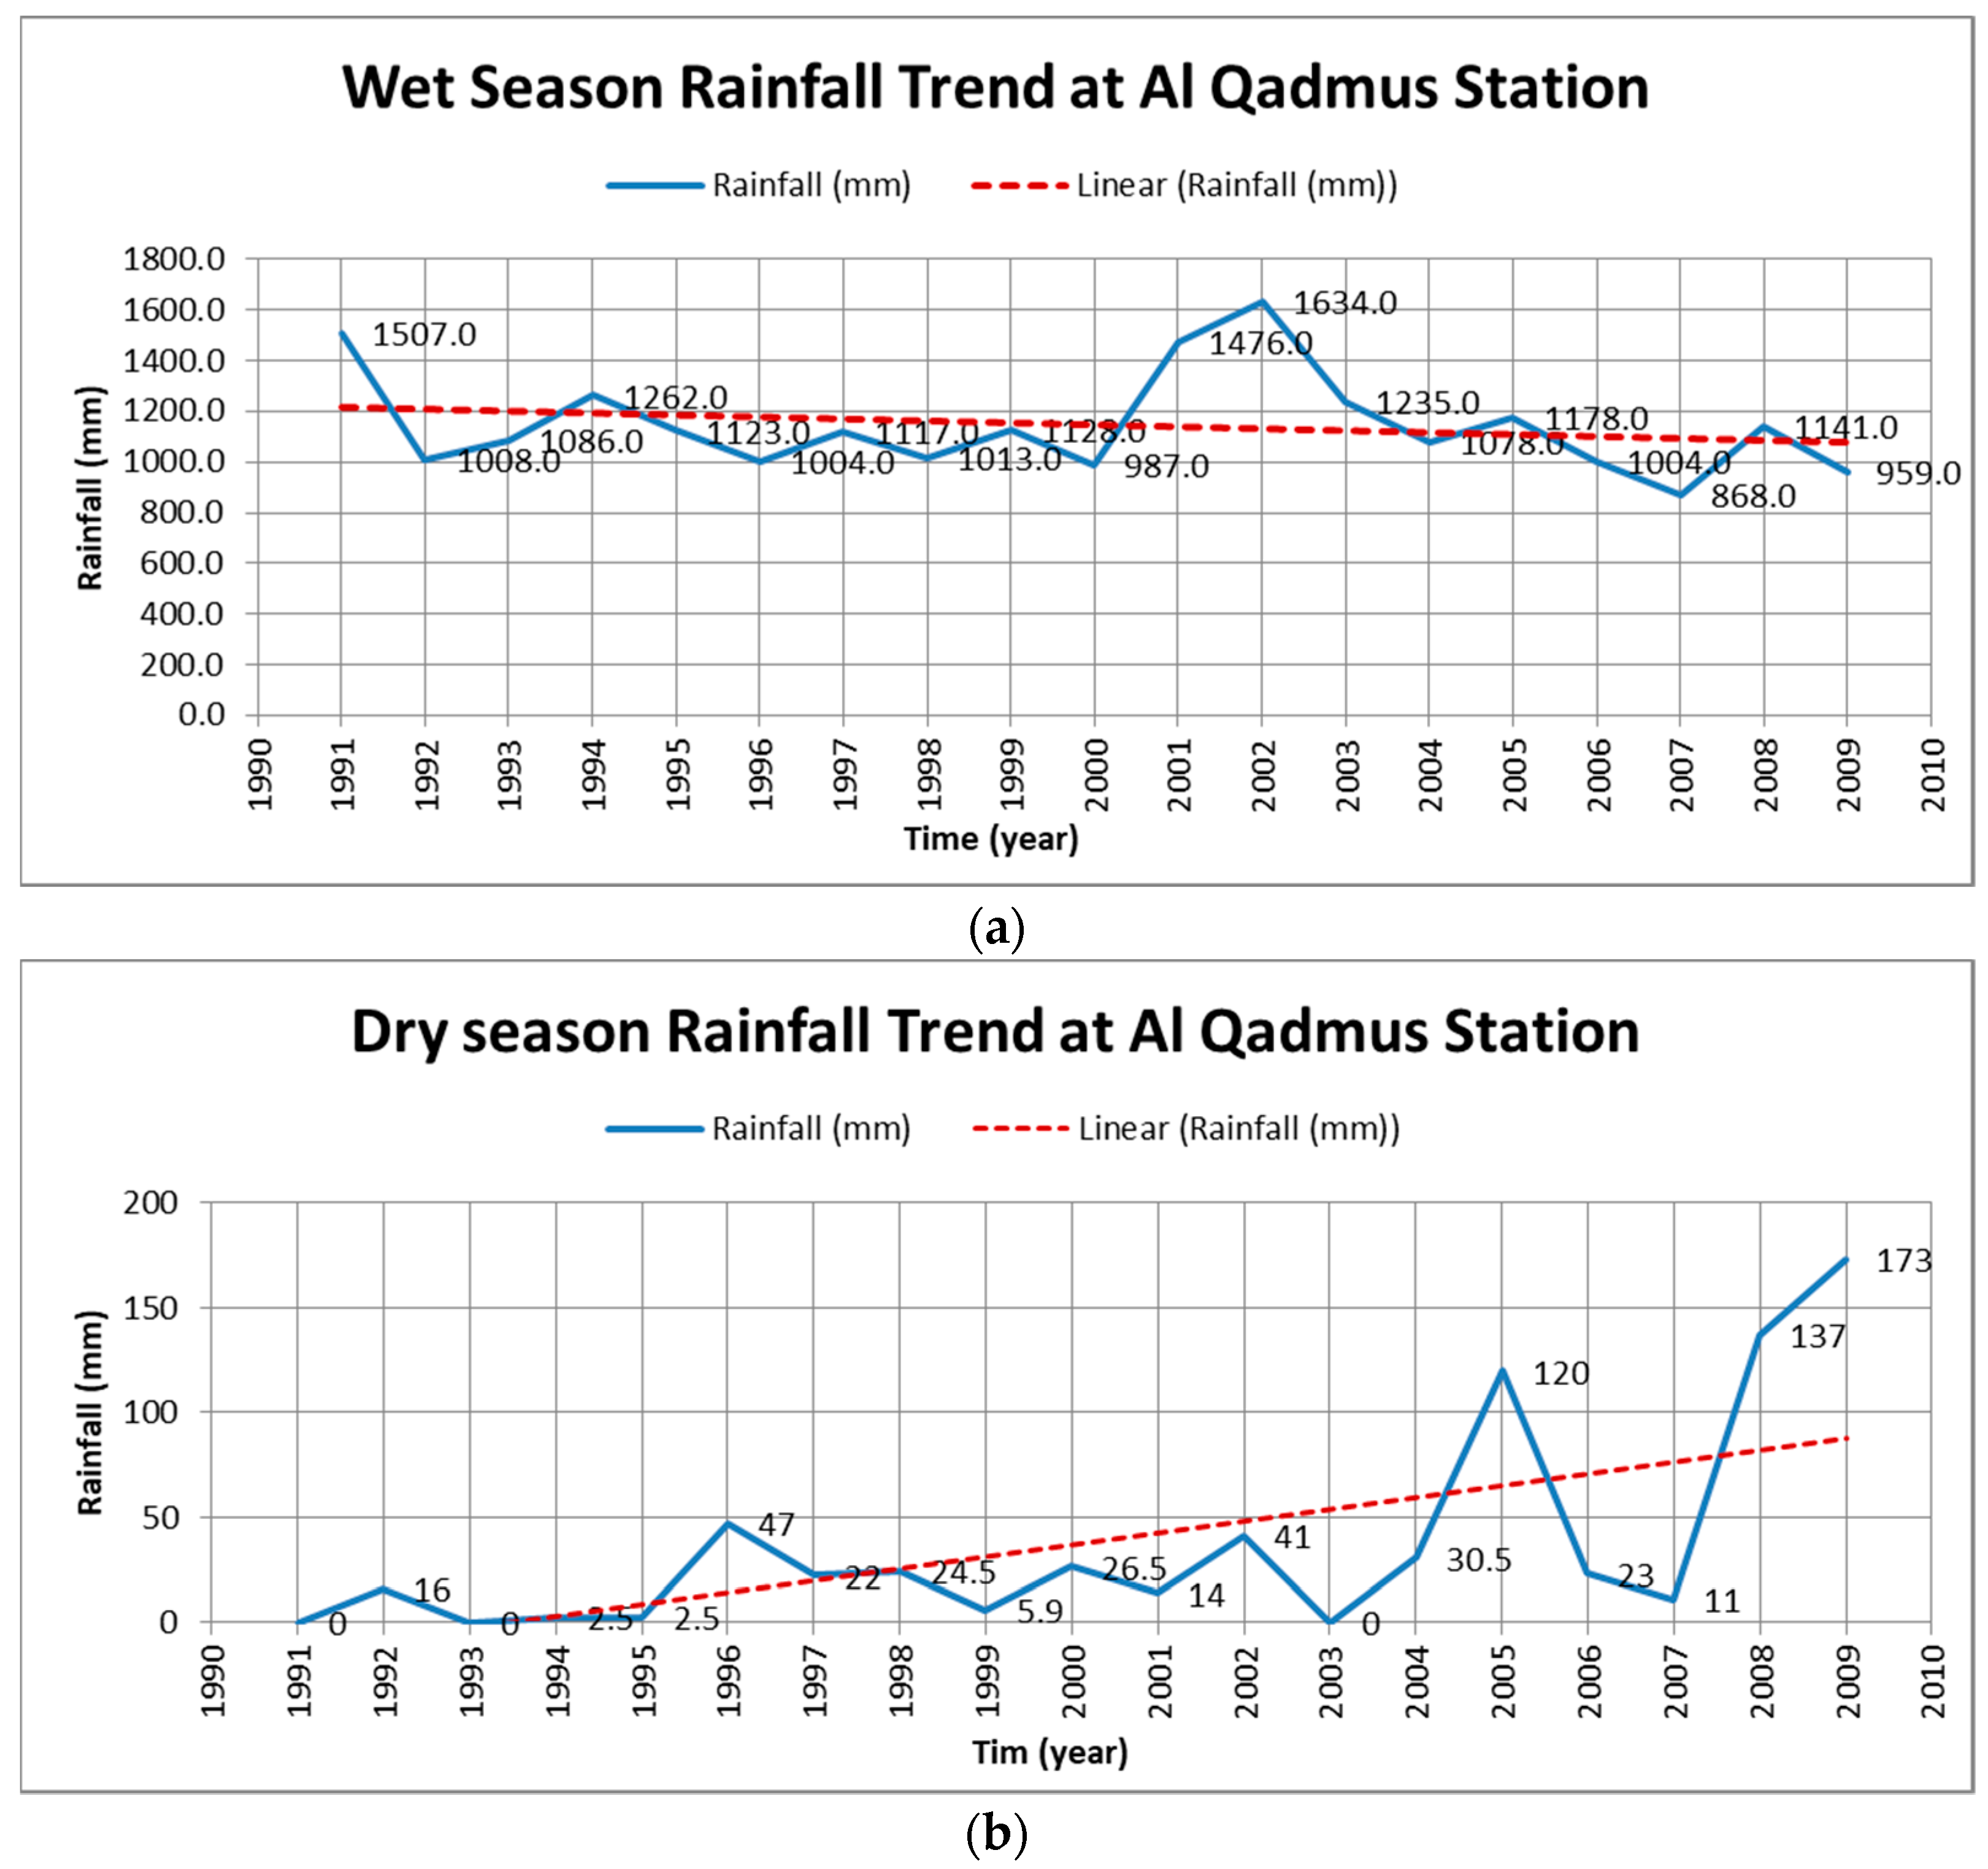
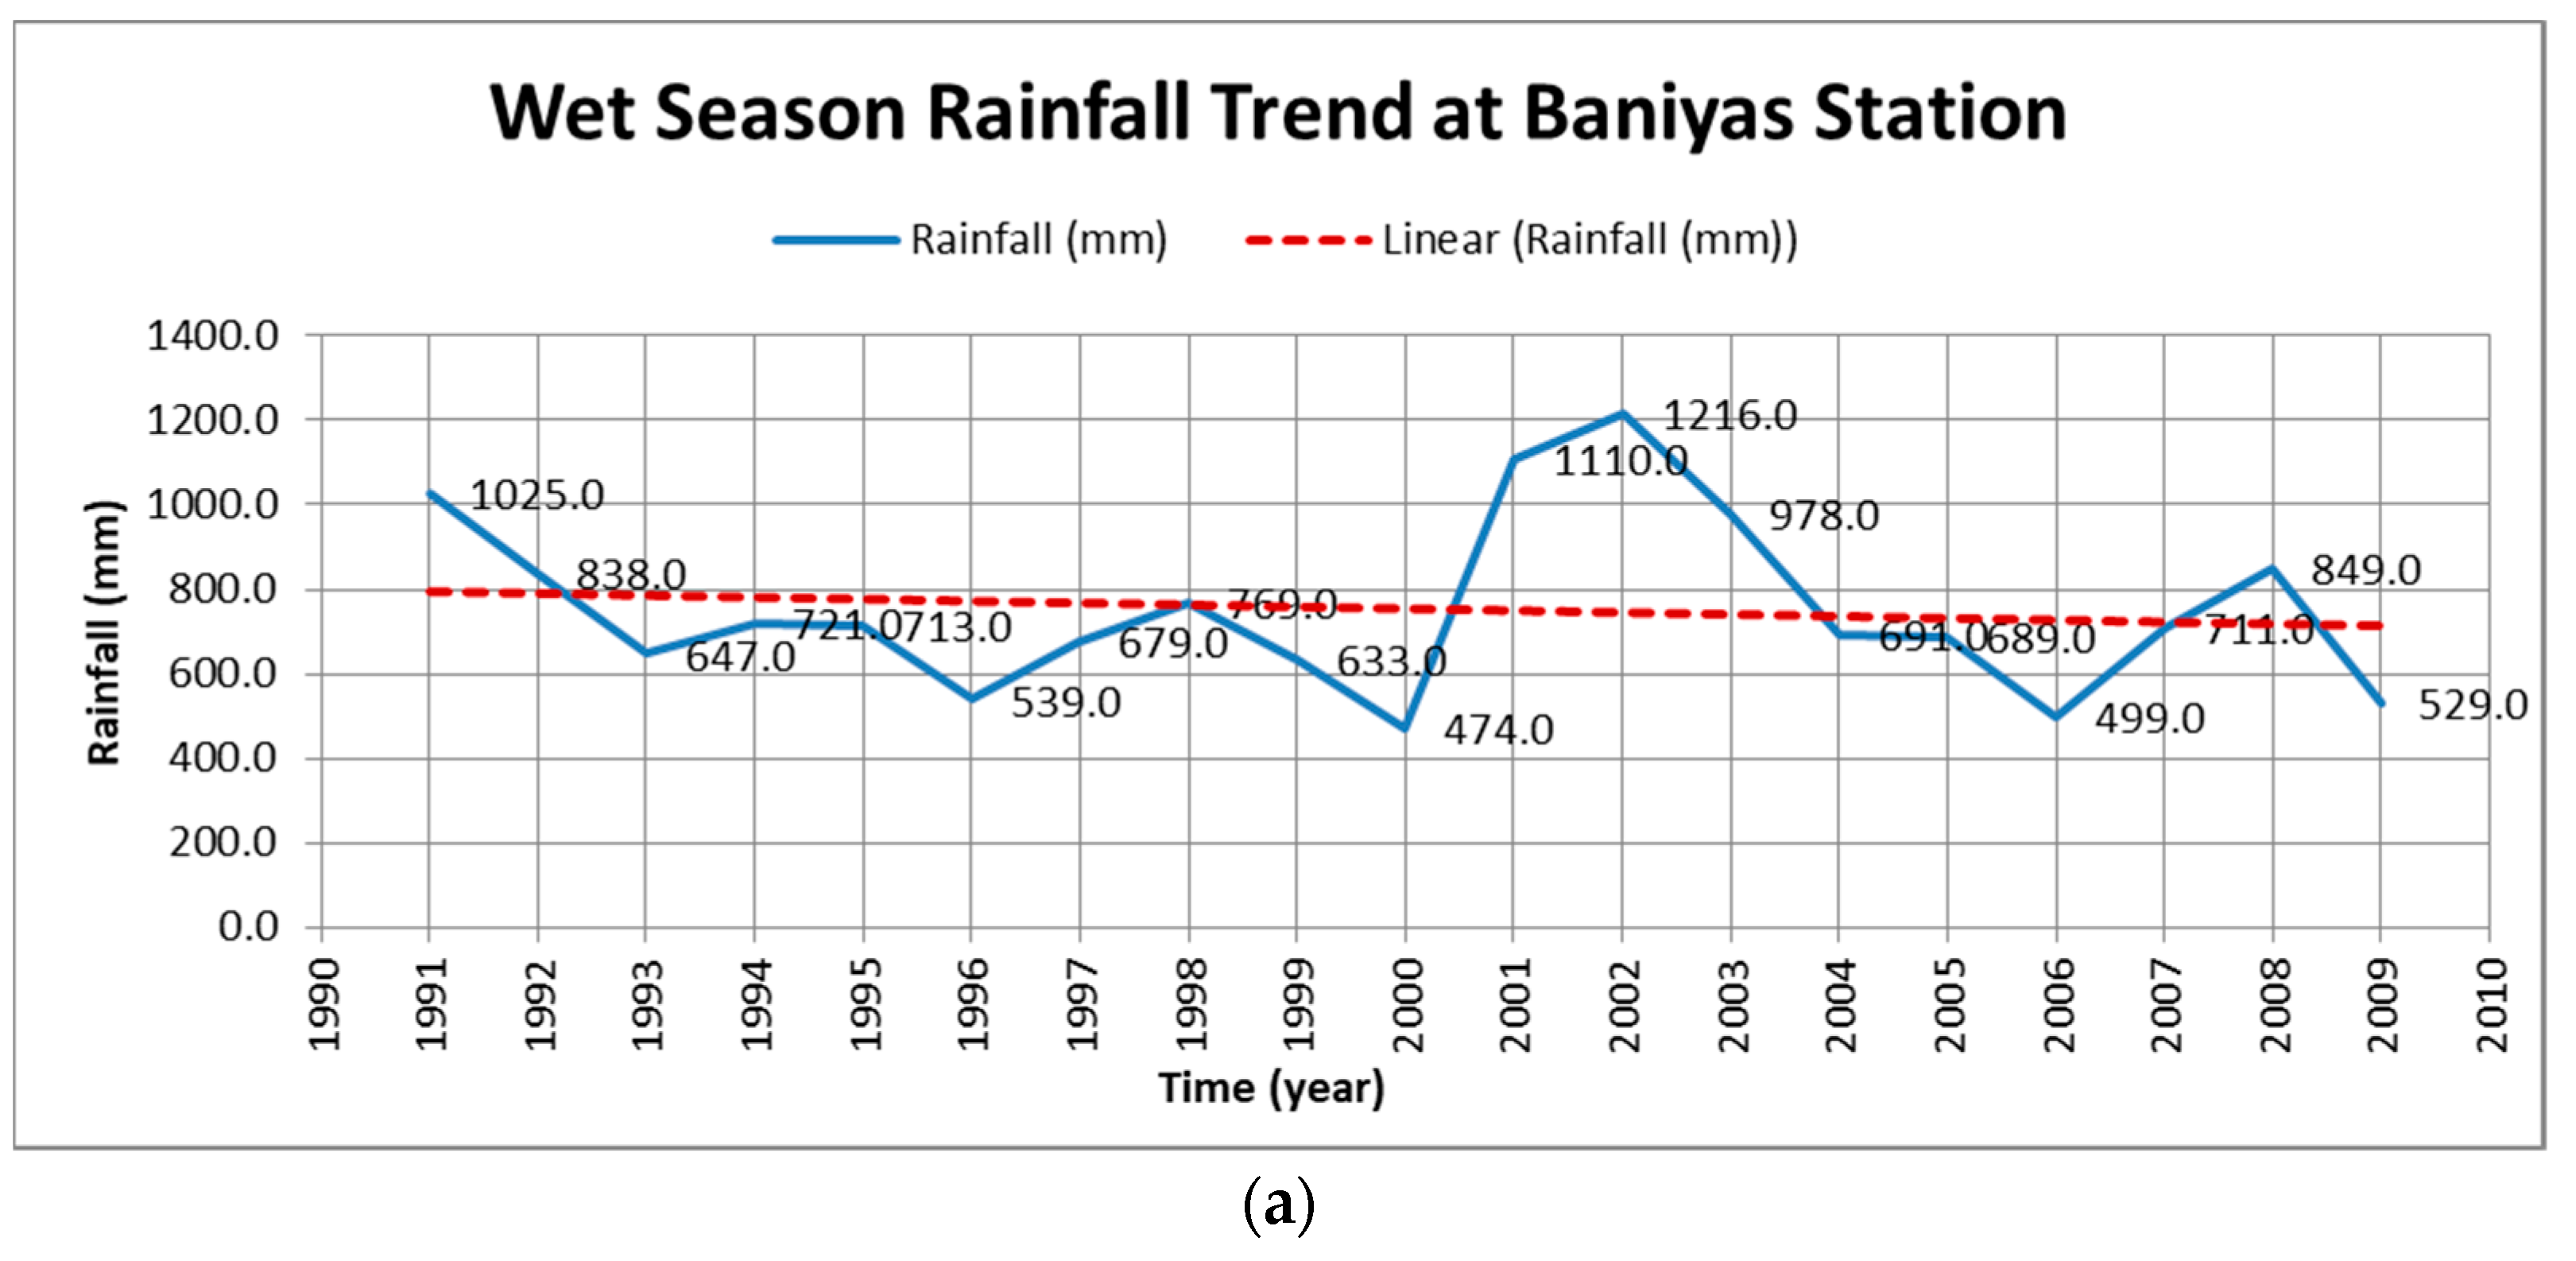
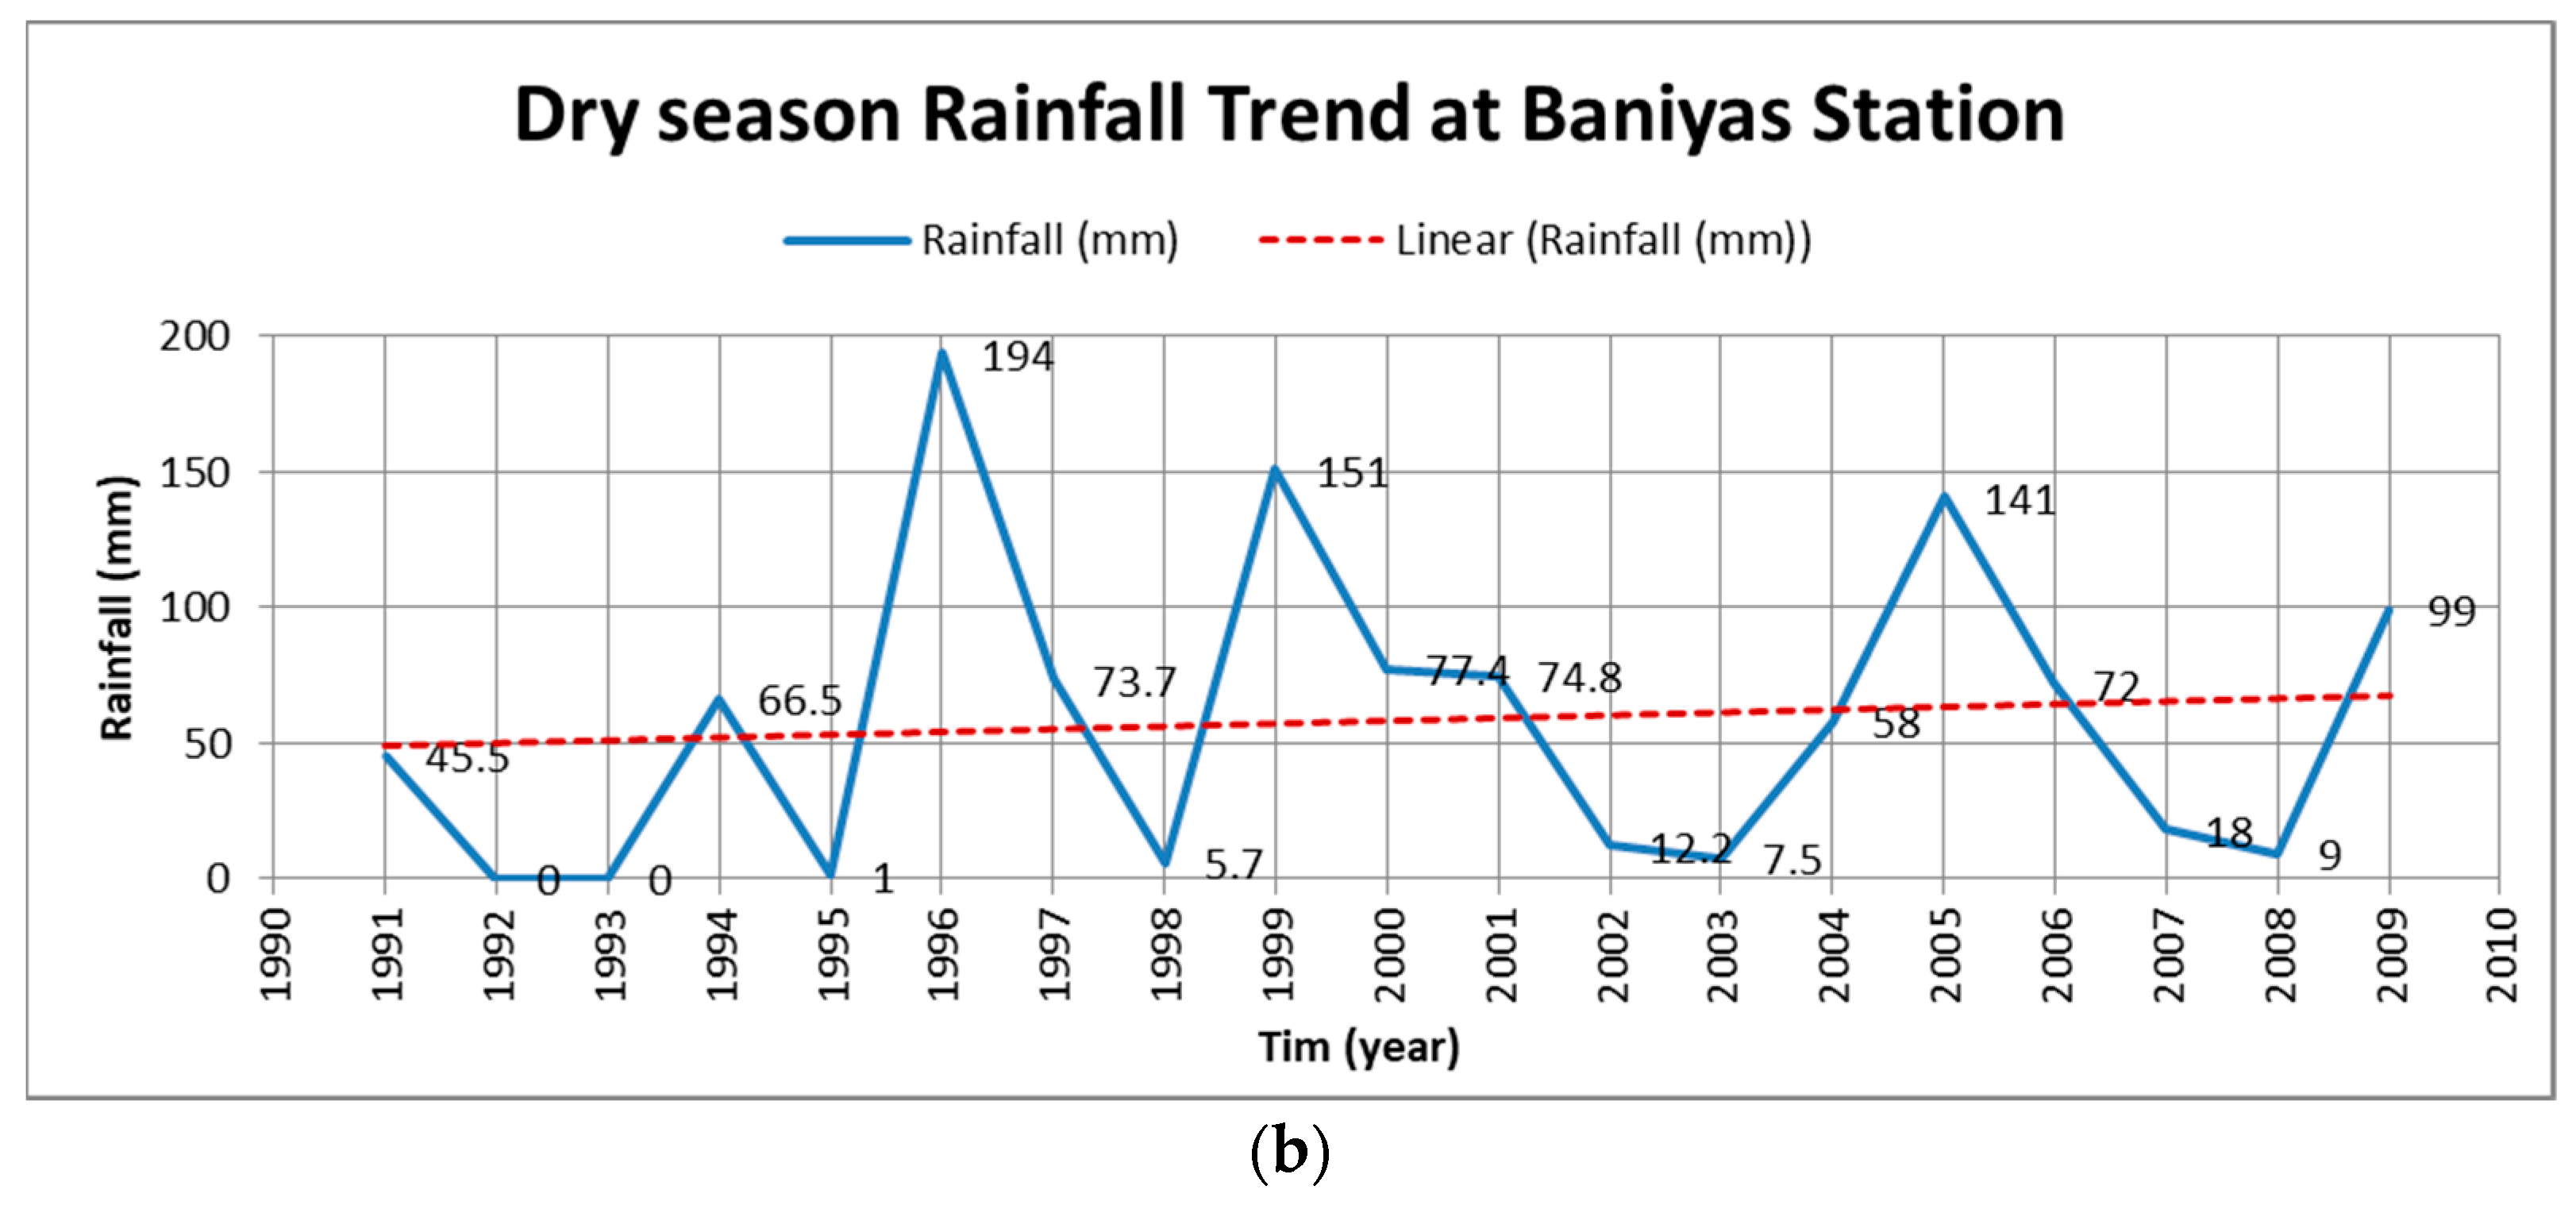
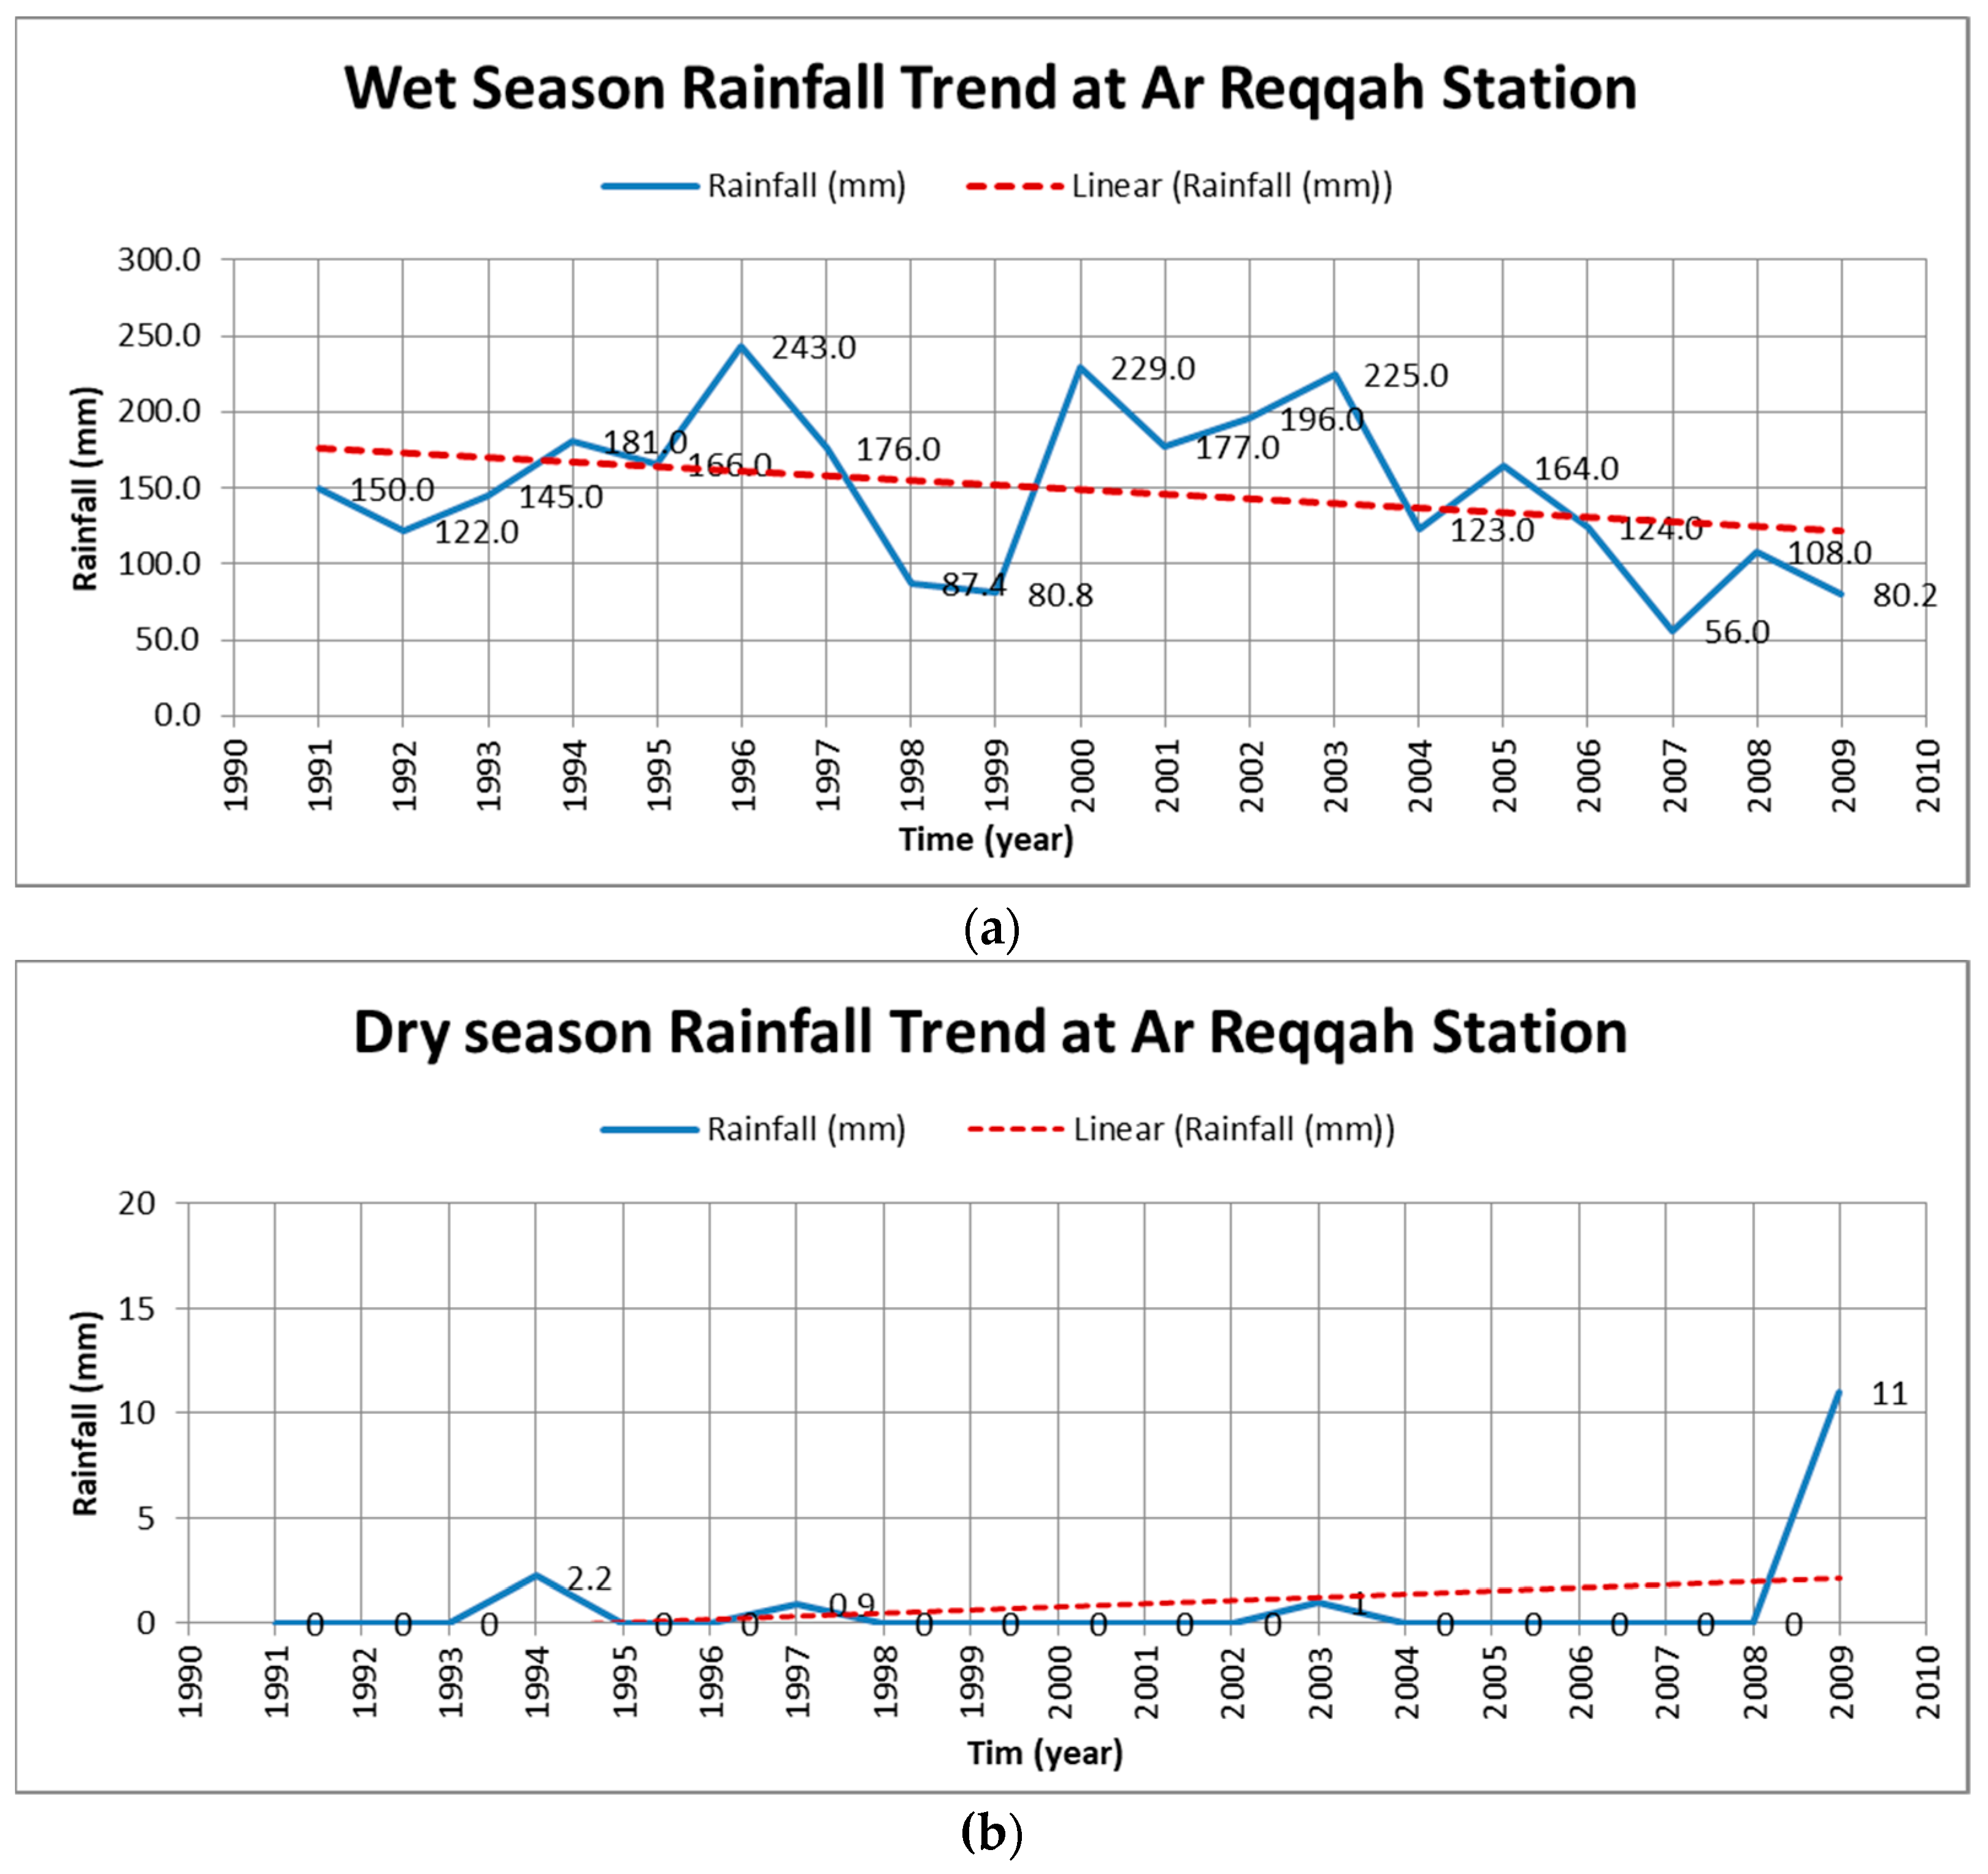
4.3. Stations of Significant Trends
4.4. Evaluation of Rainfall Trends in Syria
5. Conclusions
Author Contributions
Funding
Institutional Review Board Statement
Informed Consent Statement
Data Availability Statement
Acknowledgments
Conflicts of Interest
References
- Karl, T.R. and Trenberth, K.E. Modern global climate change. Science 2003, 302, 1719–1723. [Google Scholar] [CrossRef] [PubMed] [Green Version]
- Bradford, A.; Pappas, S. Effect of Global Warming. 2017. Online. Publisher in: LiveScience.com. Available online: https://www.livescience.com/37057-global-warming-effects.html (accessed on 20 December 2021).
- Kelly, J. The Top 10 Causes of Global Warming. Sciencing.com. Available online: https://sciencing.com/the-top-10-causes-of-global-warming-12512484.html (accessed on 15 January 2022).
- National Academies of Sciences, Engineering, and Medicine. Attribution of Extreme Weather Events in the Context of Climate Change; National Academies of Sciences, Engineering, and Medicine: Washington, DC, USA, 2016. [Google Scholar]
- National Academies of Sciences, Engineering, and Medicine. Climate Change: Evidence and Causes Update 2020; The National Academies Press: Washington, DC, USA. [CrossRef]
- Moss, B.; Kosten, S.; Meerhoff, M.; Battarbee, R.; Mazzeo, N.; Havens, K.; Lacerot, G.; Liu, Z.W.; Meester, D.L.; Paerl, H.; et al. Allied attack: Climate change and eutrophication. Inland Waters 2011, 1, 101–105. [Google Scholar] [CrossRef] [Green Version]
- Masson-Delmotte, V.; Zhai, P.; Pörtner, H.-O.; Roberts, D.; Skea, J.; Shukla, P.R.; Pirani, A.; Moufouma-Okia, W.; Péan, C.; Pidcock, R. Global Warming of 1.5 °C An IPCC Special Report on the Impacts of Global Warming of 1.5 °C above Pre-Industrial Levels and Related Global Greenhouse Gas Emission Pathways, in the Context of Strengthening the Global Response to the Threat of Climate Change; Intergovernmental Panel on Climate Change: Geneva, Switzerland, 2018. [Google Scholar]
- Abouelfadl, S. Global Warming—Causes, Effects and Solution’s Trials. J. Eng. Sci. Assiut Univ. 2012, 40, 1233–1254. [Google Scholar] [CrossRef]
- Houghton, J.T.; Ding, Y.; Griggs, D.J.; Noguer, M.; Van der Linden, P.J.; Dai, X.; Maskell, K.; Johnson, C.A. Climate Change: The Scientific Basis; Cambridge University Press: Cambridge, UK, 2001. [Google Scholar]
- IPCC. Ch. Summary for Policymakers. Online. 2018. Available online: https://www.ipcc.ch/sr15/chapter/spm/ (accessed on 20 January 2022).
- Doyle, A. Global Warming May Be more Severe than Expected by 2100: Study. Online. Publisher: Discover Thomson REUTERS. 6 December 2017. Environment. Available online: https://www.reuters.com/article/us-climatechange-temperatures/global-warming-may-be-more-severe-than-expected-by-2100-study-idUSKBN1E02J6 (accessed on 1 February 2022).
- Arheimer, B.; Andreasson, J.; Fogelberg, S.; Johnsson HPers, C.B.; Persson, K. Climate change impact on water quality: Model results from southern Sweden. Ambio 2005, 34, 559–566. [Google Scholar] [CrossRef]
- Dai, A.; Trenberth, K.E. Estimates of freshwater discharge from continents: Latitudinal and seasonal variations. J. Hydrometeorol. 2002, 3, 660–687. [Google Scholar] [CrossRef] [Green Version]
- United States Environmental Protection Agency (EPA), Future of Climate Change. 2013. Available online: https://19january2017snapshot.epa.gov/climate-change-science/future-climate-change_.html (accessed on 5 February 2022).
- Hassan, H.; Aramaki, T.; Hanaki, K.; Matsuo, T.; Wilby, R.L. Lake stratification and temperature profiles simulated using downscaled GCM output. J. Water Sci. Technol. 1998, 38, 217–226. [Google Scholar] [CrossRef]
- Altõnbilek, D. Development and management of the Euphrates-Tigris basin. Int. J. Water Resour. Dev. 2004, 20, 15–33. [Google Scholar] [CrossRef]
- Whitehead, P.G.; Wilby, R.L.; Battarbee, R.W. A review of the potential impacts of climate change on surface water quality. Hydrol. Sci. J. 2009, 54, 101–123. [Google Scholar] [CrossRef]
- Adam, J.C.; Lettenmaier, D.P. Adjustment of global gridded precipitation for systematic bias. J. Geophys. Res. 2003, 108, 4257. [Google Scholar] [CrossRef]
- Panagoulia, D.P. Assessment of daily catchment precipitation in mountainous regions for climate change interpretation. Hydrol. Sci. J. 1995, 40, 331–350. [Google Scholar] [CrossRef]
- Haylock, M.R.; Peterson, T.C.; Alves, L.M.; Ambrizzi, T.; Anunciação, Y.M.T.; Baez, J.; Barros, V.R.; Berlato, M.A.; Bidegain, M.; Coronel, G.; et al. Trends in total and extreme South American rainfall in 1960-2000 and links with sea surface temperature. J. Clim. 2006, 19, 1490–1512. [Google Scholar] [CrossRef]
- Endo, N.; Matsumoto, J.; Lwin, T. Trends in precipitation extremes over Southeast Asia. SOLA 2009, 5, 168–171. [Google Scholar] [CrossRef] [Green Version]
- Alahacoon, N.; Edirisinghe, M. Spatial variability of rainfall trends in Sri Lanka from 1989 to 2019 as an indication of climate change. ISPRS Int. J. Geo-Inf. 2021, 10, 84. [Google Scholar] [CrossRef]
- Sabattini, J.A.; Rafael, A.S. Rainfall Trends in Humid Temperate Climate in South America: Possible Effects in Ecosystems of Espinal Ecoregion. In Book Chapter in The Nature, Causes, Effects and Mitigation of Climate Change on the Environmen; Stuart, A.H., Ed.; IntechOpen: London, UK, 2021. [Google Scholar] [CrossRef]
- Alahacoon, N.; Edirisinghe, M.; Simwanda, M.; Perera, E.; Nyirenda, V.R.; Ranagalage, M. Rainfall Variability and Trends over the African Continent Using TAMSAT Data (1983–2020): Towards Climate Change Resilience and Adaptation. Remote Sens. 2022, 14, 96. [Google Scholar] [CrossRef]
- Burdon, D.J.; Safadi, C. Ras El-Ain: The Great Karst Spring of Mesopotamia: A Hydrogeological Study. J. Hydrol. 1963, 1, 58–95. [Google Scholar] [CrossRef]
- Braemer, F.; Genequand, D.; Dumond Maridat, C.; Blanc, P.M.; Dentzer, J.M.; Gazagne, D.; Wech, P. World Archaeology. Archaeol. Water 2009, 41, 36–57. [Google Scholar]
- Shaaban, A. Indicators and Aspects of Hydrological Drought in Lebanon. Water Resour. Manag. 2009, 23, 1875–1891. [Google Scholar] [CrossRef]
- Kattan, Z. Environmental isotope study of the major karst springs in Damascus limestone aquifer systems: Case of the Figeh and Barada springs. J. Hydrol. 1997, 193, 161–182. [Google Scholar] [CrossRef]
- Khaldoon, A.; Mourad; Berndtsson, R. Water Status in the Syrian Water Basins. Open J. Mod. Hydrol. 2012, 2, 15–20. [Google Scholar]
- Zeleňáková, M.; Alkhalaf, I.; Purcz, P.; Blišťan, P.; Pelikán, P.; Portela, M.; Silva, A. Trends of rainfall as a support for integrated water resources management in Syria. Desalin. Water Treat. 2017, 86, 285–296. [Google Scholar] [CrossRef] [Green Version]
- Nations Online Countries of the World. Available online: https://www.nationsonline.org/oneworld/press_freedom.htm (accessed on 20 March 2022).
- Almazouri, M. Calibration of TRMM rainfall climatology over Saudi Arabia during 1998-2009. Atmos. Res. 2011, 99, 400–414. [Google Scholar] [CrossRef]
- Almazroui, M.; Islam, N.; Jones, P.; Athar, H.; Rahman, M.A. Recent climate change in the Arabian Peninsula: Seasonal rainfall and temperature climatology of Saudi Arabia for 1979–2009. Atmos. Res. 2012, 111, 29–45. [Google Scholar] [CrossRef]
- Alkolibi, F.M. Possible effects of global warming on agriculture and water resources in Saudi Arabia: Impacts and responses. Clim. Change 2002, 54, 225–245. [Google Scholar] [CrossRef]
- FAO. Asi-Orontes Basin. Available online: http://www.fao.org/nr/water/aquastat/basins/asi-orontes/index.stm (accessed on 25 February 2022).
- Zeleňáková, M.; Purcz, P.; Blišťan, P.; Alkhalaf, I.; Hlavatá, H.; Portela, M.M.; Silva, A.T. Precipitation trends detection as a tool for integrated water resources management in Slovakia. Desalin. Water Treat. 2017, 99, 83–90. [Google Scholar] [CrossRef]
- Alkhalaf, I.; Zeleňáková, M. Water management-Modelling and mapping of rainwater. In Colloquium on Landscape Management 2014; Mendelova Univerzita V Brně: Brn, Czech Republic, 2014; pp. 11–15. [Google Scholar]
- Khaldoon, A.M.; Berndtsson, R. Syrian Water Resources between the Present and the Future. Air Soil Water Res. 2011, 4, 93–100. [Google Scholar]
- Franzke, C.A. Novel method to test for significant trends in extreme values in serially dependent time series. Geophys. Res. Lett. 2013, 40, 1391–1395. [Google Scholar] [CrossRef] [Green Version]
- Sen, P.K. Estimates of the regression coefficient based on Kendall’s tau. J. Am. Stat. Assoc. 1968, 63, 1379–1389. [Google Scholar] [CrossRef]
- Hamed, K.H. Trend detection in hydrologic data: The Mann-Kendall trend test under the scaling hypothesis. J. Hydrol. 2008, 349, 350–363. [Google Scholar] [CrossRef]
- McKee, T.B.; Doesken, N.J.; Kleist, J. The Relationship of Drought Frequency and Duration of Time Scales. In Proceedings of the Eighth Conference on Applied Climatology. American Meteorological Society, Anaheim, CA, USA, 17–23 January 1993; pp. 179–186. [Google Scholar]
- Mann, H.B. Non-parametric tests against trend. Econometrica 1945, 13, 245–259. [Google Scholar] [CrossRef]
- Kendall, M.G. Rank Correlation Measures; Charles Griffin and Co., Ltd.: London, UK, 1975. [Google Scholar]
- Clark, I. Practical Geostatistics; Applied Science Publishers Ltd.: London, UK, 1979. [Google Scholar]
- IPCC. Fifth Assessment Report. Available online: https://www.ipcc.ch/assessment-report/ar5/2014 (accessed on 25 April 2022).


| Period | |||
|---|---|---|---|
| Station | September–November | Station | September–November |
| Khan Shaykhun | 0.1552 | −0.0520 | −0.2973 |
| Al Quaryatayn | 0.0000 | 0.0020 | −0.0100 |
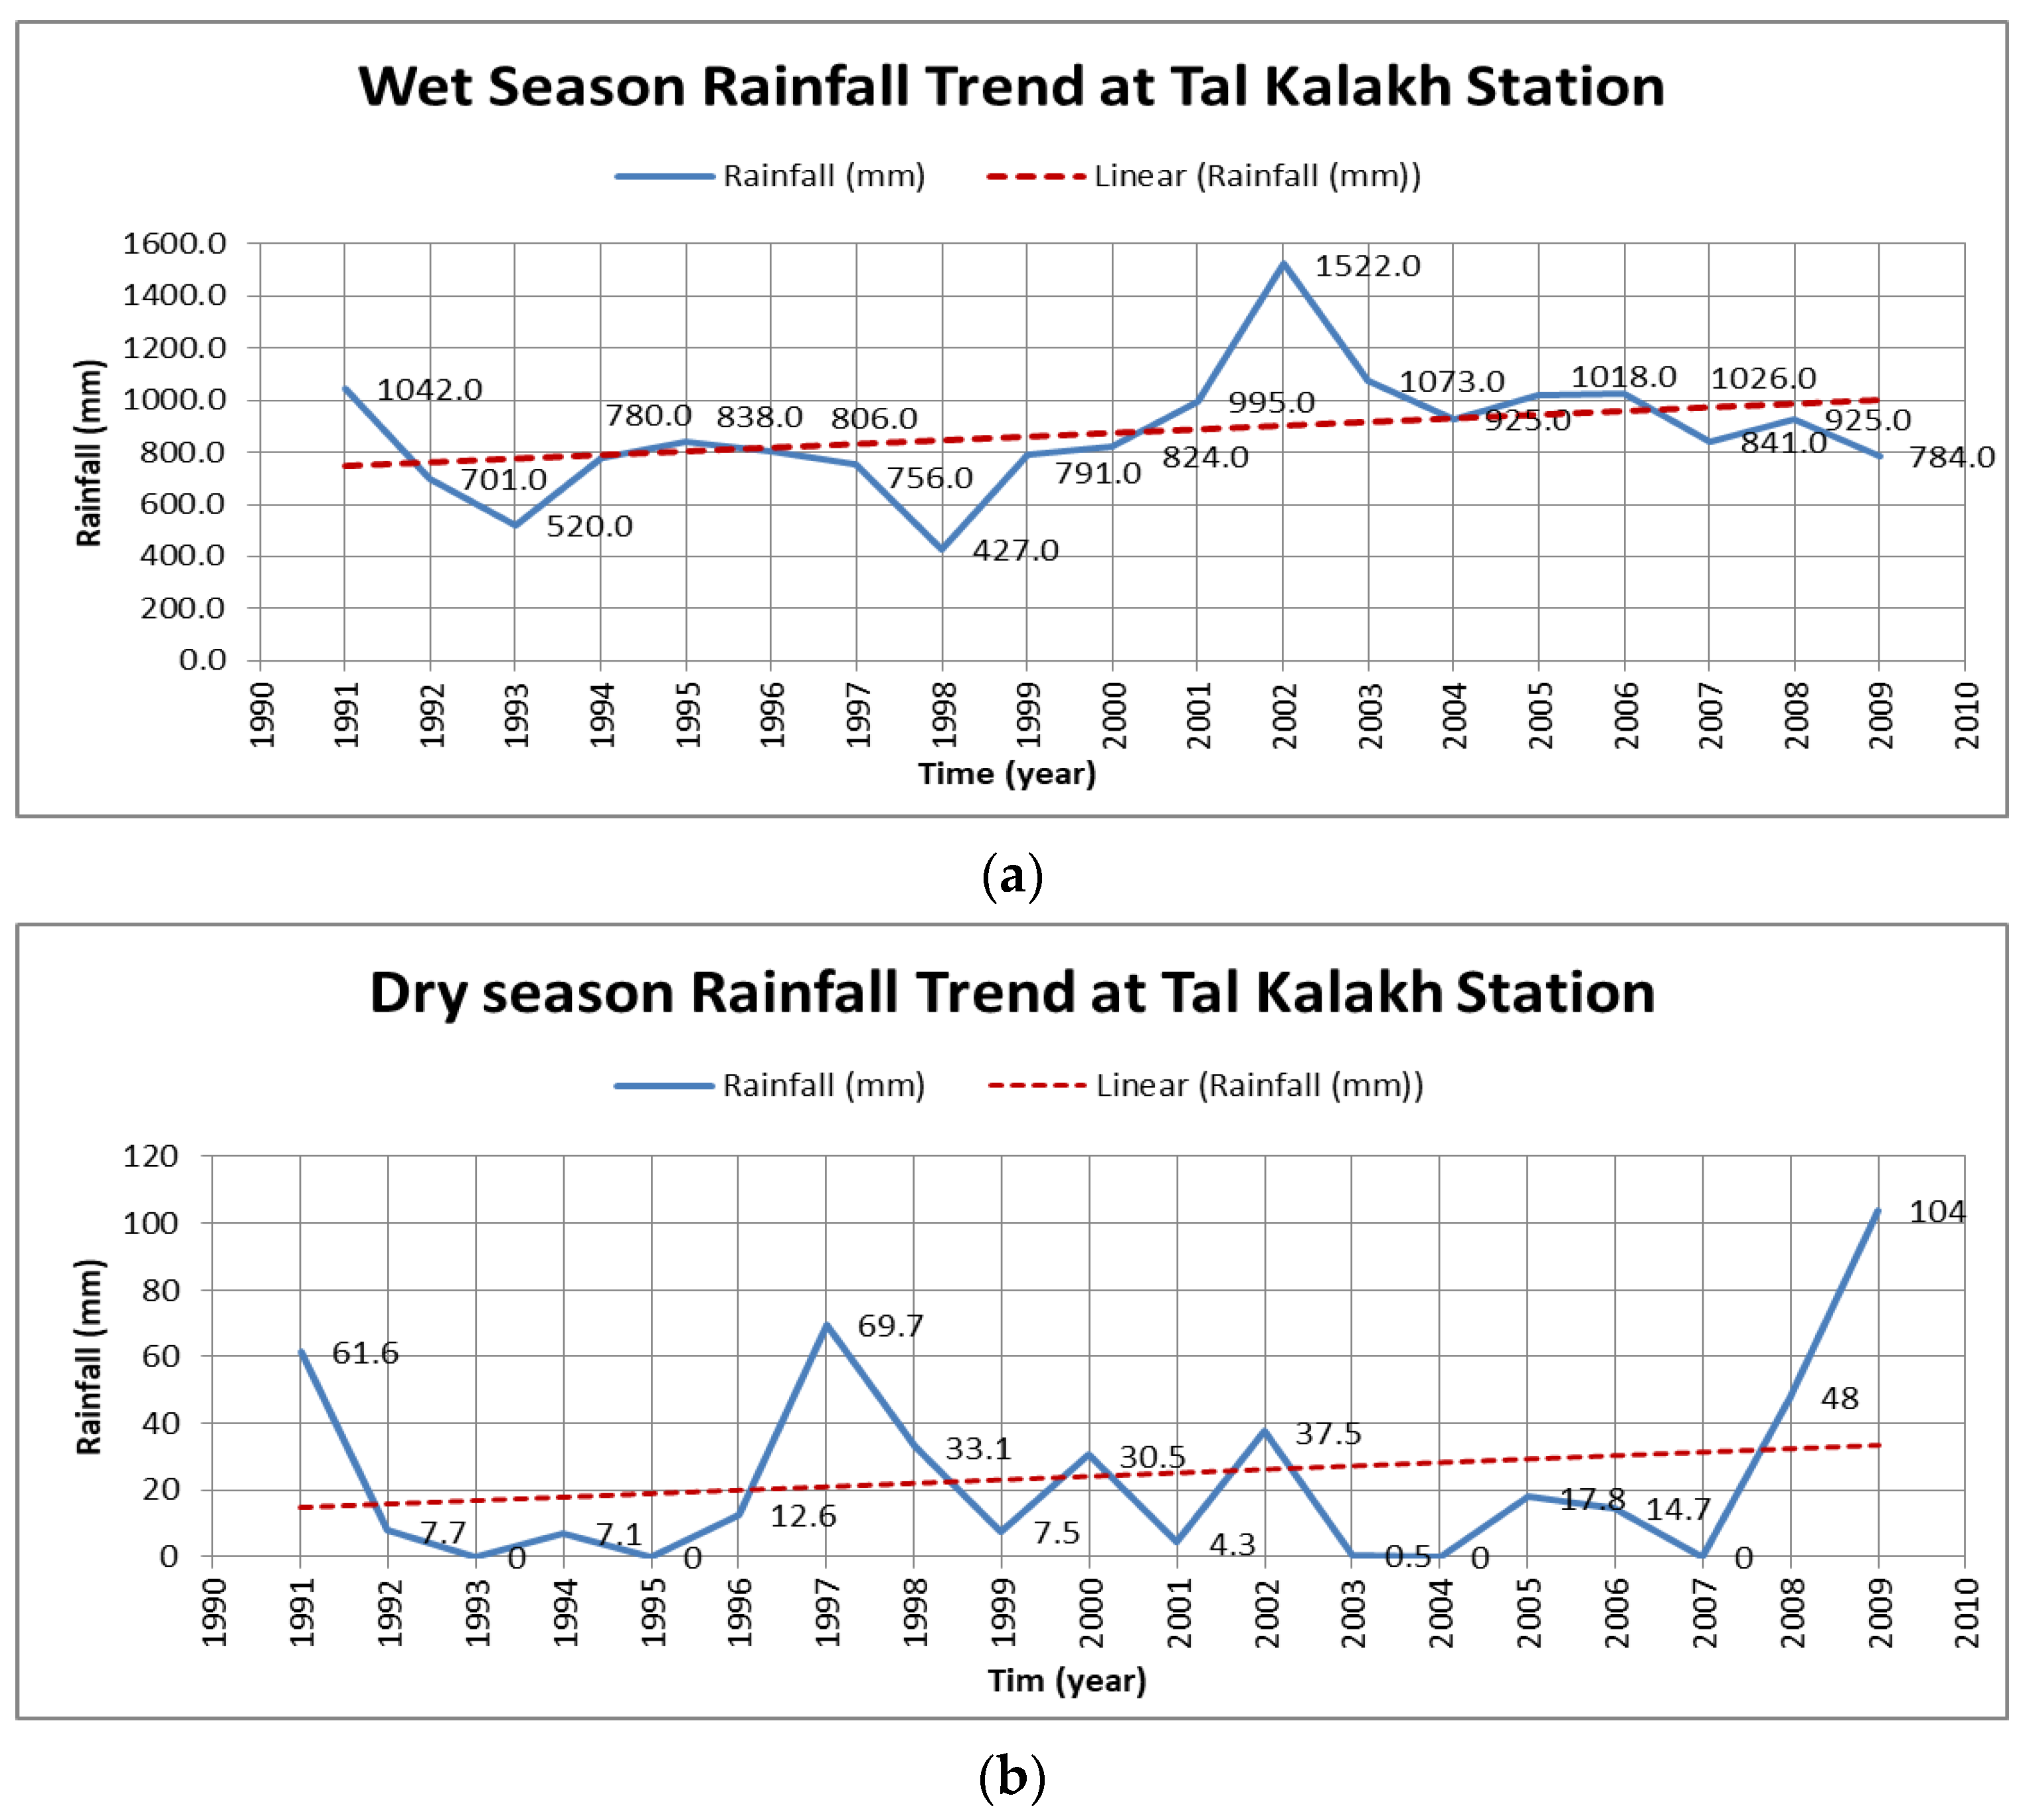
| Tal Kalakh | 0.7228 | 1.0171 | −0.1481 |
| Al Nabk | −0.1667 | 0.0000 | −0.0500 |
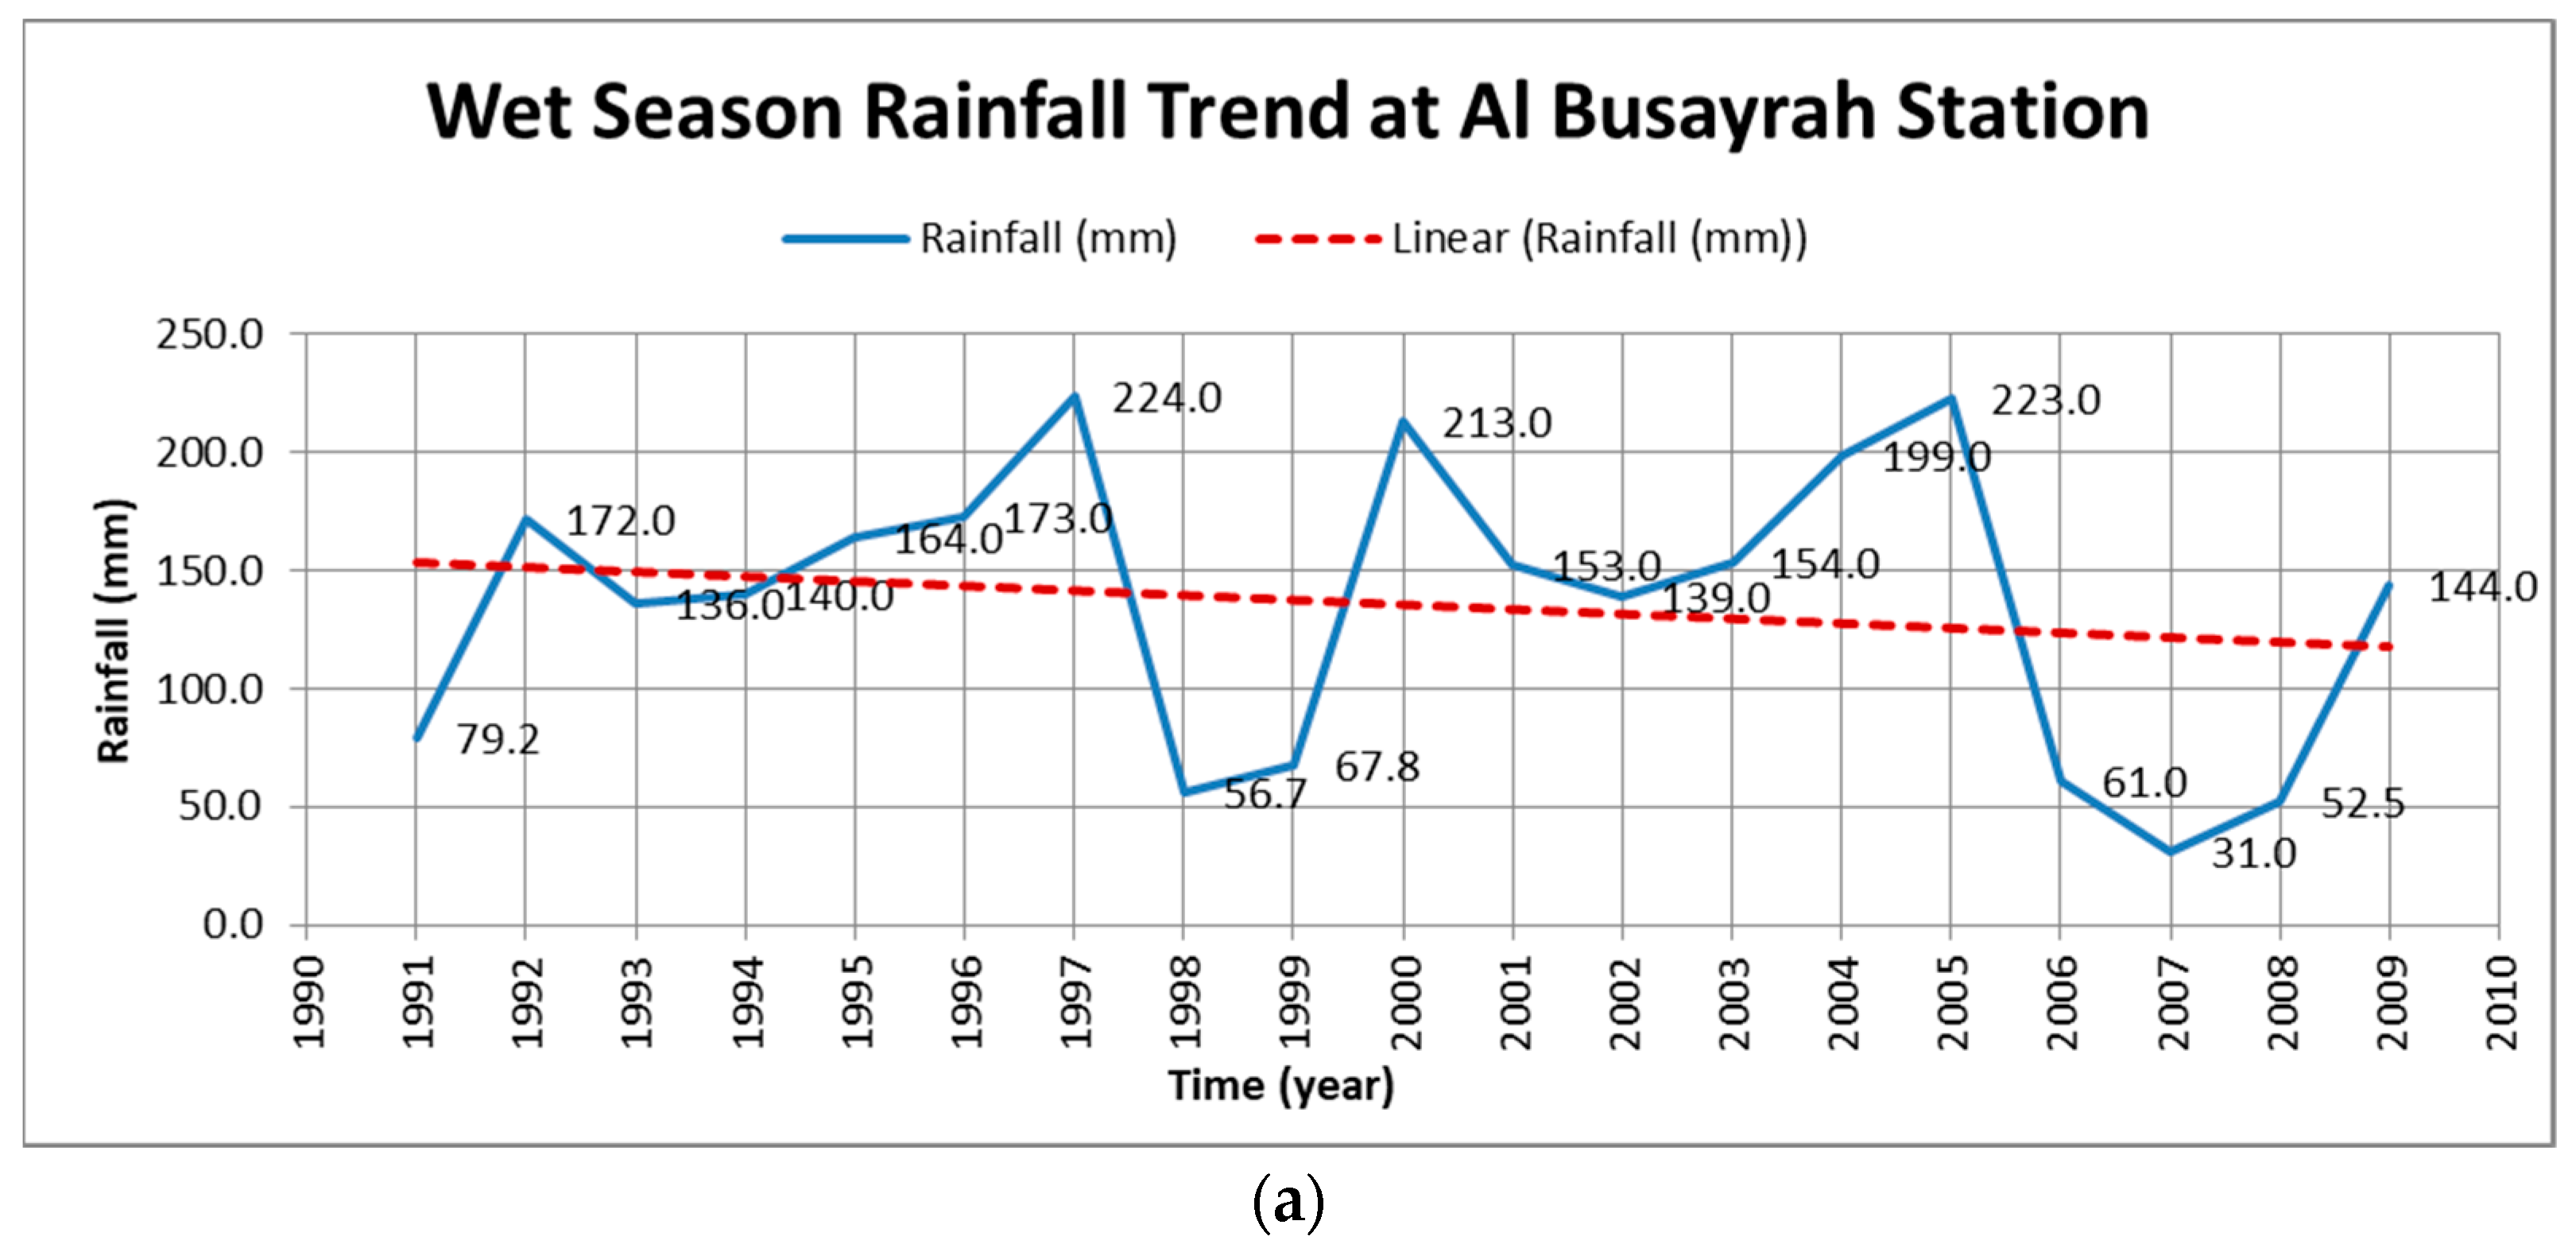
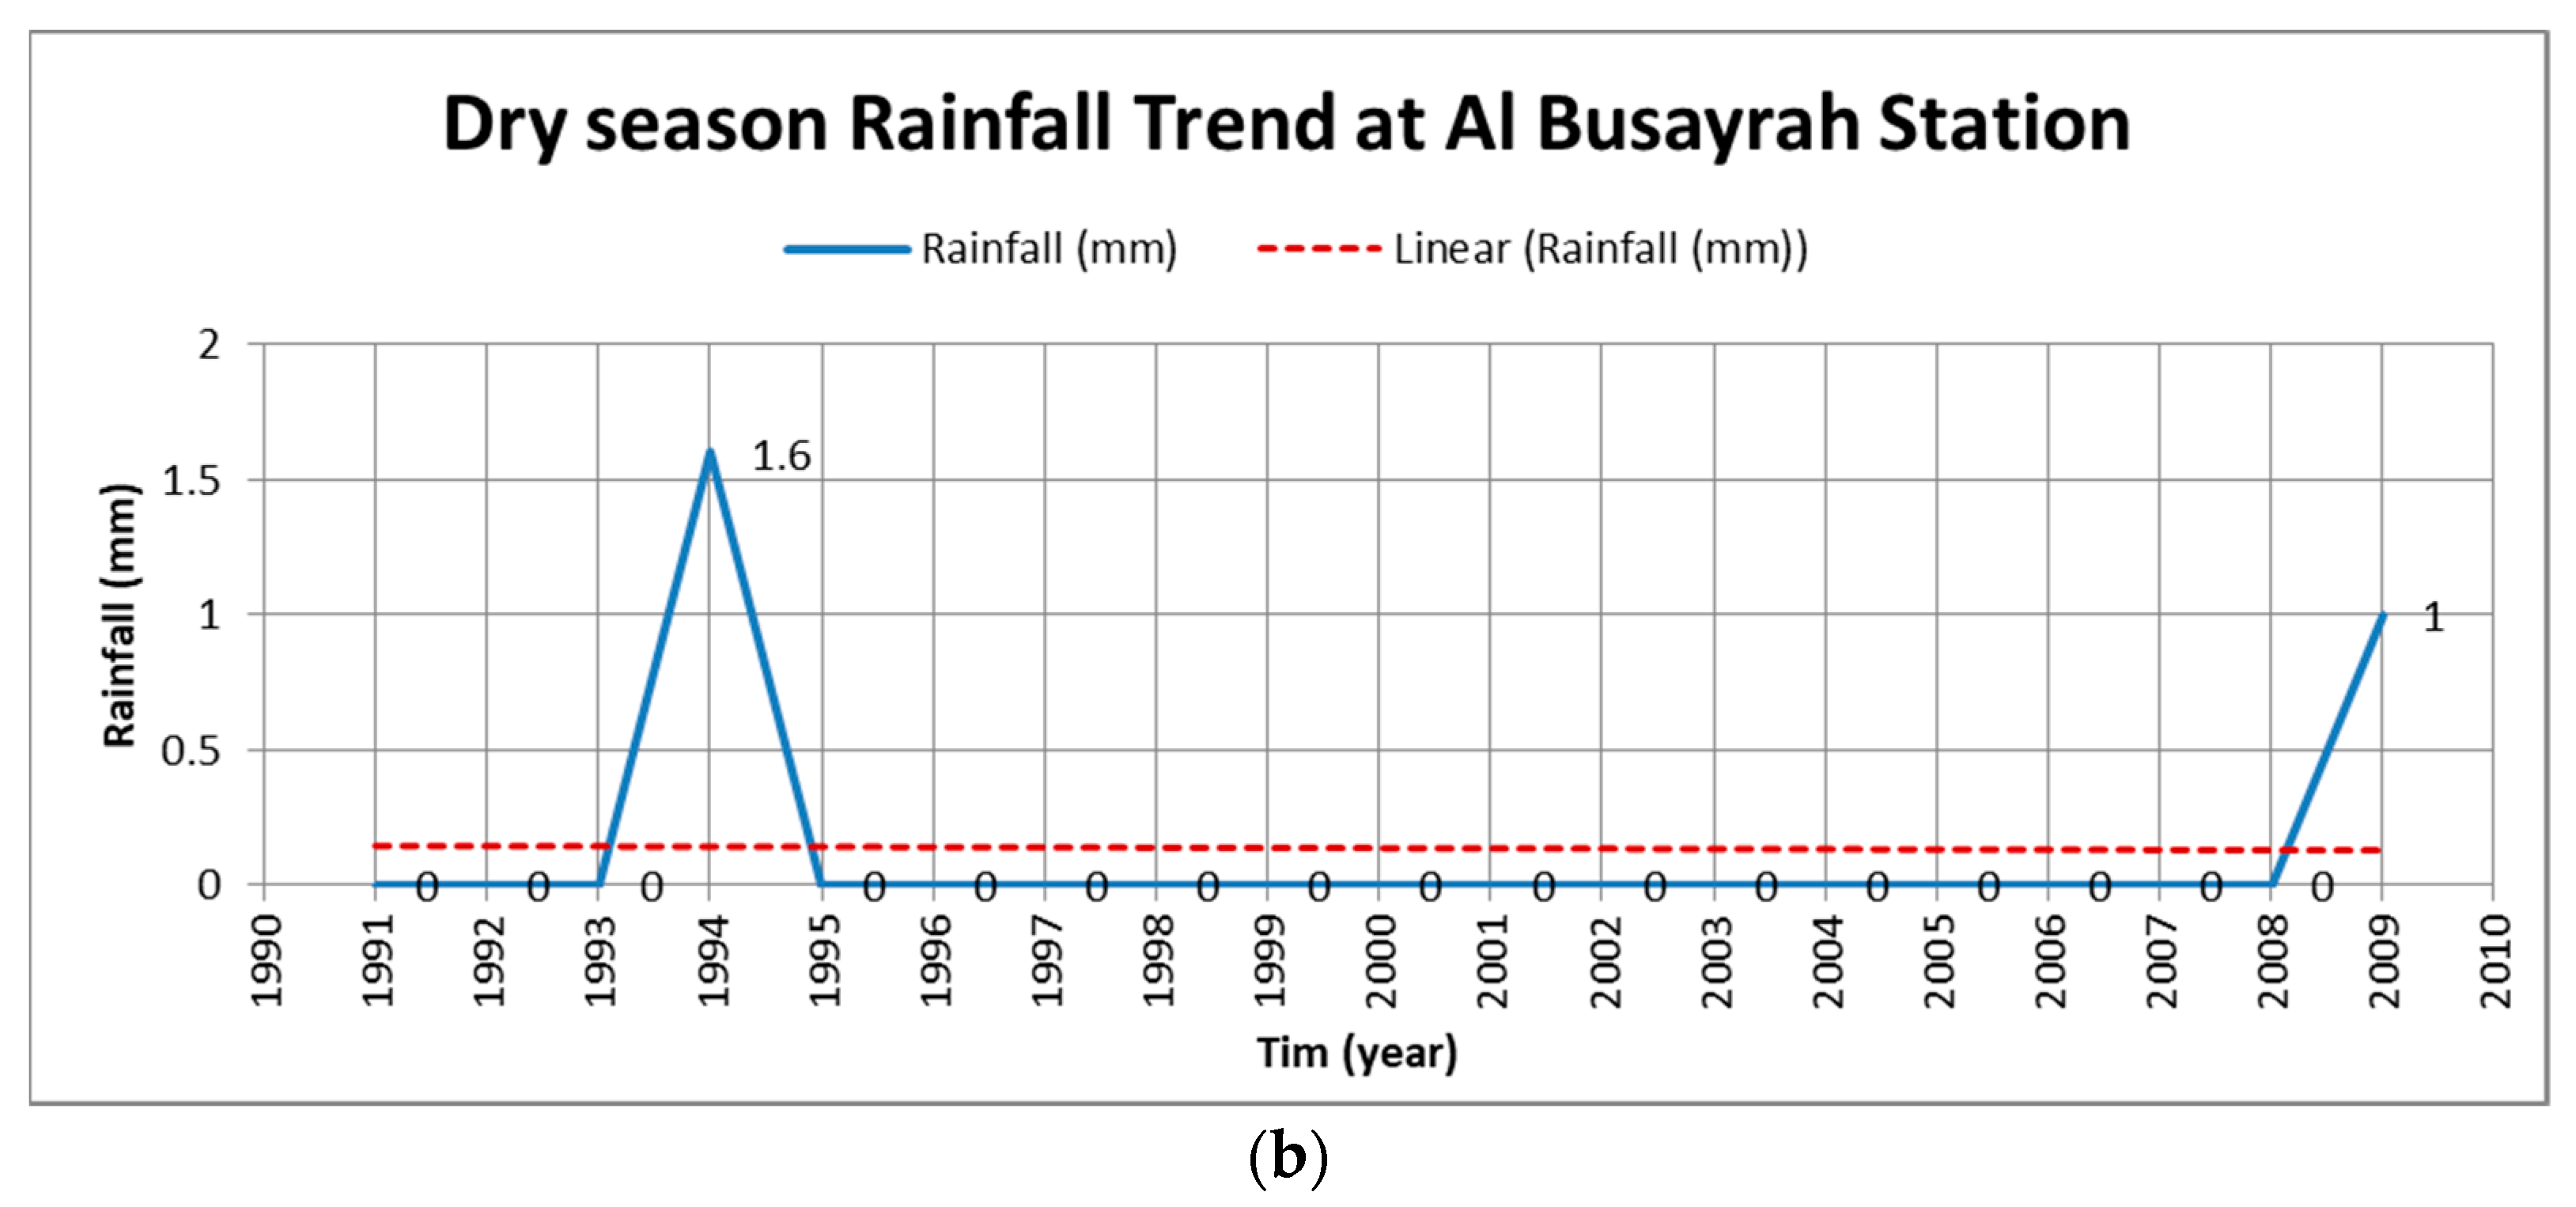
| Al Busayrah | 0.0000 | −0.1600 | −0.0950 |
| Al Tebni | 0.0029 | −0.0385 | −0.0780 |
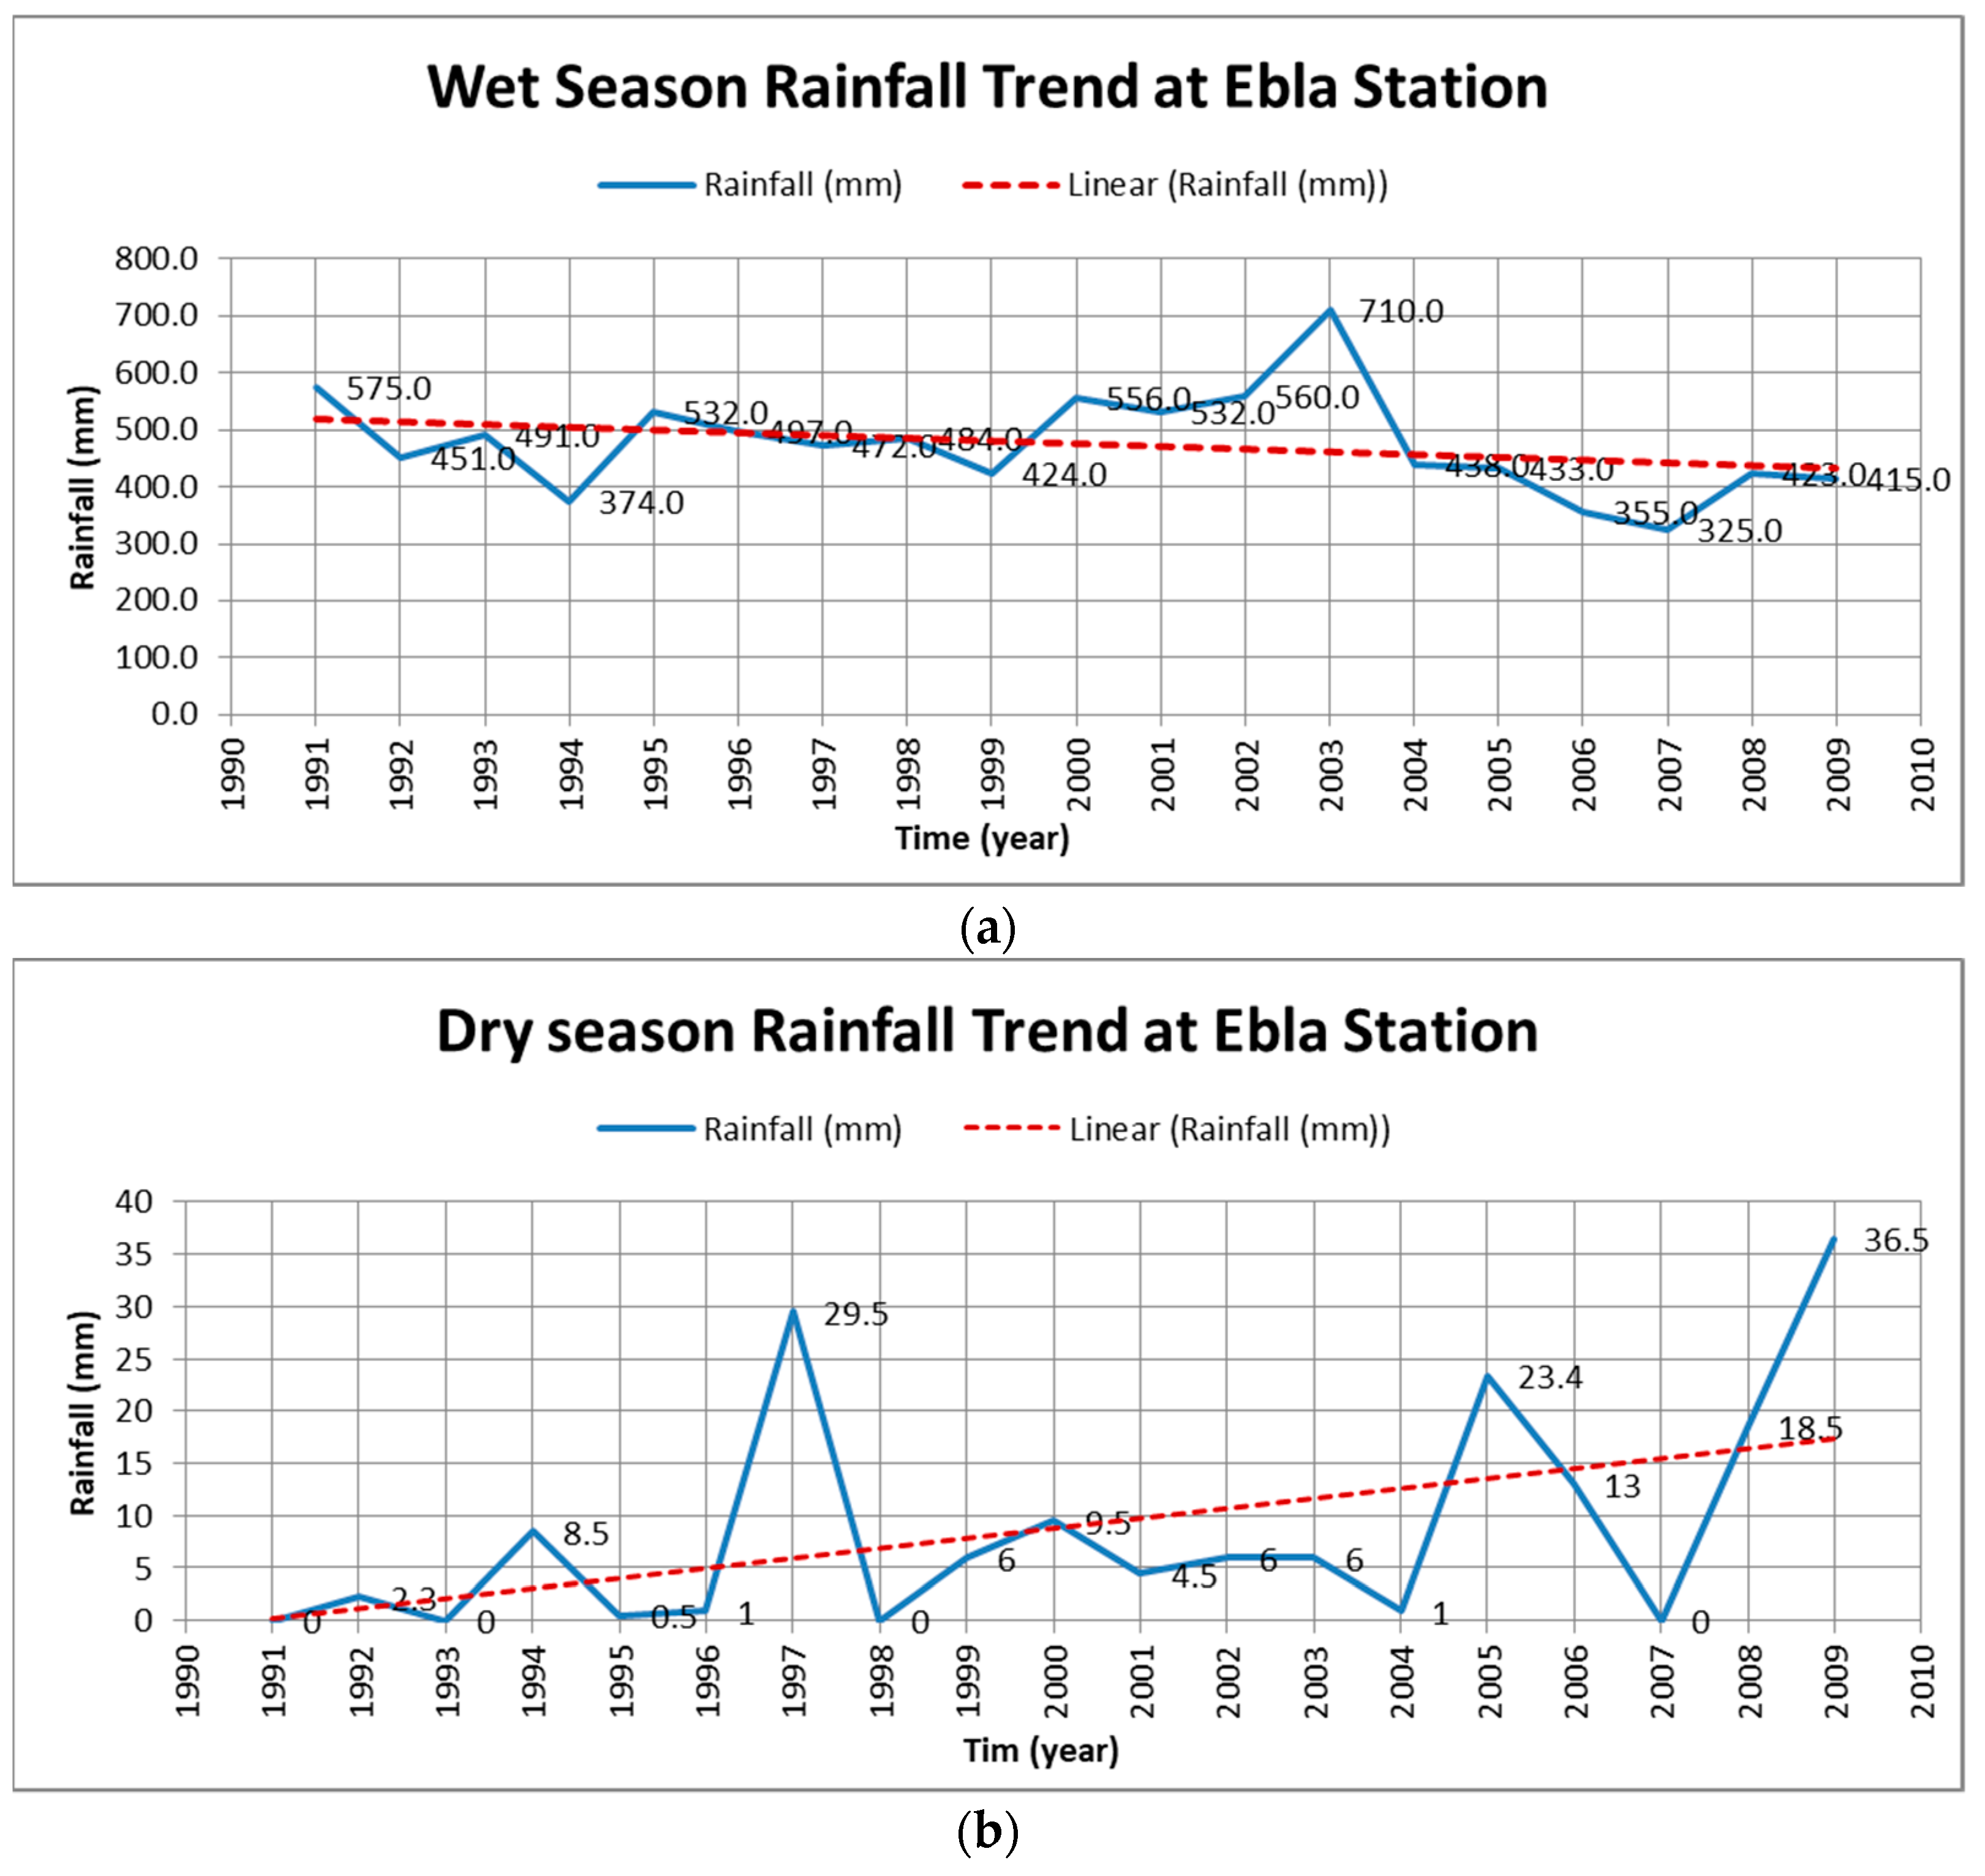
| Ebla | 0.1460 | 0.0759 | −0.3556 |
| Al Qadmus | 0.8182 | −0.2553 | −0.7353 |
| Baniyas | 0.4545 | −0.3263 | −0.2192 |
| Ar Reqqah | 0.0000 | −0.2613 | −0.1120 |
| Ain Issa | 0.0000 | −0.3143 | −0.0308 |
Publisher’s Note: MDPI stays neutral with regard to jurisdictional claims in published maps and institutional affiliations. |
© 2022 by the authors. Licensee MDPI, Basel, Switzerland. This article is an open access article distributed under the terms and conditions of the Creative Commons Attribution (CC BY) license (https://creativecommons.org/licenses/by/4.0/).
Share and Cite
Zeleňáková, M.; Abd-Elhamid, H.F.; Krajníková, K.; Smetanková, J.; Purcz, P.; Alkhalaf, I. Spatial and Temporal Variability of Rainfall Trends in Response to Climate Change—A Case Study: Syria. Water 2022, 14, 1670. https://0-doi-org.brum.beds.ac.uk/10.3390/w14101670
Zeleňáková M, Abd-Elhamid HF, Krajníková K, Smetanková J, Purcz P, Alkhalaf I. Spatial and Temporal Variability of Rainfall Trends in Response to Climate Change—A Case Study: Syria. Water. 2022; 14(10):1670. https://0-doi-org.brum.beds.ac.uk/10.3390/w14101670
Chicago/Turabian StyleZeleňáková, Martina, Hany F. Abd-Elhamid, Katarína Krajníková, Jana Smetanková, Pavol Purcz, and Ibrahim Alkhalaf. 2022. "Spatial and Temporal Variability of Rainfall Trends in Response to Climate Change—A Case Study: Syria" Water 14, no. 10: 1670. https://0-doi-org.brum.beds.ac.uk/10.3390/w14101670