Article

Peatlands as Filters for Polluted Mine Water?—A Case Study from an Uranium-Contaminated Karst System in South Africa—Part III: Quantifying the Hydraulic Filter Component

North-West University, School of Environmental Sciences and Development, Private Bag X6001, Potchefstroom, 2520, South Africa
Submission received: 12 February 2011 / Accepted: 10 March 2011 / Published: 15 March 2011

Abstract

:
As Part III of a four-part series on the filter function of peat for uranium (U), this paper focuses on the hydraulic component of a conceptual filter model introduced in Part II. This includes the quantification of water flow through the wetland as a whole, which was largely unknown and found to be significantly higher that anticipated. Apart from subaquatic artesian springs associated with the underlying karst aquifer the higher flow volumes were also caused by plumes of polluted groundwater moving laterally into the wetland. Real-time, quasi-continuous in situ measurements of porewater in peat and non-peat sediments indicate that rising stream levels (e.g., during flood conditions) lead to the infiltration of stream water into adjacent peat deposits and thus allow for a certain proportion of flood water to be filtered. However, changes in porewater quality triggered by spring rains may promote the remobilization of possibly sorbed U.

1. Introduction

Peat has frequently been reported to act as an efficient filter for dissolved heavy metals including radioactive uranium. In the study area, a significant peat deposit occurs downstream of a large karst spring that feeds into the water supply system of the municipality of Potchefstroom. Situated below a gold mining area, the peatland may have the potential to act as a buffer against mining-related impacts on the downstream municipal water supply. Owing to the ongoing excavation of peat, however, such buffer function may be threatened. To investigate the impacts associated with the mining of peat the Department of Water Affairs (DWA) commissioned this study. A focal point of the investigations was the question if and to what degree the remaining (i.e., unmined) peat may act as a filter for uranium (U) as the main contaminant of concern emanating from upstream mining activities. Apart from assessing current conditions, this also includes possible future post-mining scenarios in which large volumes of highly polluted, acidic mine water may flow into the peatland [1]. Based on a literature review, a conceptual model on the U filter function of peat was developed that consists of a chemical component characterizing the mechanisms responsible for the attenuation and release of U in and from peat as well as a hydraulic component that addresses the rate and mode of contact between (polluted) water and the peat. In order to verify to what extent the general assumptions made in this model are applicable to local conditions several site-specific investigations were designed [2]. This part of the paper series focuses on the hydraulic component of the filter model.
In a first step, an attempt is made to quantify the total water flow through the wetland since no reliable flow data existed prior to this study. This is followed by an analysis of quasi-continuous monitoring data of the in situ dynamic of peat porewater that is aimed at investigating how far polluted stream water may flow through the peat as a prerequisite for any filter function to take place. In addition to undisturbed peat deposits this is also investigated for non-peat, alluvial sediment that may also act as sorbent for U.

2. Water Flow through the Wetland

As a major tributary of the upper Mooi River, and as the only source of drinking water for the downstream municipality of Potchefstroom, the Gerhard Minnebron (GMB) wetland is an important part of the regional river system that contributes substantially to the inflow into Boskop Dam, the main water reservoir of Potchefstroom. Fed by dolomitic spring water that emerges from the Boskop-Turffontein compartment (BTC), the wetland is also part of a vast underground karst network that extents well into the upstream catchment of the Wonderfonteinspruit (WFS) where decade-old deep-level gold mining is responsible for ongoing U pollution of surface and groundwater [2]. Since 1964, most of the water discharged from the eye is diverted into an irrigation canal and bypasses the wetland on its way back into the upper Mooi River and the Boskop Dam further downstream. This diversion around the wetland was motivated by the DWA to prevent water loss to the karstic underground and enhanced evapotranspiration in the wetland [3]. Unfortunately, when the study commenced, no reliable gauging records of the actual contribution of the wetland to the upper Mooi River systems existed. In order to arrive at a first order estimate, available flow data from nearby DWA-gauging stations were compiled and statistically evaluated. With recording periods of the different stations ranging from over 100 years at C2H001 (Mooi River at Witrand below Boskop Dam as longest continuous serving gauging station in South Africa) to less than 10 years and frequently large recording gaps, it was not possible to directly compare annual averages from the different stations with each other. Comparing flow data from different time periods was particularly difficult as major changes of the hydrological system had occurred over the years. These include the construction of two large dams (Klerkskraal and Boskop Dams), the large-scale dewatering of four dolomitic compartments and the associated increase in stream flow through pumped groundwater as well as the redistribution of water within the system by numerous newly installed pipelines and irrigation canals. In order to ensure comparability of the different gauging records, only those reflecting an identical time period were selected. For the 11 relevant (and operational) gauging stations, this criterion was met only for an 18 year-period (1971 to 1988) out of a total of 107 years of observation [4] (Table 1).
Table 1. Average flow rates [ML/d] of selected gauging stations in and around the Gerhard Minnebron wetland covering the period 1971–1988 (data: [5]).
DWAF stations:
1971–1988 (18a)
Jan.Feb.Mar.Apr.May.Jun.Jul.Aug.Sep.Oct.Nov.Dec.Mean annual flow rate
C2H001152227222202151150151124110113102101150
C2H011101012111311101211911911
C2H01320212020202019202020202020
C2H06954464545404545403739435744
C2H09260605762576161596161576260
C2H11373747475687071738279767574
C2H09415151515151516151515151515
C2H11152494042404746525952424948
C2H1121221131049911495112125120126109118113
C2H110179165152146157146163178185183167170166
Adding up all gauged water sources flowing into Boskop Dam results in an average inflow over the selected 18-year period of 126 ML/d. Comparing this to the total (gauged) outflow from the dam (including calculated evaporation losses over the whole dam area) totaling 257 ML/d results in a shortfall of inflow of 131 ML/d, i.e., for approximately half of the outflow from Boskop Dam (51%) it is not clear where the water is actually originating from (Figure 1).
The few minor, non-perennial tributaries of the upper Mooi River were not considered as their flow is unlikely to account for a significant portion of the observed difference.
In order to spatially improve the resolution of flow data, snap shot measurements of the flow situation in and around the wetland were taken on two occasions during the dry winter period (13 June and 1 August 2007). The flow was measured employing different methods including tracer dilution, Doppler and propeller-based flow meters and also aimed at verifying earlier cork-method-based estimates of the preliminary survey [6,7]. While at some sites deviations between the different methods were considerable, this did not change the overall finding that significantly more water flows into Boskop dam than suggested by the gauging records. Of particular importance is the fact that the GMB wetland delivers much more water than previously anticipated. Even though, at the day of measurement, 80% of a total spring flow (84 ML/d) was diverted around the wetland (leaving 19 ML/d flowing through the wetland), an estimated 111 ML/d were found flowing out of the wetland into the Mooi River. Subtracting the 19 ML/d that originate from the eye results in approximately 92 ML/d contributed by the wetland downstream of the eye. Due to the inherent inaccuracy of flow measurements in natural streams and the methodological differences as well possible fluctuations in flow, the second measurement (using the Doppler technology) indicated a somewhat lower flow rate of 60 ML/d. Taking into account that the Doppler method tends to underestimate the true flow rate, as found when the different methods were calibrated in a canal [7], the actual difference in flow is probably less than the 32 ML/d and more in the region of around 20 ML/d (i.e., a 22% overestimation by the propeller-based measurement). In making an allowance for this margin of error, the two flow snapshots indicate that the wetland downstream of the eye is not the sink for water it was assumed to be by the authorities, but in fact, generates as much water, or more, than the eye. However, it was still unclear where exactly the additional water downstream of the eye was coming from. In order to identify possible inflow areas a detailed survey of the wetland was thus undertaken.
Figure 1. Tentative water balance for the Boskop Dam based on existing gauging data from the Department for Water Affairs [5].
Water 03 00356 g001
Based on field observation as well as maps, aerial photographs and recent satellite imagery of the wetland a permanent influx of unaccounted surface water could be ruled out. However, a high-resolution GIS analysis suggested that during flood conditions in the upstream river system, a depression in the micro relief may allow for flood water from the upper Mooi River and the Du Toit Spruit to enter the wetland (Figure 2).
Figure 2. Digital elevation model of the study area indicating a shallow depression in topography via which flood water from the Upper Mooi River and the Du Toit Spruit sporadically flows into the Gerhard Minnebron (GMB) wetland (GIS: [8]).
Water 03 00356 g002
For the dry winter period during which the measurements were taken such influx of additional water can, however, be excluded, leaving groundwater as most likely source for the observed flow increase downstream of the eye.
With groundwater in the area commonly displaying a rather constant temperature of approximately 20 °C compared to ca. 12 °C of surface water during winter, we hoped that surface water temperatures of well above 12 °C would indicate the influx of warmer groundwater [9,10]. These measurements were confined to open water of the peat excavation area since the unmined part of the wetland is densely vegetated with nearly impenetrable 3–4 m high reeds. Selecting a cold winter morning (−2 °C air temperature at 8:00) it was hoped that the formation of visible steam as observed at the eye (Figure 3) would allow visual localization of the influx of warmer groundwater in the inaccessible vegetated part of the wetland.
Figure 3. Steam emanating from the Gerhard Minnebron eye during a cold winter morning.
Water 03 00356 g003
Unfortunately, this was not the case except for the eye itself.
In some instances, points along the various horizontal measuring transects indicated elevated surface water temperatures relative to the adjacent areas. This, however, was found to relate to (warmer) spring water from the eye preferentially flowing through breaches in berms designed to separate the individual peat-mining ponds from each other and to retain some of the original filter- and flow-slowing function of the peatland (Figure 4).
In addition to the horizontal transects at each measuring point, vertical temperature profiles were compiled. With most profiles in the mining pond area, constant or decreasing temperatures with depth significant influxes of (warmer) groundwater into the mined out areas of the peatland could be ruled out (Figure 4).
Figure 4. Horizontal and vertical distribution of water temperature as measured during a survey of the Gerhard Minnebron wetland aimed at detecting the possible influx of (warmer) groundwater into the wetland (measured on 8 June 2007).
Water 03 00356 g004
It was only after a veldt-fire destroyed most of the wetland vegetation that the formerly inaccessible, reed-covered parts of the peatland could also be surveyed. During this survey, a number of subaquatic springs in the upper part of the wetland have been detected, most of which were located within the first 800–900 m below the dam wall of the eye. They are recognizable by the naked eye through localized bodies of upwelling water that appear to be pushing from the bedrock through the overlying 1–2 m-high water column, indicating that the exfiltrating groundwater is under artesian pressure (Figure 5).
When occurring in natural in situ peat, these subaquatic springs appear to form round, almost well-like holes in which the continuously upwelling water does not allow for any material to be deposited (left photo in Figure 5).
Figure 5. Examples for subaquatic springs detected in the upper part of the Gerhard Minnebron wetland in close proximity to the eye.
Water 03 00356 g005
At other sites, significant changes in electrical conductivity and/or water temperature indicate a slower and possibly more diffuse influx of groundwater of varying quality. At some sites the Electrical Conductivity (EC) dropped significantly, at others considerably higher values than measured in the surface water and the eye were detected. Generally, it seems that wetland areas affected by exfiltrating groundwater appear darker than their surroundings, at least on satellite imagery taken during the dry winter months (retrieved from Google Earth; Figure 6).
Figure 6. A satellite image of the Gerhard Minnebron wetland taken during winter depicting an increased bush density towards the eye as point where the increasingly shallower groundwater table finally intersects the topographic surface as well as darker areas within the downstream wetland. Both features have been found at other sites in the region to indicate shallower groundwater levels and exfiltrating conditions, respectively (Satellite image: Google Earth, 2008).
Water 03 00356 g006
Furthermore, it was observed that upstream of known springs in the area, the density of bushes increases gradually towards the eye as the point where the groundwater table finally intersects the topographic surface. The increase in bush density towards springs is presumably caused by an increasingly shallower groundwater table that allows roots to access water throughout the year. This phenomenon was also found at the GMB eye (Figure 6).
Further analyses of this set of Google Earth images revealed that the immediate vicinity of natural karst springs (i.e., not dammed up) known to be discharging water of good quality are generally covered (surrounded by green vegetation, such as water lilies, as opposed to the overwhelmingly brown reeds found further away in the associated wetlands (Figure 7).
Figure 7. Green aquatic vegetation at springs and increasing bush density upstream of various eyes indicating discharge of unpolluted groundwater and shallower water tables, respectively. Main image: Bovenste Oog, upstream of Klerkskraal Dam, including a close up photograph of the eye (Inset B); Inset A: Two unnamed springs north-west of the Klerkskraal dam; Inset C: a satellite image of the upper part of the Gerhard Minnebron Wetland including a photo of the so-called ‘Lily pond’ as a subaquatic spring discharging unpolluted dolomitic groundwater.
Water 03 00356 g007
A similar area was found in the upper part of the wetland locally known as the ‘Lily pond’ owing to the coverage with water lilies. By inference, it was assumed that here—as in the case of the other three springs with known good water quality—comparably ‘clean’ groundwater enters the wetland.
Surveying water quality across the open water of mining ponds of the two different peat mining operations indicated little differences and no discernable consistent trend of water quality changes, neither in downstream direction nor vertically. It, however, confirmed the preferential flow through gaps in the berms between the ponds indicating that the intended filter function of the prescribed berms has been compromised (Figure 8).
Figure 8. Horizontal and vertical distribution of Electrical Conductivity (EC) values as measured during a survey of the Gerhard Minnebron wetland (measured on 8 June 2007).
Water 03 00356 g008
It is noticeable that the EC-levels at both ponds are consistently above those at the eye (730–740 µS/cm vs. 700 µS/cm) presumably caused by the influx of polluted groundwater upstream of the ponds. The latter is indicated by significantly elevated EC-values detected in water at a depression known as ‘Willow seep’, displaying close to 1,200 µS/cm (Figure 8). Compared to a salt load of 8.9 t/d entering the wetland via the eye, the load discharged at the outflow of the wetland into the Mooi River of 54.4 t/d constitutes a significant increase (600%). Since the increase in flow is somewhere between 250% (assuming a 50 ML/d outflow rate compared to 19 ML/d inflow) and 580% (assuming a 110 ML/d outflow volume as upper value of the measured range) this increase in salt load is not only due to the rising water volume but also due to a higher salt load of the water.
Following the observation of extensive salt crusts forming during the dry winter months in three distinct areas across the wetland, the quality of porewater in alluvial sediments or peat if present at these sites was determined (Figure 9).
Figure 9. Examples of salt crusts of different mineral composition as observed during the dry winter month of August 2007 at four different sites of the Gerhard Minnebron wetland.
Water 03 00356 g009
The areal extent of these salt crusts could only be fully determined after the earlier mentioned veld fire destroyed most of the covering vegetation. Salt crust patches of significant proportions were found at three different sites: (a) the upper part of the wetland stretching from the dam wall of the eye to the “Willow Seep” covering the entire width of the wetland; (b) at portion 7, right next to the Middleground mining pond, where a wall obviously impedes pre-existing surface flow, and (c) at portion 9 in a shallow depression in which borehole ri 80 m is located having a diameter of approximately 100 m. A nearby puddle with white salt fringes occurring semi-permanently on a dirt road just outside the wetland at the right hand bank also indicates sub-surface influx of polluted water into the wetland.
Results of in situ field measurements indicate that EC-levels of near surface porewater, at all sites where salt crusts had formed, were well above the average of the wetland displaying 1,000–6,000 µS/cm compared to 730–740 µS/cm (Figure 10).
Figure 10. Spatial trends in porewater quality in peat and alluvial sediments as measured in borehole transects at portions 9 and 7, respectively, indicating the influx of polluted groundwater at both sites (12 September 2007, using a multiprobe field meter).
Water 03 00356 g010
The latter value exceeds EC-levels commonly found in undiluted seepage from tailings dams in the upstream gold mining area. For the EC in all three transects, a consistent gradient was found decreasing from the edge of the wetland towards the center. Assuming that the decrease was caused by increasing dilution by clean water within the wetland, it is likely that polluted groundwater moves from the edges of the wetland along a low hydraulic gradient towards the draining stream in the center of the wetland. At present, the sources of the increased salt concentration of these groundwater bodies are still largely unknown.
Analyses of the salt crust from the different sites show that the mineral composition changes from Ca/Mg carbonate-dominated species upstream through sulfate-dominated minerals at the middle of the wetland (portion 7 at Middleground) to sodium/ potassium-chloride combinations at Portion 9, the most down-gradient area of the wetland. In the upper part of the wetland immediately downstream of the eye, elevated sulfate levels in laterally infiltrating groundwater as well as the spring water issued at the eye (continuous rise over the past decades) suggest that most of the salt crusts observed in this area are also sulfate dominated.
In addition to the formation of salt crusts at portions 7 and 9 puddles with freshly formed floating coatings of iron hydroxides as well as older (precipitated) iron hydroxide flakes were observed (Figure 11).
Figure 11. Examples of iron hydroxide rich puddles occurring at portions 7 and 9 indicating freshly formed iron hydroxide floating as a bluish colored film on top of the water (right picture) and matured iron hydroxide that already partially precipitated in the form of brown flakes (left picture).
Water 03 00356 g011
Since U is known to be removed from the water phase by co-precipitating along with FeOOH this may point to the presence of a potential immobilization mechanism at both sites.

3. Porewater Dynamics in Peat and Non-Peat Wetland Sediments

3.1. Overview on Measuring Stations in the GMB Wetland

In order to assess how far the surface or groundwater that flows through the wetland also moves through the peat or other types of wetland sediments, a total of nine monitoring boreholes were installed along transects at two of the sites where the inflow of polluted groundwater was detected (i.e., portion 7 and portion 9 of the farm GMB, Figure 12).
In addition to the datalogger-controlled probes installed at the boreholes, a number of pre-existing, or newly installed measuring stations provided supplementary information used to interpret the borehole data.
This includes a multisensor probe at the dam wall of the eye measuring water level, pH, EC and water temperature (Tw) at 10 min intervals some 50 cm below the water level, provided and maintained by the DWA. Station C2H092, an established DWA-gauging weir, registers the flow rates of spring water diverted into the irrigation canal. This is complemented by water level measurements at another long-standing gauging weir of the DWA (C2H011) located downstream of the eye dam wall, which measures the water released from the eye into the wetland (also termed ‘wetland inflow’). Owing to technical problems the existing rating table for the weir is no longer reliable, limiting the station to water level records only.
Figure 12. Location of automatic measuring stations installed in the Gerhard Minnebron Wetland (DL-data logger).
Water 03 00356 g012
In order to capture the outflow of the wetland, on which no information was available, a station comprising of water level measurements (vented STS) and water quality measurements (YSI multi probe) was installed.
In order to capture relevant meteorological parameters such as rainfall (volume and intensity), air temperature, relative humidity, etc., an automatic weather station was placed near the borehole transect at portion 9, recording all parameters at 10 minute intervals.

3.2 Porewater Dynamics of (Non-Peat) Alluvial Sediments

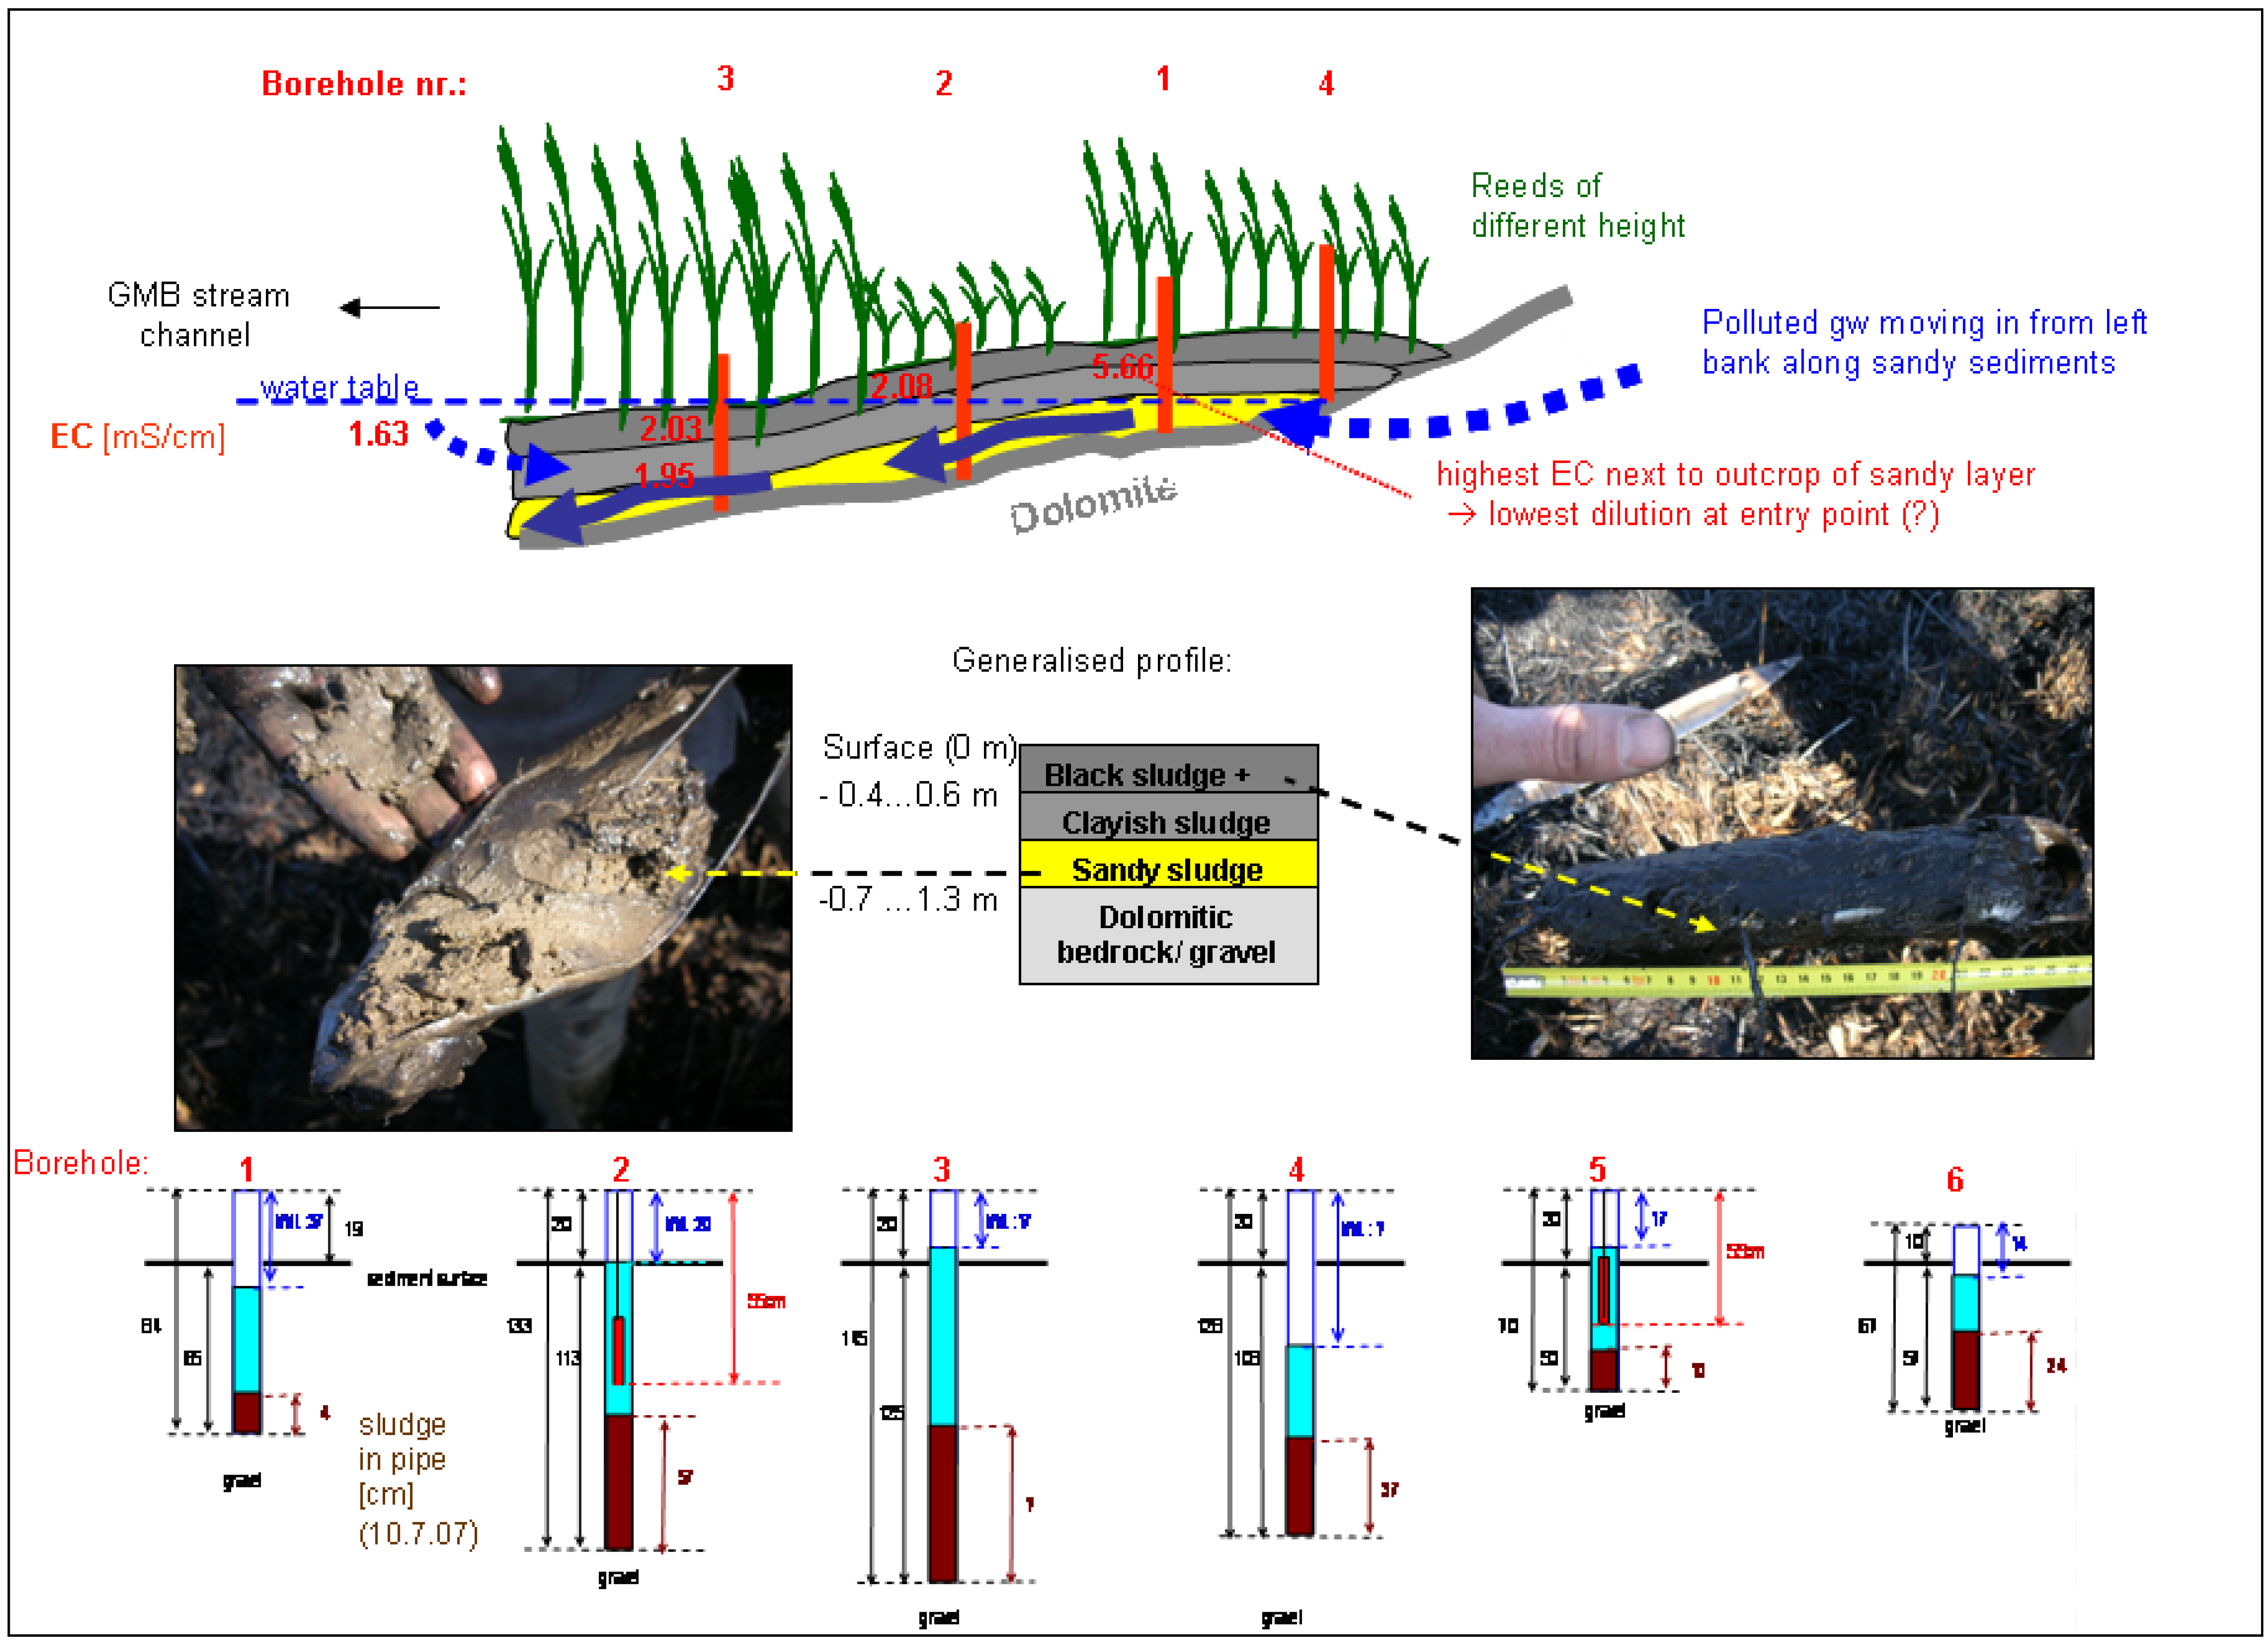
In contrast to expectations of the owner of portion 7, who reportedly considered selling his peat to the adjacent peat miners, no peat was detected at this site. Probing the sediment thickness along a transect from the left-hand side edge of the wetland to the GMB stream and later installing two transects of monitoring boreholes, mostly alluvial sediments were encountered consisting of partly reduced organic rich sludge of various thickness, underlain by sand and clay layers below (Figure 13).
Figure 13. Simplified cross section depicting the near-surface geological underground along the borehole transect at portion 7 (upper part) including a generalized soil profile (middle part) and the depth of each borehole (lower part).
Water 03 00356 g013
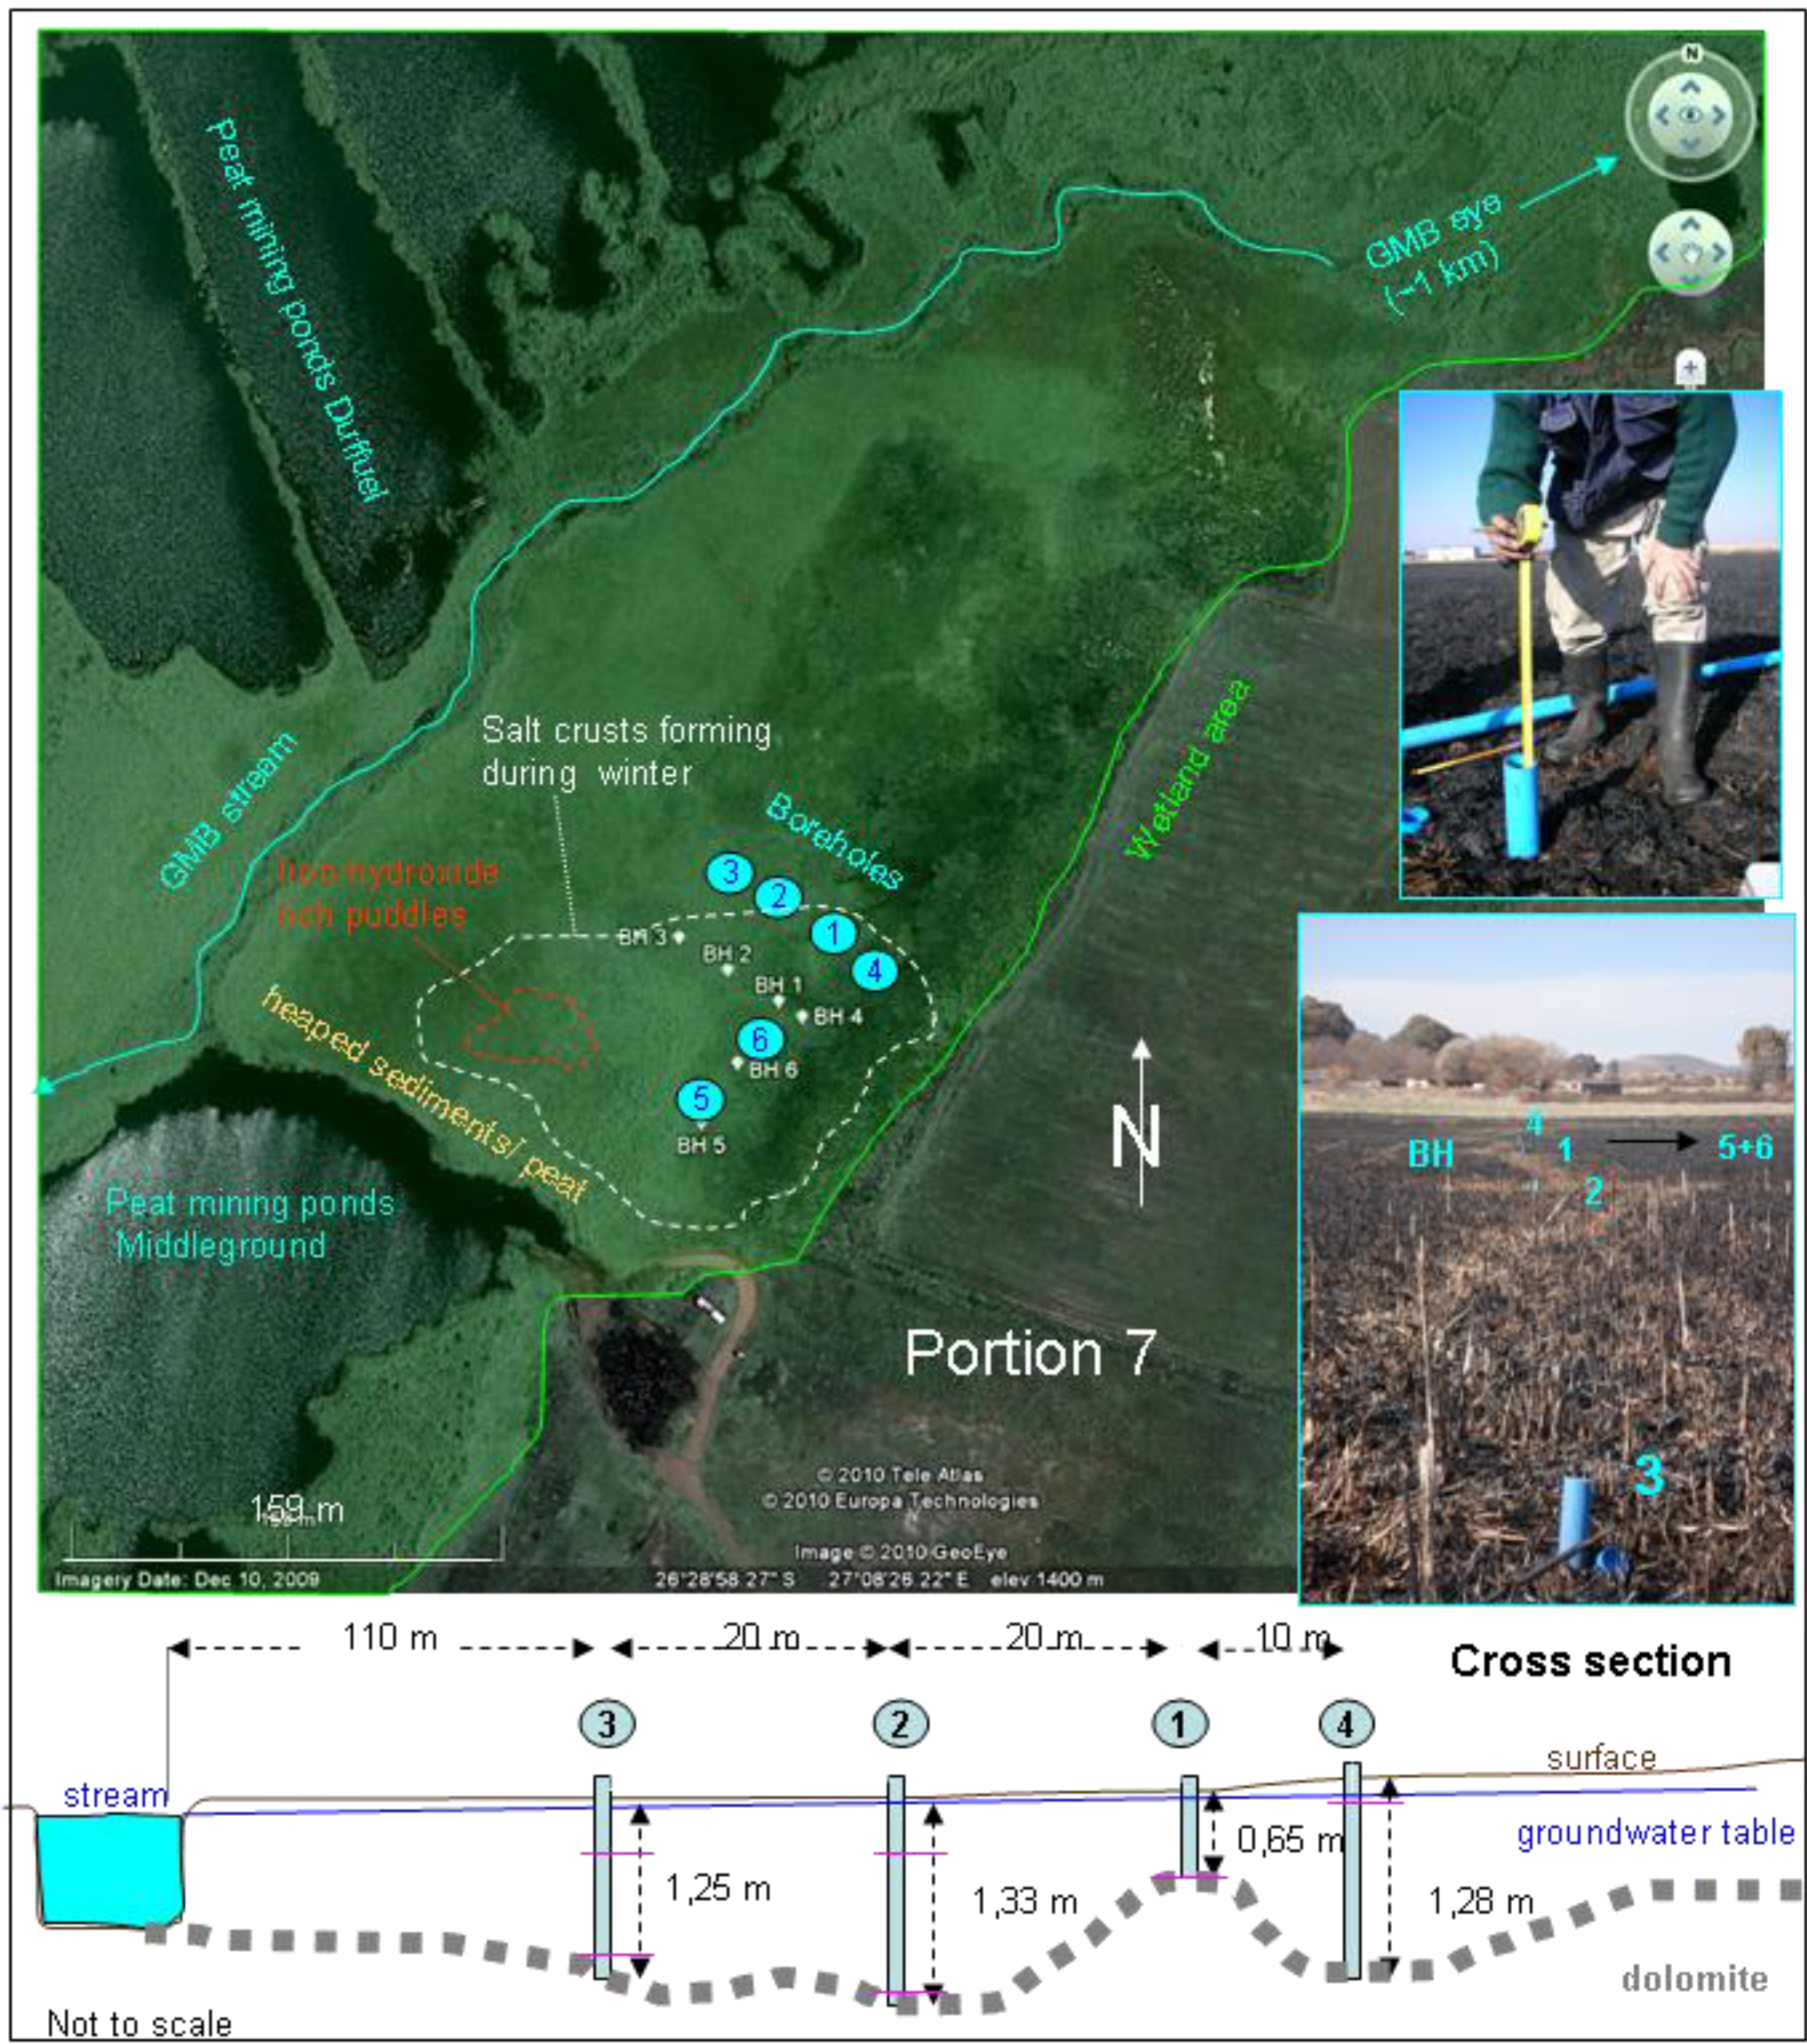
In order to capture the dynamics of the lateral inflow of the plume, a T-shaped transect design was chosen with a four-borehole transect running perpendicular to the stream and a three borehole transect running parallel (Figure 14).
Figure 14. The location and horizontal and vertical structure of the borehole transect at portion 7.
Water 03 00356 g014
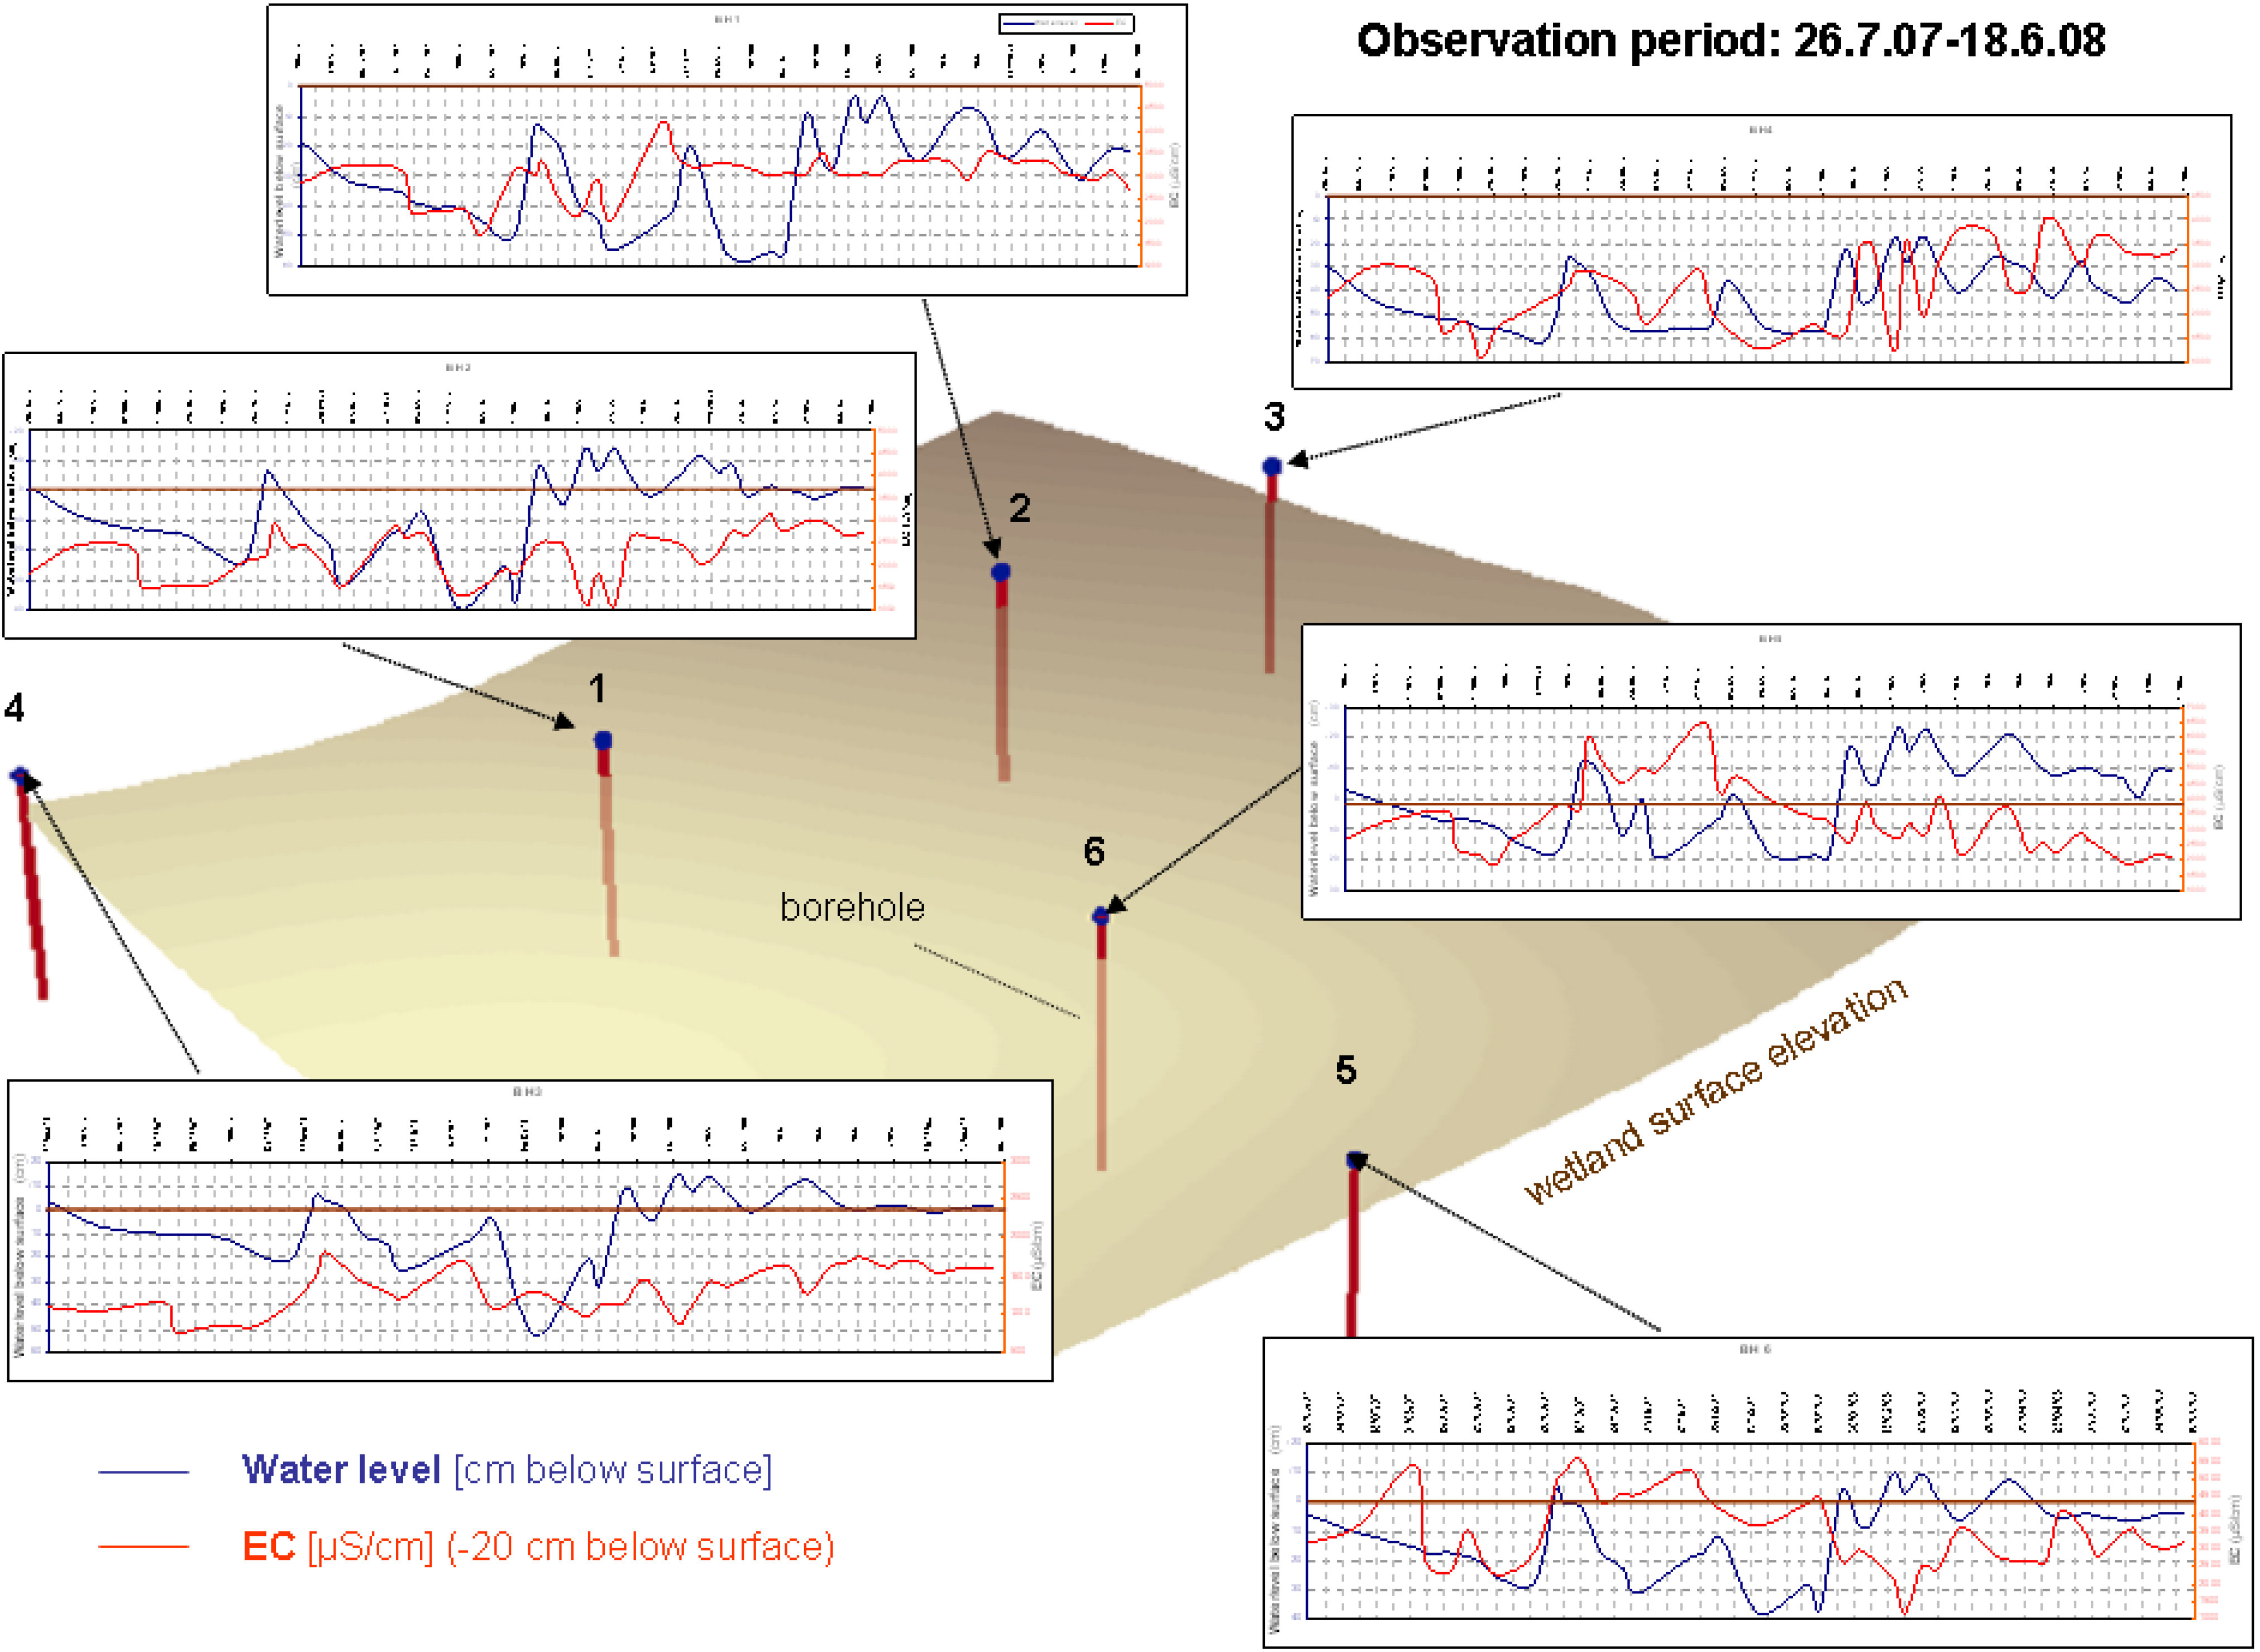
In addition to equipping selected boreholes with water level loggers (Swiss brand STS, non-vented) recording water levels at 10 min-intervals, water quality parameters (Electrical conductivity [EC], pH. T) from all boreholes (at different depths) were also measured manually at a weekly/fortnightly intervals including the manual capture of water levels, existence of salt crusts, vegetation growth and corresponding meteorological data that were subsequently archived in an EXCEL-spreadsheet.
Attempts to identify possible pollution and flow patterns through the combined interpretation of 3-dimensional spatial data (horizontal and vertical gradients have been determined) changing over time (two observation years) resulted in such a large degree of complexity that meaningful results were difficult to obtain (Figure 15).
Figure 15. Spatial and temporal variation of the water level and electrical conductivity of near surface alluvial groundwater as measured at weekly intervals in boreholes of the transect at portion 7 during July 2007 and June 2008.
Water 03 00356 g015
To overcome this problem, a method was developed to synoptically visualize the spatial and temporal changes of all monitored parameters by combining a high resolution GIS-based digital elevation model (3D) for the transect area superimposed with a GIS-generated extrapolation of the measured point data. Generating this for each measurement resulted in a time-series of GIS-images, which were then important into a PowerPoint file. Displaying them in rapid succession, their chronological order makes them appear as a dynamic sequence of parameter changes. This, in turn, makes it easier to visually observe spatial patterns and temporal correlations between parameter changes [11] (Figure 16).
Figure 16. An example of a PowerPoint slide depicting the temporal change of water level and EC of alluvial groundwater at the borehole transect at portion 7 for a certain date of measurement. Parameters of possible relevance such as rainfall, air temperature, vegetation growth and salt crust coverage are also displayed. This slide represents 1 in a series of approximately 40 slides that cover all measurements taken over the 11 month observation period. Displaying all slides in rapid succession allows the viewer to perceive discrete results in an almost uninterrupted time-lapse camera like fashion. Superimposed onto DEM associated spatial changes such as growing or shrinking of inundated areas are displayed in a (quasi) 3D-manner.
Water 03 00356 g016
While no clear source of the plume could be identified, it appears that an upstream open pit where clay covering underlying dolomite was extracted for brick making may act as a basin collecting and channeling surface runoff towards the wetland. Moving underground along a shallow depression line, possibly indicates a subterranean karst channel. The runoff is subsequently contaminated either by fill material in the pit itself (ashes and other waste material from brick burning) or by geological features such as an outcrop of atypically weathered dolomite found in the area, or (hospital) waste dumped into the pit or a source located between the pit and the receiving wetland (or a combination of some or all factors).
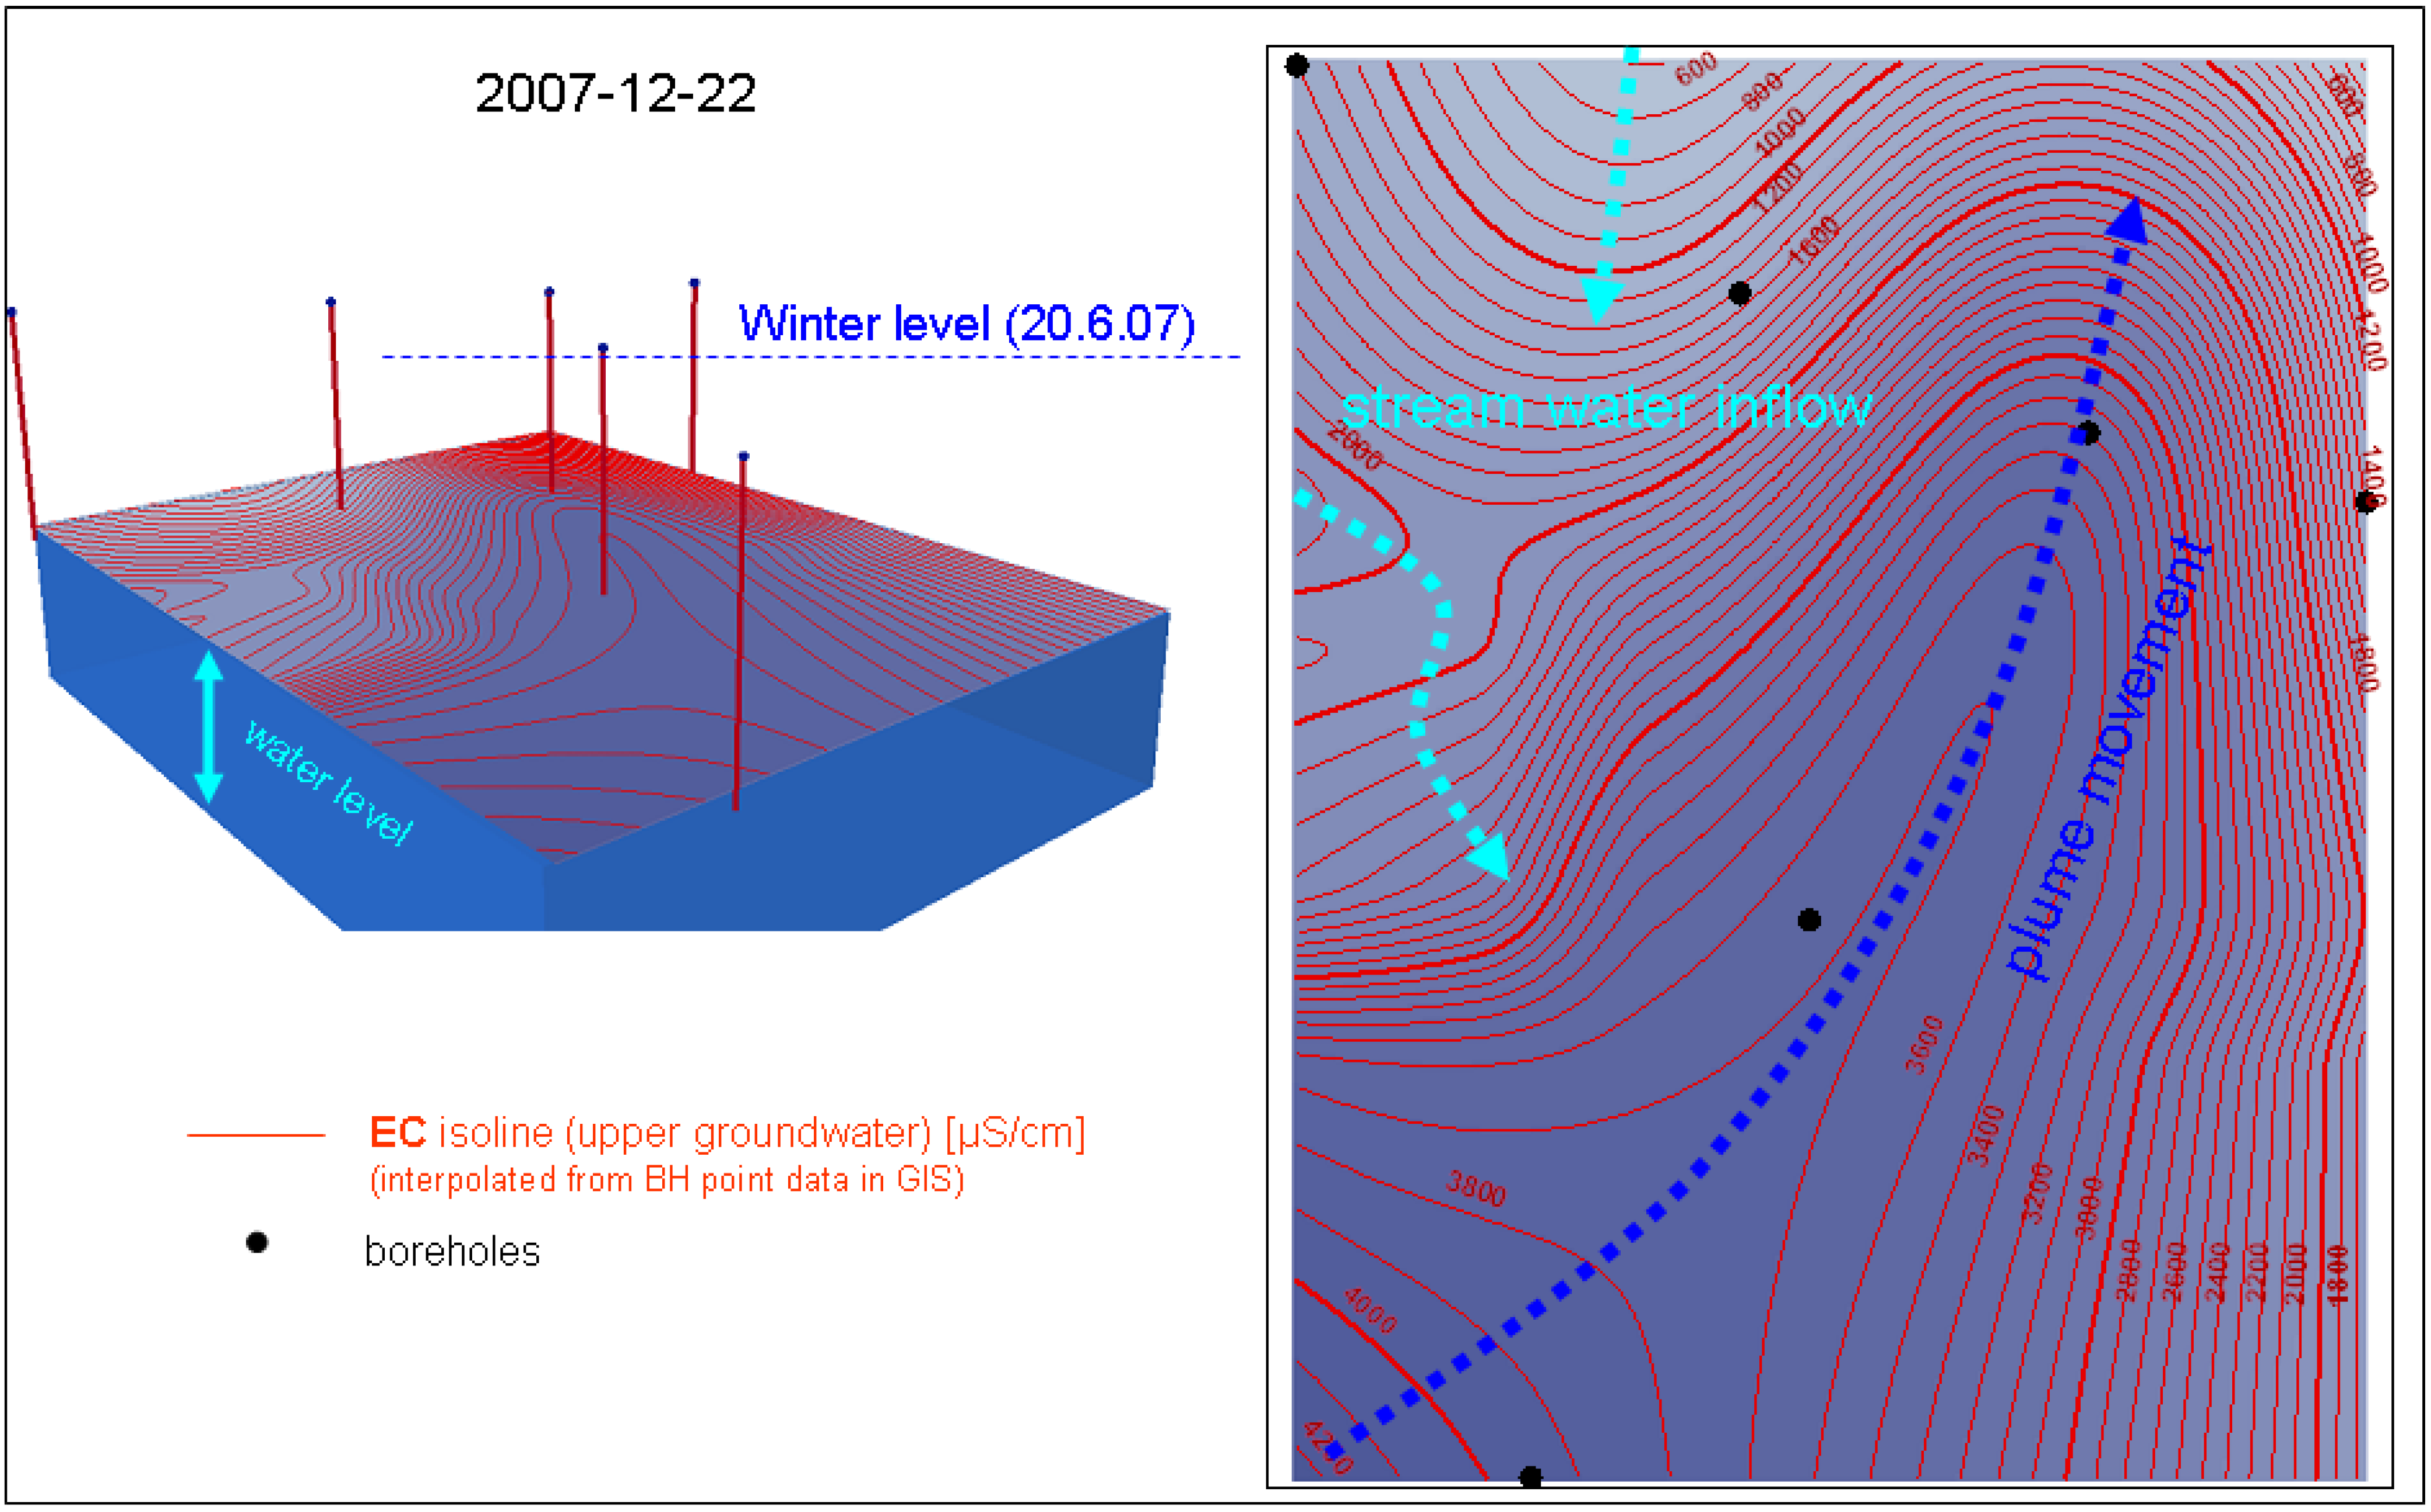
The movement of the plume shows strong temporal changes with some dependence on rainfall and possibly vegetation patterns, which needs further analyses (Figure 17).
Figure 17. GIS-generated contours of Electrical Conductivity (EC) in shallow alluvial groundwater and water level elevation at the borehole transect at portion 7 and associated interpretations of possible flow patterns indicating plume movement and influx of (cleaner) stream water.
Water 03 00356 g017

3.3. Porewater Dynamics in Undisturbed in in situ Peat

(a)
Peat thickness and monitoring design
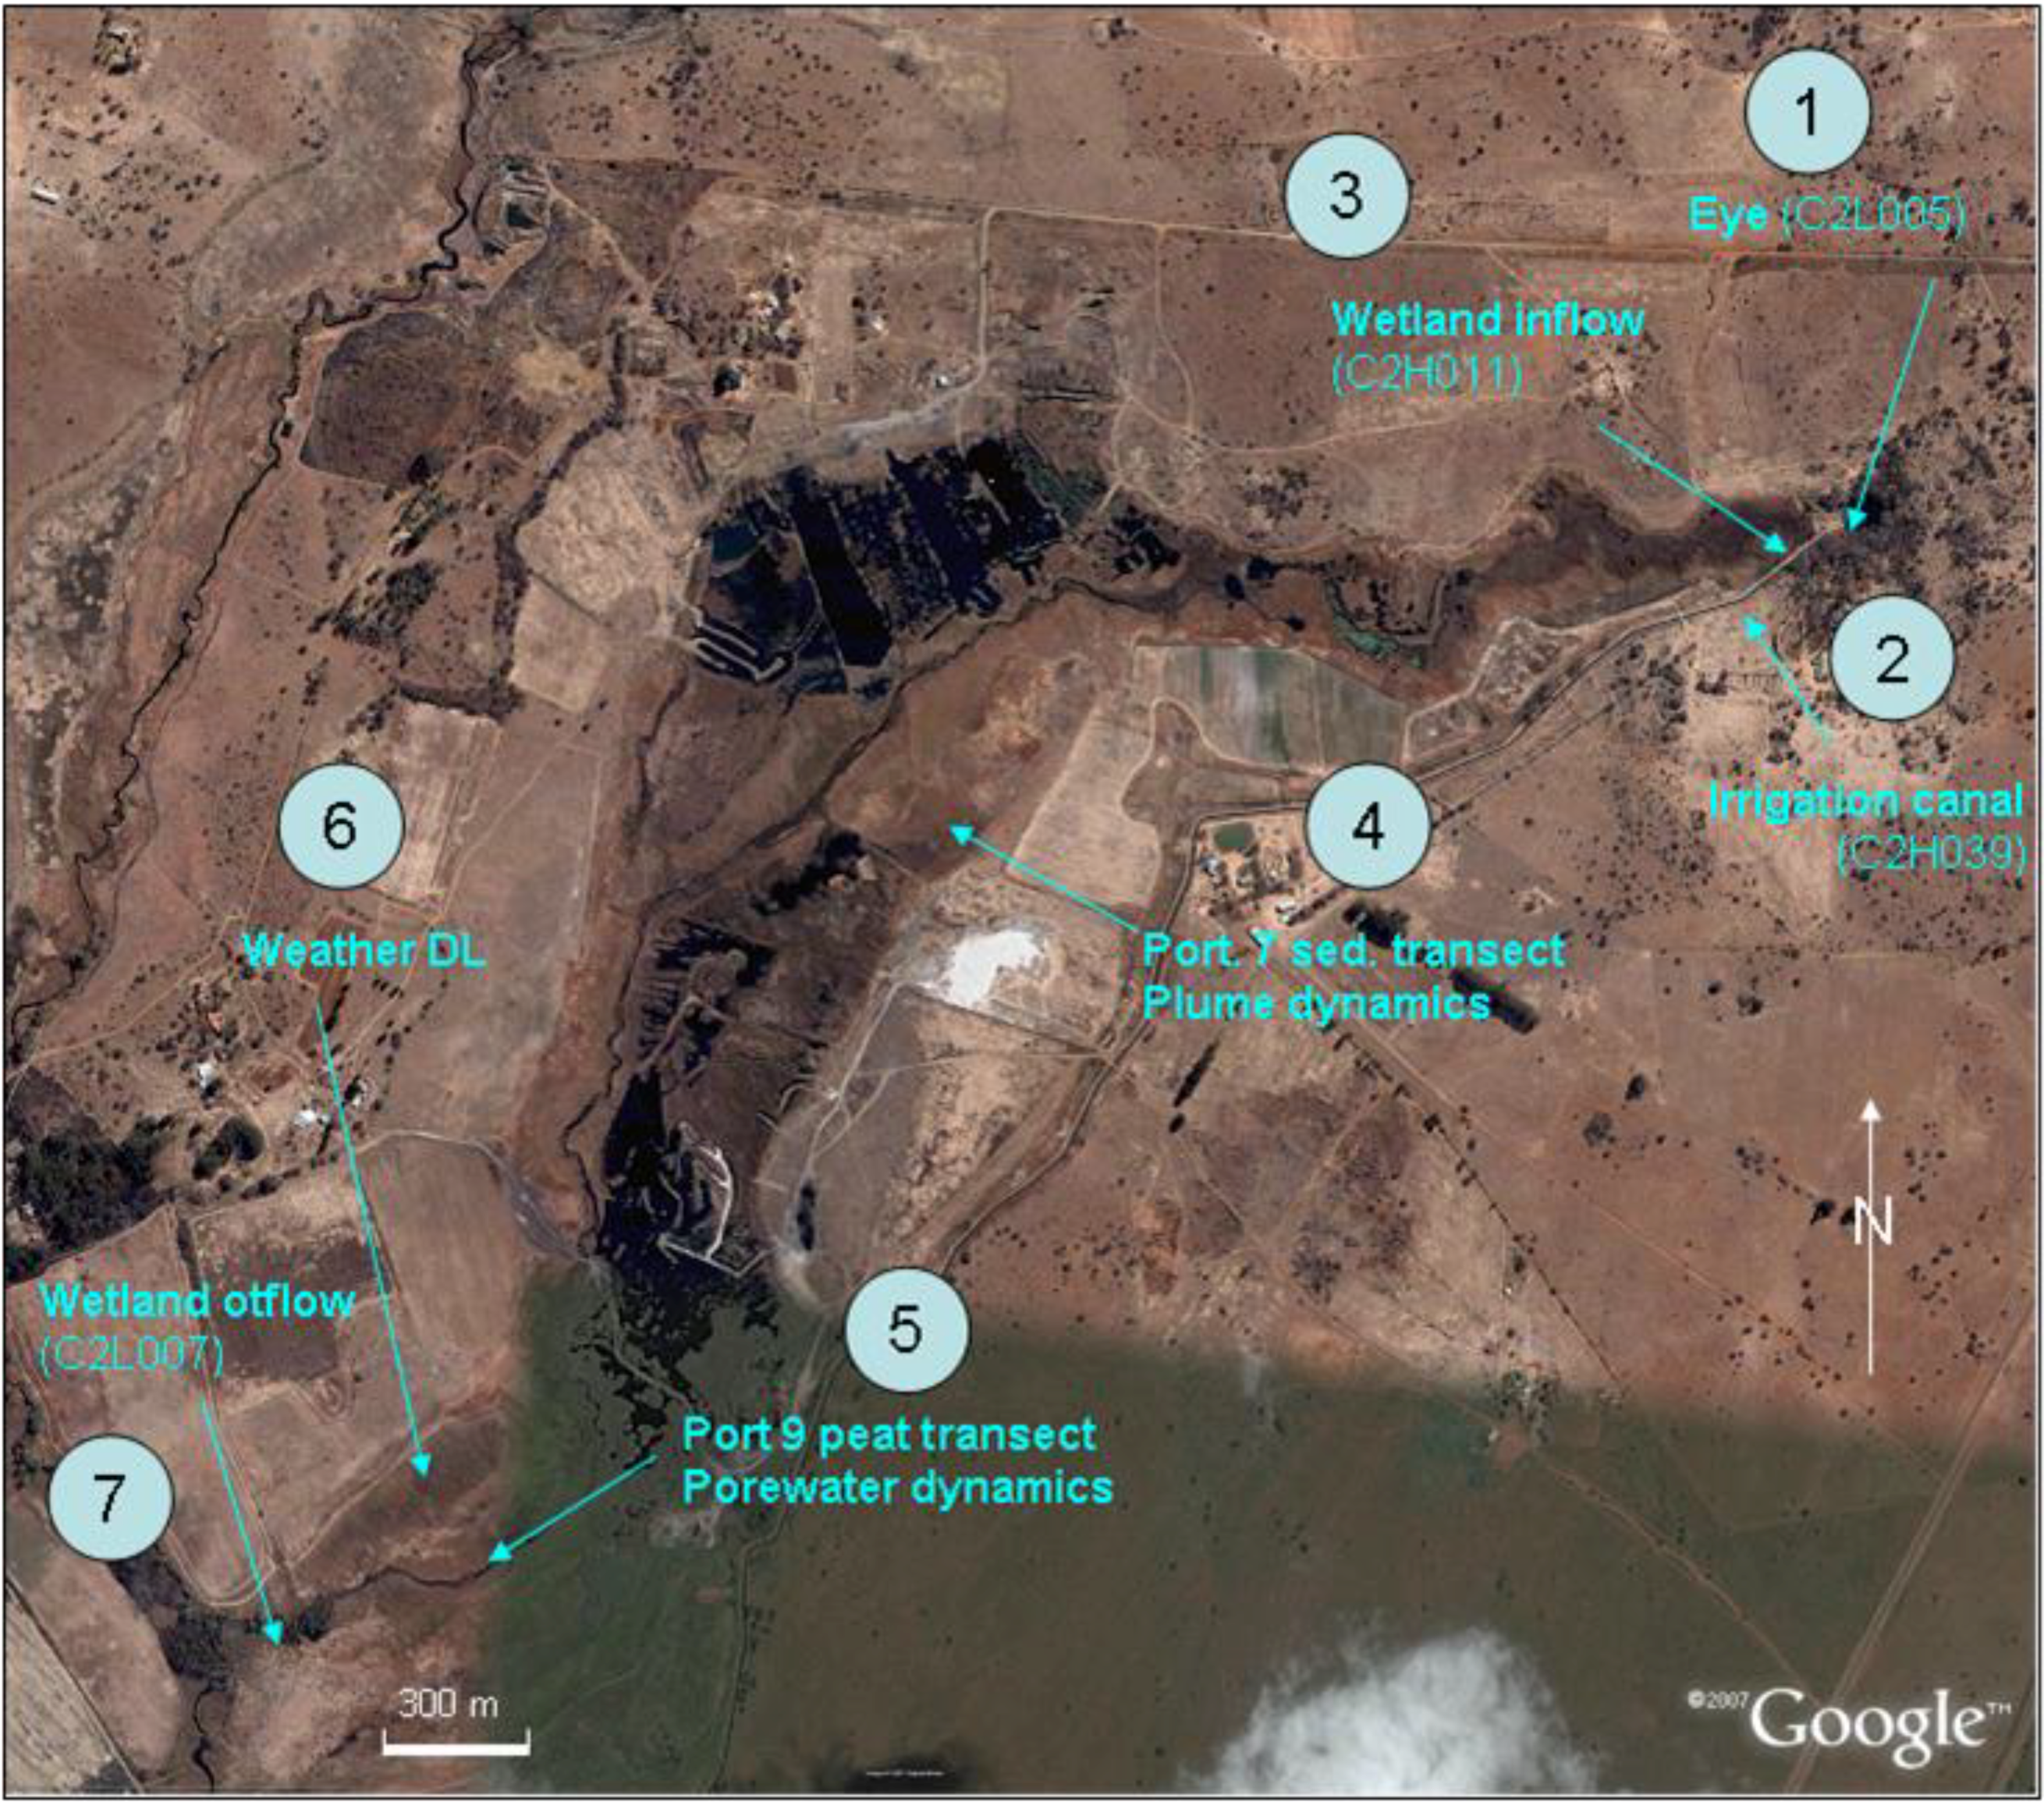
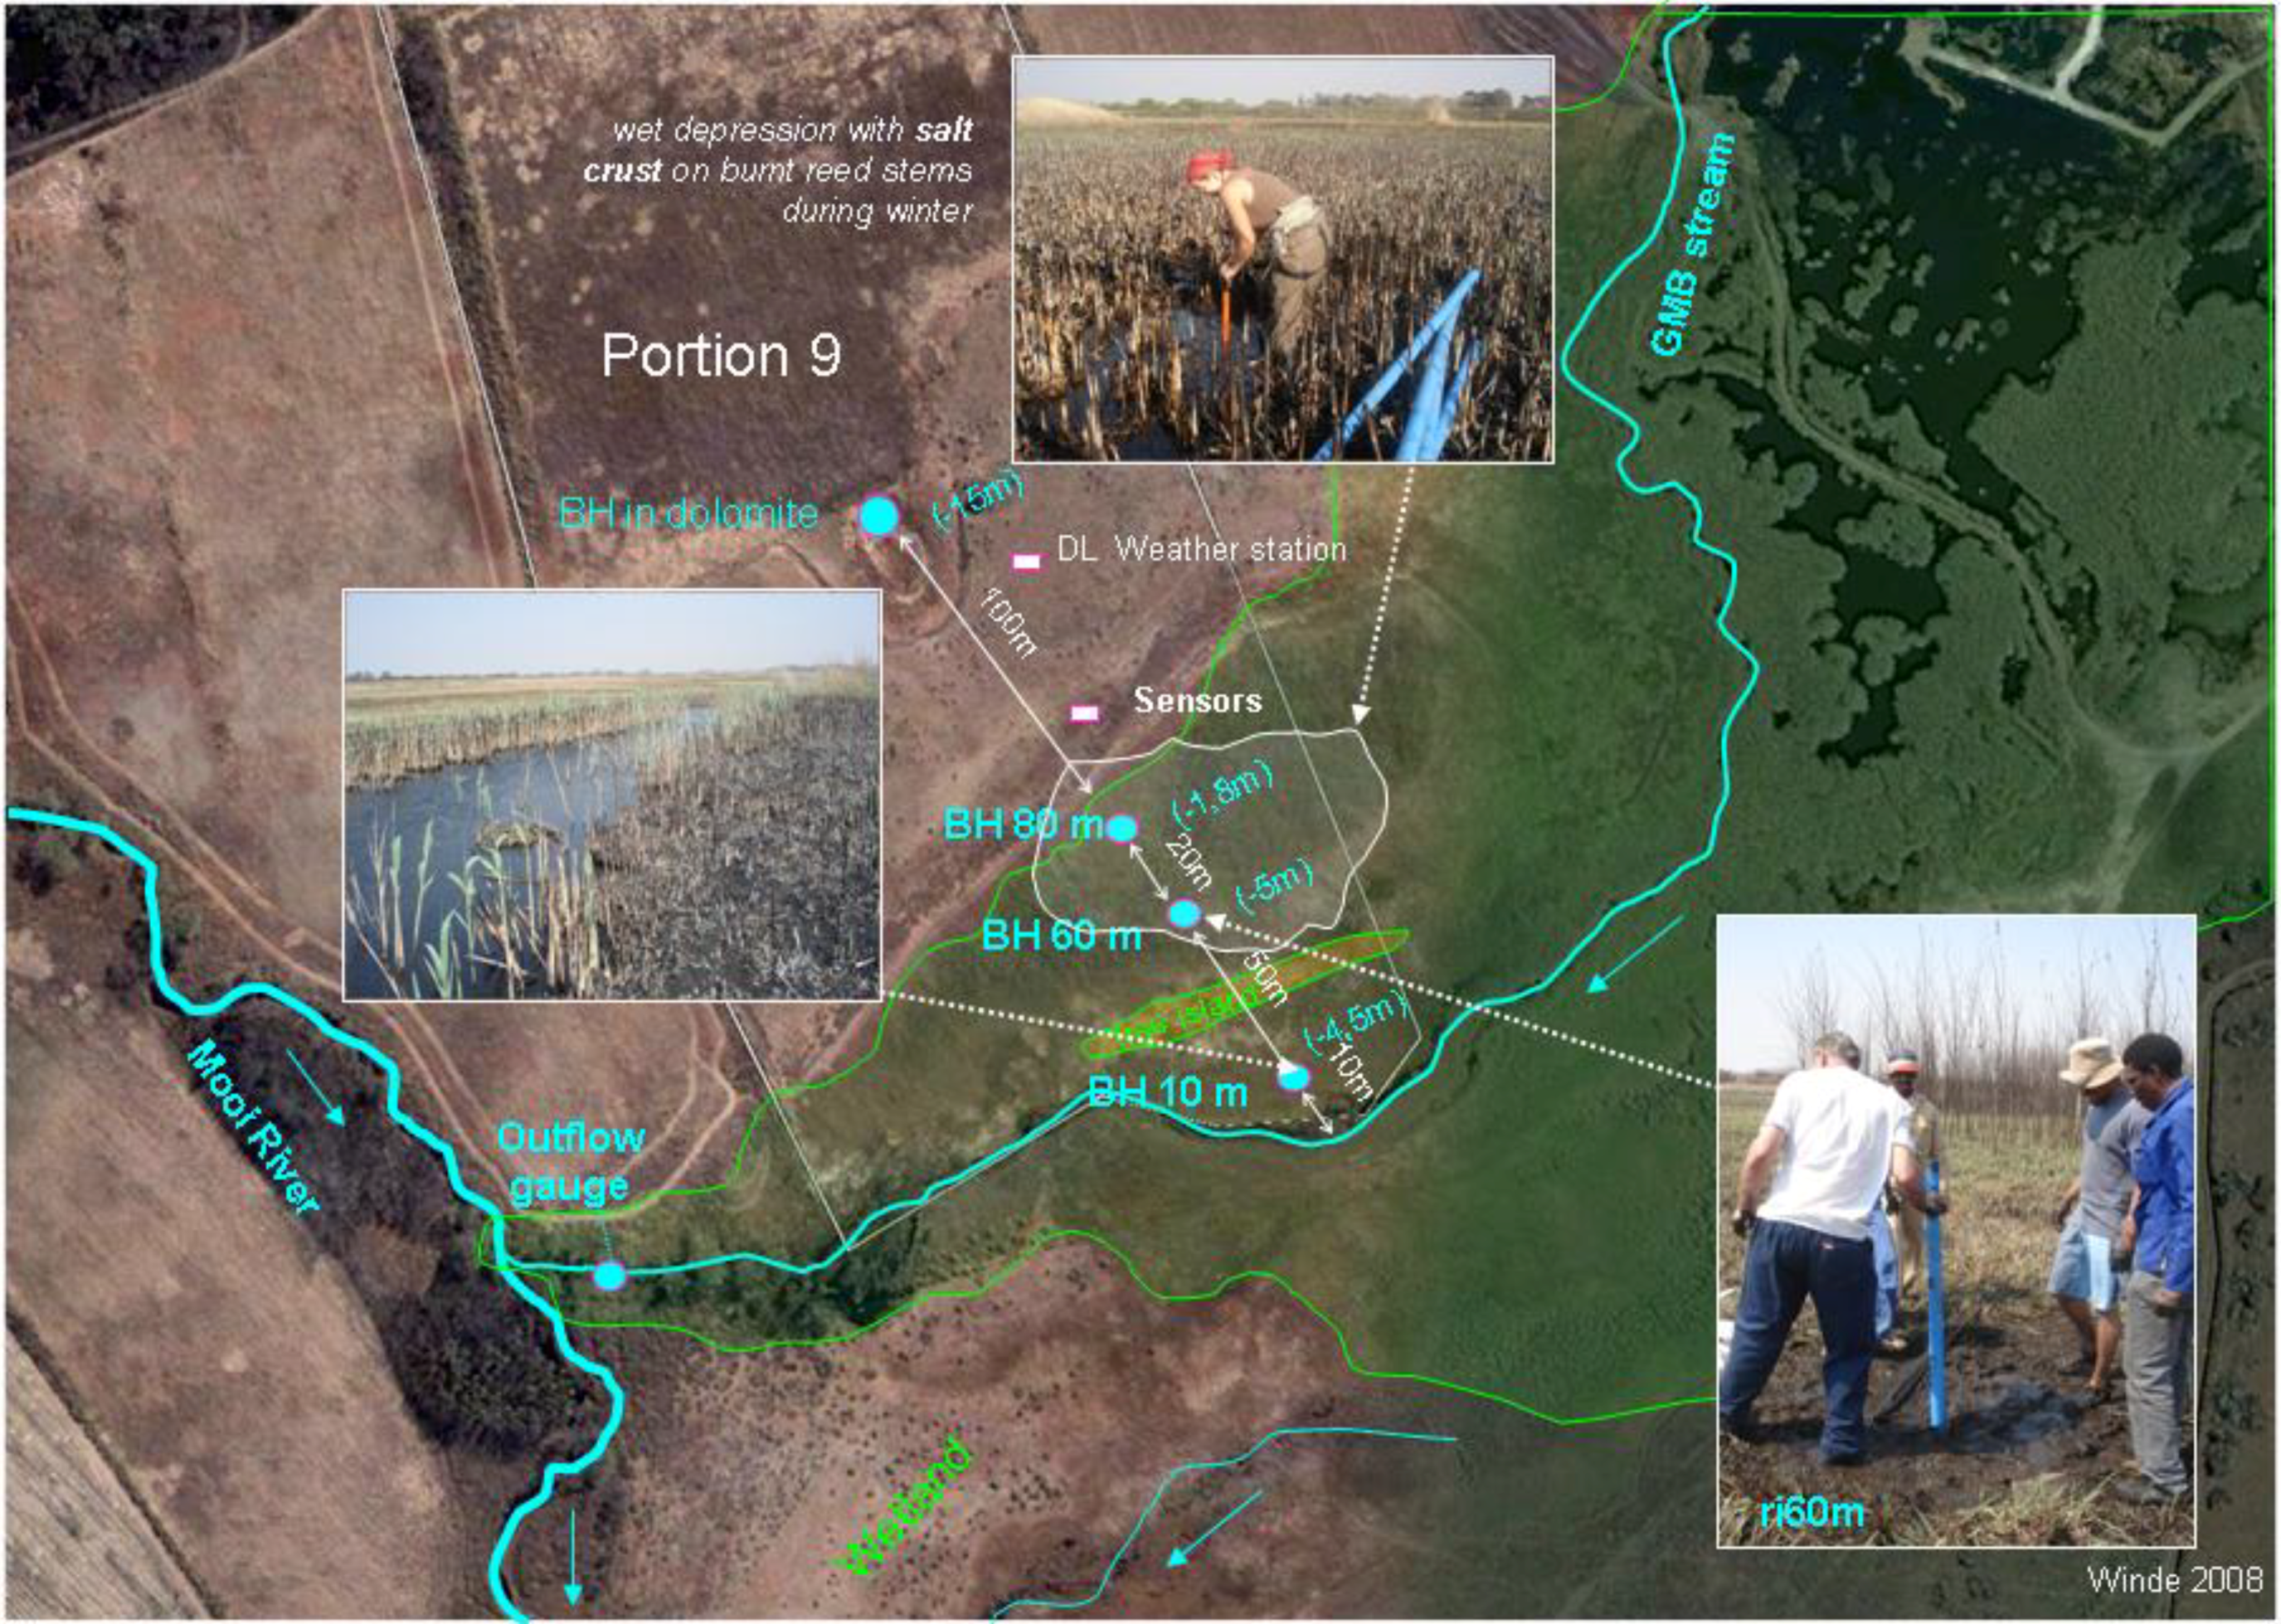
The location of the station at portion 9 is shown in Figure 18.
Figure 18. Location and structure of the borehole transect in peat installed at portion 9 (underlying satellite image retrieved from Google map, September 2008).
Water 03 00356 g018
The area at portion 9 that is affected by polluted groundwater, is also covered by undisturbed in situ peat deposits ranging in thickness from approximately 1 m to over 5 m [12,13]. In order to investigate how far porewater in peat may be interacting with the nearby GMB stream, three boreholes were installed along a transect perpendicular to the course of the stream channel. At distances varying from 10 m from the left hand bank of the stream to 60 m and 80 m, up to 5 m-deep peat core were drilled and slashed plastic borehole casing (8 cm in diameter) installed. The cross section displaying the borehole transect in peat installed at portion 9 is shown in
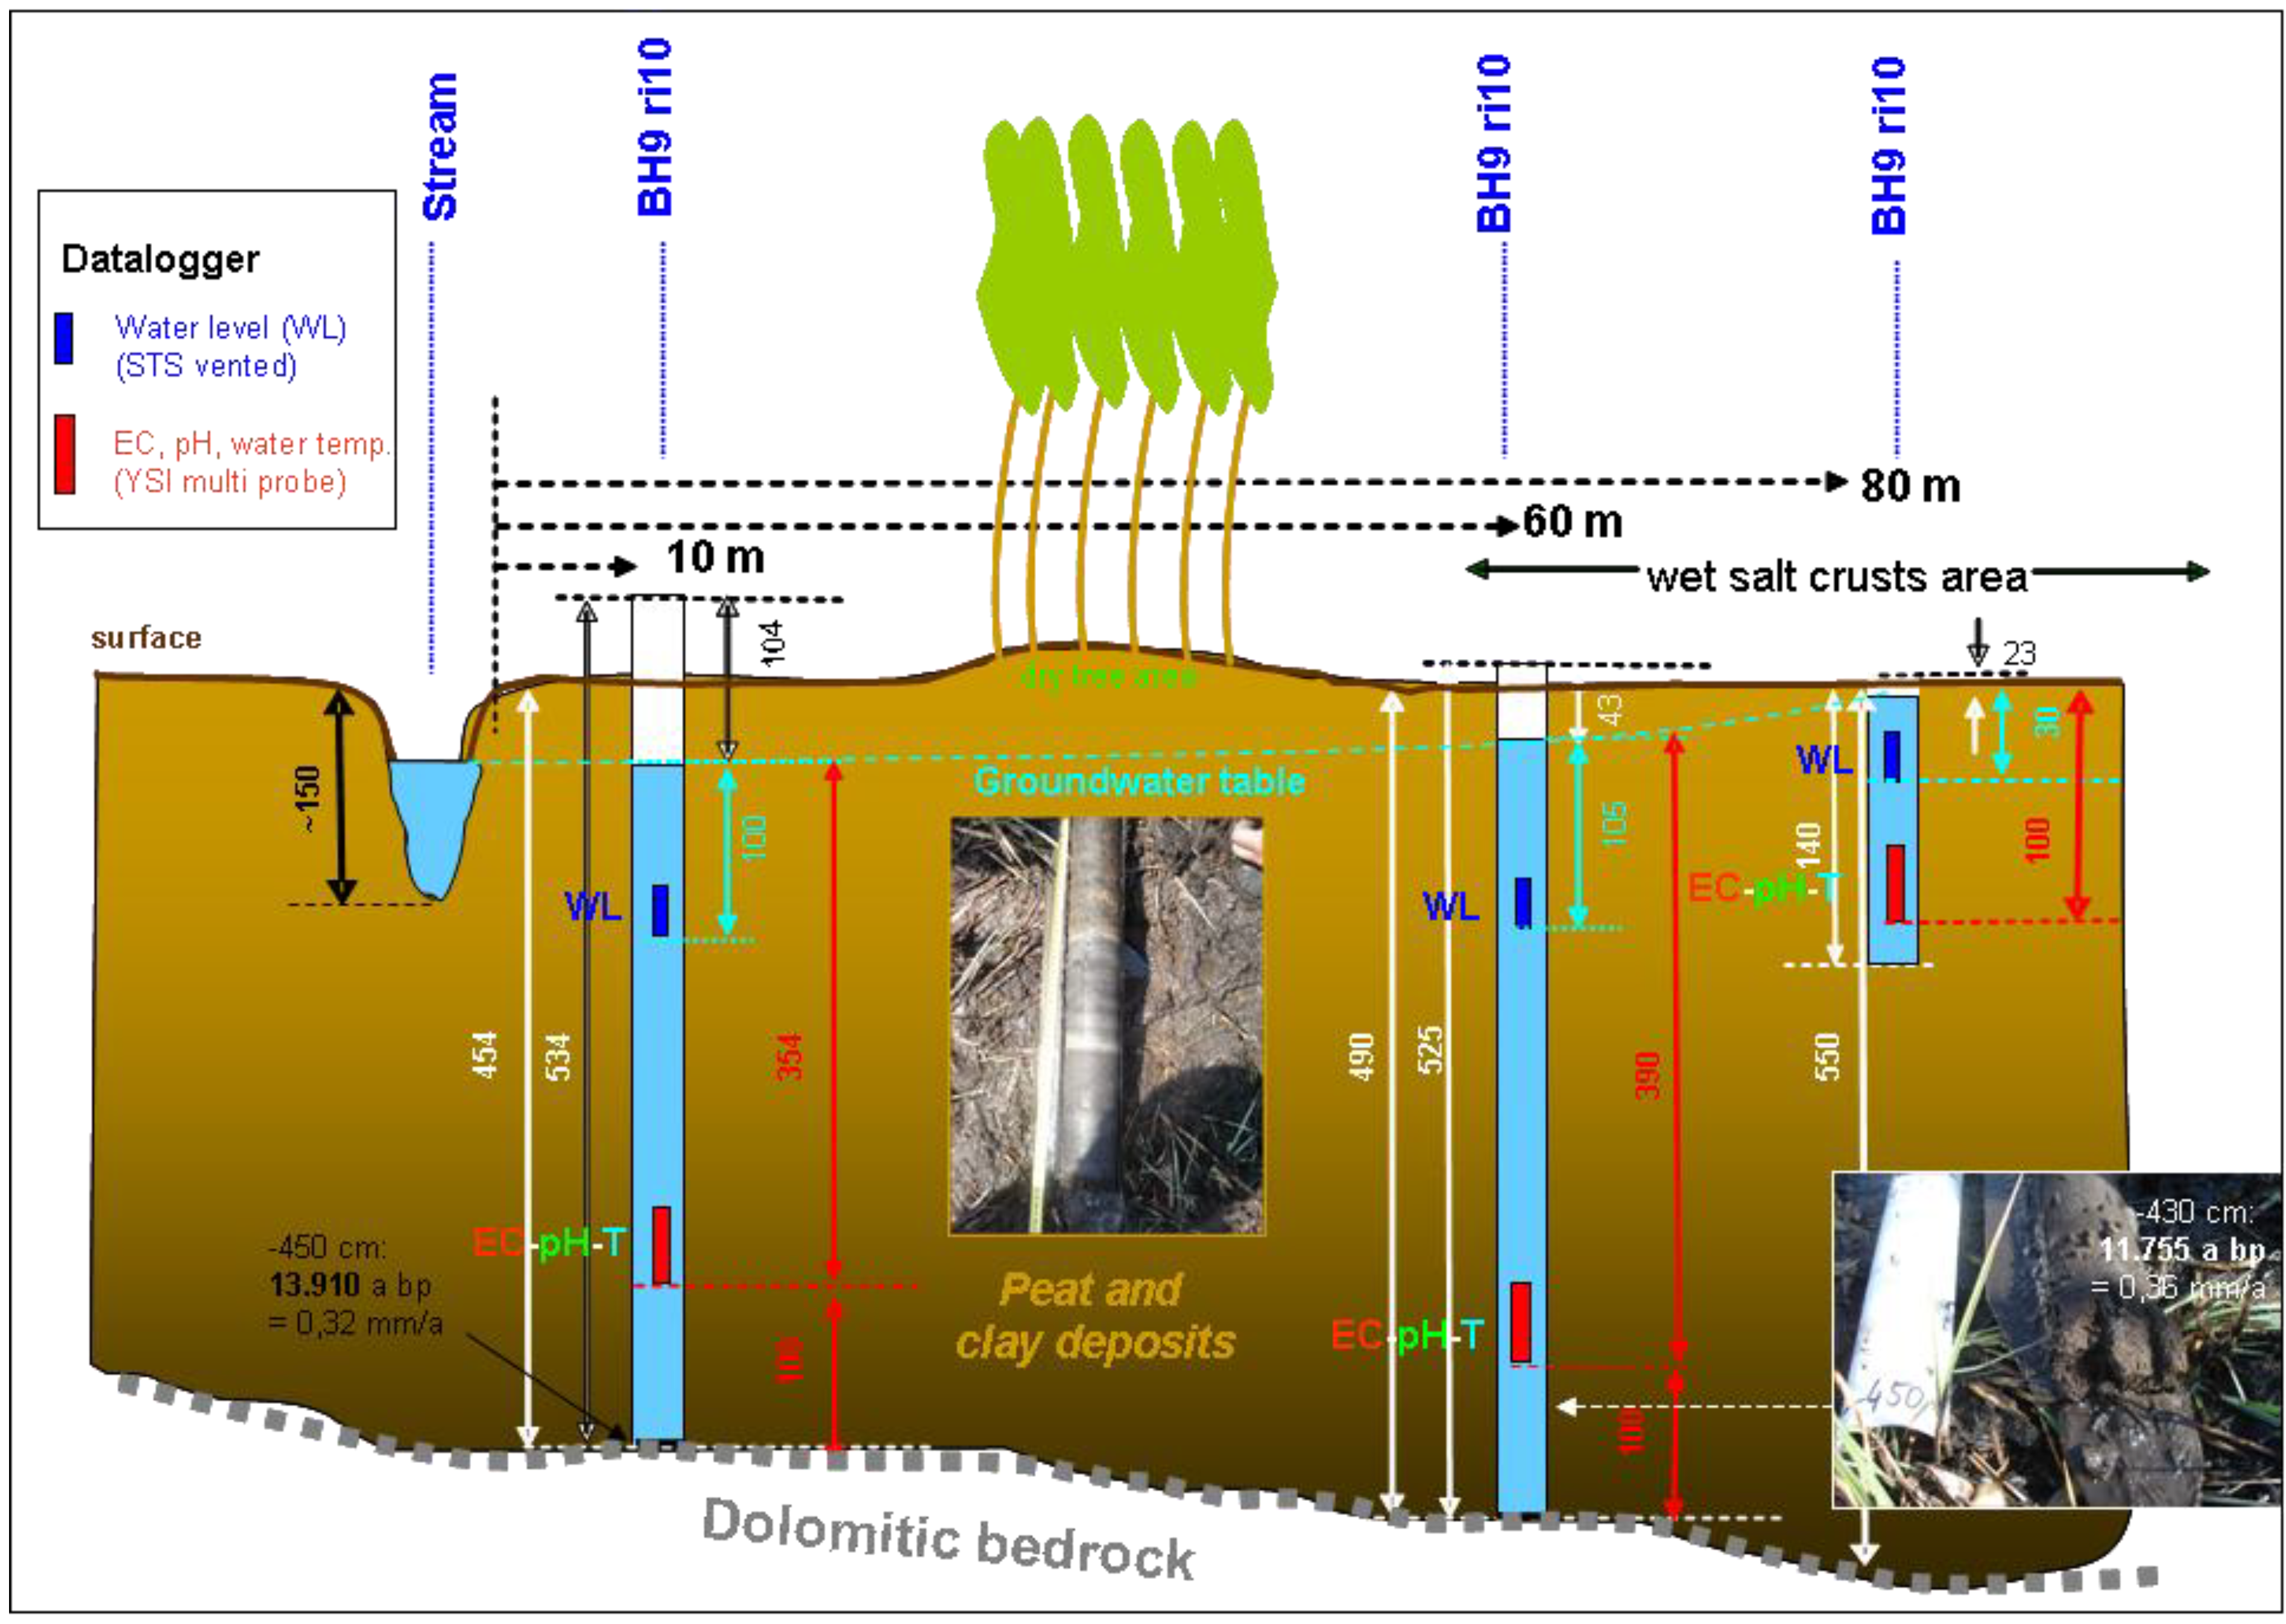
 Figure 19.
Peat from these boreholes was also used to determine the age of the deposits employing the radiocarbon method (analyses performed at the University of Kiel, Germany).
Much of the water flowing into the peatland is drained via the GMB stream running through the wetland. It is, therefore, important in assessing a potential filter function of the peat to establish how far water flowing in the stream could be routed through the peat as a prerequisite for any filter effect to take place.
Figure 19. Cross section of the peat borehole transect at portion 9 indicating the position of different data logging sensors within the different boreholes.
Water 03 00356 g019
(b)
Hydraulic gradients and water quality depth profiles
The water table in the three boreholes measured shortly after installation-related fluctuations had stabilized, indicated a relatively flat hydraulic gradient towards the stream, suggesting (at least for the right hand bank area) that exfiltrating groundwater flows into the stream.
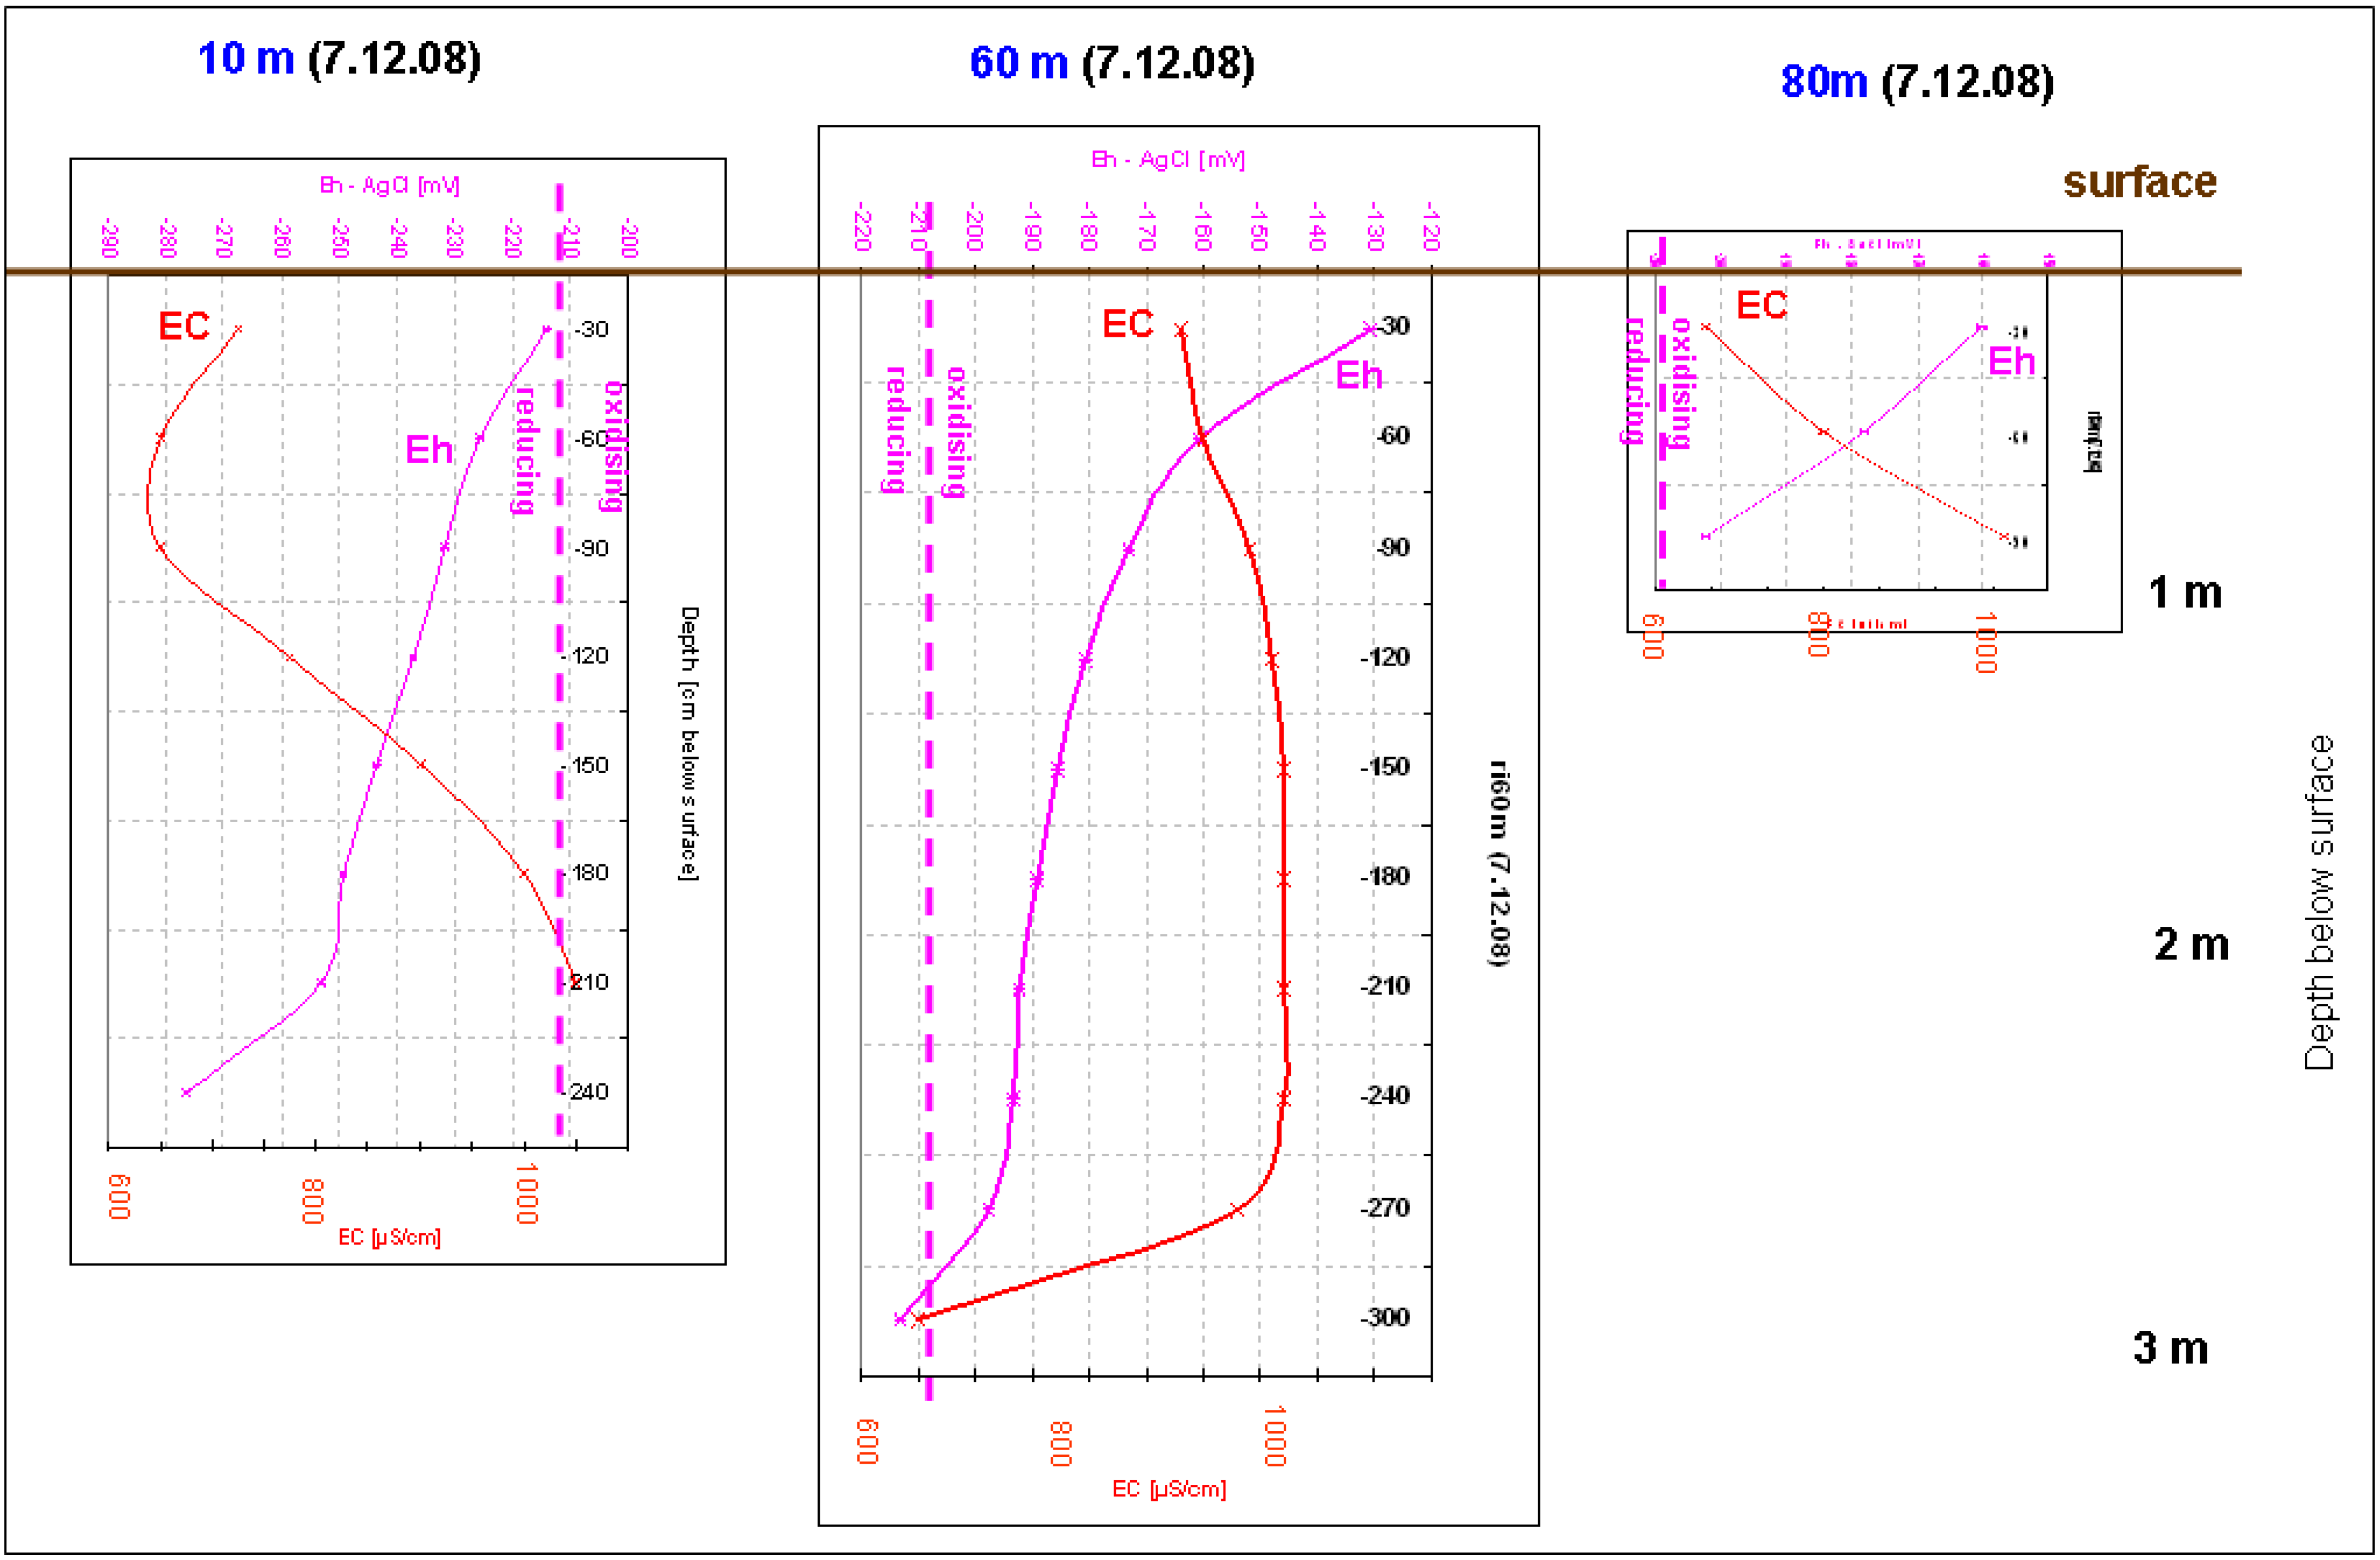
On-site measurement of vertical EC and Eh-profiles in all three boreholes suggest that the pore water quality of the peat differs along the transect. In all boreholes (BH), the EC was found to generally increase with depth by 100–400 µS/cm, reaching the maximum level of approximately 1,100 µS/cm in about 1 m depth at the borehole furthest away from the stream (BH ri 80 m) and at ca. 2 m closest to the river (BH ri 10 m). The EC in BH ri 60 m reaches this maximum at around 1.2 m (Figure 20).
The EC maximum at the three boreholes of approximately 1,050 µs/cm appears to occur at different depths below surface. It is the shallowest in the borehole furthest away from the stream (ri 80 m: at 1 m below surface) and occurs at a similar depth (1.2 m below surface) at adjacent borehole ri. 60 m (which is 20 m closer to the stream). In the latter borehole, the EC stays almost constant on the high level to a depth of 2.4 m below surface before dropping abruptly. This peculiar EC profile could perhaps indicate that polluted water is confined to a certain, 1.2 m-thick, sediment layer. In the near-stream borehole (ri 10 m) the EC maximum only starts at a depth of 2.1 m. Projecting the depth where the EC maximum occurs in the near-stream borehole to the two far-stream ones indicates a consistent dip towards the stream. This may reflect the dip of possible sediment/peat layer underground that perhaps facilitates the flow of polluted water across the wetland into the stream.
Figure 20. Vertical gradients of the EC and redox potential (Eh) in peat porewater as measured in boreholes of the transect at portion 9.
Water 03 00356 g020
The fact that the EC minimum in the far- and near-stream boreholes (around 650 µS/cm) is below the EC of the adjacent stream (~740 µS/cm) suggests that there is little if any stream water infiltrating into the peat during normal flow conditions. This is also confirmed by the reducing conditions in the near-stream borehole, suggesting the absence of well oxidized stream water. In contrast, groundwater in both far-stream boreholes displays oxidizing conditions, which could be indicative of stream water from the nearby Mooi River as a possible source (Figure 20).
(c)
Event-related porewater dynamics: Flushing event (9 September 2007)
An artificial increase of water levels in the stream caused by additional water from the eye that had to be routed into the wetland due to maintenance work in the irrigation canal, provided a good opportunity to assess how far rising stream water levels may allow the surface water to infiltrate into the adjacent peat deposit. In contrast to rain events that are normally responsible for rising stream levels, at this event no accompanying infiltration of rainwater could possibly impact on the observed pore water levels leaving the stream as the only factor to explain possible pore water level changes. 
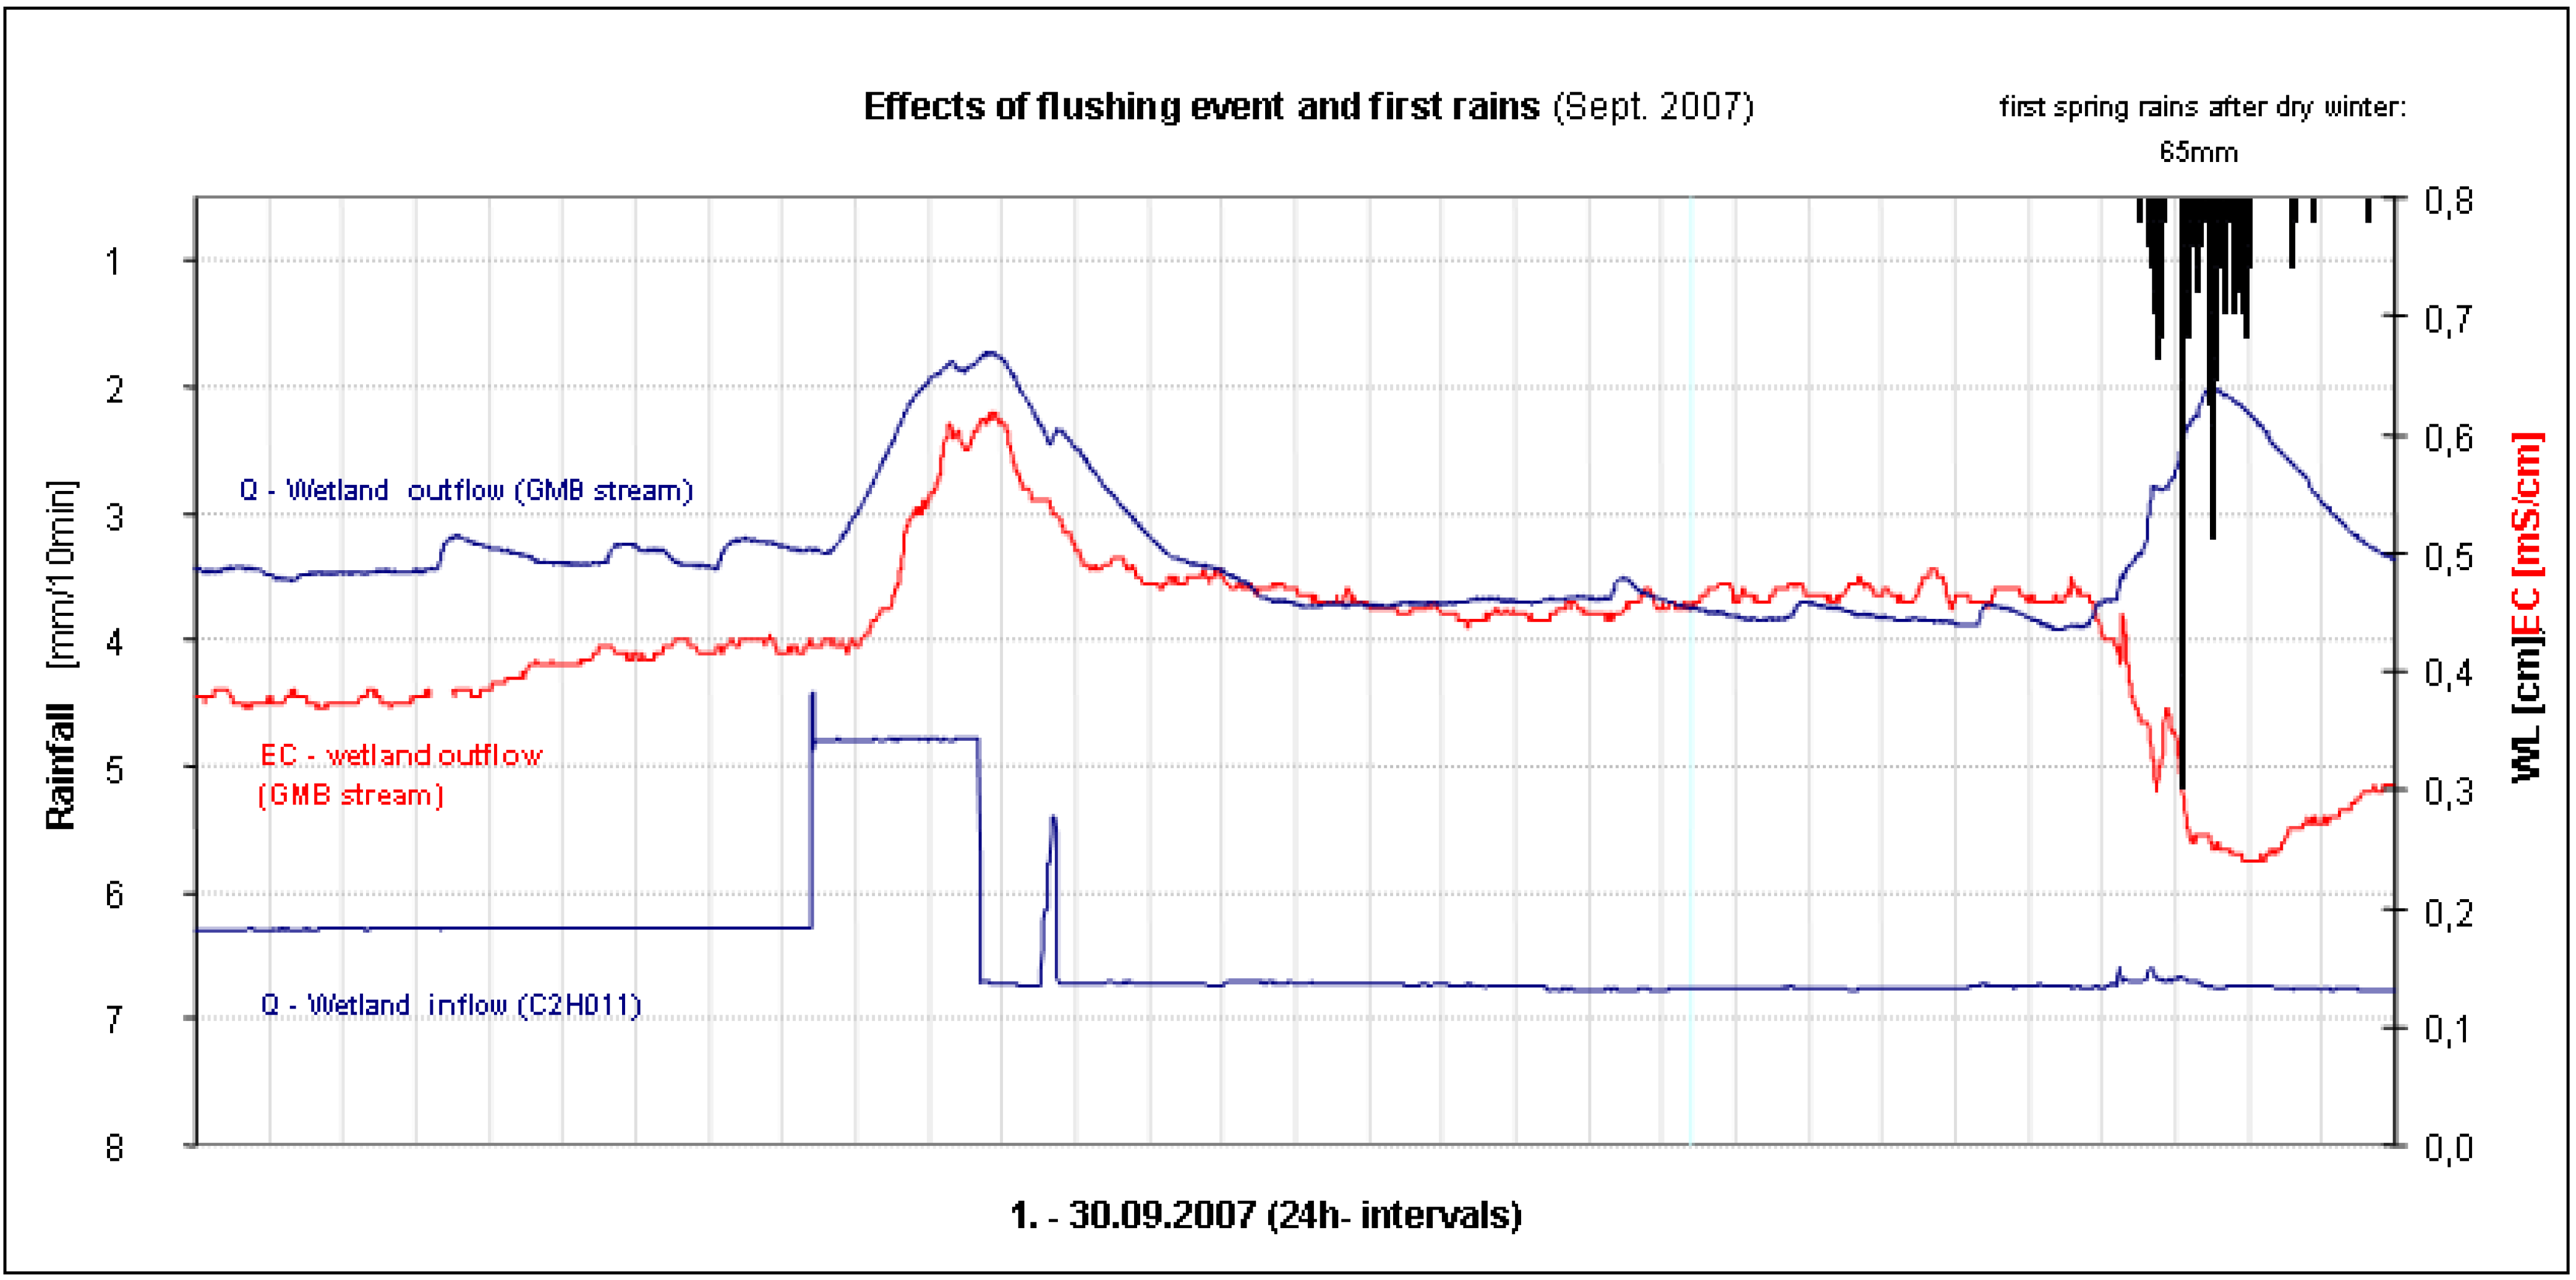
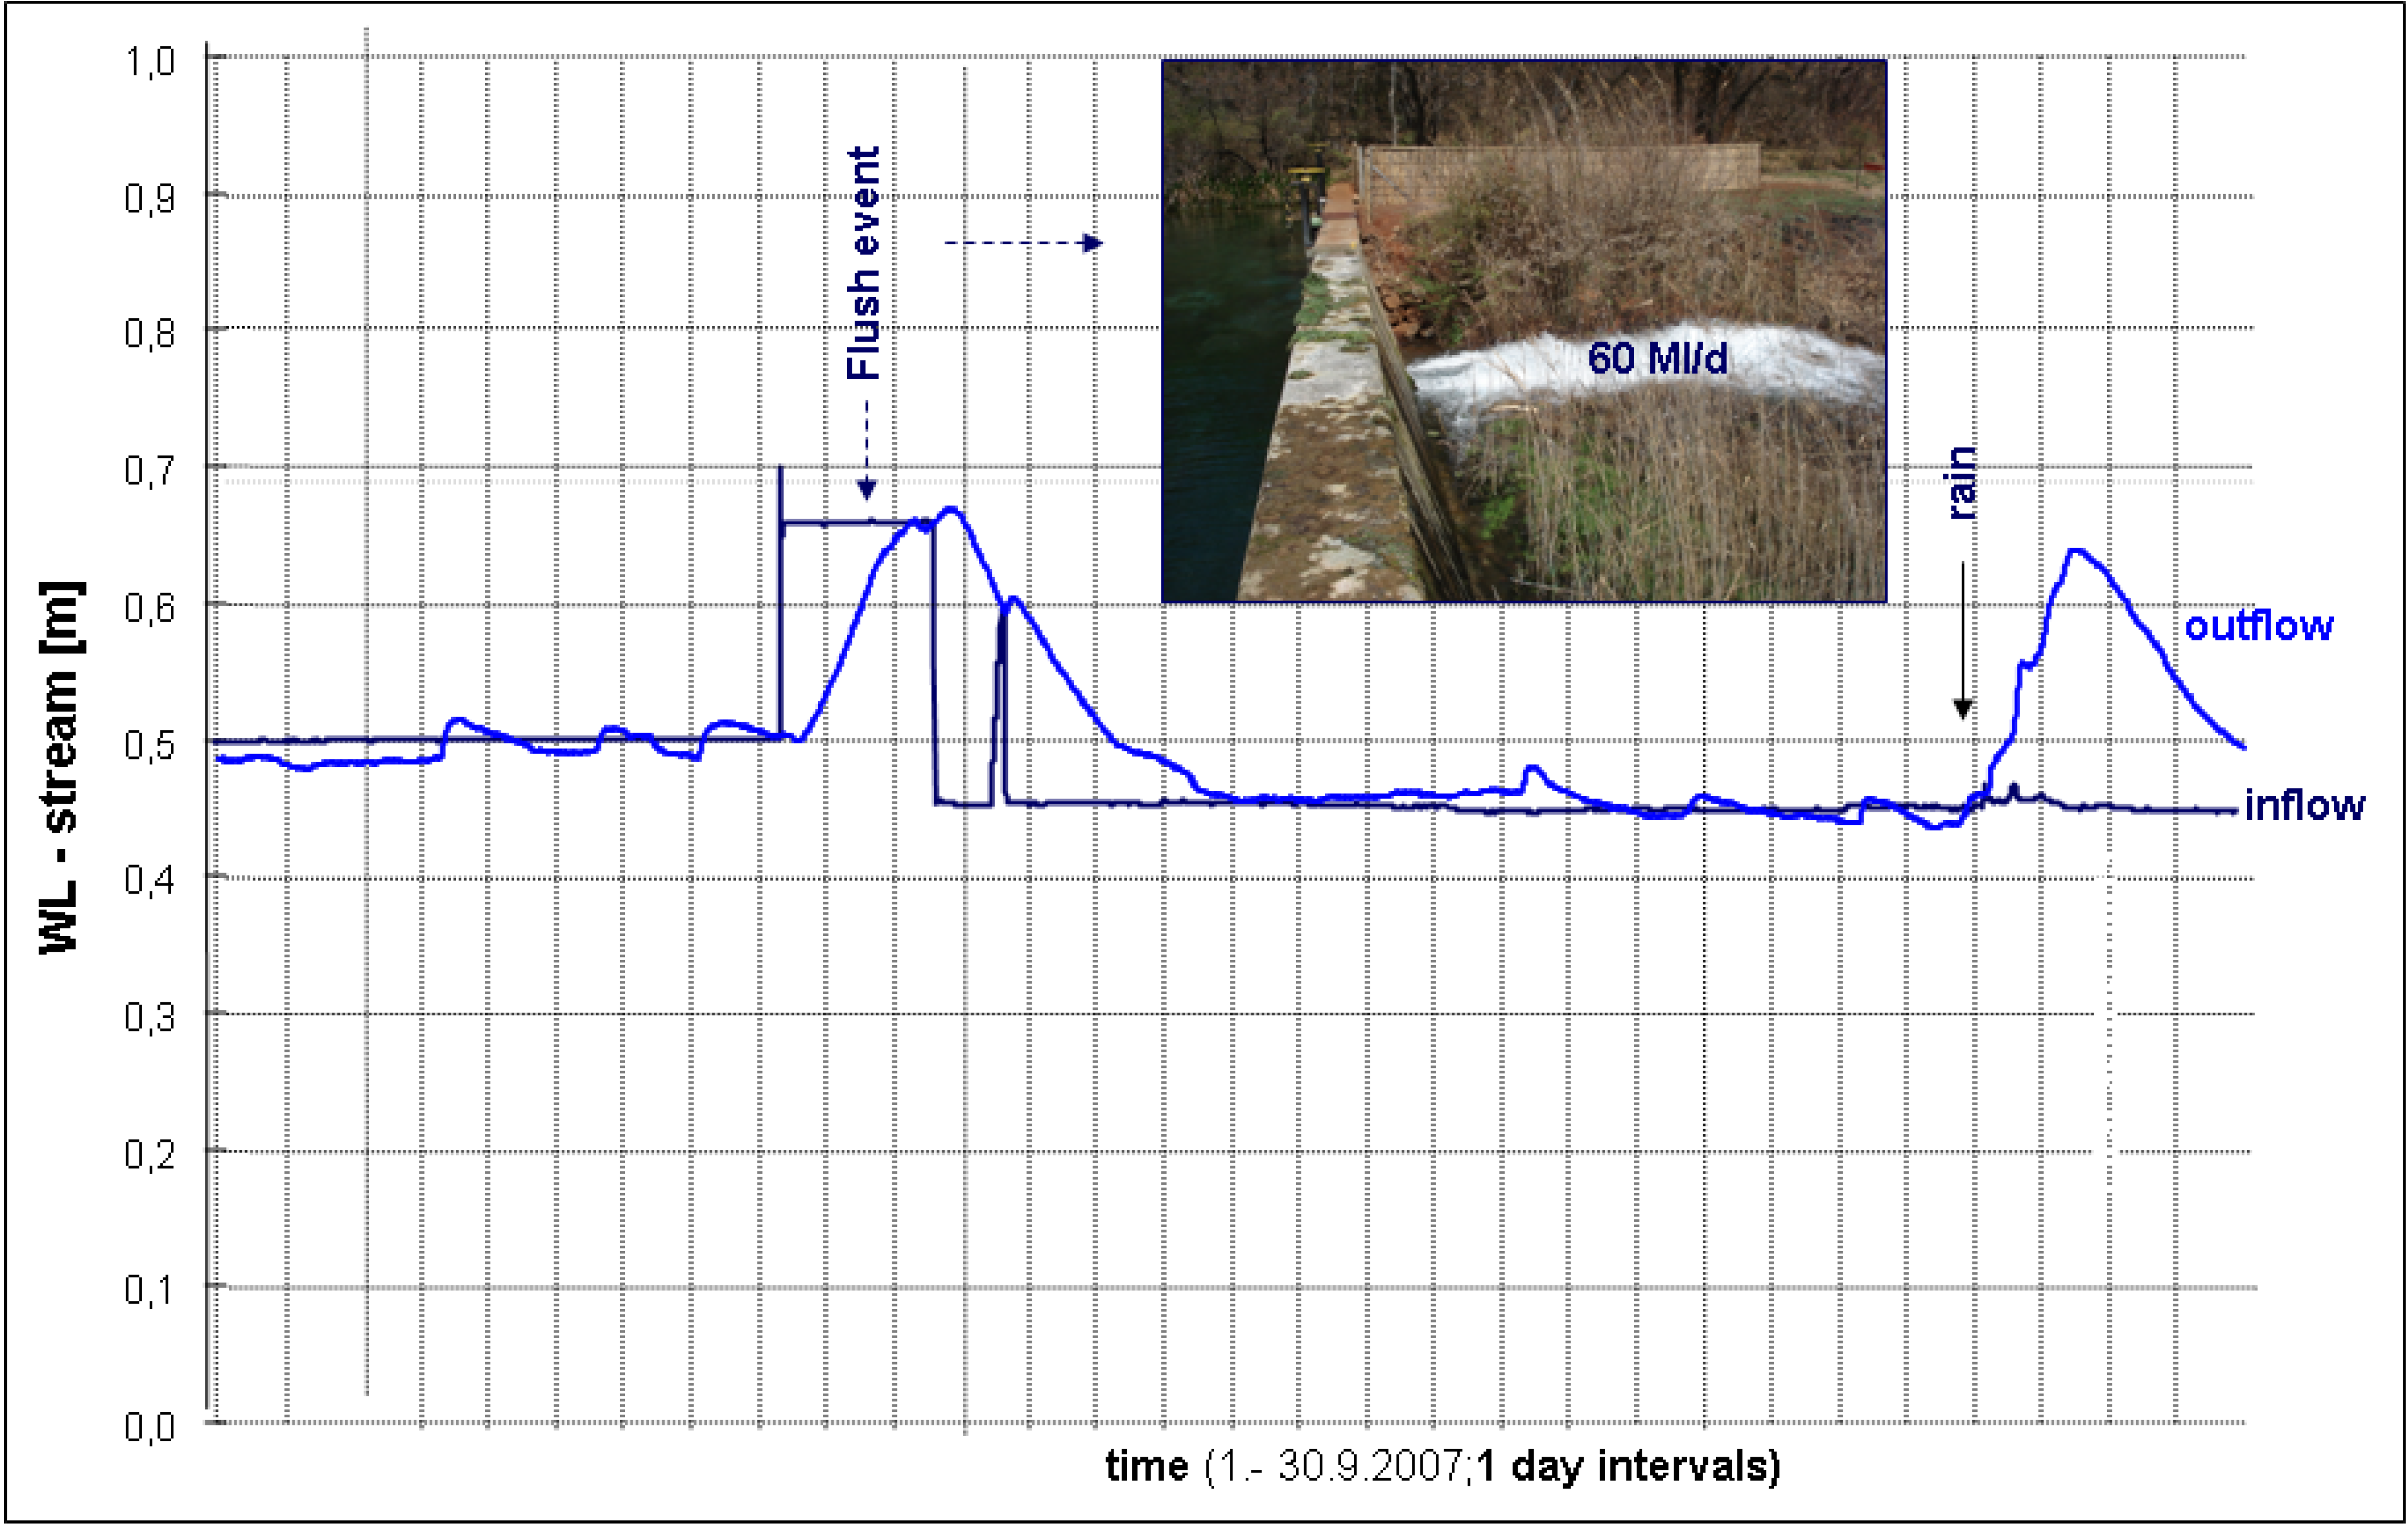
Figure 21 shows how the temporary increase of surface water inflow into the wetland (displaying a typical rectangular shape caused by the immediate response of the water level to the opening and closing of the sluice gate at the dam wall) is reflected by a delayed and smoothed water level rise at the outflow of the wetland, reaching peak flow more than two days later.
Figure 21. Changes in water level and EC of the GMB stream at the outflow of the wetland in response to the discharge of additional water into the wetland (flushing event) and the first spring rains (September 2007).
Water 03 00356 g021
With a distance between the in- and outflow of 3,247 m (±2% inaccuracy) and a time lag between the first discernable water level rise at both points of 5 hours and 50 minutes (±10 min resolution uncertainty and possible time deviations between the dataloggers of maximum 5 min.), the average flow velocity following the release of the water is approximately 0.15 m/s (±0.01 m/s). However, the different shapes of the hydrographs indicate that some of the released water did not flow straight down to the outflow (as it would, for example, in a concrete canal) but went elsewhere. While the flow peak at the sluice was reached immediately (straight vertical hydrograph) and maintained for the whole period of 2 days and 7 hours (straight horizontal graph), at the outflow the peak only occurs more than 2 days (58 h:40 min) later, lasting only a short period time (Figure 21). It is, therefore, likely that a certain volume of the water flushed into the wetland (a total of approximately 80 ML/d consisting of 20 ML/d of base-inflow and 60 ML/d diverted from the irrigation canal) initially filled the available pore space in the vadose zone of alluvial sediments (unsaturated zone, similar to what is known as ‘bank storage’ [14,15]) and possibly also inundated somewhat higher lying areas in the in the micro-relief of the adjacent floodplain.
The latter assumption may be supported by the accompanying rise in EC that almost mirrors the water level increase at the outflow. Since certain areas in the wetland have been covered by salt crusts that formed during the preceding (dry) winter months, their dissolution upon contact with water flooding parts of the crust covered areas may explain the rising EC (Figure 21).
With increasing contact to sediments likely to occur during this phase, some of the floodwater may be filtered (depending on the mode of the water–sediment contact e.g., intra-sediment porous flow vs. saturated overland flow). Following the initial flooding, the occurrence of the flow peak at the outflow station indicates a turning point when stream water levels start to fall again and receding water from flooded areas returns to the stream. With a falling limb of the hydrograph of almost three days (68 h:48 min) this phase is somewhat longer than the filling-up phase (i.e., rising limb of the hydrograph), which lasted just over two days (53 h:20 min). Assuming that this time difference (here termed ‘excess time’: 15 h:28 min) is caused by water that was stored in the vadose zone of sediments and therefore released more slowly than water flowing back on surface from flooded areas, it could be used to semi-quantify the storage capacity of the peat and wetland sediments (the so-called ‘sponge effect’). Assuming similar volumes for water level changes at both gauging points (a very rough first approximation as both stations do not have reliable rating tables), the volume of water released during the excess time (=sponge effect) accounts for approximately 10% of the total water volume released over the flushing period (Figure 22).
Figure 22. Comparison of water level changes in the Gerhard Minnebron stream at the inflow and the outflow of the wetland as observed during a flushing event and first spring rains.
Water 03 00356 g022
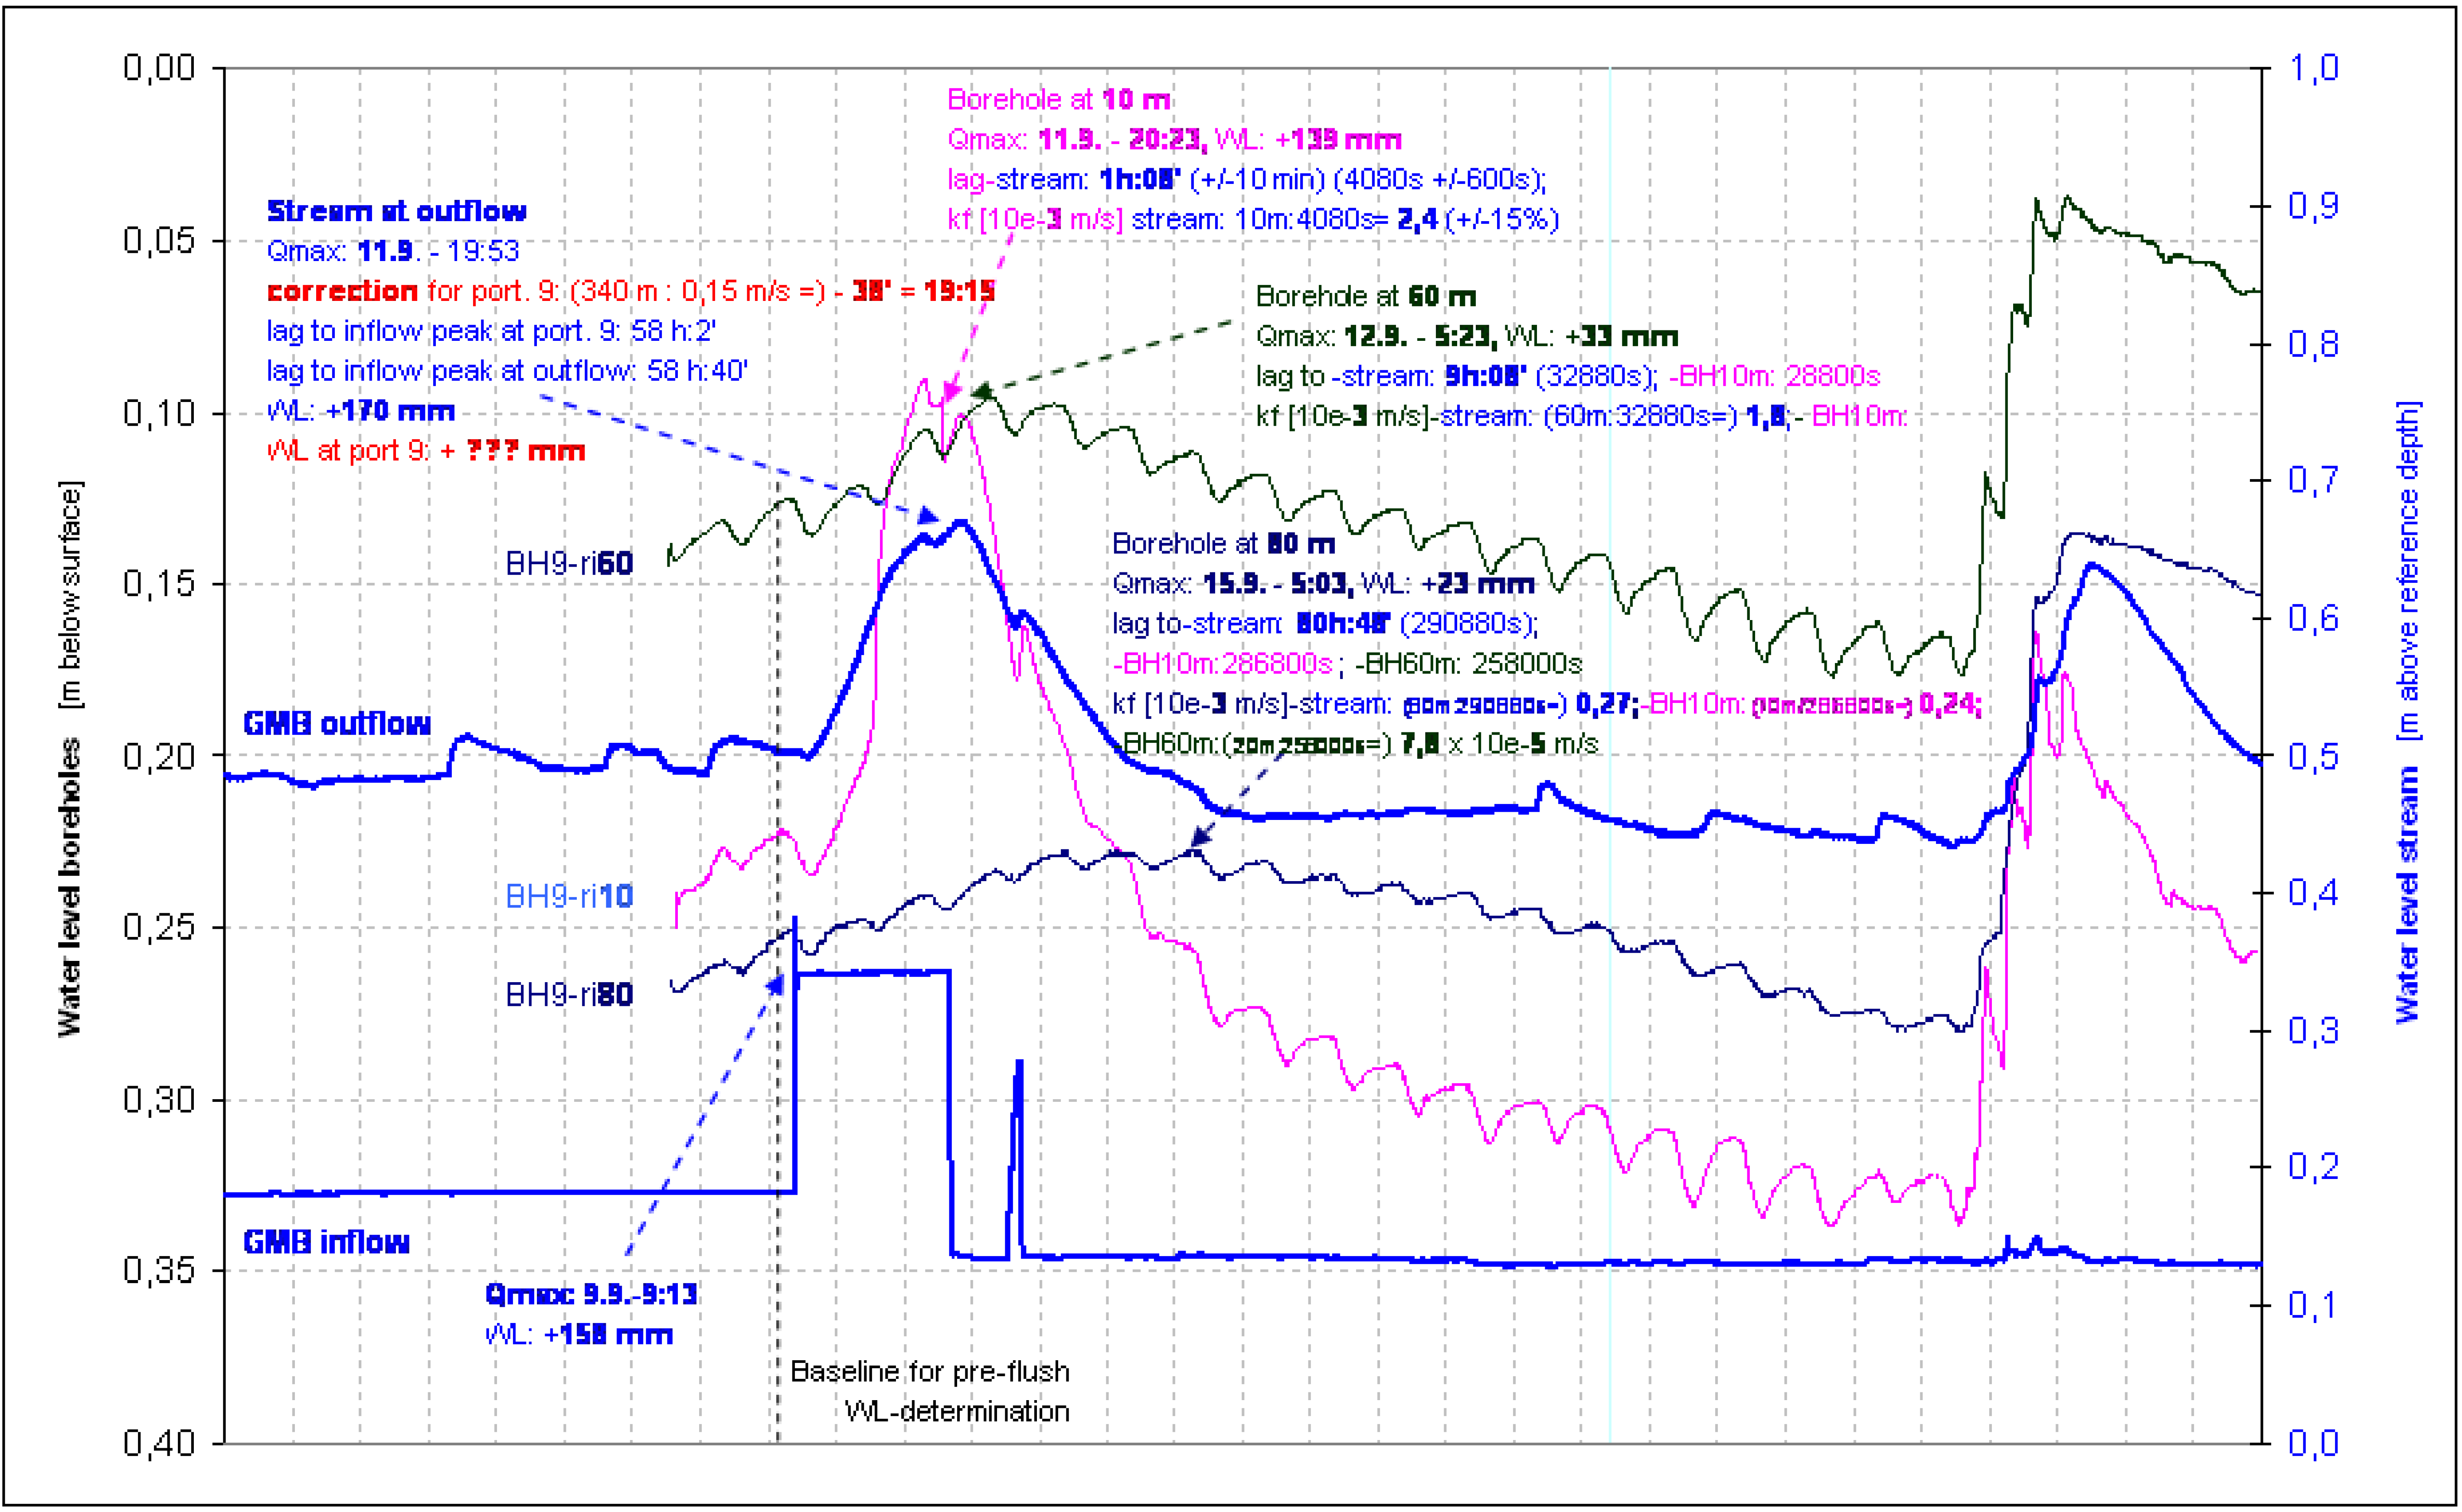
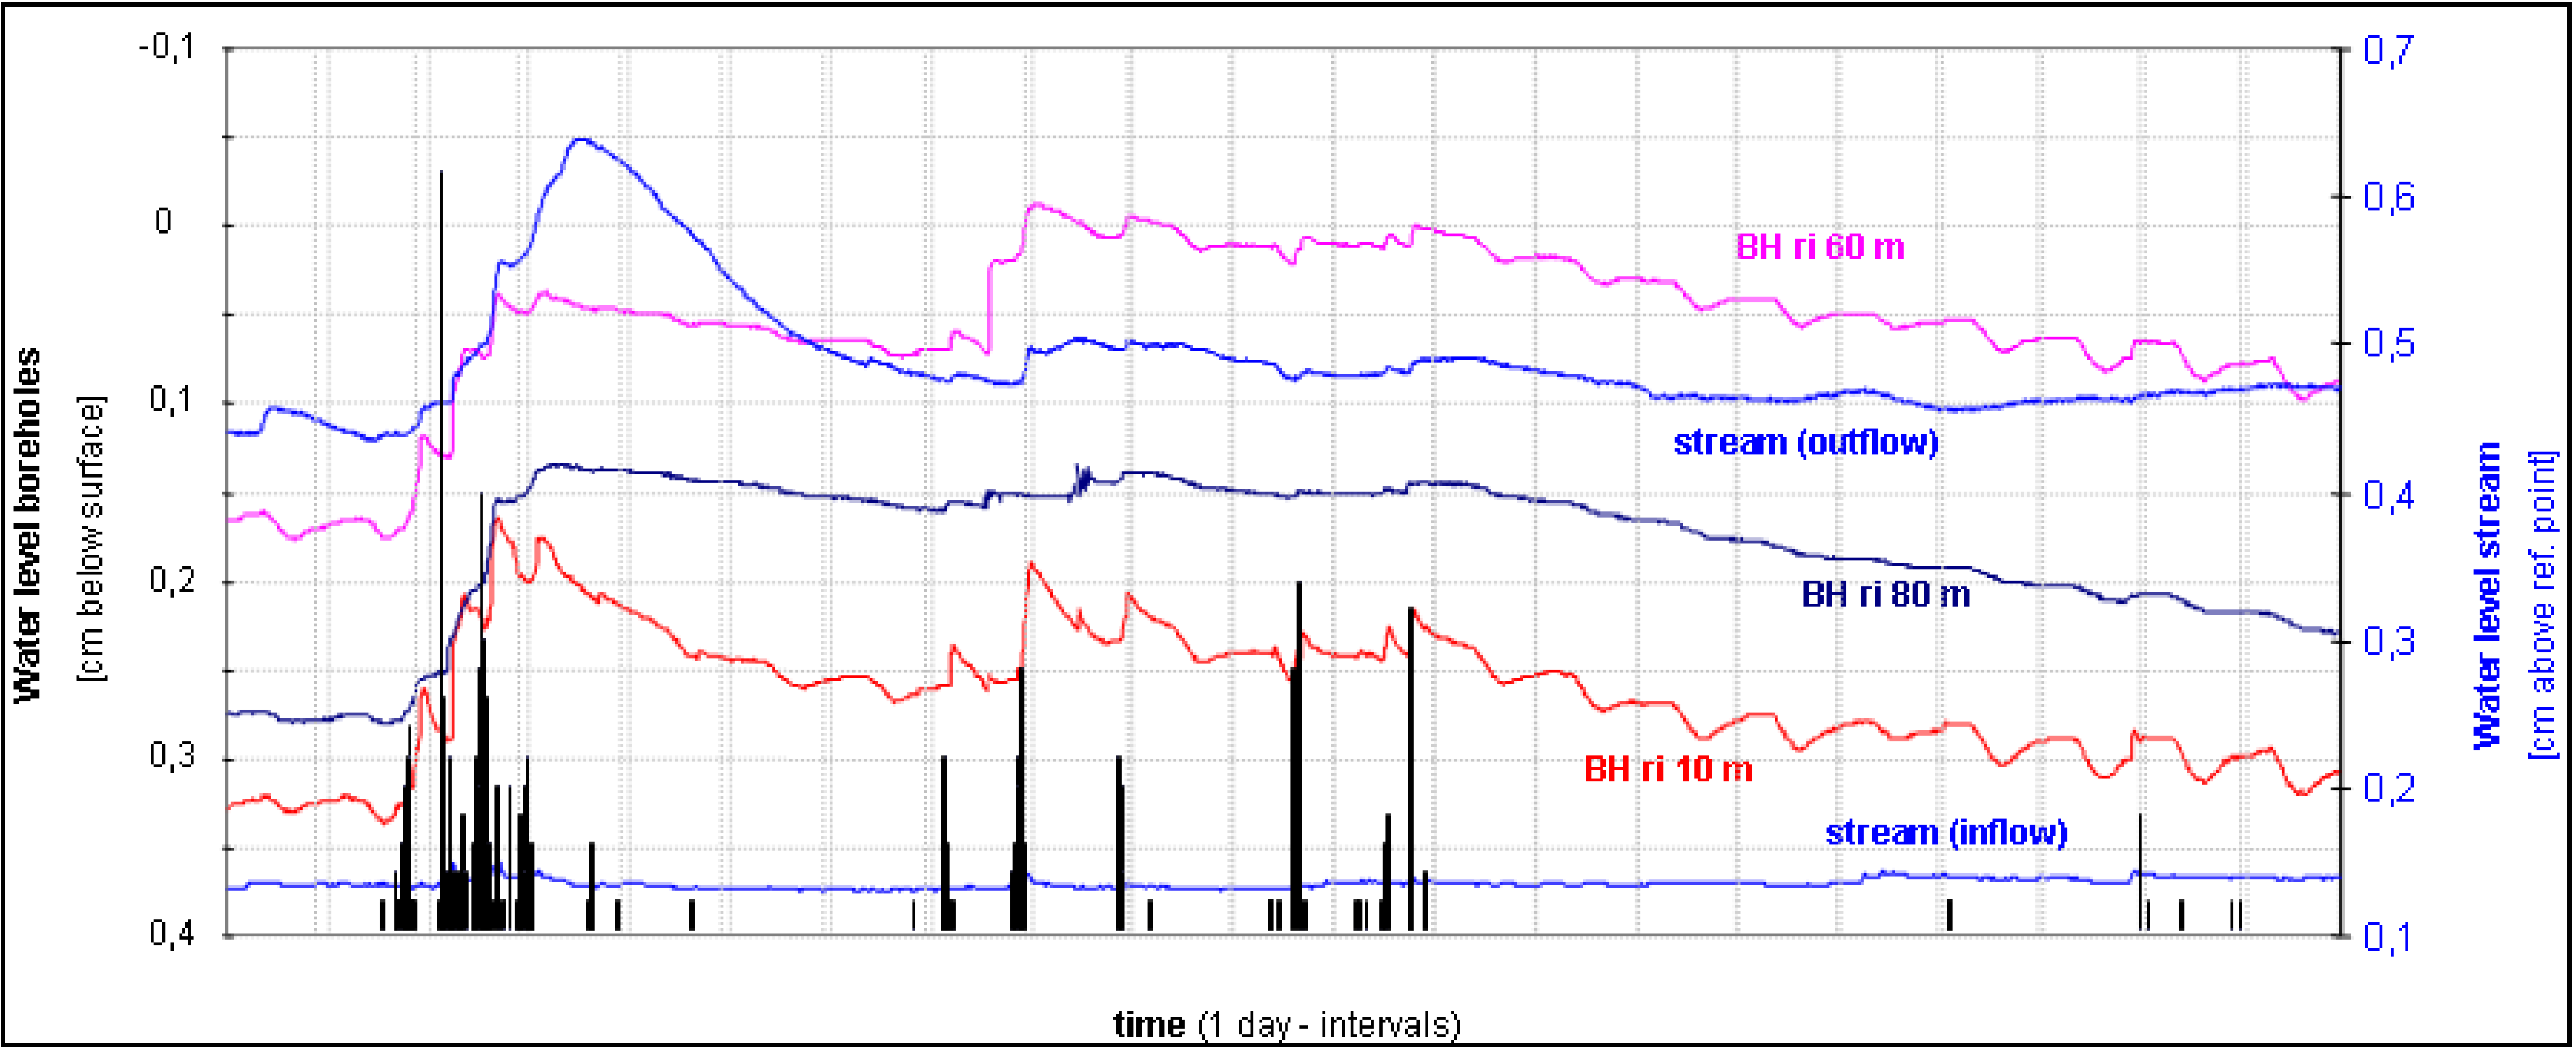
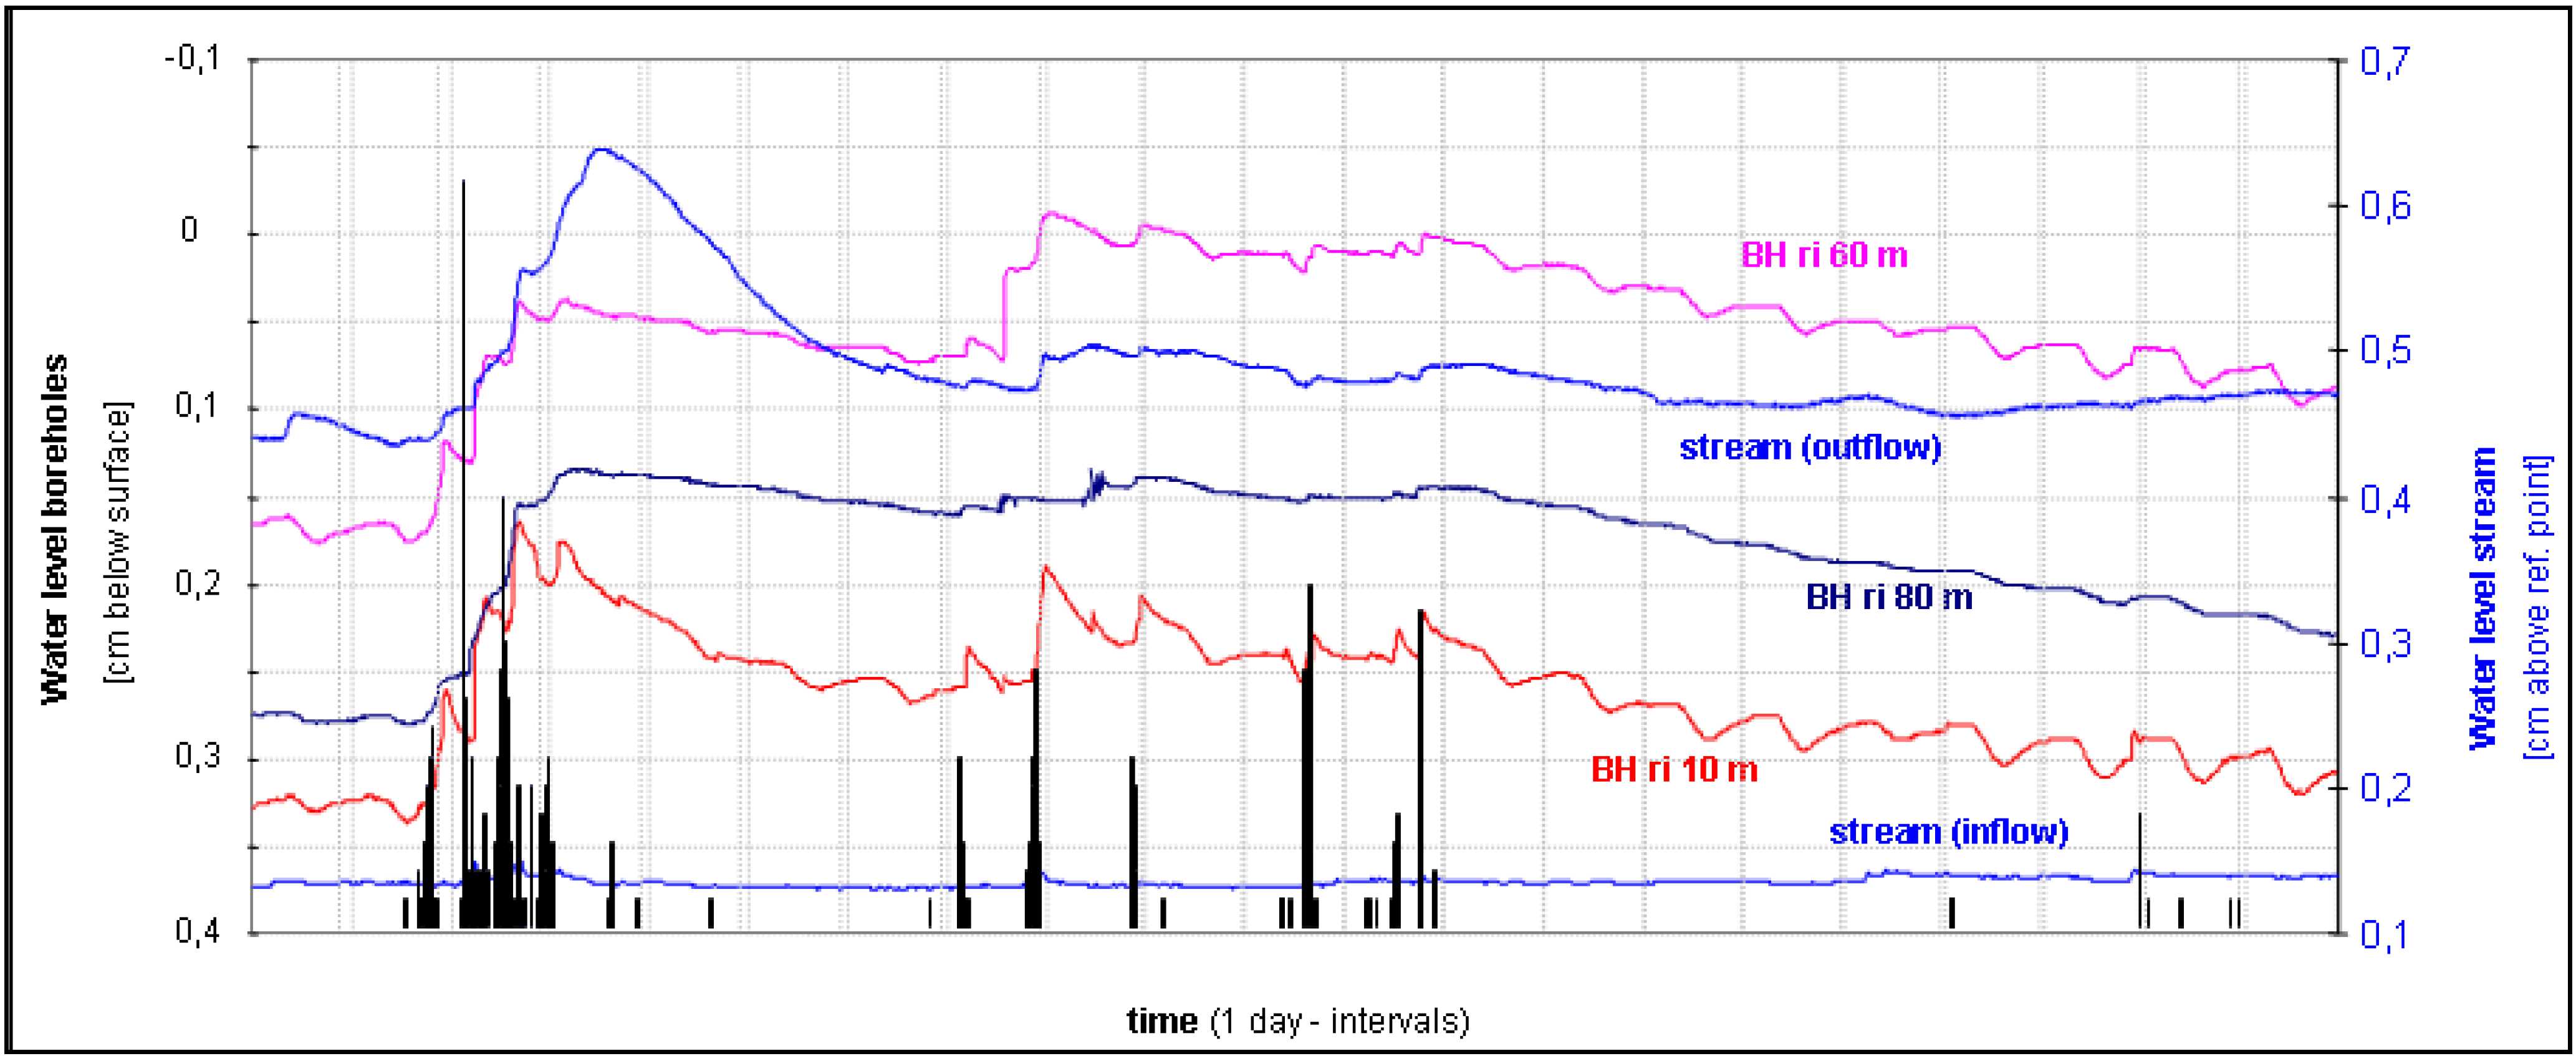
Analyzing corresponding water level changes in the borehole transect at portion 9 indicated that all boreholes responded to the rise in stream level with an increase (Figure 23).
Figure 23. Peat porewater level changes at the transect at portion 9 in response rising water levels in the adjacent stream during a flushing event (note the different scales of the double Y-axes slightly exaggerating borehole fluctuations compared to stream level changes).
Water 03 00356 g023
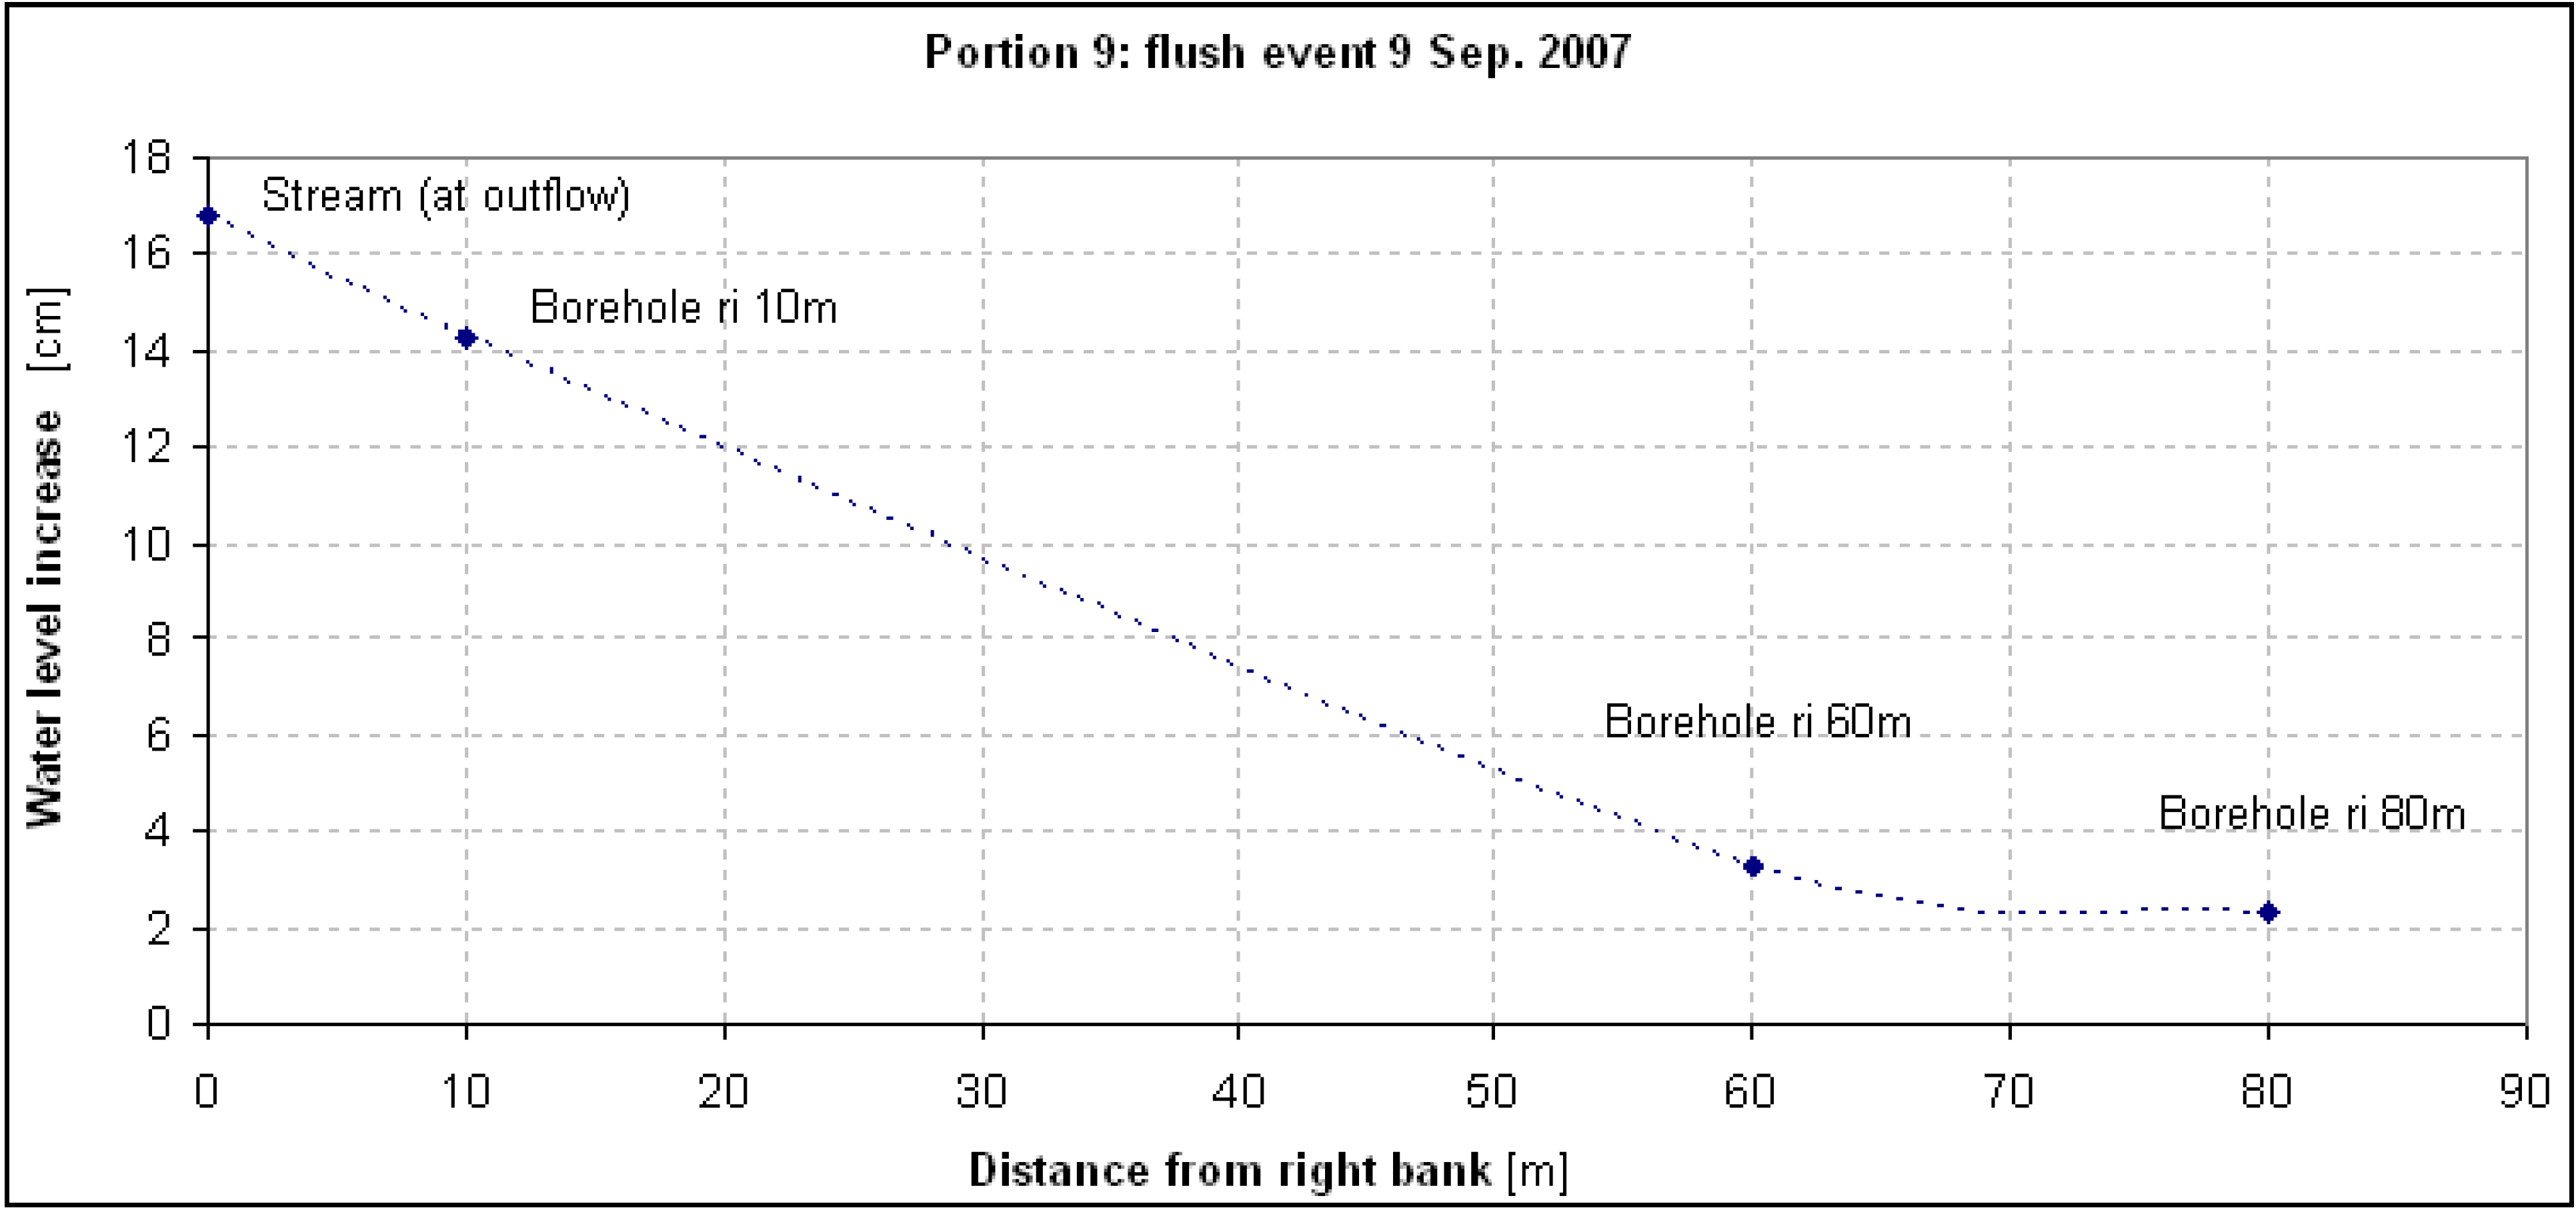
The most pronounced increase corresponding to the peak flow in the adjacent stream was observed in the near-stream borehole (i.e., BH ri 10 m) displaying an increase of 133 mm compared to 158 mm and 170 mm stream level rise at the inflow and outflow stations, respectively. Since the outflow is some 340 m below the borehole transect of portion 9, the stream level rise at the transect may differ depending on the stream channel geometry at the site. However, comparing the different stream channel geometries of the inflow (gauging weir C2H011) and the outflow, the possible difference is likely to be marginal. Thus, the response of near-stream peat porewater (formed by alluvial groundwater) is only slightly weaker than the original stream level change. With growing distance from the stream the magnitude of the corresponding rise in groundwater levels in the peat decreases to 23 mm at BH ri 80 m (80 m from the stream bank; Figure 24).
Figure 24. Relationship between the increase water levels in boreholes and their distance from adjacent stream indicating that the rise in groundwater level associated with rising stream levels is highest near the stream and decreases non-linearly with increasing bank distance.
Water 03 00356 g024
A similar pattern was observed when the time-lag between the initial water rise in the stream and the associated increase of groundwater levels in the peat was compared. As was to be expected, the time lag is shortest in the near-stream borehole and increases towards the edge of the wetland. Using the distance to the stream and the time lag between the stream level rise and subsequent groundwater response in the boreholes, the (lateral) hydraulic conductivity of the peat under water-saturated conditions can be calculated. The assumption was made that the observed rise in water level in the boreholes was caused by stream water physically moving from the stream channel into the respective boreholes in the peat deposit and not transmitted indirectly via hydraulic pressure or piston effects. (Note: Since stream level changes are measured some 340 m downstream from the borehole transect the stream level rise at portion 9 occurred somewhat earlier than recorded at the outflow. Based on the average flow speed of 0.15 m/s, the peak flow passed portion 9 approximately 38 min earlier than the outflow i.e., at 19:15 on the 11 September 2007, Figure 24).
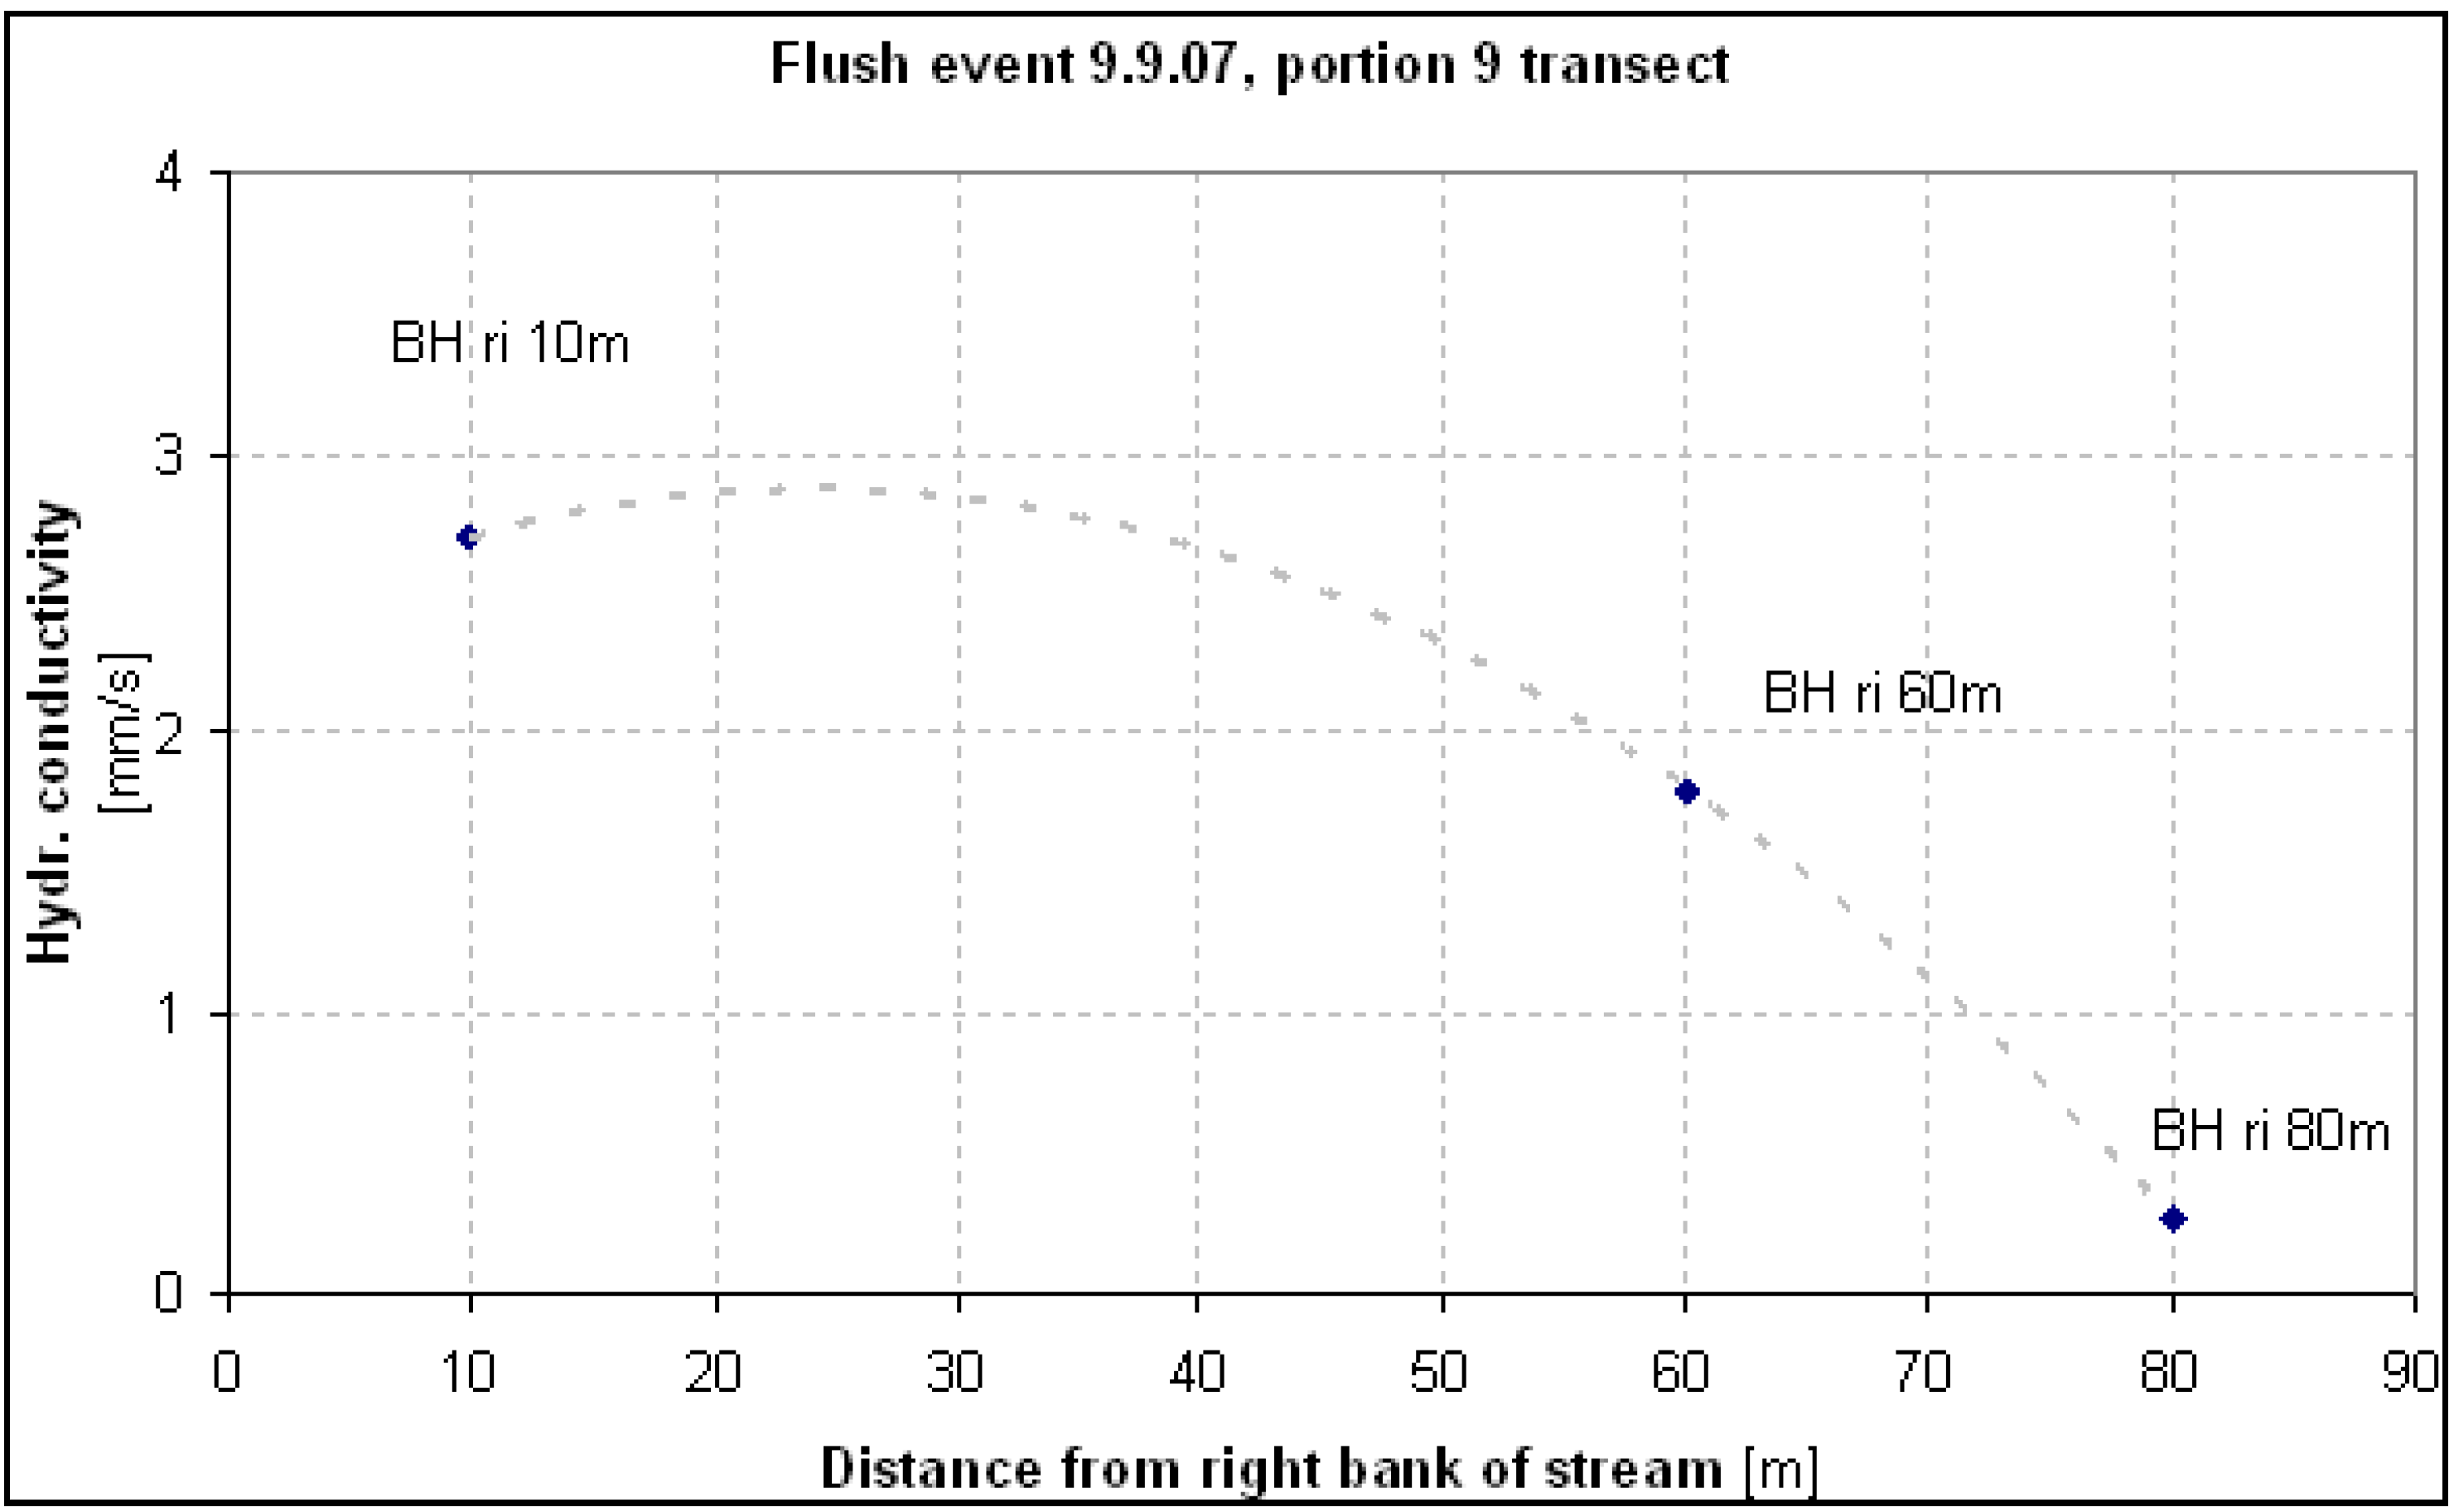
Related to the peak flow in the stream, the lateral hydraulic conductivity of the adjacent peat deposit under water-saturated conditions deposit appears to be relatively high, when compared to values determined in column experiments for the (saturated) vertical hydraulic conductivity (5.6 × 10⁻⁶ m/s) decreasing from a maximum of around 3 × 10⁻³ m/s in the near stream peat to about a tenth of this value 80 m away from the stream (0.3 × 10⁻³ m/s) (Figure 25).
Figure 25. The lateral hydraulic conductivity of peat in relation to the distance from the stream (calculated based on lags of water level responses in the boreholes at portion 9 to peak flow in the adjacent stream during a flushing event).
Water 03 00356 g025
Calculating the water permeability (kf-value) for the peat between the three boreholes by using the respective differences in time and distance, largely confirms the values calculated for peat between each borehole and the stream (Figure 23). However, for the peat located between the boreholes ri 60 m and ri 80 m, a significantly lower kf-value resulted (7.8 × 10⁻⁵ m/s). Compared to the overall permeability for the peat between BH ri 80 m and the stream of 2.4 × 10⁻⁴ m/s, this is 30-times lower. In this context, it may be important to note that borehole BH ri 80 m is just over 1 m deep compared to the well over 4 m depth of the other two. Should, for some reason, much of the lateral water movement from the stream into the peat occur in layers deeper than 1 m, that part of the water in borehole ri 80 m would have to move up vertically for the observed water level to increase. Since the vertical hydraulic conductivity of peat, as determined in column experiments, has been found to be considerably lower than the lateral one, this could be the reason for the significant delay in water level response between borehole ri 60 m and ri 80 m.
(d)
Event-related porewater dynamics: first spring rain (26 September 2007)
The flushing of the wetland with water diverted from the irrigation canal (‘flushing event’) was followed two weeks later by the first spring rains (26–28 September 2007), with 65 mm over about three days (Figure 21). Compared with the flushing event, the associated increase in flow at the inflow station is almost negligible while at the outflow the rise in water level is nearly as high as during the flush event with a very similar overall shape of the hydrograph (Figure 21). This differential allows an estimate to be made of the runoff in the wetland catchment area in a first order approximation assuming that the rain caused similar peak flow and overall volumes to the flushing event, when over two days 60 ML/d were released into the wetland (totaling 120 ML for the whole event). Using GIS, the surface catchment area of the wetland was determined to be 4.0 km2, of which the majority is located upstream of the eye and draining into the upper-most part of the wetland just below the inflow gauging weir (
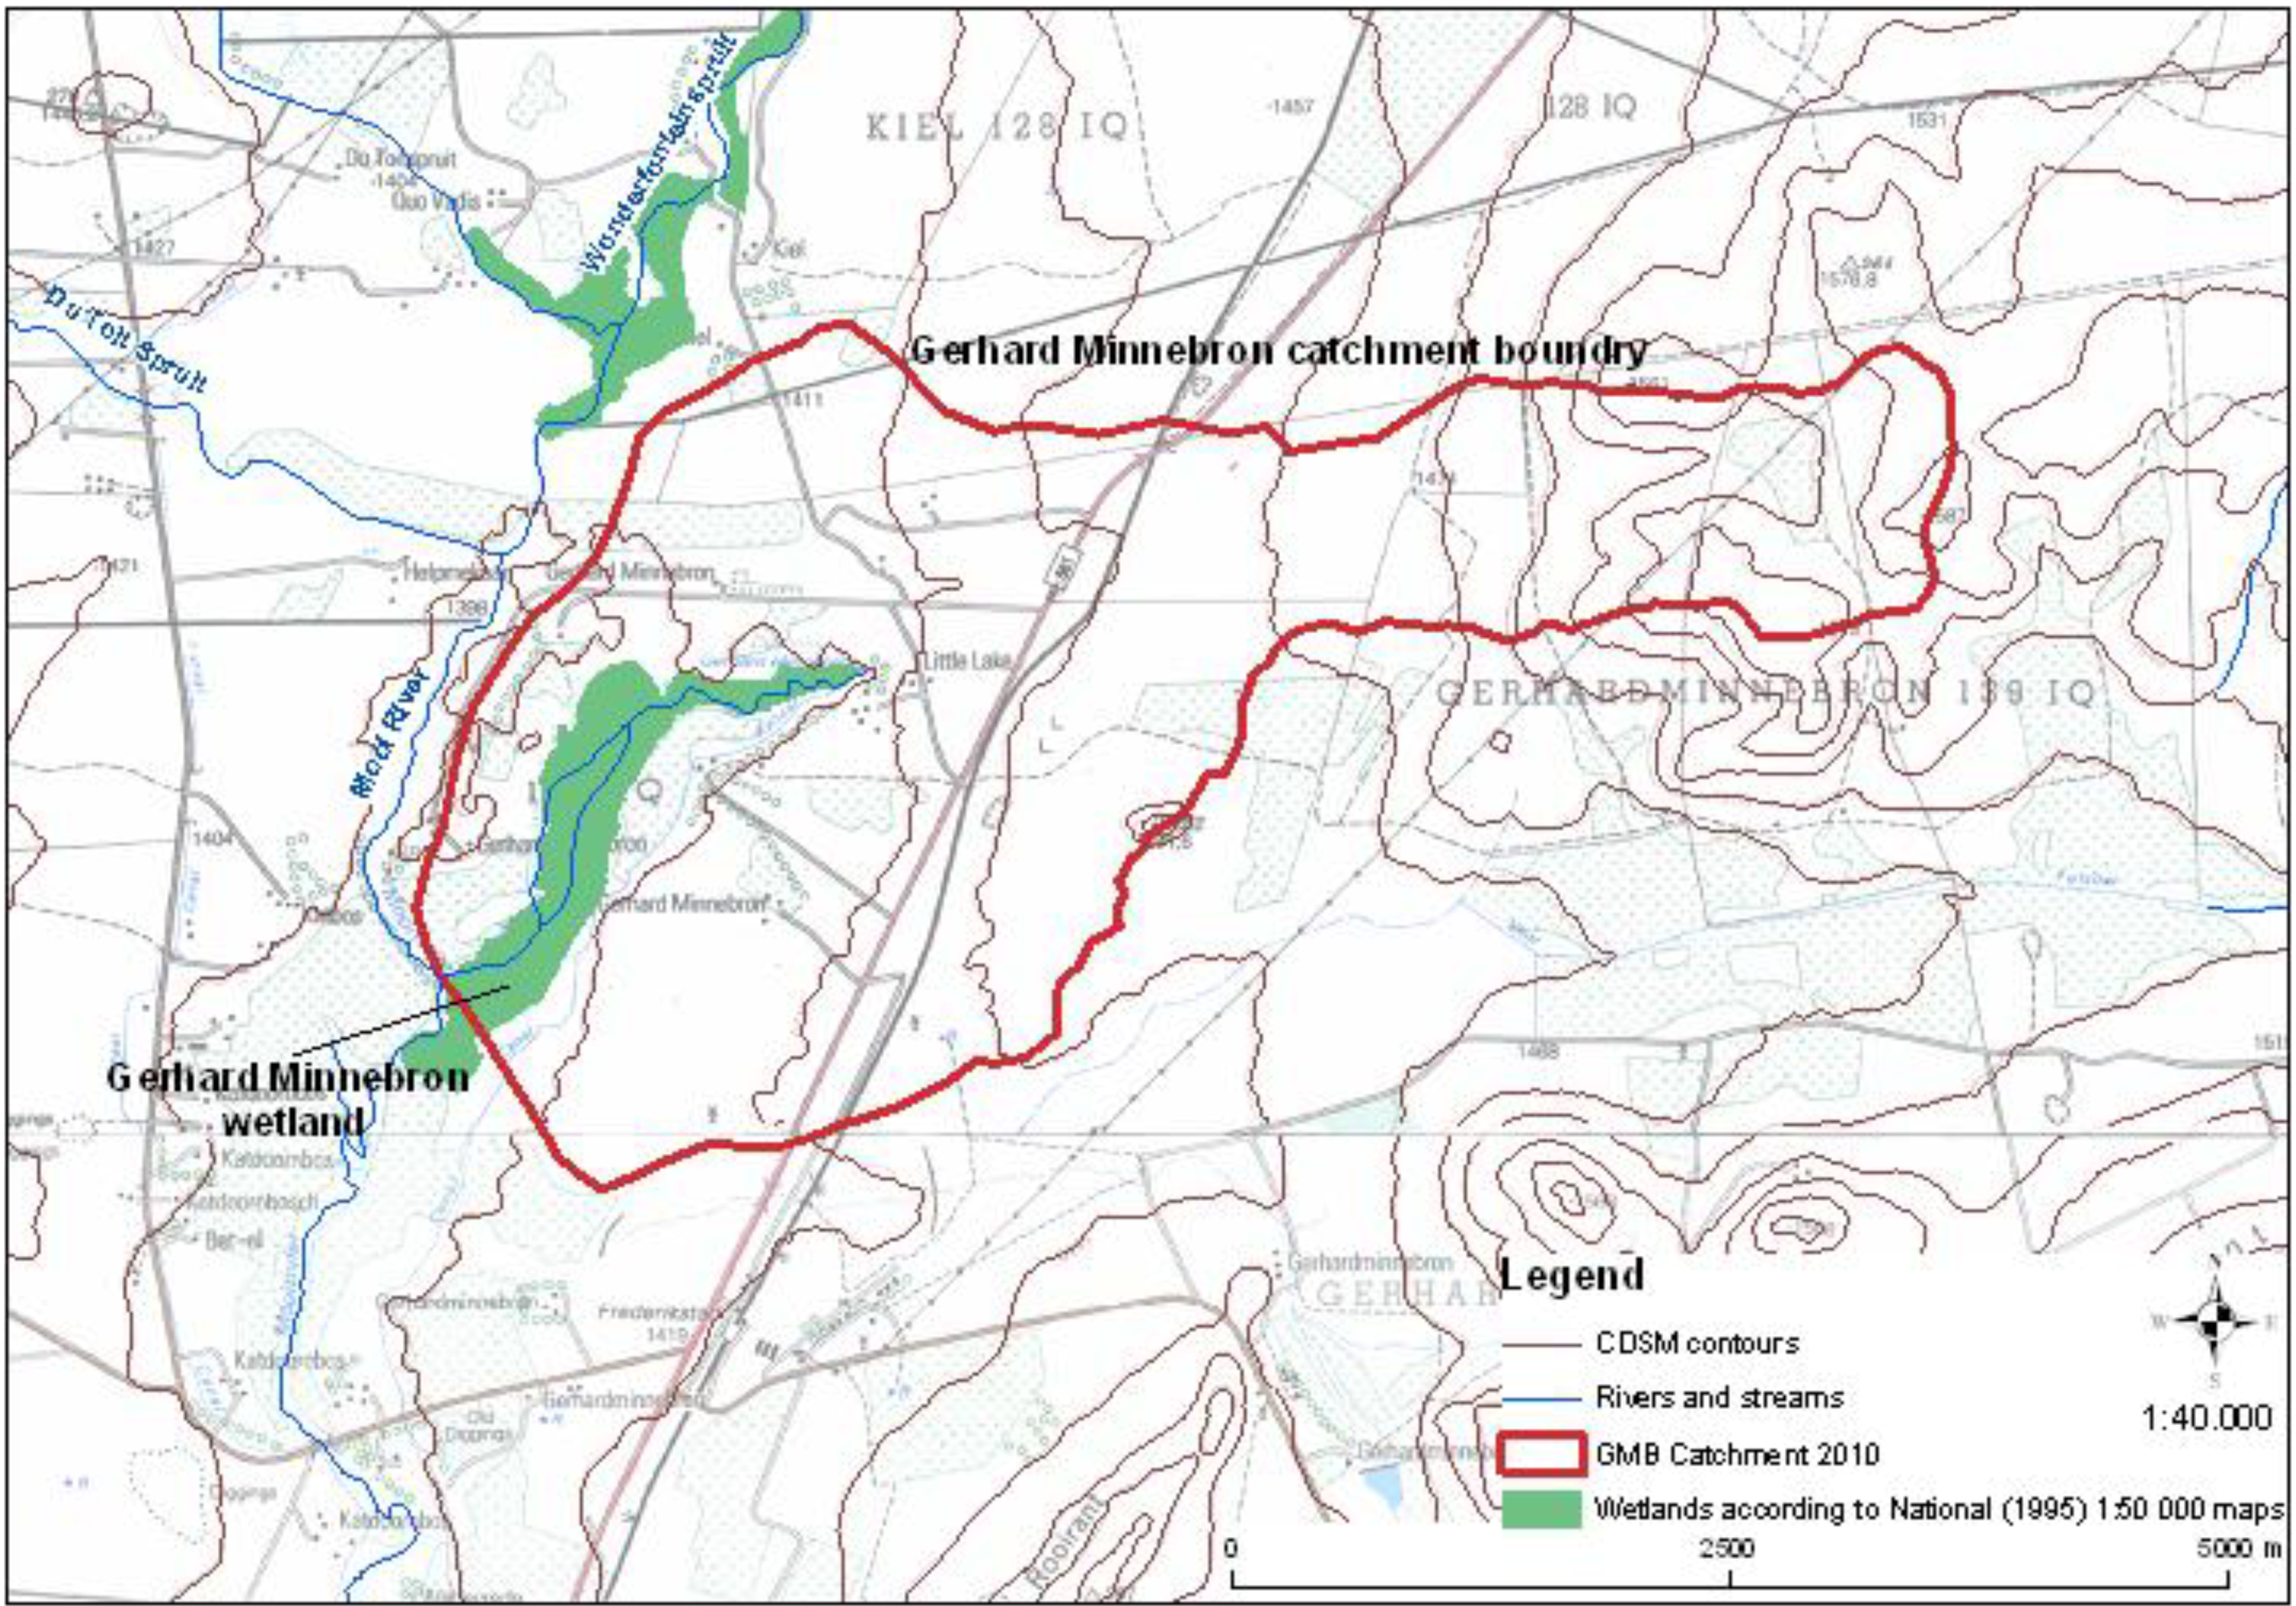
Figure 26).
Figure 26. Surface catchment area of the Gerhard Minnebron wetland (GIS: [8]).
Water 03 00356 g026
Assuming that the rain-related stream flow increase to a maximum of 60 ML/d (totaling an estimated 120 ML for the whole rain event) was derived from runoff from the 4 km2-large surface catchment (
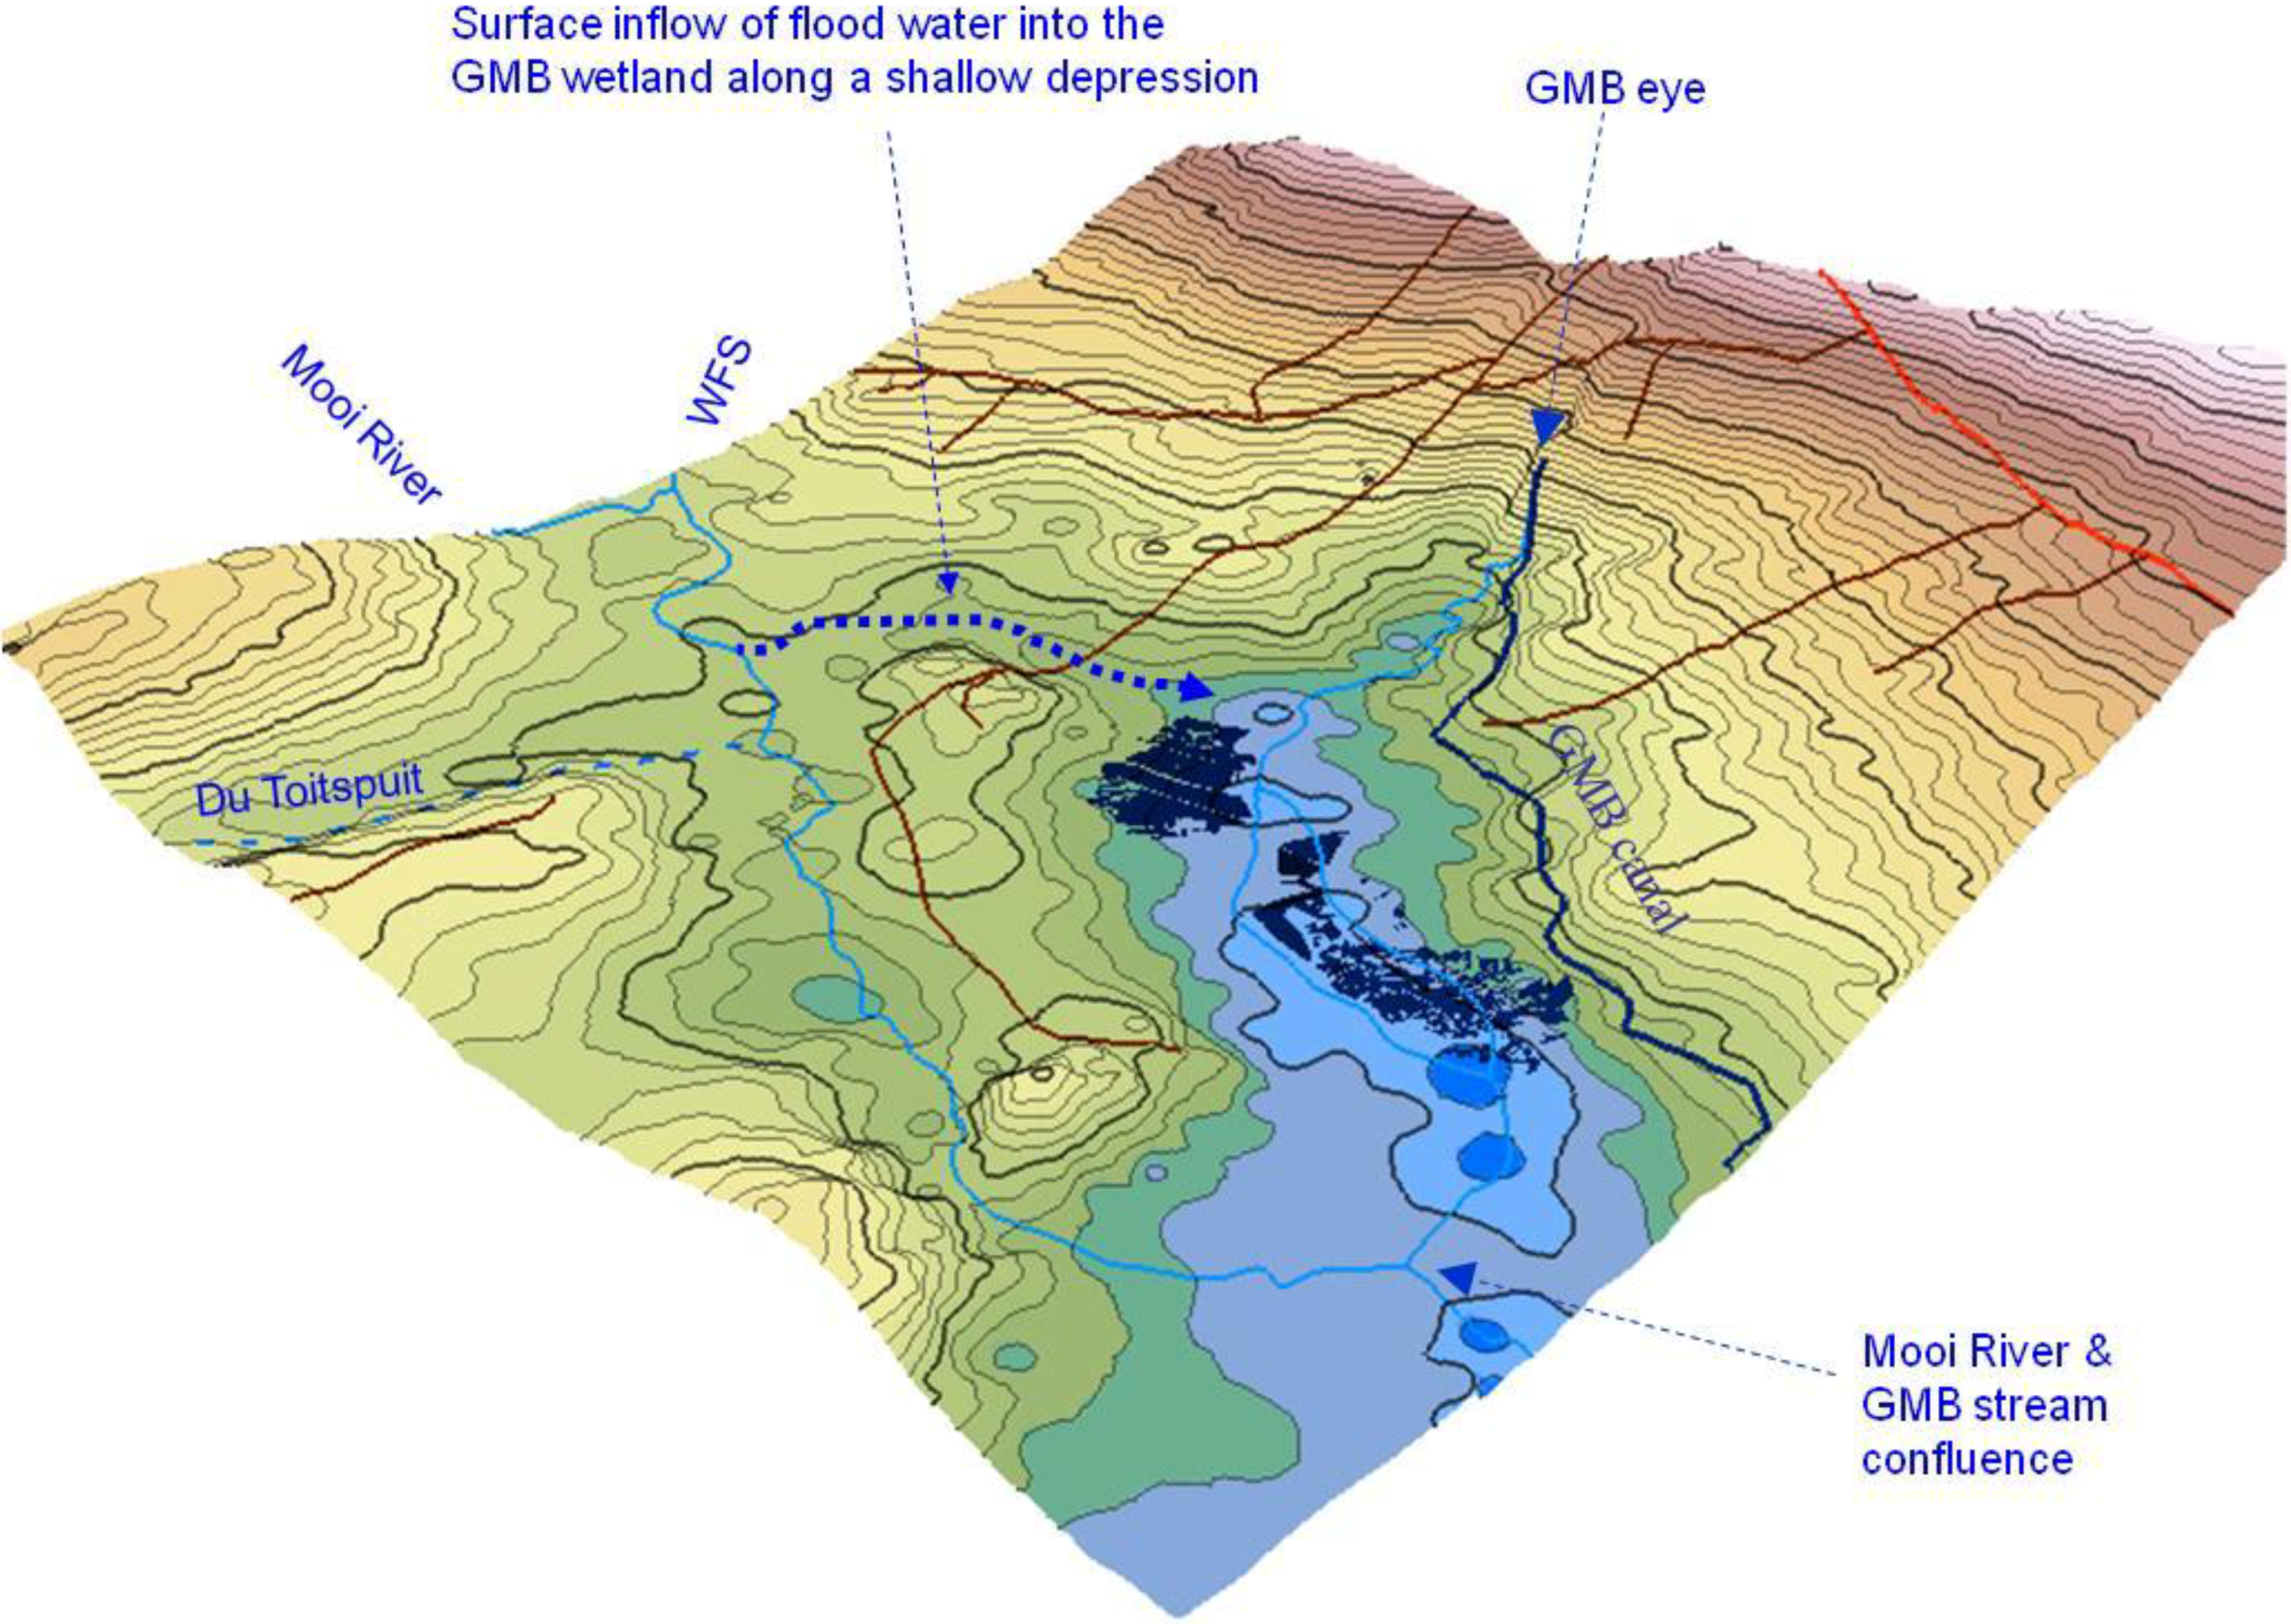
i.e., no other sources such as floodwater inflow via the shallow depression connecting the upper wetland to the upper Mooi River and Du Toit Spruit or subterranean inflow of groundwater), the 65 mm of rain resulted in a runoff of approximately 30 mm. Representing almost half of the received rainfall, the runoff coefficient for the wetland catchment (0.46) is comparatively high. This may be explained by the relative large percentage of the (comparatively small) catchment area being covered by open water and saturated or near–saturated peat and alluvial sediments allowing for rain to contribute almost without delay to the runoff. With little evapotranspiration losses during the actual rain event (the air is nearly saturated with water vapor indicated by a relative humidity of >90%) most of the remaining 54% of the rainwater most probably infiltrated into the relatively thin vadose zone of peat and alluvial sediments, thus recharging the shallow alluvial groundwater. This is supported by the swift and pronounced increase of borehole water levels at portion 9 following the onset of rain (Figure 27).
Figure 27. Water level changes in boreholes at portion 7 as well as at the in- and outflow of the GMB stream in response to rainfall (September 2007).
Water 03 00356 g027
In contrast to the flushing event, the groundwater response to the rain shows no horizontal gradient in magnitude i.e., no weakening away from the stream. With increases of 170 mm at BH ri 10 m, 138 mm at BH ri 60 m and 207 mm at BH ri 80 m, the highest increase does, in fact, occur in the borehole furthest away from the stream. Since the rain coincides with the diurnal water level increase in the afternoon, it is difficult to determine exactly when the rain-triggered water level rise starts. After the first count of rain was measured at 16:03 (i.e., the rain must have started before this time) all boreholes show an increase above diurnal oscillation levels within 30–60 min (Figure 27). This suggests that the infiltrating rainwater reaches the groundwater surface in less than an hour after the rain started. While the groundwater level in both far-stream boreholes remains relatively high after the rains, showing only a slow linear decrease, the near-stream groundwater level drops quicker, possibly indicating easier drainage into the adjacent stream which displays a similar hydrograph.
(e)
Water quality aspects
In contrast to the flushing event where rising stream levels are mirrored by a parallel increasing EC in the stream water, the latter drops significantly in response to the rain event, showing an inverse relation to the stream flow (Figure 21). This inverse relation between water level and EC in the stream water is probably related to the dilution caused by relatively large volumes of clean rainwater entering the system.
However, the response of the EC in the near stream groundwater (BH ri 10 m) displays the opposite behavior, i.e., showing a strong increase soon after the groundwater level starts to rise in response to the rain (Figure 28).
Figure 28. Changes in water level and EC in near-stream groundwater in response to the first spring rains (September 2007).
Water 03 00356 g028
Compared to the rain-triggered EC-drop observed in the stream (from 790 to 750 µS/cm: 40 µS/cm), the EC-increase in the near-stream groundwater is more than an order of magnitude higher, almost doubling from just over 700 µS/cm to close to 1,500 µS/cm (770 µS/cm). The latter value indicates a significant level of salt pollution. The EC level reaches the peak about one day after the water level, gradually approaching the pre-event level along with falling groundwater levels. This decline is only shortly interrupted by a small, renewed increase triggered by another rainfall event four days after the EC peak (Figure 28). A possible explanation for the different reactions of stream water and groundwater to the first spring rain rainfall may be the dissolution of salt crusts covering parts of the sediment surface by rainwater before percolating through the vadose zone of the peat towards the groundwater table. This would result in a simultaneous increase of groundwater level and EC as the former is caused by polluted, percolating rainwater. Figure 28 indicates, however, that the WL-changes precede the EC increase by several hours rendering the dissolution of surface crusts by infiltrating rainwater unlikely to be the cause of the EC-increase. Since the EC rises after the groundwater increases, it is more likely that salt deposited in the vadose peat zone is slowly dissolved as it comes in contact with the rising groundwater. The falling groundwater levels in this zone allow deeper groundwater to dilute the increased salt load of the upper groundwater layer. This would also explain the renewed EC-increase that accompanies the second water level rise triggered by the following rain event.
The steadily increasing EC in the adjacent stream could point to much of the polluted alluvial groundwater slowly exfiltrating into the stream following the re-established hydraulic gradient after the stream level subsided again (Figure 28).
(f)
Diurnal water level fluctuations
In addition to the pronounced responses to the flushing and the rain events, the water level in all boreholes also displays diurnal fluctuations ranging from a maximum of 20 mm/d near the stream channel to 19 mm/d in borehole (BH) ri 60 m and only 9 mm/d in BH ri 80 m. Reaching the daily maximum early in the morning at around 6:00–7:00 hours, during the day the WL drops to a minimum reached at around 14:30–16:30. During the night the WL rises again to the early morning maximum (Figure 23). While this may suggest evapotranspiration losses from the shallow groundwater table (which may at times even be above the surface [16]), as an underlying cause one first needs to exclude possible technical effects first. Schrader (2010) found that insufficient temperature compensation in pressure-based WL-sensors results in the recording of daily ‘pseudo-fluctuations’ of the WL (following the temperature cycle) while, in fact, the water level remains constant [
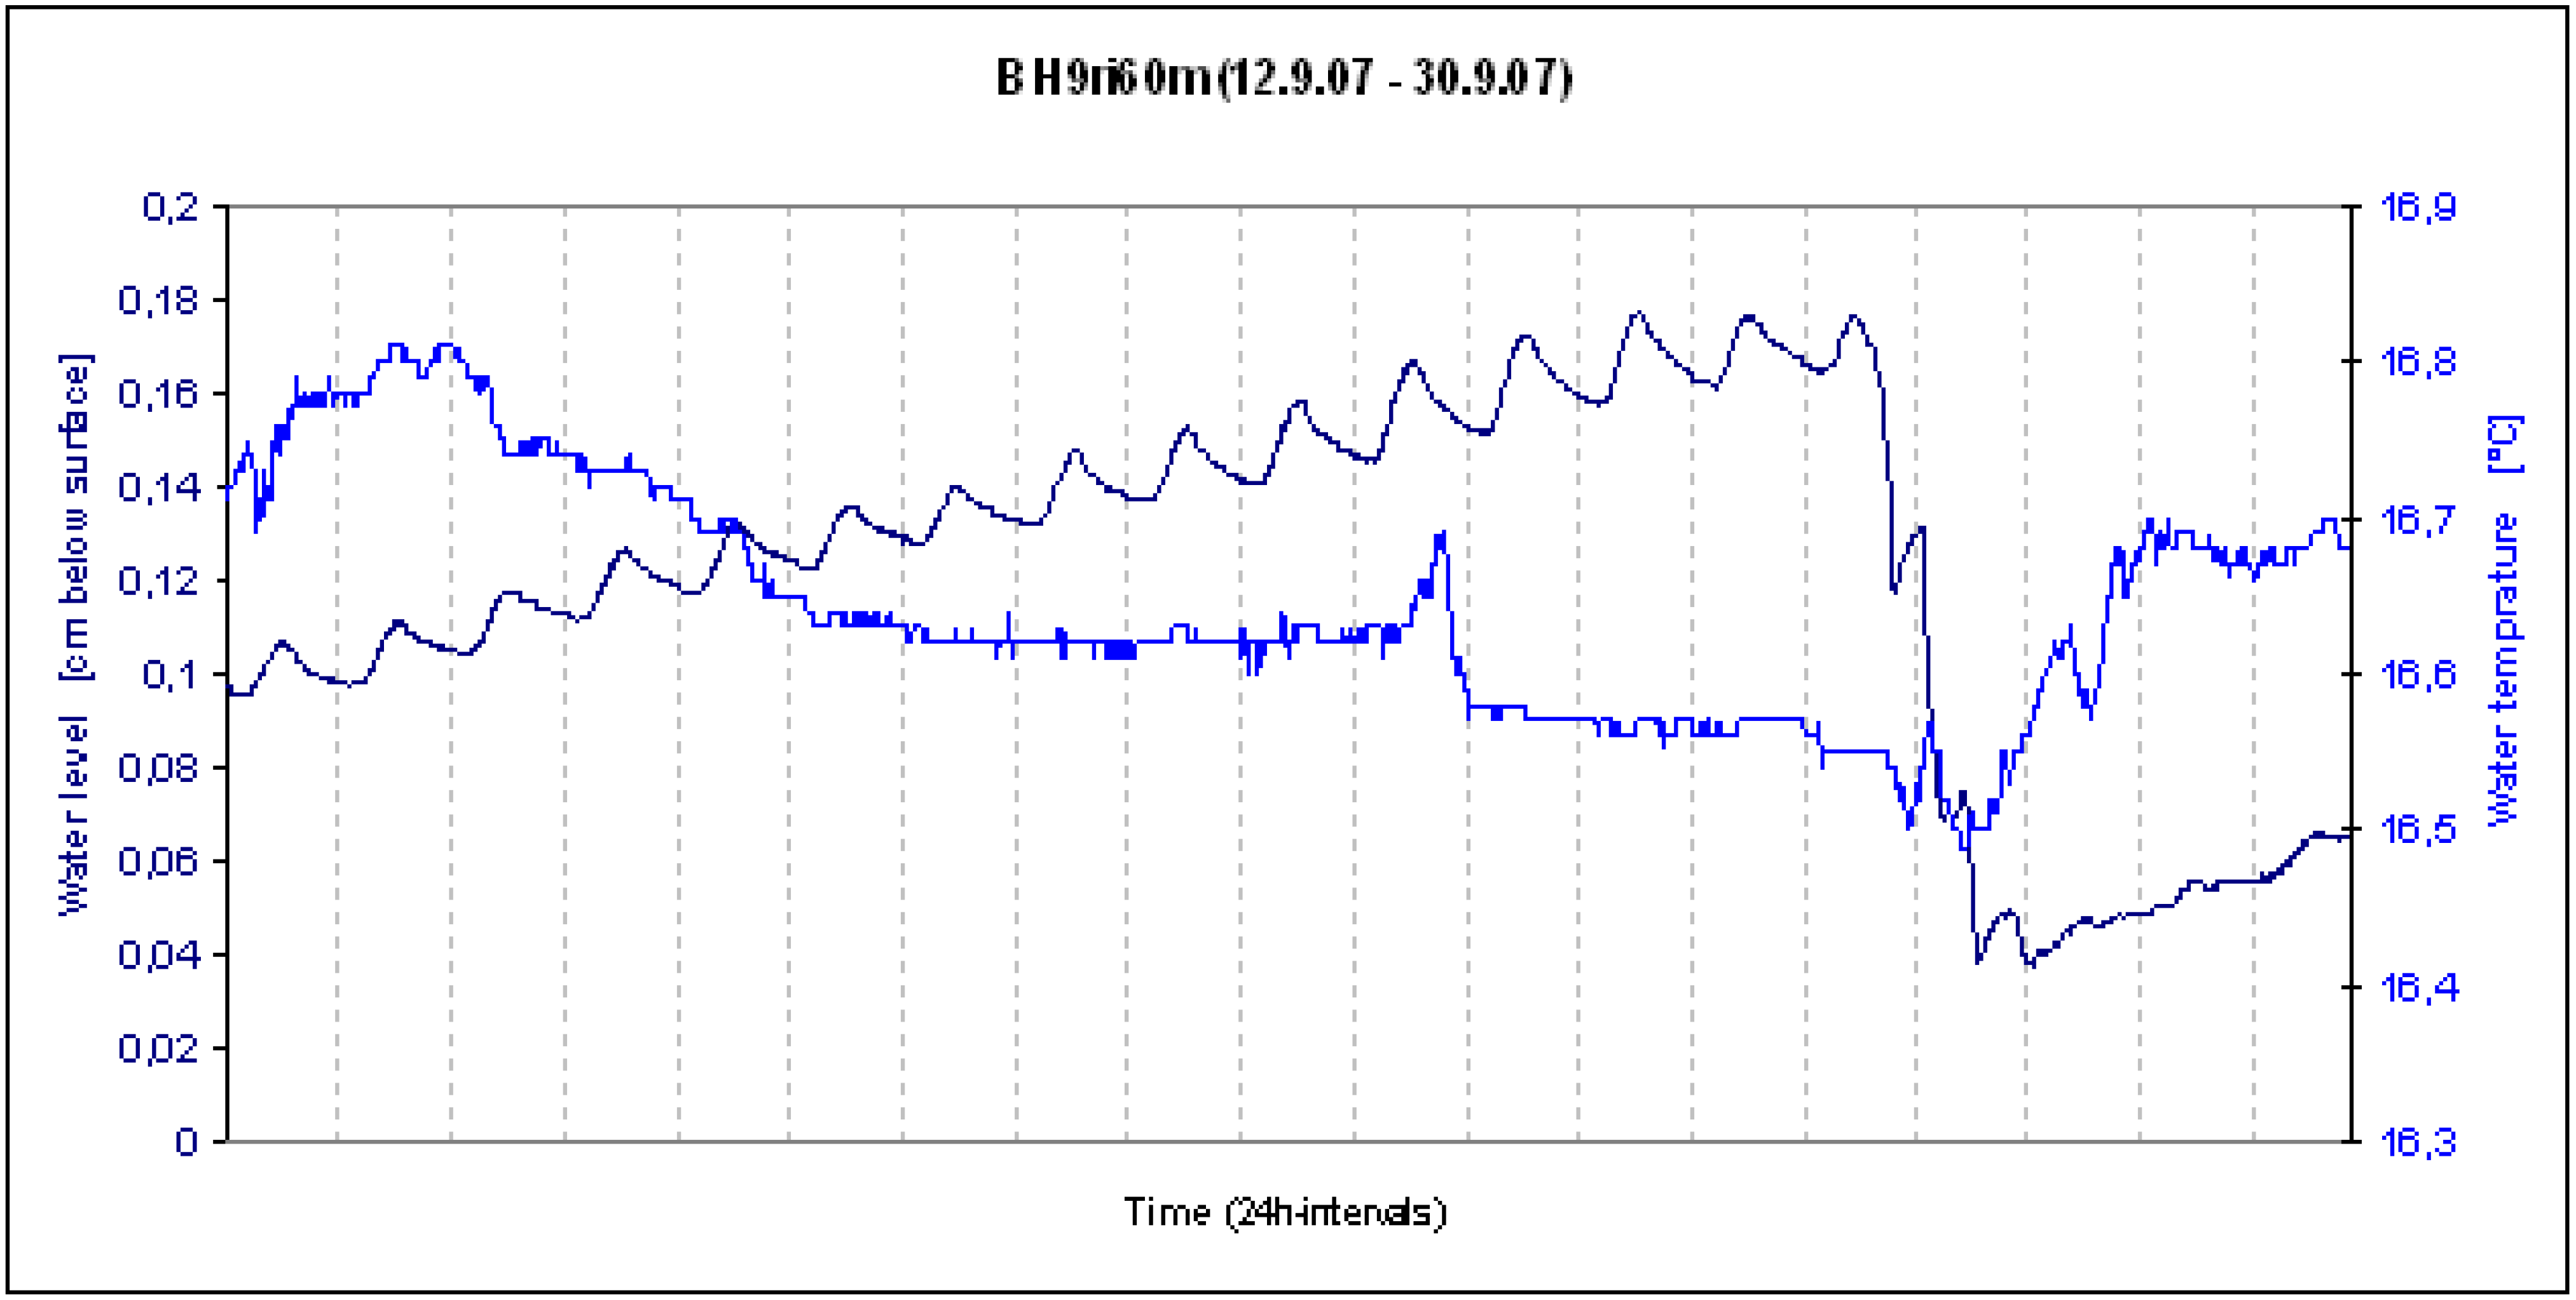
16]. While this was determined in non-vented pressure sensors (which also react to atmospheric pressure changes) it may also affect vented sensors used in the boreholes. However, comparing the simultaneously recorded water temperature with the water level does not indicate any synchronic changes (Figure 29).
Figure 29. Comparison between diurnal fluctuations of the groundwater level (BH ri 60 m) and the groundwater temperature, indicating that the recorded diurnal level oscillations are not induced by possible temperature fluctuations.
Water 03 00356 g029
It is, therefore, assumed that the porewater level in the peat indeed fluctuates daily by 10–20 mm. Especially at BH ri 10 m, where overall reducing conditions below the water table prevail (Figure 20), this means that an approximately 2 cm-thick peat layer is subjected to regular redox changes alternating between oxidizing conditions for several hours during the day and reducing conditions during night time. This, in turn, may have relevance for the immobilization and remobilization especially of redox-sensitive heavy metals such as U. Should the reaction (kinetics) of oxidizing U be fast enough, this may result in diurnal pulses of U being released from the peat into the porewater whenever reducing conditions change to oxidizing conditions during the course of the day. With rather slow physical water movement through the peat, this would, however, not necessarily result in U peaks entering the adjacent stream allowing for subsequent immobilization of U from the porewater after reducing conditions returned.
Apart from increased evaporation during day time, these fluctuations could possibly also be caused by (temperature-induced) volumetric changes of the peat (in German known as ‘Mooratmung’—mire breathing) [18]. The latter possibility, however, still needs to be investigated.

4. Summary and conclusion

The third part of a series that focuses on how and to what extent the GMB peatland may act as a filter for U polluted water originating from an upstream gold mining area. This paper’s emphasis is on characterizing the hydrological conditions in the study area and to determine the extent and dynamics of water flow through the wetland as well as through the peat and other alluvial sediments that may act as U filter. The investigation was aimed at verifying the extent to which general hydraulic aspects outlined in the conceptual peat filter model are applicable to local conditions found in the study area. For the characterization of the site-specific hydraulic filter component, a number of different field- and laboratory methods were employed.
As a first step, an approximation of the total volume of water flowing through the wetland was established by statistically analyzing historical flow data from relevant gauging stations in the area, which indicated a significant mismatch between inflow and outflow of the Boskop Dam, suggesting that approximately half of the out-flowing water could not be accounted for by existing gauging stations. Based on two ‘snap shot’ flow measurements, during which number of streams and sites were covered for which no flow record existed, much of the water previously unaccounted for was found to arise from the GMB wetland. A screening survey of the wetland, using water quality parameters such as water temperature and EC as well as field observations, indicated that most of the additional water stems from a number of smaller and previously unknown subaquatic artesian springs in the upper part of the wetland. The 60–100 ML/d contributed by the springs effectively doubles to trebles the water volume that issues from the main eye at the top of the wetland. This renders the GMB wetland the single largest water source for the water supply of Potchefstroom.
In addition to the subaquatic artesian inflow at the upper part of the wetland, two sites were identified further downstream where plumes of polluted groundwater moved laterally from the edges of the wetland towards the stream. In these areas, displaying significantly elevated EC-levels, extensive white salt crusts were found to develop during the dry winter months. Down-gradient, the mineral composition of these salt crusts changes from carbonate-domination in the upper part to sulfate domination in the middle and a higher NaCl content in the lower part, suggesting different sources of pollution.
While passing through the wetland the salt load of the water generally increases from inflow to the outflow by approximately 600% totaling >54 t/d that subsequently flows into the upper Mooi River. Compared to an increase of flow by 250% to 580% (the flow measurements unfortunately suffer from a considerable degree of uncertainty associated with the determination of flow rates in natural stream beds), this suggest that most of the inflowing groundwater is on average of lesser quality (i.e., higher EC) than the spring water of the GMB eye.
While the higher water flow through the wetland significantly increases the potential importance of the peatland as U filter, little is known about the actual proportion of this water that flows through, or at least comes into contact with, the peat. In order to detect and quantify this component of the total flow, two transects of monitoring boreholes running perpendicular to the stream were installed at two different sites in the wetland. Equipped with data-logging multiparameter sensors measuring water level and selected quality parameters such as pH, EC and water temperature at 10 minute intervals, these boreholes allowed to monitor the dynamic of porewater in peat as well as in non-peat sediments quasi continuously and in situ (i.e., undisturbed by sampling). By analyzing porewater dynamics associated with selected hydrological events, such as flushing the adjacent stream as part of annual canal maintenance and the first spring rains, it was established that water from the stream channel infiltrates laterally into adjacent peat at rates significantly higher than found for vertical percolation in column experiments. This, in turn indicates that at least some of the stream water could be filtered. Comparing hydrographs from the inflow and the outflow of the wetland during the flushing event indicated in a first-order approximation that this affects ca. 10% of the total stream flow through lateral and vertical infiltration into the vadose zone of peat as well as non-peat sediments.
In response to the first spring rains that occurred after the prolonged dry winter period, the porewater quality drastically declined as indicated by significant rises of its EC. The increase possibly results from the dissolution of salt crusts covering the surface. The associated increase in ionic strength and complexing ions such as CO32−, SO42− and Cl may trigger the release of sorbed U from the peat. This is in addition to the U released from the salt crusts following their dissolution by rainwater.
In an attempt to explain the movement of the groundwater plume detected in the middle of the wetland (portion 7) as a possible indication of its origin (source of pollution), point measurements of water level and quality parameters (pH, EC, Eh, temperature) were taken in six boreholes, at weekly intervals over a period of two years. To reduce the resulting complexity of data and aid interpretation, all data were imported into a GIS and extrapolated generating contour (iso-line) maps for each of the parameters. After importing these maps into PowerPoint and combining them with related parameters such as rainfall, vegetation and salt crust coverage the extrapolated contours of selected parameters were visualized for each date of measurement in 3D-fashion. By displaying the created, standardized images on PowerPoint slides in consecutive order at a higher than normal frequency the illusion of dynamic changes is created aiding a more holistic interpretation of an otherwise large number of incoherent point data. This method of visualizing complex data sets in a comprehensive and condensed manner allowed identifying complex flow patterns of a groundwater plume that in many instances did not follow the expected relationship to rainfall. This warrants further investigations into the dynamics that seem to control much of the waterborne uranium input into the studied peatland.

Acknowledgements

The study is funded by the Department of Water Affairs and Forestry of South Africa (project no. 213-2006) which is gratefully acknowledged. In particular, the project team wish to thank Frans Le Roux and his colleagues from the Boskop Dam office for their enthusiastic support and for providing much needed data.

References

  1. Winde, F.; Erasmus, E. Peatlands as filters for polluted mine water?—A case study from an uranium-contaminated karst system in South Africa. Part I: Hydrogeological Setting and U Fluxes. Water 2010, 3, 291–322. [Google Scholar] [CrossRef]
  2. Winde, F. Peatlands as filters for polluted mine water?—A case study from an uranium-contaminated karst system in South Africa. Part II: A conceptual filter model. Water 2010, 3, 323–355. [Google Scholar] [CrossRef]
  3. Liebenberg, W.; Head of regional office Department of Water Affairs. Personal communication, May 2007.
  4. Rudolph, S. Untersuchungen zu Wasserhaushalt und Hydrodynamik von Feuchtgebieten in semiariden Karstregionen Südafrikas—das Gerhard Minnebron Peatland (North-West Province) als Fallstudie eines vom Torfabbau betroffenen Feuchtgebiets (Investigations into Water Balance and Hydrodynamics of Wetlands in Semi-Arid Karst Regions of South Africa—The Gerhard Minnebron Peatland, North-West Province as a Case Study of a Peat-Mining Affected Wetland). Diplom thesis, University of Halle, Institute for Geography, Halle, Germany, 2009; p. 72. [Google Scholar]
  5. Water Flow Data for Gauging Stations in and Around the Gerhard Minnebron Wetland, Hydrological Information System; Department of Water Affairs and Forestry of South Africa(DWAF): Pretoria, South Africa, 2007.
  6. Le Roux, F. Wonderfontein Spruit & Mooi River—Report on field investigations into flow gauging for peat project, 25–26 July 2007; Department of Water Affairs, Divison Hydrometry—Gauteng region, Boskop Dam office: Potchefstroom, South Africa; p. 21.
  7. Le Roux, F. Wonderfontein Spruit & Mooi River—Report on ‘snapshot’ data collection exercise for peat project, 1 August 2007; Department of Water Affairs, Divison Hydrometry—Gauteng region, Boskop Dam office: Potchefstroom, South Africa; p. 53.
  8. Hoffmann, E. Arc-Desk GIS Map Series for the Gerhard Minnebron Peat Project; North-West University, Water Research Group: Potchefstroom, South Africa, 2010. [Google Scholar]
  9. Conant, B., Jr. Delineating and quantifying ground water discharge zones using streambed temperatures. Ground Water 2004, 42, 243–257. [Google Scholar] [CrossRef] [PubMed]
  10. Loheide, S.P., II; Gorelick, S.M. quantifying stream-aquifer interactions through the analysis of remotely sensed thermographic profiles and in situ temperature histories. Environ. Sci. Tech. 2006, 40, 3336–3341. [Google Scholar] [CrossRef]
  11. Hoffmann, E.; Winde, F. GIS Applications as a Tool for Wetland Research—Part II: Synoptic Visualization of Dynamic Changes in Water Flow and Quality. In National Wetlands Indaba, Skukuza, South Africa, 28–31 October 2008.
  12. Smuts, W.J. Characteristics of South African Peats and Their Potential Exploitation. PhD Thesis, Faculty of Science, University of Pretoria, Pretoria, South Africa, 1997; p. 222. [Google Scholar]
  13. Grundling, P.L. Environmental Impact Assessment for Stander Veen Cc. (Middleground) Expansion to Portions 4,8 & 9; Environmental Impact Assessment Report, IHL 2002/4/001; Ihlaphosi Enviro Services: Pretoria, South Africa, 2002. [Google Scholar]
  14. Hunt, B. An approximation for the bank storage effect. Water Resour. Res. 1990, 26, 2769–2775. [Google Scholar] [CrossRef]
  15. Bradley, C.; Brown, A.G. Shallow groundwater modeling and the over-bank contribution to a small floodplain bog. In Geomorphology and Groundwater, 1st ed.; Brown, A.G., Ed.; Wiley: Wiltshire, UK, 1995; pp. 37–52. [Google Scholar]
  16. Gribovszki, Z.; Szilagyi, J.; Kalicz, P. Diurnal fluctuations in shallow groundwater levels and streamflow rates and their interpretation—A review. J. Hydrol. 2010, 385, 371–383. [Google Scholar] [CrossRef]
  17. Schrader, A. Hydrodynamik von Feuchtgebieten in semi-ariden Karstregionen Südafrikas—untersucht am Beispiel des Schoonspruit Wetlands (NW-Province) (Hydrodynamics of Wetlands in Semi-Arid Karst Regions of South Africa—a Case Study of the Schoonspruit Wetland (NW-Province)). Diplom Thesis, Department of Geography, University of Marburg, Marburg, Germany, 2010; p. 109. [Google Scholar]
  18. Price, J.S.; Schlotzhauer, A. Importance of shrinkage and compression in determining water storage changes in peat: The case of a mined peatland. Hydrol. Processes 1999, 13, 2591–2601. [Google Scholar] [CrossRef]

