3.1. Findings of the Assessment Method
Table 2 summarizes the new ecosystem services assessment approach applied to 100 potential example SuDS sites in Greater Manchester. Most ecosystem service variables did relate well to the natural environment such as biologically diverse parks (41% of all sites) and not to the built environment like impermeable car parks (33% of all sites). This relationship reduces the number of sites suitable for retrofitting of most SuDS, as car parks usually only perform well with respect to three ecosystem service variables [
moderation of extreme events (
MEE),
storm runoff treatment (
SRT) and
fresh water (
FW);
Table 1]. The presence of public parks did not pull up the overall suitability of retrofitting sites, because they were usually small in size (30% of sites were <25,000 m
2), low in tree coverage (7%) and the presence of surface water [stream (0%), river (11%), canal (21%) and standing water (8%)] of the associated catchment was limited. However, the introduction of a weighting system (
Table 3) that puts bias towards what a drainage engineer would perceive as more important variables for SuDS (e.g., flood control as part of
MEE and water quality control considered by SRT) could increase the suitability of sites for retrofitting.
Table 4 shows the assessment approach in terms of proposed SuDS techniques for Greater Manchester. The relative proportions for each SuDS technique have been expressed in percentage points for all selected professions. Note that there were many occasions where more than one SuDS technique had the same order of preference.
Table 5 shows a comparison of the inter-site variability for a given sustainable drainage technique for Greater Manchester, and helps to interpret the preference distributions in
Table 4. The relatively high variability for most variables such as ponds and constructed wetlands cannot be explained by factors relating to specific planning policies for Greater Manchester. Ponds are associated with the greatest inter-site variability because of their potentially relatively small size and great popularity [
5,
6,
19].
Table 4.
Drainage system preferences*.
Table 4.
Drainage system preferences*.
| Profession | Sustainable Drainage System | First | Second | Third |
|---|
| Drainage engineer | Permeable pavement | 43 | 9 | 4 |
| Filter strip | 2 | 7 | 12 |
| Swale | 0 | 2 | 12 |
| Green roof | 0 | 0 | 3 |
| Pond | 33 | 11 | 4 |
| Constructed wetland | 11 | 1 | 2 |
| Infiltration trench | 5 | 9 | 44 |
| Soakaway | 0 | 4 | 15 |
| Infiltration basin | 1 | 4 | 8 |
| Belowground storage | 5 | 44 | 13 |
| Water playground | 3 | 17 | 9 |
| Developer | Permeable pavement | 42 | 13 | 12 |
| Filter strip | 11 | 23 | 14 |
| Swale | 1 | 13 | 11 |
| Green roof | 0 | 0 | 1 |
| Pond | 36 | 9 | 1 |
| Constructed wetland | 8 | 6 | 1 |
| Infiltration trench | 2 | 32 | 23 |
| Soakaway | 3 | 1 | 34 |
| Infiltration basin | 1 | 1 | 8 |
| Belowground storage | 0 | 11 | 23 |
| Water playground | 1 | 2 | 6 |
| Ecologist | Permeable pavement | 39 | 7 | 12 |
| Filter strip | 13 | 22 | 22 |
| Swale | 2 | 13 | 22 |
| Green roof | 0 | 1 | 2 |
| Pond | 30 | 13 | 5 |
| Constructed wetland | 10 | 1 | 3 |
| Infiltration trench | 8 | 33 | 26 |
| Soakaway | 1 | 8 | 17 |
| Infiltration basin | 2 | 8 | 12 |
| Belowground storage | 1 | 13 | 32 |
| Water playground | 5 | 19 | 8 |
| Planner | Permeable pavement | 39 | 8 | 6 |
| Filter strip | 8 | 11 | 29 |
| Swale | 1 | 6 | 17 |
| Green roof | 0 | 1 | 1 |
| Pond | 31 | 12 | 1 |
| Constructed wetland | 10 | 1 | 1 |
| Infiltration trench | 0 | 6 | 25 |
| Soakaway | 0 | 3 | 16 |
| Infiltration basin | 0 | 2 | 9 |
| Belowground storage | 5 | 42 | 14 |
| Water playground | 5 | 19 | 7 |
| Social scientist | Permeable pavement | 39 | 7 | 6 |
| Filter strip | 12 | 24 | 19 |
| Swale | 0 | 1 | 11 |
| Green roof | 0 | 1 | 0 |
| Pond | 33 | 10 | 0 |
| Constructed wetland | 10 | 0 | 1 |
| Infiltration trench | 0 | 9 | 31 |
| Soakaway | 0 | 2 | 20 |
| Infiltration basin | 0 | 2 | 3 |
| Belowground storage | 2 | 33 | 18 |
| Water playground | 5 | 20 | 5 |
Table 5.
Inter-site variability* comparison for a given sustainable drainage technique.
Table 5.
Inter-site variability* comparison for a given sustainable drainage technique.
| Sustainable Drainage System | Drainage engineer | Developer | Ecologist | Planner | Social Scientist |
|---|
| Permeable pavement | 21 | 17 | 16 | 19 | 16 |
| Filter strip | 16 | 18 | 19 | 19 | 18 |
| Swale | 15 | 17 | 17 | 17 | 13 |
| Green roof | 5 | 0 | 6 | 5 | 5 |
| Pond | 31 | 36 | 33 | 32 | 31 |
| Constructed wetland | 21 | 25 | 23 | 21 | 19 |
| Infiltration trench | 13 | 9 | 13 | 12 | 11 |
| Soakaway | 7 | 5 | 9 | 6 | 5 |
| Infiltration basin | 13 | 16 | 12 | 12 | 11 |
| Belowground storage | 17 | 15 | 13 | 15 | 13 |
| Water playground | 18 | 17 | 17 | 19 | 20 |
It may come as a surprise that permeable pavements scored relatively highly on ecosystem service variables (
Table 4), which contradicts the common belief among some engineers that there has to be a strong bias towards natural and soft techniques when using ecosystem service assessment techniques [
5,
20]. However, permeable pavements are likely to attract high values for variables such as
SRT and
MEE, respectively, if properly designed and managed.
3.2. Expert Judgment
The estimation of certainties associated with expert judgment needs to be undertaken consistently to be informative. Human judgment may vary considerably, and involves an appreciation of reality and what is a realistic solution to a given problem and an understanding of the importance of making the right choice about what action to take [
21]. Confidence estimations are affected by ones familiarity of a topic, experience with probabilistic assessments, the level of difficulty of a task, and the environmental context in which the task is performed [
22].
Research has proven that a group’s level of judgment usually outperforms that of an average individual due to the sharing of responsibility between the group members. This sharing, in turn, leads to an increase in their confidence to communicate judgments [
23].
Knowledge used by engineers to make judgments is not entirely of scientific nature, although a substantial part is derived by science, but is based on experimental evidence and on empirical observations of materials and systems. Understanding is built-up over time as a result of continuous unquantifiable but improving judgments and choices [
24,
25]. The introduction of a weighting system can address differences between assessor groups with different scientific backgrounds.
Previous studies indicate that good expert judgment performance can be observed when both the scientific validity of an estimated observation and the learnability of the estimation by the assessor are high. Poor expert opinion may occur if at least one of these factors is low [
26]. Most variables (
Table 1) to be estimated in the proposed SuDS retrofitting tool are strongly scientifically valid, and their estimation is uncontroversial and easy to learn (e.g.,
SRT and
FW). Therefore, this paper focuses on the estimation of some of those more controversial variables that are highly subject to personal opinion and taste (
aesthetics and
safety), difficult to learn due to their highly dynamic nature in terms of time and space (
land cost), and scientific complexity (
habitat for species).
For example, the indirect assessment of biodiversity predominantly through the supporting ecosystem service variables
habitat for species and
maintenance of genetic diversity is difficult due to its scientific complexity in terms of sustainability assessment and ecosystem valuation. Any rapid and cost-effective screening method should preferably be undertaken by experts in order to avoid obtaining poor results based on guesses. In comparison, traditional biodiversity assessments are time-consuming and costly. Therefore, this paper assesses this challenge by researching to what degree users with different experience and scientific background (see
Section 3.4) come up with similar findings.
3.3. Variability and Learning Process
An estimation tool has to be relatively simple to learn and apply [
26], and should be based more on intuition than on expert understanding to limit the variability associated with estimations for the same variable by different assessors with potentially diverse backgrounds.
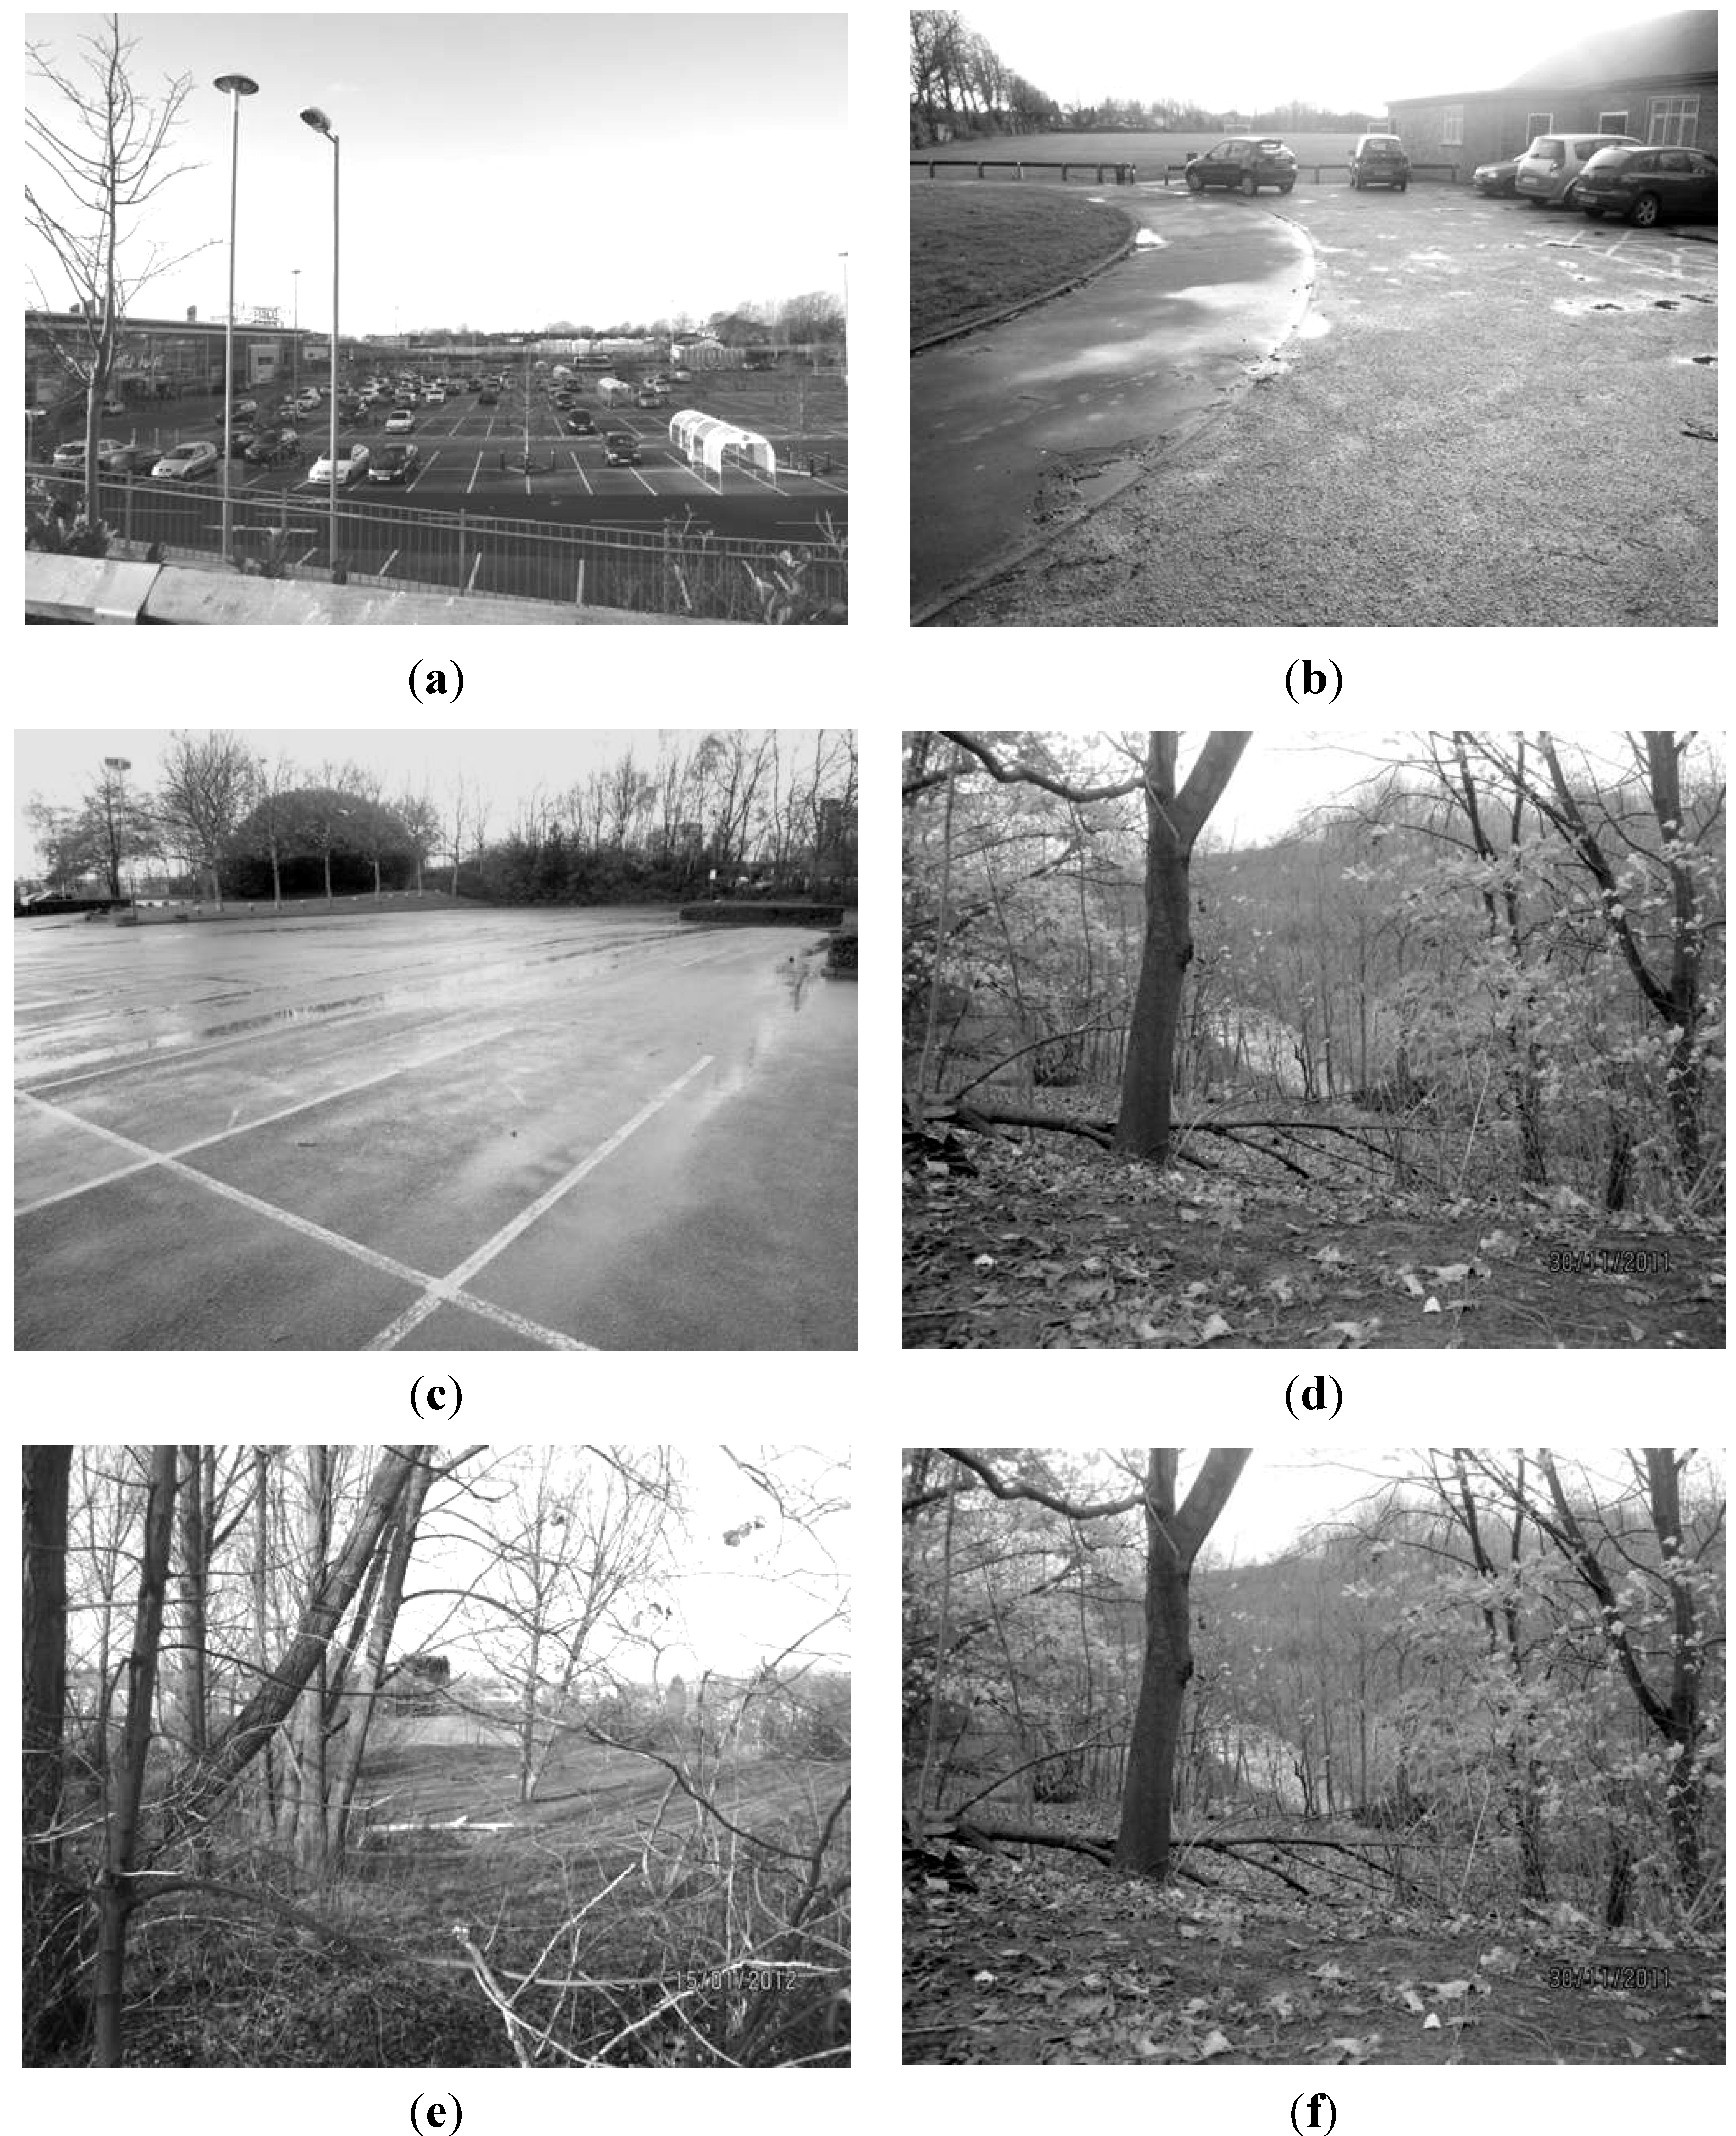
Table 6 shows the findings of the questionnaire analysis.
Figure 1 shows the relative ranking values for the variable
habitat for species (%) in ascending order (
i.e., from highly inadequate to highly adequate habitat).
The example variables
aesthetics and
land costs were determined relatively well (
Table 6). In comparison,
habitat for species (
Figure 1 and
Table 1) and
safety were associated with higher but still acceptable estimated errors. This can be explained by the high complexity of these variables (see
Section 3.2). The cohort had serious difficulties in estimating
land size. Nevertheless, this is not considered to be a problem, because
land size can be easily measured in the field or estimated using maps.
Considering that the concept of “estimation” was new to the students, and they were neither briefed nor trained in advance of the questionnaire, someone might expect considerable progressive learning from stage to stage. However, learning only improved clearly for
land size estimation between all stages (
Table 6). Moreover, the authors expected to identify a clear reduction in variability (indicated by the standard deviation) as learning progressed. Nevertheless, this was not the case (
Table 6).
Table 6.
Summary of the questionnaire analysis* for the civil engineering student cohort.
Table 6.
Summary of the questionnaire analysis* for the civil engineering student cohort.
| Picture number | Target score | Stage 1 | Stage 2 | Stage 3 |
|---|
| Mean | STDEVa | Mean | STDEVa | Mean | STDEVa |
|---|
| Aesthetics (%), which is part of variable 16 (Aesthetics, education, culture and art; Table 1) |
| 1 | 30 | 36 | 20.9 | 29 | 22.0 | 31 | 24.4 |
| 2 | 43 | 35 | 18.3 | 36 | 18.8 | 40 | 17.8 |
| 3 | 49 | 48 | 22.4 | 41 | 27.2 | 39 | 24.2 |
| 4 | 62 | 55 | 10.6 | 57 | 15.5 | 63 | 14.8 |
| 5 | 74 | 58 | 21.1 | 65 | 19.4 | 69 | 22.2 |
| 6 | 82 | 64 | 23.9 | 61 | 22.0 | 69 | 20.5 |
| Land size (m2), which influences all variables (Table 1) |
| 1 | 3240 | 6370 | 11,613 | 8510 | 19,523 | 8400 | 14,302 |
| 2 | 4600 | 8540 | 11,621 | 14,630 | 25,144 | 10,990 | 18,423 |
| 3 | 8200 | 11,560 | 23,187 | 10,790 | 23,532 | 21,100 | 59,486 |
| 4 | 9440 | 57,010 | 216,610 | 16,040 | 35,940 | 21,690 | 48,024 |
| 5 | 10,350 | 49,520 | 69,104 | 63,160 | 149,055 | 56,650 | 91,580 |
| 6 | 70,000 | 123,470 | 436,125 | 84,940 | 159,947 | 70,790 | 101,090 |
| Land cost (%), which is part of variable 15 (Tourism and area value; Table 1) |
| 1 | 27 | 27 | 24.9 | 25 | 20.0 | 25 | 21.9 |
| 2 | 35 | 42 | 15.0 | 45 | 17.7 | 44 | 17.4 |
| 3 | 54 | 53 | 22.4 | 58 | 21.6 | 59 | 22.4 |
| 4 | 60 | 58 | 19.3 | 62 | 17.1 | 60 | 20.3 |
| 5 | 69 | 65 | 19.7 | 63 | 19.0 | 64 | 18.9 |
| 6 | 78 | 71 | 17.9 | 68 | 18.5 | 70 | 20.2 |
| Habitat for species (%), which is variable 1 (Table 1) |
| 1 | 9 | 10 | 13.2 | 16 | 21.5 | 16 | 20.6 |
| 2 | 23 | 30 | 17.5 | 29 | 18.9 | 28 | 20.4 |
| 3 | 45 | 35 | 22.0 | 38 | 20.3 | 40 | 19.5 |
| 4 | 62 | 52 | 24.4 | 53 | 16.7 | 56 | 17.5 |
| 5 | 70 | 67 | 19.4 | 62 | 21.3 | 64 | 20.0 |
| 6 | 82 | 69 | 23.2 | 68 | 23.8 | 74 | 23.3 |
| Safety (%); which is part of variable 14 (Recreation, and mental and physical health; Table 1) |
| 1 | 20 | 21 | 20.7 | 22 | 20.0 | 26 | 32.2 |
| 2 | 29 | 24 | 22.6 | 27 | 21.6 | 27 | 21.2 |
| 3 | 34 | 33 | 20.4 | 32 | 20.6 | 31 | 22.9 |
| 4 | 40 | 46 | 24.3 | 45 | 22.8 | 47 | 32.3 |
| 5 | 62 | 46 | 23.9 | 45 | 25.2 | 53 | 22.5 |
| 6 | 74 | 59 | 35.7 | 61 | 30.4 | 64 | 32.7 |
Figure 2,
Figure 3 and
Figure 4 show the findings for the ecology students, social science students and the general public, respectively. The standard deviations associated with variable estimations were usually lower for the ecology compared to the civil engineering students. In comparison, the same was the case for social science students (except for
aesthetics and
habitat for species). The standard deviations for ecology and social science students and the general public were rather similar.
Table 7 shows an assessment of the statistically significant differences between different cohorts of estimators for selected SuDS characterization variables using the non-parametric Mann-Whitney U-test. There were five relationships that could be considered as unexpected with respect to commonly hold public opinions. Civil engineering compared to ecology students had similar views regarding
habitat for species (
P = 0.994;
Table 7) and
safety (
P = 0.494;
Table 7). However, one might assume that
habitat for species would be much more important to ecologists than engineers. On the other hand, engineers are usually more aware of health and
safety matters than ecologists.
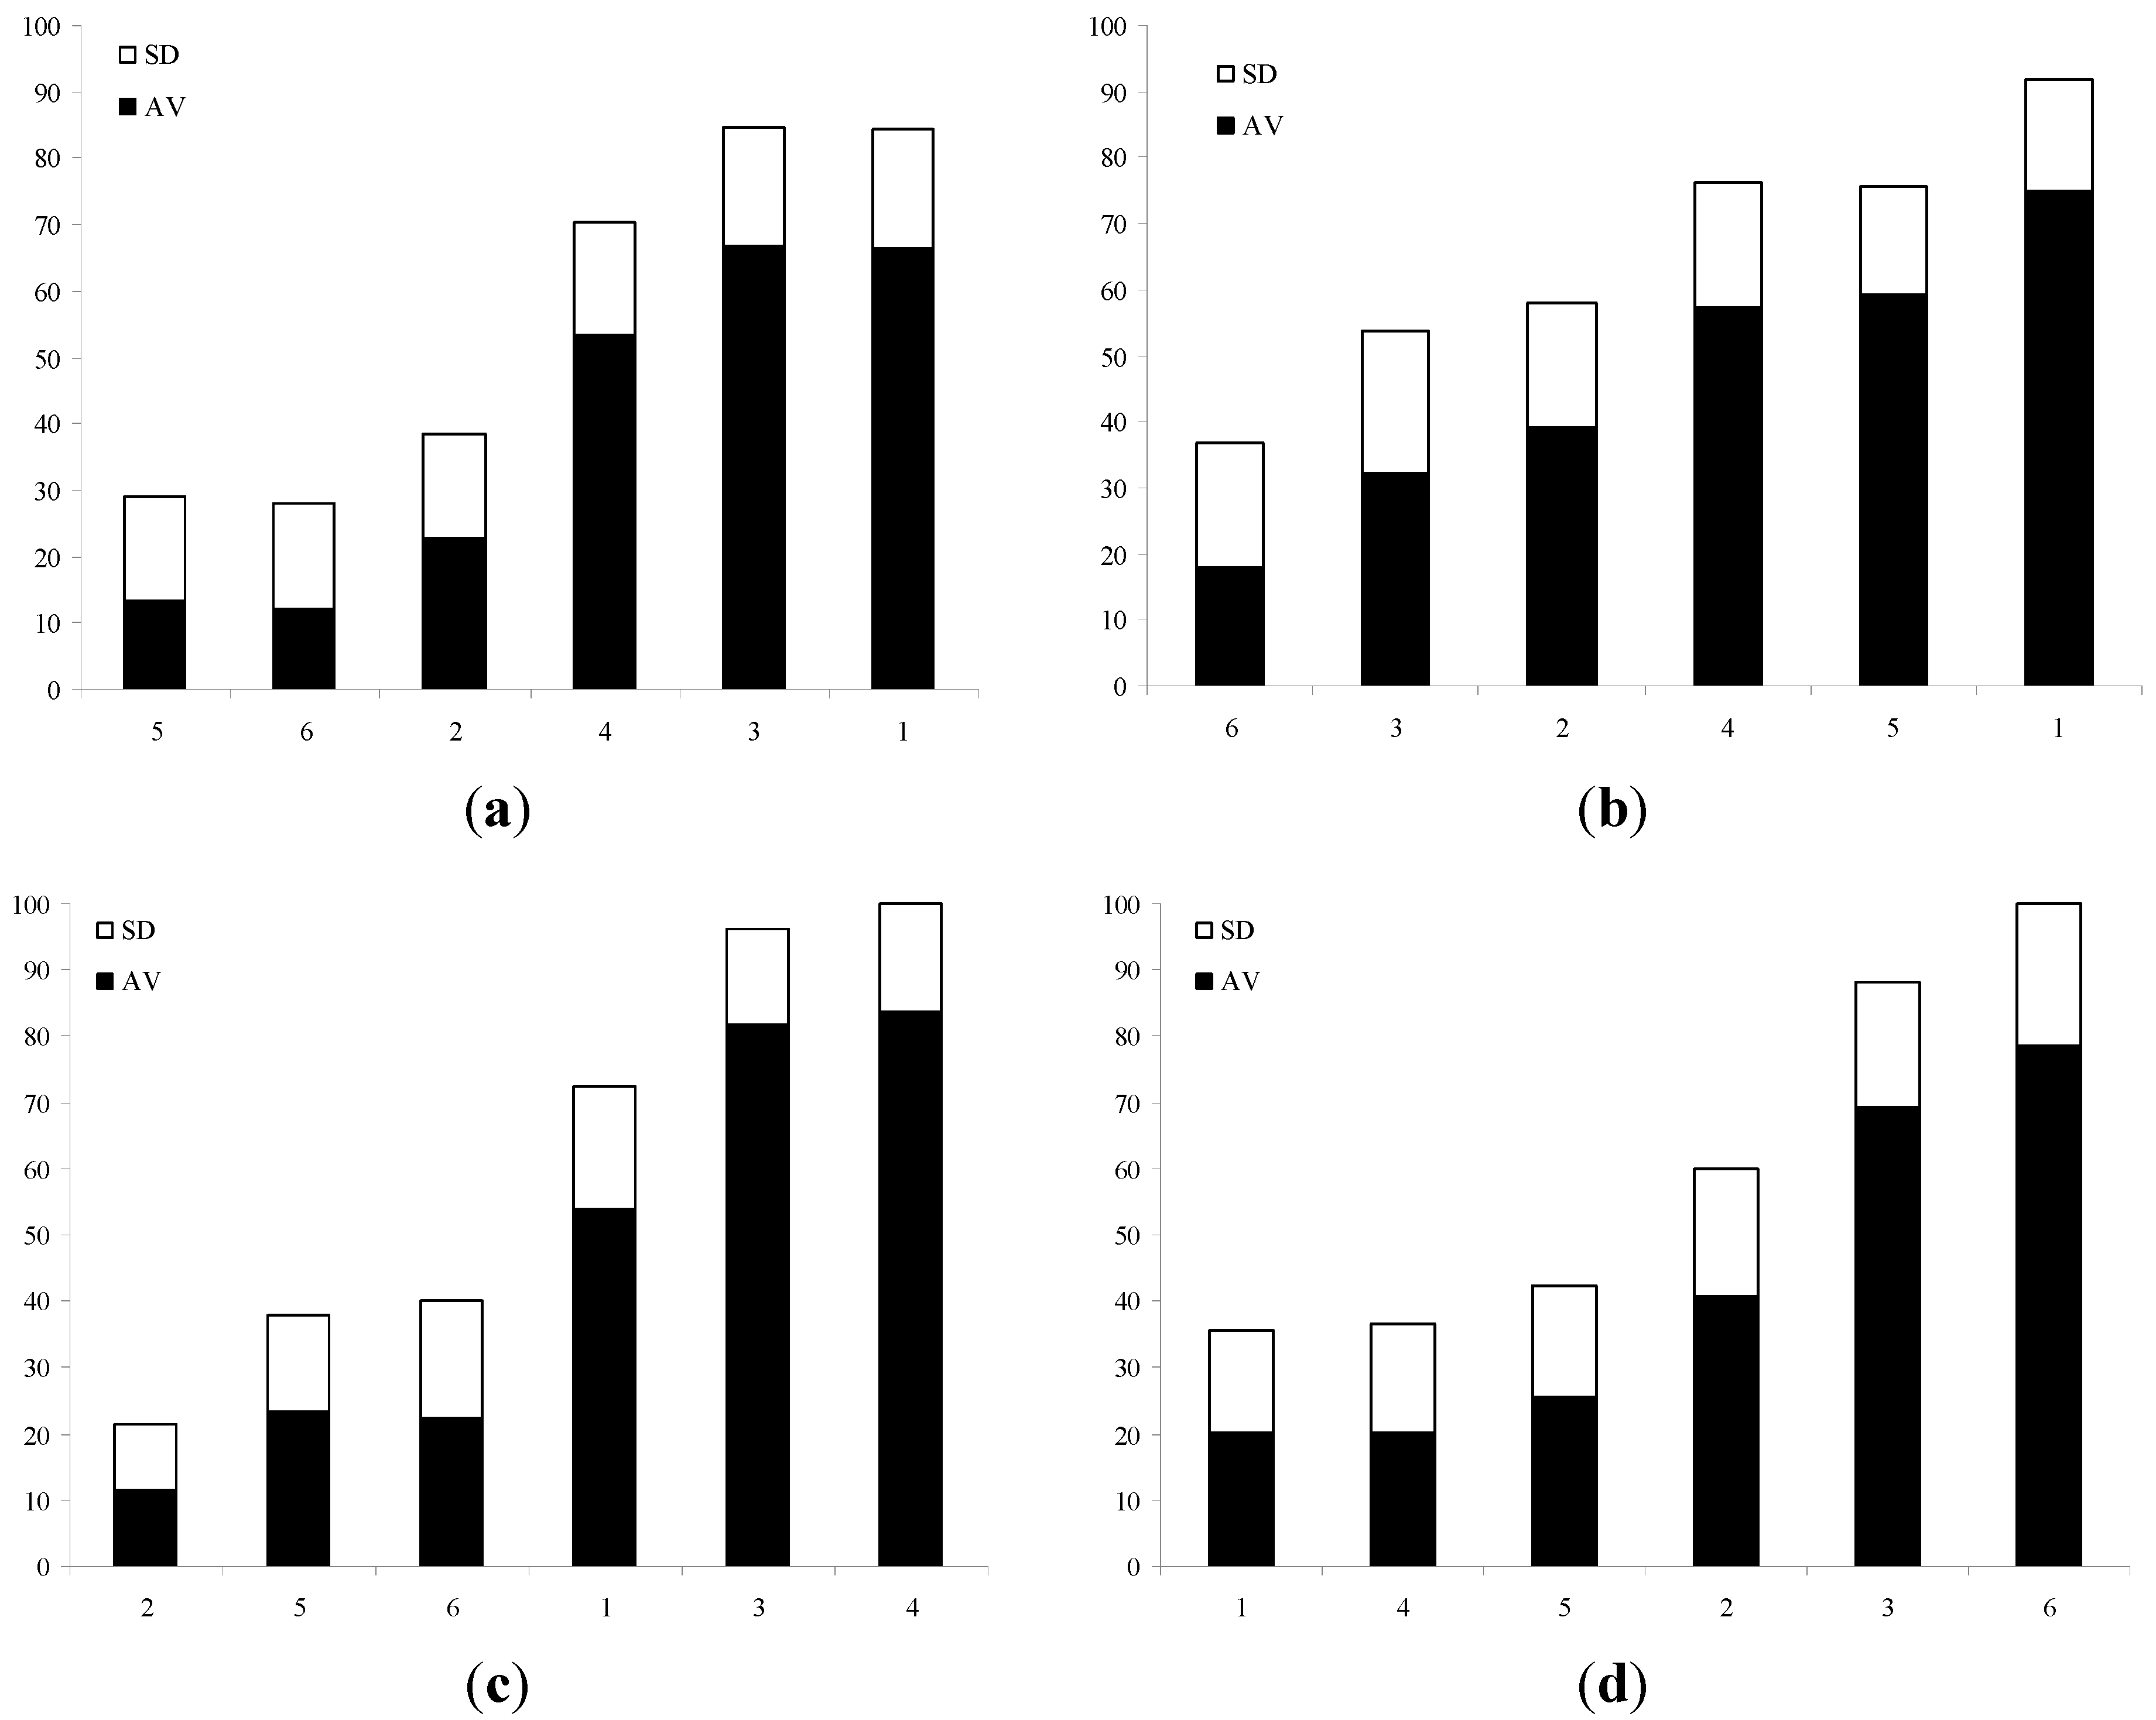
Figure 2.
Stage 3 estimations (%) by ecology students for the variables (a) aesthetics; (b) land cost; (c) habitat for species; and (d) safety based on different pictures represented by numbers on the x-axis. SD, standard deviation; AV, average.
Figure 2.
Stage 3 estimations (%) by ecology students for the variables (a) aesthetics; (b) land cost; (c) habitat for species; and (d) safety based on different pictures represented by numbers on the x-axis. SD, standard deviation; AV, average.
Someone might expect that civil engineering and social science students might have different views regarding
habitat for species. However, the study showed that the data were rather similar (
P = 0.379;
Table 7). It could be expected that ecology students would have a different opinion regarding
habitat for species compared to the general public. However, their assessments were rather similar (
P = 0.072;
Table 7), which is surprising considering that ecologist should have a better understanding of the associated science and might therefore have different assessment criteria. Finally, social scientists and the general public might be expected to have similar opinions with respect to the estimation of
land costs. However, their estimations were significantly different (
P = 0.006;
Table 7), which could be explained by the dominance of engineers in the general public sample.
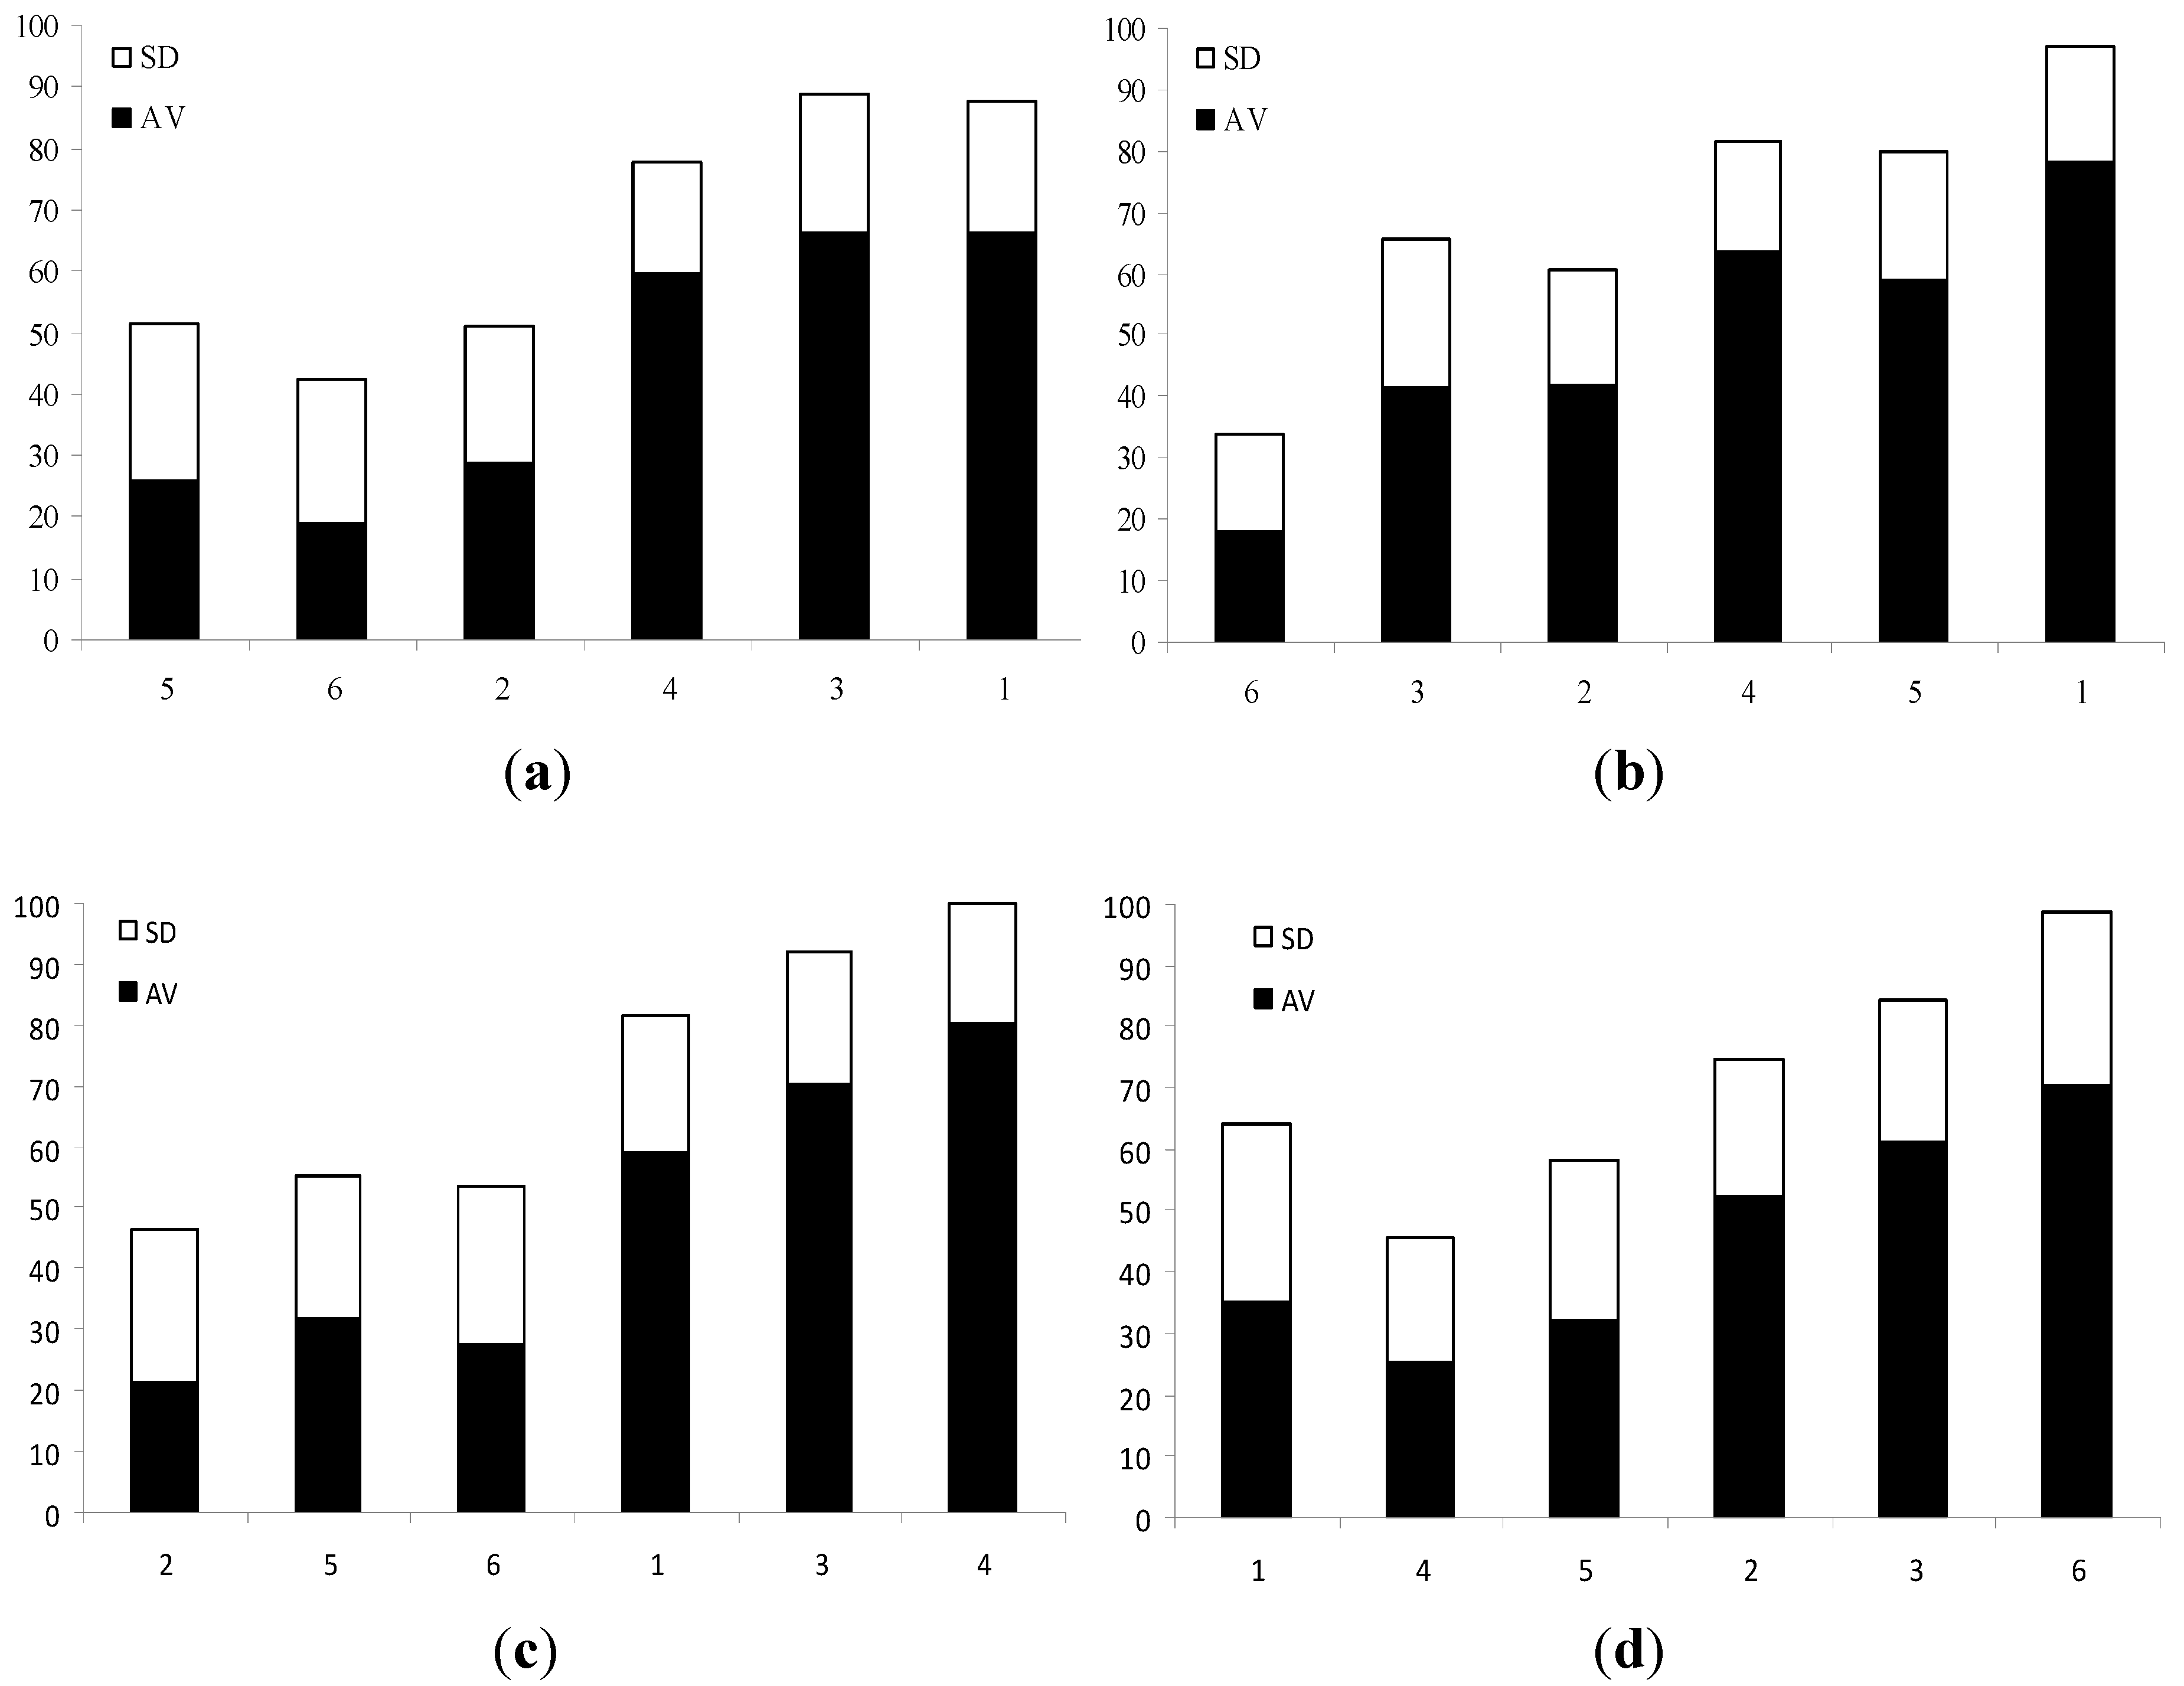
Figure 3.
Stage 3 estimations (%) by social science students for the variables (a) aesthetics; (b) land cost; (c) habitat for species; and (d) safety. based on different pictures represented by numbers on the x-axis. SD, standard deviation; AV, average.
Figure 3.
Stage 3 estimations (%) by social science students for the variables (a) aesthetics; (b) land cost; (c) habitat for species; and (d) safety. based on different pictures represented by numbers on the x-axis. SD, standard deviation; AV, average.
3.4. Different Professional Perspectives
Different professions will want to assign a higher importance to those variables that are of greater relevance to their interests (
Table 4). Therefore, the new tool takes into account the diversity of professional opinions by giving any user the opportunity to select a weighting system (
Table 3) of greatest relevance to his or her line of thought. However, the introduction of associated bias can be avoided by not selecting any weighting system.
In case a result that is free of any bias and error associated with the estimation by a specific cohort is preferable, the findings in
Section 3.3 can be used to adjust the estimation results. For example, if an estimation is made by cohort A for a variable
x, and it is known that A consistently overestimates
x by 10% compared to all other relevant cohorts,
x could be reduced by 10%, which would result in an estimation more acceptable by the majority of stakeholders. With respect to this study, the general public sample is dominated by engineers (at least 43%;
Section 2.5). Considering that engineers consistently overestimate
aesthetics for less beautiful (<50% for aesthetics) SuDS sites in comparison to, for example, ecologists and social scientists (
Table 6;
Figure 2 and
Figure 3), their estimations could be reduced by at least 15% and 5%, respectively, to bring them in line with those made by ecologists and social scientists. Such relationships can be formalized in numerical models based on uncertainty estimations associated with different cohorts and variables [
27].
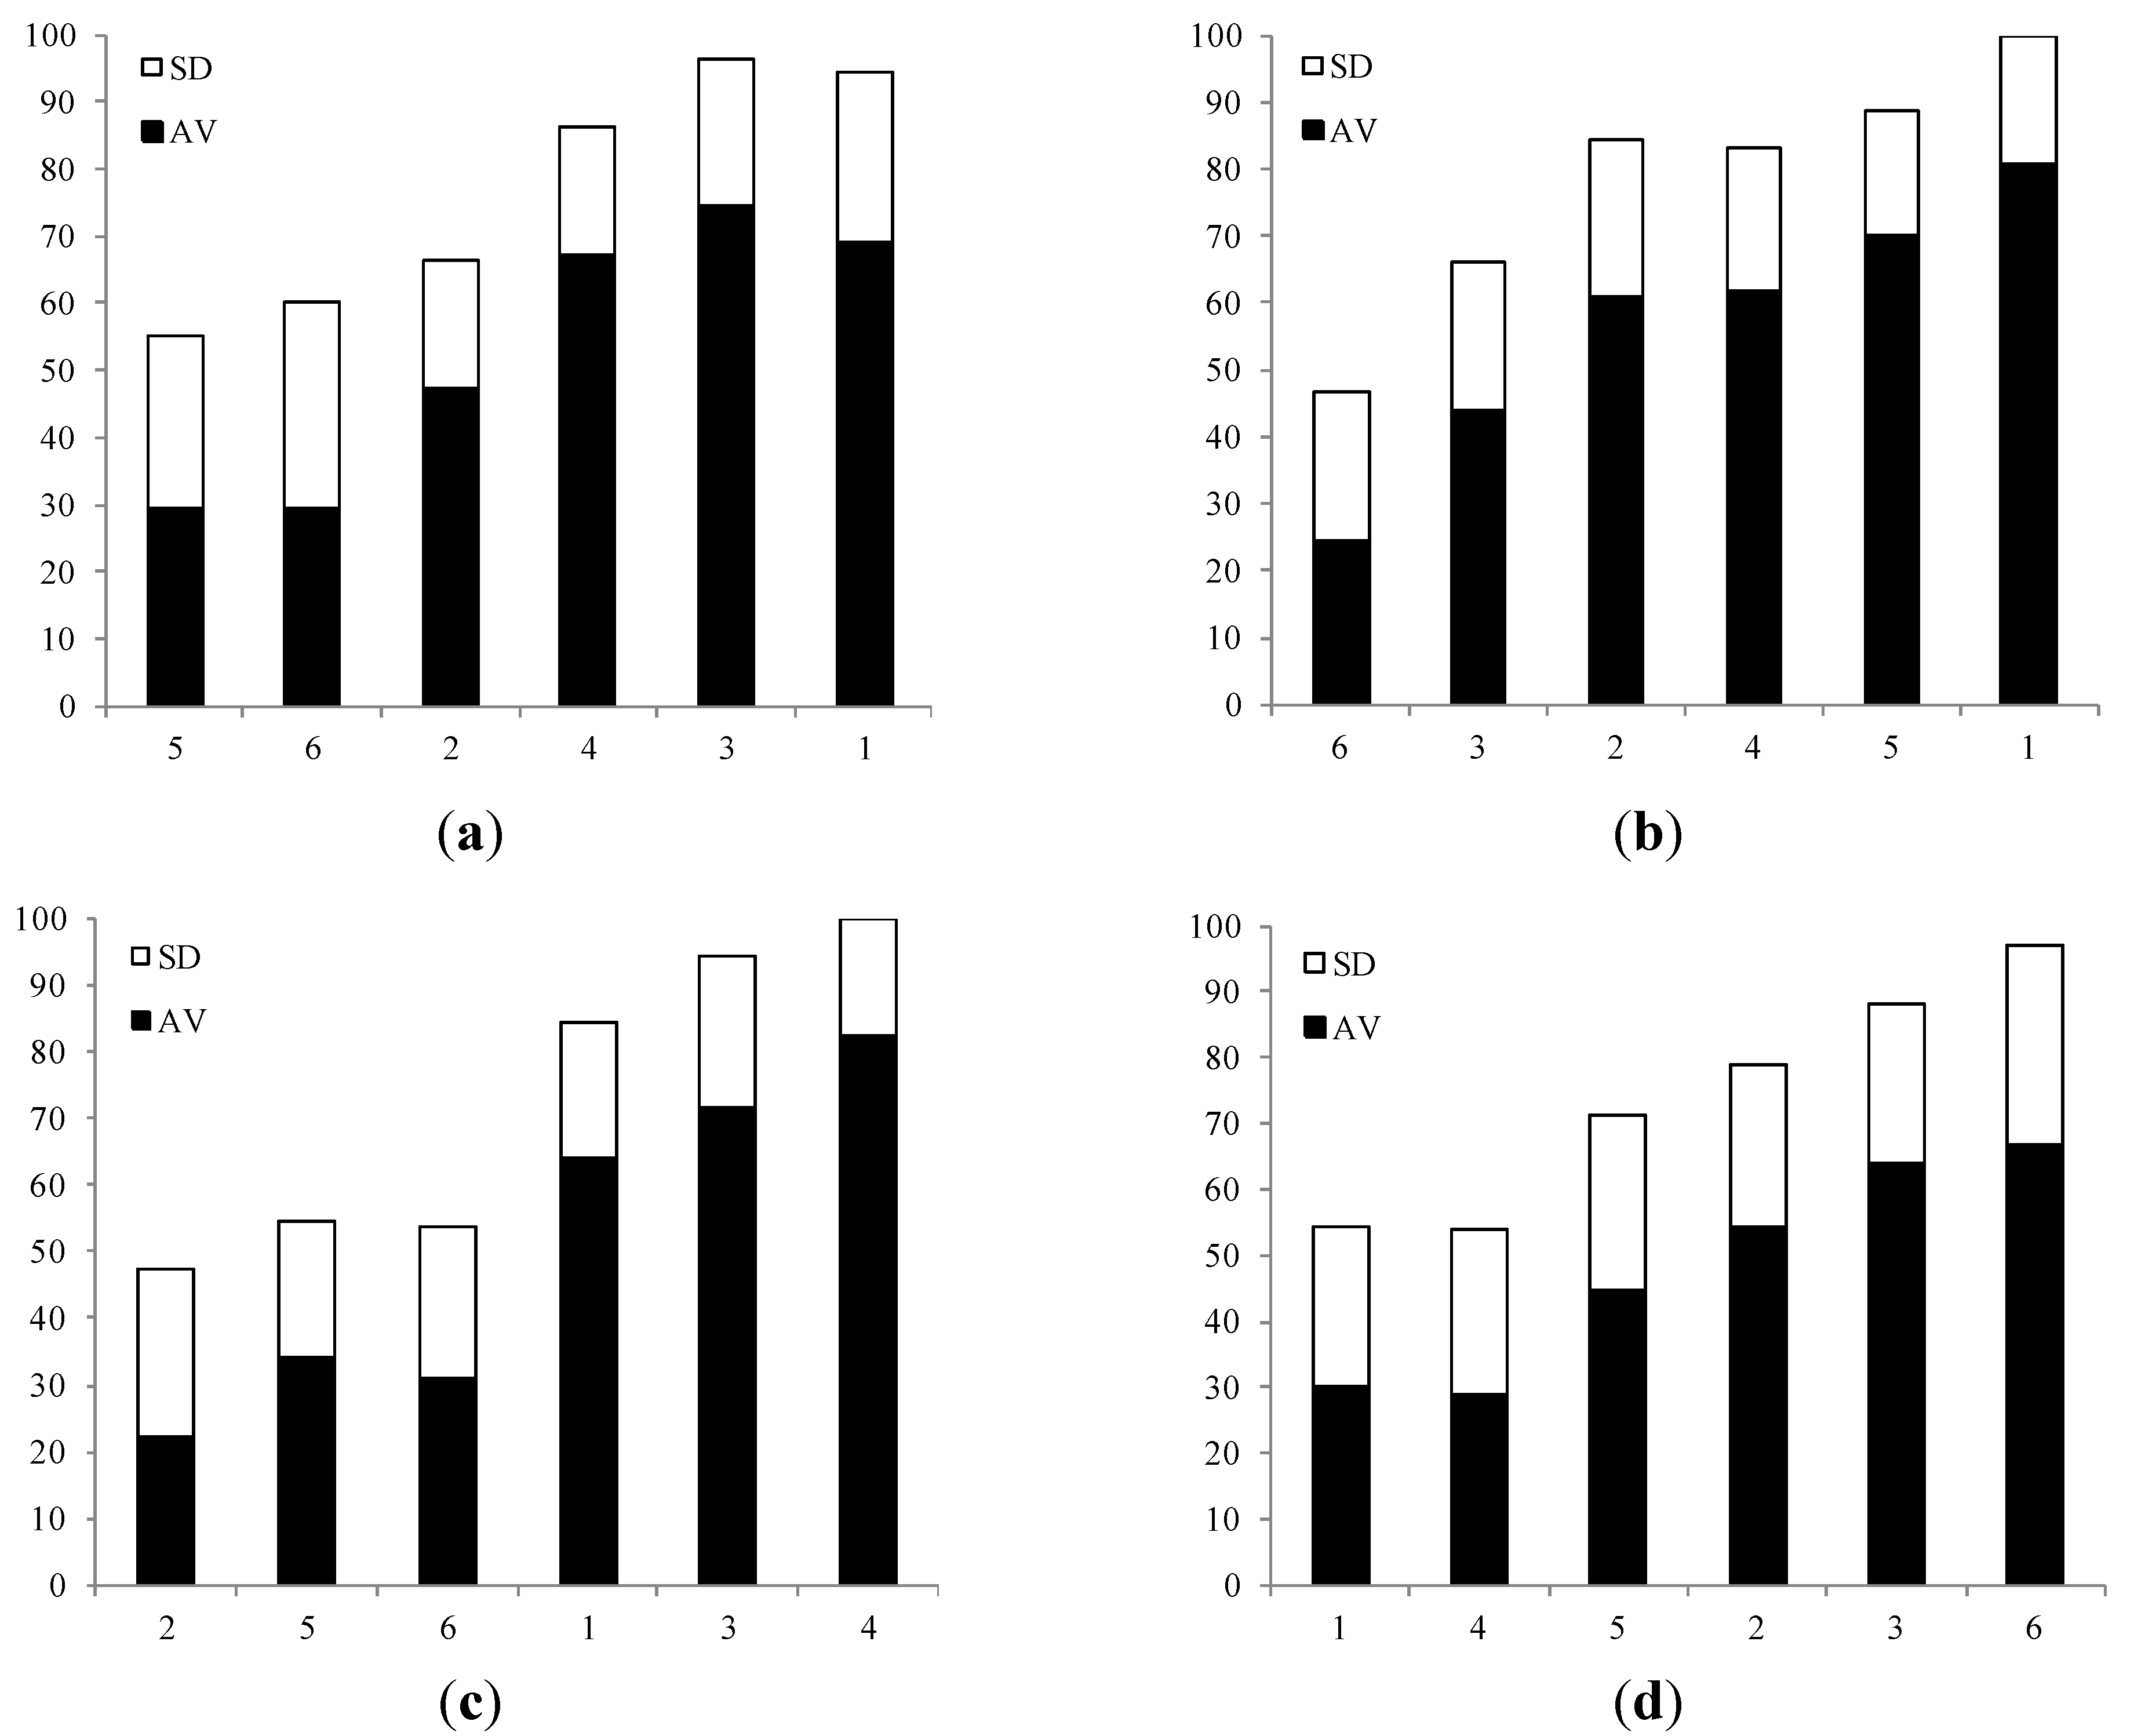
Figure 4.
Stage 3 estimations (%) by the general public for the variables (a) aesthetics; (b) land cost; (c) habitat for species; and (d) safety. based on different pictures represented by numbers on the x-axis. SD, standard deviation; AV, average.
Figure 4.
Stage 3 estimations (%) by the general public for the variables (a) aesthetics; (b) land cost; (c) habitat for species; and (d) safety. based on different pictures represented by numbers on the x-axis. SD, standard deviation; AV, average.
3.5. Strengths and Limitations
The strengths of the new ecosystem services approach to SuDS retrofitting, particularly in comparison to the community and environment methodology adopted by others [
13,
28], are as follows:
Generic retrofitting approach based on universal ecosystem service variables;
Recognition that various professions have different priority variables;
Expert judgment may be more accurate than prediction models if the science base is strong, the learnability high and sufficient information is available [
21,
26];
Inexpensive, user-friendly and easy-to-understand evaluation; and
Overall ecosystem service potential of a site expressed through an individual value.
The potential weaknesses of the ecosystem services assessment approach are:
Subjectivity and aggregation are generic limitations of an expert-based system, which can be addressed by involving expert groups and determination of uncertainty values for all estimations [
14,
29,
30];
Some ecosystem service variables are not always applicable;
Strong perceived (often falsely; see below) bias towards natural sites and “soft” SuDS (e.g., ponds and wetlands) in contrast to urban sites and “hard” SuDS (e.g., permeable pavements and belowground storage systems); and
Possibility of multicollinearity among variables due to potential dependencies between some of them [
31].
Table 7.
Assessment of the statistically significant differences between different cohorts of estimators (civil engineering, ecology
and social science students, and the general public) for selected SuDS characterization variables (
aesthetics,
land cost,
habitat for species and
safety) using the non-parametric Mann-Whitney U-test (see also
Section 2.7).
Table 7.
Assessment of the statistically significant differences between different cohorts of estimators (civil engineering, ecology and social science students, and the general public) for selected SuDS characterization variables (aesthetics, land cost, habitat for species and safety) using the non-parametric Mann-Whitney U-test (see also Section 2.7).
| Cohort comparisons | Statistic | Aesthetics | Land cost | Habitat for species | Safety |
|---|
| Civil engineers and ecologists | P | 0.000 | 0.004 | 0.994 | 0.494 |
| H | 1 | 1 | 0 | 0 |
| Civil engineers and social scientists | P | 0.004 | 0.157 | 0.379 | 0.027 |
| H | 1 | 0 | 0 | 1 |
| Civil engineers and the general public | P | 0.396 | 0.094 | 0.050 | 0.002 |
| H | 0 | 0 | 0 | 1 |
| Ecologists and social scientists | P | 0.070 | 0.183 | 0.500 | 0.175 |
| H | 0 | 0 | 0 | 0 |
| Ecologists and the general public | P | 0.000 | 0.000 | 0.072 | 0.018 |
| H | 1 | 1 | 0 | 1 |
| Social scientists and the general public | P | 0.002 | 0.006 | 0.311 | 0.453 |
| H | 1 | 1 | 0 | 0 |
Some of the above limitations such as subjectivity are also inherent in traditional assessment approaches [
1,
13]. However, multicollinearity might be a more relevant problem with the proposed ecosystem services approach due to the use of a high number of variables. In order to avoid artificial dependencies between some variables that could be considered as similar by the inexperienced assessor, all assessors need to be clear about their differences, which require training by more experiences evaluators. Considering that any tests for multicollinearity is case study-dependant, the inevitable bias associated with a case study does not allow for objective testing unless the number of case studies is very high and there is an adequate geographical spread to reduce bias. Nevertheless, a principal component analysis was carried out to identify redundant variables in order to reduce the risk of multicollinearity [
31]. Findings indicate that all ecosystem services variables (
Table 1) were considered to be necessary for the proposed expert system.


