Impact of Damaging Geo-Hydrological Events and Population Development in Calabria, Southern Italy


Abstract
:1. Introduction
2. Materials and Methods
2.1. Damage Data Collection

| Event identification | Time | Damaging phenomena | Damaged elements |
|---|---|---|---|
| Record number | Year | Landslide | People (victims injured) |
| Municipality | Month | Flood | Roads |
| Place name | Day | Strong wind | Buildings (private) |
| Hour | Storm surge, etc. | Buildings (public) | |
| Services: electric/telephonic lines, aqueducts, drainage, systems, gas pipelines, embankments, dams, retaining walls . | |||
| Productive activities: Industry, commerce and handcraft, tourism, agriculture, farming |
2.2. Damage Assessment
- a
- The data available mainly pertains to the direct damage [34], which includes the physical effects such as the destruction and changes that reduce the functionality of an individual or structure, the damage to people (death/injury), buildings, their contents, and vehicles, and the clean-up and disposal costs. The data about the indirect and intangible damage caused by old events are generally either unavailable or scattered and, thus, cannot be systematically analyzed;
- b
- The economic data about the direct damage are rare and can be incomplete and underestimated. These data depend on an exact appraisal of the costs based on private documents, mainly those documents reporting the damage refund, which are almost impossible to consult for old events. Even if these documents are consulted, an underestimation can arise because, in some administrative contexts, the time for the refund can span several years; it is virtually impossible to isolate a temporal section of an archive in which “all” of the refund documents are included.
2.3. Rainfall Data Gathering and Analysis
2.4. Data on the Anthropogenic Framework of the Study Area
2.5. Data Analysis and Synthesis

3. Introduction to the Case Study
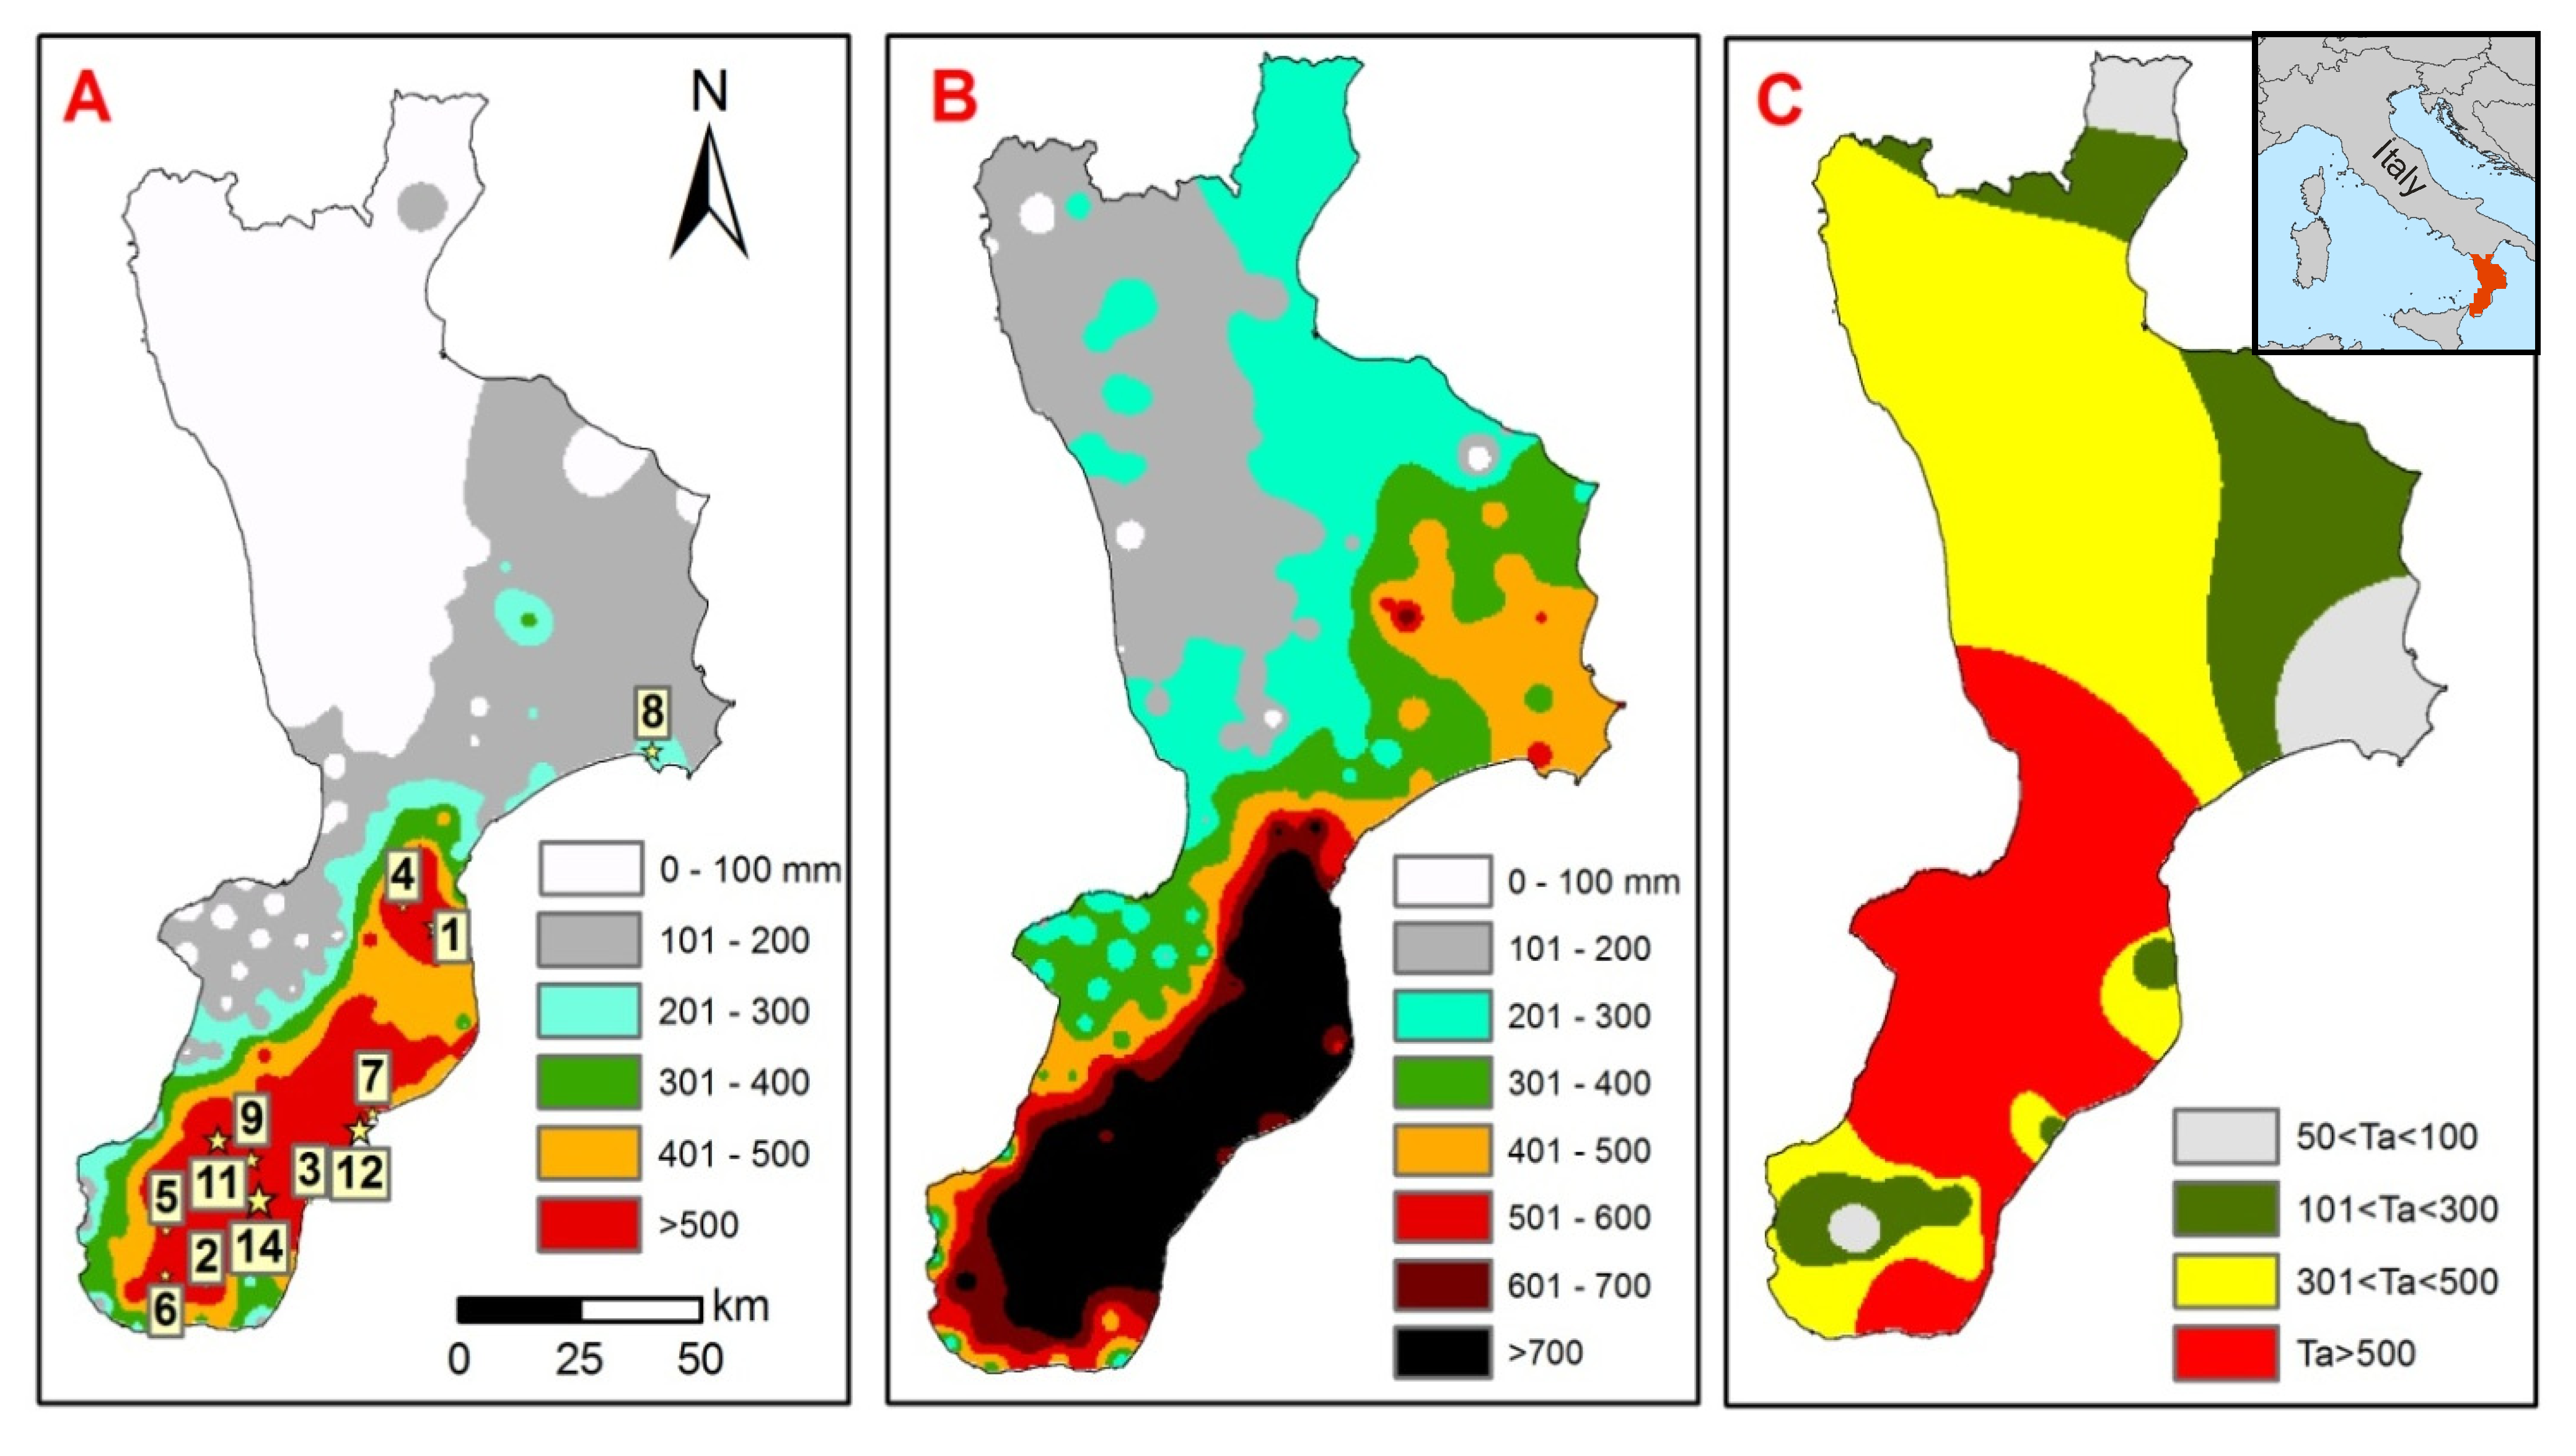
3.1. Rainfall Analysis

| No. | Raingauge | Altitude (m) [H] | Length of the series (years) [L] | Max event daily rain (mm) [D] | Max event daily rain/Oct monthly average [D/Ma] | Oct 1951 monthly rain/Oct monthly ave ge [M/Ma] | Oct 1951 monthly rain/average yearly rain [M/Ya] | T1d | T3d | T5d | Ta |
|---|---|---|---|---|---|---|---|---|---|---|---|
| 1 | Badolato | 250 | 30 | 371.2 | 2.09 | 8.22 | 1.24 | 1 | 3 | 3 | 2 |
| 2 | Bova S. | 800 | 58 | 261.4 | 2.08 | 6.96 | 1.06 | 2 | 4 | 4 | 4 |
| 3 | Bovalino M. | 8 | 38 | 462.9 | 3.29 | 5.22 | 1.00 | 4 | 4 | 3 | 4 |
| 4 | Chiaravalle C. | 550 | 60 | 436.1 | 2.72 | 9.03 | 1.09 | 2 | 4 | 4 | 4 |
| 5 | Croce Romeo | 1350 | 10 | 250.4 | 1.48 | 6.06 | 0.81 | 1 | 1 | 1 | 1 |
| 6 | Croce S.Lorenzo | 425 | 36 | 274.3 | 2.10 | 5.83 | 0.93 | 2 | 3 | 3 | 3 |
| 7 | Gioiosa Ionica | 125 | 60 | 303.1 | 2.54 | 6.59 | 0.92 | 3 | 4 | 4 | 4 |
| 8 | Isola C. Rizzuto | 96 | 54 | 179.6 | 1.76 | 5.35 | 0.81 | 1 | 1 | 1 | 1 |
| 9 | Plati’ | 310 | 60 | 373.3 | 1.96 | 7.12 | 0.83 | 3 | 4 | 4 | 4 |
| 10 | S. Sostene | 475 | 47 | 417.1 | 2.15 | 8.37 | 1.15 | 2 | 4 | 4 | 4 |
| 11 | S. Cristina | 510 | 57 | 534.6 | 3.11 | 10.29 | 1.28 | 2 | 4 | 4 | 4 |
| 12 | Siderno M. | 7 | 55 | 271.2 | 2.41 | 5.46 | 0.92 | 2 | 2 | 3 | 2 |
| 13 | Santuario Polsi | 786 | 37 | 410.2 | 1.93 | 7.23 | 0.81 | 1 | 2 | 2 | 2 |
| 14 | S. Luca | 250 | 57 | 410.2 | 2.63 | 5.60 | 0.83 | 1 | 3 | 3 | 2 |
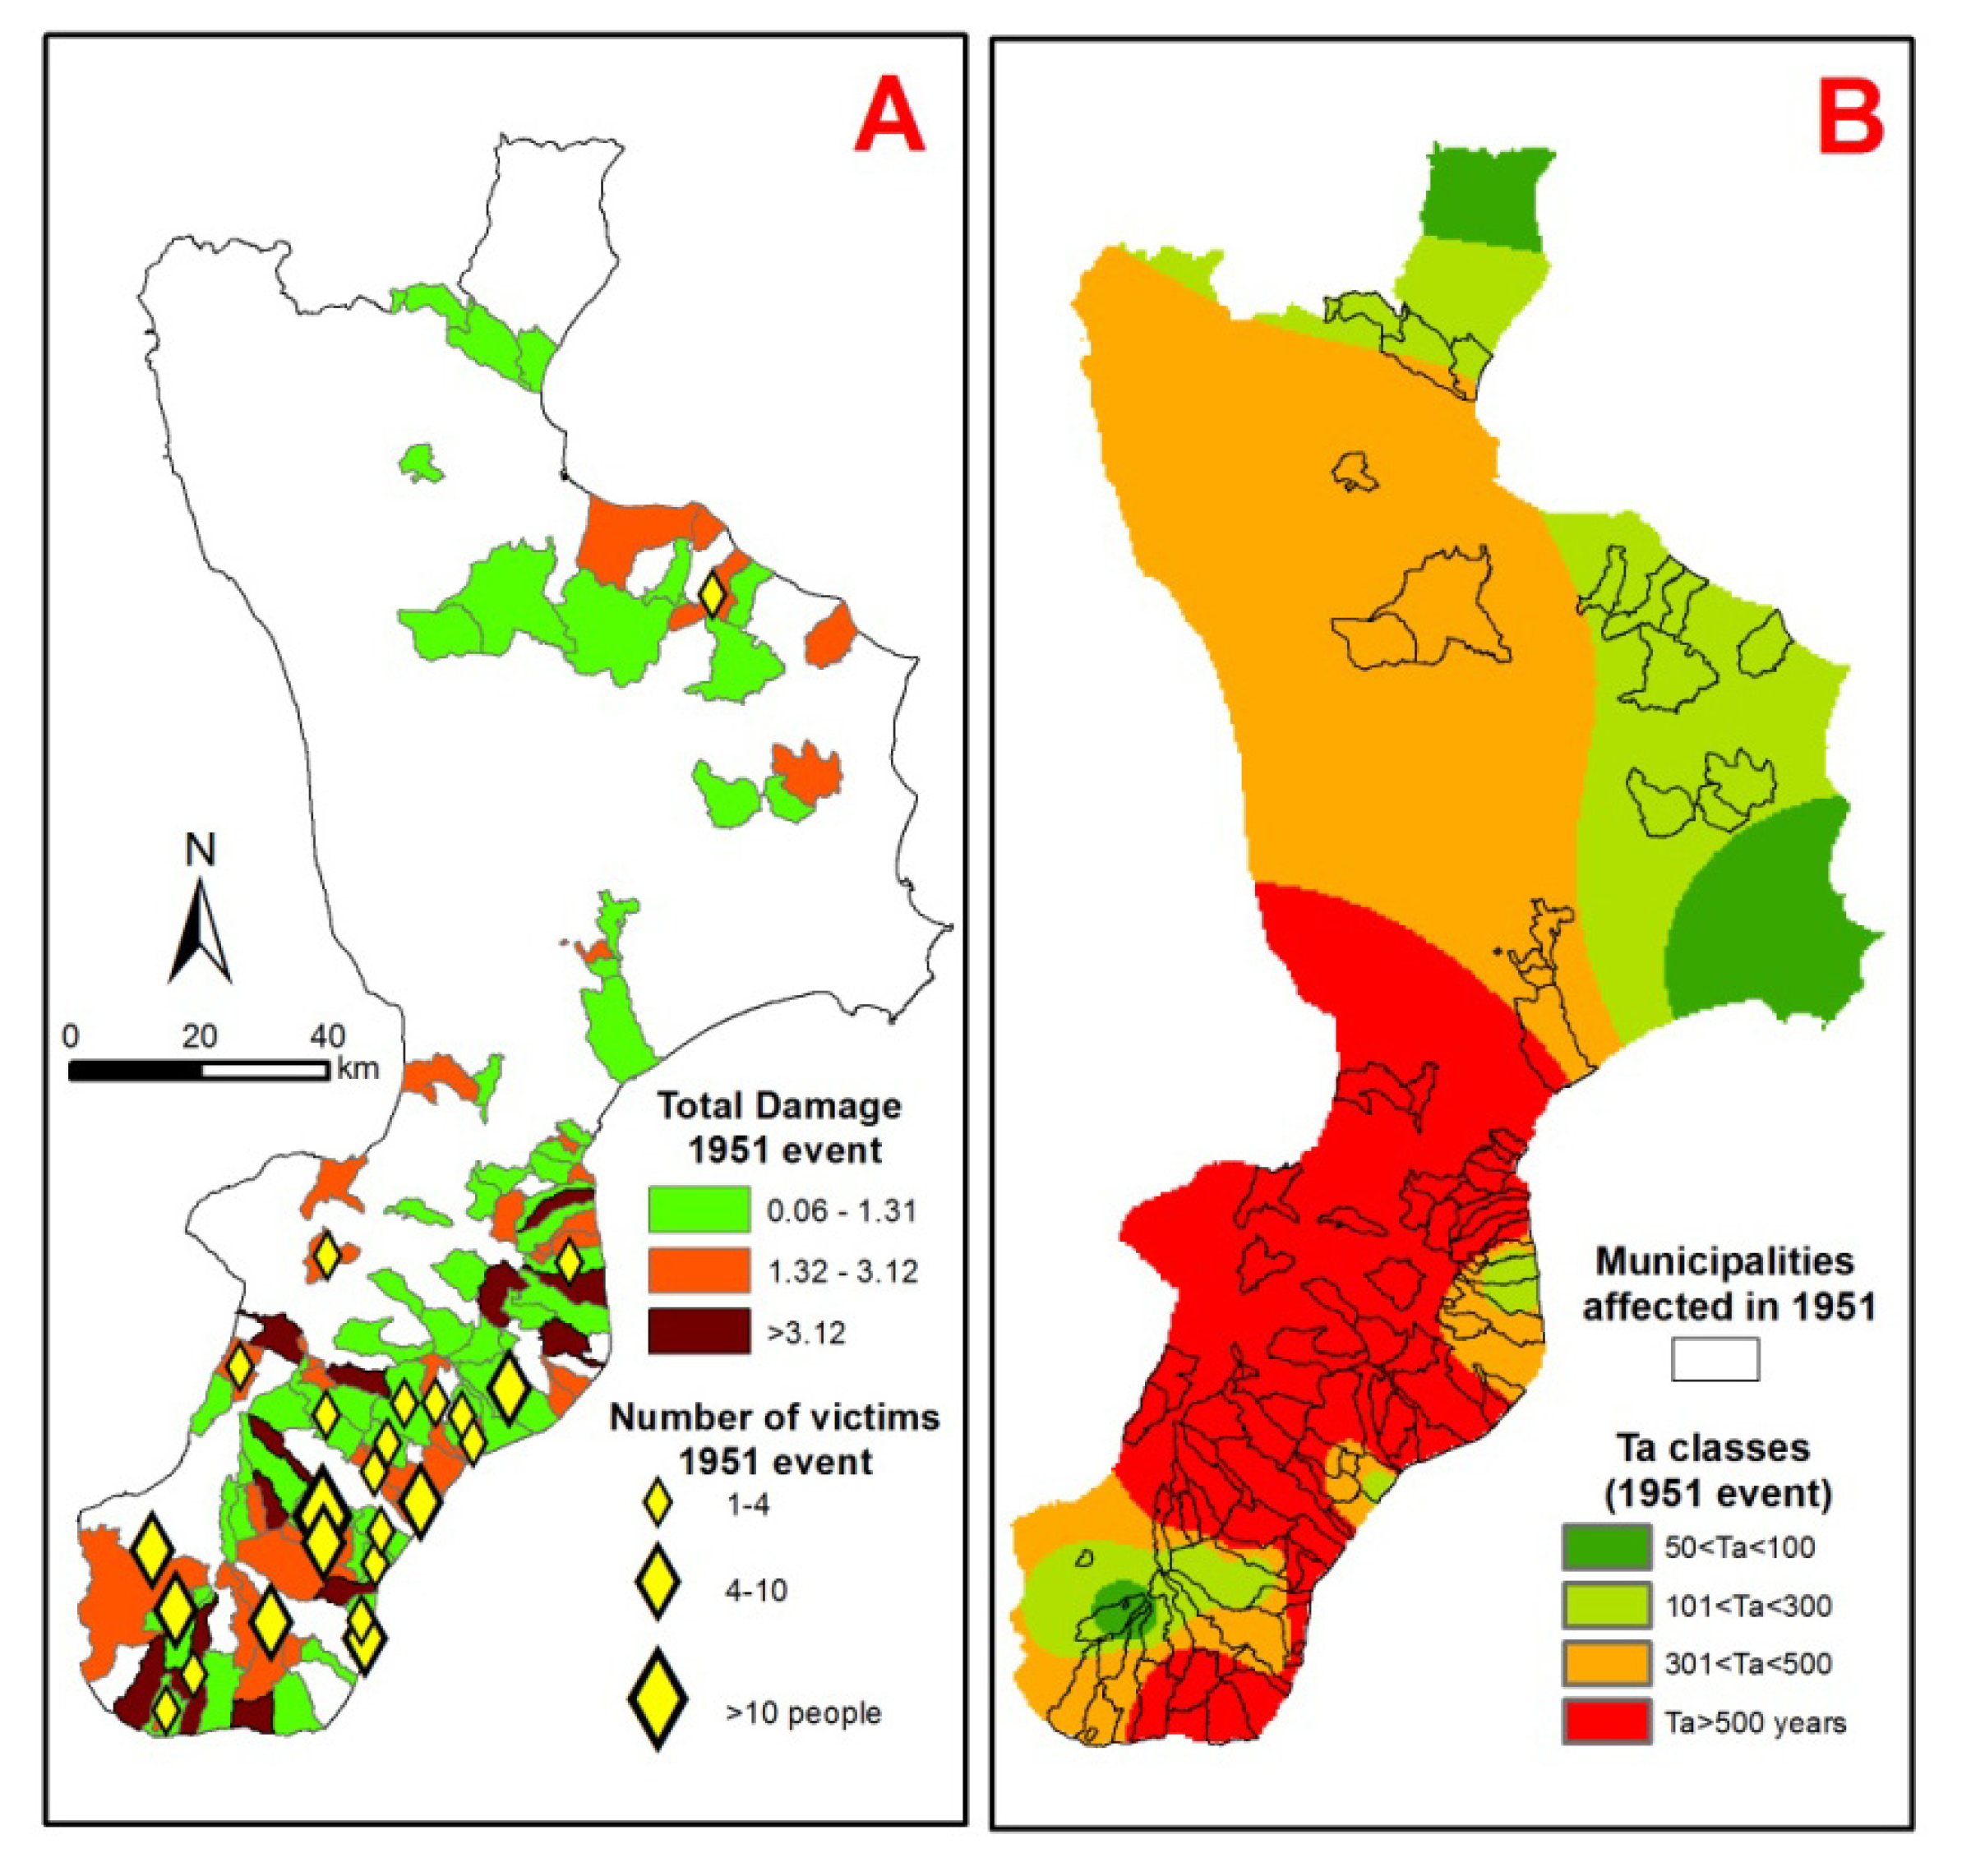
3.2. Damage Analysis

3.3. The Anthropogenic Framework of the Study Area
| Inhabitants | Year 1951 | Year 2010 |
|---|---|---|
| Regional Nh | 1,995,084 | 2,011,391 |
| Min Nh (M) | 883 | 291 |
| Max Nh (M) | 140,734 | 186,547 |
| Mean Nh (M) | 4,878 | 4,918 |
| Modal value of Nh (M) | 1,604 | 538 |
| Median of Nh (M) | 3,035 | 2,251 |
| Min PD (M) | 8 | 9 |
| Max PD (M) | 1,923 | 1,868 |
| Mean PD (M) | 157 | 144 |
| Modal value of PD (M) | 94 | 156 |
| Median of PD (M) | 121 | 79 |
3.4. Discussion
| Municipality | Δd | Ta | Municipality | Δd | Ta |
|---|---|---|---|---|---|
| ACQUARO | LONGOBUCCO | ||||
| ACRI | LUZZI | ||||
| AFRICO | 9 | MAMMOLA | 4 | ||
| ALBI | MANDATORICCIO | ||||
| ANTONIMINA | 2 | MARINA DI GIOIOSA IONICA | 2 | ||
| ARDORE | 1 | MELICUCCO | |||
| BADOLATO | 1 | MELITO DI PORTO SALVO | 1 | ||
| BAGALADI | MILETO | 1 | |||
| BELVEDERE DI SPINELLO | MONTAURO | ||||
| BENESTARE | MONTEBELLO IONICO | ||||
| BIANCO | 2 | MONTEPAONE | |||
| BIVONGI | NARDODIPACE | ||||
| BOVA | OPPIDO MAMERTINA | ||||
| BOVA MARINA | PALIZZI | ||||
| BOVALINO | 2 | PALMI | |||
| BRUZZANO ZEFFIRIO | PENTONE | ||||
| CACCURI | PETRIZZI | ||||
| CAMPANA | PIETRAPAOLA | 2 | |||
| CANOLO | 3 | PLATI' | 18 | ||
| CARDETO | 7 | POLISTENA | |||
| CARDINALE | PORTIGLIOLA | ||||
| CARERI | 10 | REGGIO DI CALABRIA | |||
| CASABONA | RIACE | ||||
| CASIGNANA | ROCCELLA IONICA | ||||
| CATANZARO | ROGHUDI | ||||
| CAULONIA | 10 | ROSARNO | |||
| CERCHIARA DI CALABRIA | ROSSANO | ||||
| CHIARAVALLE CENTRALE | S. GIORGIO MORGETO | ||||
| CINQUEFRONDI | S. LORENZO | 1 | |||
| CITTANOVA | 3 | S. LORENZO BELLIZZI | |||
| CONDOFURI | S. LORENZO DEL VALLO | ||||
| COSOLETO | S. LUCA | ||||
| CROPALATI | S. SOSTENE | ||||
| CROSIA | S. CATERINA DELLO IONIO | ||||
| CRUCOLI | S. CRISTINA D'ASPROMONTE | ||||
| CURINGA | S. ALESSIO IN ASPROMONTE | 7 | |||
| DAVOLI | S. ANDREA AP. DELLO IONIO | ||||
| DELIANUOVA | SATRIANO | ||||
| FABRIZIA | SCIDO | ||||
| FOSSATO SERRALTA | SERRA SAN BRUNO | ||||
| GALATRO | SIDERNO | ||||
| GASPERINA | SOVERATO | ||||
| GERACE | STIGNANO | ||||
| GIOIA TAURO | 1 | STILO | |||
| GIOIOSA IONICA | 2 | TAURIANOVA | |||
| GROTTERIA | 2 | TORRE DI RUGGIERO | |||
| GUARDAVALLE | VARAPODIO | ||||
| ISCA SULLO IONIO | VAZZANO | ||||
| JACURSO | VIBO VALENTIA | ||||
| LOCRI | 10 | VILLAPIANA |
 ,
,  ,
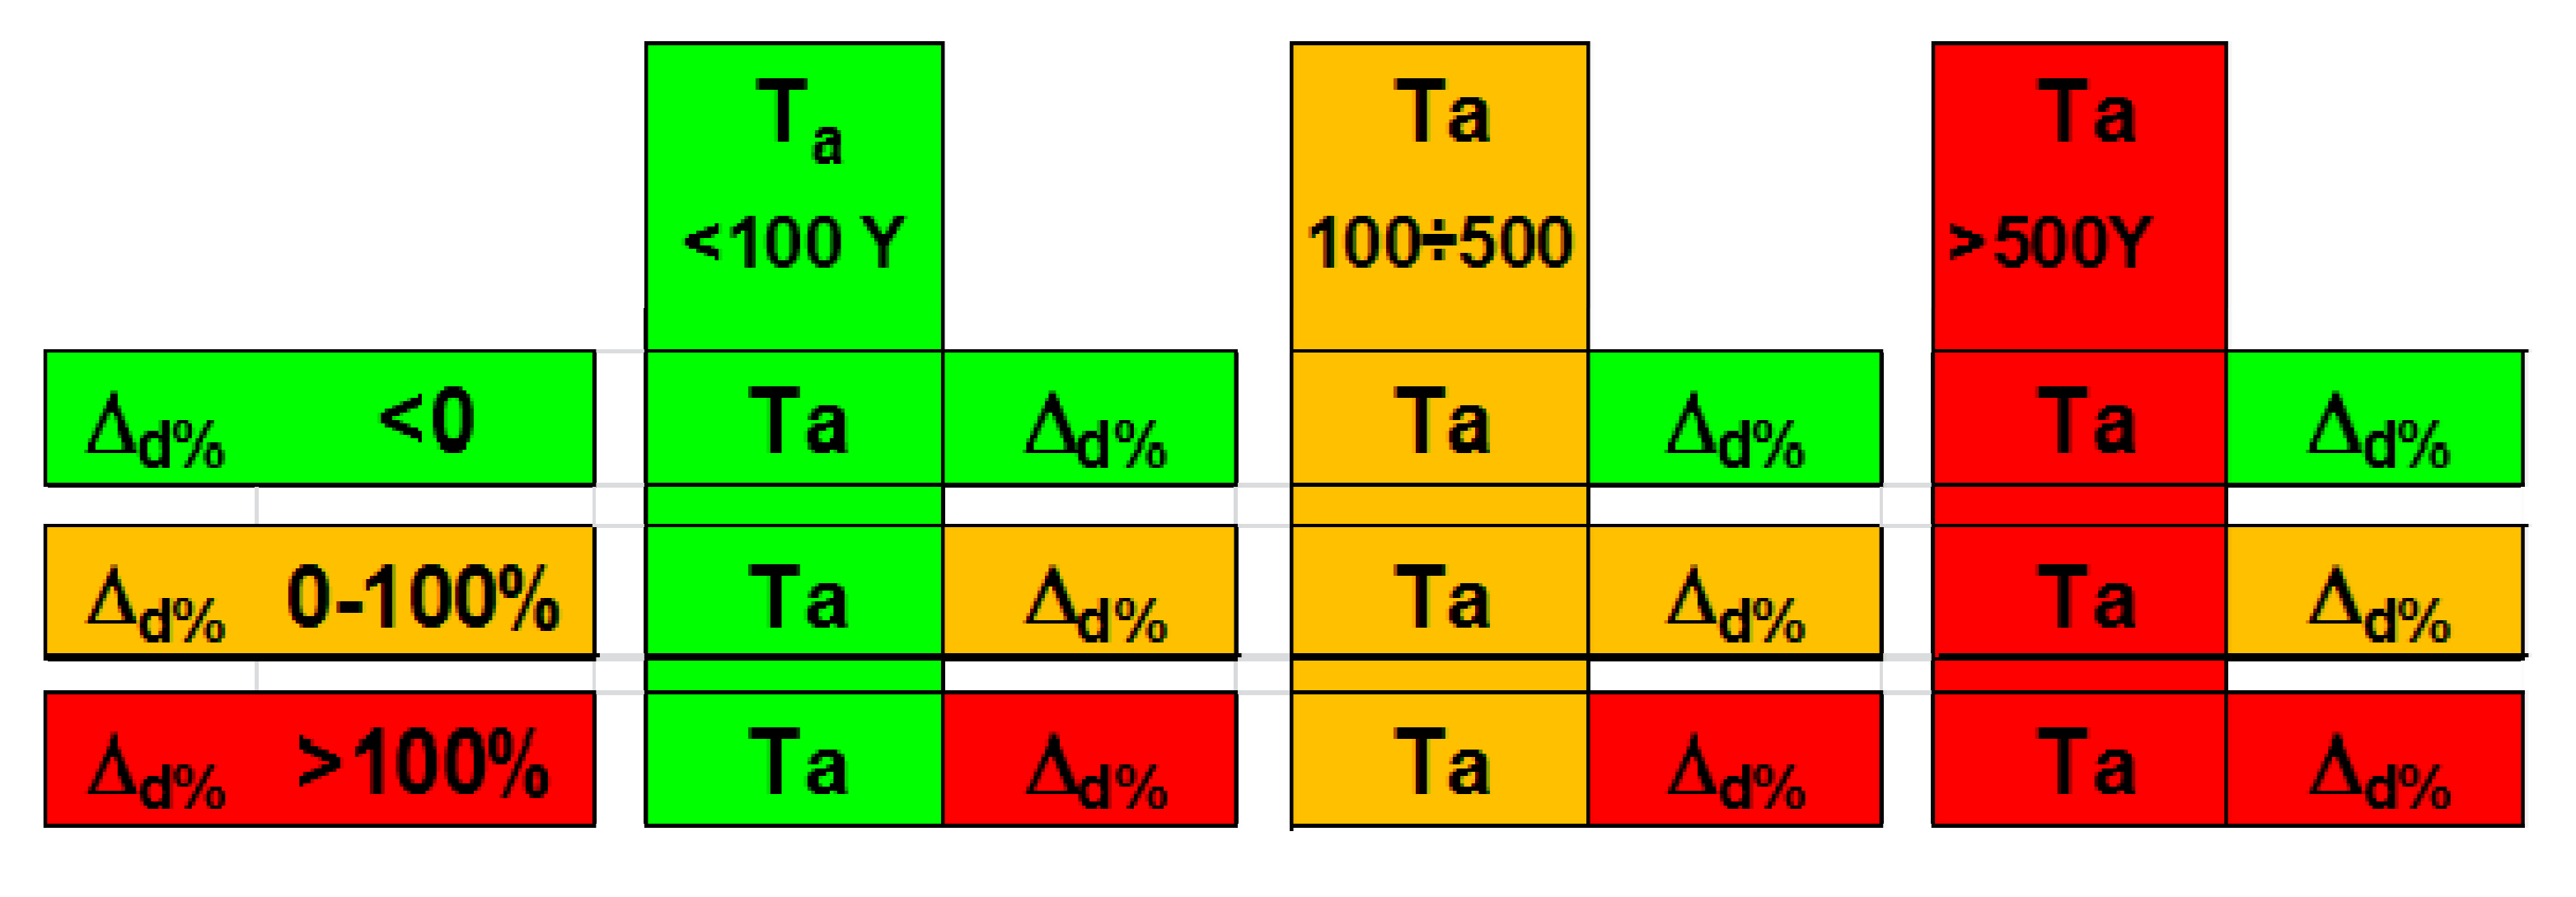
,  ; T Classes:
  ,
,  ,
,  .
.4. Conclusions

Acknowledgments
Conflicts of Interest
References
- Petrucci, O.; Polemio, M.; Pasqua, A.A. Analysis of damaging hydrogeological events: The case of the Calabria Region (Southern Italy). Environ. Manag. 2009, 25, 483–495. [Google Scholar] [CrossRef] [Green Version]
- Petrucci, O.; Polemio, M. The role of meteorological and climatic conditions in the occurrence of damaging hydro-geologic events in Southern Italy. Nat. Hazards Earth Syst. Sci. 2009, 9, 105–118. [Google Scholar]
- Llasat, M.C.; Llasat-Botija, M.; Petrucci, O.; Pasqua, A.A.; Rosselló, J.; Vinet, F.; Boissier, L. Towards a database on societal impact of Mediterranean floods in the framework of the HYMEX project. Nat. Hazards Earth Syst. Sci. 2013, 13, 1337–1350. [Google Scholar] [CrossRef]
- Blahut, J.; Poretti, I.; de Amicis, M.; Sterlacchini, S. Database of geo-hydrological disasters for civil protection purposes. Nat. Hazards 2012, 60, 1065–1083. [Google Scholar] [CrossRef]
- Crozier, M.J. Multiple-occurrence regional landslide events in New Zealand: Hazard management issues. Landslides 2005, 2, 247–256. [Google Scholar] [CrossRef]
- Copien, C.; Frank, C.; Becht, M. Natural hazards in the Bavarian Alps: A historical approach to risk assessment. Nat. Hazards 2008, 45, 173–181. [Google Scholar] [CrossRef]
- Petrucci, O.; Pasqua, A.A.; Gullà, G. Landslide damage assessment using the Support Analysis Framework (SAF): The 2009 landsliding event in Calabria (Italy). Adv. Geosci. 2010, 26, 13–17. [Google Scholar]
- May, F. Cascading disaster models in post burn flash flood. In The Fire Environment—Innovations, Management, and Policy; Butler, B.W., Cook, W., Eds.; U.S. Department of Agriculture, Forest Service, Rocky Mountain Research Station: Fort Collins, CO, USA, 2007; pp. 443–464. [Google Scholar]
- Rappaport, E.N. Loss of life in the United States associated with recent atlantic tropical cyclones. Bull. Am. Meteorol. Soc. 2000, 9, 2065–2073. [Google Scholar] [CrossRef]
- Agasse, E. Flooding during the 17th to 20th centuries in Normandy (Western France): Methodology and use of historical data. Barcelona, Spain, 16–19 October 2003; Thorndycraft, V.R., Benito, G., Barriendos, M., Llasat, M.C., Eds.; pp. 99–105.
- Devoli, G.; Morales, A.; Høeg, K. Historical landslides in Nicaragua-collection and analysis of data. Landslides 2007, 4, 5–18. [Google Scholar] [CrossRef]
- Hilker, N.; Badoux, A.; Hegg, C. The Swiss flood and landslide damage database 1972–2007. Nat. Hazards Earth Syst. Sci. 2009, 9, 913–925. [Google Scholar] [CrossRef]
- Kuriakose, S.L.; Sankar, G.; Muraleedharan, C. History of landslide susceptibility and a chorology of landslide-prone areas in the Western Ghats of Kerala, India. Environ. Geol. 2009, 57, 1553–1568. [Google Scholar] [CrossRef]
- Llasat, M.C.; Llasat-Botija, M.; Barnolas, M.; Lopez, L.; Altava-Ortiz, V. An analysis of the evolution of hydrometeorological extremes in newspapers: The case of Catalonia, 1982–2006. Nat. Hazards Earth Syst. Sci. 2009, 9, 1201–1212. [Google Scholar] [CrossRef]
- Maples, L.Z.; Tiefenbacher, J.P. Landscape, development, technology and drivers: The geography of drownings associated with automobiles in Texas floods, 1950–2004. Appl. Geogr. 2009, 29, 224–234. [Google Scholar] [CrossRef]
- Adhikari, P.; Hong, Y.; Douglas, K.R.; Kirschbaum, D.B.; Gourley, J. A digitized global flood inventory (1998–2008): Compilation and preliminary results. Nat. Hazards 2010, 2, 405–422. [Google Scholar]
- FitzGerald, G.; Du, W.; Jamal, A.; Clark, M.; Hou, X. Flood fatalities in contemporary Australia (1997–2008). Emerg. Med. Aust. 2010, 22, 180–186. [Google Scholar] [CrossRef]
- Brázdil, R.; Kundzewicz, Z.W. Historical hydrology–Editorial hydrological sciences. Hydrol. Sci. J. 2006, 51, 733–738. [Google Scholar] [CrossRef]
- Llasat, M.C.; Barriendos, M.; Barrera, A. The use of historical data in flood risk assessment, application to Catalonia (NE Spain) 14th–20th Centuries. In View from the South, Environmental Stories from the Mediterranean Word; Armiero, M., Ed.; Consiglio Nazionale delle Ricerche, Istituto di Studi sulle Società del Mediterraneo: Napoli, Italy, 2006; pp. 95–110. [Google Scholar]
- Kirschbaum, D.B.; Adler, R.; Hong, Y.; Hill, S.; Lerner-Lam, A.L. A global landslide catalogue for hazard applications: Method, results and limitations. Nat. Hazards 2009, 52, 561–575. [Google Scholar]
- Petrucci, O.; Gullà, G. A simplified method for landslide damage scenario assessment based on historical data. Nat. Hazards 2010, 52, 539–560. [Google Scholar] [CrossRef]
- Petrucci, O.; Pasqua, A.A.; Polemio, M. Flash flood occurrences since 17th century in steep drainage basins in southern Italy. Environ. Manag. 2012, 50, 807–818. [Google Scholar] [CrossRef]
- Guzzetti, F. Landslide fatalities and the evaluation of landslide risk in Italy. Eng. Geol. 2000, 58, 89–107. [Google Scholar] [CrossRef]
- Petrucci, O.; Pasqua, A.A. The study of past Damaging Hydrogeological Events for damage susceptibility zonation. Nat. Hazards Earth Syst. Sci. 2008, 8, 881–892. [Google Scholar] [CrossRef]
- Petrucci, O.; Pasqua, A.A. A methodological approach to characterise Landslide Periods based on historical series of rainfall and landslide damage. Nat. Hazards Earth Syst. Sci. 2009, 9, 1655–1670. [Google Scholar] [CrossRef]
- Petrucci, O.; Pasqua, A.A. Damaging events along roads during bad weather periods: A case study in Calabria (Italy). Nat. Hazards Earth Syst. Sci. 2012, 12, 365–378. [Google Scholar] [CrossRef]
- Petrucci, O. Assessment of the impact caused by natural disasters: Simplified procedures and open problems. Managing Disasters, Assessing Hazards, Emergencies and Disaster Impacts; Tiefenbacher, J.P., Ed.; InTech: Rijeka, Croatia, 2012; pp. 109–132. Available online: http://www.intechopen.com/books/approaches-to-managing-disaster-assessing-hazards-emergencies-and-disaster-impacts (accessed on 12 September 2013).
- Frigerio, S.; Blahut, J.; Sterlacchini, S.; Poretti, I. Landslides historical dataset and population distribution: Historic@, the experience of the consortium of Mountain Municipalities of Valtellina di Tirano, Italy. Malet, J.-P., Glade, T., Casagli, N., Eds.; CERG Publications: Strasbourg, France, 2010; pp. 491–497. [Google Scholar]
- Llasat, M.C.; Barriendos, M.; Barrera, A.; Rigo, T. Floods in Catalonia (NE Spain) since the 14th century. Climatological and meteorological aspects from historical documentary sources and old instrumental records. J. Hydrol. 2005, 313, 32–47. [Google Scholar] [CrossRef]
- Mudelsee, M.; Deutsch, M.; Börngen, M.; Tetzlaff, G. Trends in flood risk of the River Werra (Germany) over the past 500 years. Hydrol. Sci. J. 2006, 51, 818–833. [Google Scholar] [CrossRef]
- The International Disaster Database Homepage. Available online: http://www.emdat.be/ (accessed on 6 November 2013).
- Munich Re Homepage. Available online: http://mrnathan.munichre.com/ (accessed on 6 November 2013).
- Beckman, L. An Annotated Bibliography of Natural Hazard Loss DataSets Derived from the Hazards Loss Dataset Catalog. 2009. Available online: http://www.colorado.edu/hazards/publications/hazloss/loss_catalog.pdf (accessed on 12 September 2013).
- Swiss Re, Floods—An insurable risk? Swiss Re: Zurich, Switzerland, 1998; Volume 48.
- Petrucci, O.; Gullà, G. A Support Analysis Framework for mass movement damage assessment: Applications to case studies in Calabria (Italy). Nat. Hazards Earth Syst. Sci. 2009, 9, 315–326. [Google Scholar] [CrossRef]
- Llasat, M.C.; Lopez, L.; Barnolas, M.; Llasat-Botija, M. Flash-floods in Catalonia: The social perception in a context of changing vulnerability. Adv. Geosci. 2008, 17, 63–70. [Google Scholar] [CrossRef]
- Istituto Nazionale di Statistica Homepage. Available online: http://www.istat.it/it/ (accessed on 6 November 2013).
- Petrucci, O.; Chiodo, G.; Caloiero, D. Eventi alluvionali in Calabria nel decennio 1971–1980. Available online: http://books.google.it/books/about/Eventi_alluvionali_in_Calabria_nel_decen.html?id=JqQtrxZhkpsC&redir_esc=y (accessed on 12 September 2013).
- D’Andrea, E.; Petrucci, O. Gli Eventi Alluvionali Calabresi di Dicembre 2002 Gennaio 2003; Editoriale Bios: Cosenza, Italy, 2002. [Google Scholar]
- Petrucci, O.; Versace, P. ASICal: A Database of Landslides and Floods Occurred in Calabria (Italy). In Proceedings of 1st Italian-Russian Workshop: New Trends in Hydrology, Rende, Italy, 24–26 September 2002; pp. 49–55.
- Petrucci, O.; Versace, P. Frane e Alluvioni in Provincia di Cosenza Agli Inizi del ‘900:Ricerche Storiche Nella Documentazione del Genio Civile; Editoriale Bios: Cosenza, Italy, 2005; p. 172. [Google Scholar]
- Petrucci, O.; Versace, P. Frane e Alluvioni in Provincia di Cosenza Tra il 1930e il 1950:Ricerche Storiche Nella Documentazione del Genio Civile; Nuova Bios: Cosenza, Italy, 2007; p. 247. [Google Scholar]
- Palmieri, W.; Petrucci, O.; Versace, P. La Difesa del Suolo Nell’Ottocento nel Mezzogiorno d’Italia; Rubbettino: Soveria Mannelli, Italy, 2011; p. 183. [Google Scholar]
- Botta, G. Difesa del Suolo e Volontà Politica , Inondazioni Fluviali e Frane in Italia: 1946–1976; Franco Angeli: Milano, Italy, 1977. [Google Scholar]
- Caloiero, D.; Mercuri, T. Le Alluvioni in Calabria dal 1921 al 1970; Consiglio Nazionale delle Ricerche: Rende, Italy, 1980; p. 161. [Google Scholar]
- ARPACAL, Centro Funzionale Multirischi Homepage. Available online: http://www.cfd.calabria.it/index.php?option=com_wrapper&view=wrapper&Itemid=41 ( accessed on 6 November 2013).
- Servizio Idrografico. In Annali Idrologici, parte I e II; Istituto Poligrafico e Zecca dello Stato: Roma, Italy, 1951.
- Versace, P.; Ferrari, E.; Fiorentino, M.; Gabriele, S.; Rossi, F. Valutazione Delle Piene in Calabria; Consiglio Nazionale delle Ricerche: Rende, Italy, 1989; pp. 1–157. [Google Scholar]
- Ergenzinger, P. A conceptual geomorphological model for the development of a Mediterranean river basin under neotectonic stress (Buonamico basin, Calabria, Italy). In Erosion, Debris Flows and Environment in Mountain Regions; IAHS Press, Institute of Hydrology: Wallingford, UK, 1992; pp. 51–60. [Google Scholar]
- Ibbeken, H.; Schleyer, R. Source and Sediment:A Case Study of Provenance and Mass Balance at an Active Plate Margin (Calabria, Southern Italy); Springer: Berlin, Germany, 2012; p. 300. [Google Scholar]
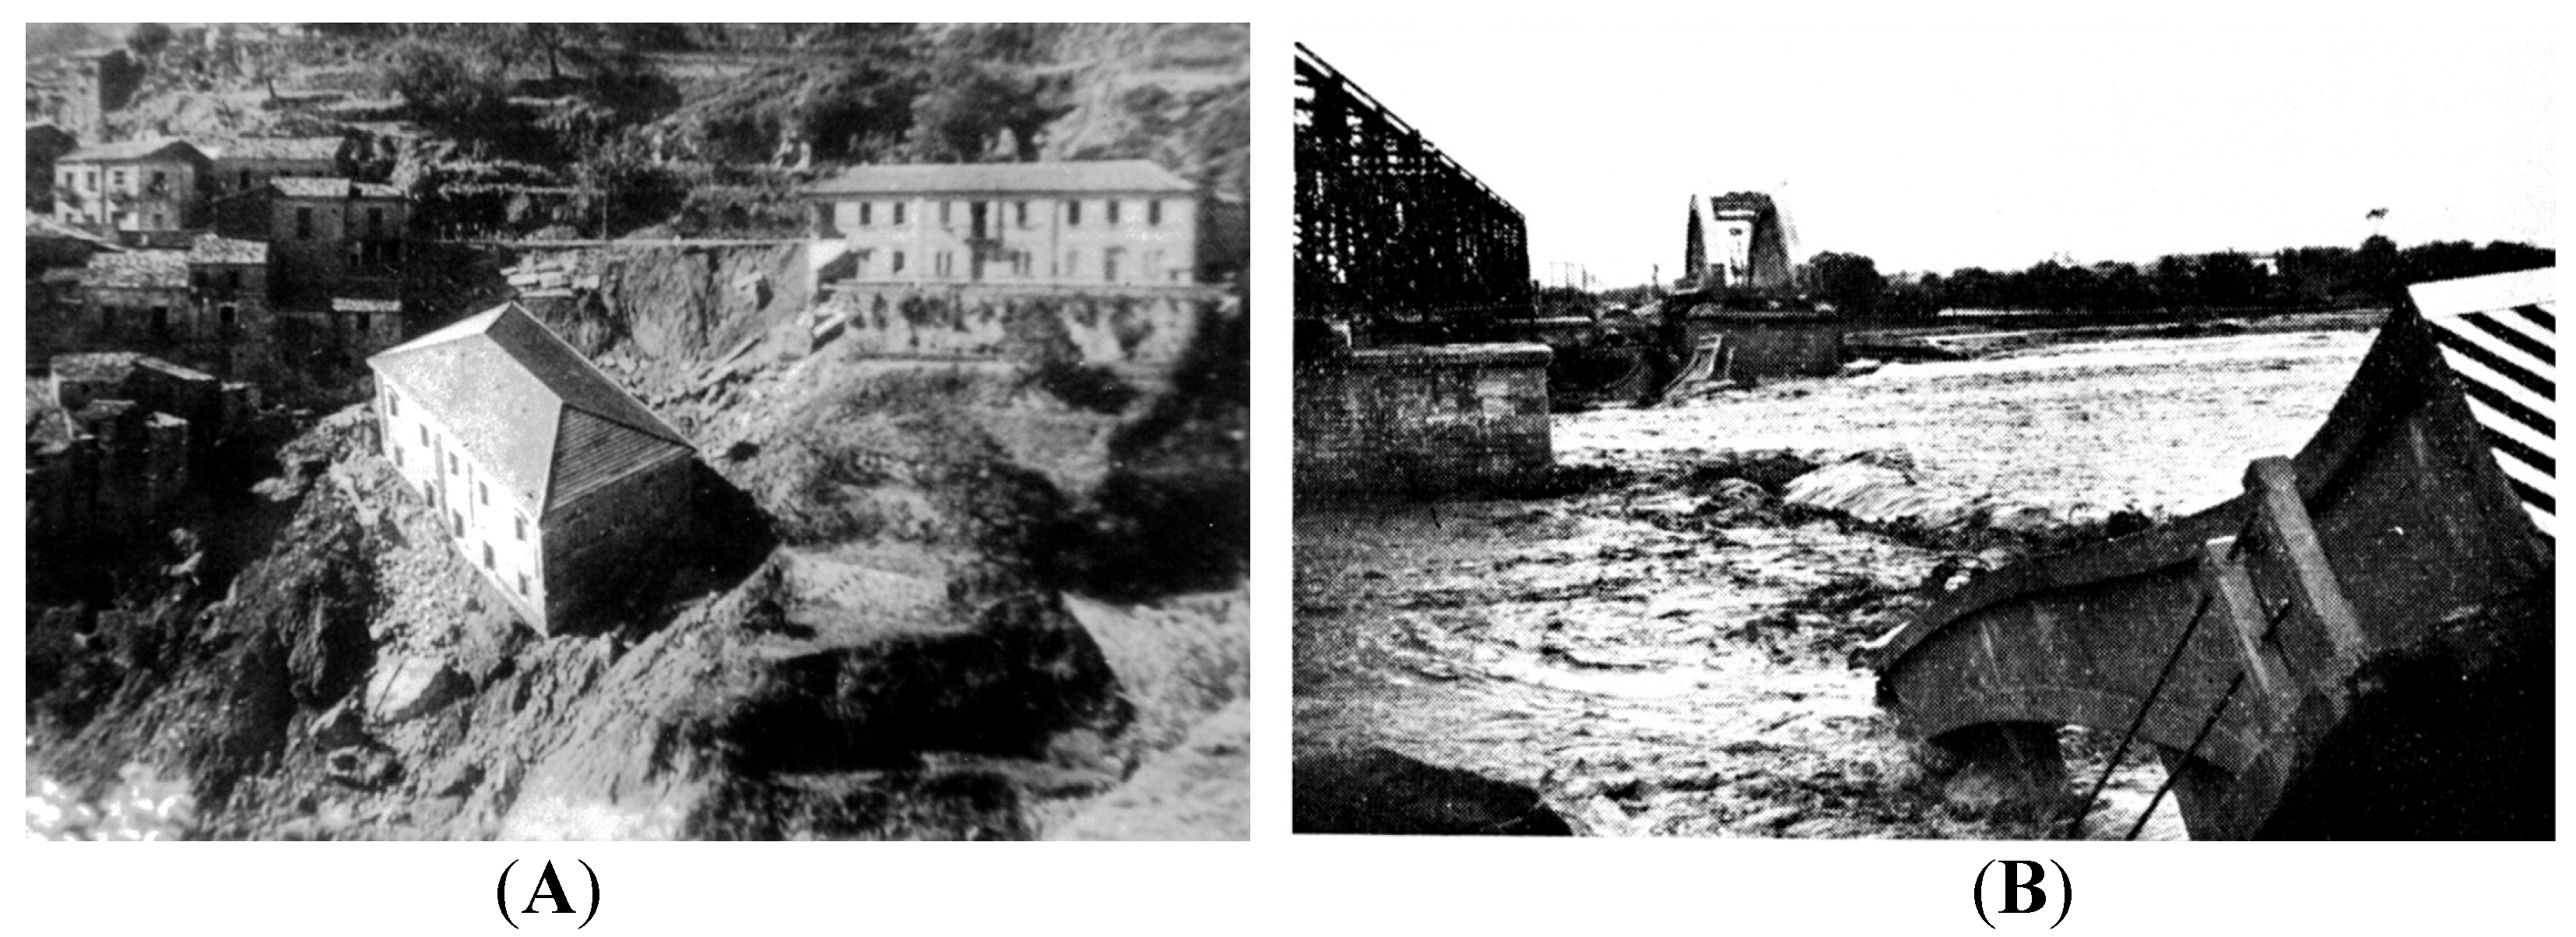
- Gulli, G.B. L’alluvione del 15–18 ottobre 1951 in Calabria. In Giornale del Genio Civile; Istituto Poligrafico dello Stato: Roma, Italy, 1952; pp. 147–157. [Google Scholar]
© 2013 by the authors; licensee MDPI, Basel, Switzerland. This article is an open access article distributed under the terms and conditions of the Creative Commons Attribution license (http://creativecommons.org/licenses/by/3.0/).
Share and Cite
Petrucci, O.; Pasqua, A.A.; Polemio, M. Impact of Damaging Geo-Hydrological Events and Population Development in Calabria, Southern Italy. Water 2013, 5, 1780-1796. https://0-doi-org.brum.beds.ac.uk/10.3390/w5041780
Petrucci O, Pasqua AA, Polemio M. Impact of Damaging Geo-Hydrological Events and Population Development in Calabria, Southern Italy. Water. 2013; 5(4):1780-1796. https://0-doi-org.brum.beds.ac.uk/10.3390/w5041780
Chicago/Turabian StylePetrucci, Olga, Angela Aurora Pasqua, and Maurizio Polemio. 2013. "Impact of Damaging Geo-Hydrological Events and Population Development in Calabria, Southern Italy" Water 5, no. 4: 1780-1796. https://0-doi-org.brum.beds.ac.uk/10.3390/w5041780