1. Introduction
The European Water Framework Directive (WFD) [
1] provides the principles that should drive the water policies of EU Member States (MS) for both the choice of economic instruments required to control the use of water resources (the incentive pricing principle, the full cost recovery and the polluter pay principle) and the choice of methods for assessing the costs needed to achieve policy objectives (cost benefit analysis and cost effectiveness analysis; [
2]).
According to the WFD, EU water quality objectives should be achieved by 2015. Potential derogations (article 4, par. 4, 5, 7 [
1]) are allowed both for technical infeasibility or disproportionate costs [
2,
3]. Technical infeasibility justifies the possibility of extending the deadline for the achievement of Good Ecological Status (GES) up to 2027; disproportionate costs justify the setting of lower targets,
i.e., reaching an “acceptable ecological state”.
The European Commission has developed guidelines for the assessment of disproportionate costs [
4,
5]. These guidelines offer alternative assessment instruments that justify the adoption of significantly different strategies and policies within each MS. The assessment process is designed to support policy in the decision making process and to ensure transparency [
6,
7]. However, the generic nature of the European guidelines fails to suggest a practical procedure whereby a country can carry out a disproportionate cost analysis [
8]. Postle
et al. (2004) [
9] try to solve such regulatory ambiguities. Other contributions are provided by Courtequisse (2005) [
10], Laurans (2006) [
11], Klauer (2007) [
12], Brower (2010) [
13], Berbel
et al. (2012) [
14] and Jensen
et al. (2013) [
8]. These studies define a number of rules and criteria upon which derogation decisions can be based and the application of which would reduce the inherent subjectivity of derogation decisions. More recently, Martin-Ortega
et al. (2013) [
15] provided a critical review of the key challenges of the WFD’s disproportionality analysis. Specifically, they propose the adoption of guiding principles for the assessment of cost disproportionality by tackling various key issues, such as the spatial and temporal scale of assessment, cost and benefit distributional effects and uncertainty. These issues are not properly addressed in most of the studies dealing with disproportionate costs, as cost benefit analysis (CBA) is usually carried out by focusing attention on individual pressures without considering that multiple pressures can contribute to the deterioration of water resources with multiple impacts.
The objective of this study is to develop and apply a methodology for the assessment of disproportionate costs according to the Water Framework Directive guidelines. In particular, the purpose of the study is to enable economic assessment at different scales of aggregation (driven by water body interdependencies) by considering the cross interaction between pressures and measures. The methodology keeps track of the geographical distribution of pressures at all levels of aggregation for both non-point and point pollutants. Water scarcity is also taken into account in parallel with qualitative pressures. However, aggregation is not designed for sizing interventions, but rather follows the level at which benefits are generated in order to account for the distribution of both the sources of pollution and the relevant impacts. To this end, the suggested approach contributes to framing the linkage of ecosystem service assessments with the practical implementation of WFD, as this represents one of the main challenges in water policy implementation [
16].
The present study contributes to further deepening the existing literature on the evaluation of disproportionate costs by focusing, in particular, on the choice of the assessment method, the comparison criteria and the spatial scale of assessment. These three factors converge in the suggested approach: both cost effectiveness analysis (CEA) and CBA methods are first applied at the scale of the smallest hydrographic unit (the water body), leading to a comprehensive screening of the entire region. In the following step, we identify homogeneous areas in terms of pressures (and related costs) and functions (implying service provisions). This process is the basis for the definition of an appropriate (multiple) spatial scale of assessment, which makes it possible to overcome operational difficulties in connecting the technical representation of spatially complex phenomena, whilst providing insights into disproportionality at scales that are meaningful for policy design purposes. Critical issues include: interactions between water bodies, multiple pressures and double counting due to the cross effects of measures that simultaneously affect surface and groundwater.
Although, according to the WFD, the area of analysis should correspond to river basin district management, in this paper, an application of the methodology is provided for the Emilia-Romagna Region in Northern Italy. This is primary due to the requirements of the institution funding this study (see the Acknowledgments), justified by the fact that, in the Italian legal system, the regions are the administrative institutions charged with ensuring the implementation of the measures included in the river basin district plans. In connection to this, the assessment of cost disproportionality supports local administrations’ participation in the selection of the range of feasible measures and the criteria to be adopted at the river basin level, which includes more administrative regions (the same region can also include areas belonging to other river basins).
Given the specificities of Emilia-Romagna, the paper demonstrates how the approach works for a region characterized by water bodies that are mostly undermined by diffuse pollutants. However, the approach is not case study-specific and is suitable for a broader range of environmental conditions.
Section 2 provides the literature background concerning the assessment of cost disproportionality.
Section 3 illustrates the methodology with the two-fold purpose of tackling the problem of the interdependencies between water bodies for the assessment of disproportionate costs and the problem of multiple interaction between pressures and measures.
Section 4 shows the outcomes of the application of the model for the Emilia-Romagna case study, outlining the set of measures and the relevant costs needed to achieve the WFD water status objectives. The section also describes the benefits generated by the achievement of the GES, providing an estimation of both use and non-use values. Moreover, this section includes the results of a sensitivity analysis performed for key factors in order to deal with uncertainty, due to the lack of detailed information. Finally, the section illustrates the resulting set of measures required to reach the GES and identifies where disproportionate costs are most likely to occur within the region.
Section 5 concludes with a discussion of the strengths and limitations of the study.
2. Literature Background
Analyses of cost disproportionality have been carried out in various countries, such as Spain [
17], Scotland [
18], Germany [
12], France [
10,
11], England [
9], Denmark [
8], and The Netherlands [
6]. and Most of the studies only address qualitative pressures (Martin-Ortega, 2012) [
16] and focus on surface water rather than groundwater. None of these studies follow a common methodology. This is mainly due to the fact that economic assessment methodologies are adaptive and change considerably between different socio-economic and environmental frameworks. However, according to Ward (2009) [
19], the estimation of disproportionate costs should follow three main steps: (1) the choice of the assessment method (how to quantify the social, economic and environmental impacts; (2) the choice of the comparison criteria and the threshold of proportionality; and (3) the choice of the scale of comparison (basin, sub-basin).
2.1. Assessment Method
Cost effectiveness analysis (CEA) and cost benefit analysis (CBA) are the two main methods adopted for economic assessment. CEA usually compares monetary costs and physical benefits (
i.e., the ratio between the restoration costs and the level of pollutant abatement). CBA, for its part, compares monetarily valued costs and benefits (the ratio between direct or indirect monetary benefits due to the level of abatement and recovery costs). CEA avoids the controversial monetization of intangible assets, such as the environment, and is usually designed for the comparative assessment of alternative measures, rather than for a clear-cut judgment on the feasibility of a project/policy. CBA is designed to assess the viability of the intervention, as it requires an estimation of costs and both tangible and intangible benefits [
3]. All of the previously mentioned studies assess cost disproportionality mainly by way of a cost effectiveness analysis, as benefit estimation is onerous. However, for England, Scotland, France (Seine, Normandy), the Netherlands and Denmark, cost-effectiveness was replaced by a cost-benefit analysis. In order to contain the economic effort required to assess benefits, scholars offer two alternative strategies: (a) limiting the application of CBA to those water bodies where CEA do not meet the requirements of acceptability set by local stakeholders; (b) exploiting the estimation of benefits from other studies with similar aims and in similar contexts. The first strategy was suggested by Postel
et al. (2004) [
9] in England and by Interviews
et al. (2005) [
18] in Scotland, while the second strategy, known as the Benefit Transfer Method [
6], was used by Laurans (2006) [
11] and by Jensen
et al. (2013) [
8], respectively, for disproportionate cost assessment in Normandy and Denmark.
2.2. Comparison Criteria
The results of the CBA can be given, alternatively, by the difference or the ratio between benefits and costs. The action/project is feasible when the difference is greater than zero and the ratio greater than one. In any case, both criteria make it possible to arrive at the same judgment. CEA is strongly conditioned by the terms of comparison. This suggests the need for a set of complementary indicators that offer multiple perspectives of assessment. The implementation costs of measures could be compared to the pressure abatement level, to the size of the areas that benefit from the intervention and to the financial capacity of those actors called to support the restoration costs.
For CEA, the costs required to achieve GES are acceptable if they are lower than a given threshold. Exceeding that threshold implies the need to reformulate the time horizon (WFD, Article 4.4) [
1] and/or the need to address measures with less ambitious environmental objectives (WFD, Article 4.5) [
1]. Scholars also suggest that thresholds should be related to the financial capacity of those users expected to pay for the restoration of water bodies. This threshold ranges between 2% and 4% of the per capita income of citizens [
10,
20,
21]. However, the WFD does not specify either the type of indicators or the relevant threshold level, hence leaving the choice implicitly up to the discretion of the local authorities.
2.3. Scale of Comparison
The choice of the assessment method and the comparison criteria are complemented by the identification of the most appropriate spatial scale of analysis for economic assessments. Costs may be disproportionate at the regional or sectoral level, but economically sustainable at a higher level of aggregation [
6]. Large reference areas make it possible to endogenize otherwise not appreciable economies of scale and offer an approximate estimation of specific local conditions. Therefore, it is advisable to identify management areas that are as homogeneous as possible in terms of both natural and socio-economic conditions. In this regard, Stemplewsky
et al. (2008) [
7] suggest aggregating water bodies in sub-basins in order to include relevant interactions. However, cost disproportionality has been assessed at different levels of aggregation, including both geographical [
3,
8,
10,
11,
17] and administrative boundaries [
12]. The first option is driven by the need to emphasize the interaction between water bodies and the last option by the need to estimate the financial burden that local authorities should bear in order to reach water status objectives. Thus, both levels of analysis should be addressed in order to achieve integrated estimations of environmental and economic impacts.
3. The Conceptual Model and Methodology
The following methodological approach is based mostly on official guidelines [
5] for theexemptions to the environmental objectives of the WFD and takes into account existing theoretical [
7,
9,
19] and applied literature on disproportionate costs [
3,
8,
11,
18].
The evaluation process reflects the optimization rationale illustrated by the following model:
Subject to:
where:
a = the level of aggregation;
Za = total net benefit;
Ba = total benefit;
Ka = total cost;
xi = the degree of activation of measures
i;
ka,i(
xi) = the cost function for measure
i;
pa,j,i(
xi) = the reduction function of pressures
j for the degree of activation of measure
i and at the level of aggregation
a;
Pa,j = the level of pressure reduction
j needed to achieve the good hydrological status and
I = the set of the feasible solutions.
The model can be applied at different levels of aggregation, a. The water body is the reference unit on which the aggregates are built and the endpoint to which interventions can be targeted.
Equation (1) is the ideal social objective, namely, to maximize the differences between the benefits and costs of intervention. The cost of measures is computed in Equation (2), constrained by the requirement that the degree of activation of measures achieves the pre-established water status target, Equation (3). This constraint highlights the need to simultaneously obtain the reduction of all pressures needed to achieve the directive’s water status objectives, considering that more measures can contribute to the reduction of the same pressure and that more pressures can be solved by the same measure. The last would enable the endogenization of multiple effects due to a given intervention. The model is further tied to the feasibility (e.g., measures intended to reduce the application of fertilizer in a given region are limited by the coverage of the target crops) and the non-negativity conditions [Equation (4)]. The decision variable of the model consists of the level of activation of each measure.
If Ba is approximated by achievement of the required water status, i.e., adds no information compared to the right-hand side of Equation (3), the problem shifts to a cost-effectiveness perspective, in which the choice of the best set of measures relies on the criterion of cost minimization.
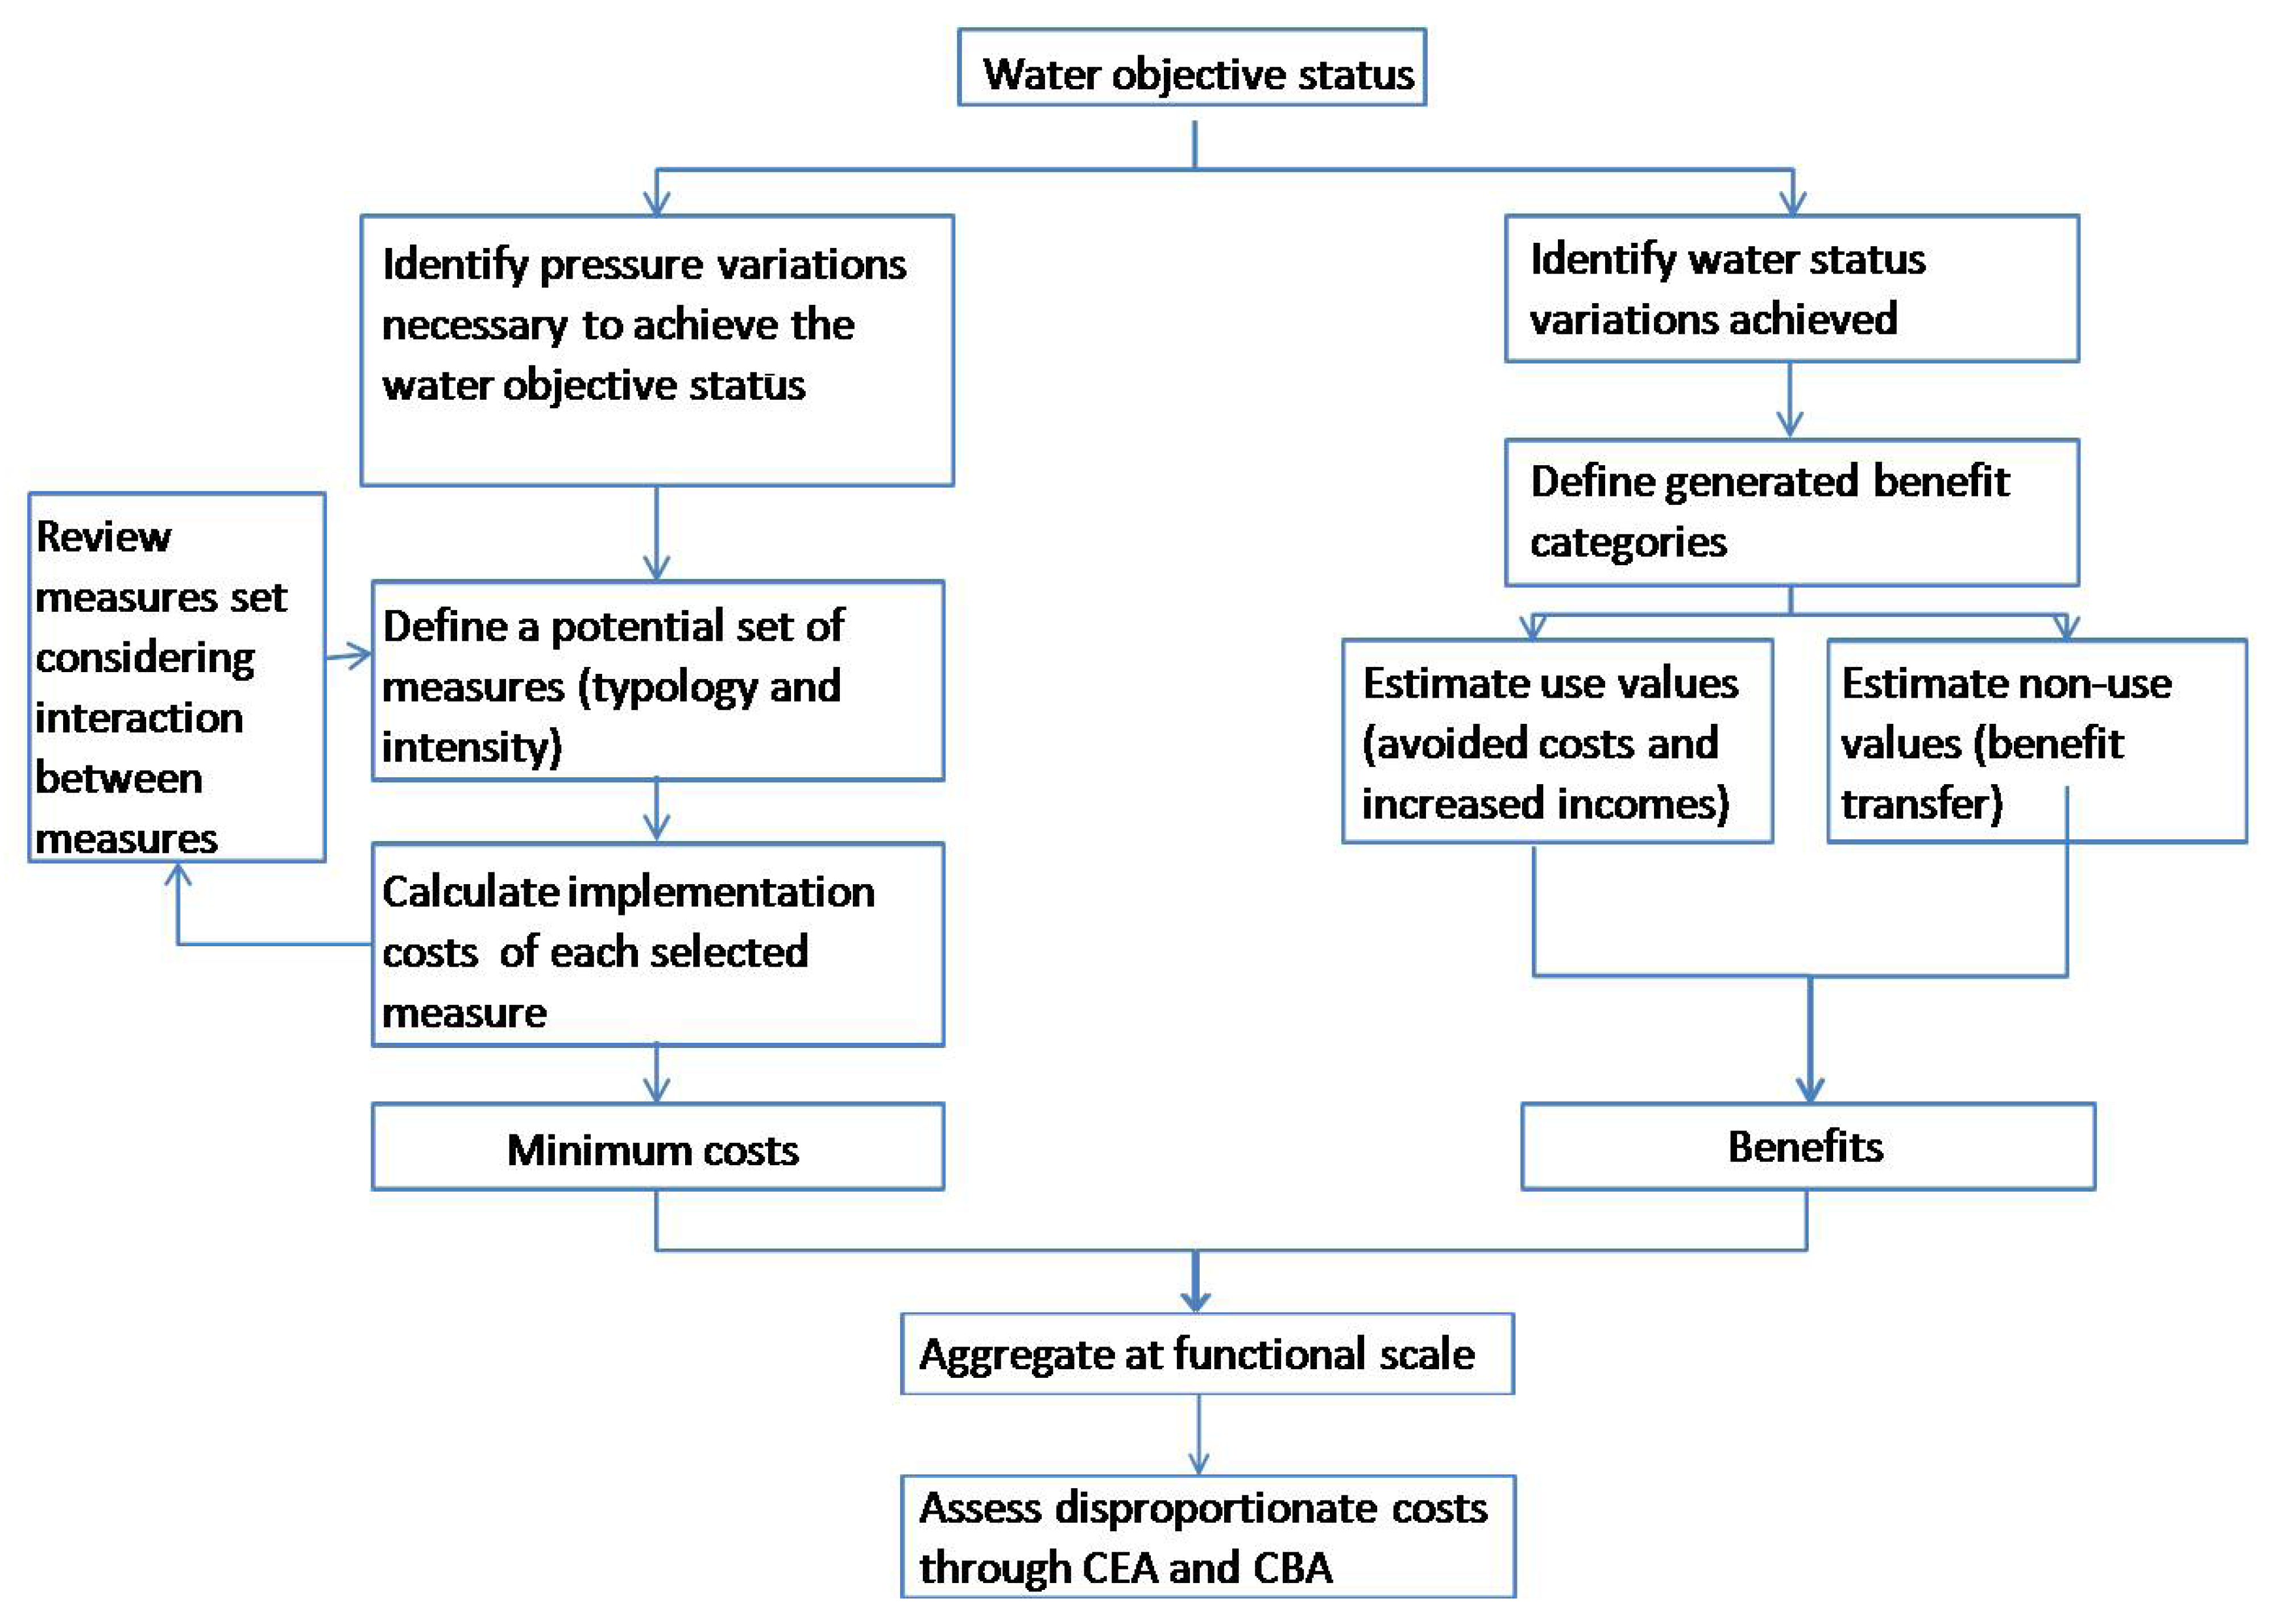
The conceptual model illustrated above is implemented through the procedure illustrated in
Figure 1.
Figure 1.
The application procedure. CEA, cost effectiveness analysis; CBA, cost benefit analysis.
Figure 1.
The application procedure. CEA, cost effectiveness analysis; CBA, cost benefit analysis.
The assessment of disproportionality builds on the definition of the objective status and measures and leads to the screening of the actions needed to achieve economically feasible objectives. This goes through two parallel pathways for costs and benefits. On the one hand, cost estimation entailed the establishment of a set of measures, followed by the calculation of the cost and, based on this, on the revision of the set of measures up until the point at which no cost improvement was possible. On the other hand, the value of benefits was calculated, based on a classification of the positive effects of the achievement of objectives. After this was done at the lowest possible scale, different levels of aggregation were performed and, at these levels, CEA and CBA were then carried out.
The water body is the reference unit for the achievement of the water status objectives, the minimum level at which each MS should identify pressures and uses for both surface and groundwater [
4]. However, the identification of the relevant level of analysis for the assessment of disproportionate costs, what we call here “functional scale”, is not well defined either in official guidelines or in the relevant literature. The level of aggregation is a key factor influencing the disproportionate cost assessment. In our perspective, there are two fundamental aspects underpinning a reasonable aggregation: (a) the interaction between measures and pressures for both surface and groundwater; and (b) the influence between adjacent water bodies.
For the first aspect, a measure intended to solve a given pressure for surface water could affect groundwater, as well, and a measure aimed at groundwater could also influence the quality of surface waters with a two-fold benefit. For the second aspect, the mutual influence exerted by adjacent water bodies imposes the need to identify an aggregation layer that includes all of the relevant sources of pressure conditioning the status of each water body. For each level of aggregation, the assessment of cost disproportionality should include two different hypothesis: one in which it is assumed that water body restoration will affect the whole region (river basin) and the other where it is assumed that the assessment focuses only on a given aggregate within the whole region. For the latter, the achievement of the objective status should also include the contribution of pressures from adjacent aggregates in the deterioration of the pertaining water resources.
The approach used is built for the assessment of disproportionate costs and does not directly manage the issue of technical unfeasibility that would justify temporal derogations. However, the need for temporal derogation is implicit in setting the range of feasible measures, the implementation of which may take longer to abate pollutants below the levels imposed by the directives.
Lack of information and/or high levels of uncertainty for some key technical and economic estimates would justify the adoption of a threshold lower than those usually expected in CBA (i.e., zero when considering benefits and cost differences; one when considering benefits and costs ratios). However, this condition could lead to a dangerous state of arbitrariness that would likely compromise the informative capacity of the assessment tool. A way to reduce such arbitrariness is to combine cost benefit and cost effective indicators. Policy prescriptions could then go in the direction of suggesting a priority for intervention in those areas showing best estimates for both types of assessment tools.
The methodology is consistent with the assessment procedure developed in Jensen
et al. (2013) [
8], who highlighted the informative role of the analysis supporting policy decisions. The assessment procedure begins with the description of the geographical scale of analysis, identifying pressures and relevant impacts and the set of measures required to reach the GES. This is followed by the definition of the aggregation pattern. Then, costs and benefits are estimated for each water body. Uncertainty in the estimations are managed through a sensitivity analysis. Finally, the results are elaborated according to the aggregation pattern previously described, in order to provide support for decisions related to intervention.
4. Implementation: Cost and Benefit Estimation in the Emilia-Romagna Region
4.1. Case Study Description
In this section, the implementation of the methodology in the Emilia-Romagna region is described. Emilia-Romagna, an administrative region of Northern Italy, has an area of 22,446 km2 and accounts for 4.4 million inhabitants. The region falls into three river basin districts; the Po River Basin, the Northern Apennines River Basin and the Central Apennines River Basin. Nearly half of the region (48%) consists of plains, while 27% is hilly and 25% mountainous. Emilia-Romagna is one of the richest, most developed regions in Europe, and claims the third highest GDP per capita in Italy. In general, the regional economy is well balanced and comprises agriculture, as well as mechanical industries.
Industry in the region presents a varied and complex picture, including the food industry, as well as the ceramic industry. Tourism is increasingly important, especially along the Adriatic coast and at historical sites. All of these sectors, including the urban sphere, contribute to the generation of pressures that contribute to, or are likely to affect, the quality of water bodies and benefit from the availability of good hydrological status.
The Regional Environmental Agency estimated to which extent each sector (agriculture, civil, industry) is responsible for each type of pressure (qualitative/quantitative, point/no point). Most of the point sources of pollution are represented by industries (responsible for water pollutants, such as organohalogens and metals), while agriculture and livestock contribute mostly with no point pollutants (nitrogen and phosphorus, pesticides) and quantitative pressures (overexploitation of water resources). Morphological alterations are mostly related to the extraction of raw materials.
The functional destination of each water body is usually represented either by drinking water, bath water or water for the protection of fish and mollusk life. In the region, bath waters generally have a good ecological status, while water designed to protect fish life shows deterioration, due to natural causes. Pressures, mostly in the form of nutrient loads and low water flows, threaten mollusk life on the northern coastline and compromise the use of drinking water in the northern inland plain [
22].
4.2. Adaptation of the Methodology to the Case Study Area
Cost disproportionality is assessed at the regional scale. This seems to contradict most of the relevant literature on cost disproportionality that recognizes the river basin level [
3,
8,
10,
11] to be the ideal scale of assessment. However, as previously discussed, this choice is driven by the local legislation and reveals the important role that the local administration plays in defining priorities for both the identification of areas of intervention and the selection of measures to be implemented.
The use of administrative boundaries also implies the assumption that water courses do not pass through other regions before crossing Emilia-Romagna. This assumption basically holds in the case of Emilia-Romagna (Annex 1 of the regional Water Protection Plan, Piano di Tutela delle Acque, PTA, 2005) [
22], with the exception of the Po River. In the Emilia-Romagna Region, in fact, the hydrological boundaries roughly match with administrative borders: the Po River almost coincides with the northern border, the Adriatic Sea is the eastern border and the crests of the Apennines chain are the south-western border. Thus, by referring to administrative boundaries, we excluded from the assessment the Po River, as it passes through the border with the Veneto Region, and coastal water (sea water proximal to the region), which is the domain of a number of regions. This implies that we did not consider the impact of low water ecological status on both tourism (bath water) and the fish industry (mollusk life). Moreover, it was not possible to estimate the impact of water overexploitation on salt intrusion, as this phenomenon is caused by a complex interaction between both natural (natural subsidence, climate change) and anthropic causes (subsidence induced by hydrocarbon extractions, mechanical drainage of reclaimed lands) that go beyond the objectives of this analysis.
Furthermore, a simplification was made on the different levels of water ecological status for the calculation of benefits. In the regional Water Protection Plan [
22], ecological status is classified based on the distribution of water bodies on a five-point scale, going from bad to optimum. In this study, we rearranged this scale into a two-point scale: lower and equal/greater than good. This simplification was needed to ensure the comparability and usability of benefit estimates from other studies as references for benefit calculations in this study (see below).
The analysis was first carried out at the water body level (base unit) and then at different levels of aggregation, as described in the next sections. All of the water bodies’ aggregations are sub-regional units, meaning that their extension is always included within the study area boundaries. Therefore, when describing the interactions between water bodies (e.g., rivers upstream-downstream interdependencies, see next sections for details), these are always internal to the Emilia-Romagna region, where all the considered rivers have both heads and outlets.
4.3. Description of Pressures and Measures
A set of alternative and complementary measures has been identified according to the relevant sources of pressure, which are likely to affect the hydrological status of most of the water bodies in the case study region (
Table 1). The identification of a feasible set of alternative/complementary measures has been accomplished thanks to stakeholder meetings involving both the manager of the regional Water Protection Plan and the manager of the regional Environmental Agency. The selection of measures was carried out by excluding measures already compulsory, due to the implementation of other directives (
i.e., Nitrate Directive, Habitat Directive).
Nutrients, pesticides, heavy-metals, morphological alterations and water overuse threaten the regional water resources at different degrees of relevance. Specifically, 43% of the regional water bodies are threatened by a high concentration of nitrogen and phosphorus, 3% by pesticides, 4% by other pollutants, 5% by water scarcity and 19% by morphological alterations [
22].
No point sources of pollution, in particular nitrogen and phosphorous, are the main pressures conditioning the ecological status of most of the regional water bodies.
Both the civil and agricultural sectors are responsible for these types of pressures. However, while the civil sector contributes to the deterioration of the water body status, overloading wastewater mostly in correspondence with large urban sites, the agricultural sector discharges nutrients especially in the inland plain. As a result, point measures with limited economic impact are feasible only for the urban sector and not for agriculture.
Table 1 shows a synthesis of the interaction between pressures and measures. In the case of the industrial and civil sectors, specific measures are directed to solve single pressures, tracing back to localized sources of pollution (point sources of pollution). Concerning the agricultural sector, several measures can address the same pressure, and different types of pressures can be addressed by a single measures.
Table 1.
Interactions between measures and pressures (S = surface waters; G = groundwater).
Table 1.
Interactions between measures and pressures (S = surface waters; G = groundwater).
| Measures | Pressures |
|---|
| Nutrients | Pesticides | Industrial chemicals | Morphological alterations | Water scarcity |
|---|
| Upgrade of urban waste water depuration plants/construction of new sewer systems | S | | | | |
| Agricultural extensivization | SG | SG | | | SG |
| Buffer strip | S | | | | |
| Management of livestock waste | SG | | | | |
| Pesticides prohibition, reduction and substitution | | SG | | | |
| Remediation of contaminated brown fields | | | G | | |
| Advanced chemical treatment for industrial wastewater | | | S | | |
| Prohibition of inert extraction in narrow rivers | | | | S | |
| Prohibition of high water intensive crops | SG | SG | | | SG |
| Construction of reservoirs for irrigation water storage | | | | | SG |
| Information/awareness campaign about domestic water saving | | | | | G |
| Construction of new plants for storage and treatment of drainage water (for industrial use) | | | | | G |
For the abatement of pollutants from urban waste water, we have assumed both empowering existing water treatment plants and resizing containment tanks. For the agricultural sector, pollutants are currently abated by way of both voluntary payment schemes for the uptake of low input agricultural techniques (measure 214, Rural Development Plan, 2007–2013) [
23] and compulsory limitations in the use of fertilizers in Nitrate Vulnerable Zones (NVZ), (Nitrate Directive, 1991) [
24]. In addition, we assume the enforcement of regulatory restrictions by obliging farmers to adopt extensive farming systems. The level of abatement of nutrient loads in surface and groundwater bodies, due to the transition from high intensive farming to low intensive farming, has been estimated by exploiting a formally official methodology developed by the Regional Environmental Agency [Agenzia Regionale per la Protezione dell’Ambiente, (ARPA)], which takes into account the geomorphology and soil texture (slope and permeability) of each water body, crop coverage, livestock density, climate, type of fertilizers used and the relevant distribution techniques (Annex 1 of the PTA, 2005 [
22]). Alternatively, or complementarily to extensivization, the study suggests the use of buffer strips for nutrients loaded in surface waters. The retention power of the buffer strip is extremely variable and changes considerably according to the assortment of species, soil texture and the width of the strip [
25]. On the basis of the literature review by Osborne and Kovacic (1993) [
25] and in line with a recent study (Lago, 2008) [
26], for the buffer strip, we consider a cautionary estimation of the width, 15 m, and of the retention power, equal to 20% of the leached nutrients. Moreover, the management of wastewater could represent another alternative to the livestock density reduction for both surface and ground water bodies. The management of livestock wastewater is characterized by two steps: (1) plant treatment for the separation of the liquid and solid fractions of the waste water; and (2) transportation and distribution to non-nitrate vulnerable zones [
27,
28]. The preliminary treatment favors the subsequent stages of transportation and distribution, with the result of improving the land absorptive capacity up to 20% [
29,
30].
Another relevant pressure in the agricultural sector, besides nutrients, is that of pesticides. According to the intrinsic characteristics of each kind of pesticide, we considered the implementation of three alternative measures to restore water bodies that have chemical concentrations exceeding legal limits (Directive 2009/90/EC, implemented in Italy through Legislative Decree 2010/219) [
31]: prohibition, dosage and substitution. Prohibition and substitution remove the pressure, while the environmental impact of dosage is uncertain. Thus, we assumed that the 30% reduction of the dosage is strong enough to abate pollutant loads on water bodies.
Besides pesticides and nutrients, which are derived mainly from the agricultural sector, most of the other qualitative pressures can be traced back to the industrial sector. Here, according to the most widespread categories of chemicals, we considered two types of measures: construction of new treatment plants for heavy metals and hydrocarbons and reclamation of brown field sites contaminated with organohalogens.
Industry is also primarily responsible for morphological alterations and the limitation of the extraction of raw materials from narrow rivers, for which we identified just one measure.
Concerning water scarcity, the agricultural sector is the main source of surface water overexploitation. In this case, three types of measures were adopted: substitution of water-intensive crops, construction of inter-farm reservoirs in hill/mountain areas and construction of reservoirs with low environmental impact in ex-river quarry areas. With the exception of the construction of inter-farm reservoirs in hill/mountain areas, the remaining measures were applied to reduce the overexploitation of groundwater occurring in aquifers located in the conoid belt. With respect to surface water, groundwater is also commonly extracted for civil and industrial uses. Therefore, two other specific measures were planned for the reduction of groundwater overuse in addition to those addressed to the agricultural sector. Water extraction for civil uses is limited through the implementation of a water saving awareness campaign, including educational initiatives, the advertisement of good practices and incentives for improving the efficiency of the domestic water distribution system. The limitations of extraction for industrial uses is achieved through the construction of treatment plants and distribution networks for drainage water, which can be re-used instead of being discharged into the sea (mechanical drainage involves most of the flat areas located in the alluvial and coastal plain of the region).
4.4. Aggregation Pattern
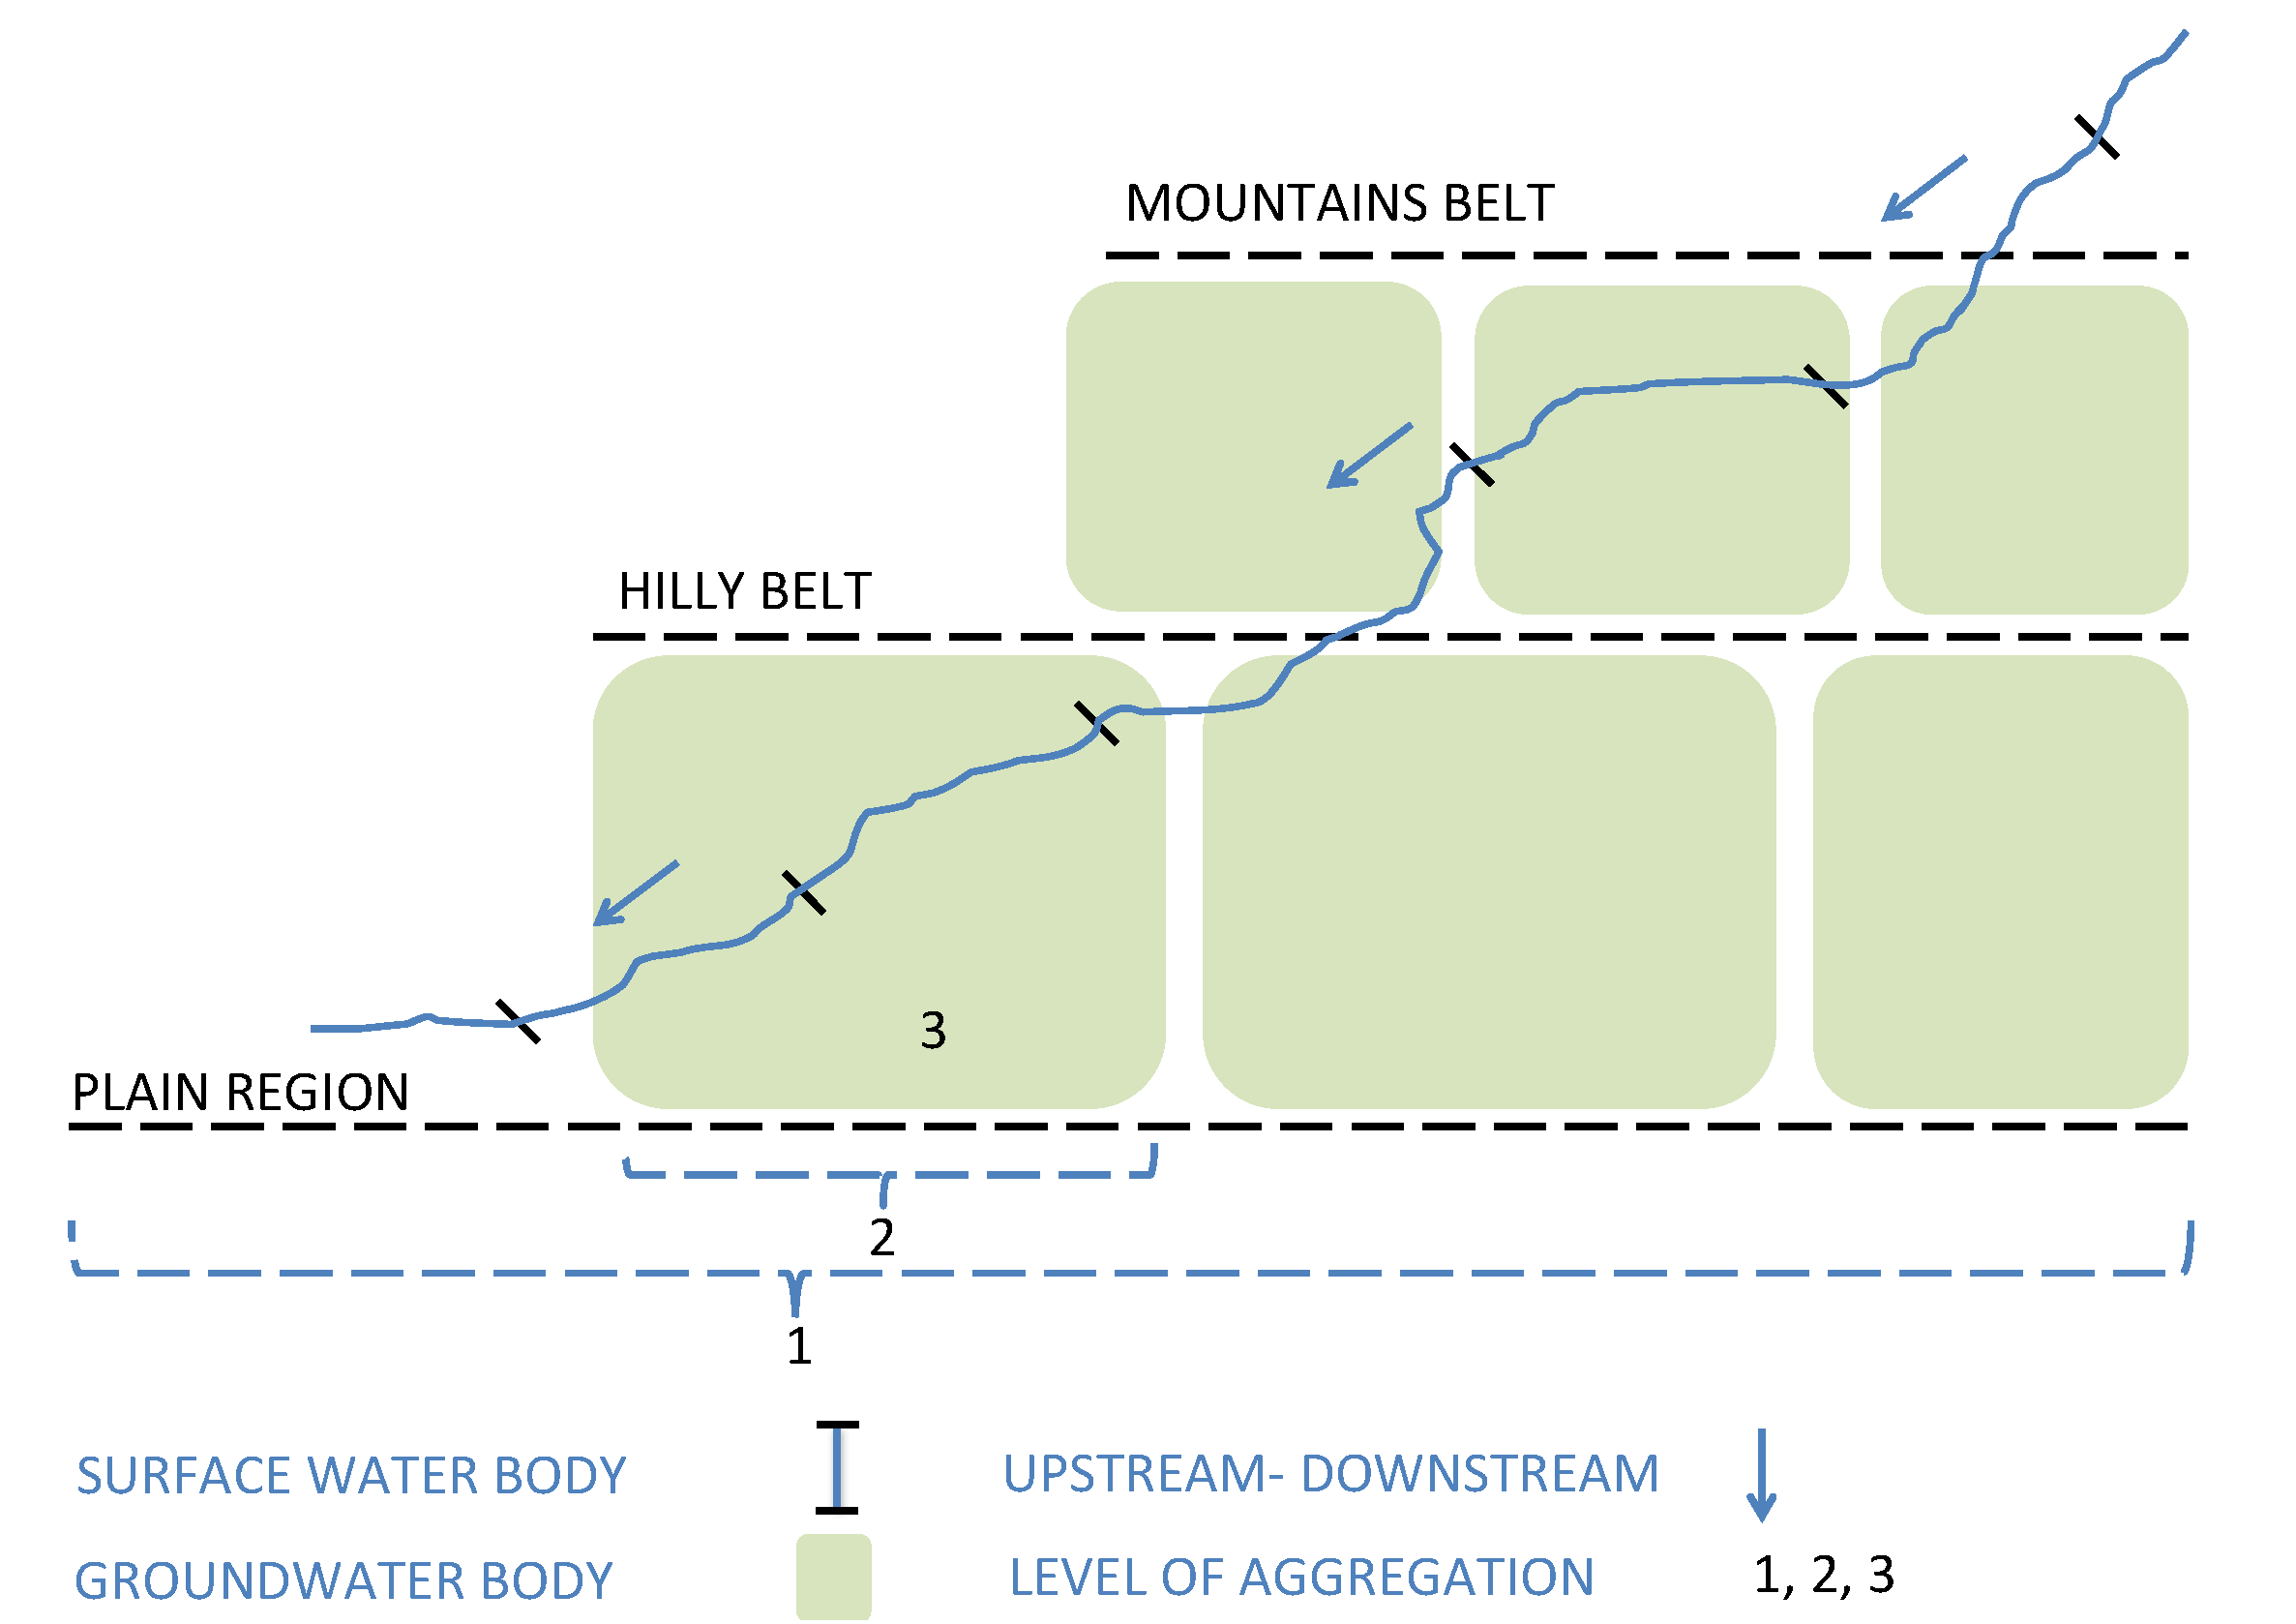
As described above, the identification of the aggregation pattern should follow the interaction between pressures and measures and interdependencies between adjacent water bodies. In the first case, most of the selected measures interfere with both the status of ground and surface waters, as is indicated in
Table 1. This condition justifies the definition of a level of aggregation that includes both types of water bodies (
Figure 2).
Figure 2.
Levels of aggregation for ground and surface water bodies: mountain belt, hilly belt and plain region.
Figure 2.
Levels of aggregation for ground and surface water bodies: mountain belt, hilly belt and plain region.
According to the regional hydrographic patterns and the distribution of pressures, it is possible to identify three main aggregates: the mountain belt (corresponding to the region overlying mountainous aquifers), the hilly belt (corresponding to the recharge area of alluvial aquifers and overlying conoid aquifers) and the plain region (corresponding to the artificial drainage area and overlying the phreatic aquifers of the alluvial plain). This first and broader level of aggregation is justified by the fact that the geographical distribution of costs and benefits within the region is unbalanced. The sources of pollution are concentrated mainly in the plain regions, where most of the industrial activities, urban sites and intensive agriculture are located. On the contrary, the benefits are concentrated mainly in the hilly belt, which hosts most of the sources of drinking water and most of the recreational sites in the region. If the estimated benefits are significantly lower than costs for these aggregates, then a finer scale analysis may be required.
A second and greater level of aggregation is at the water body scale for groundwater and includes all of the overlying surface water bodies. A detailed assessment allows for the identification of those areas where disproportionate costs are more likely to occur within each belt.
In a third and final level of analysis, the assessment of both surface and ground water bodies is handled separately. At this level, it would be possible to more accurately detect the single water bodies where disproportionality may occur, which, in turn, makes it possible to plan actions aimed at the achievement of GES in the adjacent units.
With respect to the mutual influence between adjacent water bodies, whereas it is particularly difficult to identify a clear interaction in between groundwater bodies and between groundwater and the overlying surface water, there is a clear interdependence between upstream and downstream surface water bodies (see arrows in
Figure 2).
The aggregation of surface water bodies according to the area overlying groundwater should also take into account all of the costs needed to achieve a good hydrological status and the relevant benefits from the beginning of each water course up to the boundaries of the groundwater body. The cumulative effect (upstream–downstream) must also be considered at a broader level of aggregation, hence the three belts identified by the dashed lines in
Figure 2. From foothill to coastal areas, the interaction between groundwater bodies is unknown, as indicated by their representation as independent entities in
Figure 2. This consideration leads to the definition of the two scenarios discussed in the methodology: one in which it is assumed that the intervention will affect the whole region and the other in which the implementation of measures only for specific aggregates is assumed.
4.5. Cost Estimation
Recent studies have pointed out that cost assessments related to the implementation of the WFD should not focus solely on additional costs (e.g., investment and operating costs), but should rather include income reduction associated with the implementation of the required measures, welfare costs (e.g., distortion effects due to taxation needed to finance the implementation of the WFD) and the value of side effects (e.g., increase/reduction of other types of emission). Moreover, costs should be converted to reflect consumer prices in order to obtain cost estimates that are consistent with the welfare economic theory underlying the CBA [
8,
9,
25].
In this study, we calculate the costs as they emerge from the reduction of pressures that each sector must meet in order to achieve good status. This implies no transfer (e.g., taxes, subsidies) from one sector or economic actor to another and no distinction between financial and economic costs. While it may be claimed that this choice is consistent with the polluter pays principle, in fact, it is largely motivated by the lack of detail regarding the actual implementation strategies for measures (e.g., who is going to pay for what), which did not allow for a more precise analysis.
Table 2 offers a list of the unit cost estimates for the two main categories of measures, direct investments and compensation payments, described below.
4.5.1. Direct Investments
Most of the data needed to assess structural projects were already available from previous works carried out by ARPA [
32]. To reduce nutrients from the urban sector, we exploited a unit cost appraisal carried out by ARPA [
32] for upgrading wastewater depuration plants and for the construction of new sewer systems. For the industrial sector, in the case of heavy metal pollution, we took references from ARPA’s unit cost estimation for the construction of advanced treatment plants, while for the reclamation of brown field sites contaminated with organohalogens, we made use of technical information from two other recent studies carried out in Italy [
33,
34]. To reduce agricultural water overuses, we exploited both ARPA [
32] estimations for existing regional reservoirs and estimations from the conversion of six ex-quarry areas in recent decades, respectively, inferring to inter-farm reservoirs and low environmental impact reservoirs. Costs associated with the implementation of water saving measures addressing the civil sector are based on the adaptation for Emilia-Romagna of the costs reported for a similar action implemented in Australia [
35] . The costs of water saving measures addressing the industrial sector, like the construction of drainage water treatment plants and distribution networks, were also provided by ARPA.
Table 2.
Average annual unit cost estimates for each measure (acronyms of data source are defined in the text).
Table 2.
Average annual unit cost estimates for each measure (acronyms of data source are defined in the text).
| Measures | Main pressures | Source | Unit of measure | Mean value |
|---|
| Direct investments |
| Upgrade of wastewater depuration plants | nitrogen and phosphorus | [32] | €/PE* | 13 |
| Construction of new sewer systems | nitrogen and phosphorus | [32] | €/PE | 100 |
| Construction of advanced treatment plants | heavy metals | [32] | €/mc** | 0.24 |
| Reclamation of brown field sites | Organohalogens | [33,34] | €/site | 210.524 |
| Construction of inter-farm reservoirs | water shortage | [32] | | 24 |
| Conversion of ex-Quarry Areas in Reservoirs | water shortage | [32] | €/mc | 7 |
| Information/awareness campaign about domestic water saving | water shortage | [35] | €/mc | 0.45 |
| Construction of new plants for distribution and treatment of drainage water (for industrial use) | water shortage | [32] | €/mc | 0.38 |
| Compensation payments |
| Extensivization for crops | nitrogen and phosphorus, pesticides, water shortage | [36] | €/ha | 474 |
| Extensivization for livestock | nitrogen and phosphorus | [36] | €/ LU *** | 264 |
| Plantation of buffer strip | nitrogen and phosphorus | [36] | €/ha | 250 |
| Pesticide prohibition | Pesticides | [37] | % loss of gross income | 30 |
| Pesticides substitution | Pesticides | [37] | % loss of gross income | 5 |
| Dosage reduction | Pesticides | [23] | €/ha | 275 |
| Limitation for the extraction of row materials | morphological alteration | [32] | €/mc | 16 |
| Construction of plants for livestock manure treatment | nitrogen and phosphorus | [28,29] | €/LU | 350 |
| Transport of livestock manure outside NVZs | nitrogen and phosphorus | [38] | €/km | 18 |
| Distribution of livestock manure | nitrogen and phosphorus | [38] | €/ha | 150 |
Key factors conditioning the affordability of the investment are the discount rate, representing the reference parameter for the opportunity cost of capital in the long term, and the time horizon, representing the economic life of the investment. With regard to the assessment of disproportionate costs, we set a discount rate at 5%, recommended by the European Commission for the programming period 2007–2013 [
21]. In order to comply with the recommendation of the European Commission with regard to public investments, the time horizon was set at 30 years [
39]. With respect to the WFD, both the discount rate and the time horizon should reflect the opportunity cost to achieve (or not) a good ecological status for future generations.
4.5.2. Income Losses
Income losses have been estimated both for the agricultural sector and industry. Estimations for agriculture were carried out by assuming regulatory restrictions on nutrients, pesticides and water uses. To this end, we exploited datasets on gross margins for each type of crop and livestock from the Italian Farm Accountancy Data Network (FADN) [
36].
Specifically, with respect to restrictions on nutrients, in the case of vegetable crops, loss of income is given by the difference between per hectare gross margins of high value crops and low value crops times the area (hectares) of high value crops, which need to be substituted to achieve the GES. In the case of livestock, costs are equal to the loss in gross margin for each unit of animal times the absolute density reduction (number of heads) needed to achieve GES. The costs associated with the plantation of buffer strips, alternative/complementary to low input farming, were estimated in terms of losses in the gross margins of those agricultural areas converted to buffer strips, while the setup costs were not estimated, as they are considered to be negligible. The extension of buffer strips is given by the length of the water body times the width of the buffer strip itself.
For the restriction on pesticide use, the cost of the measures were estimated to be equal to a 30% reduction in gross income for crops treated with the banned chemicals. This loss is reduced to 5% in the case of the substitution of the banned pesticides with other accepted chemicals [
37]. Finally, with regard to dosage reductions, the implementation cost corresponds to the reduction per hectare of the gross farm income associated with the application of integrated pest management, as estimated in Annex 3 of the Regional Rural Development Plan 2007–2013 [
23].
In the case of irrigation, we considered the loss of income due to the substitution with non-irrigated crops in all areas receiving water from water bodies threatened by water scarcity. Industrial sector income losses have been estimated with respect to morphological alterations. In order to limit this type of pressure, we considered the severe limitation of the extraction of raw materials from narrow rivers. In this case, costs have been estimated to be equal to the loss of income, due to the extraction of aggregates from quarries rather than rivers. Estimations were carried out based on technical information provided by ARPA. The management of livestock manure is alternative/complementary to the livestock density reduction. To this end, we exploited the estimation of costs for plant treatment undertaken by Mantovi
et al. (2010a, 2010b) [
28,
29] for livestock in the region, while transportation and distribution costs outside Nitrate Vulnerable Zones (NVZs) were estimated by exploiting datasets on unit costs for different agricultural mechanical practices from the National Union of Contractors [Unione Nazionale Imprese di Meccanizzazione Agricola, UNIMA)] [
38]. Distances were calculated based on shape files provided by ARPA; land use information at the municipality level were provided by the Italian Institute of Statistics (ISTAT) [
40].
4.6. Estimation of Benefits
For the assessment of benefits, we referred to Annex I of Guidance Document No. 20 [
5]. Here, several categories of values (use value, non-use value, side effects with other sectors, cross effects with other environmental policies) are listed. The systematic analysis of all of these aspects would provide an exhaustive, yet extremely costly, estimation. In addition, some of the listed items turned out to be particularly difficult to quantify in monetary or even qualitative terms.
Accordingly, we opted to carry out an estimation of the benefits by considering the categories of use and non-use values, using the grid provided by the guidance document as a checklist of the more detailed components of these two main categories. In particular, the non-use value is based on perceptions, often conditioned by various factors, and tends to include more complex categories of value, such as side effects for which it was not possible to make direct evaluations.
In analogy with the costs, it is important to highlight a number of important issues for which simplified assumptions were required to ensure the feasibility of the study. For the assessment of the non-use value, scope effects are usually higher than size effects, as benefits are assumed to be perceived only when water bodies reach the good status [
8,
41]. This was to justify the choice of assessment based on just two states: bad status and good status. Thus, we did not consider the possibility of reaching intermediate levels of status improvement. Another important consideration is made for the substitution effect, which would imply that the value placed on a water body depends on the availability of substitute water bodies [
42]. Economic theory would predict decreasing values with increasing substitution possibilities [
8]. However, the assessment of the non-use value in this study is not site-specific, as it covers the entire region, and the resulting value is disaggregated to the level of the water body. As a result, substitution effects are assumed to be equal to zero. Another assumption is made for distance decay. We assume no distance decay, even if a negative effect has been proven on the value assessment of water bodies in a recent study (Bateman
et al., 2006) [
43]. Finally, several assumptions are incorporated into the benefit transfer method (BT), the method adopted to estimate the non-use value. This method adjusts non-use estimates concerning the subject of investigation by exploiting studies carried out in regions other than the study area. This process of adaptation generates biases, and to reduce such distorting effects, the socio-economic conditions of the policy site should be as close as possible to those of the study site, where the estimation of the non-use value was carried out [
44]. For this reason Lindhjem and Navrud (2008) [
45] highlighted that choosing a study that was carried out in the same country should be preferred when adopting BT. In this study, we exploit both Italian and foreign non-use value assessments, due to the absence of studies with similar goals conducted in Italy. With respect to BT, we assume no biases.
Table 3 offers a list of the unit estimates for the two main benefit categories: non-use values and use values (described below).
Table 3.
Average unit benefit estimates for good water status.
Table 3.
Average unit benefit estimates for good water status.
| Measures | Pressures | Source | Units of measure | Mean Value |
|---|
| Use Value | | | | |
| Cost saving for drinking water treatment | nitrogen and phosphorus | [32] | €/mc | 0.80 |
| Cost saving for drinking water treatment | organohalogens | [32] | €/mc | 0.09 |
| Cost saving for the emergency interventions in case of drought events | water overuse | [46] | €/mc | 0.79 |
| Non-use Value | | | | |
| Recreational value | pollutants | [44,47,48,49] | WTP * /Household | 10.14 |
| Ecological value | nitrogen and phosphorus | WTP/Household | 6.89 |
4.6.1. Non-Use Values
The non-use value of an asset is usually estimated through methods based on the interpretation of economic perceptions (subjective values). This imposes the need to collect numerous (and, therefore, extremely expensive) interviews. The BT consists in the transfer of existing estimates of the non-market values of a given asset from site to site [
50].
As previously stated, this paper exploits the BT method with respect to recent studies carried out in Italy and in other European countries. Specifically, we took advantage of the estimations of the annual households willingness to pay (WTO) for both the improvement of water quality [
44,
50] and the restoration of water bodies in protected areas [
48,
49], which correspond, respectively, to the improvement of recreation standards and the improvement of the ecosystem quality. Estimates have been adapted to Emilia-Romagna according to the BT method developed by Raggi
et al. [
44], which takes into account three variables as the main determinants for WTP: the average number of family members, the mean per-capita income and the share of drinking water in the considered water reservoir (e.g., aquifer, river basin). These parameters were estimated in both the study site and the policy site, all three which were then used to adapt the benefit estimation. Mean values are shown in
Table 3.
4.6.2. Use Values
The estimation of the use value is carried out for all those sectors that benefit from the availability of high quality water. This value is related to the functional destination of water resources (drinking water, bath water and water for the protection of fish and mollusk life) and the indirect damage caused by water overuse. In the study region, water pollutants mainly compromise drinking water. With respect to the use value, the achievement of a good ecological status results both in the reduction of costs needed to treat water for drinking standards and in the ability to face water scarcity during drought events.
Benefits have been estimated in terms of cost savings. The achievement of GES, in fact, does not require the treatment of water contaminated by nutrients and the mitigation of the emergency caused by water scarcity. The unit cost for denitrification and for the treatment of water contaminated by organohalogens (bioremediation) were provided by ARPA [
32]. The costs associated with the emergency interventions in the case of drought events were estimated based on the available records regarding costs incurred by the Emilia-Romagna region in the past decade [
46].
4.7. Sensitivity Analysis
We decided to focus the sensitivity analysis on non-use benefit estimates, which are recognized to be more sensitive to uncertainty than cost estimates [
51]. This choice is further motivated by the low accuracy of the method adopted to assess the non-use value (the BT method).
We carried out the sensitivity analysis in two different ways. First, we considered a generic percent variation of the non-use benefits estimation to account for uncertainty in values due to sample selection, response rates and, generally speaking, uncertainties in transposing sample estimates to the population. Second, we allowed for a variation of benefits in a range identified by the variability in the estimates available from existing studies.
As for the second sensitivity analysis mentioned above, a number of studies are available on the assessment of the non-use value of water resources in Europe: the Netherlands [
13], Germany [
52], Italy [
44,
48], Spain [
47,
53], Denmark [
54], England and Wales [
55], Scotland [
56] and Ireland [
57]. Most of the cited studies refer to water quality improvement [
13,
44,
53,
54,
55,
56,
57], while a few studies focus on the improvement of recreational value [
48,
49,
56,
57].
The range of benefits for the sensitivity analysis was identified by selecting two of the listed studies for the improvement of recreation standards and two for the improvement of ecosystem quality. The studies were selected according to two screening criteria: the degree of similarity to the reference area (more or less close to the site characteristics) and the relevance of the topic (recreational value/water status value). The first criterion prevailed when analyzing the improvement of ecosystem quality, while priority was given to the second criterion when assessing the recreational values. For the quality perspectives, we exploited information from Raggi
et al. [
44] and Hernandez and Salazar [
47]. Both studies adopted the same criterion of benefit assignment according to the status of water bodies, described in Brower
et al. [
13]. The first study refers to the Po River Basin. The study adopted a BT method estimate based on Brower
et al. [
13] referring to the Scheldt Basin, Netherlands. According to the results of Brouwer
et al. [
13], a level of positive bidders of 18% was adopted. The analysis carried out by Raggi
et al. [
44] was readapted to the regional scale and to the year 2010 with the result of an annual WTP for reaching GES in surface water of 4.8 €/household and 9.1 €/household for achieving a good status of groundwater. The second study refers to the Guadiana River Basin, which covers part of both Spain and Portugal, and makes use of a contingent valuation method. By transposing the results from the Guadiana River Basin to the Emilia-Romagna Region, we obtain an annual WTP of 9 €/household with 50% positive bidders.
With regard to the recreational perspective, we exploited information from Alberini
et al. [
48] and Bateman and Lagford [
49]. Although there are noteworthy differences in the site characteristics, both studies estimate the recreational values of protected areas. The survey presented in Alberini
et al. [
48] was carried out on S. Erasmo Island, close to Venice, Italy, and made use of a Contingent Valuation Method. By transposing results from the site areas described in Alberini
et al. [
48] to the protected areas in Emilia-Romagna, we obtained an average annual WTP to reach a good recreational standard of 7 €/household with 35% positive bidders. The survey presented in Bateman and Lagford [
49] was conducted in the Norfolk Broads, England. A contingent valuation method was also adopted in this study. After adaptation of benefit estimates, the average annual WTP to reach a good recreational standard for protected areas in Emilia-Romagna is 14 €/household, with a percentage of positive bidders of 16%.
Low estimates of the non-use value for water quality and recreational standards were summed up to identify the lower bound of the benefit value, estimated at 32 M€; similarly, an upper bound was derived from the respective high estimates, equal to 64 M€.
4.8. Results
Rather than expressing the results in terms of net present value, which would be difficult to compare with measures that only produced annual effects without initial costs, we have reported all figures in annual equivalents and analyze the results as average expected costs and benefits per year.
The results refer both to the identification of regions where cost disproportionality is more likely to occur and the selection of the most cost-effective set of measures required to reach the GES.
Table 4 explains the level of intervention for all of the measures identified to achieve the directive water status objectives in Emilia-Romagna for each type of pollutants and for each source of pressure. Measure complementarity was found for diffuse pollutants both for the urban sector and agriculture. Cross interaction between measures is particularly low for the first sector, yet high when considering agriculture. In
Table 4, the level of implementation of each measure is the ratio between the number of water bodies of interest by a given measure and the whole number of water bodies threatened by a given pressure for each sector. When the summation of the level of implementation of a set measures directed to solve a given pressure for each sector is higher than 100%, there is measure complementarity (more measures contextually concur to fight a given pressure). When this summation is equal to 100%, there is measure substitution. Complementarity occurs for most of the measures directed to diffuse pollutants. Substitution is present when dealing with pesticides or water shortages.
Table 4.
Level of implementation of each measure for each type of pollutant and for each source of pressure.
Table 4.
Level of implementation of each measure for each type of pollutant and for each source of pressure.
| Sectors | Main pressures | Measures | Level of implementation (%) |
|---|
| Urban sector | Nitrogen and phosphorus | Upgrading of treatment plants | 45% |
| Construction of new containment tanks | 61% |
| Extensivization | 87% |
| Livestock wastewater disposal | 12% |
| Plantation of buffer strip | 52% |
| Agriculture | Water shortage | Construction of inter-farm reservoirs | 32% |
| Conversion of ex-quarry areas in reservoirs | 34% |
| Extensivization | 34% |
| Pesticides | Prohibition | 10% |
| Substitution | 70% |
| Dosage reduction | 20% |
| Industry | Heavy metals | Construction of advanced purification plants | 100% |
| Organohalogens | Reclamation of brown field sites | 100% |
| Morphological alterations | Limitation for the extraction of row materials | 100% |
According to our estimations, the achievement of a good status for all of the regional surface waters costs about 330 M€ per year (
Table 5). If we do not consider the interactions between measures described previously (
Table 1), the costs needed to achieve this status for groundwater in Emilia-Romagna (only shallow aquifers) would be about 37 M€ (
Table 5). If we take into account that some of the measures planned to achieve a good status of surface waters will also improve the status of groundwater, the corresponding costs needed to achieve the good status of the regional shallow aquifers would be nearly halved (19 M€ in
Table 5).
Table 5.
Cost estimation at the level of aggregation of groundwater bodies. For groundwater, costs estimated when taking into account interactions between measures are also provided. GES, Good Ecological Status.
Table 5.
Cost estimation at the level of aggregation of groundwater bodies. For groundwater, costs estimated when taking into account interactions between measures are also provided. GES, Good Ecological Status.
| Aggregate Area | Achievement of the GES of surface water Costs (€) | Achievement of the GES of groundwater |
|---|
| Costs not considering interaction of measures (€) | Costs considering interaction of measures (€) |
|---|
| Mountains | 16,713,459 | - | - |
| Conoids | 17,998,915 | 14,963,545 | 9,020,863 |
| Phreatic | 295,351,881 | 22,045,175 | 9,950,848 |
| Region | 330,064,255 | 37,008,720 | 18,971,711 |
The overall costs needed to achieve the good status of both surface and groundwater bodies are about 349 M€/year and the corresponding benefits are about 53 M€/year, which leads to a ratio Benefits/Costs (B/C) of 0.15 for the region (
Table 6).
These quantities are referred to in a scenario (hypothesis 1 in
Table 6), in which all of the interventions needed to achieve the good status are implemented. As previously explained, due to the physical hierarchy of the surface water bodies, if the suggested measures are not implemented upstream (e.g., mountain areas), the costs to achieve a good status downstream (e.g., hill areas) will rise, (hypothesis 2 in
Table 6). When presenting these results, it is worth reiterating the assumption made on the study area boundaries (
Section 4.2) that the considered surface waters have both their origin and outlet in Emilia-Romagna (with the exception of the Po River, which was not included in the analysis).
Table 6.
Cost and benefit estimation for both surface and groundwater at the level of aggregation of groundwater bodies.
Table 6.
Cost and benefit estimation for both surface and groundwater at the level of aggregation of groundwater bodies.
| Aggregate | Hypothesis 1 recovery of water status for all areas | Hypothesis 2 recovery of water status for single area |
|---|
| costs (€) | benefits (€) | benefits/costs | costs (€) | benefits (€) | benefits/costs |
|---|
| Mountains | 16,713,458 | 2,955,827 | 0.18 | 16,713,458 | 2,955,827 | 0.18 |
| Conoids | 27,019,778 | 17,986,184 | 0.67 | 39,927,067 | 17,986,184 | 0.45 |
| Phreatic | 305,302,729 | 32,457,678 | 0.11 | 403,699,677 | 32,457,678 | 0.08 |
| Region | 349,035,966 | 53,399,689 | 0.15 | 443,626,744 | 53,399,689 | 0.12 |
Table 6 also shows that the ratio between benefits and costs tends to decrease from the hill belt (conoids) to the plain areas (phreatic).
This is the case, as most of the benefits tend to be concentrated in the foot belt strip, both because of the functional destination of water resources and because of the non-use value perceived for those areas. Indeed, most of the water for drinking purposes is extracted from both surface and groundwater bodies in conoid areas, hence allowing for an estimation of the use value of water resources. Moreover, most of the protected areas overlap conoids, hence increasing the estimation of the non-use value of water resources. On the other hand, costs tend to focus on plain areas (corresponding to phreatic aquifers), where industrial, urban and agricultural pressures are greater.
According to the aggregation pattern developed in the methodology, net benefit estimations are too low for all of the aggregates discussed above, even if the estimates vary significantly within the aggregates. This justifies the need to further deepen the analysis for the entire region. This should be accomplished by considering the second (more detailed) level of aggregation, the groundwater body level and, at this level, analyzing the cross interaction between cost benefit and cost effectiveness indicators.
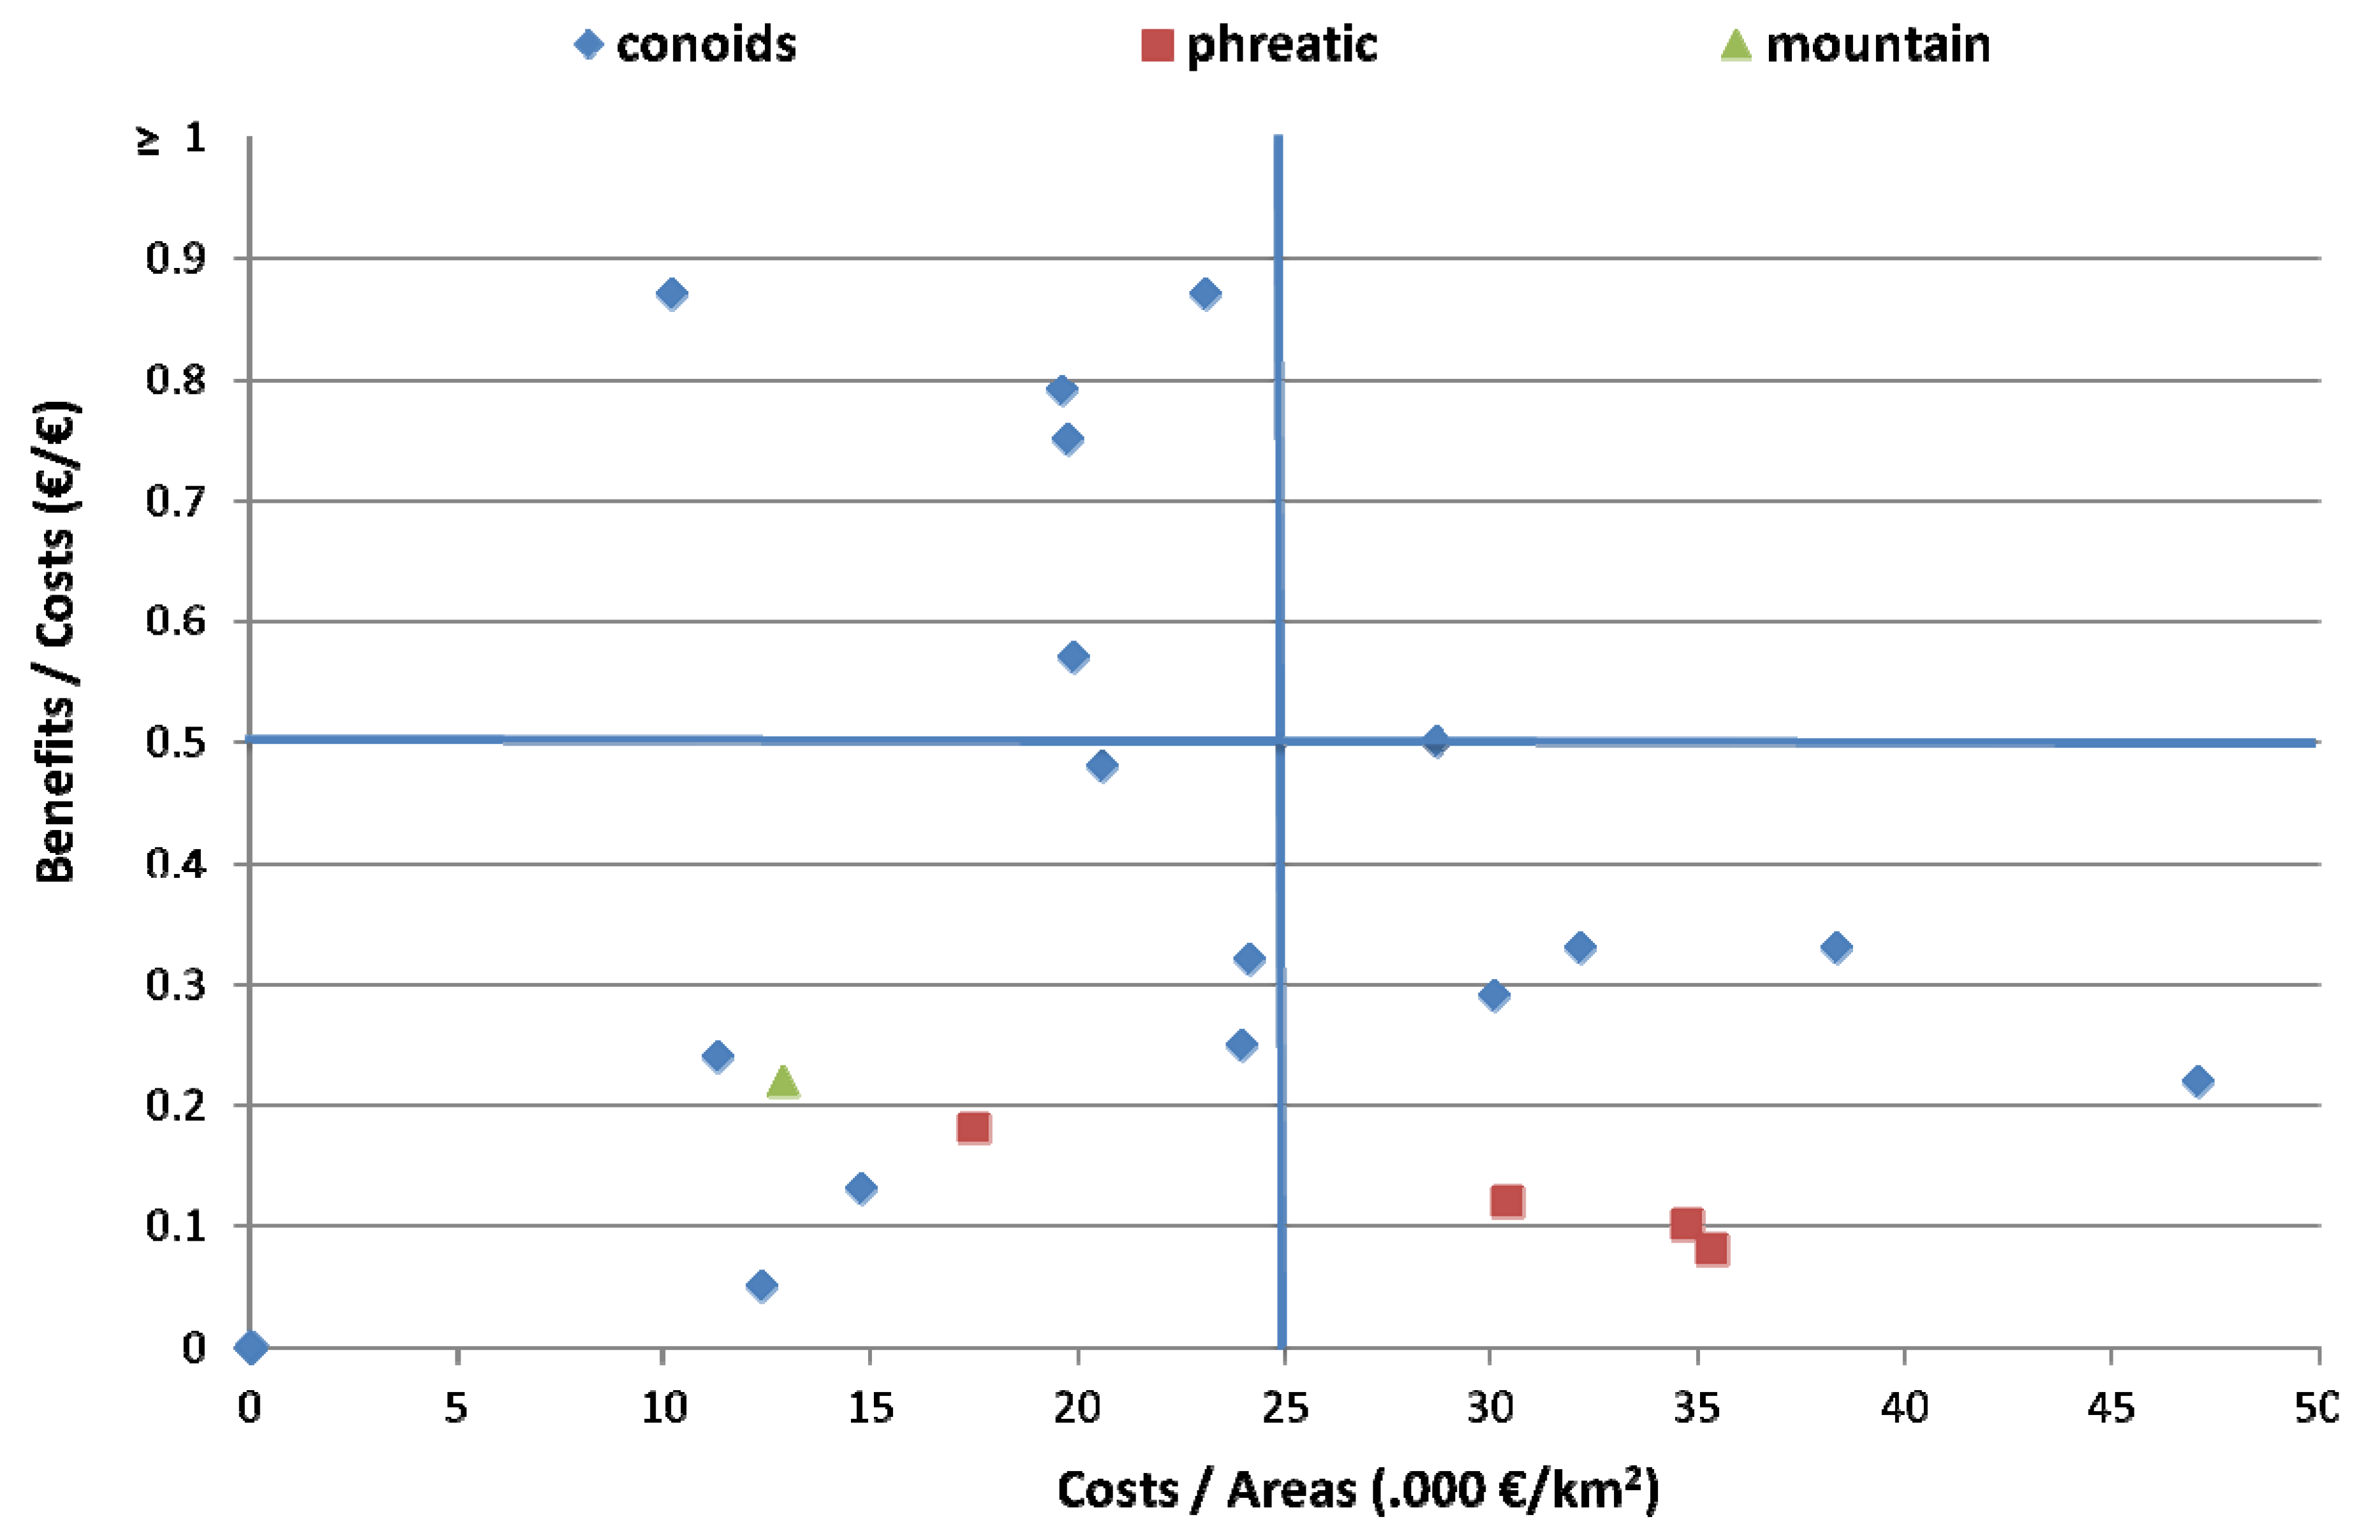
Figure 3 displays the relationship between two CBA and CEA indicators (benefits/costs and costs/areas, respectively). The quadrants are defined by two lines representing the average values of the two indicators. As a result, the main contribution of this representation is simply to facilitate data interpretation based on relative results.
Figure 3.
Crossing CBA indicators and CEA indicators at the level of aggregation of groundwater bodies:according to their location stratified with respect to the conoids, the phreatic aquifer area and the mountain belt.
Figure 3.
Crossing CBA indicators and CEA indicators at the level of aggregation of groundwater bodies:according to their location stratified with respect to the conoids, the phreatic aquifer area and the mountain belt.
The chart shows that most of the conoid areas tend to be located in the upper left quadrant of the figure, while the phreatic areas are in the lower quadrants (mainly in the lower left one). Thus, the assessment of cost proportionality, both in a cost/benefit and a cost/effective perspective, is positive for most of the conoid areas (hence reinforcing their prioritization for intervention) and negative for phreatic regions.
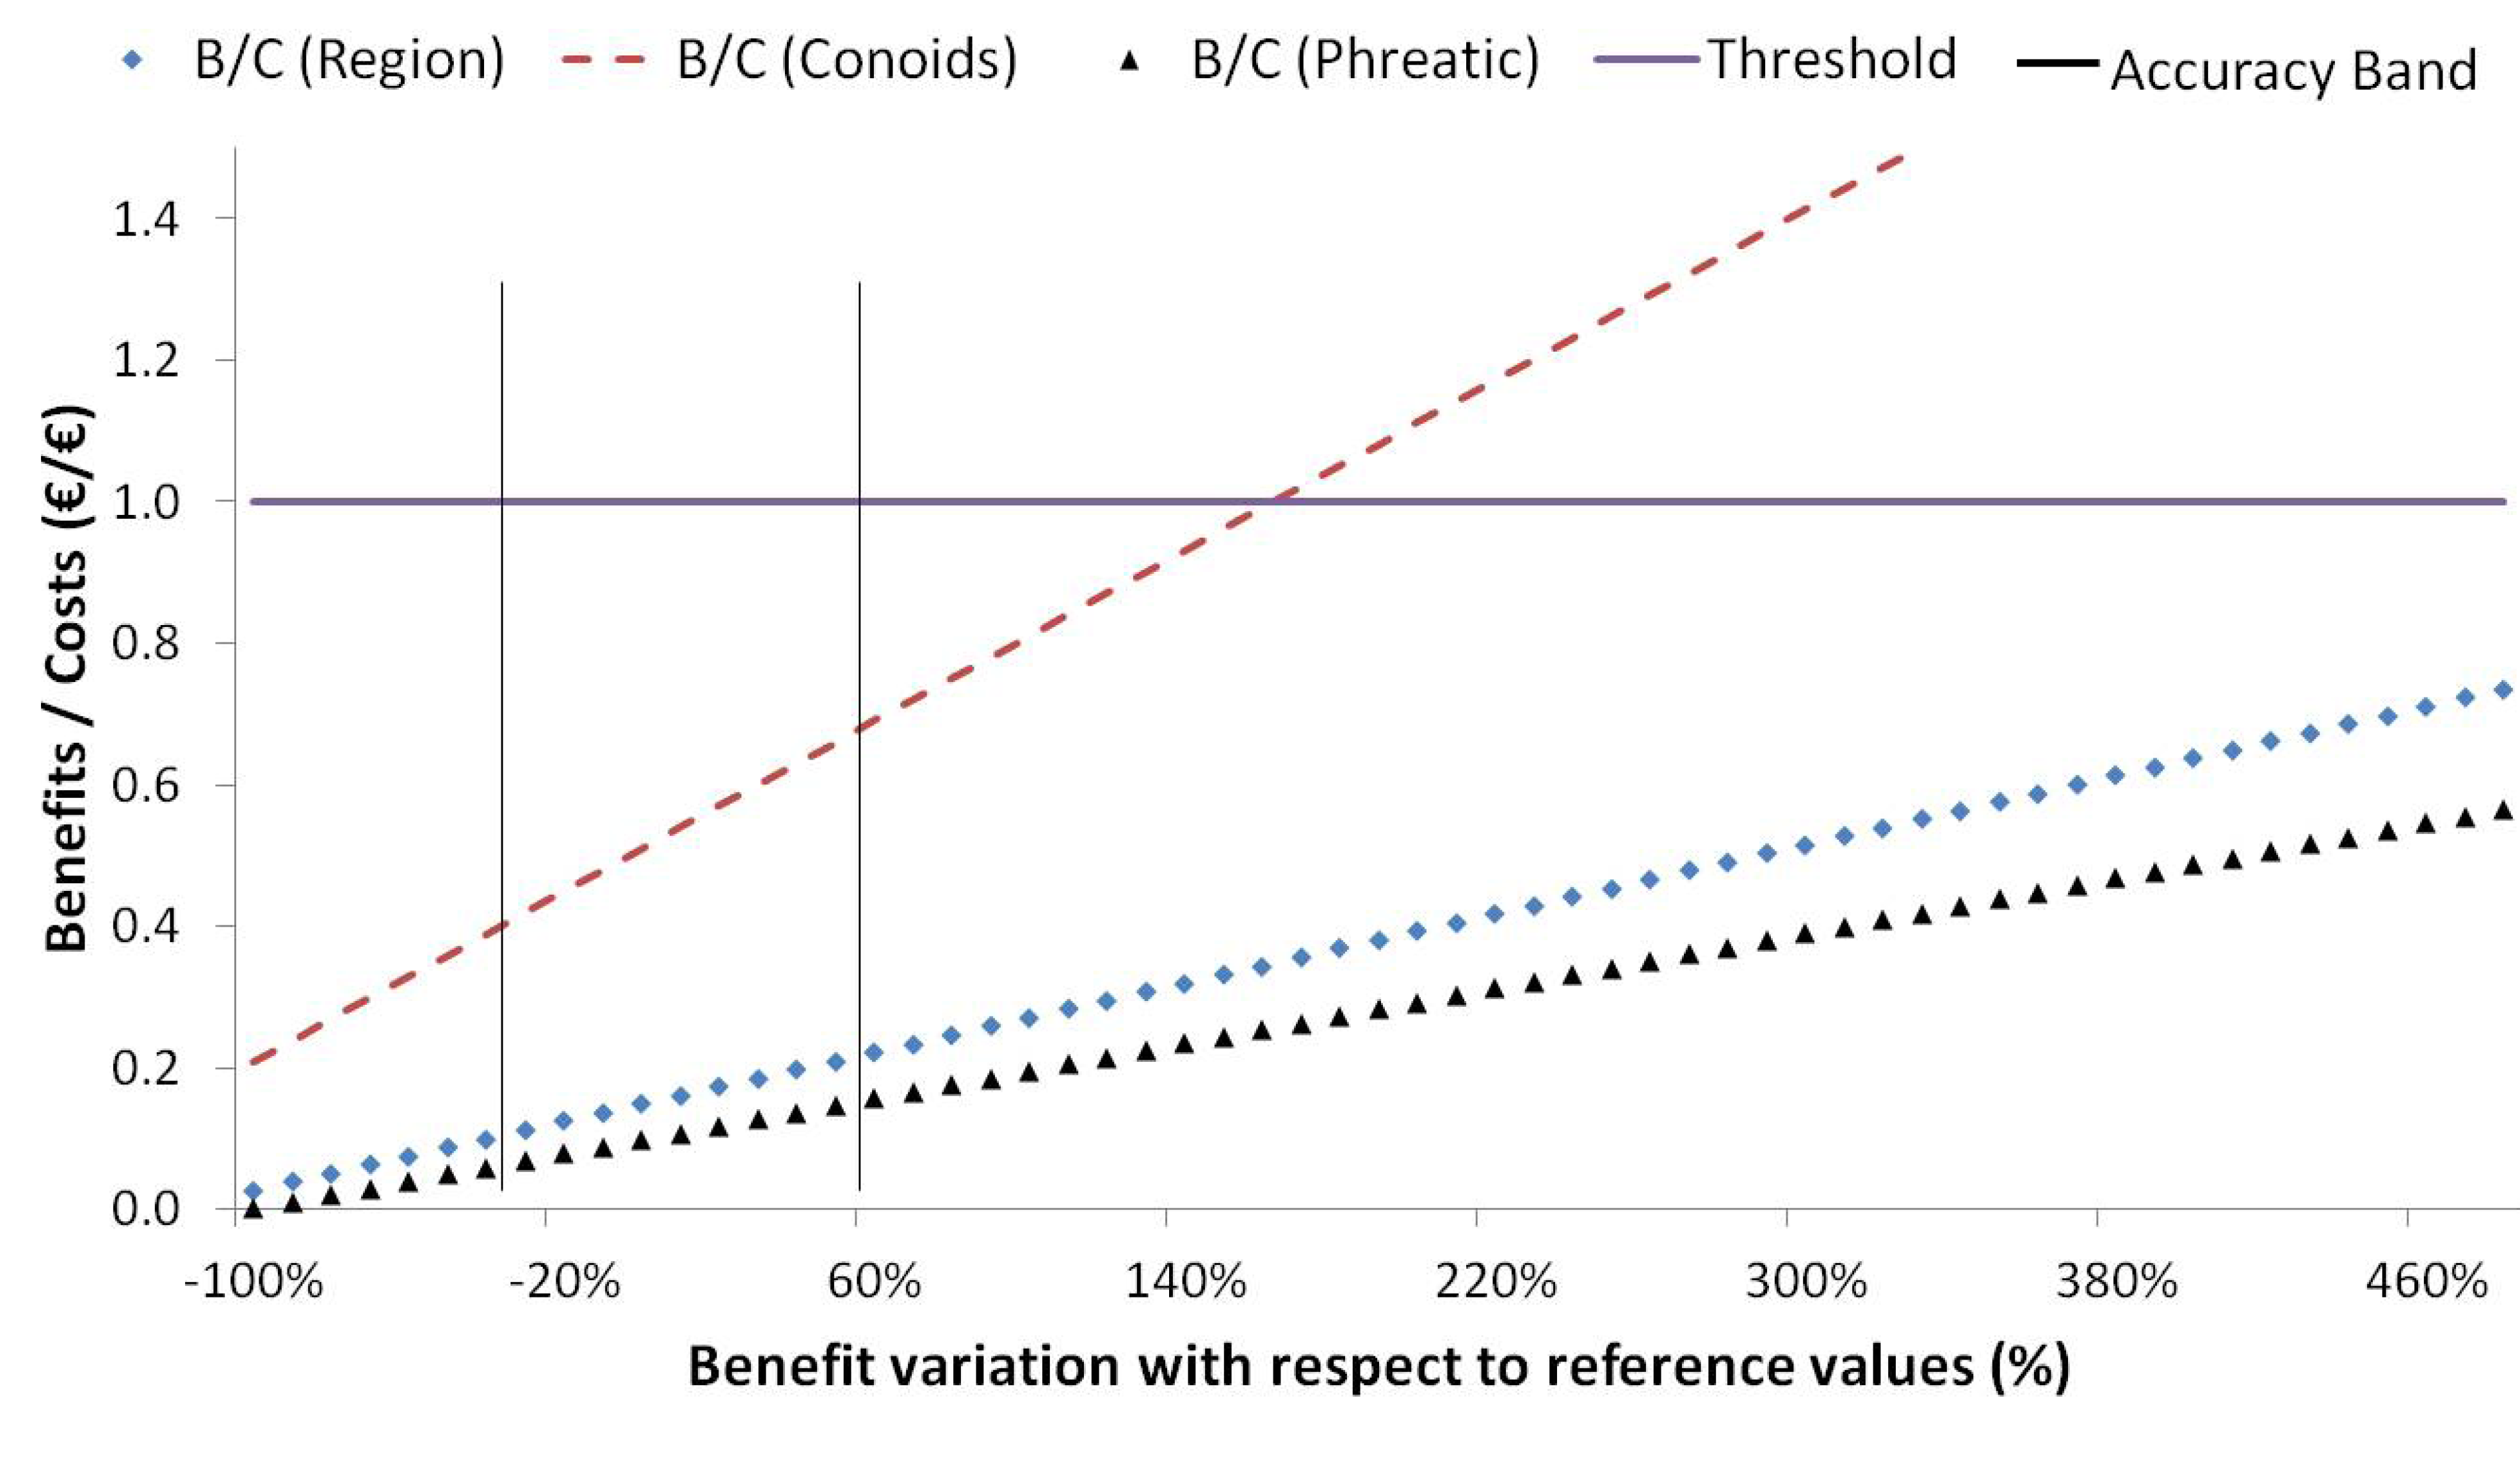
Finally,
Figure 4 and
Figure 5 show the results of a sensitivity analysis with respect to the non-use value component of benefit estimates. In
Figure 4, the trend of the CBA indicator is plotted against the increasing level of benefit variation with respect to the reference value. The reference value is provided by summarizing both benefit estimates for the use value and the average non-use value described above. The vertical lines in the chart represent the band within which the estimated value is expected to fall. In this area, on average, the CBA indicator ranges from 0.10 to 0.20 for the whole region. This range tends to be lower for the plain region, while it is higher for the hilly belt. This is highlighted by the differences in slope for the trend lines in the chart. For the hilly belt, the CBA index reaches the threshold of one when benefit estimates increase by +150% with respect to the most likely estimated value. This variation increases significantly when considering plain areas. This is due to the fact that non-use benefit estimates mainly focus on the hilly belt, where both recreational and ecological components are likely to occur, while, on the other hand, costs for pressure abatements are much higher in plain areas.
Given that the sensitivity analysis is carried out only with respect to the non-use value, the use value component is shown by the interception of the B/C trend with the y-axis. The intercept is greater than zero for the hilly belt, where most of the functional impacts occur. On the contrary, in the plain areas, water bodies do not show any functional use. This is reflected on a B/C trend intercepting the y-axis at the origin.
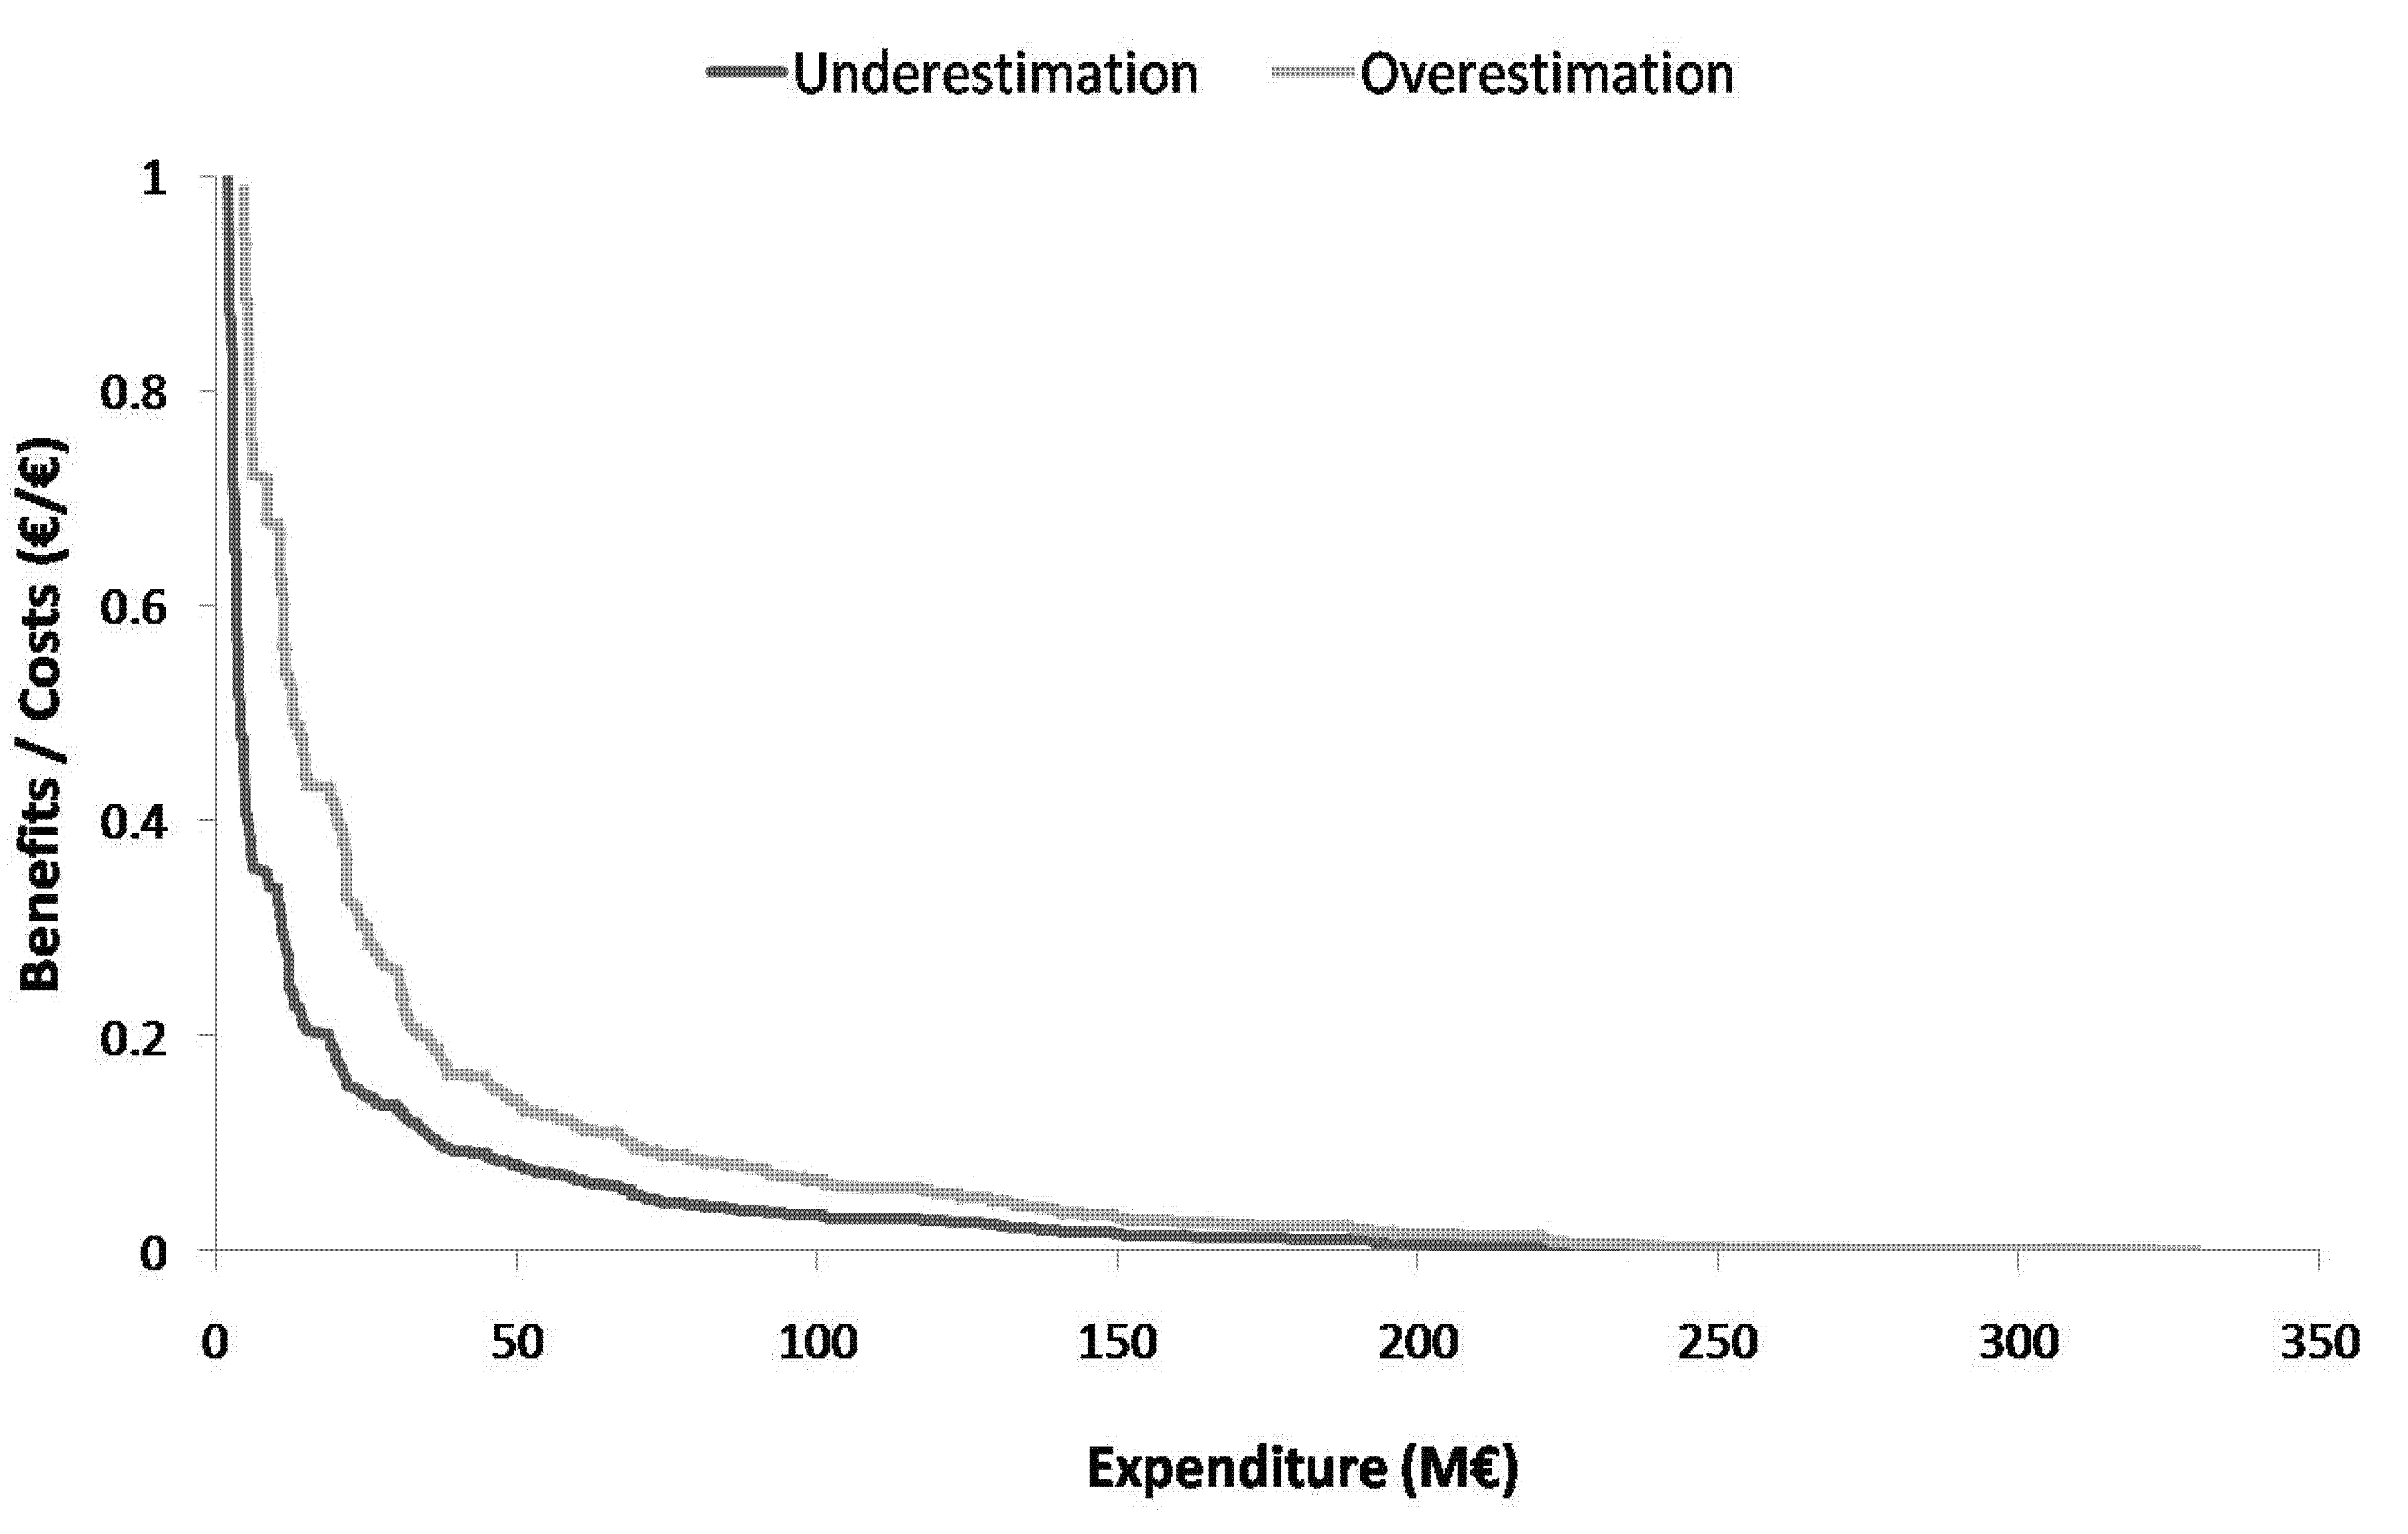
Figure 5 shows the change in levels of the B/C index with different levels of available/acceptable funding to implement the measures, in the range of benefit estimates given by the sensitivity analysis illustrated above. The results show a very marked reduction in the marginal cost/benefit ratio with increasing expenditure. This reduction is much more evident in the first part of the curve. Under the optimistic scenario, 20% of water bodies show a benefits/costs ratio higher than one, while under the pessimistic scenario, only 5% of water bodies exceed this threshold. Given a threshold of one, the percentage of water bodies for which the assessment recommends the intervention is high if considering that, on average, the B/C index is 0.15 for the whole region. This further confirms the strong difference between areas of impact (the hilly belt) and the sources of pressures (the plain regions).
Figure 4.
Benefit and cost ratio trend on the benefit variation with respect to reference values.
Figure 4.
Benefit and cost ratio trend on the benefit variation with respect to reference values.
Figure 5.
Variation of the benefit and cost ratio as a function of the acceptable expenditure to improve the ecological status of water resources for both under- and over-estimation of non-use benefits.
Figure 5.
Variation of the benefit and cost ratio as a function of the acceptable expenditure to improve the ecological status of water resources for both under- and over-estimation of non-use benefits.
5. Discussion and Conclusions
In this paper, we estimate costs and benefits associated with WFD implementation in Emilia-Romagna for the purpose of assessing disproportionate costs. As mentioned above, the implementation of the methodology at the regional level, driven by Italian legislation, has the main function of complementing district level provisions by supporting the local administration in charge of measure implementation.
The cost and benefit assessment was driven by the water status objectives of the Emilia-Romagna Region. Once the types of pressures threatening water resources in the region were defined, a consultation with local stakeholders enabled the identification of a number of measures for each type of pressure. Then, in light of the water status objectives, a cost minimization analysis allowed for the identification of the most efficient set of measures and the related levels of activation. The procedure presented in this study takes into account both qualitative and quantitative pressures affecting ground and surface waters. Thus, the risk of “overshooting”, which could occur by separately considering the effect of measures on pressures (nutrients, pesticides, etc.) and on water bodies (groundwater, surface waters), is avoided. This effect, not considered in previous studies, arises as measures can contextually solve more than one problem (in terms of pressures and areas of interest).
With regard to benefits, this paper separately estimates changes in water status that are related to water uses and changes associated with non-use effects. For use values, available information enabled the estimation of cost savings for the treatment of drinking water and emergency interventions in case of drought events.
One limitation in this study with respect to the benefit component is that other secondary effects on the economy and society have not been considered. Non-use values have been estimated exploiting other studies through the application of the Benefit-Transfer Method. Both the perceived value of protected areas and water quality have been estimated. As we were aware of the limitations of this method, a sensitivity analysis was hence performed, allowing for the identification of the range of variation within which the real perceived value would likely fall. However, the way benefits were estimated remains a limitation of this study and would hence benefit from further investigation by way of an original evaluation in the region.
Another area of possible improvement concerns the treatment of uncertainty. Uncertainty derives from technical factors, as well as economic variables. Errors in estimating these factors affect both the overall output of the assessment (similarly to benefits) and the recommended policy decisions from the selection of one option of intervention or another. The consequences connected to uncertainty also need to be properly developed by referring to approaches that are more sophisticated than the ones adopted for this analysis, such as stochastic models [
58], Monte Carlo simulations [
59] or Bayesian models [
60].
Another relevant issue that was not addressed by this study is the financial aspect of measure implementation and disproportionality analysis, which would need to be investigated prior to the implementation of measures.
According to the results of this study, the benefits/costs ratio tends to decrease from the hilly belt of the region to the plain area. This is caused by the fact that benefits tend to focus on conoid aquifers located in the hilly belt and costs in the plain side of the region. Yet, for the mountain belt, the level of the benefits/costs indicator is low. In this belt, there are no effects on groundwater, so surface waters are the only sources of benefits.
The general low value of the CBA indicator suggests the reasonable insight that, in most of the region, the costs to achieve the GES are too high in comparison with the benefits. However, information gaps on the side of benefits may have led to a somewhat unbalanced estimation of costs and benefits in favor of the former. In order to partially overcome this issue, and for a more robust assessment, the study suggests a cross-evaluation using different cost benefits and cost effectiveness indicators, in order to identify areas that are more likely to be a priority for intervention.
Altogether, the procedure was largely driven by data availability and time constraints. This is also the main cause of limitations in the coverage and economic sophistication of this study, but also hints at the need for a better understanding of local assessment conditions in order to develop practical solutions for economic assessments in the directive.
This work is also amenable to development in various other directions, in addition to those already mentioned above. On the practical side, the procedure could be made more effective through a more explicit use of a two-step approach, based on a screening of hotspot areas, followed by in-depth analyses of selected areas. On the research and decision-making support side, the procedure presented here could be developed into a model of regional pressures/water quality/quantity relationships, allowing for a finer assessment of policies and water quality objectives for the future.


