Article

Utilization of Ion-Exclusion Chromatography for Water Quality Monitoring in a Suburban River in Jakarta, Indonesia

1
Faculty of Industrial Sciences and Technology, University Malaysia Pahang, Lebuhraya Tun Razak, 26300 Gambang Kuantan, Pahang Darul Makmur, Malaysia
2
Centre for Earth Resources Research & Management, University Malaysia Pahang, University Malaysia Pahang, Lebuhraya Tun Razak, 26300 Gambang Kuantan, Pahang Darul Makmur, Malaysia
3
Graduate School for International Development and Cooperation, Hiroshima University, 1-5-1 Kagamiyama, Higashi-hiroshima 739-8529, Japan
4
Department of Environmental and Symbiotic Sciences, College of Agriculture, Food and Environmental Science, Rakuno Gakuen University, 582 Bunkyodai-Midorimachi, Ebetsu, Hokkaido 069–8501, Japan
5
Faculty of Science and Technology, Gunma University, 1-5-1 Tenjin, Kiryu, Gunma 376–8515, Japan
*
Author to whom correspondence should be addressed.
Submission received: 21 January 2014 / Revised: 26 May 2014 / Accepted: 11 June 2014 / Published: 4 July 2014

Abstract

:
We evaluated the use of ion-exclusion chromatographic systems for analyzing the behavior of inorganic ions (e.g., bicarbonate, sulfate, chloride, nitrate, phosphate, dissolved silicate, sodium, ammonium, potassium, magnesium, and calcium ions) in a suburban river located in Jakarta, Indonesia. Carbonate, phosphate, and silicate ion concentrations were determined using ion-exclusion chromatography (IEC) on a weakly acidic cation-exchange resin column (WCX) in the H+-form with water eluent. Other ions were identified by ion-exclusion/cation-exchange chromatography (IEC/CEC) on a WCX column with tartaric acid eluent. The use of IEC systems for water quality monitoring was advantageous for the following reasons: (1) the concentrations of analyte ions, except NO3 and silicate ions, increased from upstream to downstream; and (2) the speciation of inorganic nitrogen ions could be analyzed by single injection into the IEC/CEC. The IEC approach provided beneficial information for the construction of sewage treatment facilities in our study area. Results showed that (1) the analyte concentrations for samples obtained in the downstream area were higher than those in the upstream area owing to contamination by domestic sewage; (2) the concentrations of NO3 and NH4+ correlated with the concentration of dissolved oxygen; and (3) bicarbonate concentrations increased downstream, likely due to respiration of bacteria and dissolution of concrete under low-oxygen conditions.

1. Introduction

Water pollution and the eutrophication of lakes, rivers, and oceans have been caused by the influx of wastewater associated with rapid economic development, agriculture, and industry [1,2]. In particular, the manifestations of water pollution in developing countries are remarkable. Therefore, adequate water quality monitoring is required to secure water resources in a sustainable way.
The present study focuses on the Ciliwung River (Figure 1) in Jakarta, Indonesia. This river has become severely polluted by increasing urban populations (i.e., increasing organic components in human sewage) and in response to agricultural (e.g., through fertilizer and pesticide use in agricultural fields of rice, vegetables, and fruit) and industrial development (e.g., through introduction of organic components, several heavy metals, and other products produced by the food, beverage, textile, and rubber industries) [3,4,5,6,7,8,9,10]. Such pollution is conducive to eutrophication, which occurs owing to the non-treated water discharged from human sewage contaminated with inorganic and organic components and several ionic nutrients [8,9,10]. To determine the degree of eutrophication of the river and secure its water resources, a sewage treatment system that can adequately treat wastewater should be developed; however, the development of such a system has been delayed, owing primarily to financial limitations. Under such circumstances, the necessity of water quality monitoring and management policies in Jakarta, where water environment problems are particularly serious, has been recognized prior to constructing the sewage treatment system.
Our research group collaborated with the Japan International Cooperation Agency (JICA) to analyze the present water quality characteristics of the Ciliwung River using several ion chromatographic methods. These methods included the following: ion-exclusion chromatography (IEC) with water eluent for bicarbonate, IEC with post-column derivatization for phosphate, and simultaneous IEC/cation-exchange chromatography (CEC) for common anions and cations. We developed these methods in a series of previous studies and demonstrated their usefulness for the monitoring of several environmental waters in terms of eutrophication, acidification, and other similar processes [11,12,13,14,15,16,17,18,19,20,21]. Additionally, these methods have been accepted as official analytical methods (e.g., EPA, JIS) [22,23,24,25,26].
Figure 1. Photographs showing (a) a panoramic view of the Ciliwung River; (b) sampling of the river water; and (c) the filtration of sampled water.
Water 06 01945 g001
Here, we describe the following: (1) the behavior of the bicarbonate ion, which also demonstrates the alkalinity of water; (2) the behavior of SO42, Cl, NO3, Na+, K+, NH4+, Mg2+, and Ca2+, which are indicators of water quality; (3) the influence of phosphate (H2PO4/HPO42) and silicate ions, which contribute to eutrophication; and (4) changes in the total quantity of ions in samples collected from the Ciliwung River. We also discuss the status of water pollution in the Ciliwung River, with specific reference to dissolve oxygen (DO), electrical conductivity (EC), and various biological reactions (e.g., aerobic oxidation, anaerobic decomposition, nitrification and denitrification reactions). Finally, we discuss the usefulness of the proposed IEC methods for analyzing ionic species for water quality monitoring.

2. Materials and Methods

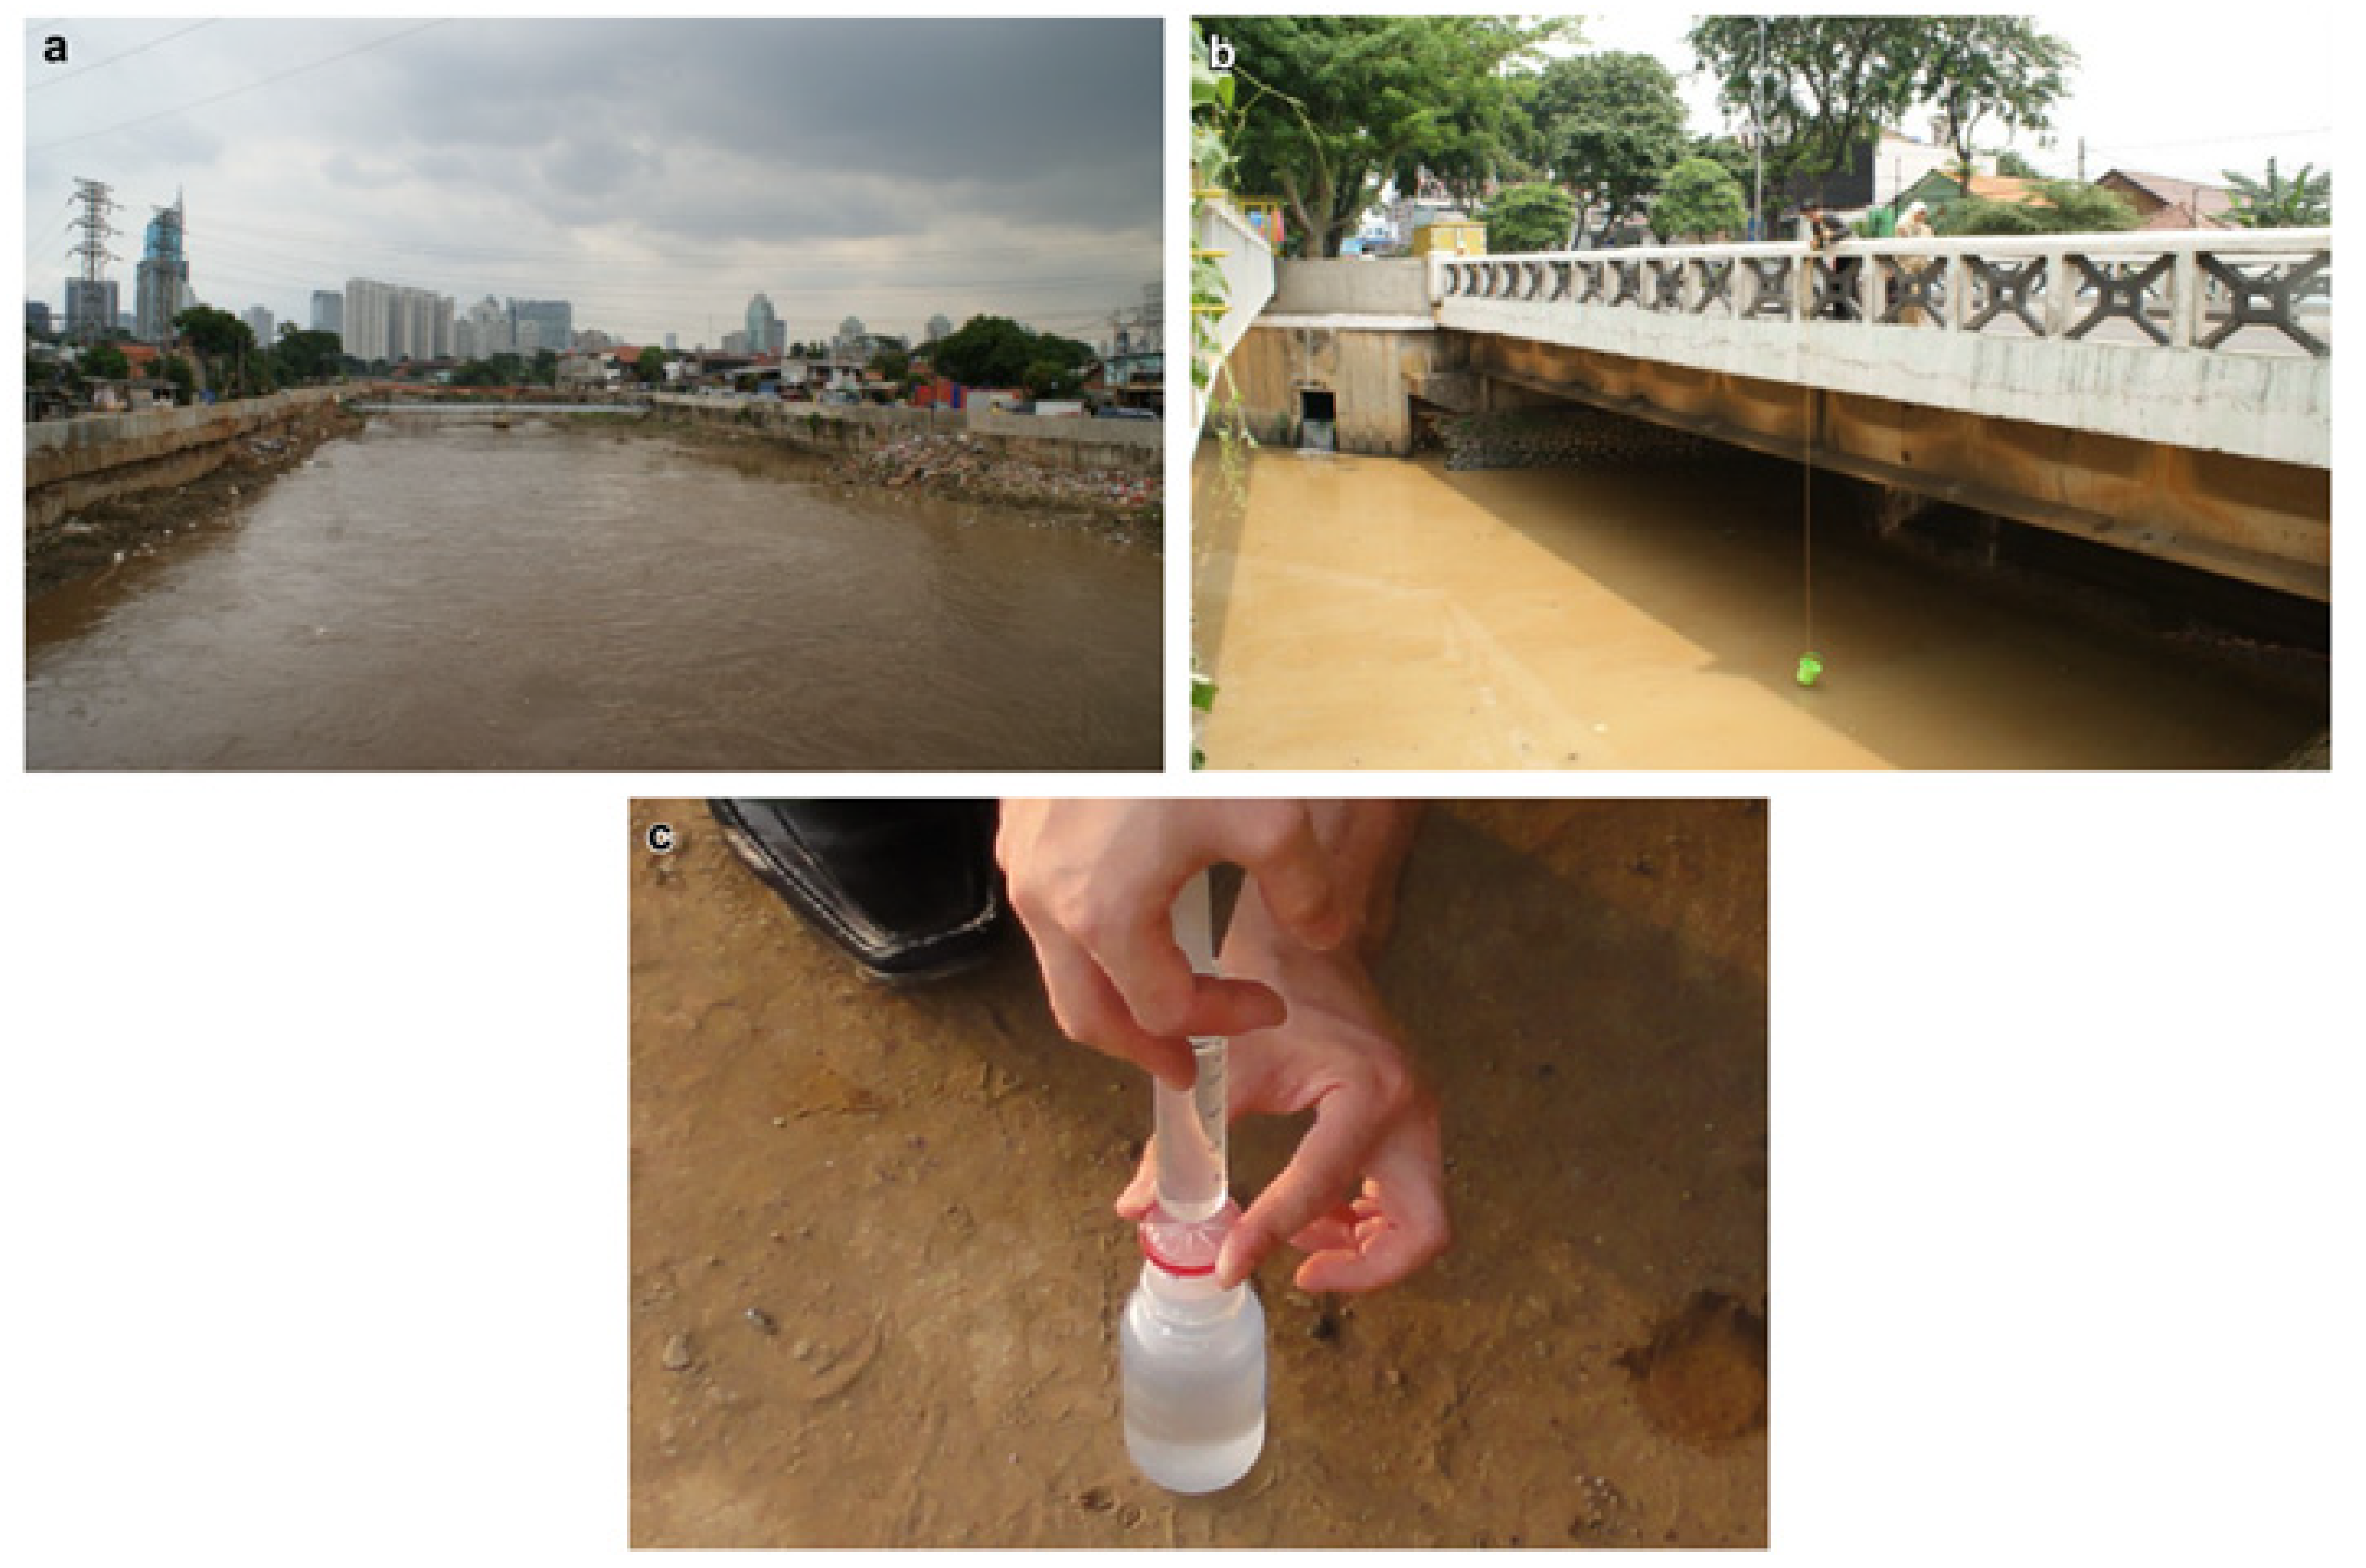
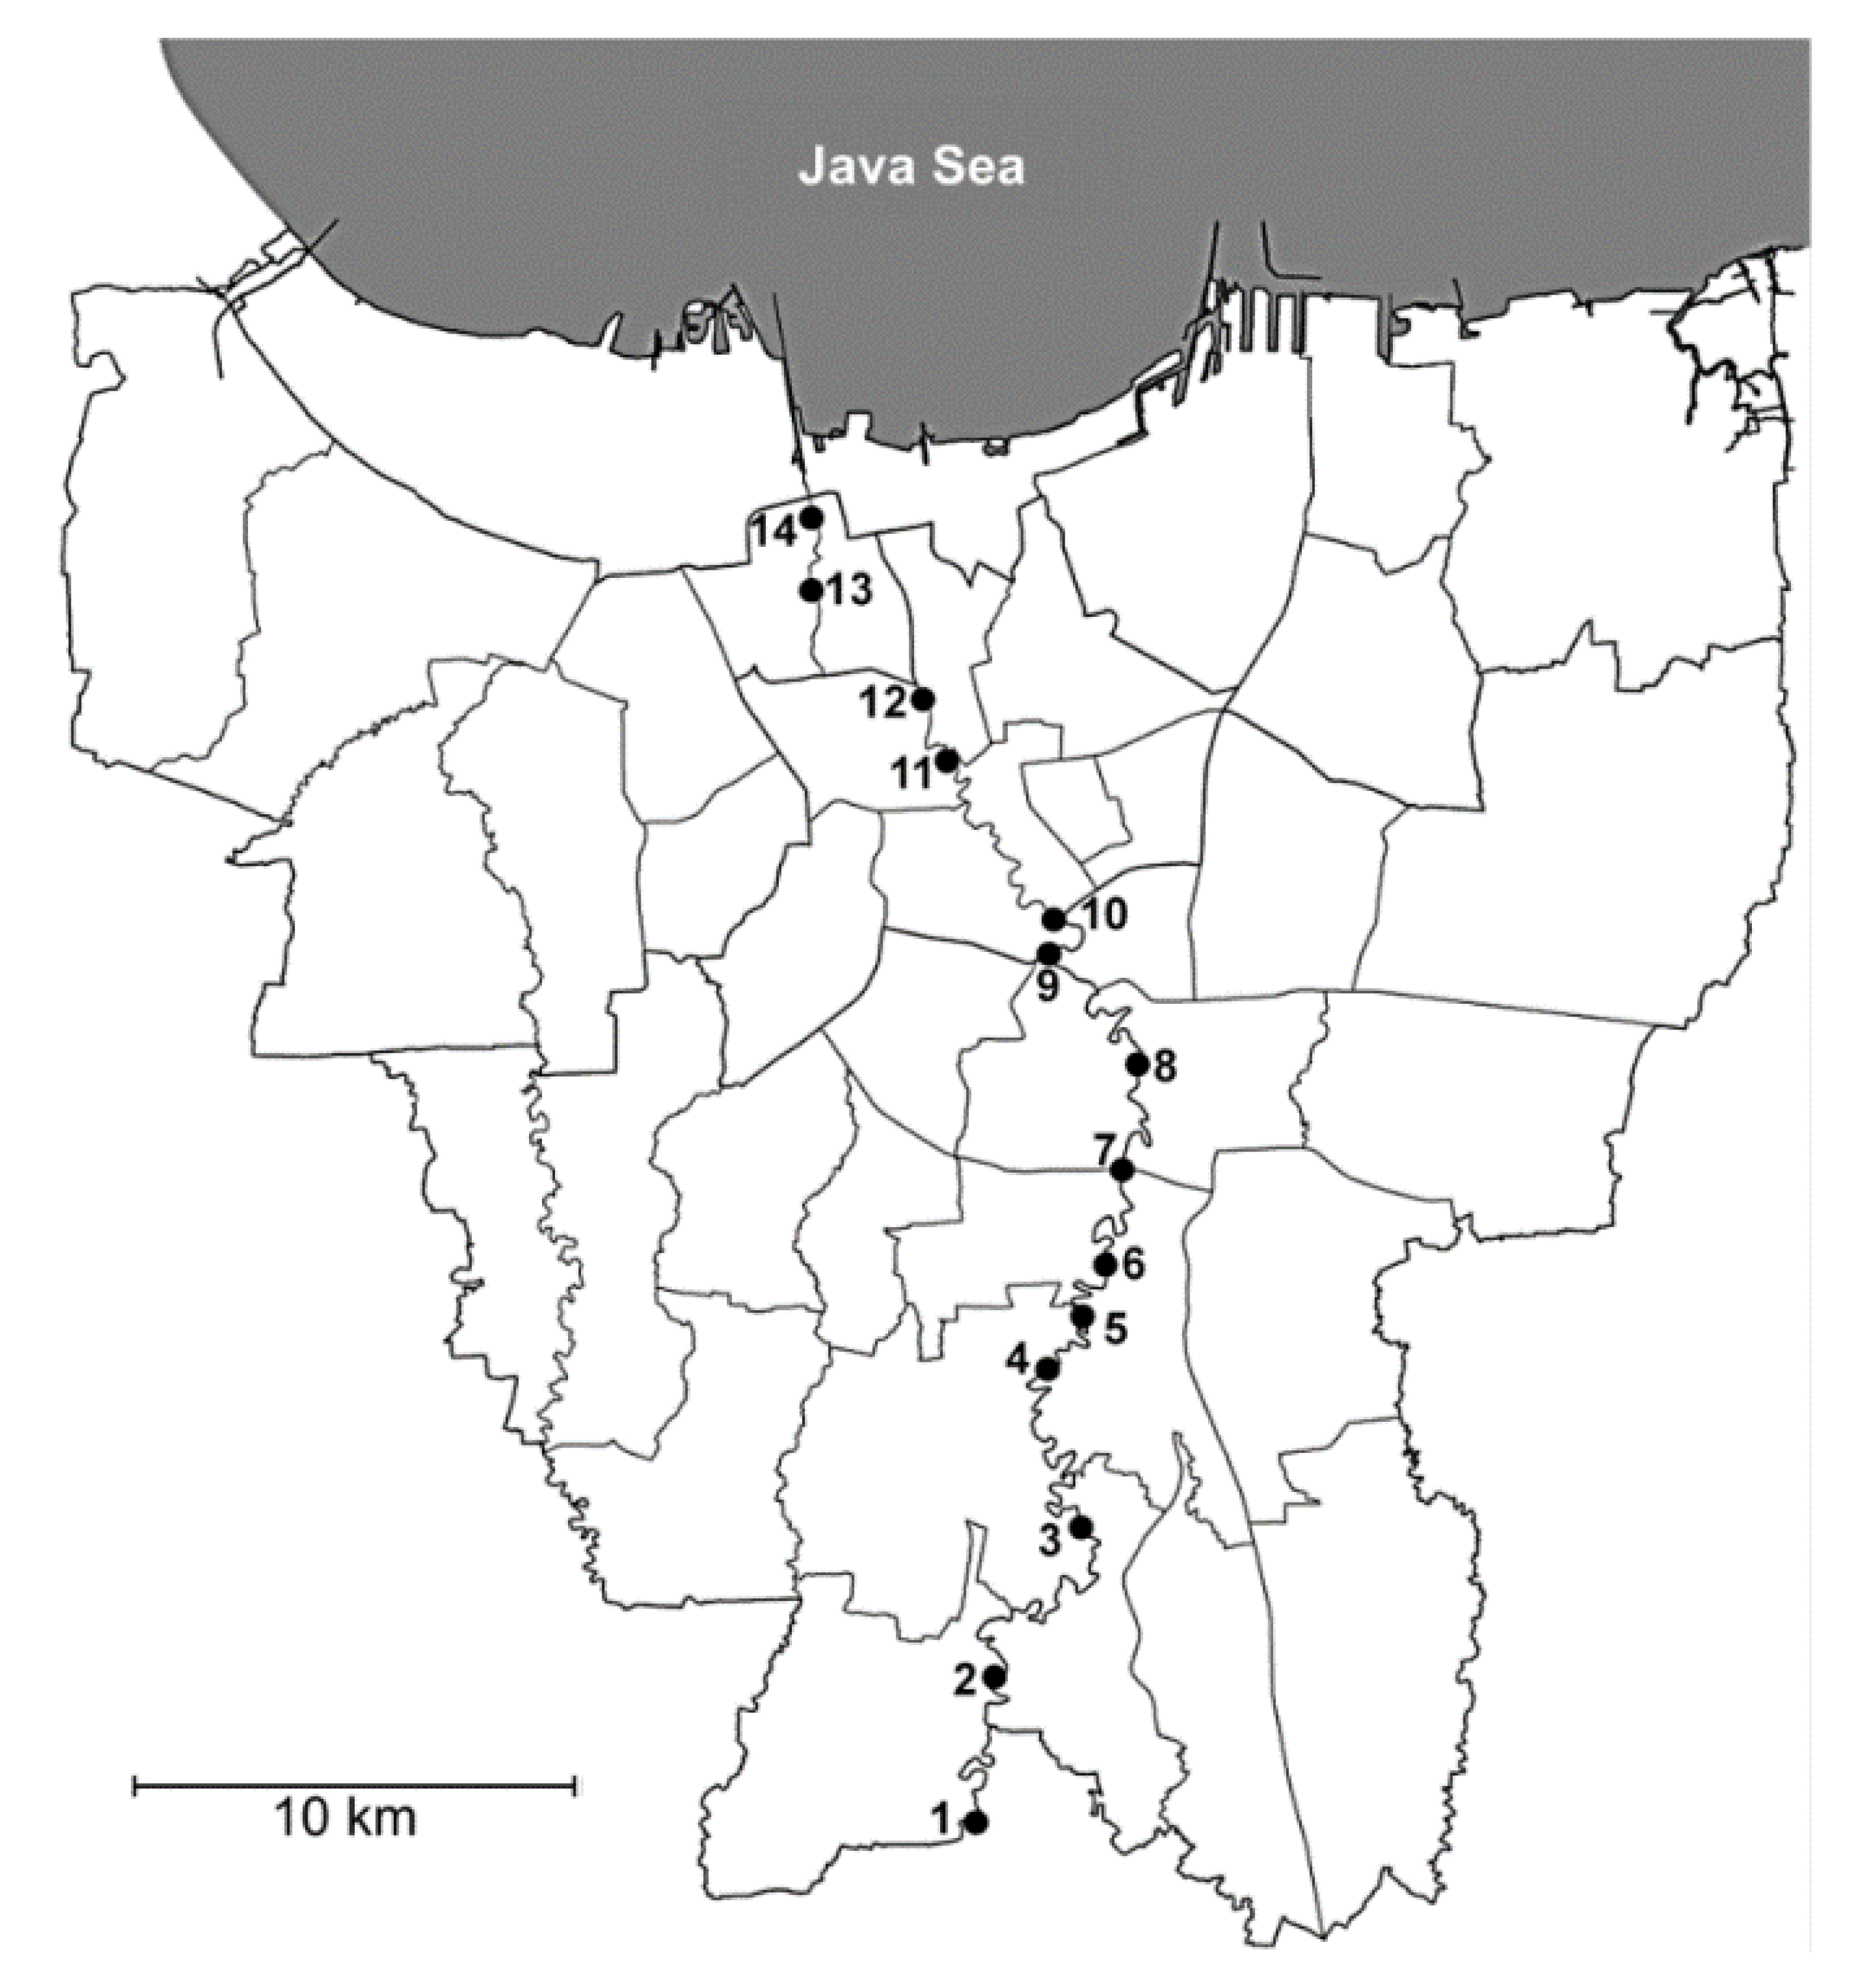
2.1. Water Sampling in the Ciliwung River

The Ciliwung River flows through the 17 different blocks of Jakarta City, Indonesia. In the present study, river water samples were collected at 14 sites, with no samples collected in the coastal area (Figure 2), on 15 June 2010. Water samples were filtered through a membrane filter (pore size: 0.2 μm; DISMIC®-25HP PTFE, Advantec Toyo Kaisha, Ltd., Tokyo, Japan) immediately following collection and then refrigerated at 4 ± 2 °C.
Figure 2. Sampling points along the Ciliwung River, Jakarta, Indonesia.
Water 06 01945 g002

2.2. Reagents

All reagents used in this study were obtained from Wako Pure Chemical Industries, Ltd. (Osaka, Japan), Pure water (18 MΩ∙cm at 25 °C) obtained from a Sartorius Arium 611 reverse osmosis system was used for the dissolution and dilution of reagents. Stock solutions were prepared using the pure water. The standard solutions that were injected to the proposed ion chromatographic systems were prepared in the range 0.501–192 mg/L by diluting the stock solutions with pure water.

2.3. Ion-Exclusion Chromatography

2.3.1. Ion Chromatograph

We used a Tosoh IC-2001 ion chromatograph, which consisted of an eluent pump, sample injector, auto-sampler, column oven, and conductivity detector. We also used a Tosoh IC-WS work station for data analyses. In addition, the following chromatographic conditions and structures were used: (1) separation column; TSKgel Super IC–A/C packed with a polymethacrylate-supported weakly acidic cation-exchange resin in the H+-form (150 mm × 6.0 mm i.d.; 4 μm-particle; and 0.2 meq./mL-capacity); (2) column temperature; 40 °C; and (3) injection volume; 30 μL.

2.3.2. IEC of Bicarbonate Ion

Bicarbonate ion concentrations in the river water samples were analyzed by IEC with water eluent. To sensitively detect the bicarbonate ion by IEC, a strongly acidic cation-exchange resin in the K+-form (TSKgel SCX: 50 mm × 4.6 mm i.d.) was inserted as a conductimetric enhancement column between the separation column (TSKgel Super IC-A/C) and the conductivity detector. In practice, the calibration curve for carbonic acid (H2CO3) separated through weakly acidic cation-exchange resin column (WCX) in the H+-form alone was nonlinear in the range 0.610–61.0 mg/L owing to the nature of conductometric detection for this weak electrolyte. Therefore, the bicarbonate ion was converted to a strong electrolyte (K2CO3) by the enhancement column [20]. Consequently, the use of the enhancement column allowed a linear relationship to be obtained over a wider concentration range (0.610–61.0 mg/L). The flow rate of the eluent was 0.5 mL/min. All other conditions are described in Section 2.3.1.

2.3.3. IEC/CEC of Inorganic Anions and Cations

Inorganic ions (i.e., SO42, Cl, NO3, Na+, K+, NH4+, Mg2+, and Ca2+) contained in the river water samples were analyzed using ICE/CEC. The optimized eluent used in this study was composed of a mixture of tartaric acid and 18-crown-6 [16,17,18,19]. The flow rate of the eluent was 0.6 mL/min. The separated ions were detected using a conductivity detector in the Tosoh IC-2001. All other experimental conditions are described in Section 2.3.1.

2.3.4. IEC-Post-Column Derivatization of Phosphate and Silicate Ions

Phosphate and silicate ions were analyzed by IEC with an all-automated post-column derivatization based on the molybdenum blue method to ensure high-sensitivity detection [13,14,15]. The coloring reagent and reducing agent for the separated phosphate and silicate ions were composed of 50 mM sulfuric acid plus 10 mM sodium molybdate, and 50 mM ascorbic acid, respectively. The reagent was transported to a reaction coil (Teflon tube, 600 mm × 0.25 mm i.d.) using a solution pump (Shimadzu LC-10AD) and mixed with the phosphate and silicate ions eluted from the separation column in automatic programmable flow. The reaction in the coil was performed at 40 °C. The detector used a Tosoh UV-8020 at a wavelength of 700 nm. The flow rates of the eluent and the reagent (using the post-column derivatization) were 1.0 mL/min and 0.5 mL/min, respectively. All other conditions are described in Section 2.3.1.

2.4. Analyses of Other Parameters

During the ion analyses using the IEC systems, we measured several parameters of the water samples relevant to water quality, including EC and DO. The EC values were determined using a Horiba conductivity meter (ES-12), while DO levels were determined by a HACH DO meter (HQ30d).

3. Results and Discussion

3.1. Analytical Performances of the IEC System

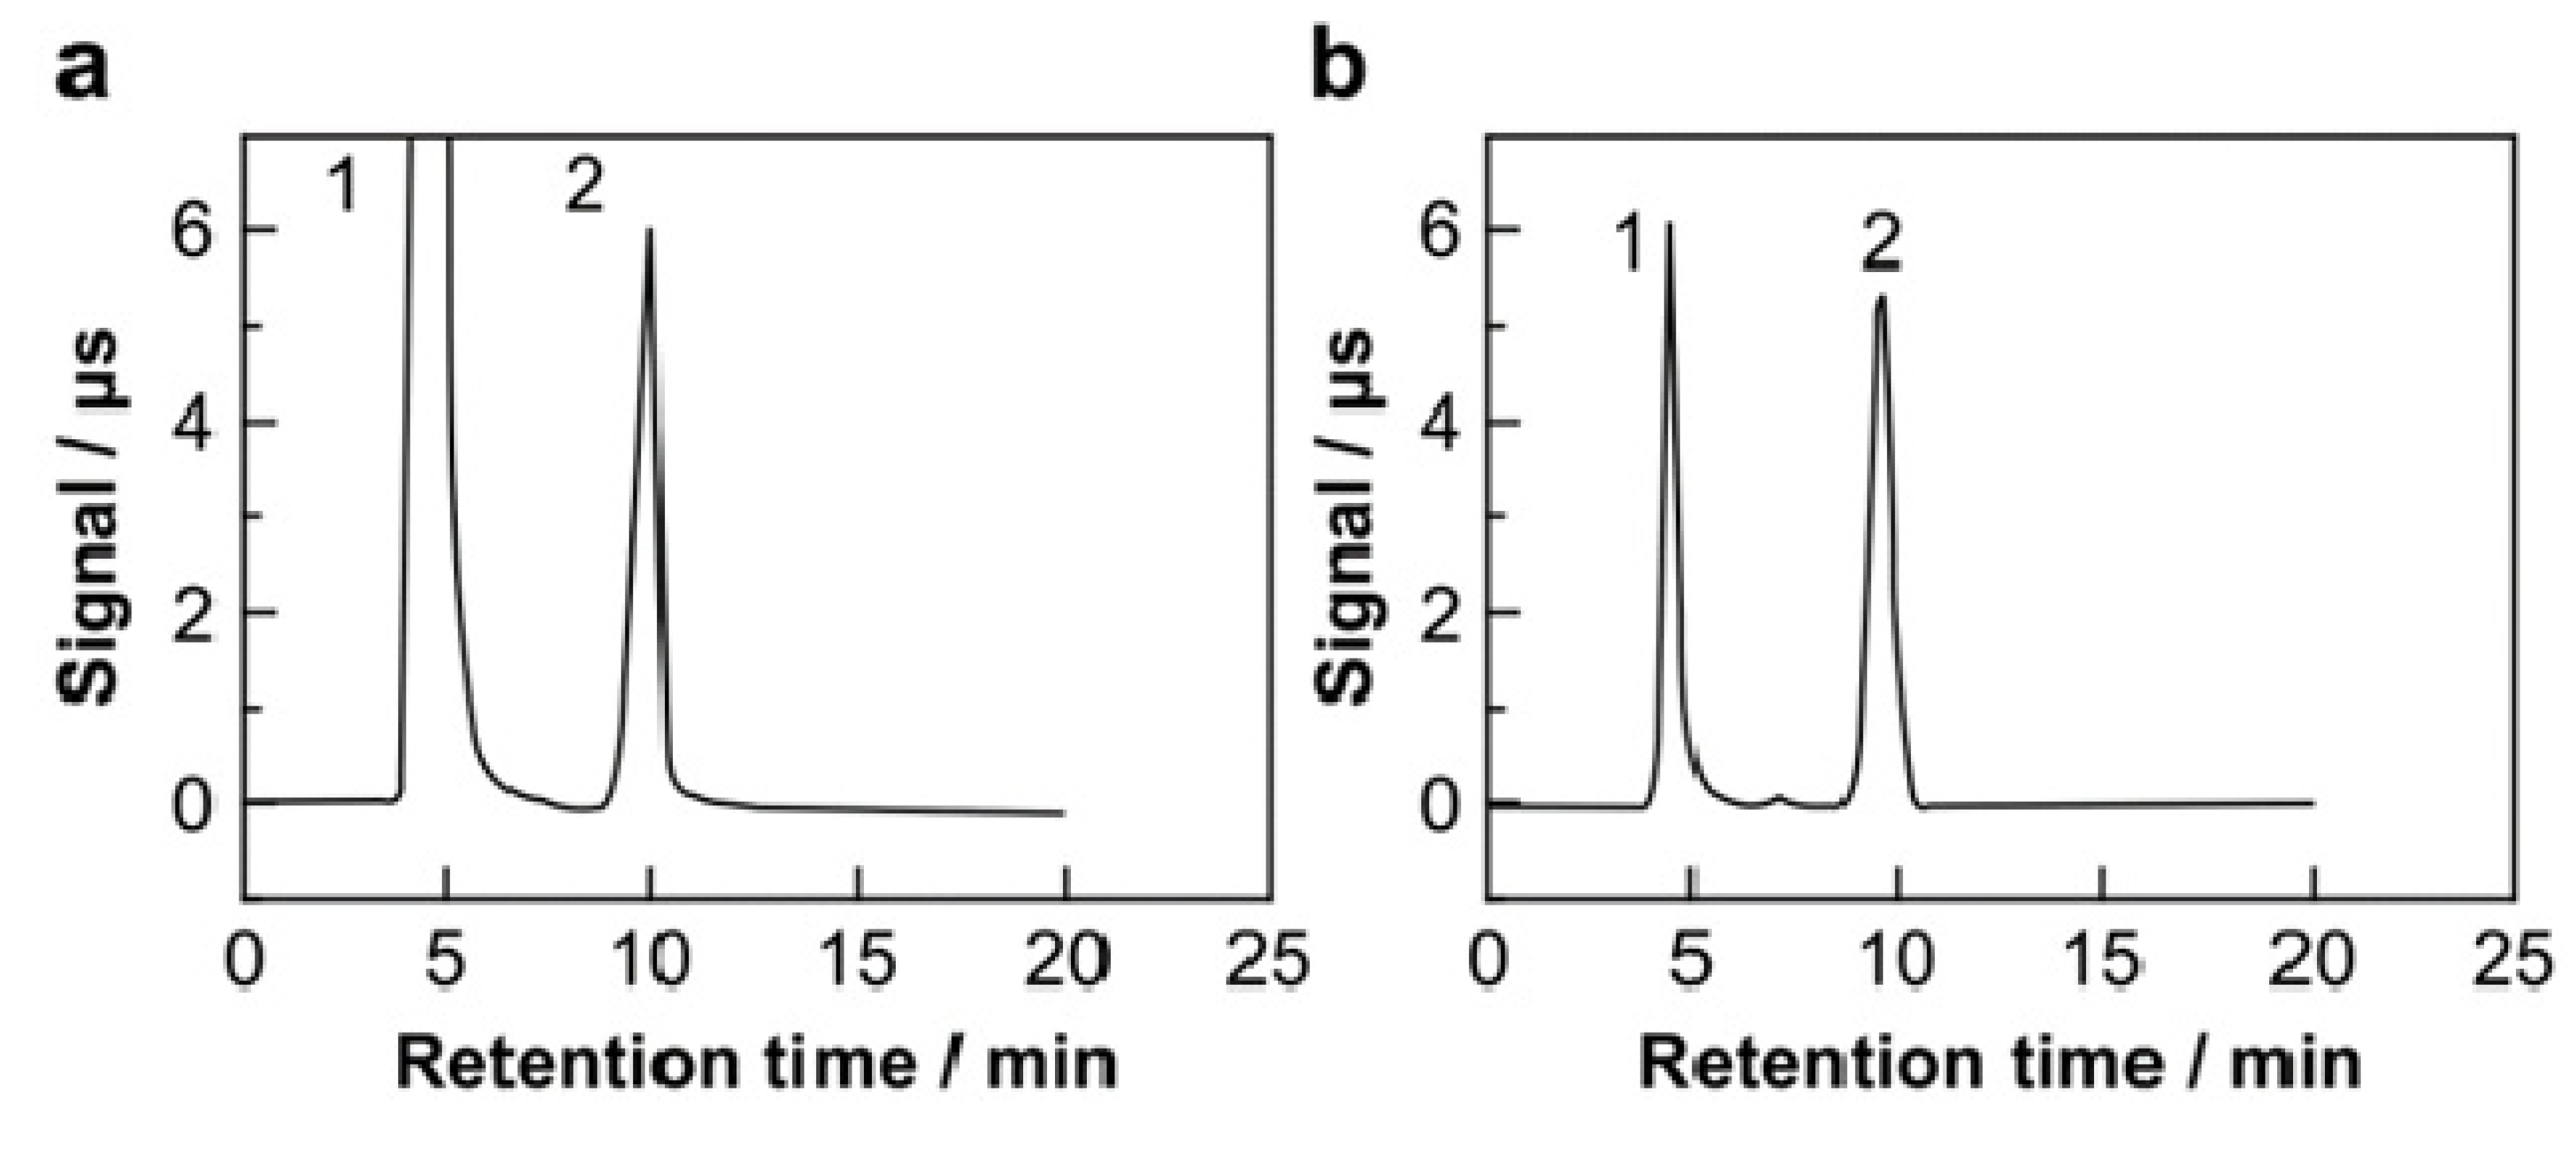
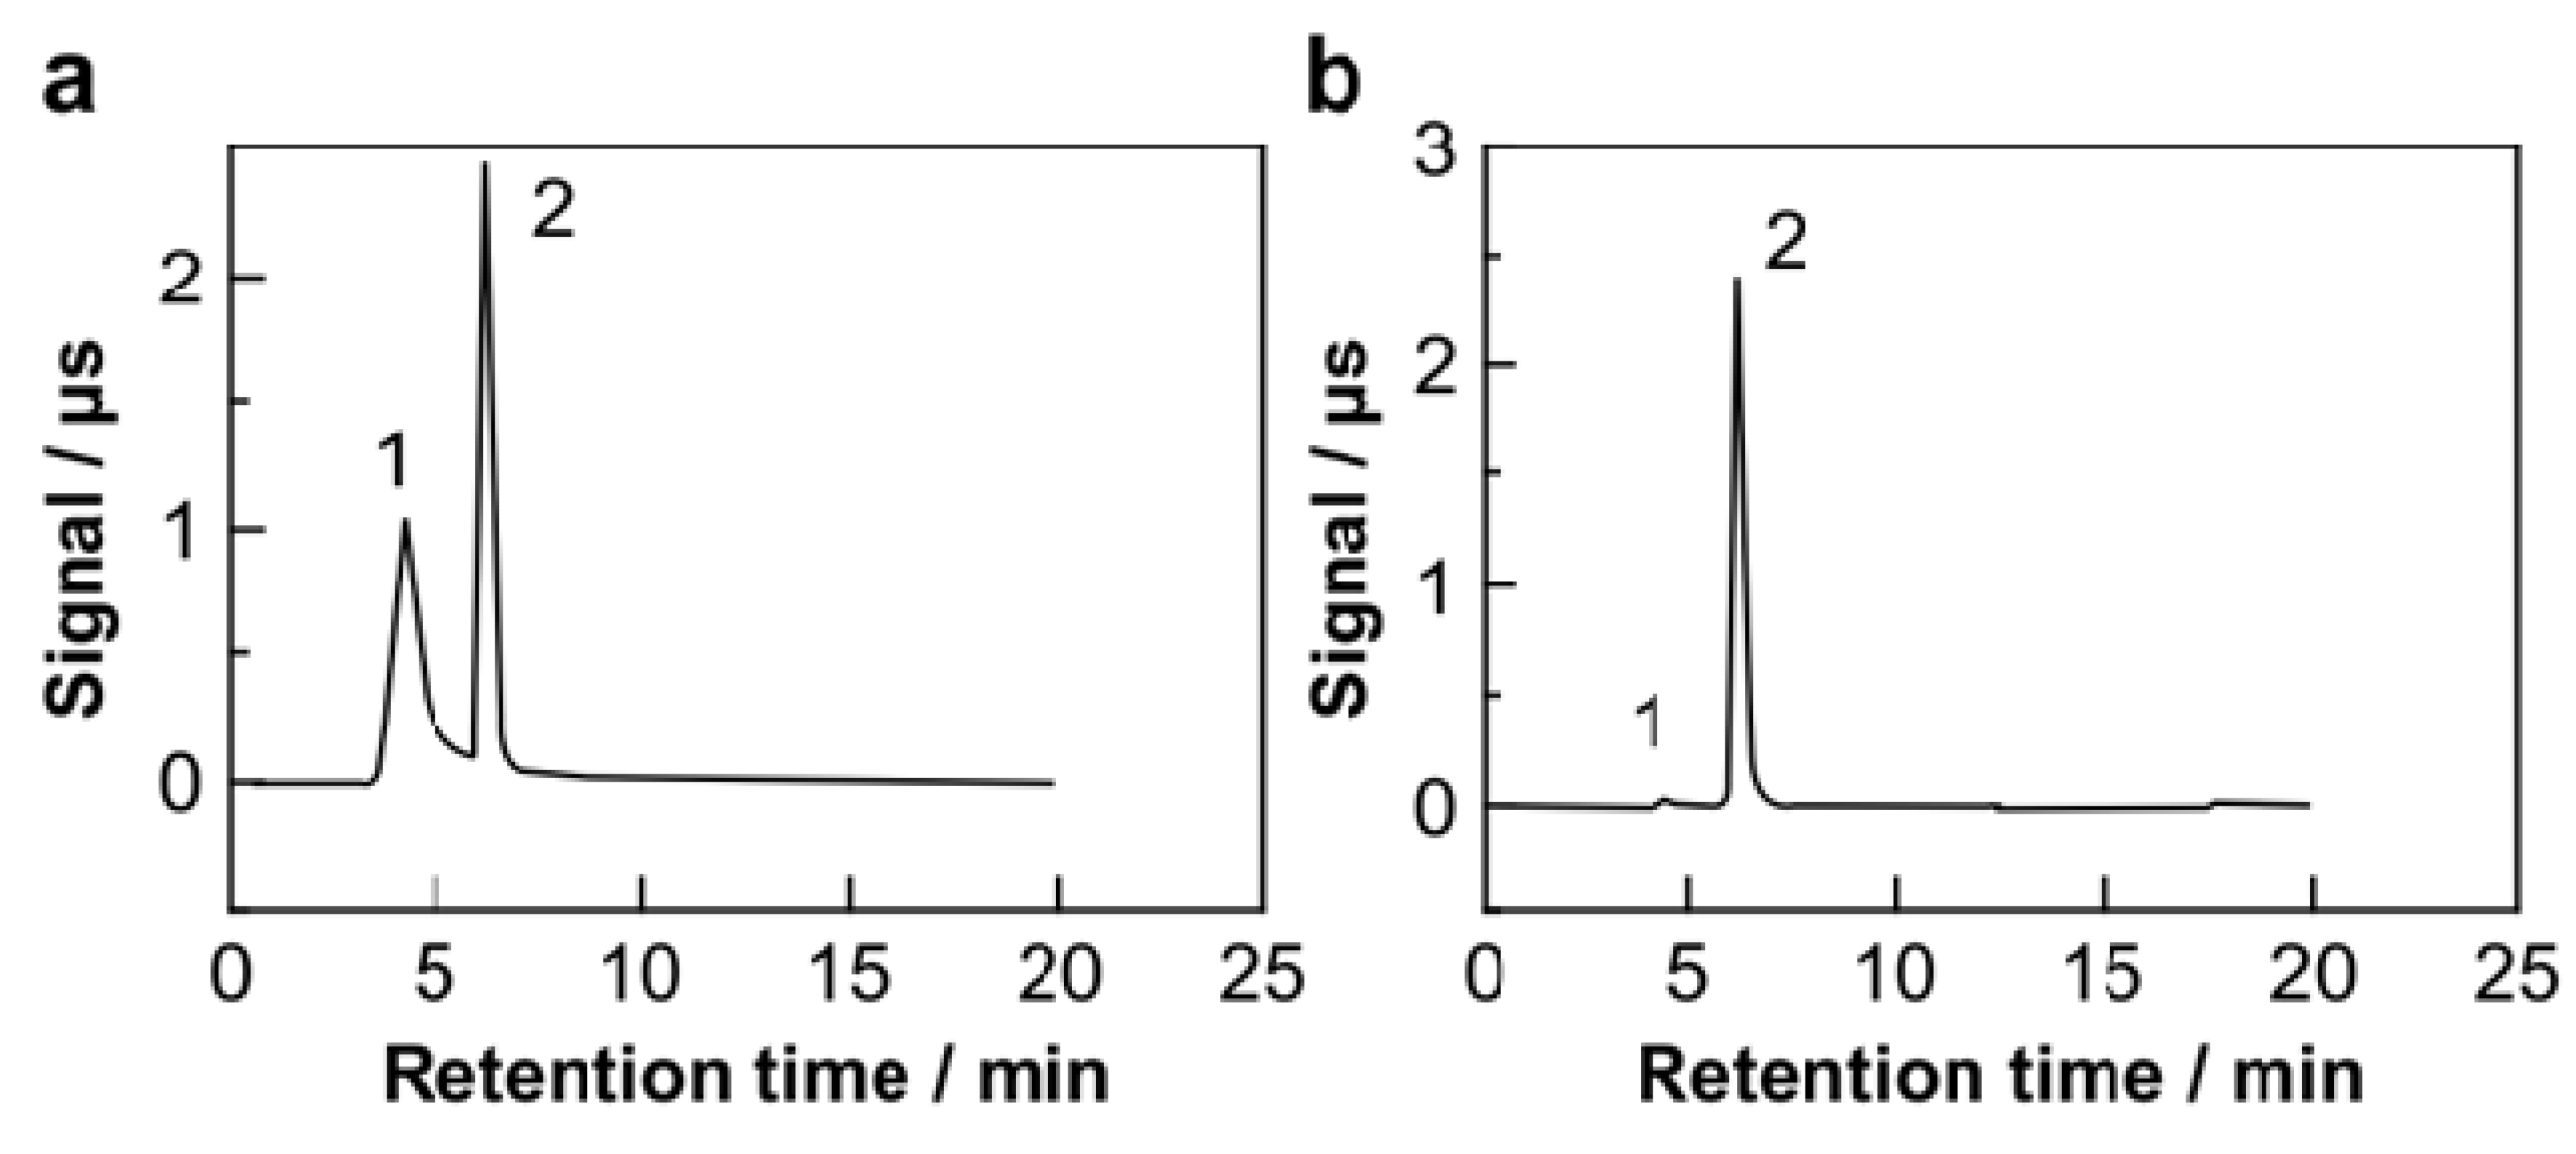
3.1.1. IEC for the Carbonate Ion

Bicarbonate ion concentration is an important indicator of alkalinity in river water and influences a variety of biological reactions [27,28]. The proposed IEC method can selectively separate and determine bicarbonate ion concentrations using a combination of WCX and water eluent; this is possible owing primarily to the complete penetration of the bicarbonate ion in the cation-exchange resin phase [15,20]. Furthermore, the connection of the enhancement column (TSKgel SCX in the K+-form) allowed a wider concentration range to be obtained, because the post-column could convert from weak electrolyte (H2CO3) to strong electrolyte (KHCO3). In the present study, we have demonstrated that IEC can successfully isolate the bicarbonate ion from salts of strong acids in approximately 10 min (Figure 3a). Figure 3b shows the ion chromatogram for the bicarbonate ion in a water sample collected from sampling point #6 in the Ciliwung River (Figure 2). The average concentration was found to be 83.0 mg/L, with maximum and minimum values of 164 mg/L (#14) and 40.9 mg/L (#2), respectively.
Figure 3. Ion-exclusion chromatogram of bicarbonate ion. Injected sample: (a) a mixture of 142 mg/L Na2SO4, 58.4 mg/L NaCl, 85.0 mg/L NaNO3, and 84.0 mg/L NaHCO3; and (b) river water sampled at point #6 in the Ciliwung River (Figure 2). Separation column: weakly acidic cation-exchange resin in the H+-form, TSKgel Super IC-A/C (150 mm × 6.0 mm i.d.). Conductometric enhancement post-column: strongly acidic cation-exchange resin in the K+-form, TSKgel SCX (50 mm × 4.6 mm i.d.). Eluent: pure water. Column temperature: 40 °C. Flow rate: 0.5 mL/min. Injection volume: 30 μL. Detector: conductivity. Peaks: 1 = strong acidic anions (SO42, Cl, and NO3) and 2 = bicarbonate ion.
Water 06 01945 g003
As summarized in Table 1, the calibration curves of the bicarbonate ion was found to be linear in the range 0.610–61.0 mg/L, with a correlation coefficient (r2) of 0.9990. Moreover, the detection limit (S/N = 3) and RSD value (n = 10) in the peak area of the bicarbonate ion were found to be 31.1 μg/L and 0.5%, respectively.
Table 1. Analytical performances of three different IEC methods.
AnalyteLineality range (mg/L)Correlation coefficientDetection limits (mg/L) *Relative standard deviation (%)Methodology
Sulfate ion9.60–1920.99930.8740.330IEC/CEC for common inorganic ions
Chloride ion3.55–70.90.99990.1380.240
Nitrate ion6.20–1240.99580.2110.210
Sodium ion2.30–46.00.99990.1770.400
Ammonium ion1.80–18.00.99990.1260.420
Potassium ion3.91–39.10.99280.4030.620
Magnesium ion2.43–24.30.99950.1020.250
Calcium ion4.01–40.10.99620.2890.430
Bicarbonate ion0.610–6.100.99900.03110.500IEC for bicarbonate ion
Phosphate ion 0.501–9.910.99000.06810.360IEC for phosphate and silicate ions
Silicate ion0.510–10.10.99990.09551.10
Note: * signal-to-noise ratio of 3.

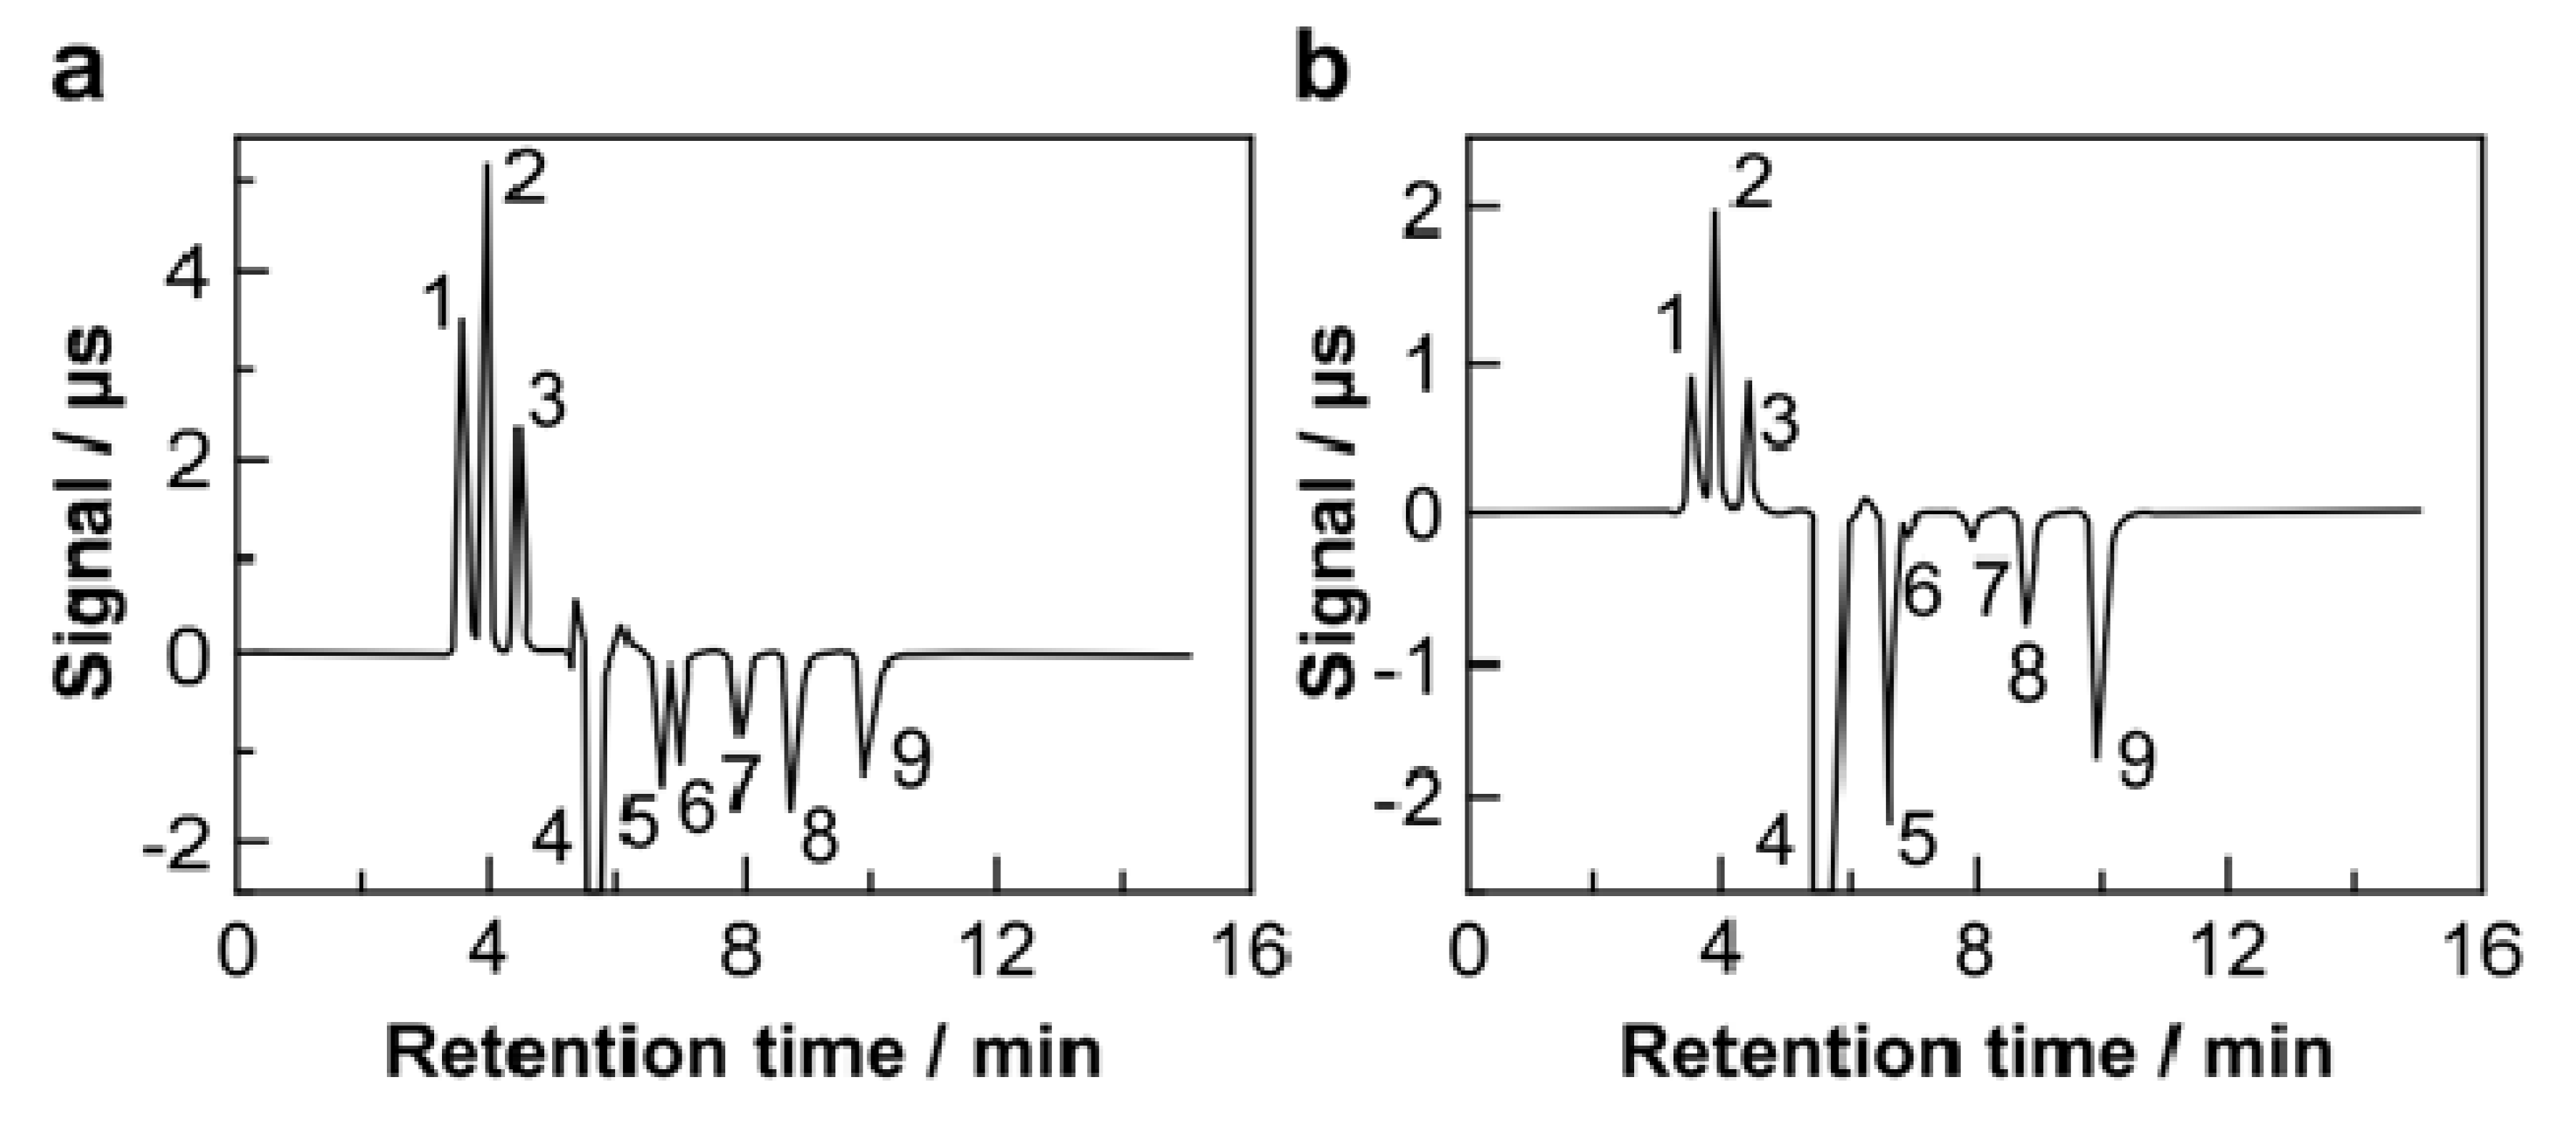
3.1.2. Simultaneous IEC/CEC for Common Inorganic Ions

In the present study, we used IEC/CEC to simultaneously determine all major ionic compounds. IEC/CEC measured the speciation of inorganic nitrogen compounds (i.e., NH4+ and NO3) in water, which are important indicators of river eutrophication [1,29]. IEC/CEC is able to separate anions, based on ion-exclusion/penetration effects in the WCX phase, and cations, based on the cation-exchange effect by the functional groups (carboxylate groups) in the column.
The concentration of tartaric acid affects the retention behavior of both anions and cations. For example, when increasing tartaric acid in the eluent, the retention times of anions increase owing to enhancement of the penetration effect for the weakly acidic cation-exchange resin phase; conversely, the retention times of cations decrease owing to the reduction of cation-exchange adsorption to the resin phase. In the latter case, the well-resolved separation of analyte ions (except NH4+ and K+) was obtained by adding 15 mM tartaric acid in the elution. Next, in order to improve the resolution of NH4+ and K+, we added 18-crown-6. The resolution was improved to various degrees, depending on the concentration of 18-crown-6 added to the eluent. Because K+ was strongly bound to 18-crown-6 and the resulting complex was adsorbed to the resin phase, the retention time of K+ was separated from that of NH4+ [16,17,18,19]. Consequently, the optimal elution was a mixture of 15 mM tartaric acid and 2.5 mM 18-crown-6. As shown in Figure 4a, the complete separation of the analyte anions and cations was obtained in approximately 10 min.
As summarized in Table 1, the calibration curves of the analytes were linear in each concentration range, and the correlation coefficients (r2) were 0.9928–0.9999. Moreover, the detection limits (S/N = 3) and the RSD values in the peak areas of the analyte ions were 0.102–0.874 mg/L and 0.21%–0.62%, respectively.
Figure 4b shows the ion chromatogram for the anions and cations contained in the river water samples collected at sampling point #6 in the Ciliwung River. Based on IEC/CEC, the ion concentrations sampled at 14 points were found to be in the ranges 5.57–23.1 mg/L (SO42), 5.60–69.5 mg/L (Cl), 2.29–8.99 mg/L (NO3), 6.44–59.5 mg/L (Na+), 0.216–11.1 mg/L (NH4+), 2.27–6.92 mg/L (K+), 3.82–9.92 mg/L (Mg2+), and 22.6–52.5 mg/L (Ca2+).
Figure 4. Ion-exclusion/cation-exchange chromatogram of inorganic anions and cations. Injected sample: (a) a mixture of 120 mg/L MgSO4, 74.6 mg/L KCl, 85.0 mg/L NaNO3, 53.5 mg/L NH4Cl, and 101 mg/L KNO3; and (b) river water sampled at point #6 in the Ciliwung River (Figure 2). Separation column: weakly acidic cation-exchange resin in the H+-form, TSKgel Super IC-A/C (150 mm × 6.0 mm i.d.). Eluent: 15 mM tartaric acid and 2.5 mM 18-crown-6 ether. Column temperature: 40 °C. Flow rate: 1.0 mL/min. Injection volume: 30 μL. Detector: conductivity. Peaks: 1 = SO42, 2 = Cl, 3 = NO3, 4 = elution dip, 5 = Na+, 6 = NH4+, 7 = K+, 8 = Mg2+, and 9 = Ca2+.
Water 06 01945 g004

3.1.3. IEC for Phosphate and Silicate Ions

Phosphorus (i.e., the phosphate ion in the aqueous phase) is a limiting factor related to eutrophication, in conjunction with nitrogen. Generally, the total concentration of phosphorus in environmental water is one to two orders of magnitude lower than that of total nitrogen [30,31,32,33], and eutrophication can be caused by even lower concentrations of the phosphate ion. Therefore, highly sensitive detection methods are needed to determine phosphate ion concentration. In practice, when injecting the river water samples into ICE/CEC (described in Section 3.1.2), the phosphate ion could not be detected for all river samples owing to its much lower concentrations compared to other common ions.
We introduced the post-column derivatization method, which applied the molybdenum blue method for detecting the phosphate ion after IEC with water eluent [14,15]. IEC-post-column derivatization could simultaneously detect phosphate and silicate ions at 700 nm (Figure 5a).
As summarized in Table 1, the calibration curves for both phosphate and silicate ions were linear in each concentration range, with correlation coefficients (r2) of 0.9900 and 0.9999 for phosphate and silicate ions, respectively. Moreover, the detection limits (S/N = 3) were 0.0681 mg/L and 0.0955 mg/L and the RSDs in the peak areas were 0.36% and 1.1% for phosphate and silicate ions, respectively.
Figure 5b presents the ion chromatogram of the phosphate and dissolved silicate ions contained in the river water samples collected at sampling point #6 in the Ciliwung River. Based on IEC, the ion concentrations sampled at 14 points were found to be in the ranges of 0.0681–0.681 mg/L (phosphate) and 3.46–12.1 mg/L (dissolved silicate ion).
Figure 5. Ion-exclusion chromatogram of phosphate and silicate ions. Injected sample: (a) a mixture of 47.6 mg/L KH2PO4 and 39.1 mg/L Na2SiO3; and (b) river water sampled at point #6 in the Ciliwung River (Figure 2). Separation column: weakly acidic cation-exchange resin in the H+-form, TSKgel Super IC-A/C (150 mm × 6.0 mm i.d.). Eluent: pure water. Coloring reagent: a mixture of 50 mM sulfuric acid and 10 mM sodium molybdate. Reducing agent: 50 mM ascorbic acid. Column temperature: 40 °C. Flow rate: 1.0 mL/min (eluent) and 0.5 mL/min (coloring reagent). Injection volume: 30 μL. Detector: visible at 700 nm. Peaks: 1 = phosphate ion and 2 = silicate ion.
Water 06 01945 g005

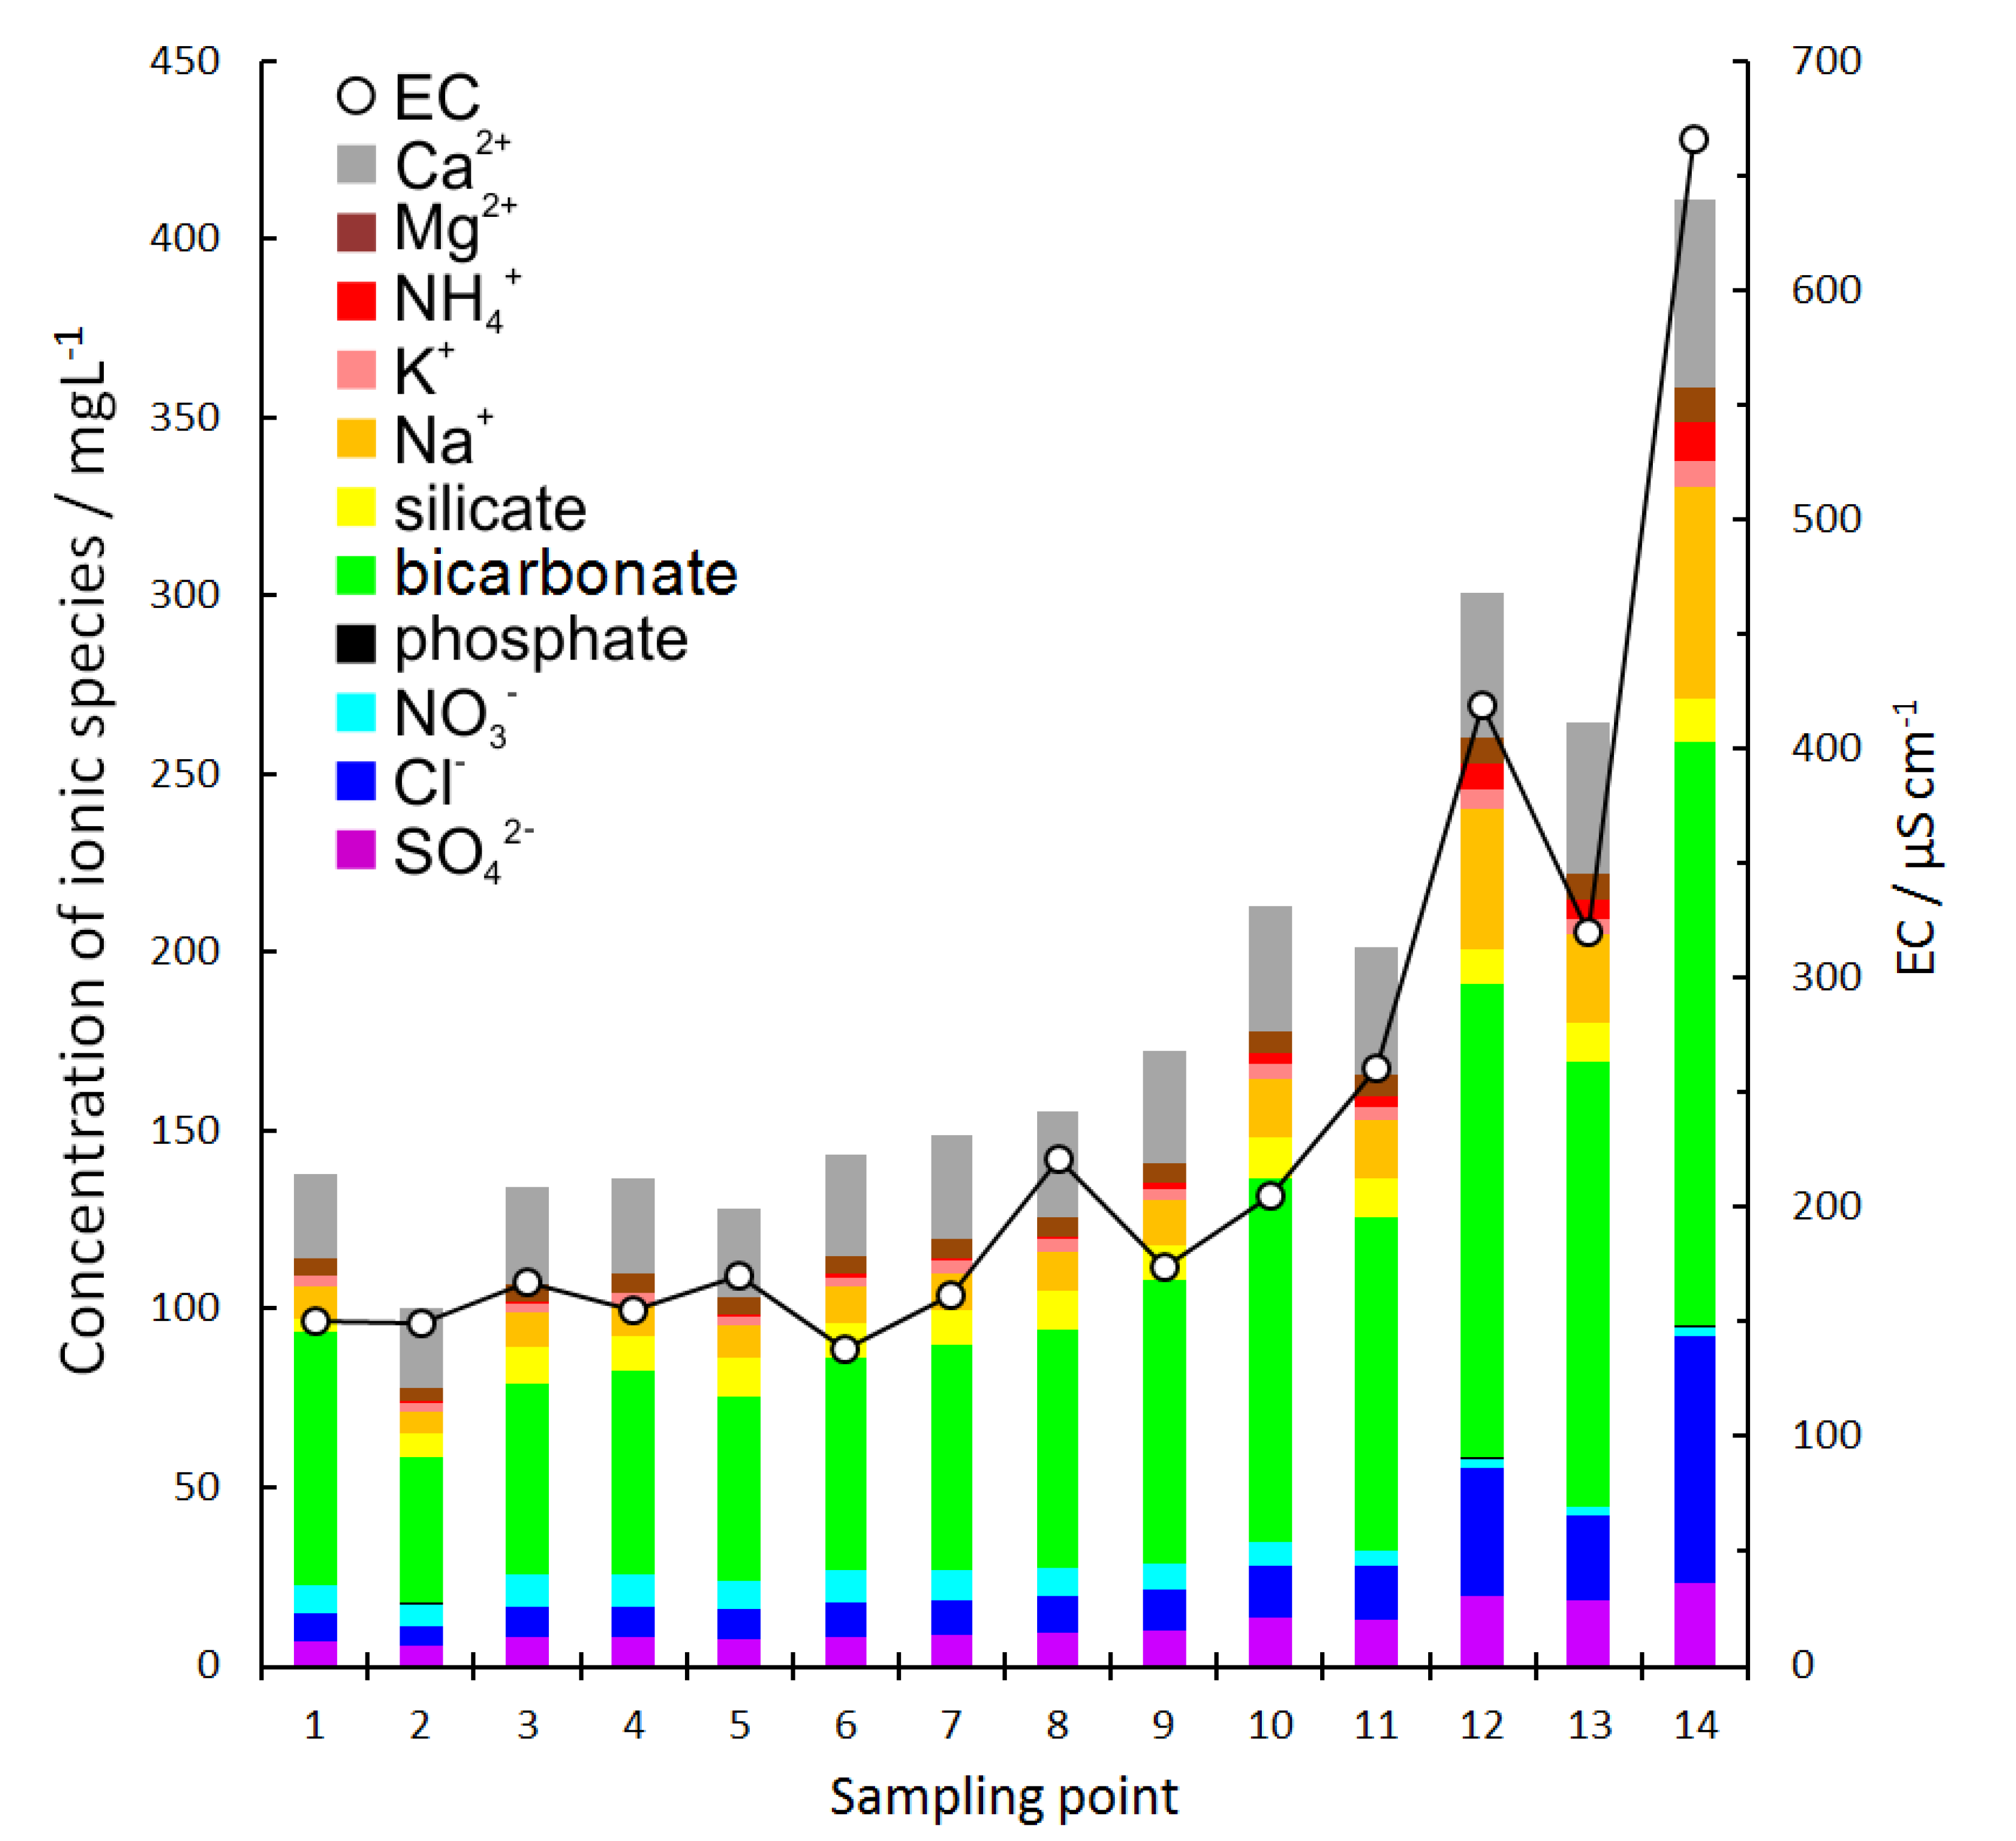
3.2. Transition of Ionic Composition in the Ciliwung River

In this section, we discuss the transition of ionic composition in river water samples collected at 14 points along the Ciliwung River (Figure 2). Figure 6 shows the classifications of the ion concentrations obtained through the three types of IEC systems. The concentrations of analyte ions, with the exception of NO3 and silicate ions, increased from upstream to downstream. Moreover, EC values changed from 150 to 666 μs/cm, which is a parameter of total ionic species in a water sample and also increased from sampling points #1 to #14 (Figure 6). The average concentrations were as follows (from highest to lowest): bicarbonate ion (83.0 mg/L) > Cl (17.0 mg/L) > SO42 (11.5 mg/L) > dissolved silicate (9.55 mg/L) > NO3 (6.20 mg/L) > phosphate (0.155 mg/L) for the anionic components, and Ca2+ (32.1 mg/L) > Na+ (17.5 mg/L) > Mg2+ (5.83 mg/L) > K+ (3.52 mg/L) > NH4+ (2.52 mg/L) for the cationic components. Conversely, the average concentrations of the most abundant ions found in samples of unpolluted river water worldwide are as follows: bicarbonate ion (56.1 mg/L) > SO42 (10.6 mg/L) > Cl (8.13 mg/L) > NO3 (0.869 mg/L) for the anionic components, and Ca2+ (15.2 mg/L) > Na+ (6.90 mg/L) > Mg2+ (3.89 mg/L) > K+ (2.11 mg/L) for the cationic components [34,35,36]. Based on these data, it is clear that the concentrations of the bicarbonate ion, Cl, NO3, NH4+, the phosphate ion, and the silicate ion in the Ciliwung River are higher than the global average values for these ions.
Figure 6. Changes in ionic components and electrical conductivity (EC) in river water samples between sampling points.
Water 06 01945 g006
In the eutrophicated river water, the high concentration of the bicarbonate ion may have been derived from organic compounds in human sewage and related to photosynthesis, respiration, and other biological and non-biological reactions and exchanges with the atmosphere; such processes can create a buffering effect. Bicarbonate ion concentrations may also reflect some contribution from the dissolution of concrete under low DO concentrations. In contrast, the concentration of Cl was likely derived primarily from human sewage, raw sewage, and sea water.
The concentrations of NO3 and NH4+ decreased and increased, respectively, between sampling points #1 to #14. We also observed a strong relationship between DO and the concentration ratio of NO3 to NH4+ at each sampling point (Figure 7). These results suggest that the water at sampling points #7 to #14 was altered to form a reducing environment.
The concentration of the phosphate ion increased between sampling points #1 and #14, likely owing to organic phosphorus compounds in components such as human sewage and raw sewage, among others. Conversely, the concentration of the silicate ion remained relatively constant between sampling points. This can likely be attributed to the fact that the ion originated from natural sources (e.g., soil or sediment) within the research area and not from domestic wastewater. However, further investigation of this result will be required in future research.
Figure 7. Changes in NO3/NH4+ ratios and dissolved oxygen (DO) *1 in the river water samples taken from each sampling point.*1: Following data collection, DO concentrations were available for only 8 of the 14 sampling points, because the cable of the DO meter used was 5 m long; thus, the meter could not be used at sampling points with depths shallower than 5 m.
Water 06 01945 g007

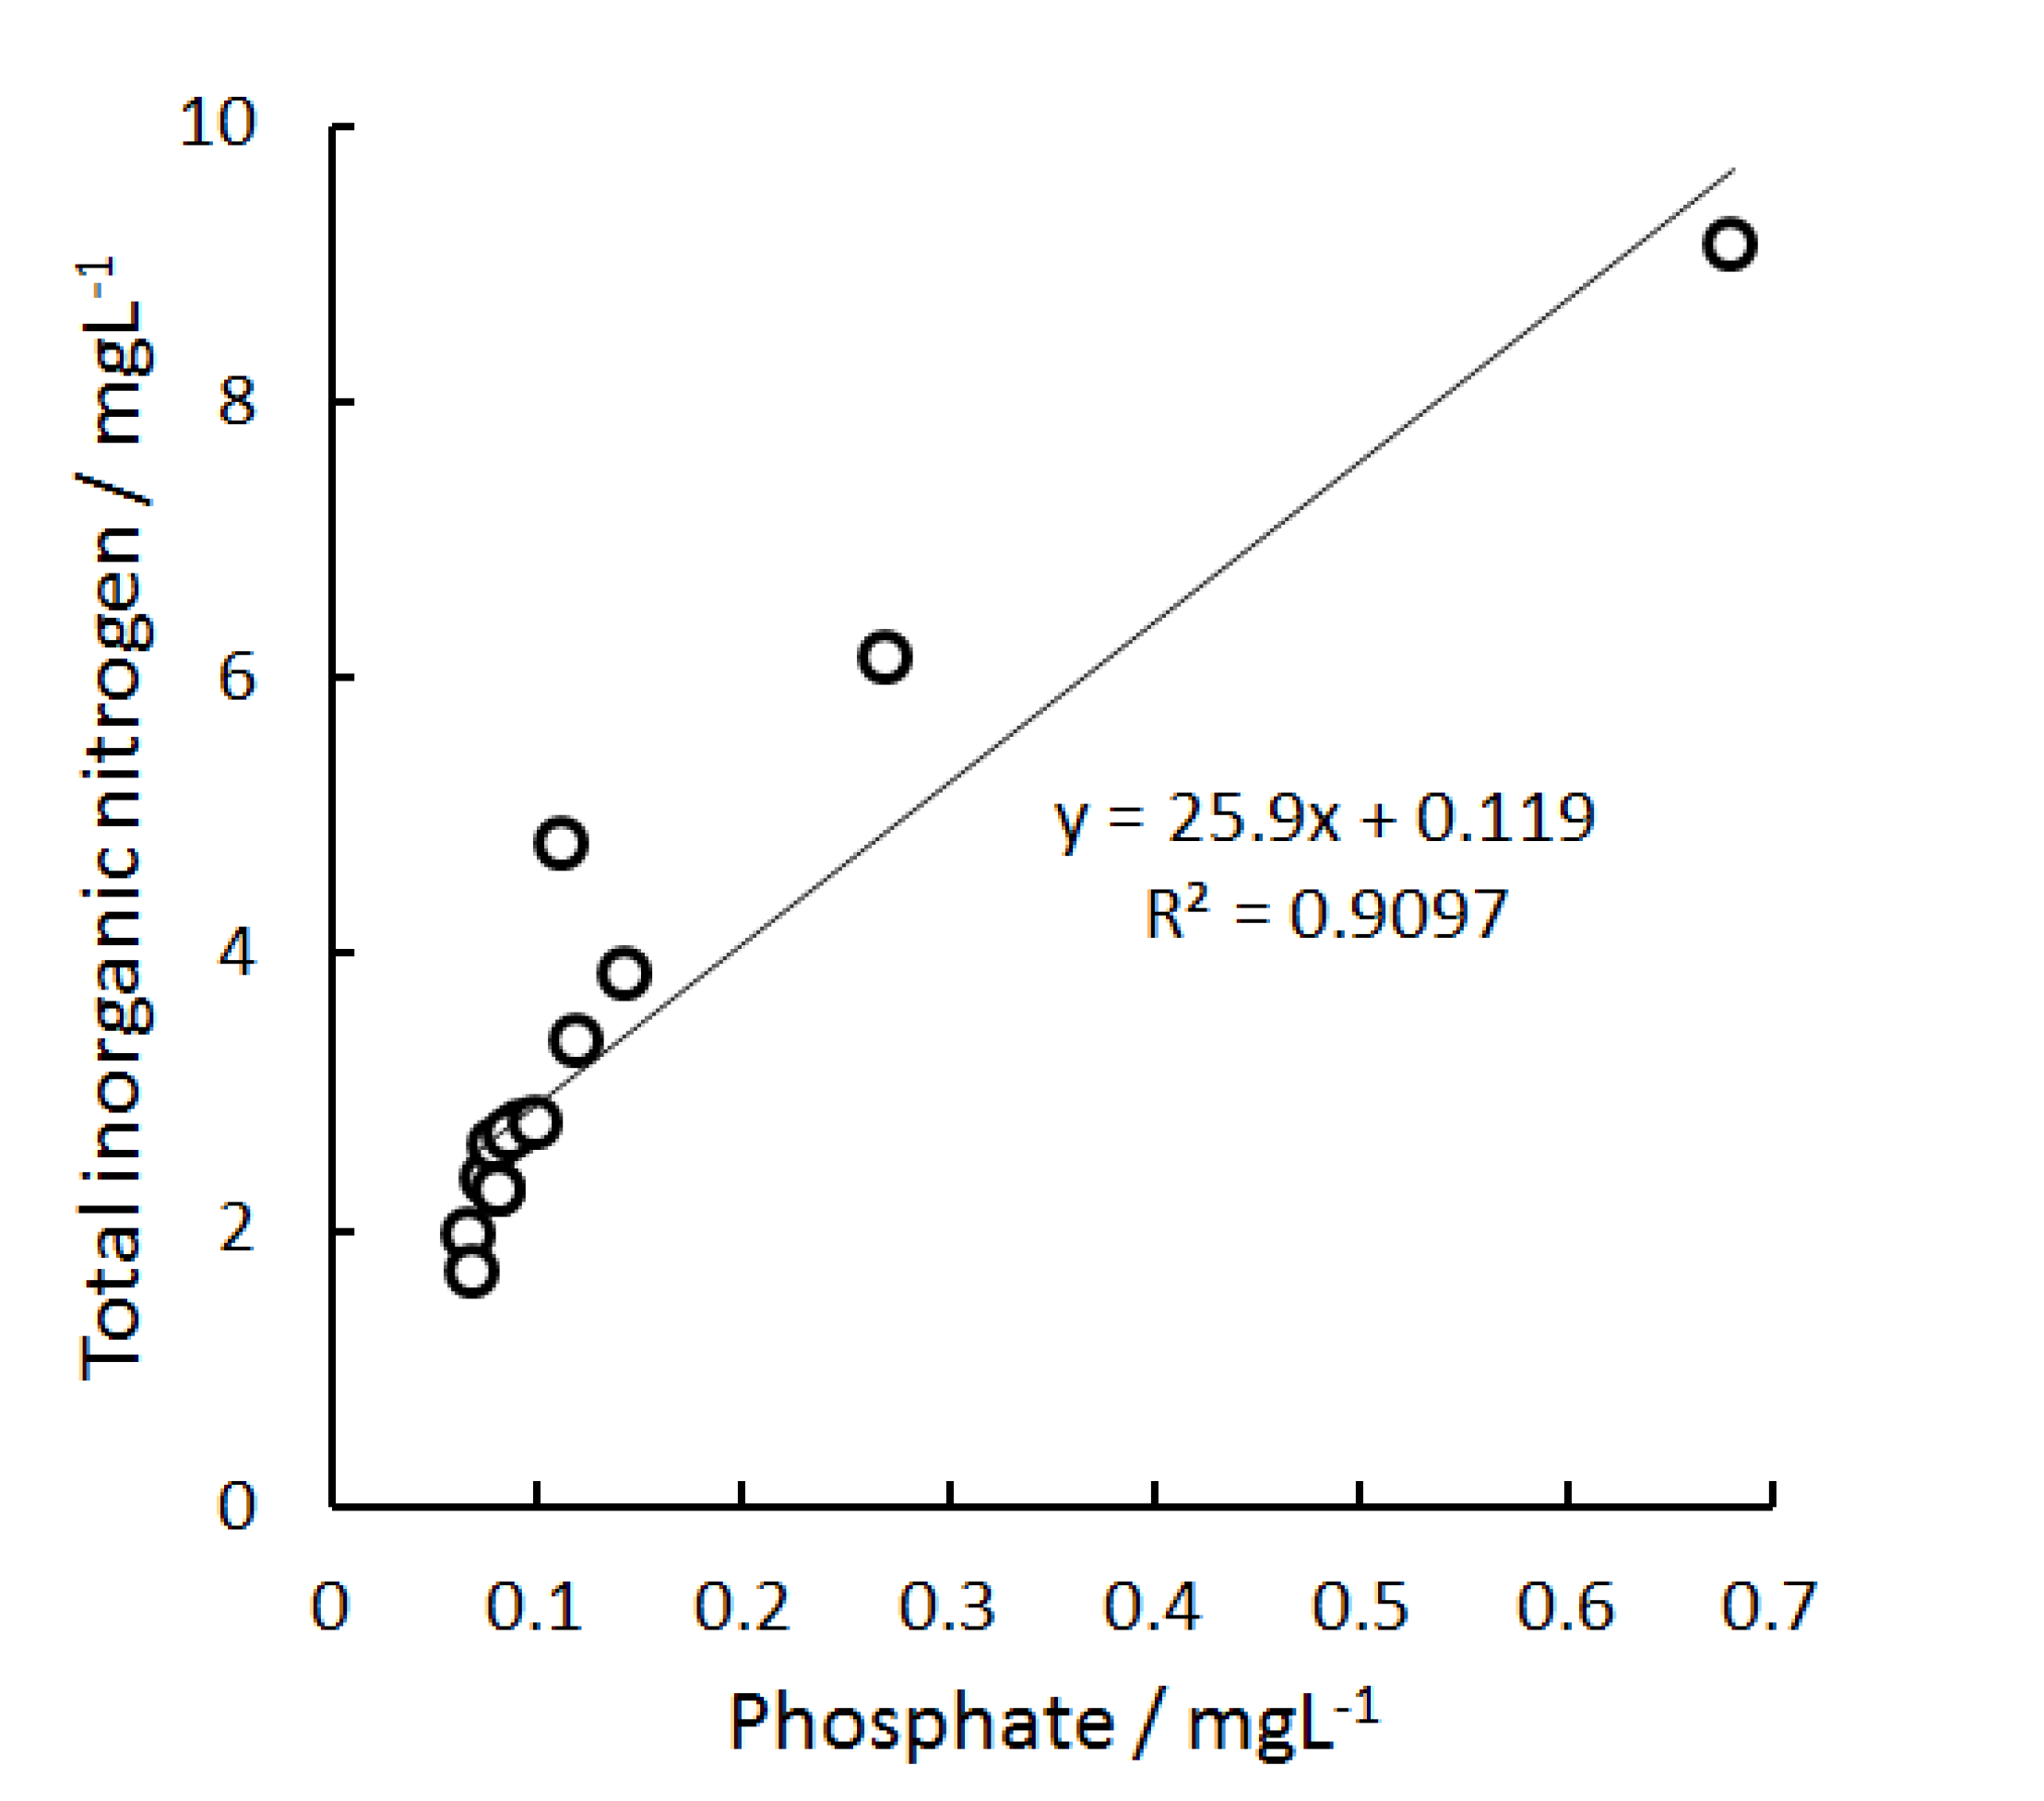
3.3. Changes in the Ionic Concentrations for Various Biological and Chemical Reactions

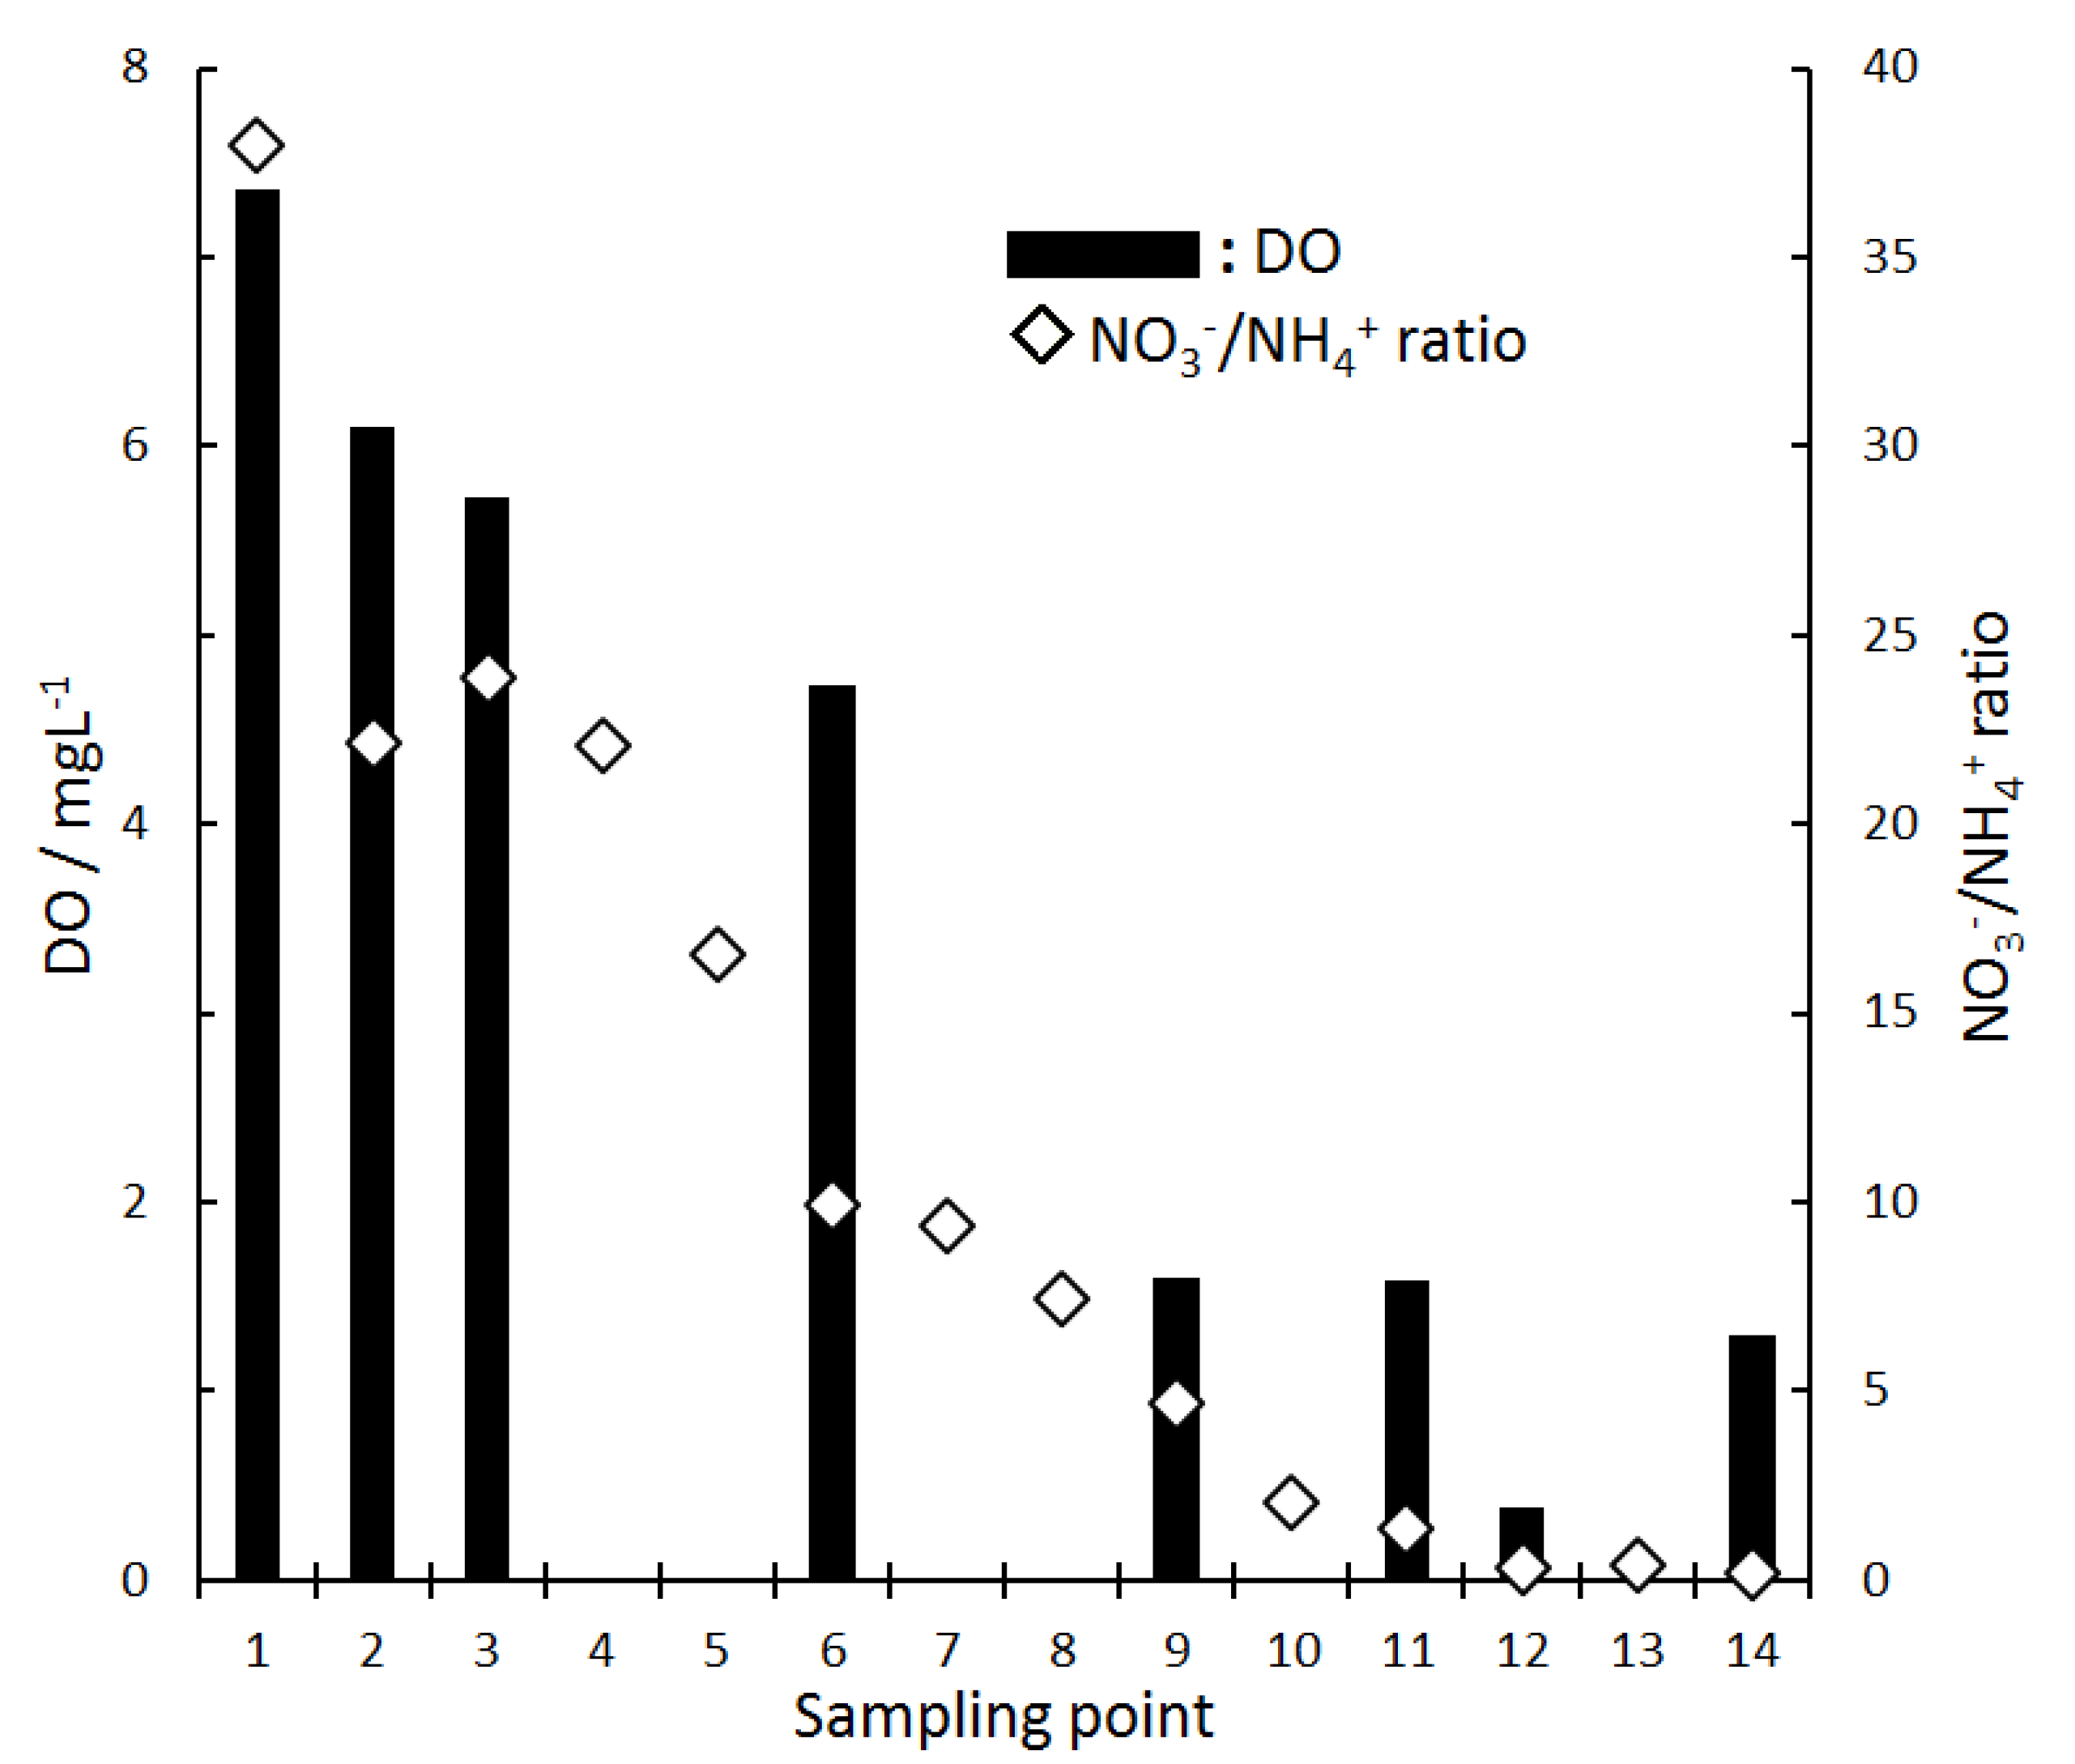
3.3.1. Inorganic Nitrogen Species and DO

In reference to the eutrophication of the Ciliwung River, we discuss the influences of inorganic nitrogen and carbonate ions on DO based on biological reactions, because these parameters are closely related to eutrophication in closed aquatic environments. We focused on the differences between NO3 and NH4+ concentrations between sampling points #1 to #6 and #7 to #14.
Between sampling points #1 to #6, DO concentrations decreased from 7.36 mg/L (#1) to 4.73 mg/L (#6). Water quality in this area was in a relatively aerobic state. Such aerobic conditions have been predicted to cause aerobic oxidation of organic nitrogen and phosphorus compounds by microorganisms (Equation (1)) and a nitrification reaction by nitrifying bacteria (Equation (2)) [37,38,39].
(CH2O)106(NH3)16H3PO4 + 106O2 → 106CO2 + 16NH3 + H3PO4 + 106H2O
NH4+ + 1.83O2 + 1.98HCO3 → 0.0210C5H7NO2 + 0.979NO3 + 1.04H2O + 1.88H2CO3
The organic nitrogen and phosphorus compounds in the river water were decomposed to NH3, and NH3 was dissolved as the ionic form (NH4+) in the aqueous solution. DO was converted to dissolved CO2 (bicarbonate ion). In contrast, NH4+ was oxidized to NO3 through nitrification, and HCO3 was converted to H2CO3 (H2O + CO2). Accordingly, NO3 concentrations at sampling points #1 to #6 were slightly higher than NH4+ concentrations.
Between sample points #7 and #14, DO concentrations further decreased from 1.60 mg/L (#7) to 0.39 mg/L (#13). This likely caused the decomposition of organic nitrogen compounds by microorganisms (Equation (3)) and a denitrification reaction by denitrifying bacteria (Equation (4)) under low-DO conditions [40,41,42].
(CH2O)106(NH3)16H3PO4 + 14H2O → 39CO2 + 14HCO3 + 53CH4 + 16NH4+ + HPO42−
NO3 + 1.08 CH3OH + 0.24 H2CO3 → 0.056 C5H7O2N + 0.47 N2↑ + 1.68H2O + HCO3
The organic nitrogen and phosphorus compounds in the river water were decomposed to NH4+. In addition, this decomposition generated gases, such as CO2 and CH4. NO3 was also reduced to N2 gas through denitrification at the same moment that HCO3 was produced. Therefore, at lower DO conditions, the formation of NH4+ and HCO3 and the reduction of NO3 occurred simultaneously. These reactions were likely caused by the inflow of domestic wastewater. In addition, because of the eutrophication of the estuary, the pollution of seawater as well as river water is expected.
The concentrations of the phosphate ion (0.0619–0.681 mg/L) determined by IEC-post-column derivatization were much lower than those of common analyte ions, but the concentrations of phosphate and other ions increased from sampling points #1 to #14. The increase of phosphate ion concentration was caused by the draining of synthetic detergents and household wastewater into the river water. Furthermore, as shown in Figure 8, the concentration of phosphorus was related to the concentration of total nitrogen (NO3 + NH4+) (r2 = 0.9097). Therefore, the phosphate ion was likely related to the formation of NO3 under aerobic conditions (Equation (1)) and the formation of NH4+ under low-DO conditions (Equation (3)) [37,40].
Figure 8. Relationship between total inorganic nitrogen (NO3 + NH4+) and the phosphate ion in river water samples.
Water 06 01945 g008

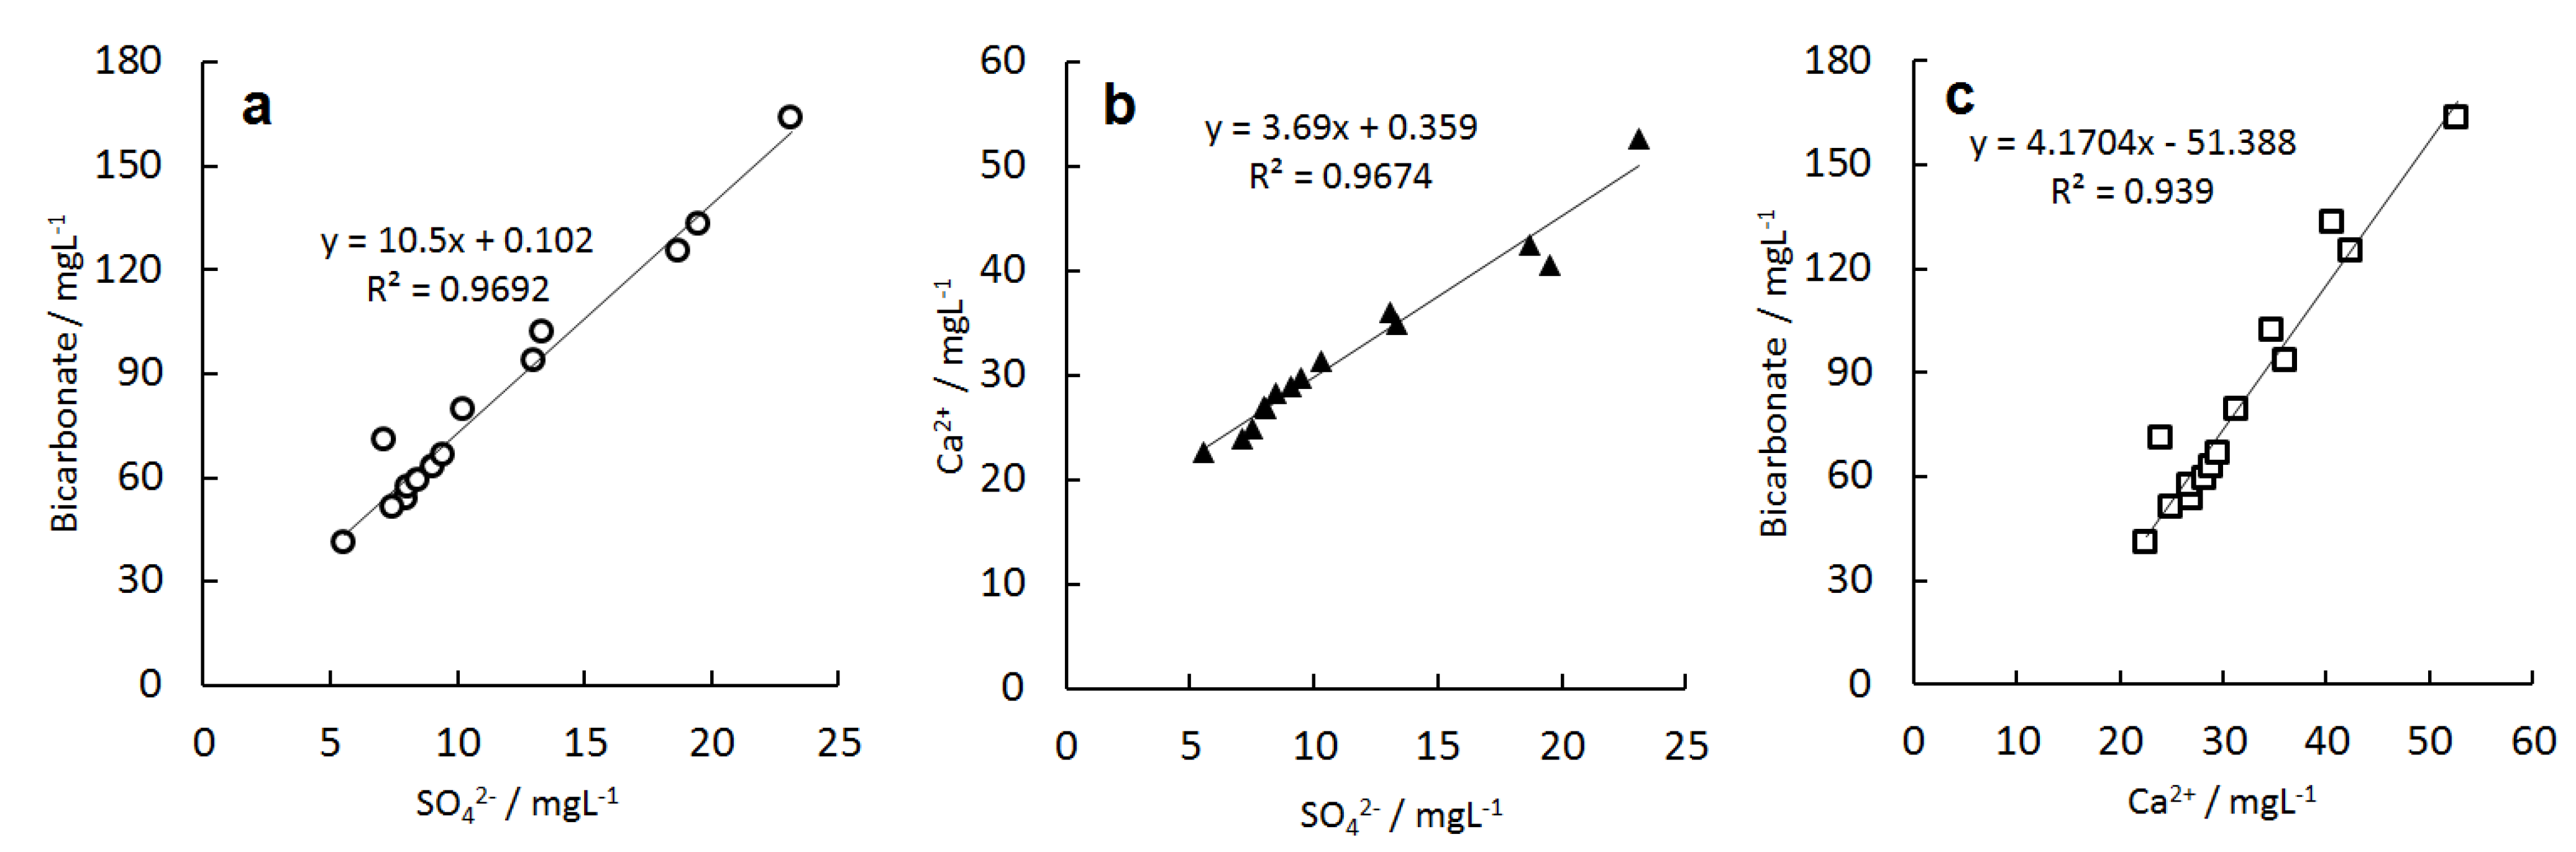
3.3.3. Bicarbonate, Sulfate, and Calcium Ions

When we investigated the correlations between all ion species obtained from the IEC systems, we found strong correlations between the bicarbonate ion, SO42, and Ca2+. As shown in Figure 9, the correlation coefficients (r2) were 0.9692 for both bicarbonate and SO42 (Figure 9a), 0.9674 for Ca2+ and SO42 (Figure 9b), and 0.9390 for bicarbonate and Ca2+ (Figure 9c).
Figure 9. Relationship between SO42, bicarbonate, and Ca2+ ions in river water samples: (a) bicarbonate vs. SO42; (b) Ca2+ vs. SO42; and (c) bicarbonate vs. Ca2+.
Water 06 01945 g009
These results relate to SO42 levels contained in urban sewage, detergents, and human waste. SO42 is also generated from the decomposition of organic sulfur compounds by sulfur-oxidizing and sulfate-reducing bacteria. During the decomposition process, the bicarbonate ion was also generated through the reduction process that occurs in the following reaction (Equation (5)) [43,44]:
SO42 + 2CH2O → 2HCO3 + H2S↑
Additionally, the strong correlation between Ca2+ and SO42 can likely be attributed to the fact that SO42 converted from H2S by sulfur-oxidizing bacteria reacted with calcium hydroxide (Ca(OH)2) leached from concrete, thus forming CaSO4. The free Ca2+ and the bicarbonate ion in the water solutions generated insoluble CaCO3. When Ca2+ concentration is higher than that of other analyte cations, the deterioration of concrete supports in the drainage system may occur.

4. Conclusions

In the present study, water quality in the Ciliwung River basin, which is affected by typical influxes of domestic wastewater, was analyzed by three advanced IEC modes. Our results indicate the severe eutrophication state of the river water, including increases in ammonium and phosphate ion, and the deterioration of the drainage system’s concrete with elution of Ca2+ and SO42 in the downstream region.
Accordingly, the construction of a sewage treatment system that can successfully treat the organic components and nutrients present is required in the Ciliwung River basin area.

Acknowledgments

This study was supported by the Japan International Cooperation Agency (JICA) project entitled “Confirmation Study on Basic Information Gathering for the Jakarta Low-Cost Wastewater Treatment System for Water Improvement in Indonesia”. Additionally, this publication was supported by the internal fund of the University Malaysia Pahang (No. RDU 1303126). We also appreciate the assistance of Takao Yamashita at the Graduate School for International Development and Cooperation and Shin-ichi Onodera at the Graduate School of Integrated Arts and Sciences (Hiroshima University) for help with field research and sample collection.

Author Contributions

Sample analysis, data evaluation and drafting the manuscript was done by Daisuke Kozaki with contributions by Takashi Ozaki, Masanobu Mori, Nobutake Nakatani and Kazuhiko Tanaka. Water sample was collected by Kazuhiko Tanaka supported with Daisuke Kozaki. Kazuhiko Tanaka headed the water quality monitoring section of this project. All authors read and approved the final manuscript.

Conflicts of interest

The authors declare no conflict of interest.

References

  1. Brebbia, C.A.; Anagnostopoulos, P. Water Pollution: Modelling, Measuring and Prediction; WIT Press: Southampton, UK, 1991. [Google Scholar]
  2. Chin, D.A. Water-Quality Engineering in Natural Systems: Fate and Transport Processes in the Water Environment; Wiley-VCH: Weinhelm, NJ, USA, 2012. [Google Scholar]
  3. Ministry of the Environment, Institute for Global Environmental Strategies. Onsite wastewater treatment systems for improving water quality in Asian cities. Clean Asia Initiat. Newsl. 2013, 10, 6–7. [Google Scholar]
  4. Ministry of Economy, Trade and Industry. Study on the Waste Treatment Facility Bot Project in Dki Jakarta, the Republic of Indonesia; Study on Private-Initiative Infrastructure Projects in Developing Countries in FY2011; Ministry of Economy: Tokyo, Japan, 2012. [Google Scholar]
  5. Kido, M.; Wati, Y.; Syawal, M.S.; Sulastri.; Hosokawa, T.; Tanaka, S.; Saito, T.; Iwakuma, T.; Kurasaki, M. Comparison of general water quality of rivers in Indonesia and Japan. Environ. Monit. Assess. 2009, 156, 317–329. [Google Scholar] [CrossRef]
  6. Palupi, K.; Sumengen, S.; Inswiasri, S.; Agustina, L.; Nunik, S.; Sunarya, W.; Quraisyn, A. River water quality study in the vicinity of Jakarta. Water Sci. Technol. 1995, 31, 17–25. [Google Scholar] [CrossRef]
  7. Takarina, N.D.; Adiwibowo, A. Impact of heavy metals contamination on the biodiversity of marine benthic organisms in Jakarta bay. J. Coast. Dev. 2011, 14, 168–171. [Google Scholar]
  8. Taurusman, A.A. Community structure of macrozoobenthic feeding guilds in responses to eutrophication in Jakarta Bay. Biodiversitas 2010, 11, 133–138. [Google Scholar]
  9. Meij, S.E.T.; Moolenbeek, R.G.; Hoeksema, B.W. Decline of the Jakarta Bay molluscan fauna linked to human impact. Mar. Pollut. Bull. 2009, 59, 101–107. [Google Scholar] [CrossRef]
  10. Nixon, S.W. Coastal marine eutrophication: A definition, social causes, and future concerns. Ophelia 1995, 41, 199–219. [Google Scholar]
  11. Tanaka, K.; Ishizuka, T. Elution behavior of acids in ion-exclusion chromatography using a cation-exchange resin. J. Chromatogr. 1979, 174, 153–157. [Google Scholar] [CrossRef]
  12. Tanaka, K.; Fritz, J.S. Separation of aliphatic carboxylic acids by ion-exclusion chromatography using a weak-acid eluent. J. Chromatogr. 1986, 361, 151–160. [Google Scholar] [CrossRef]
  13. Ikedo, M.; Mori, M.; Kurachi, K.; Hu, W.; Tanaka, K. Selective and simultaneous determination of phosphate and silicate ions in leaching process waters for ceramics glaze raw materials of natural origin by ion-exclusion chromatography coupled with UV-detection after postcolumn derivatization. Anal. Sci. 2006, 22, 117–121. [Google Scholar] [CrossRef]
  14. Nakatani, N.; Kozaki, D.; Masuda, W.; Nakagoshi, N.; Hasebe, K.; Mori, M.; Tanaka, K. Simultaneous spectrophotometric determination of phosphate and silicate ions in river water by using ion-exclusion chromatographic separation and post-column derivatization. Anal. Chim. Acta 2008, 116, 110–114. [Google Scholar]
  15. Kozaki, D.; Nakatani, N.; Mori, M.; Nakagoshi, N.; Tanaka, K. Development of water quality monitoring system for sequential determination of ionic nutrients by ion-exclusion chromatography with spectrophotometric detection on cation- and anion-exchange resin columns in parallel using water eluent. Chin. J. Chromatogr. 2012, 30, 721–727. [Google Scholar]
  16. Mori, M.; Tanaka, K.; Helaleh, M.I.H.; Xu, Q.; Ikedo, M.; Ogura, Y.; Sato, S.; Hu, W.; Hasebe, K.; Haddad, P.R. High-speed simultaneous ion-exclusion/cation-exchange chromatography of anions and cations on a weakly acidic cation-exchange resin column. J. Chromatogr. A 2003, 997, 219–224. [Google Scholar]
  17. Mori, M.; Tanaka, K.; Satori, T.; Ikedo, M.; Hu, W.; Itabashi, H. Influence of acidic eluent for retention behaviors of common anions and cations by ion-exclusion/cation-exchange chromatography on a weakly acidic cation-exchange resin in the H+-form. J. Chromatogr. A 2006, 1118, 51–55. [Google Scholar] [CrossRef]
  18. Tanaka, K. Study on water quality monitoring by advanced ion-exclusion chromatography. Bunseki Kagaku 2006, 55, 275–289. (In Japanese) [Google Scholar] [CrossRef]
  19. Kozaki, D.; Goto, R.; Masuda, W.; Saito, D.; Nakatani, N.; Nakagoshi, N.; Mori, M.; Tanaka, K. Application of ion-exclusion/cation-exchange chromatography to water quality monitoring of sub-urban river. Bunseki Kagaku 2008, 57, 651–658. (In Japanese) [Google Scholar] [CrossRef]
  20. Mori, M.; Ikedo, M.; Hu, W.; Helaleh, M.I.H.; Xu, Q.; Itabashi, H.; Tanaka, K. High-speed ion-exclusion chromatography of dissolved carbon dioxide on a small weakly acidic cation-exchangeresin column with ion-exchange enhancement columns of conductivity detection. J. Chromatogr. A 2005, 1092, 250–253. [Google Scholar] [CrossRef]
  21. Fritz, J.S.; Gjerde, D.T. Ion Chromatography, 4th ed.; Wiley-VCH: Weinhelm, NJ, USA, 2009. [Google Scholar]
  22. Japanese Standards Association. JIS K0102 Testing Methods for Industrial Wastewater; Japanese Standards Association: Tokyo, Japan, 2008. (In Japanese) [Google Scholar]
  23. Japanese Standards Association. JIS K0127 General Rules for IonChromatography; Japanese Standards Association: Tokyo, Japan, 2013. (In Japanese) [Google Scholar]
  24. American Public Health Association, American Water Works Association and Water Environment Federation. Standard Methods for the Examination of Water and Wastewater, 22nd ed.; Part. 4110 Determination of Anions by Ion Chromatography; American Public Health Association, American Water Works Association and Water Environment Federation: Washington, DC, USA, 2012. [Google Scholar]
  25. United States Environmental Protection Agency website. Available online: http://www.epa.gov/waterscience/ftp/basins/ training/tutorial/hcyclepx.htm (accessed on 21 November 2013).
  26. International Organization for Standardization website. Available online: http://www.iso.org/iso/home.html (accessed on 21 November 2013).
  27. Butler, J.N. Carbon Dioxide Equilibria and Their Applications; CRC-Press: Florida, FL, USA, 1991. [Google Scholar]
  28. Stumm, W.; Morgan, J.J. Aquatic Chemistry: An Introduction Emphasizing Chemical Equilibria in Natural Water, 2nd ed.; Wiley: New York, NY, USA, 1981. [Google Scholar]
  29. Conley, D.J.; Paerl, H.W.; Howarth, R.W.; Boesch, D.F.; Seitzinger, S.P.; Havens, K.E.; Lancelot, C.; Likens, G.E. Controlling eutrophication: Nitrogen and phosphorus. Science 2009, 323, 1014–1015. [Google Scholar] [CrossRef]
  30. Meybeck, M. Carbon, nitrogen, and phosphorus transport by world rivers. Am. J. Sci. 1982, 282, 401–450. [Google Scholar] [CrossRef]
  31. Downing, J.A.; McCauley, E. The nitrogen-phosphorus relationship in lakes. Limnol. Oceanogr. 1992, 37, 936–945. [Google Scholar] [CrossRef]
  32. Turner, R.E.; Rabalais, N.N.; Justic, D.; Dortch, Q. Global patterns of dissolved N, P, and Si in large river. Biogeochemistry 2003, 64, 297–317. [Google Scholar] [CrossRef]
  33. Green, M.B.; Finlay, J.C. Patterns of hydrologic control over stream water total nitrogen to total phosphorus ratios. Biogeochemistry 2010, 99, 15–30. [Google Scholar] [CrossRef]
  34. Baird, C.; Cann, M. Environmental Chemistry, 3rd ed.; W.H. Freeman Publishers: New York, NY, USA, 2005. [Google Scholar]
  35. Agarwal, S.K. Water Pollution; A P H Publishing Corporation: New Delhi, India, 2008. [Google Scholar]
  36. Karamouz, M.; Moridi, A.; Nazif, S. Water Engineering and Management; CRC Press Taylor & Francis Group: New York, NY, USA, 2010. [Google Scholar]
  37. Pena, M.A.; Katsev, S.; Oguz, T.; Gilbert, D. Modeling dissolved oxygen dynamics and hypoxia. Biogeosciences 2010, 7, 933–957. [Google Scholar] [CrossRef]
  38. Hall, E.R.; Murphy, K.L. Estimation of nitrifying biomass and kinetics in wastewater. Water Res. 1980, 14, 297–304. [Google Scholar] [CrossRef]
  39. Tanaka, K. Determination of bicarbonate ion in biological nitrification process water by ion-exclusion chromatography with coulometric detection. Bunseki Kagaku 1981, 30, 358–362. (In Japanese) [Google Scholar] [CrossRef]
  40. Martin, R.E. Taphonomy A Process Approach; Cambridge University Press: Cambridge, MA, USA, 1999. [Google Scholar]
  41. Knowles, R. Denitrification. Microbiol. Rev. 1982, 46, 43–70. [Google Scholar]
  42. Hamlin, H.J.; Michaels, J.T.; Beaulaton, C.M.; Graham, W.F.; Dutt, W.; Steinbach, P.; Losordo, T.M.; Schrader, K.K.; Main, K.L. Comparing denitrification rates and carbon sources in commercial scale upflow denitrification biological filters in aquaculture. Aquac. Eng. 2008, 38, 79–92. [Google Scholar] [CrossRef]
  43. Satoh, H.; Odagiri, M.; Ito, T.; Okabe, S. Microbial community structures and in situ sulfate-reducing and sulfur-oxidizing activities in biofilms developed on mortar specimens in a corroded sewer system. Water Res. 2009, 43, 4729–4739. [Google Scholar] [CrossRef]
  44. Thamdrup, B.; Canfield, D.E. Pathways of carbon oxidation in continental margin sediments off central Chile. Limnol. Oceanogr. 1996, 41, 1629–1650. [Google Scholar] [CrossRef]

