
Effects of Urban Non-Point Source Pollution from Baoding City on Baiyangdian Lake, China


1
Ministry of Education Key Lab of Water and Sand Science, School of Environment, Beijing NormalUniversity, Beijing 100875, China
2
State Key Laboratory of Water Environment Simulation, School of Environment, Beijing Normal University, Beijing 100875, China
3
Yellow River Engineering Consulting Co. Ltd., Zhengzhou 450003, China
*
Authors to whom correspondence should be addressed.
Water 2017, 9(4), 249; https://0-doi-org.brum.beds.ac.uk/10.3390/w9040249
Submission received: 29 December 2016
/
Revised: 28 March 2017
/
Accepted: 30 March 2017
/
Published: 1 April 2017
(This article belongs to the Special Issue Integrated Soil and Water Management: Selected Papers from 2016 International SWAT Conference)
Abstract
:Due to the high density of buildings and low quality of the drainage pipe network in the city, urban non-point source pollution has become a serious problem encountered worldwide. This study investigated and analyzed the characteristics of non-point source pollution in Baoding City. A simulation model for non-point source pollution was developed based on the Stormwater Management Model (SWMM), and, the process of non-point source pollution was simulated for Baoding City. The data was calibrated using data from two observed rainfall events (25.6 and 25.4 mm, the total rainfall on 31 July 2008 (07312008) was 25.6 mm, the total rainfall amount on 21 August 2008 (08212008) was 25.4 mm) and validated using data from an observed rainfall event (92.6 mm, the total rainfall on 08102008 was 92.6 mm) (Our monitoring data is limited by the lack of long-term monitoring, but it can meet the requests of model calibration and validation basically). In order to analyze the effects of non-point source pollution on Baiyangdian Lake, the characteristics and development trends of water pollution were determined using a one-dimensional water quality model for Baoding City. The results showed that the pollutant loads for Pb, Zn, TN (Total Nitrogen), and TP (Total Phosphorus) accounted for about 30% of the total amount of pollutant load. Finally, applicable control measures for non-point source pollution especially for Baoding were suggested, including urban rainwater and flood resources utilization and Best Management Practices (BMPs) for urban non-point source pollution control.
1. Introduction
Over the past decades, high-speed urbanization has led to increasing imperviousness in urban-underlying surface in many parts of the world [1]. An increase in imperviousness results in marked changes in water circulation patterns and may result in higher risks of flood disaster in urban areas [2,3,4]. Particularly, this problem is exacerbated by increases in urban dust levels due to a sharp growth of the urban population and industrial activities in developing countries such as China [5,6]. Since a large quantity of urban dust is transported into water bodies by rainfall-runoff processes, this might cause serious deterioration of urban water quality. This process has been recognized as urban non-point source pollution and has become a great threat to the urban water environment [7,8,9]. This pollution process is very complex because it involves diverse pollutants that originate from various non-point sources in an urban environment, such as suspended solids, organic materials, nutrients, heavy metals, and pesticide residue [10,11,12,13]. Health-related conditions for both human beings and aquatic organisms can be greatly affected by this type of pollution due to stormwater and the associated urban non-point sources [14]. This is particularly true in many cities in China, which is one of the most expedite economic and industrialized countries in the world. Therefore, urban stormwater can lead to both qualitative and quantitative problems in the receiving waters.
In recent years, the management of the quantity and quality of stormwater runoff from urban areas has become a complex task and an increasingly important environmental issue for urban communities [15,16,17]. To deal with this issue, computer-aided models are extremely useful for simulating and predicting the quantity and quality of urban stormwater. For example, since the 1970s, the United States and other developed countries have started to apply mathematical models to simulate the processes of urban rainfall-runoff. In addition, these models were widely used for evaluating effects of surface runoff pollution on various drainage systems and the corresponding receiving water bodies. These widely used urban stormwater models include the Source Loading and Management Model (SLAMM), the Storage, Treatment, Overflow, Runoff Model (STORM), the Model for Urban Sewers (MOUSE), the Stormwater Management Model (SWMM), and various derivative models [18,19,20]. Among them, SWMM is a computerized program that can assess the impacts of surface runoff pollution and evaluate the effectiveness of many mitigation strategies. It was first developed in 1971 and has undergone several major upgrades since then [18,21]. The current edition, Version 5, which runs under Windows, is a complete revision of the previous release. It is widely used throughout the world for supporting planning, analysis, and design related to stormwater runoff, and it integrates sewers, sanitary sewers, and other drainage systems in urban areas [22].
Research into the applications of the SWMM model in China has been conducted for decades. The SWMM model has been described as the classic non-point source pollution model [23,24]. The Morris screening method was used for a local sensitivity analysis of the parameters in the hydrologic and hydraulic modules of the SWMM model, in order to identify the sensitivity of the model parameters and perform an uncertainty analysis [25] (Section 3, the Electronic Supplementary Information, ESI). The results showed that the impact factors of the three most sensitive parameters were coefficients of imperviousness [26].
Baiyangdian Lake, situated centrally in the North China Plain, is the kidney of North China. The lake plays vital roles in flood reservation and environmental pollution decomposition [27]. However, Baoding City is the largest city in the upper basin, the human activities in the city have an important impact on the ecological environment of the Baiyangdian Lake. The quantity of sewage that drained into Baiyangdian Lake from Baoding City was about 25 to 33.6 × 10⁴ t per day, and the quantity of sewage that drained into lake by secondary storm water runoff can reach about 25 to 30 × 104 t per day [28]. A large number of contaminants draining into Baiyangdian Lake is a serious threat to the Baiyangdian water ecological environment. Therefore, it is of great practical significance to research the impact of non-point source pollution of Baoding City on the water environment of Baiyangdian Lake.
Therefore, the objective of this research is to understand the process of non-point source pollution in Baoding City and the concentration of non-point source pollutants at the outfall of the catchment. Our monitoring data is limited by the lack of long-term monitoring, the use of only three sets of data, two used to calibrate and the other one to validate the model, is rather insufficient. However, it was already demonstrated by Di Modugno et al. that even a minimum amount of experimental observations may provide relevant information necessary to enhance design procedures and to improve the efficiency of systems aimed at first flush separation, storage, and treatment [29]. Our main objectives are to (1) develop a simulation model for non-point source pollution based on SWMM, and based on the model results, analyze the characteristic effects of the non-point source pollution in an urban catchment in Baoding City and (2) reveal the effects of the non-point source pollution of Baoding City on Baiyangdian Lake with a one-dimensional water quality model, the results will be useful for better control of urban non-point source pollution and water environmental recovery of Baiyangdian Lake.
2. Materials and Methods
2.1. Overview of Baoding City and Baiyangdian Lake
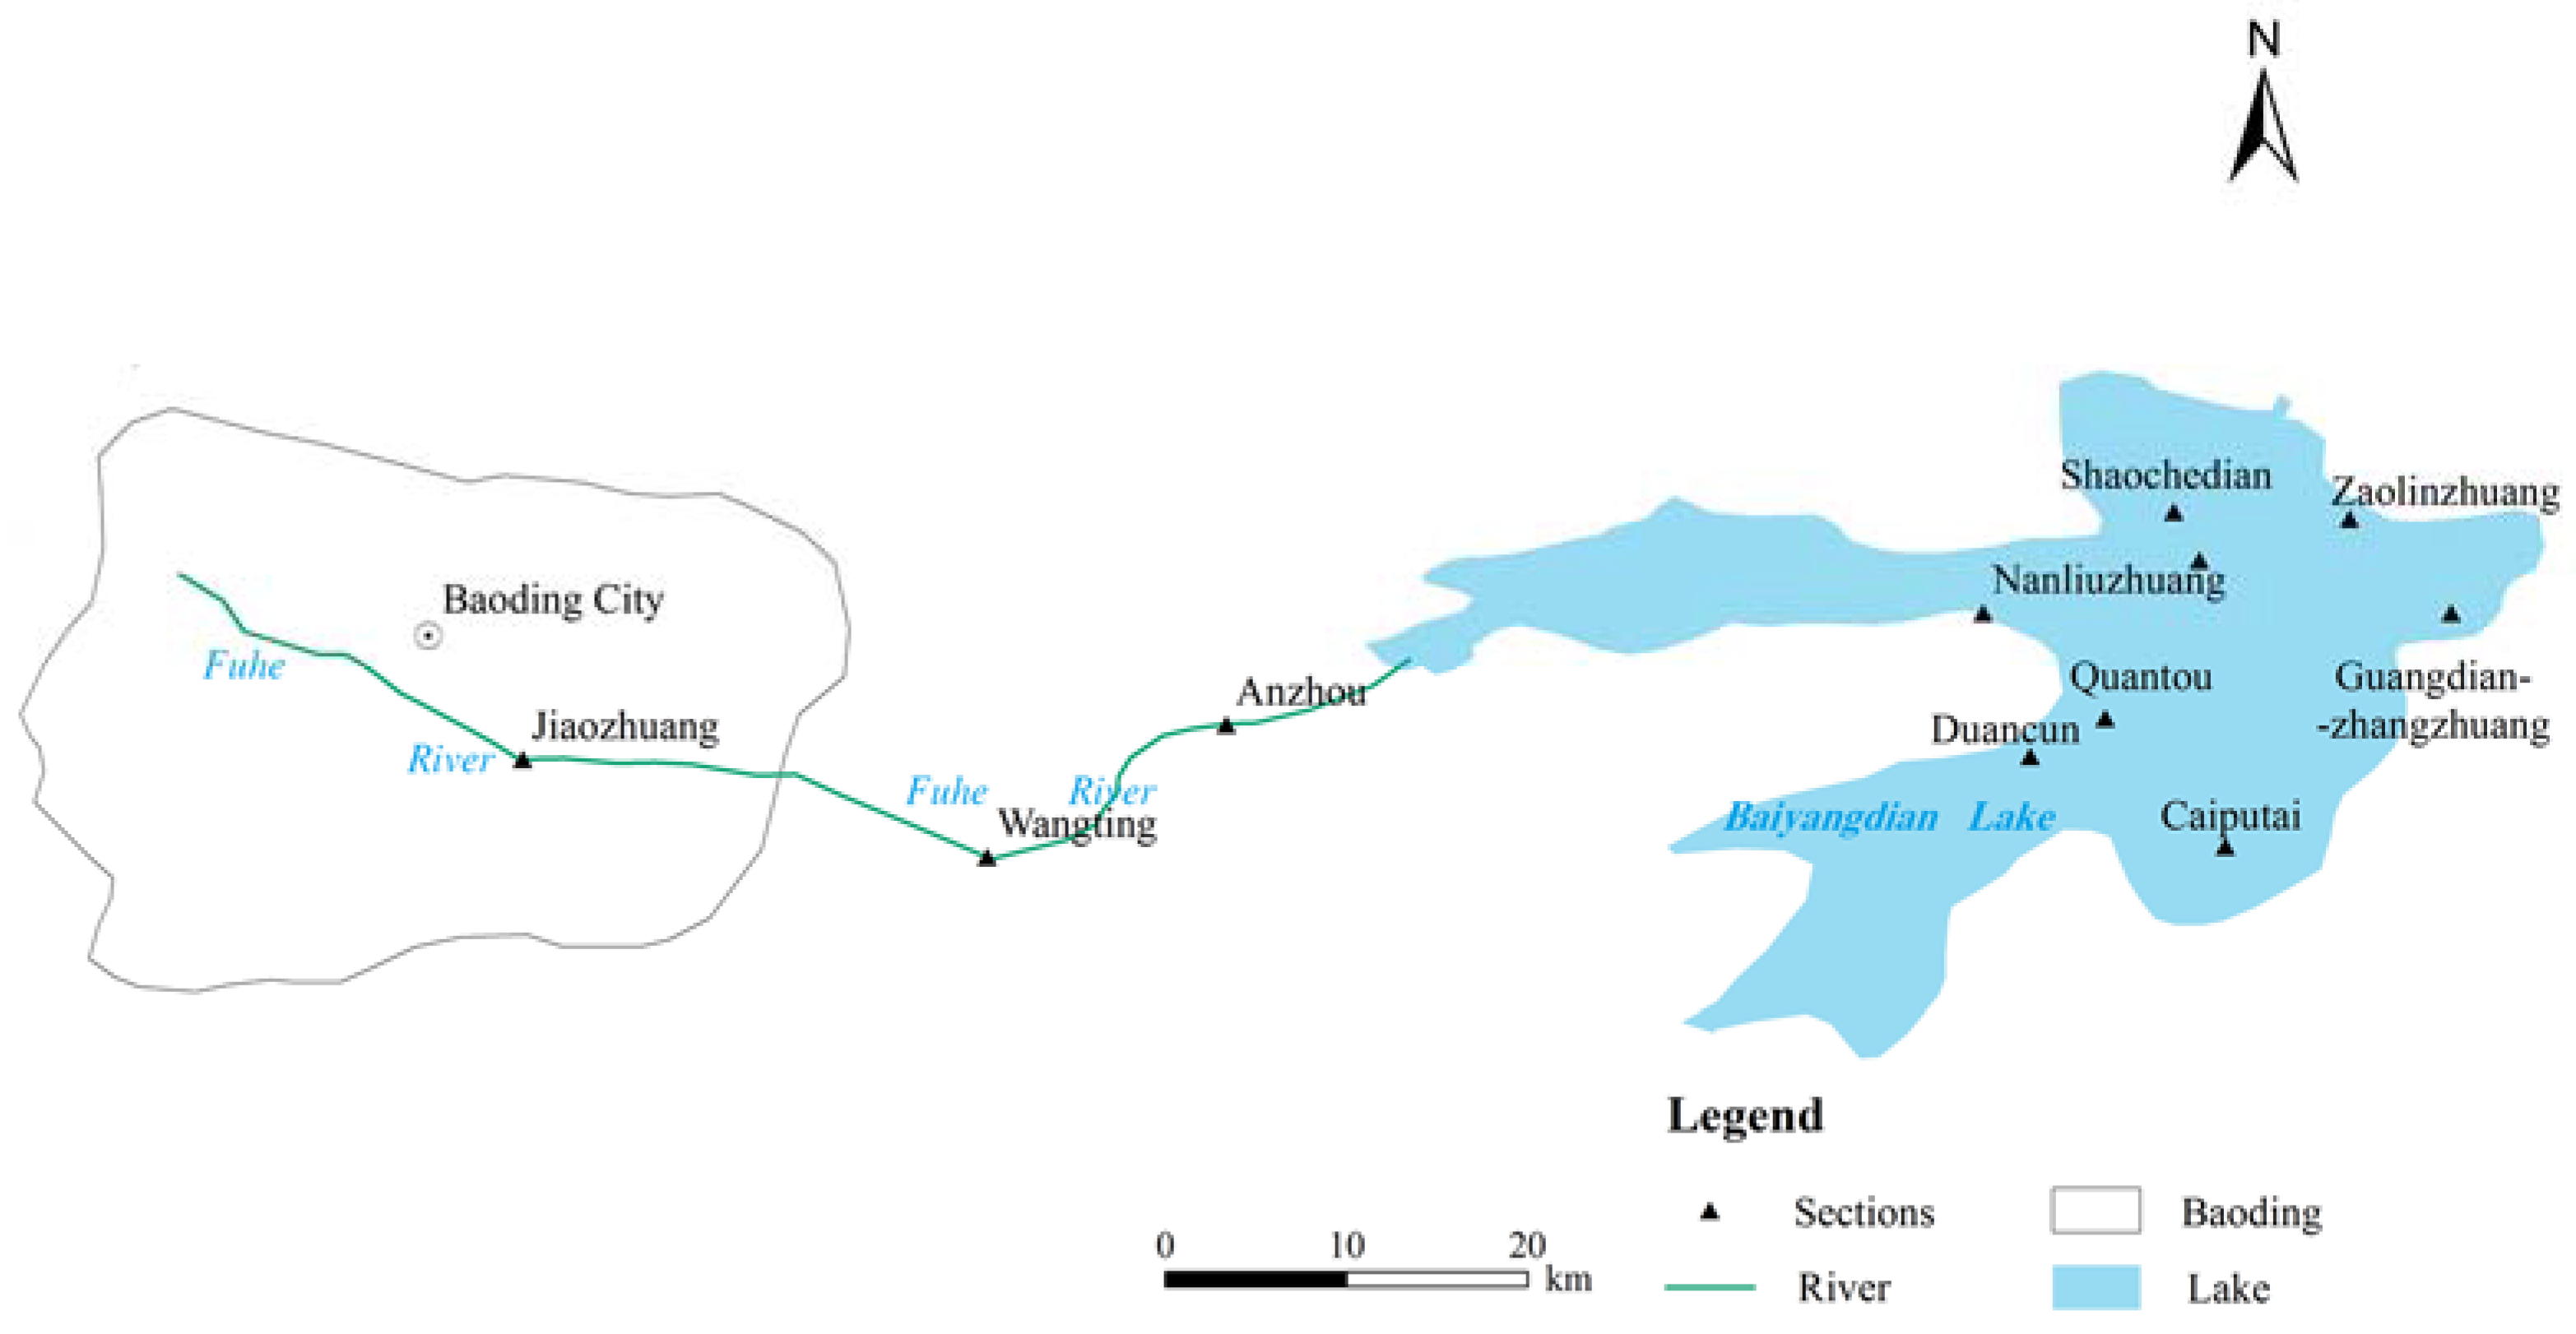
Baoding City is located in the mid-east of Hebei Province, and Baiyangdian Lake is located in the east, Taihang Mountain in the west, and the vast and fertile Hebei Great Plains in the north and south (Figure 1). The urban area is 312.3 km2, with a population of 1.07 million people. The city is located in the plains, and the terrain slopes from northwest to southeast and extends to the Taihang Mountain area in the northwest with a gentle slope. The city has 12 rivers and streams, of which the Caohe and Tanghe River cross the city and flow into Baiyangdian Lake, which is called the “Pearl of North China” [28].
With the rapid economic development, water resource shortages, water consumption, and sewage emissions in Baoding City continue to increase, and because the pollution control measures are less developed, several water-related environmental problems have become more significant. The first problem is the pollution of the flood drainage system. Sewage is discharged into the rivers, causing the destruction of the water environment.
Lake Baiyangdian, situated centrally in the North China Plain, is located 130 km south of Beijing (Figure 1). The surface area of the lake is 366 km2, with a catchment area of 31,200 m2. The lake depth varies according to the hydrologic conditions, but is usually less than 2.0 m [27,30,31]. The annual mean precipitation is less than 450 mm, and the annual mean ambient temperature is less than 17 °C in climate changes. With average annual runoff of 3.57 × 10⁹ m3, the lake plays vital roles in flood reservation, environmental pollution decomposition, etc. Moreover, the lake is a monomictic lake with only one entrance accepting pollutant emissions from Fuhe River [24] (Figure 1).
2.2. Available Data
The data of rainfall on 31 July 2008 (07312008), 21 August 2008 (08212008), and 10 August 2008 (08102008), was measured by rain gauge. Precipitation was recorded every 5 min. The total rainfall on 07312008 was 25.6 mm, but only lasted for approximately 2 h and had a high rainfall intensity. The total rainfall amount on 08212008 was 25.4 mm, lasted for approximately 7 h, but had a much lower rainfall intensity. The total rainfall on 10 August 2008 (08102008) was 92.6 mm, lasted approximately seven hours and was the strongest rainstorm that occurred from July to September 2008.
Our monitoring data is limited by the lack of long-term monitoring, the use of only three sets of data, two used to calibrate and the other one to validate the model, is rather insufficient. However, it can meet the requests of model calibration and validation at a basic level [29].
2.3. Methods
To analyze the process of non-point source pollution of Baoding City and the effects of non-point source pollution on Baiyangdian Lake, we use the Stormwater Management Model (SWMM) and the one-dimensional water quality model. In the course of the study, the technical route is as follows (Figure 2).
According to the hydrological parameters, quality parameters and hydraulic parameters of the model, the sensitivity analysis of the model parameters was carried out, and the SWMM model of Baoding City was established after repeated calibration and verification. The simulation process of non-point source pollution in Baoding City is divided into typical simulation of stormwater runoff and simulation of annual rainfall-runoff. The influence of stormwater runoff and annual rainfall-runoff pollution on the Baiyangdian Lake water environment were studied by analyzing the characteristics of pollution reduction along the Fuhe River.
2.3.1. SWMM Model
SWMM, a dynamic rainfall-runoff simulation model, is used for single event or long-term (continuous) simulation of runoff quantity and quality from primary urban areas. The runoff component of SWMM operates on a collection of sub-catchment areas that receive precipitation and generate runoff and pollutant loads. The routing portion of SWMM transports this runoff through a system of pipes, channels, storage/treatment devices, pumps, and regulators. SWMM tracks the quantity and quality of runoff generated from each sub-catchment, and the flow rate, flow depth, and quality of water in each pipe and channel during a simulation period are comprised of multiple time steps. This section briefly describes the methods SWMM uses to model stormwater runoff quantity and quality through the following two processes [21].
(1) Runoff Simulation
SWMM uses the St. Venant equations for flow simulation [32,33]. The St. Venant equations represent the principles of conservation of momentum (Equation (1)) and conservation of mass (Equation (2))
where y is the water depth, m; v is the velocity, L·t−1; x is the longitudinal distance, m; t is the time, s; g is the gravitational acceleration, 9.8 m/s; So is channel slope, dimensionless; Sf is friction slope, dimensionless; A is the area of the flow cross-section and a function of y based on the geometry of the conduit, m2; Q is the discharge and it is equal to A × v, m3·s−1.
Equation (1) represents hydrostatic pressure, convective acceleration, local acceleration, and gravity and frictional forces, respectively. Representing the effects of turbulence and viscosity, the friction slope (Sf) is calculated in SWMM using Manning’s equation [18]:
where n is Manning’s roughness coefficient, t·L−1/3; R is hydraulic radius, m; Q and A are defined previously.
Equation (3) is substituted into Equation (1), and the resulting equation is solved for Q:
Since there is no known analytic solution, an iterative finite-difference method is applied to Equations (2) and (4) to solve the equations. For each time step, the discharge, area, and water depth (y) at the outlet of each conduit are derived.
(2) Water quality simulation
In this paper, the exponential function is used as the surface pollutant build-up and wash-off algorithms of the SWMM model, and the build-up and wash-off algorithms used to simulate these two processes (Section 2 in the ESI).
Water quality routing within conduit links assumes that the conduit behaves as a continuously-stirred tank reactor (CSTR). Although the assumption of a plug flow reactor might be more realistic, the differences will be small if the travel time through the conduit is on the same order as the routing time step. The concentration of a constituent exiting the conduit at the end of a time step is determined by integrating the conservation of mass equation and using average values for quantities that might change over the time step, such as flow rate and conduit volume [22].
Solute transport is simulated with the assumption of complete and instantaneous mixing within each element of the sewer system. The instantaneous mixing assumption introduces artificial dispersion; however, as the number of conduit elements is increased within a system, solute transport is represented by pure advection [22]. The overall transport of solutes through the system is executed through a mass balance calculation that incorporates decay. The concentrations of solutes are determined using the finite difference form of the continuity equation [18]:
where c is the concentration in the mixed volume, m·L−3; V is the volume, L3; t is the time, t; Qi and Qo are the inflow (i) and outflow (o) rate, L3·t−1; ci and co are the concentrations of the influent and effluent, m·L−3; k is the decay constant, t−1; s is the source (or sink), m·t−1.
Assuming complete mixing and applying a finite-difference scheme, Equation (5) becomes:
where j is the time-step number; D1 is the decay constants, t−1; D2 is the growth constant, t−1; S = maximum growth, m·L−1; Dt is the time increment, t, and the other parameters were defined with Equation (5).
2.3.2. One-Dimensional Water Quality Model
Sewage and rainwater from Baoding City flow into the Fuhe River and a biochemical reaction occurs gradually in the flow process under the action of natural microorganisms. As a result, the main pollutant COD is decomposed as the flow process has been lengthened. For the Fuhe River with small ratio of width to depth, pollutants can be mixed in these sections (Jiaozhuang, Wangting, Anzhou, Nanliuzhuang) in a relatively short period of time. A one-dimensional water quality model that can simulate the migration of pollutants along the river longitudinal has been described in [34,35] and is defined as:
where is the contaminant concentration of the control section, mg/L; is the contaminant concentration of the initial section, mg/L; k is the self-purification capacity of the pollution, 1/d; x is the longitudinal distance of the control section of the downstream section of the sewage outfalls, m; u is the average flow velocity of the polluted belts along the river banks, m/s.
3. Results and Discussions
3.1. Model Calibration and Model Validation
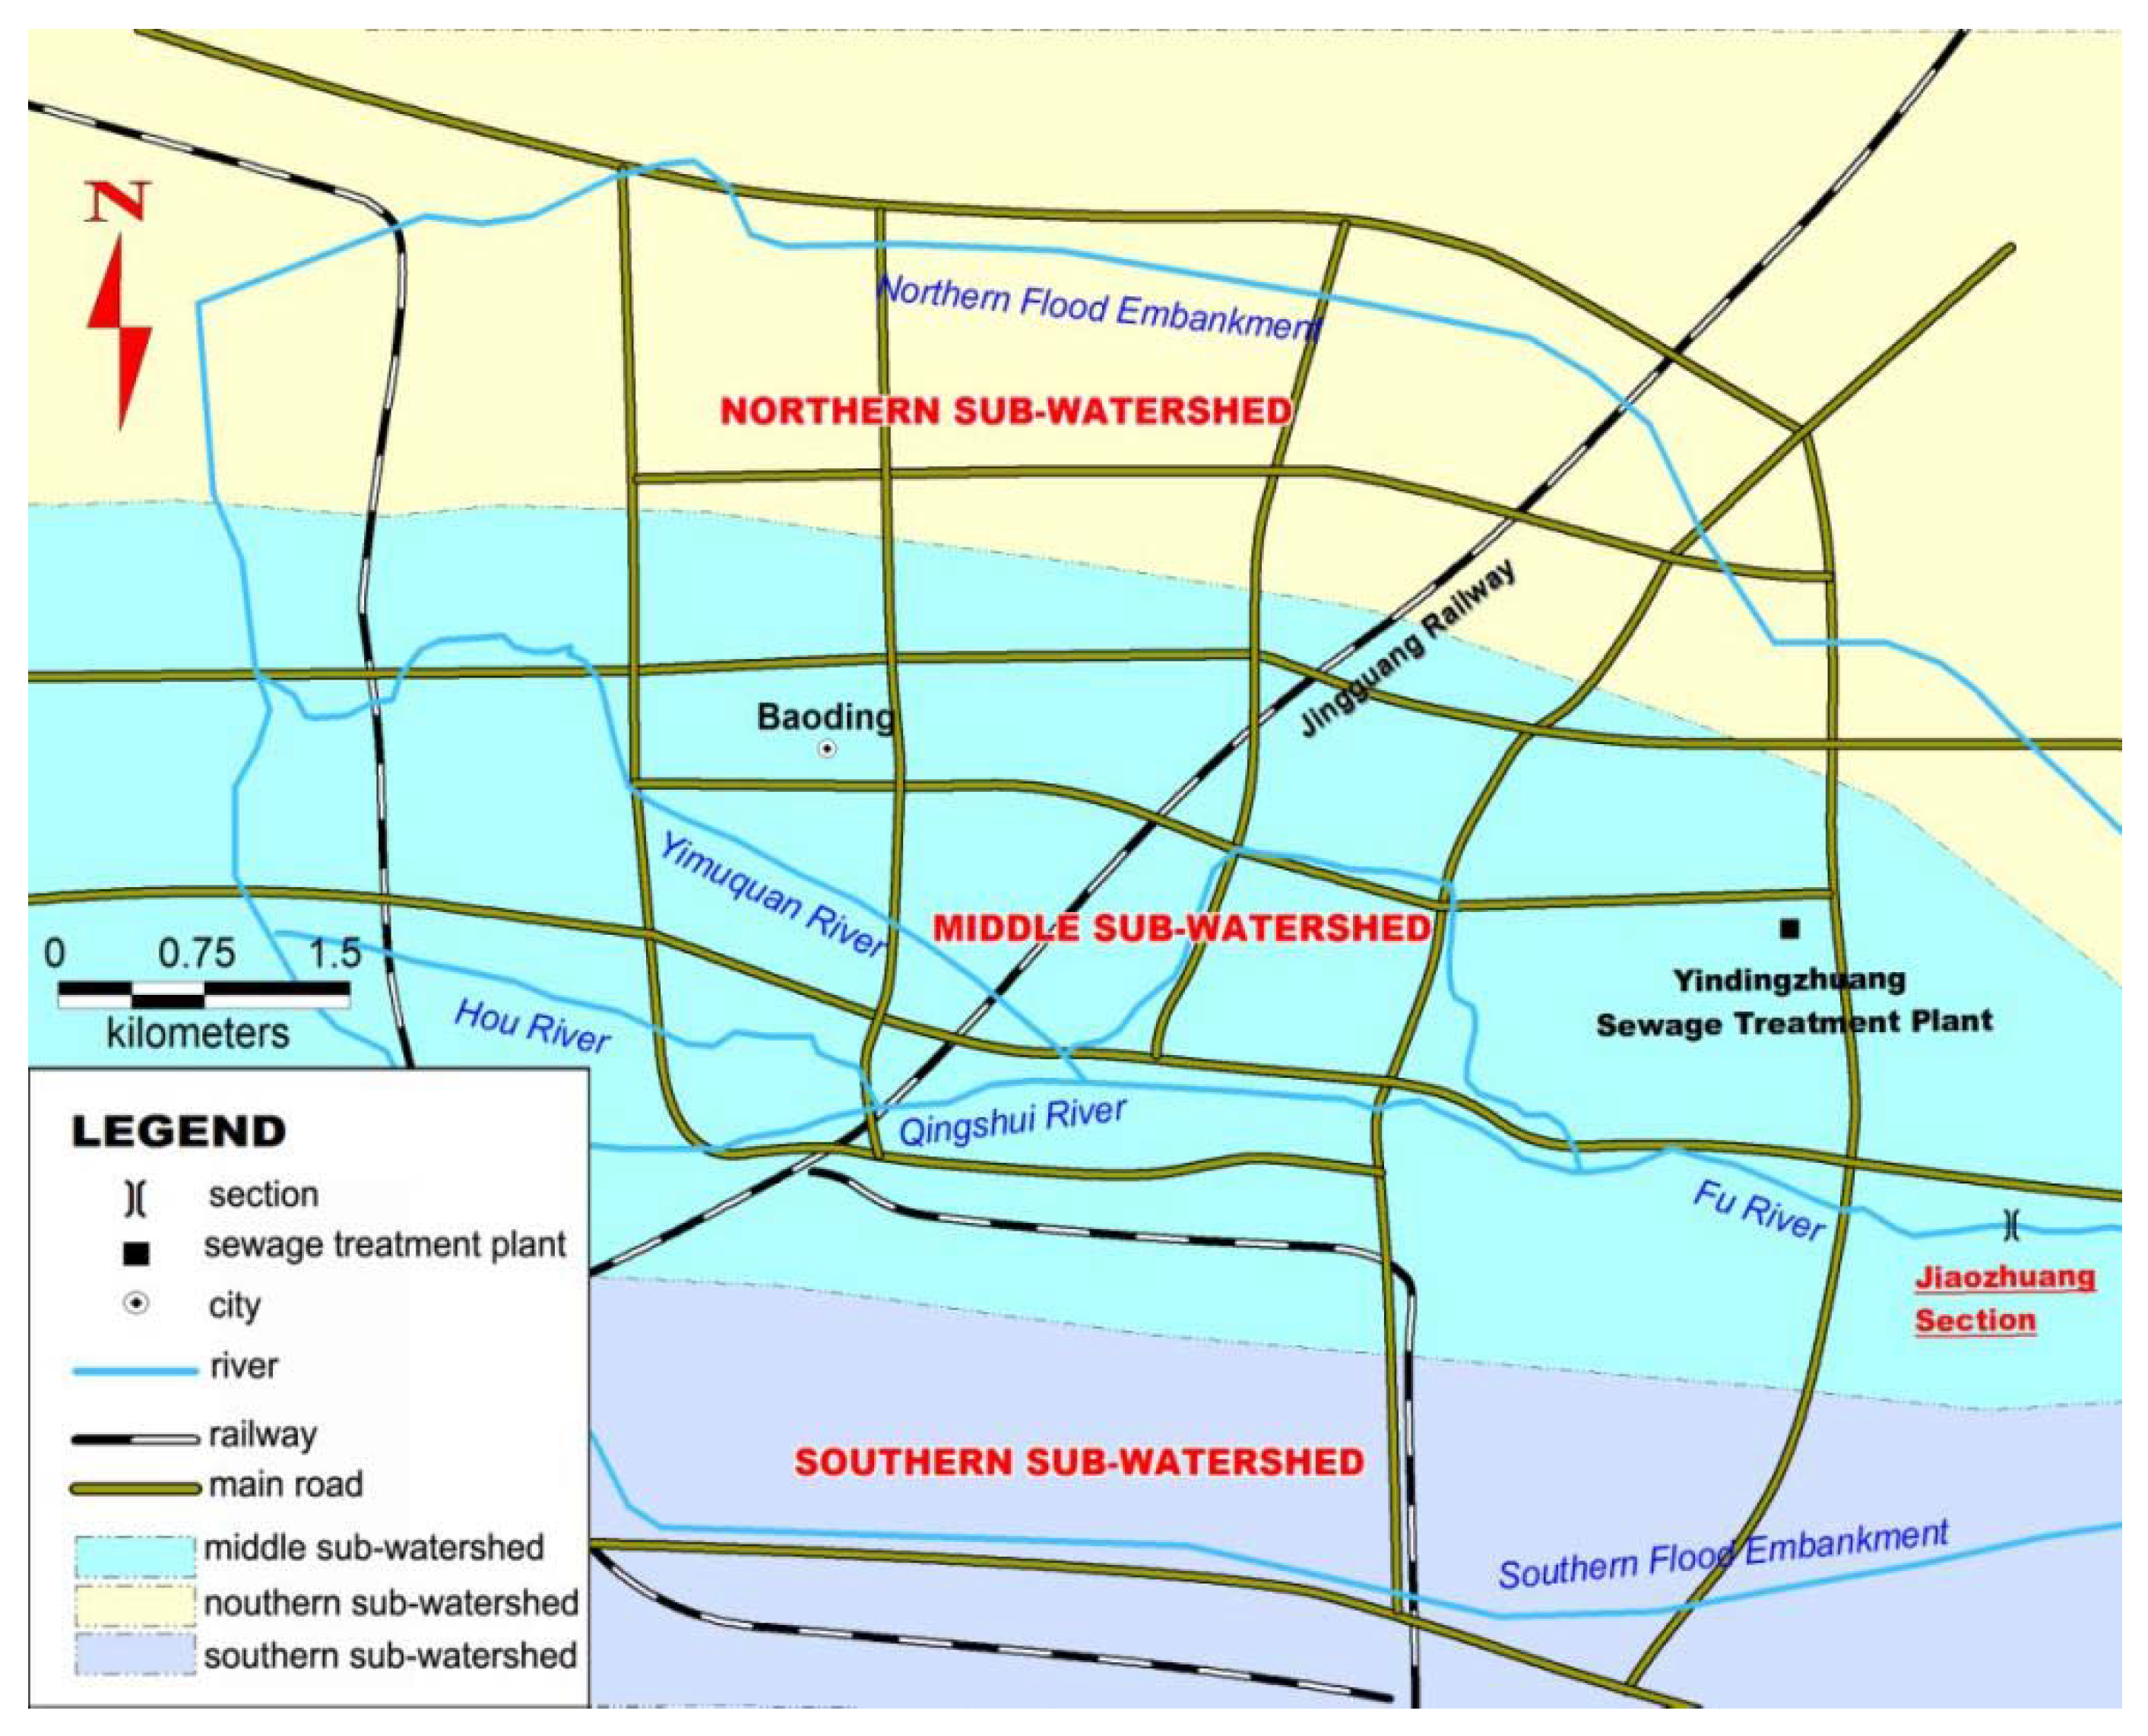
In this study, the drainage system of Baoding City was generalized based on an analysis of the drainage system and field reconnaissance of the study area. The entire city was divided into three sub-watersheds: a middle sub-watershed, a southern sub-watershed, and a northern sub-watershed, based on the actual drainage system (Figure 3). The rainfall-runoff of the middle sub-watershed flowed into Yimuquan River, Hou River, and Qingshui River, and then flowed together into the Fuhe River. The urban rainfall-runoff of the southern sub-watershed and northern sub-watershed was also generalized to flow into flood embankments as gravity flow and then flow into the Fuhe River, without regard for processed rainfall-runoff through the sewage treatment plant.
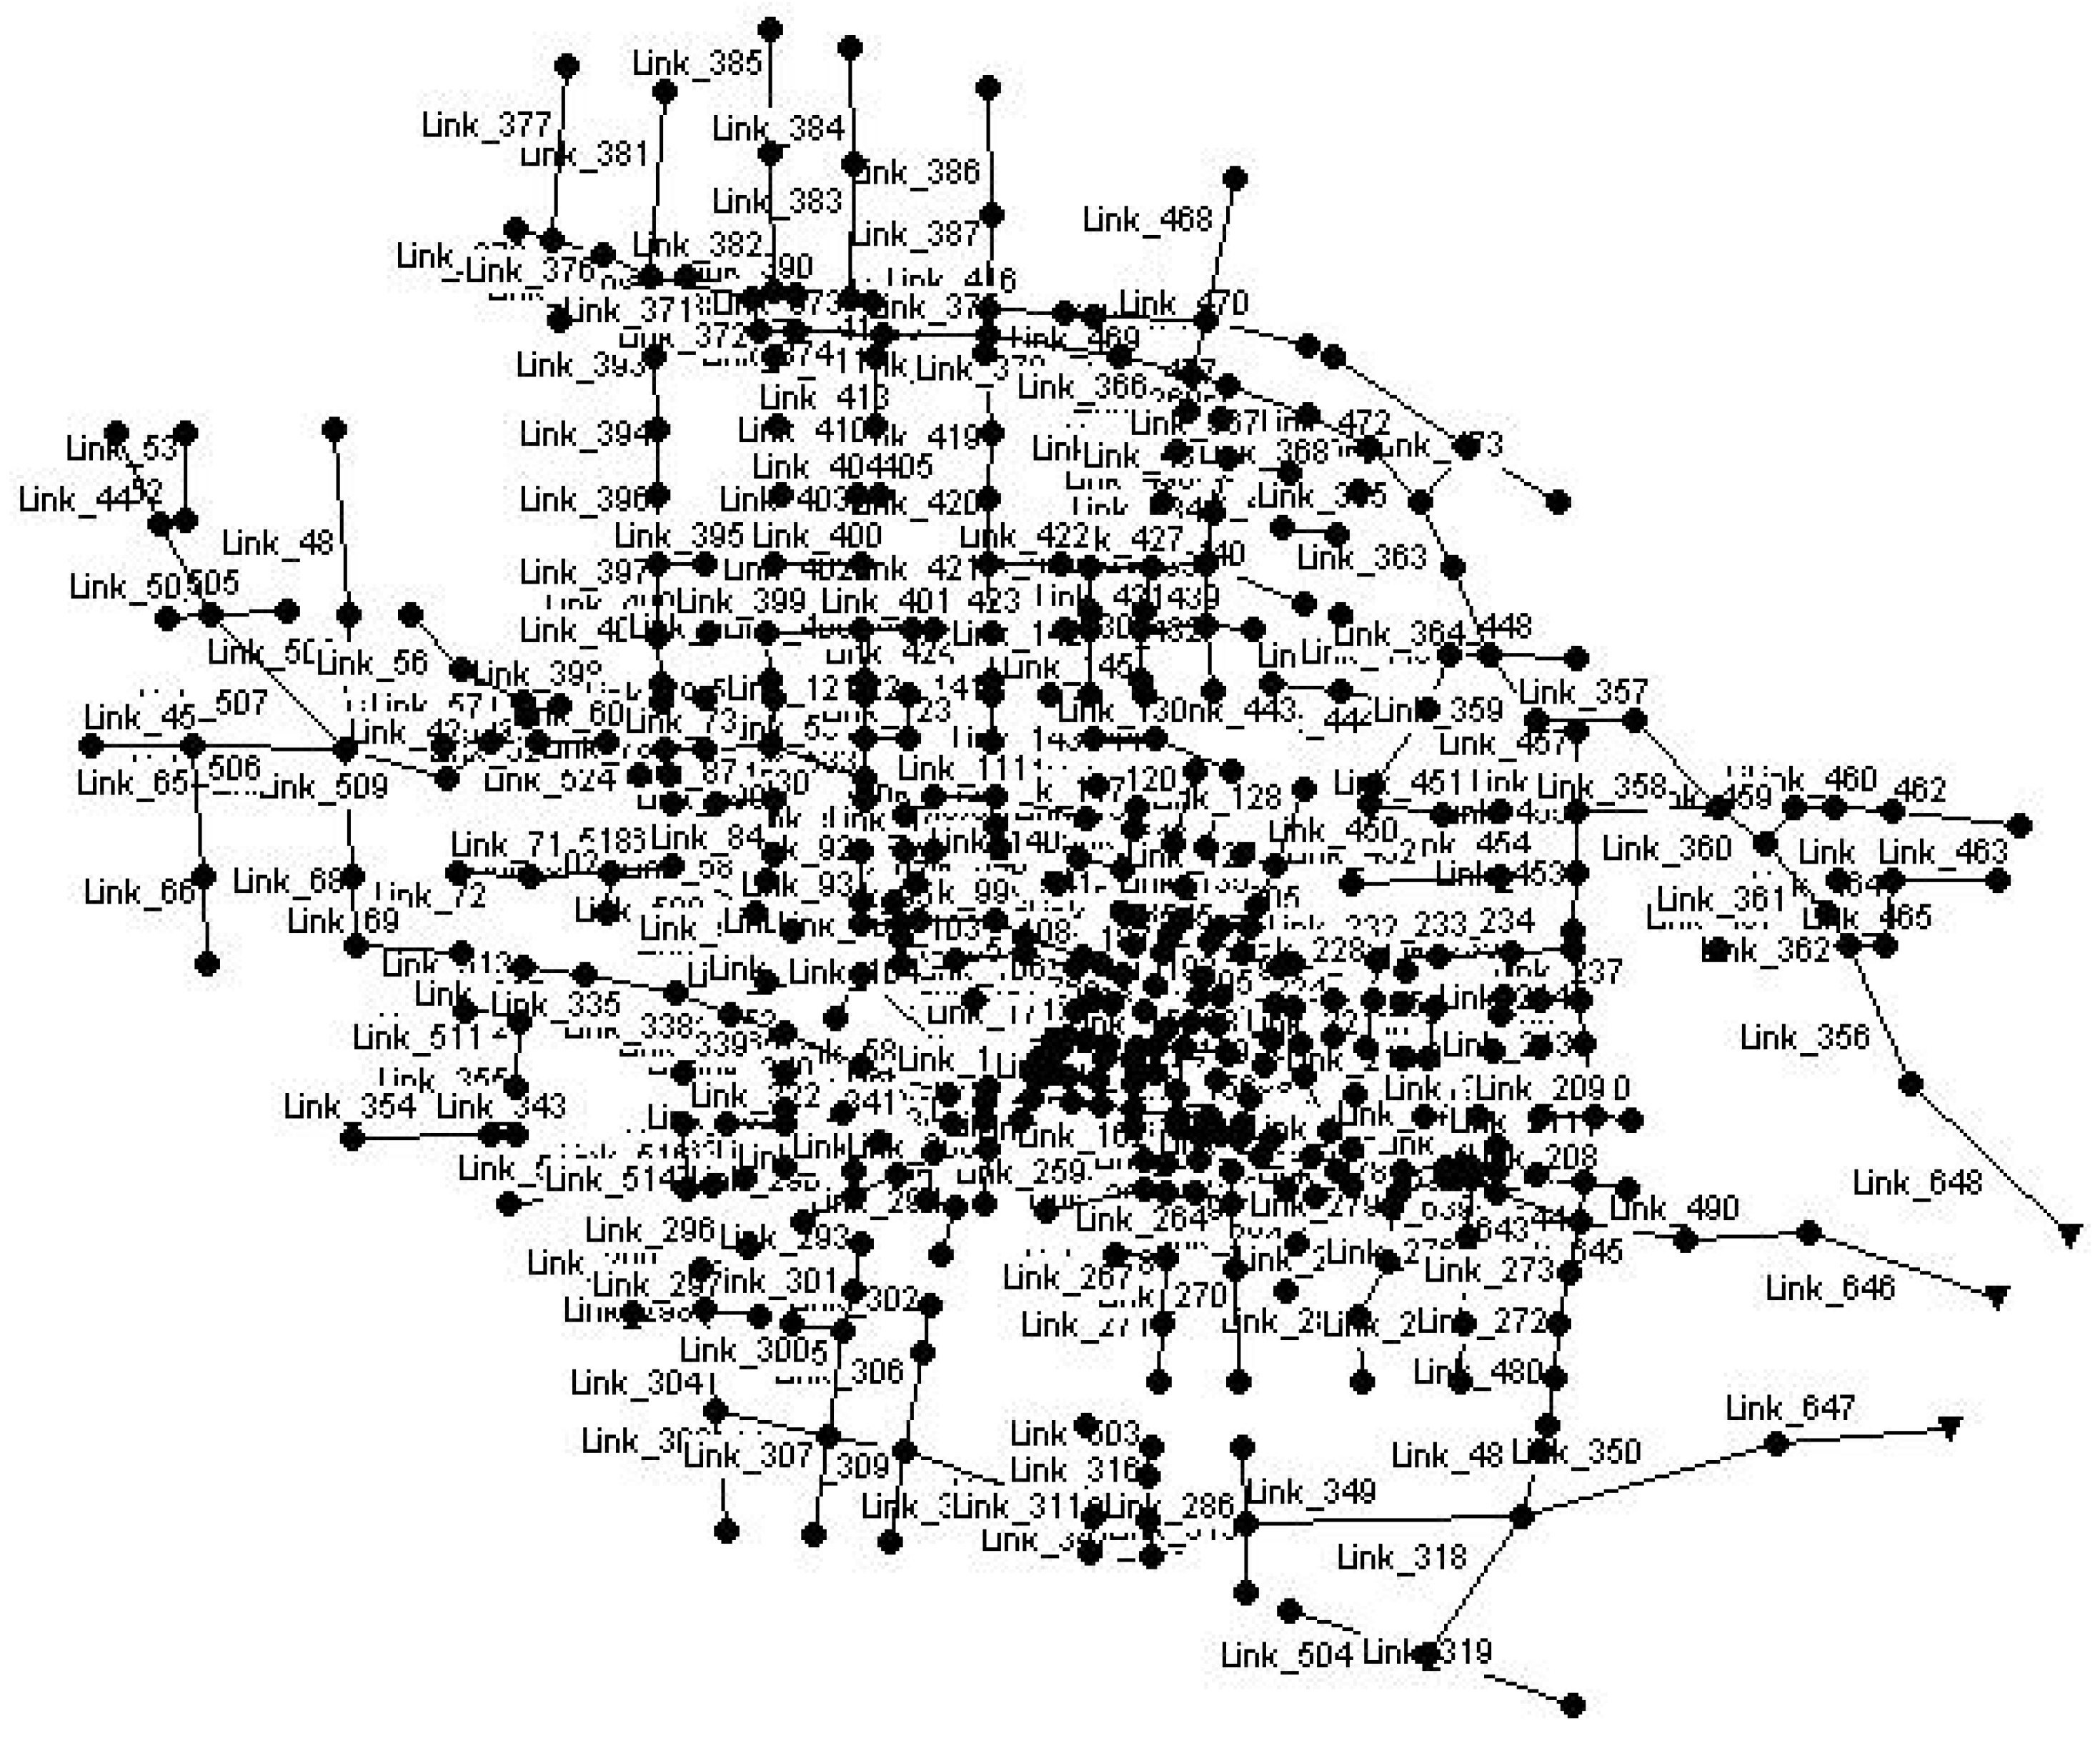
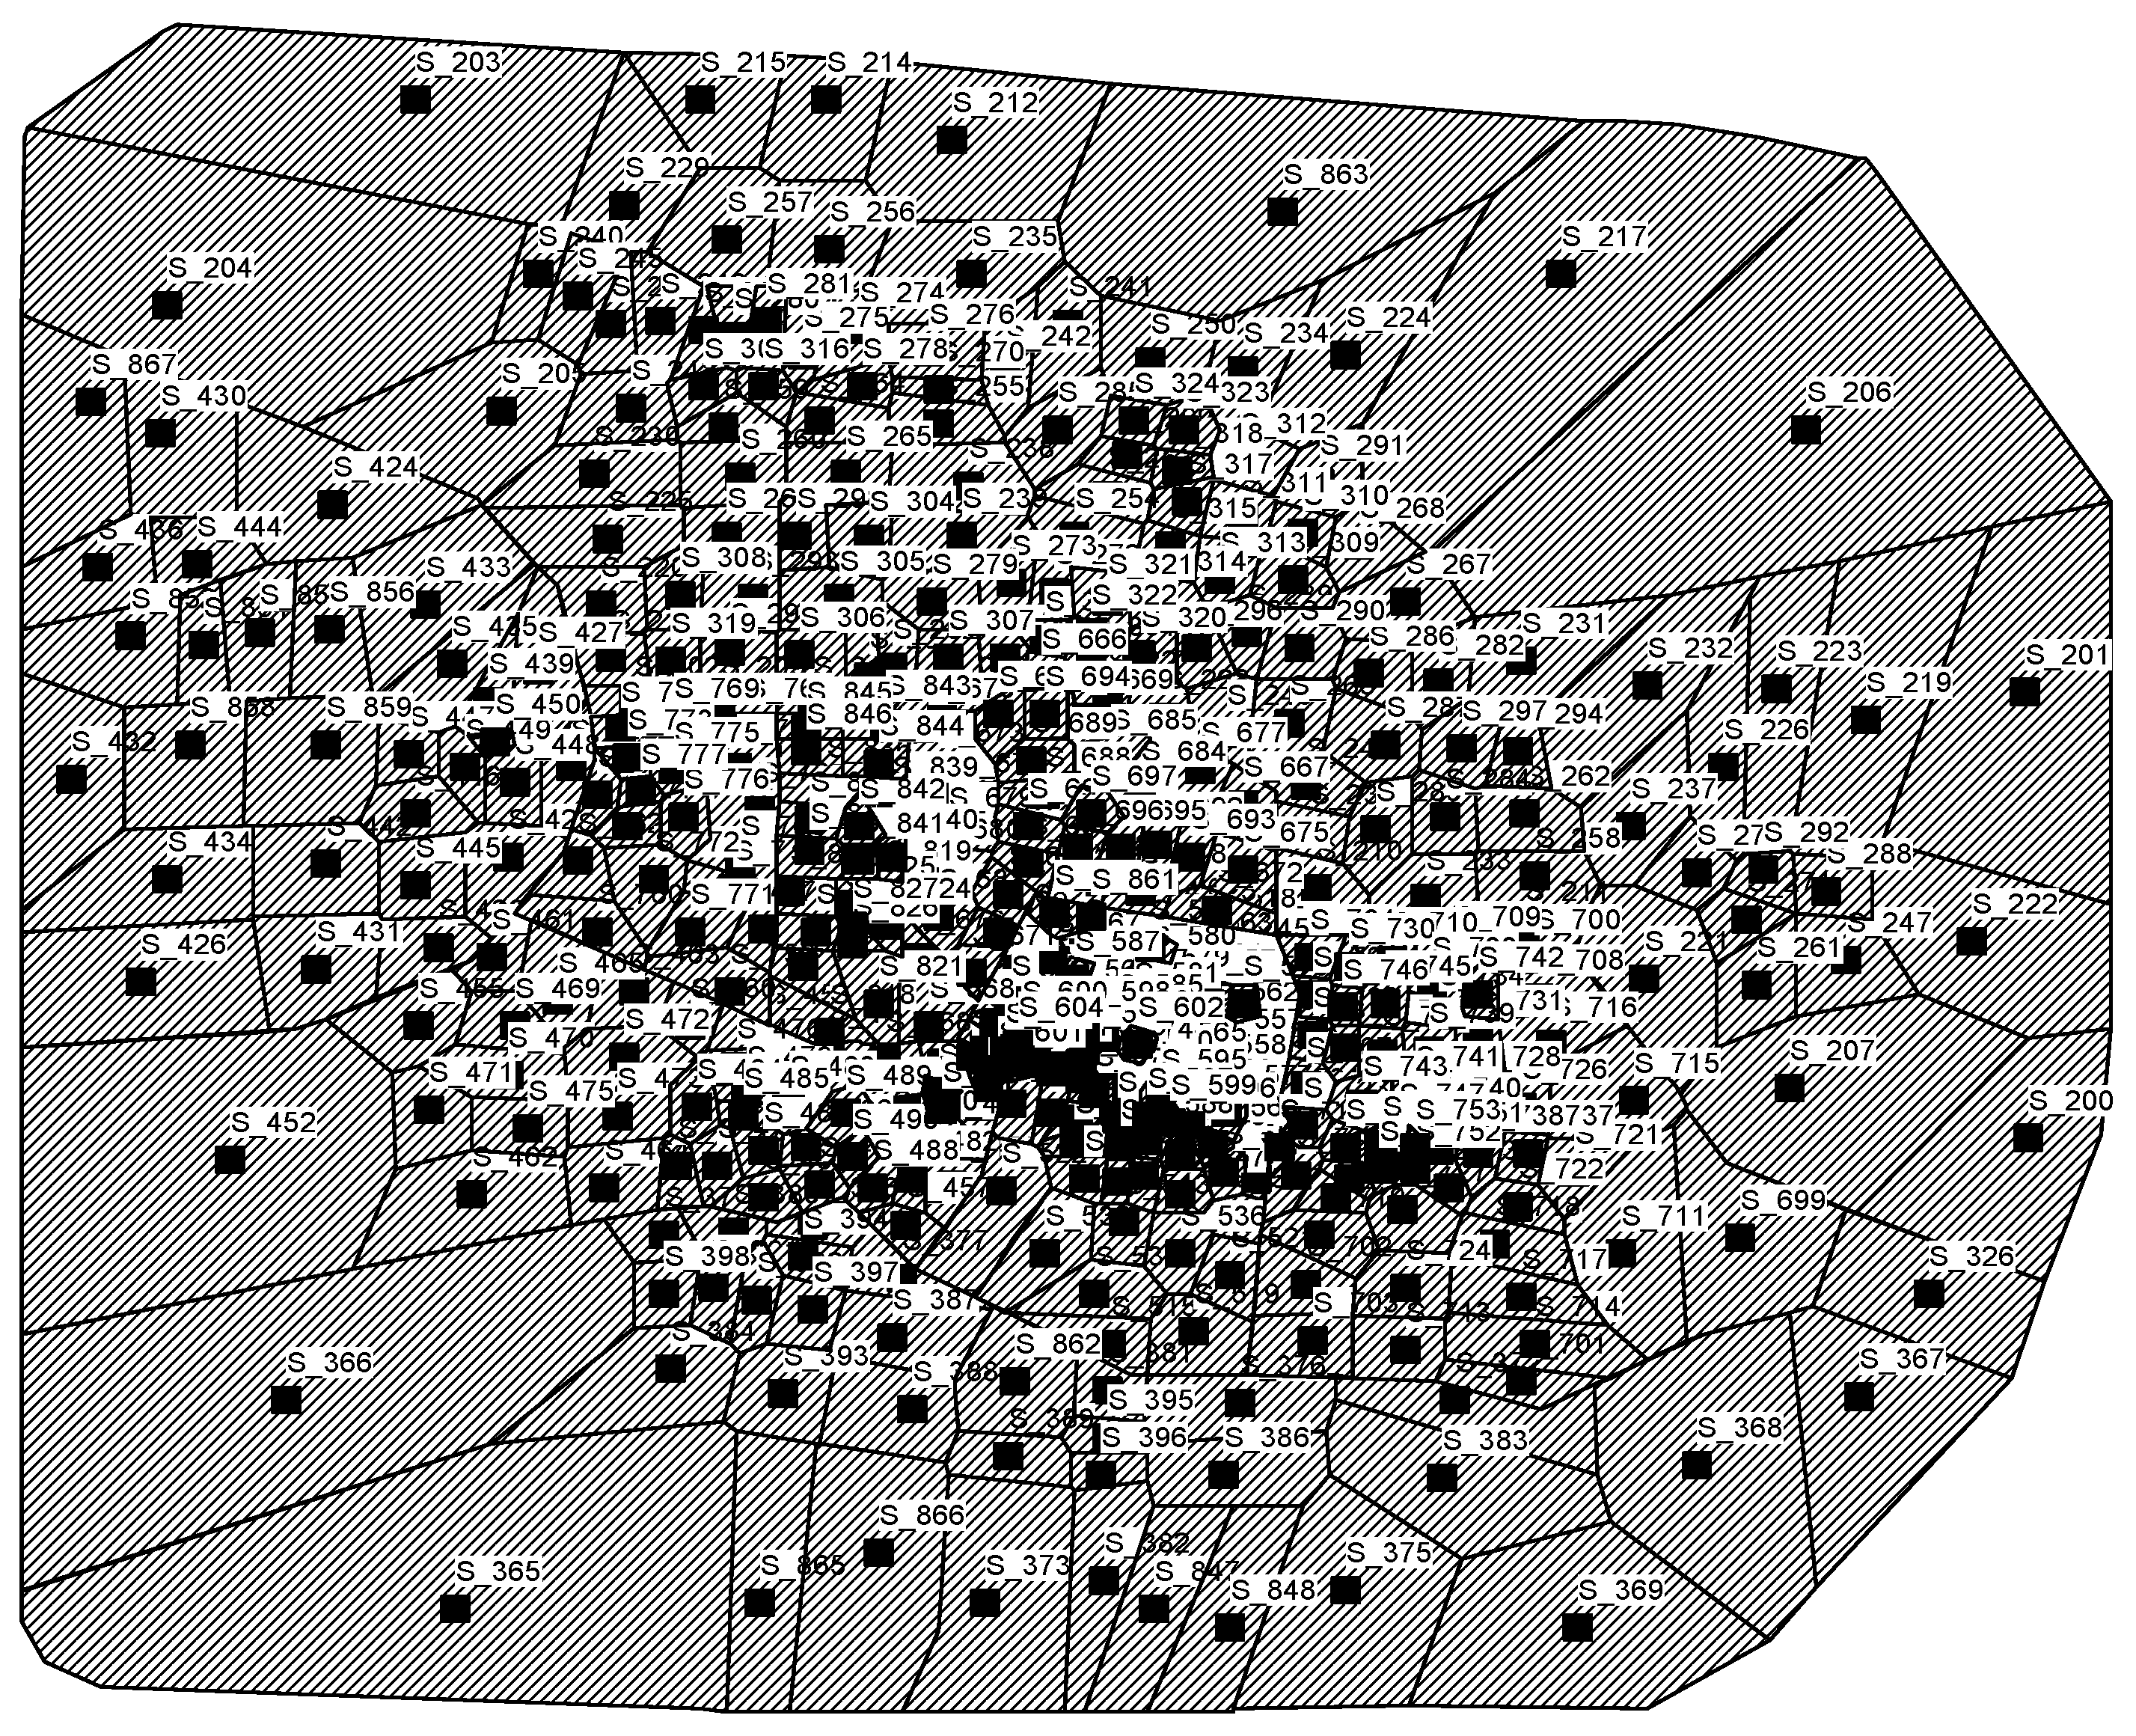
A total of 447 rainwater pipe nodes and 447 rainwater pipes were generalized (including rainwater pipes, sewage pipes, and open channels). The diameter of rainwater pipes ranged between 400 and 1400 mm, and some pipes had a rectangular cross-section of 2000 mm × 2000 mm, while the bottom width of open channels varied between 5 and 14 m. Furthermore, three outlets were generalized, Node_556, Node_557, and Node_558. Node_557 was the Jiaozhuang section on the Fuhe River of the middle sub-watershed, Node_556 and Node_558 were the sections on the northern and southern flood embankments, respectively, and they represented the outlets of the northern and southern sub-watersheds (Figure 4, Tables S1 and S2 in the ESI). Based on the generalization of the drainage system, the boundaries of trunk roads and streets in conjunction with field reconnaissance and research, and taking into account a topographic map and the convergence characteristics of Baoding City, the whole urban catchment was divided into 450 sub-catchments, with a total area of 130.76 km2 (Figure 5 and Tables S3 in the ESI).
3.1.1. Model Calibration
(1) Parameters of SWMM
SWMM parameters include hydrological, hydraulic, and water quality parameters. It is relatively easy to determine the hydraulic parameters by surveying pipes and networks. However, the hydrological parameters are relatively difficult to determine. The parameters in this study were obtained through the model handbook and field surveys. Table 1 lists the major hydrological and hydraulic parameters, their ranges, and methods for determining the parameters.
The parameters for the accumulation of pollutants in water quality portion of the model were obtained by measurements, but empirical values were used for the scouring parameters. The sub-catchments in the SWMM model were divided into four types of land-use including business areas, residential areas, industrial areas, and green areas. Moreover, the main pollution factors including COD, TN, TP, Pb, and Zn, which were produced by rainwater mixing with the urban dust, were simulated in the model. The parameters for pollutant accumulation and erosion in different land-use types are shown in Table 2 and Table 3, wash off exponent means the runoff exponent in wash off function, and wash off coefficient means wash off coefficient or Event Mean Concentration (EMC). The cumulative amount of surface pollution is directly related to land use condition, greening condition, traffic condition, rainfall interval and rainfall intensity. The distribution of dust accumulation on the surface is: industrial area > traffic area > residential area > green area. In this study, we regard the different land use types had the same cumulative rate constants and half-saturated accumulation times. The cumulative rate constant was 0.5 and the half-saturated accumulation time was 10 days.
(2) Sensitivity Analysis
A sensitivity analysis is used to study the impacts of parameters on the model output to identify the key parameters of the model. The results from a sensitivity analysis by Huang [26] and Wang [27] and the sensitivity ranking of the hydraulic and hydrological parameters in SWMM are listed in Table 4. For different output variables, the sensitivity order of each parameter is also different, for runoff coefficient, the order of parameter according to the sensitivity is Imperv(%) > S-Imperv > Pct-Zero > N-Imperv > Width.
(3) Calibration Results
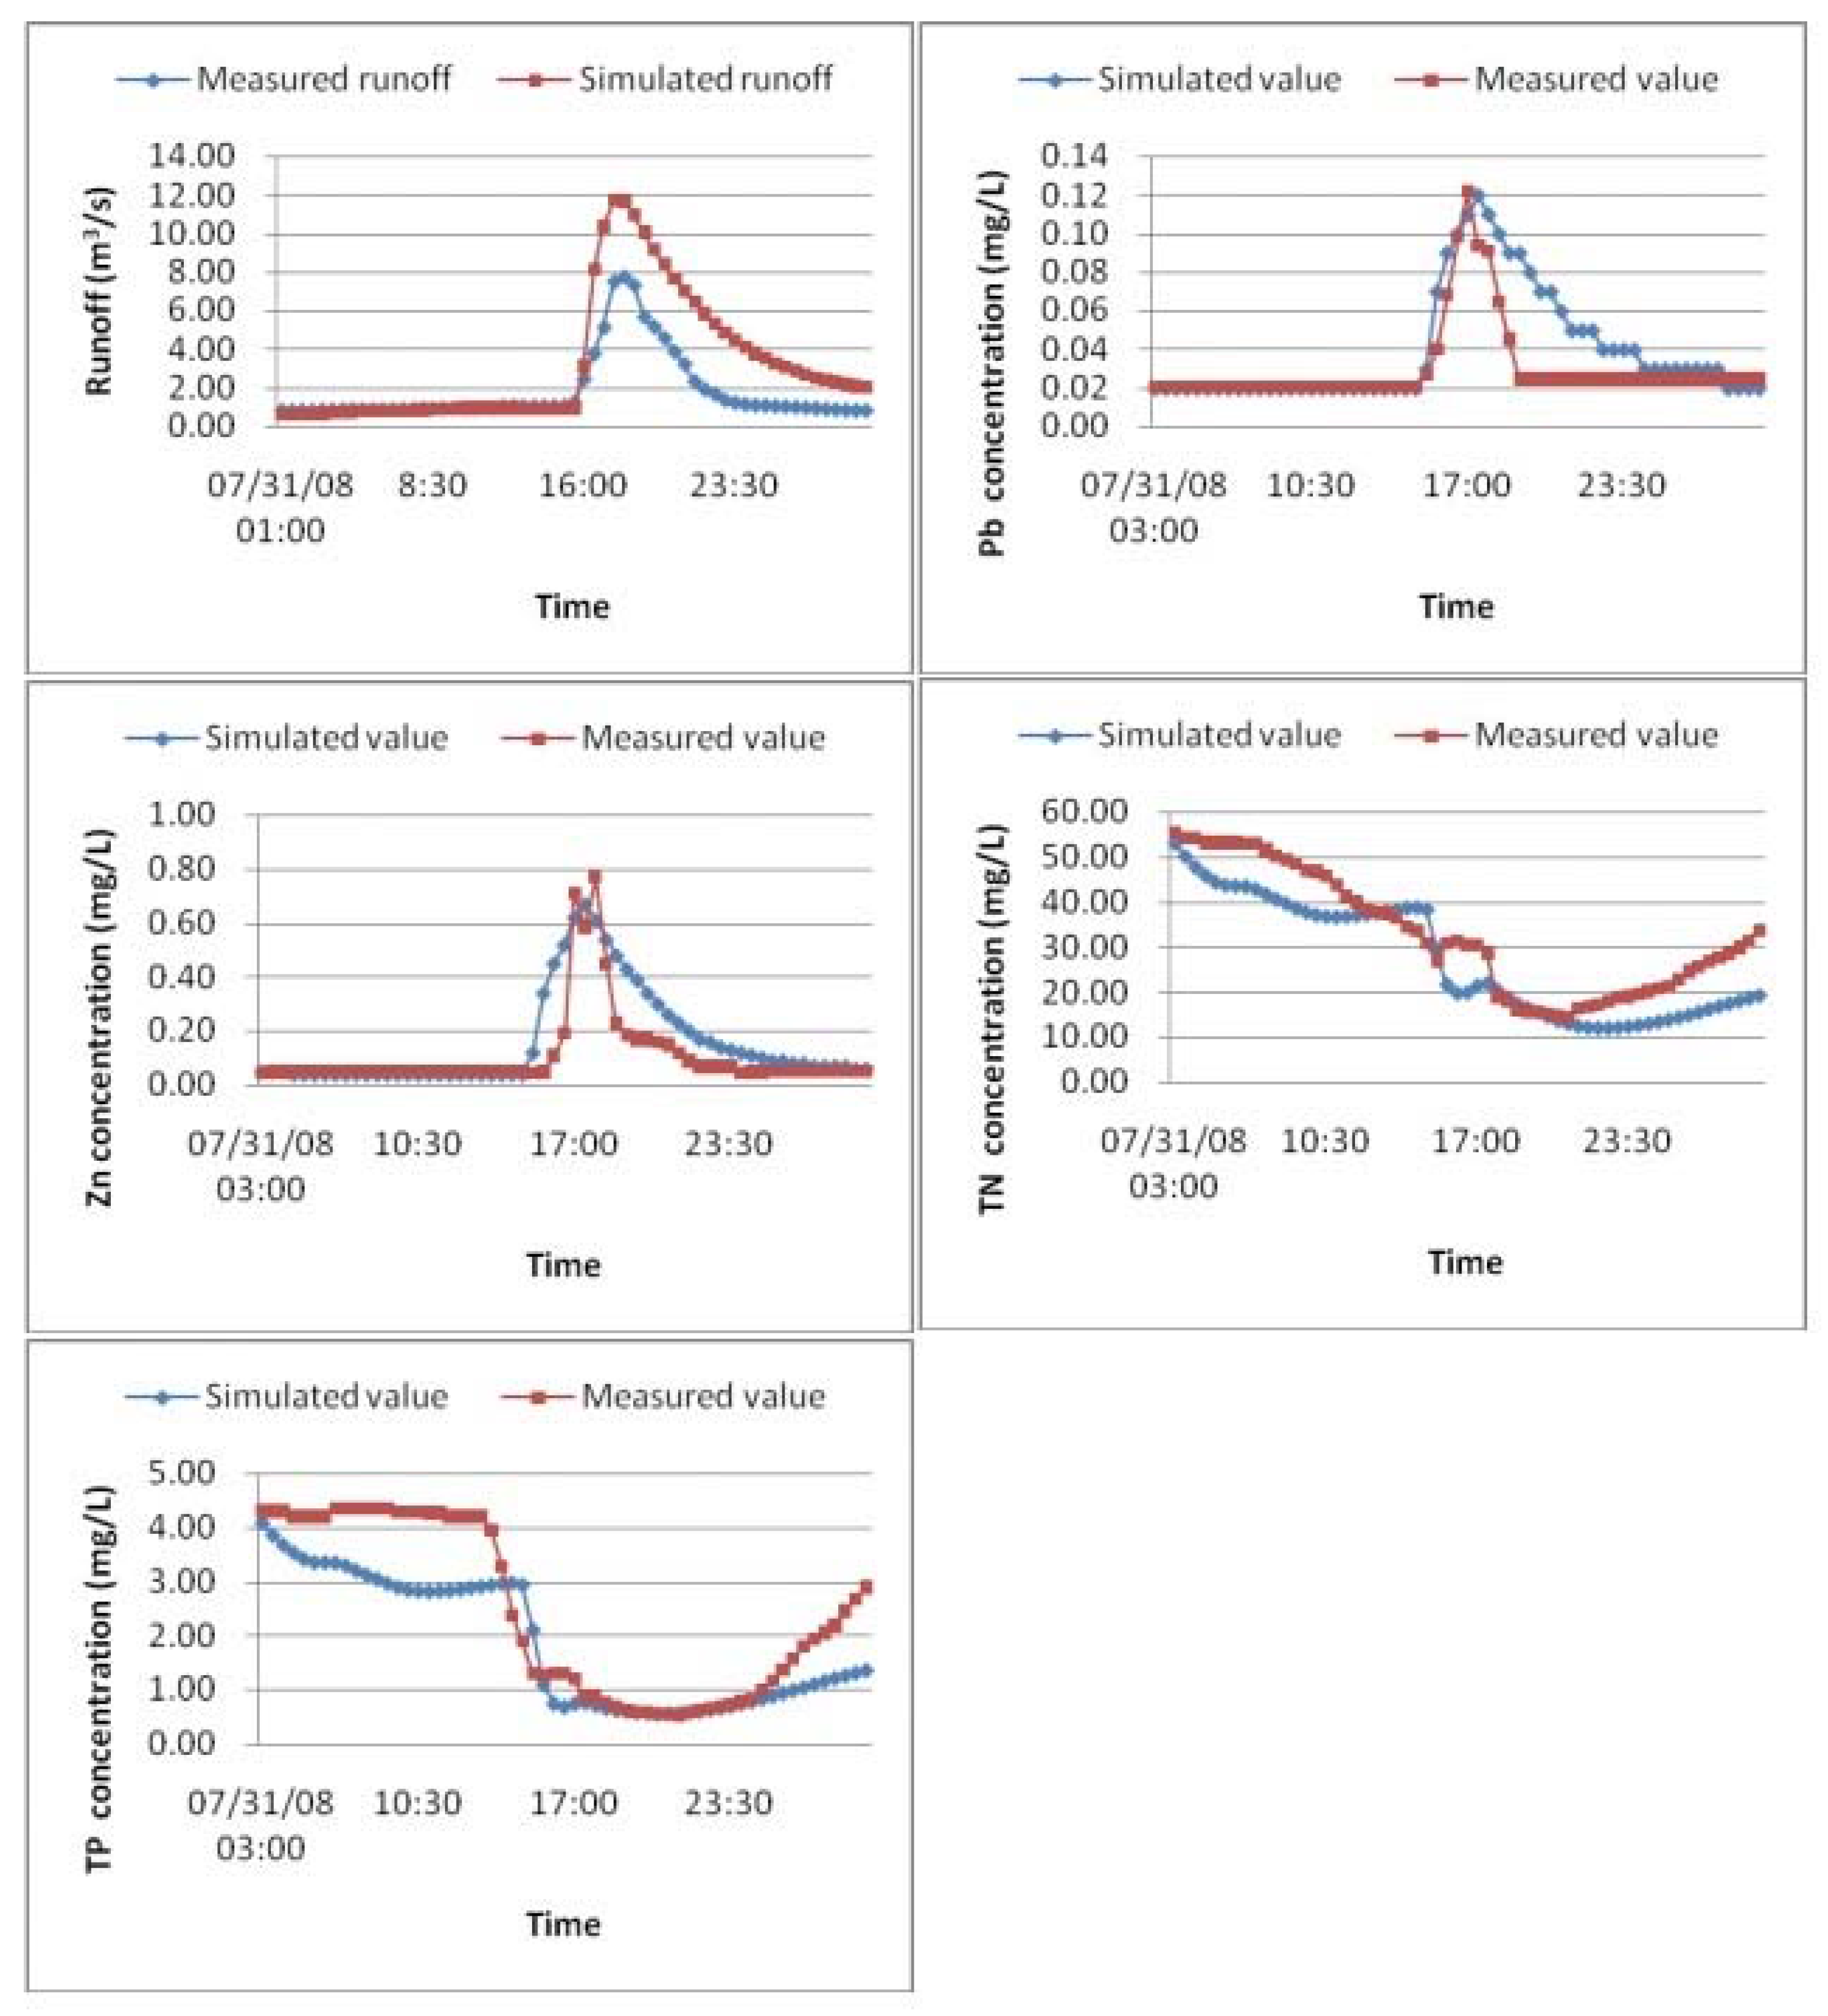
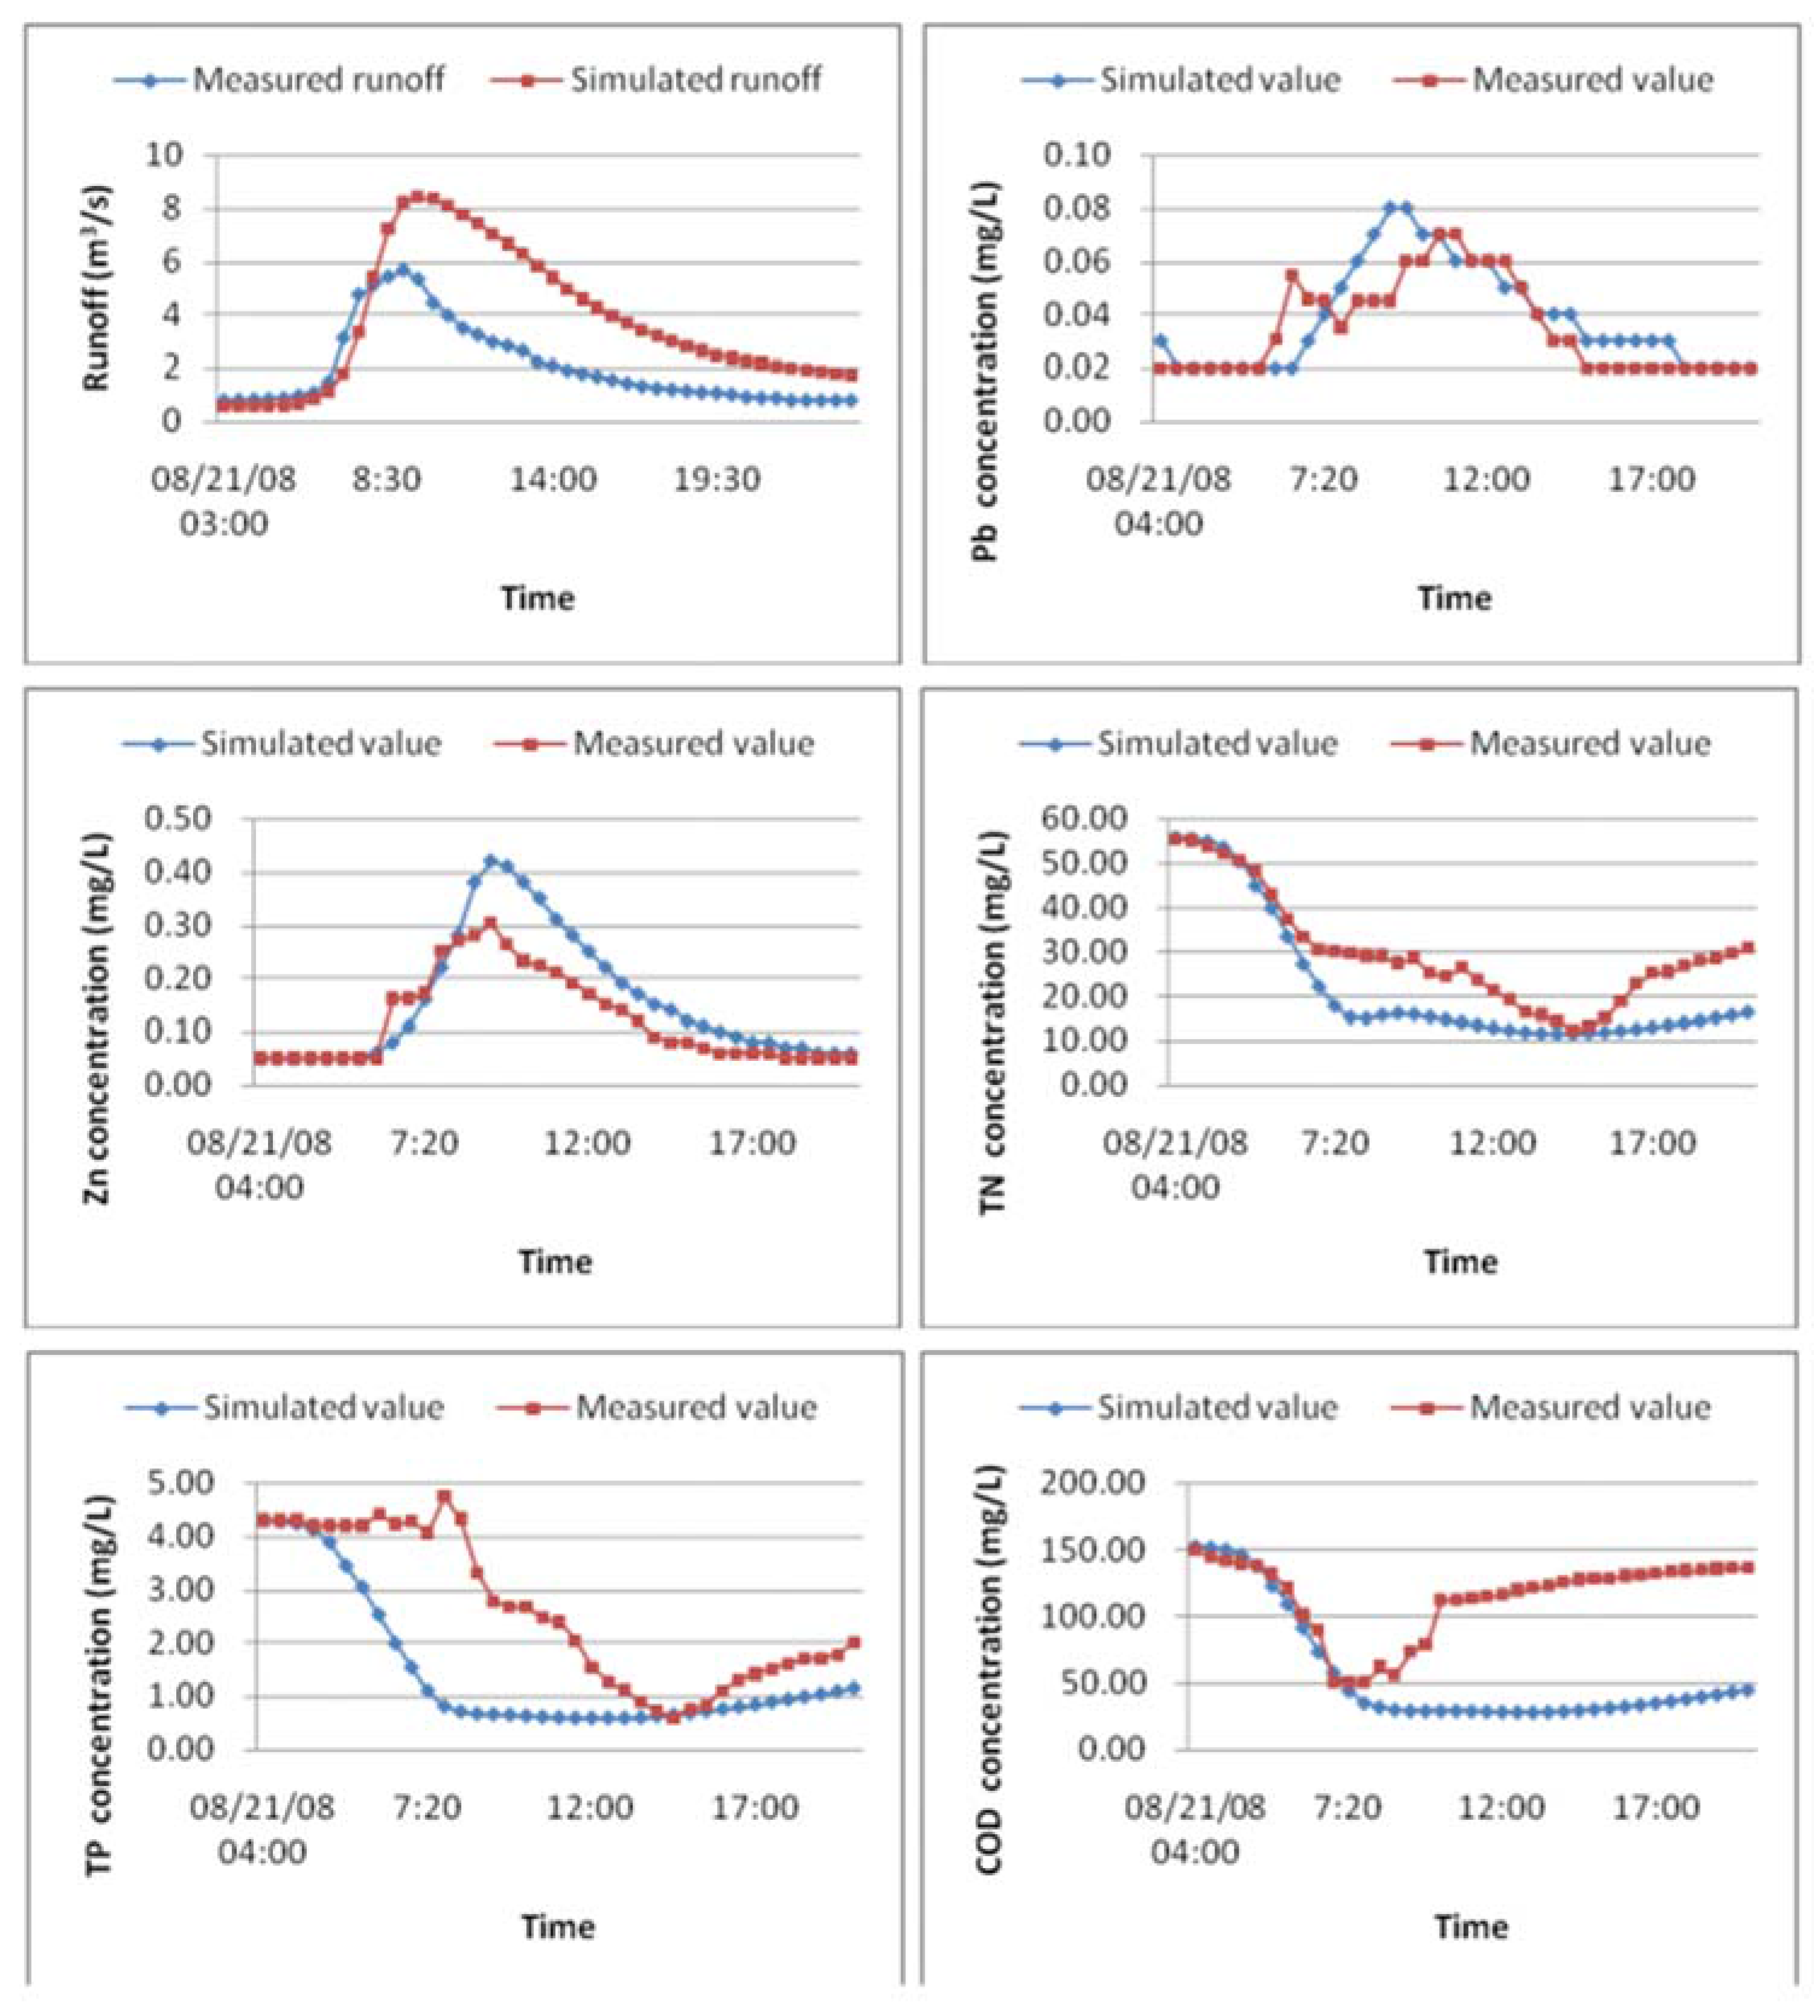
The hydrology, hydraulic, and water quality parameters in SWMM were calibrated by using rainfall data from 31 July 2008 (07312008) and 21 August 2008 (08212008). The rainfall amount was nearly identical but had different characteristics. The total rainfall on 07312008 was 25.6 mm, but only lasted for approximately 2 h and had a high rainfall intensity. The total rainfall amount on 08212008 was 25.4 mm, lasted for approximately 7 h, but had a much lower rainfall intensity. Therefore, these two rainfall events were well suited to represent rainfall and could be used to calibrate the SWMM model for Baoding City. First, the SWMM parameters were established by using measured parameters and the empirical coefficient, and then the parameters were adjusted manually until the simulated results agreed well with the measured results. Based on the parameter sensitivity analysis, the parameter calibration mainly focused on parameters with relatively high sensitivity, while parameters with low sensitivity were adjusted roughly or the empirical coefficient was used directly. We used trial and error for adjustments and there was a good fit for the quantity and quality curves between the simulated and the measured processes. The results are shown in Figure 6 and Figure 7. The simulated water quality process line of 07312008 rainfall and 08102008 rainstorm fit well with the measured water quality process line, but the simulated water quality process line of 08212008 did not fit well.
3.1.2. Model Validation
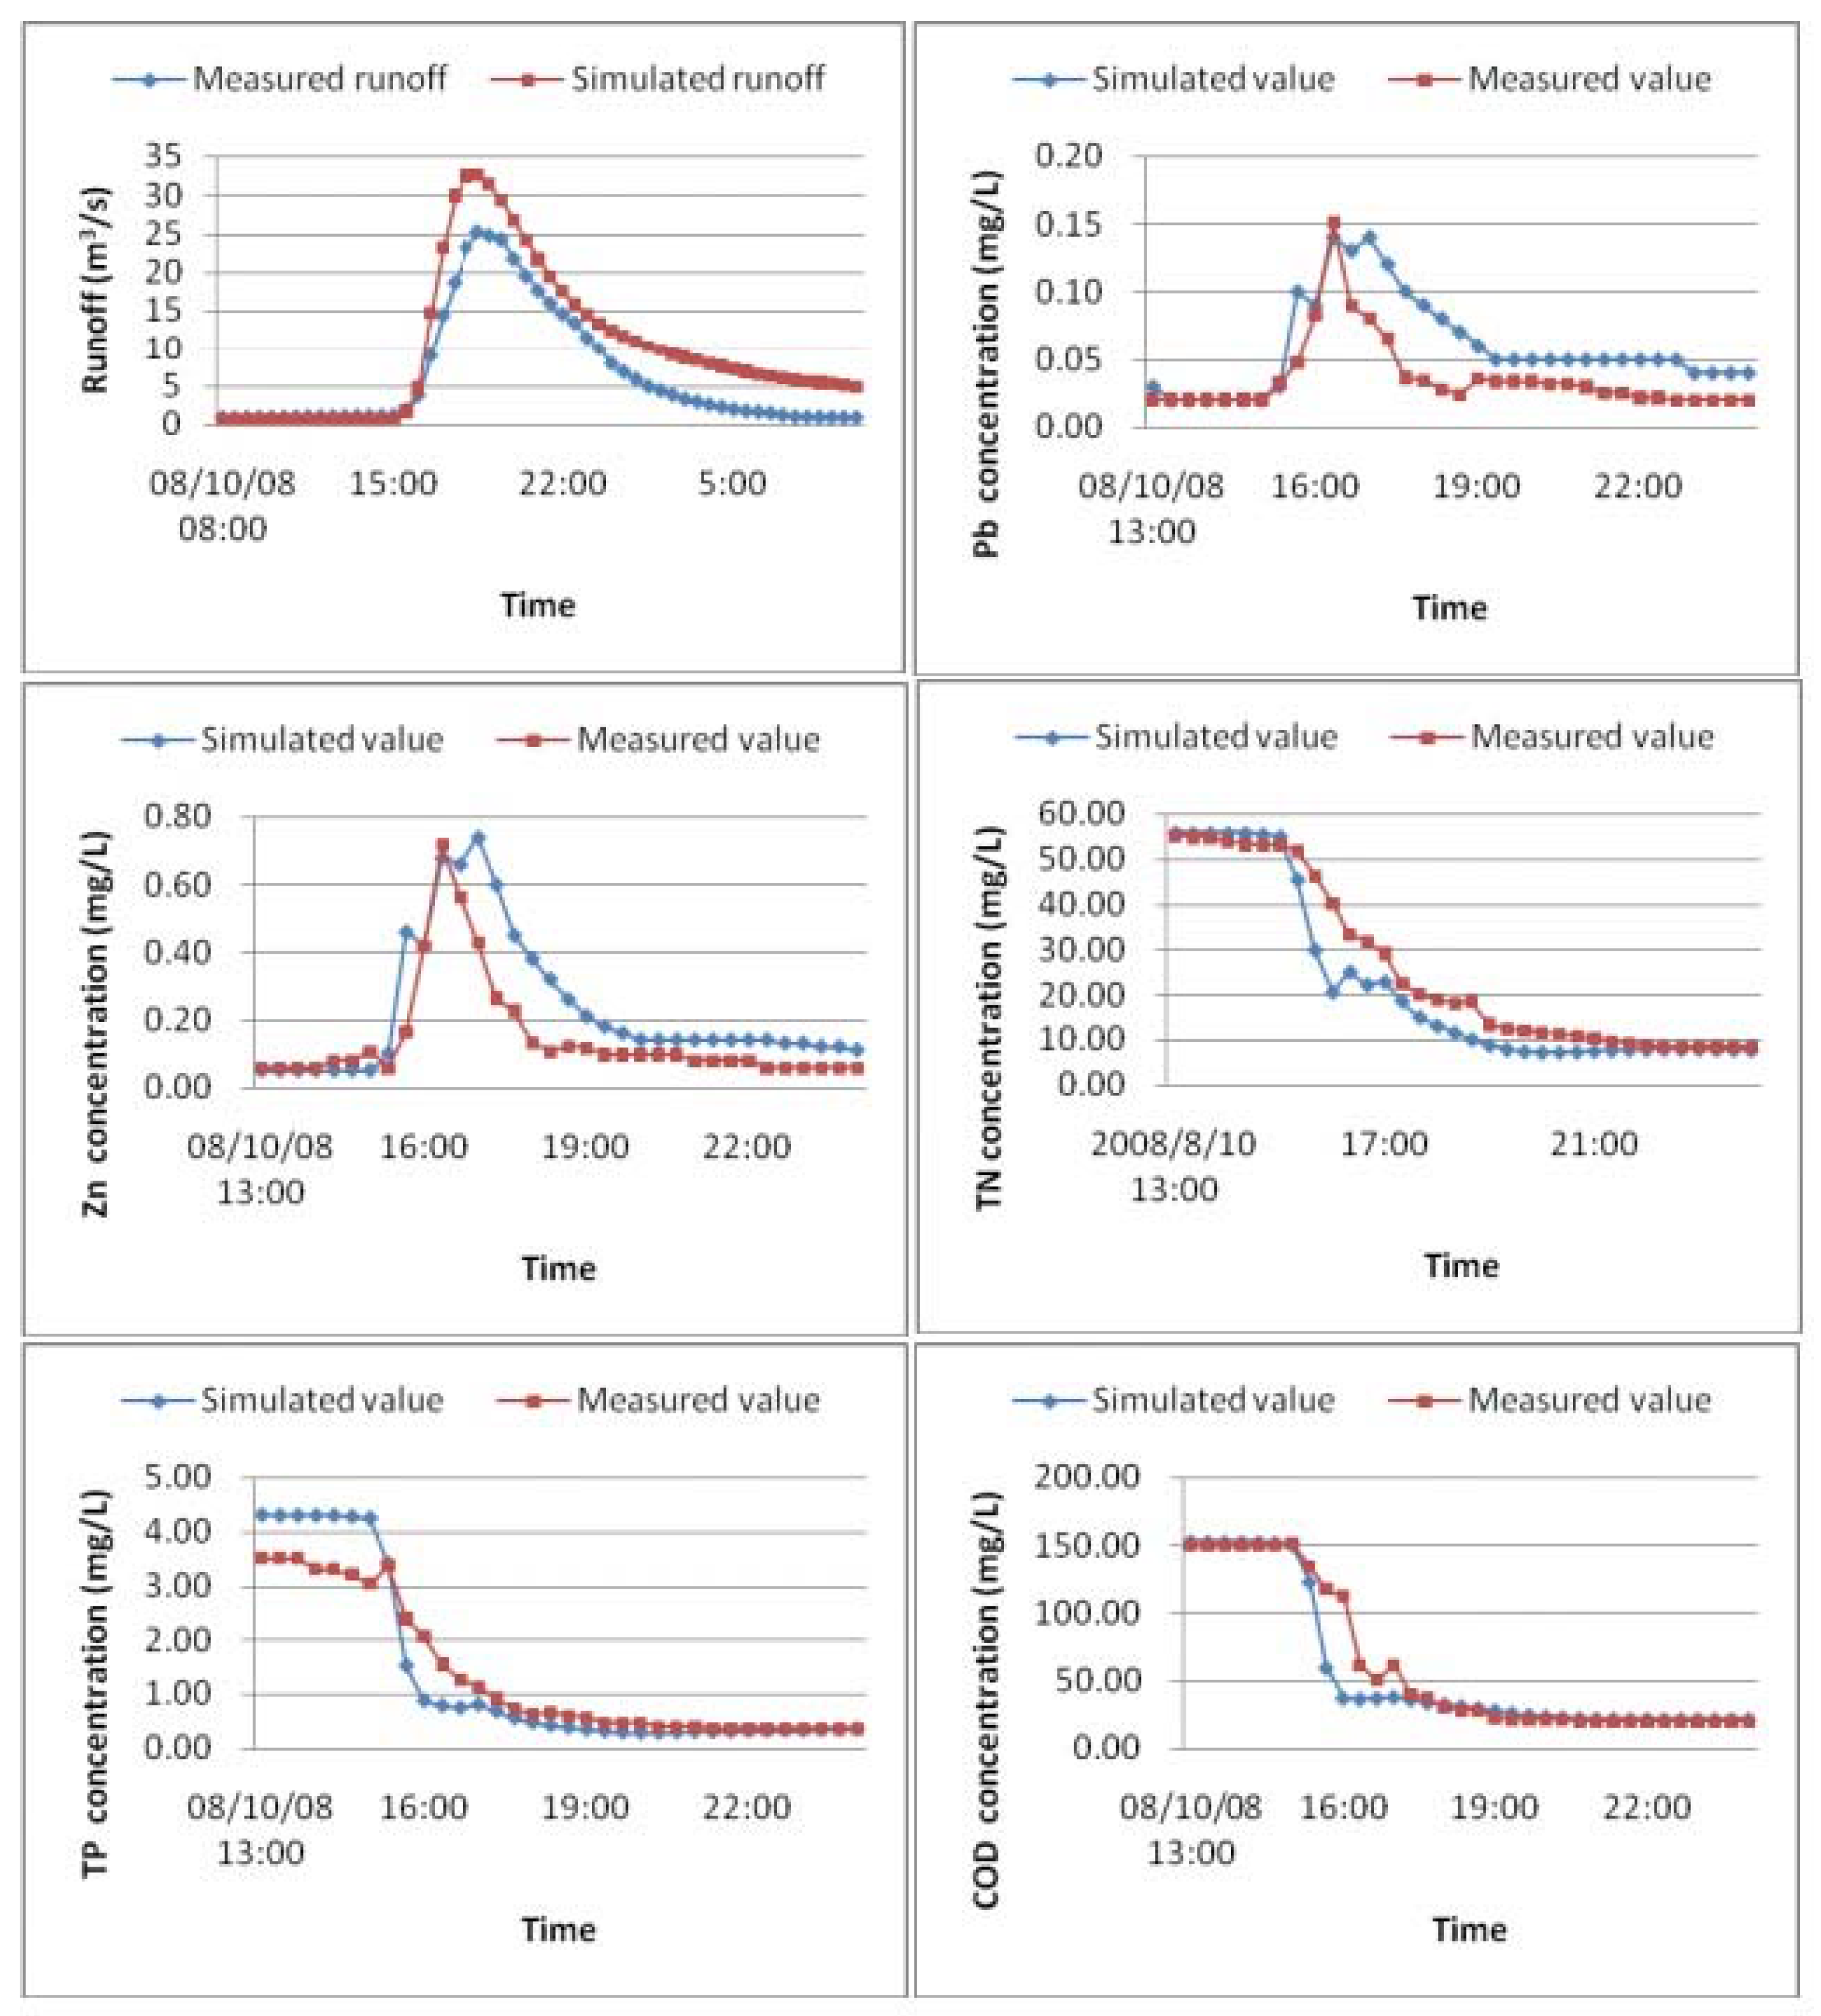
The rainfall-runoff data from 10 August 2008 (08102008) was used to validate the simulated results of the SWMM output, which was based on the calibrated data. The total rainfall on 08102008 was 92.6 mm, lasted approximately seven hours and was the strongest rainstorm that occurred from July to September 2008. The curves of measured and simulated runoff and water quality are shown in Figure 8.
The relative error (RE) between the mean value of the measured data and the corresponding simulation data is used to test the goodness-of-fit.
3.2. Error Analysis
3.2.1. Runoff
We obtained a good fit for the simulated and measured hydrograph data for the Jiaozhuang section, but the simulated peak runoff volume was higher than the measured peak runoff volume by about 30%, and the simulated peak runoff occurred about 30 min prior to the measured peak runoff. However, the rate of decrease in the simulated peak runoff was also slower than the measured peak runoff. Moreover, there were certain differences between simulated and measured runoff volume (Table 5). In the middle sub-watershed of Baoding City, rainwater flowed into the Yindingzhuang sewage plant and, therefore, the volume was 80,000–100,000 cubic meters. By adding this portion of the runoff to the other runoff data, the relative error of the SWMM results was acceptable. The calibrated relative error (RE*) is shown in Table 5.
3.2.2. Rainfall Runoff Coefficient
Based on the integrated rainfall-runoff coefficient point, the rainfall-runoff coefficients on 07312008, 08212008, and 08102008 were 0.376, 0.337, and 0.653, respectively, which was consistent with the empirical rainfall-runoff coefficient values (0.3–0.7) of Baoding City (Section 4 and Table S4 in the ESI).
3.2.3. Water Quality
With regard to the water quality simulation, the results indicated that there was a better fit for the simulated and measured water quality hydrograph data for 07312008 and 08102008 than for 08212008. In the three simulation processes, the heavy metals Pb and Zn exhibited peak values, and the simulated peak values and times of occurrence were consistent with the measured values and times, indicating that the simulations for Pb and Zn were successful. However, concentrations of TN, TP, and COD did not exhibit peak values. The concentrations of the three elements decreased during the rainfall-runoff process and then gradually returned to levels seen prior to the rainfall-runoff event. The measured times of recovery for the TN, TP, and COD concentrations were earlier than the simulated times, especially for the rainfall event on 08212008. This was possibly due to the low rainfall intensity and short duration; consequently, the conditions were not ideal for simulating erosion processes, and poor simulation results were obtained. This was consistent with the results of the rainfall-runoff process that showed that the rate of decrease of the simulated runoff was longer than the measured time. This indicated that the SWMM model simulated water quality appropriately, especially for a rainfall with heavy intensity.
3.2.4. Continuity Errors
The continuity errors for the three rainfall-runoff simulations, including the calibration and validation periods, are shown in Table 6. The continuity error was lower for surface runoff and flow routing than for the simulation of water quality. Research has suggested that the continuity error should be less than 10% in SWMM [22]. The continuity error was acceptable for the simulation process in this research, except for slightly higher values for the simulation of water quality on 07312008.
3.3. Simulation Results
3.3.1. Simulation Results of 08102008 Storm Water Runoff
The results of the simulations for stormwater runoff on 08102008 are shown in Table 7 and are as follows: (1) the runoff and output of the total non-point source pollution load were higher for the northern and middle sub-watersheds than for the southern sub-watershed. This was not only due to the larger area of the northern and middle sub-watersheds compared to the southern sub-watershed, but also because the imperviousness was lower for the southern sub-watershed than for the other two sub-watersheds; (2) the overall stormwater runoff on 08102008 was 4.52 × 10⁶ m3, the average flow was 50.83 m3/s, and the maximum flow for the system was 136.48 m3/s; and 3) the output values for the non-point source pollution loads for Pb, Zn, TN, TP, and COD in the stormwater runoff on 08102008 were 145.50, 556.72, 29,412.84, 874.98 and 74,218.42 kg, respectively.
3.3.2. Simulation Results of 2008 Rainfall-Runoff
The results of the simulations for rainfall-runoff in 2008 are shown in Table 8. The annual rainfall in 2008 was 564.3 mm, and the rainfall from June to September was 451 mm, which accounted for 80% of the total annual rainfall. The simulation started on 1 January 2008, and ended on 31 December 2008. Winter snowmelt runoff was not taken into account in the simulation. The infiltration losses were 103.48 mm, evaporation losses were 227.81 mm, and surface runoff was 233.39 mm. Furthermore, the rainfall-runoff coefficient was 0.414 and the continuity error was −0.068%.
The annual rainfall-runoff in 2008 was 48.13 × 10⁶ m3, the average flow was 1.53 m3/s, and the maximum flow for the system was 41.81 m3/s. The total runoff of the middle sub-watershed was 31.16 × 10⁶ m3, which accounted for 60% of the total annual runoff. This was due to the location of the middle sub-watershed in the center of the city in an area of high imperviousness. For the 2008 rainfall-runoff, the annual output of the non-point source pollution loads for total Pb, Zn, TN, TP, and COD was 852.0 kg, 2362.8 kg, 1,123,163 kg, 82,819 kg, and 3,116,086 kg respectively. The pollution load of the middle sub-watershed accounted for 80% of those values. Furthermore, the pollution load for TN and TP of the middle sub-watershed accounted for more than 90% of the total due to an average imperviousness of as much as 85% for the central city, which was conducive to rainfall-runoff generation. Another reason was the growth of inflow during dry season mainly generated in the middle sub-watershed.
3.4. Influence of Non-Point Source Pollution from Baoding City on Baiyangdian Lake
3.4.1. Analysis of Non-Point Source Pollution Load in Baoding City
The total discharge and non-point source pollution loads of the rainstorm and annual rainfall processes in Baoding City are shown in Table 9. The total discharge of a single storm on 20080810 was 4.52 ×10⁶ m3, and the output of the non-point source pollution load of the total Pb, Zn, TN, TP, and COD was 145.5 kg, 556.7 kg, 29,412.8 kg, 875 kg, and 74,218.4 kg, respectively. Without any Best Management Practices (BMPs), the total amounts of the output pollutants Pb, Zn, TN, TP, and COD were almost doubled. With street-sweeping and other BMPs, the total output of the pollution loads for Pb and Zn increased by more than 50%, while TN, TP, and COD approximately doubled in value. The removal efficiency of BMPs to Pb and Zn was approximately 10%, while for TN, TP, and COD, the removal efficiency was only about 1%, demonstrating that BMPs had a positive influence on the control of the non-point source pollution load in the basin.
3.4.2. Reduction of Pollutants along the Fuhe River
The sewage and stormwater discharge from Baoding City through the city’s drainage network and eventually pass through the Fuhe River into Baiyangdian Lake (Figure 1 and Figure 2), which is located approximately 45 km away. This small flow of sewage from Baoding City to Baiyangdian Lake requires about two days, while a storm flood with large velocity requires about 5 h [28]. During this time, major pollutants are degraded and reduced.
Based on a study of COD reduction along the Fuhe River [36,37] and Equation (7), the value for k is 0.5 day−1 and u = 22.5 km/day Section 5 in the ESI). The coefficients were verified by using the measured data shown in Table 10, and Equation (6) was well-suited to simulate the process of the longitudinal attenuation of COD.
3.4.3. Effects on the Water Environment of Baiyangdian Lake
There were seven sample locations for water quality monitoring in Baiyangdian Lake (Figure 1), and the results are shown in Table 11.
The total discharge and the point and non-point source pollution load in the Jiaozhuang section of Baoding City are shown in Table 12. The input concentration of Pb, TN, and TP from the storm runoff on 08102008 was two times, 3.8 times, and 2.1 times higher, respectively, than the average concentration in Baiyangdian Lake.
As rainfall-runoff and industrial sewage moves from Baoding City from the cross section into Baiyangdian Lake, and water losses occur along the way, including evaporation loss, river leakage loss, and loss due to agricultural irrigation. The pollutant load of rainfall-runoff input Baiyangdian Lake from Baoding City was deducted due to the losses of water along the way. The mean annual losses account for 40% of total water volume. If only river leakage losses are considered for a single rainstorm event, the leakage loss accounts for 15% of the total runoff. During the 10 years from 1998 to 2008, the growth in the non-point source pollution loads for Pb, Zn, TN, TP, and COD were 178.6 kg, 481.2 kg, 134,539.6 kg, 7866 kg, and 330,784.6 kg, respectively. The non-point source pollution load input accounted for the proportion of total pollution load input also increased.
4. Conclusions
In this paper, a simulation model for non-point source pollution of Baoding City was developed based on SWMM. Two typical measured rainfall-runoff processes on 07312008 and 08212008 were used to calibrate hydraulic and hydrological parameters of SWMM using trial and error for debugging. After the calibration of the model simulation error can be controlled within −36.6% to −11.4%, the actual process and the simulation process have achieved good fitting effect. The fit between measured and simulated processes was good, demonstrating that the model calibration was successful. The simulation results showed that a typical rainstorm on 08102008 produced a total runoff of 4.52 × 10⁶ m3, and the non-point source pollution loads for Pb, Zn, TN, TP, and COD were 145.50, 556.72, 29,412.84, 874.98 and 74,218.42 kg, respectively.
The annual rainfall-runoff volume in 2008 was 48.13 × 10⁶ m3, and the total runoff of the pipe network was 31.16 × 10⁶ m3, which accounted for 60% of the total annual runoff. The annual non-point source pollution loads for Pb, Zn, TN, TP, and COD were 852.0 kg, 2362.8 kg, 1,123,163 kg, 82,819 kg, and 3,116,086 kg, respectively, and the pollution load of the pipe network accounted for about 80% of those values.
The one-dimensional water quality model was applied in the research, the simulation results showed that the average concentration of TN and TP of the annual rainfall-runoff was about 10 times higher than that of Baiyangdian Lake. The input water for rainfall-runoff was 20.72 × 10⁶ m3 in 1998, accounting for 43% of the total amount of rain and sewage in Baoding City. The non-point source pollution loads for Pb, Zn, TN, TP, and COD were 332.6 kg, 936.5 kg, 341,866.4 kg, 19,868.7 kg, and 356,833.7 kg, respectively. The rainfall-runoff water input was 28.88 × 10⁶ m3 in 2008, accounting for 45% of the total amount of rain and sewage. The non-point pollution loads for Pb, Zn, TN, TP, and COD were 511.2 kg, 476,406.0 kg, 1,417.7 kg, 27,734.7 kg, and 687,618.3 kg, respectively. From 1998–2008, the total input of the non-point source pollution load for rainfall-runoff in Baoding City has increased, and the annual input accounted for about 30% of the total amount of pollutant load.
Based on the simulation results of non-point source pollution, applicable control measures for non-point source pollution especially for Baoding City would be taken, such as urban rainwater and flood resources utilization and Best Management Practices (BMPs) for urban non-point source pollution control, which including engineering and non-engineering measures. In future research, the control measures can be enhanced for floods control and pollutant reduction. In this way, the research would be more practical guidance.
Our monitoring data is limited by the lack of long-term monitoring, the use of only three sets of data, two used to calibrate and the other one to validate the model, these can meet the requests of model calibration and validation at a basic level, and the result of this study has its limitations. Further research will be needed to improve this study.
Supplementary Materials
The following are available online at https://0-www-mdpi-com.brum.beds.ac.uk/2073-4441/9/4/249.
Acknowledgments
This research was supported by National key research and development program (2016YFC0401302). We would like to extend special thanks to the editor and the anonymous reviewers for their valuable comments in greatly improving the quality of this paper.
Author Contributions
Fen Zhao and Xiaokang Zheng conceived and designed the experiments; Chunhui Li performed the experiments; Xuan Wang and Yanpeng Cai analyzed the data; Nan Zhang contributed reagents/materials/analysis tools; Chunhui Li wrote the paper.
Conflicts of Interest
The authors declare no conflict of interest.
References
- Schueler, T.R. The importance of imperviousness. Watershed Prot. Tech. 1994, 1, 100–111. [Google Scholar]
- Leopold, L.B. Hydrology for Urban Land Planning—A Guidebook on the Hydrologic Effects of Urban Land Use; USGS Circular: Menlo Park, CA, USA, 1968; p. 554.
- Paul, M.J.; Meyer, J.L. Stream in the Urban Landscape. Annu. Rev. Ecol. Syst. 2001, 32, 333–365. [Google Scholar] [CrossRef]
- Fischer, D.; Charles, E.G.; Baehr, A.L. Effects of stormwater infiltration on quality of groundwater beneath Retention Basins. J. Environ. Eng. 2003, 129, 464–471. [Google Scholar] [CrossRef]
- Akhter, M.S.; Madany, I.M. Heavy metals in street and house dust in Bahrain. Water Air Soil Pollut. 1993, 66, 111–119. [Google Scholar] [CrossRef]
- Kelly, J.; Thornton, I.; Simpson, P.R. Urban Geochemistry: A study of the influence of anthropogenic activity on the heavy metal content of soils in traditionally industrial and non-industrial areas of Britain. Appl. Geochem. 1996, 11, 363–370. [Google Scholar] [CrossRef]
- Deletic, A.B.; Maksimovic, C.T. Evaluation of water quality factors in storm runoff from paved areas. J. Environ. Eng. 1998, 124, 869–879. [Google Scholar] [CrossRef]
- Novotny, V. Urban diffuse pollution: Sources and abatement. Water Environ. Technol. 1991, 12, 60–65. [Google Scholar]
- U.S. EPA. Meeting the Environmental Challenge. In EPA’s Review of Progress and New Directions in Environmental Protection; United States (U.S.) Environmental Protection Agency (EPA): Washington, DC, USA, 1990; p. 26. [Google Scholar]
- Dinius, S.H. Design of an index of water quality. Water Resour. Bull. 1987, 23, 833–843. [Google Scholar] [CrossRef]
- Whipple, W.; Grigg, S.; Gizzard, T. Stormwater Management in Urbanizing Areas; Prentice-Hall: Englewood Cliffs, NJ, USA, 1983. [Google Scholar]
- Chapman, D. Water Quality Assessments: A Guide to the Use of Biota, Sediments and Water in Environmental Monitoring; Chapman Hall: London, UK, 1992. [Google Scholar]
- Han, Y.M.; Du, P.X.; Cao, J.J.; Posmentier, E.S. Multivariate analysis of heavy metal contamination in urban dusts of Xi’an, Central China. Sci. Total Environ. 2006, 355, 176–186. [Google Scholar]
- Qi, J.Y. Quantity Study on Non-Point Source Pollution of City; HoHai University: Nanjing, China, 2005. [Google Scholar]
- Choi, K.S.; Ball, J.E. Parameter estimation for urban runoff modelling. Urban Water J. 2002, 4, 31–41. [Google Scholar] [CrossRef]
- Liu, Y.; Puripus, S.; Li, J.; Christensen, E.R. Stormwater Runoff Characterized by GIS Determined Source Areas and Runoff Volumes. Environ. Manag. 2011, 47, 201–204. [Google Scholar] [CrossRef] [PubMed]
- Barbosa, A.E.; Fernandes, J.N.; David, L.M. Key issues for sustainable urban stormwater management. Water Res. 2012, 46, 6787–6790. [Google Scholar] [CrossRef] [PubMed]
- Metcalf, Eddy, Inc.; University of Florida; Water Resources Engineers, Inc. Storm Water Management Model, Version I: Final Report; Report 11024DOC07/71(NTIS PB-203289); Environmental Protection Agency (EPA): Washington, DC, USA, 1971. [Google Scholar]
- Hydrologic Engineering Center. Storage, Treatment, Overflow, Runoff Model, STORM, Generalized Computer Program 723–58-L7520; Hydrologic Engineering Center, US Corps of Engineers: Davis, CA, USA, 1977. [Google Scholar]
- Corbett, C.W.; Matthew, W.; Dwayne, E.P. Non-point source runoff modeling: A comparison of a forested watershed and an urban watershed on the South Carolina coast. J. Exp. Mar. Biol. Ecol. 1997, 213, 133–149. [Google Scholar] [CrossRef]
- Huber, W.C.; Dickinson, R.E. Storm Water Management Model, Version 4: User’s Manual; EPA/600/3–88/001a; Environmental Research Laboratory, U.S. Environmental Protection Agency: Athens, GA, USA, 1992.
- Rossman, L.A. Storm Water Management Model User’s Manual, Version 5.0; National Risk Management Research Laboratory, Office of Research and Development, US Environmental Protection Agency: Cincinnati, OH, USA, 2010.
- Peterson, E.W.; Wicks, C.M. Assessing the importance of conduit geometry and physical parameters in karst systems using the storm water management model (SWMM). J. Hydrol. 2006, 329, 294–305. [Google Scholar] [CrossRef]
- Wang, H.C.; Du, P.F.; Zhao, D.Q.; Wang, H.Z.; Li, Z.Y. Global sensitivity analysis for urban rainfall-runoff model. China Environ. Sci. 2008, 28, 725–729. [Google Scholar]
- Francos, A. Sensitivity analysis of distributed environmental simulation models: Understanding the model behavior in hydrological studies at the catchment scale. Reliab. Eng. Syst. Saf. 2003, 79, 205–206. [Google Scholar] [CrossRef]
- Huang, J.L.; Du, P.F.; He, W.Q.; Ao, Z.D.; Wang, H.C.; Wang, Z.S. Local sensitivity analysis for urban rainfall-runoff modeling. China Environ. Sci. 2007, 27, 549–555. [Google Scholar]
- Wang, F.; Wang, X.; Zhao, Y.; Yang, Z.F. Long-term periodic structure and seasonal-trend decomposition of water level in Lake Baiyangdian, Northern China. Int. J. Environ. Sci. Technol. 2014, 11, 327–338. [Google Scholar] [CrossRef]
- Zheng, X.K. Simulation of Non-Point Source Pollution in Baoding City and Its Effects on Baiyangdian Lake; Beijing Normal University: Beijing, China, 2009. [Google Scholar]
- Di Modugno, M.; Gioia, A.; Gorgoglione, A.; Iacobellis, V.; la Forgia, G.; Piccinni, A.F.; Ranieri, E. Build-Up/Wash-Off Monitoring and Assessment for Sustainable Management of First Flush in an Urban Area. Sustainability 2015, 7, 5050–5067. [Google Scholar] [CrossRef]
- Zhuang, C.; Ouyang, Z.; Xu, W.; Bai, Y.; Zhou, W.; Zheng, H.; Wang, X.K. Impacts of human activities on the hydrology of Baiyangdian Lake, China. Environ. Earth Sci. 2011, 62, 1343–1350. [Google Scholar] [CrossRef]
- Punam, P.; Michael, A.; Taylor, L. Application of market mechanisms and incentives to reduce stotmwater runoff. Environ. Sci. Policy 2004, 8, 133–144. [Google Scholar]
- Morquecho, R.; Pitt, R. Pollutant associations with particulates in stormwater. In Proceedings of the World Water and Environmental Resources Congress, Anchorage, AK, USA, 15–19 May 2005; pp. 4973–4999. [Google Scholar]
- Huang, G.R.; Nie, T. Characteristics and load of non-point source pollution of urban rainfall-runoff in Guangzhou, China. J. South China Univ. Technol. 2012, 40, 142–148. [Google Scholar]
- Zhou, Q.; Ren, Y.; Xu, M.; Han, N.; Wang, H. Adaptation to urbanization impacts on drainage in the city of Hohhot, China. Water Sci. Technol. 2016, 73, 167–175. [Google Scholar] [CrossRef] [PubMed]
- Lee, S.B.; Yoon, C.G.; Jung, K.W. Comparative evaluation of runoff and water quality using HSPF and SWMM. Water Sci. Technol. 2010, 62, 1401–1409. [Google Scholar] [CrossRef] [PubMed]
- Li, Y.X.; Ma, J.H.; Yang, Z.F. Influence of non-point source pollution on water quality of wetland Baiyangdian, China. Desalinat. Water Treat. 2011, 32, 291–296. [Google Scholar] [CrossRef]
- Qiu, R.Z.; Li, Y.X.; Yang, Z.F. Influence of water quality change in Fu River on Wetland Baiyangdian. Front. Earth Sci. China 2009, 3, 397–401. [Google Scholar] [CrossRef]
Figure 1.
Monitoring sections location in Baiyangdian Lake.

Figure 2.
Diagram of the technical route.

Figure 3.
Drainage system diagram of Baoding City.

Figure 4.
Drainage system generalization of Baoding City.

Figure 5.
Sub-catchment diagram of Baoding City.

Figure 6.
Measured and simulated hydrograph of rainfall-runoff and water quality of 07312008 on Jiaozhuang section.
Figure 6.
Measured and simulated hydrograph of rainfall-runoff and water quality of 07312008 on Jiaozhuang section.

Figure 7.
Measured and simulated hydrograph of rainfall-runoff and water quality of 08212008 on Jiaozhuang section.
Figure 7.
Measured and simulated hydrograph of rainfall-runoff and water quality of 08212008 on Jiaozhuang section.

Figure 8.
Measured and simulated hydrograph of rainfall-runoff and water quality of 08102008 on Jiaozhuang section.
Figure 8.
Measured and simulated hydrograph of rainfall-runoff and water quality of 08102008 on Jiaozhuang section.


Table 1.
Major hydrological, hydraulic parameters of Stormwater Management Model (SWMM) and their range and obtain methods.
Table 1.
Major hydrological, hydraulic parameters of Stormwater Management Model (SWMM) and their range and obtain methods.
| NO. | Parameter | Meaning | Data Range | Data Source |
|---|---|---|---|---|
| 1 | Manning-N | Manning coefficient of Pipe | 0.005~0.04 | SWMM handbook |
| 2 | N-Imperv | Mannings N of impervious area | 0.005~0.04 | field survey, SWMM handbook |
| 3 | N-perv | Mannings N of pervious area | 0.1~0.8 | field survey, SWMM handbook |
| 4 | S-Imperv | Depression storage on impervious area | 0.2~2 (mm) | field survey, SWMM handbook |
| 5 | S-perv | Depression storage on pervious area | 2~10 (mm) | field survey, SWMM handbook |
| 6 | Pct-Zero | Percent of impervious area with no depression storage | 50~80 (%) | field survey, SWMM handbook |
| 7 | MaxRate | Maximum rate on infiltration curve | 3~50 (mm/h) | SWMM handbook |
| 8 | MinRate | Minimum rate on infiltration curve | 1~3 (mm/h) | SWMM handbook |
| 9 | Decay | Decay constant for infiltration curve | 2~7 | SWMM handbook |
| 10 | Imperv (%) | Percent of impervious area | 10~90 (%) | field survey, Google Earth |
| 11 | Width | Width of overland flow path | depends on the area of sub-catchment | GIS |
| 12 | Slope | Average surface slope (%) | 0.1~2 (%) | GIS |
Table 2.
Maximum accumulation quantity of pollutants on different land use types kg/hm2.
| Area | COD | TN | TP | Pb | Zn |
|---|---|---|---|---|---|
| Commercial area | 46 | 15.6 | 0.64 | 0.12 | 0.62 |
| Residential area | 58 | 8.6 | 0.24 | 0.056 | 0.22 |
| Industrial area | 43 | 10.3 | 0.38 | 0.12 | 0.22 |
| Green area | 20 | 14.5 | 0.17 | 0.045 | 0.11 |
Table 3.
Wash off parameters of pollutants on different land use types.
| Area | Parameter | COD | TN | TP | Pb | Zn |
|---|---|---|---|---|---|---|
| Commercial area | wash off coefficient | 0.003 | 0.004 | 0.004 | 0.004 | 0.004 |
| wash off exponent | 1.4 | 1.8 | 1.7 | 1.7 | 1.8 | |
| Residential area | wash off coefficient | 0.003 | 0.004 | 0.002 | 0.004 | 0.004 |
| wash off exponent | 1.4 | 1.8 | 1.7 | 1.7 | 1.8 | |
| Industrial area | wash off coefficient | 0.003 | 0.004 | 0.004 | 0.004 | 0.004 |
| wash off exponent | 1.4 | 1.8 | 1.7 | 1.7 | 1.8 | |
| Green area | wash off coefficient | 0.003 | 0.002 | 0.001 | 0.001 | 0.001 |
| wash off exponent | 1.2 | 1.4 | 1.2 | 1.2 | 1.2 |
Table 4.
Sensitivity ranking of hydraulic and hydrological parameters in SWMM.
| Runoff Factor | 1 | 2 | 3 | 4 | 5 |
|---|---|---|---|---|---|
| Runoff Coefficient | Imperv(%) | S-Imperv | Pct-Zero | N-Imperv | Width |
| Peak Discharge | Imperv(%) | S-Imperv | N-Imperv | Width | Pct-Zero |
| Peak Discharge Time | Manning-N | N-Imperv | S-Imperv | Width | Pct-Zero |
Table 5.
Simulated runoff volume and measured runoff volume on Jiaozhuang section.
| Analysis Period | Rain Time | Rainfall (mm) | Simulated Runoff Volume (104 m3) | Measured Runoff Volume (104 m3) | RE (%) | RE*(%) |
|---|---|---|---|---|---|---|
| Calibration Period | 07312008 | 25.6 | 33.40 | 18.87 | −77.0 | −24.3 ~ −15.7 |
| 08212008 | 25.4 | 28.83 | 15.87 | −81.6 | −20.8 ~ −11.4 | |
| Validation Period | 08102008 | 92.6 | 94.19 | 60.97 | −54.5 | −36.6 ~ −32.7 |
Table 6.
Continuity errors of simulation.
| Analysis Period | Rain Time | Surface Runoff | Flow Routing | Runoff Quality |
|---|---|---|---|---|
| Calibration period | 07312008 | −0.09% | −0.15% | 14.23% |
| 08212008 | −0.01% | −0.05% | 8.09% | |
| Validation period | 08102008 | −0.06% | −0.07% | 6.45% |
Table 7.
Runoff and output of total non-point source pollution load on export section of 08102008.
| Node | Average Runoff (m3/s) | Max. Runoff (m3/s) | Total Runoff (104 m3) | Output Non-Point Source Pollution Load (kg) | ||||
|---|---|---|---|---|---|---|---|---|
| Pb | Zn | TN | TP | COD | ||||
| Node_556 | 22.51 | 61.55 | 196.70 | 60.56 | 238.82 | 11453.24 | 224.75 | 27970.87 |
| Node_557 | 15.75 | 43.00 | 142.60 | 66.36 | 254.04 | 13425.89 | 595.08 | 35596.38 |
| Node_558 | 12.57 | 32.97 | 112.53 | 18.58 | 63.87 | 4533.71 | 55.15 | 10651.17 |
| System | 50.83 | 136.48 | 451.83 | 145.50 | 556.72 | 29412.84 | 874.98 | 74218.42 |
Table 8.
Runoff and output of total non-point source pollution load on export section of 2008.
| Node | Average Runoff (m3/s) | Max. Runoff (m3/s) | Total Runoff (104 m3) | Output Non-Point Source Pollution Load (kg) | ||||
|---|---|---|---|---|---|---|---|---|
| Pb | Zn | TN | TP | COD | ||||
| Node_556 | 0.38 | 18.48 | 1200.77 | 140.4 | 526.3 | 26127.3 | 523.7 | 91681.3 |
| Node_557 | 0.99 | 14.97 | 3116.06 | 682.2 | 1747.7 | 1089088 | 82203 | 2997034 |
| Node_558 | 0.16 | 8.6 | 496.30 | 29.4 | 88.9 | 7947.5 | 92.1 | 27371.1 |
| System | 1.53 | 41.81 | 4813.13 | 852.0 | 2362.8 | 1123163 | 82819 | 3116086 |
Table 9.
Total discharge and non-point source pollution load of Baoding City Basin.
| Rain Time | Rainfall (mm) | Total Discharge (104 m3) | BMPs | Output Non-Point Source Pollution Load (kg) | ||||
|---|---|---|---|---|---|---|---|---|
| Pb | Zn | TN | TP | COD | ||||
| 08102008 | 92.32 | 451.83 | N | 145.5 | 556.7 | 29,412.8 | 875.0 | 74,218.4 |
| 1998 | 514.8 | 3453.31 | N | 554.3 | 1560.9 | 591,187.1 | 41,738.1 | 1,616,665.4 |
| Y | 518.0 | 1416.9 | 584,777.5 | 41,563.7 | 1,595,238.3 | |||
| 2008 | 564.3 | 4813.13 | N | 852.0 | 2362.8 | 1,123,163.2 | 82,818.9 | 3,116,086.2 |
| Y | 797.2 | 2148.6 | 1,114,198.4 | 82,559.8 | 3,081,398.4 | |||
Table 10.
Pollutant concentration of the sections mg/L.
| Section | TN | TP | COD |
|---|---|---|---|
| Jiaozhuang | 49.33 | 2.34 | 97.75 |
| Wangting | 27.45 | 1.22 | 42.74 |
| Anzhou | 25.55 | 1.21 | 31.84 |
| Nanliuzhuang | 15.31 | 0.34 | 32.52 |
Table 11.
Water quality monitoring data of Baiyangdian Lake.
| Parameters | Concentration (mg/L) | Mean (mg/L) | ||||||
|---|---|---|---|---|---|---|---|---|
| Zaolinhzuang | Wangjiazhai | Guangdianzhangzhuang | Quantou | Caiputai | Duancun | Shaochedian | ||
| Pb | 0.01 | 0.01 | 0.01 | 0.01 | 0.01 | 0.01 | 0.01 | 0.01 |
| TN | 1.79 | 2.15 | 2.68 | 1.57 | 0.8 | 1.19 | 1.74 | 1.71 |
| TP | 0.07 | 0.14 | 0.12 | 0.09 | 0.05 | 0.09 | 0.06 | 0.09 |
Table 12.
Total discharge and pollution load of the point source and non-point source of Baoding City.
Table 12.
Total discharge and pollution load of the point source and non-point source of Baoding City.
| Time | Emission Source | Total Flow of Discharging (104 m3) | Pollution Load (kg) | ||||
|---|---|---|---|---|---|---|---|
| Pb | Zn | TN | TP | COD | |||
| 1998 | Rainfall-runoff | 3453.31 | 554.3 | 1560.9 | 591,187.1 | 41,738.1 | 1,616,665.4 |
| Industrial Sewage | 4500.00 | 1350.0 | 2250.0 | 2,475,000.0 | 225,000.0 | 6,750,000.0 | |
| Total pollution | 7953.31 | 1904.3 | 3810.9 | 3,066,187.1 | 266,738.1 | 8,366,665.4 | |
| 2008 | Rainfall-runoff | 4813.13 | 852.0 | 2362.8 | 1,123,163.2 | 82,818.9 | 3,116,086.2 |
| Industrial sewage | 6000.00 | 1800.0 | 3000.0 | 3,300,000 | 300,000.0 | 9,000,000.0 | |
| Total pollution | 10,813.13 | 2652.0 | 5362.8 | 4,423,163.2 | 382,818.9 | 12,116,086.2 | |
© 2017 by the authors. Licensee MDPI, Basel, Switzerland. This article is an open access article distributed under the terms and conditions of the Creative Commons Attribution (CC BY) license (http://creativecommons.org/licenses/by/4.0/).
Share and Cite
MDPI and ACS Style
Li, C.; Zheng, X.; Zhao, F.; Wang, X.; Cai, Y.; Zhang, N. Effects of Urban Non-Point Source Pollution from Baoding City on Baiyangdian Lake, China. Water 2017, 9, 249. https://0-doi-org.brum.beds.ac.uk/10.3390/w9040249
AMA Style
Li C, Zheng X, Zhao F, Wang X, Cai Y, Zhang N. Effects of Urban Non-Point Source Pollution from Baoding City on Baiyangdian Lake, China. Water. 2017; 9(4):249. https://0-doi-org.brum.beds.ac.uk/10.3390/w9040249
Chicago/Turabian StyleLi, Chunhui, Xiaokang Zheng, Fen Zhao, Xuan Wang, Yanpeng Cai, and Nan Zhang. 2017. "Effects of Urban Non-Point Source Pollution from Baoding City on Baiyangdian Lake, China" Water 9, no. 4: 249. https://0-doi-org.brum.beds.ac.uk/10.3390/w9040249
Note that from the first issue of 2016, this journal uses article numbers instead of page numbers. See further details here.