Development of a Station Based Climate Database for SWAT and APEX Assessments in the US


1
Agricultural Research Service, US Department of Agriculture, 808 E. Blackland Road, Temple, TX 76502, USA
2
Blackland Research & Extension Center, Texas A&M AgriLife, Temple, TX 76502, USA
*
Author to whom correspondence should be addressed.
Water 2017, 9(6), 437; https://0-doi-org.brum.beds.ac.uk/10.3390/w9060437
Submission received: 11 May 2017
/
Revised: 7 June 2017
/
Accepted: 14 June 2017
/
Published: 17 June 2017
(This article belongs to the Special Issue Integrated Soil and Water Management: Selected Papers from 2016 International SWAT Conference)
Abstract
:Water quality simulation models such as the Soil and Water Assessment Tool (SWAT) and Agricultural Policy EXtender (APEX) are widely used in the US. These models require large amounts of spatial and tabular data to simulate the natural world. Accurate and seamless daily climatic data are critical for accurate depiction of the hydrologic cycle, yet these data are among the most difficult to obtain and process. In this paper we describe the development of a national (US) database of preprocessed climate data derived from monitoring stations applicable to USGS 12-digit watersheds. Various sources and processing methods are explored and discussed. A relatively simple method was employed to choose representative stations for each of the 83,000 12-digit watersheds in the continental US. Fully processed climate data resulting from this research were published online to facilitate other SWAT and APEX modeling efforts in the US.
1. Introduction
Hydrologic and water quality models are increasingly being used to inform public policy at the national and local scales. These models can be used to predict the effects of various anthropogenic activities on water quality and quantity, making them useful tools for the purposes of: (1) watershed and water resource planning; (2) evaluation of conservation programs; (3) effects of climate or land use change. The Soil and Water Assessment Tool (SWAT) [1] and Agricultural Policy EXtender (APEX) [2] are two popular models which operate on a daily time-step and are applied at decadal timeframes. Both require a considerable amount of input data which must be accurate, consistent, continuous, and cover the entire area of interest. These models require spatial data such as land use, soils, and topography as well as climatic data including (at a minimum) daily precipitation, minimum, and maximum temperature. When the area of interest is large, in this case the entire US, data development is particularly challenging.
The Conservation Effects and Assessment Project (CEAP), is a national multiagency effort to quantify the environmental benefits of existing conservation practices and the possible effects of future conservation policy. The cropland portion of CEAP makes extensive use of hydrologic and water quality models, including SWAT and APEX. Previous CEAP applications have used data developed by [3] and prepared specifically for the effort, using a combination of daily ground based station and monthly Parameter–Elevation Regressions on Independent Slopes Model (PRISM) predictions [4]. Daily (1960–2006) precipitation and temperature were estimated for each watershed and successfully applied within CEAP [5,6].
As an ongoing effort, CEAP is being updated to include more recent data (up to 2016), improved methods, and greater spatial detail. Previous CEAP efforts used watersheds based on 8-digit Hydrologic Unit Codes (HUCs), a hierarchical watershed classification system by the US Geologic Survey (USGS). Future CEAP assessments will utilize 12-digit HUCs, which are approximately 40 times smaller, thus allowing far more spatial detail to be included. This warrants the redevelopment of all data sources, including climate. The scope and objectives of CEAP dictate the parameters by which the climate dataset is developed. Climatic data must cover the entire continental US, reported daily, and be nearly seamless for a 55 year period (1960–2015). Although coverage of the entire US is needed, the required quality and density varies. CEAP is focused on agriculture, thus observation density and accuracy are key in heavily cultivated areas. Topographic climatic effects are less critical in these regions, tending to be more prominent in mountainous areas with little or no agriculture. CEAP is designed to make average annual long term predictions to inform policy. It is far more important that the climate data (especially precipitation) that is used is statistically representative than absolutely accurate for a given location. Accurate average annual total precipitation, and the distributional frequency and intensity of rainfall events are critical.
The primary models considered in this research are SWAT and APEX. These models share a common development history, the major difference between them being that SWAT is a basin-scale hydrologic model and APEX is more commonly used for field and small watersheds. Both are distributed hydrologic models which divide a basin or field into smaller units to incorporate spatial detail. In SWAT the unit is a subbasin, in APEX it is a sub-area. Water yield and pollutant loads are calculated for each unit and routed through a stream network or across a landscape surface to an outlet. In SWAT a single subbasin can be further divided into areas with the same soil, land use, and slope called Hydraulic Response Units (HRUs). Processes within each HRU are lumped and calculated independently from all other HRUs; the total nutrient or water yield for a subbasin is the sum of all the HRUs it contains. HRUs allow more spatial detail for a large basin to be represented in a computationally efficient manner. Both are process based continuous simulation models that operates on a daily or sub-daily time step. Long-term simulations can be performed using simulated or observed weather data. Relative impacts of different management scenarios can be quantified.
SWAT is the combination of ROTO (Routing Outputs to Outlets) [7] and SWRRB (Simulator for Water Resources in Rural Basins) [8]. CREAMS (Chemicals, Runoff, and Erosion from Agricultural Management Systems) [9], GLEAMS (Groundwater Loading Effects on Agricultural Management Systems) [10] and EPIC (Erosion-Productivity and Impact Calculator) [11] all contributed to the development of SWRRB and APEX. All of the models were developed, calibrated, and applied utilizing precipitation data collected from networks of ground based stations, gridded precipitation data were not available at the time.
The objective of this research is to evaluate differing data sources and methods to synthesize seamless daily climate data (1960–2015) for the Contiguous US (CONUS) suitable for application with SWAT and APEX at the 12-digit HUC level for the Cropland CEAP project. This article will focus on application related issues and methods specific to these models; the raw accuracy of differing climatic datasets is beyond this scope. These processed climate data are publicly released via the web to support other SWAT and APEX modeling projects in the US.
2. Weather Data Development
2.1. Potential Data Sources
The selection and processing of climatic data for use in hydrologic models is more complex than it may seem. For our purposes climate data are either: (1) point observations collected at discrete weather stations; or (2) interpolations, remotely sensed, or simulations averaged over some spatial extent, usually a grid. Daly discusses in detail some limitations of using these interpolated gridded datasets [12]. Data are also summarized temporally, into hourly, daily, or monthly values. It is imperative that the climate data be understood and matched to the assumptions and requirements of the model in which these data are used. This is particularly important for precipitation, as it is the driving force for hydrologic models and often more spatially varied than temperature in the crop producing regions which are the focus of the CEAP effort. In both SWAT and APEX a single set of climatic observations are applied to an entire subbasin or subarea. In reality, precipitation may vary dramatically across a subbasin during a single rainfall event; therefore, data collected at a single site may be a poor representation for the entire subbasin. In contrast, streamflow data from a single site, either observed or simulated, is in a sense an integration of all precipitation in its catchment.
There are several climatic datasets that may be useful for this purpose, each with their own limitations. Gridded climatic data generally employ some interpolation or modeling method between ground stations. This process may utilize other data such as topography or remote sensing. It is difficult to assess the accuracy of these datasets as potential validation data are often based on the same assumptions and/or underlining data as the dataset being evaluated and are not truly independent [12].
The Climate Forecast System Reanalysis (CFSR) [13] is a gridded global dataset (0.5° × 0.5°) for the period 1979 to 2009. These data have been processed into daily SWAT format and are available online [14]. Another source of gridded climate data is Next Generation Weather Radar (NEXRAD) which have been used in a variety of previous model applications [15,16,17]. NEXRAD data have sufficient spatial resolution (4 km × 4 km), but little data are available prior to the early 1990’s. PRISM data are also available from 1980 to near current on a monthly or daily basis at various grid resolutions down to 800 m. As noted before these data have been previously used in CEAP.
The most comprehensive source of measured weather station data in the US is the Global Historical Climatology Network (GHCN) [18]. This dataset integrates observations from 30 different station networks with more than 40,000 stations in the CONUS dating back to the 1800’s. Although these data have both the necessary spatial resolution, and time fame, they are far from seamless. Much of the data are derived from stations operated by cooperative observers, including private individuals. This network of weather stations is dynamic and changes from year to year making it difficult to use.
All of the aforementioned climatic data have been used in SWAT for various projects but direct comparisons between datasets are limited. Because SWAT is typically calibrated, it can be difficult to rigorously assess the accuracy of a particular model input by evaluating model performance alone. [19] compared NEXRAD, PRISM, and station based data in the central US finding all three to produce biased predictions of streamflow during dry periods, with PRISM exhibiting the least. They also conducted a detailed review of recent SWAT climate data comparisons.
For the purposes of this particular model application, there is a strong preference among SWAT and APEX developers to utilize station based data if possible. There are several reasons for this preference: (1) SWAT and APEX were developed using data from ground based stations, the use of gridded data may have unforeseen consequences; (2) the CEAP national assessment does not require fine grained analysis in space or time; (3) the vast majority of SWAT and APEX applications use ground based station data.
2.2. Evaluating Aggregation Effects
As stated before, these models apply a single set of weather observations to an entire subbasin thus it is important that these data be representative of the entire subbasin. Average precipitation across a subbasin can be derived from either gridded data sources or point station based data. Gridded data can be spatially aggregated by overlaying with subbasin boundaries. Thiessen polygon weighting or other procedures can be used to average point station observations across a subbasin. In either case, the precipitation value used in a model for a subbasin is the average value across that subbasin. For many applications that utilize monthly or annual climate summaries this maybe a very reasonable approach, but there may be unintended consequences if the goal is to predict daily surface runoff, sediment losses, or nutrient loss. The aggregation of individual observations into a single record changes the statistical nature of the climatic data. As the spatial unit over which the averaging occurs is larger, incorporating more stations or grid cells, there is less day to day variability in the aggregated precipitation value. The number of days with rainfall within the record tends to increase while rainfall intensity is reduced even though the average annual precipitation may be unaffected. Surface runoff, sediment loss, and nutrient transport area are driven by precipitation amount and intensity. Many of the contributing complex natural processes are nonlinear, thus sensitive to both precipitation frequency and intensity. Some evaluation of these aggregation effects on model predictions is necessary to aid in the selection of appropriate data sources and processing methods.
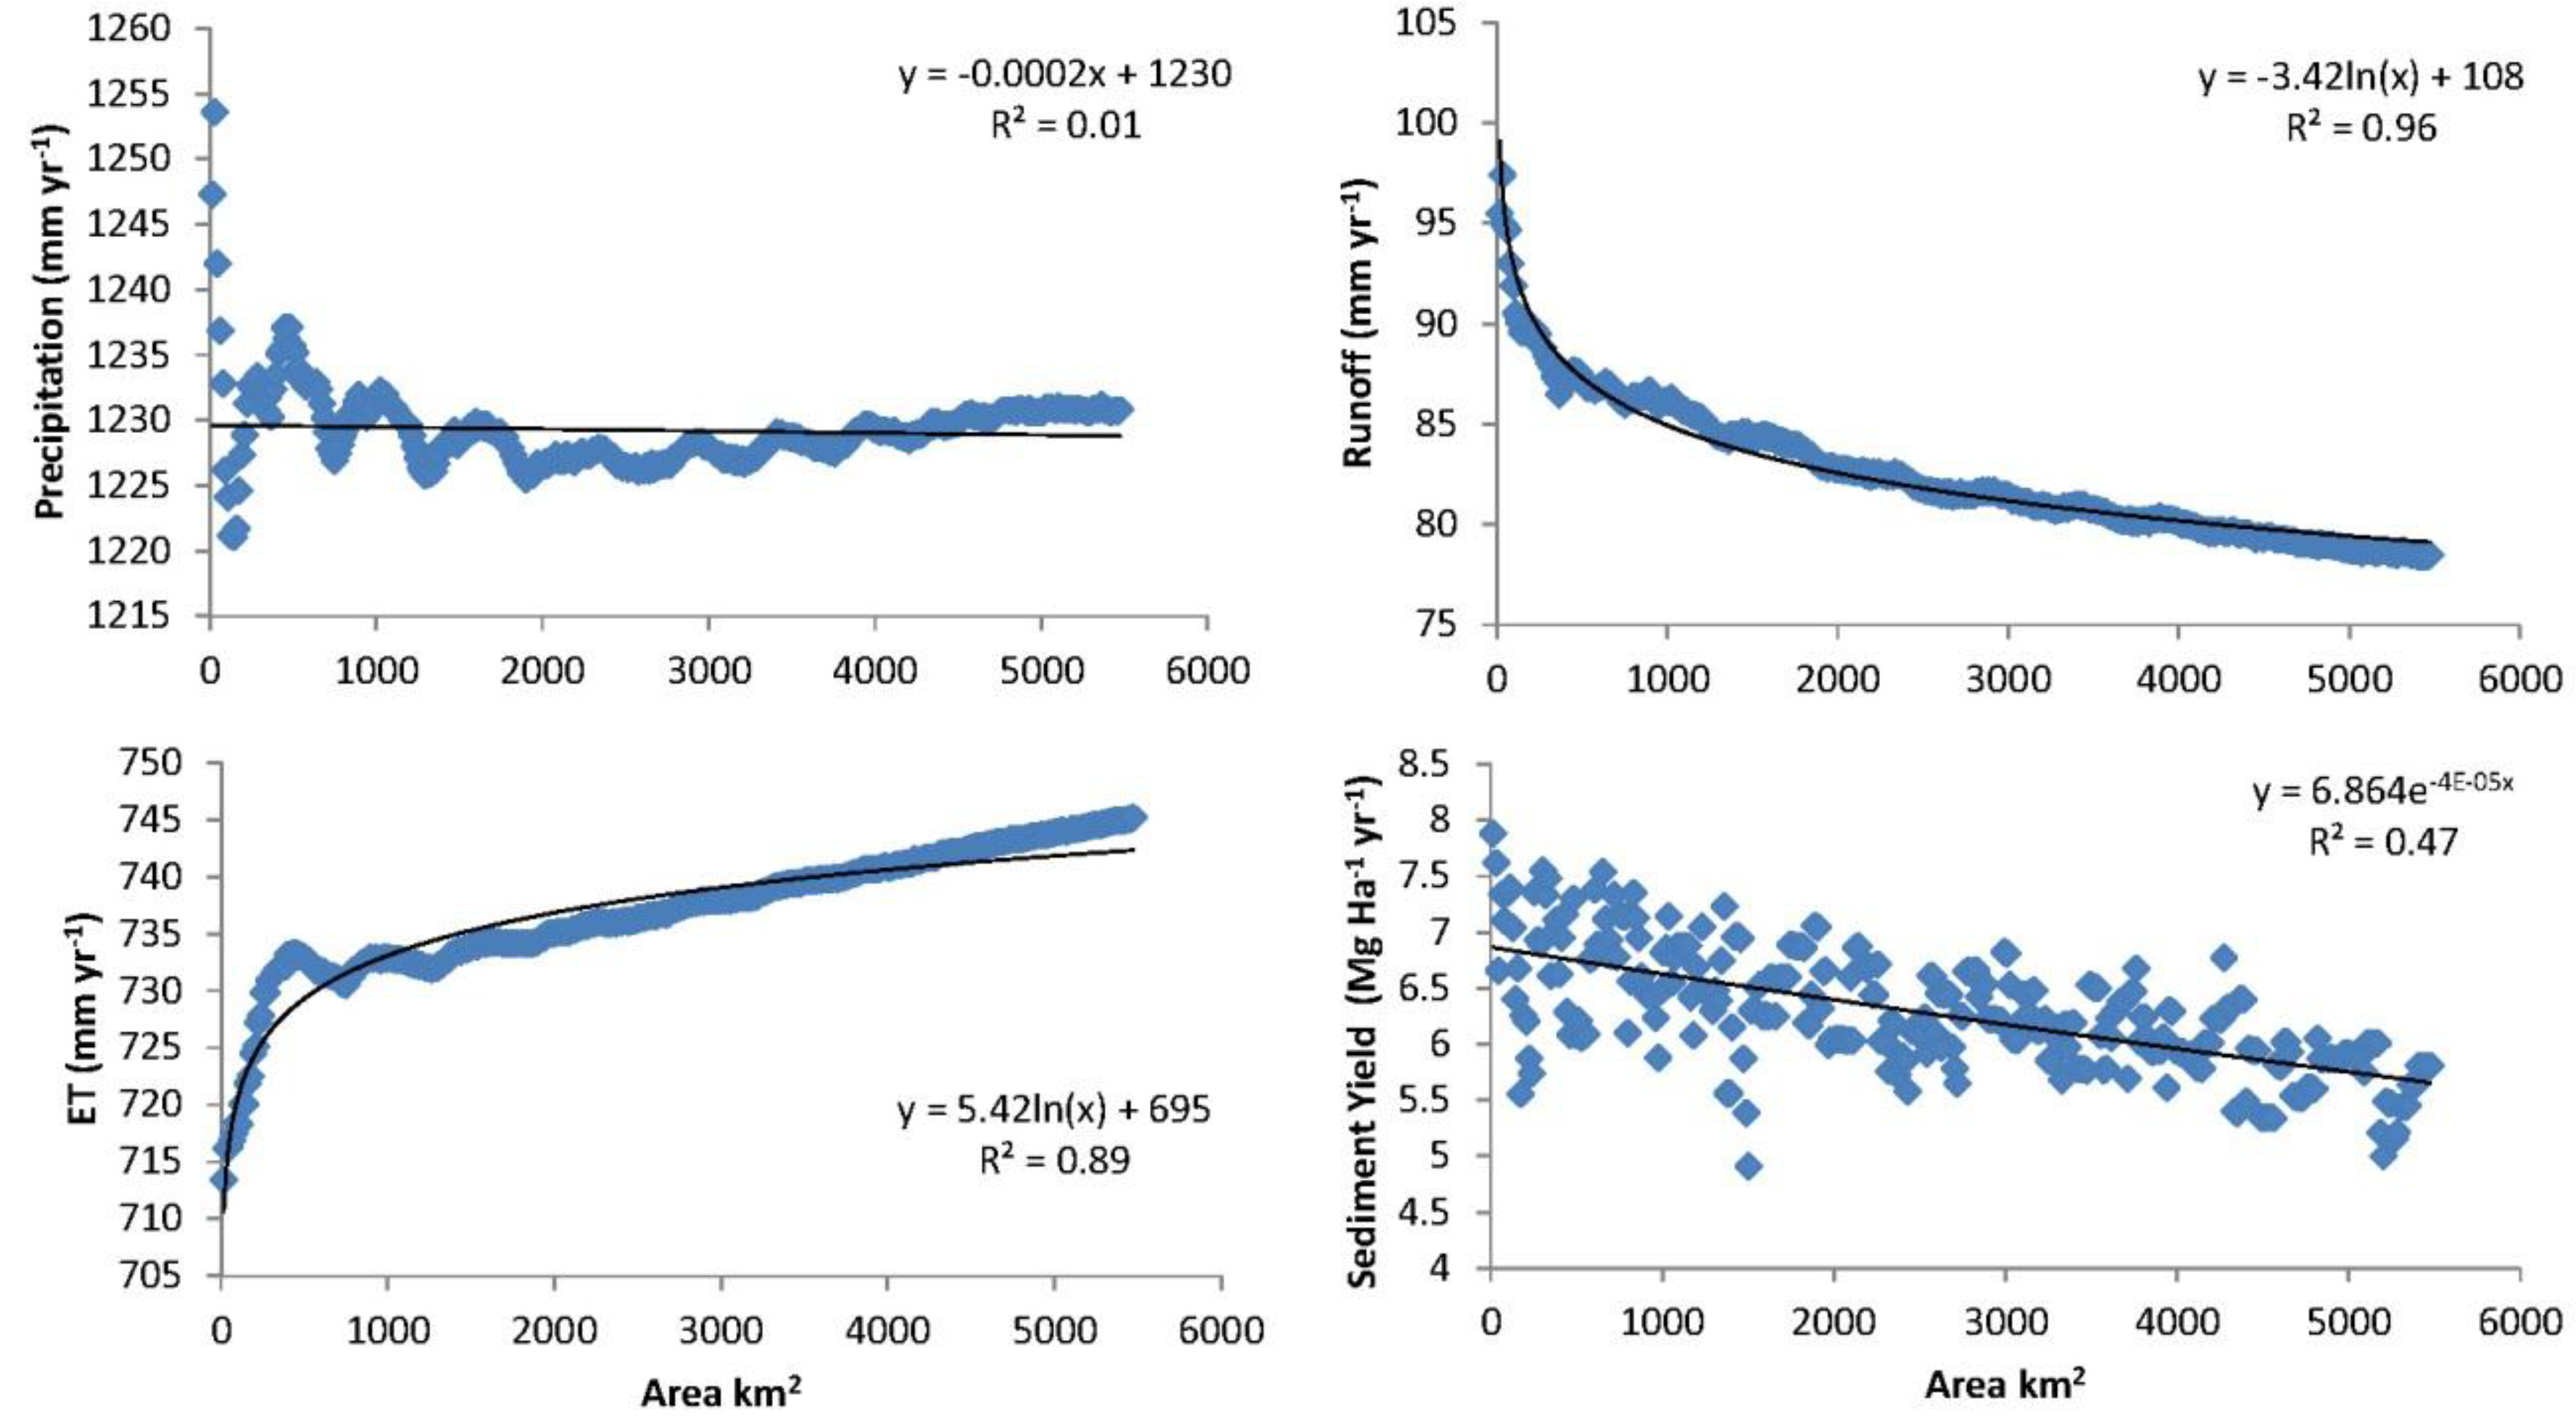
To gage the effect of aggregation, a SWAT model was developed using NEXRAD data aggregated at varying spatial scales. NEXRAD data in the Illinois River (HUC-8 11110103; Eastern Oklahoma/Western Arkansas) was obtained at a 4 km resolution for the period 1990–2001. These precipitation data were processed with differing levels of spatial aggregation ranging from 16 to 5500 km2 (1 to 342 individual NEXRAD cells). A template SWAT model of a single field (single HRU) was prepared using local soil and crop (winter wheat) information. This model was not calibrated, to do so could mask aggregation effects. Each aggregated weather dataset was incorporated into the template, SWAT was executed, and relevant model predictions were recorded.
Figure 1 illustrates the relationships between several key SWAT predictions and the level of aggregation present in the precipitation used. Variability in average annual precipitation was inversely correlated with the aggregation area, but there was no systematic trend in mean values. Both runoff and sediment yield were reduced with increasing aggregation area while evapotranspiration increased. This analysis indicates that sediment and runoff may be reduced by 20% when using spatially aggregated data, and that even at low levels of aggregation, model predictions may be significantly affected. Other researchers have also noted that model performance when using NEXRAD data decreased with increasing watershed size [15].
2.3. Network Selection
Climate data for this CEAP effort could be constructed using point station observations, individual grid cells, spatial aggregations gridded data, or aggregated point station observations. The systematic bias resulting from the use of spatially aggregated precipitation is a serious concern. Even though point observation may not fully describe the climate for an entire subbasin, we believe that these data are the more appropriate choice. Point observations could be derived from either daily grid based data like PRISM or station data. We elected to utilize measured station data for this effort, as these data were used to develop these models, and are preferred by model developers. In addition, the vast majority of SWAT and APEX applications utilize this type of data. The use of gridded data sources may offer enhanced spatial resolution, but more study is needed prior to adoption in future USDA national assessments. GHCN data were selected as the basis for the point climatic observations assembled for this effort, as these data represent the largest source of observed daily surface measurements covering the period of interest. All GHCN stations were downloaded from NOAA’s FTP Servers [20].
2.4. Filling Gaps
Data from 40,000 GHCN stations were examined and processed. Missing observations or those with quality control flags were estimated using Shepard’s inverse distance weighting [21]. Weights are based in the inverse of distance in kilometers between stations (Equation (2)). A weighted average was calculated using data from the five nearest stations with data. The exact stations used vary day by day, as there are frequently missing data at the surrounding stations as well.
where is the value an interpolated point, is the value at a known point, is the distance from to , is the weight for point , and is the power parameter which is set to 1.
This interpolation was selected because it is simple to code and not computationally intensive. This method does result in some degree of unavoidable aggregation, but this is preferable to the use of simulated data to fill these gaps. The consequences of these interpolation methods are discussed subsequently.
The GHCN data were used to construct seamless records from 1900–2015 at all stations. Note that the density of stations through time is variable and that many stations may be comprised entirely of interpolated data prior to 1950. We chose to keep these data as they have some utility for model warm-up. Process based models should be run for several years prior to the period of interest or warmed-up to minimize the importance of initial state variables which are almost always unknown.
Interpolated estimates were calculated each day at every station even when local observations were available. Having both the observation and interpolation for at least part of the period of interest at a particular station allows the correlation and bias between the two to be examined, yielding an accuracy estimate of the interpolation and the entire seamless record.
2.5. Station Selection
To support the development of a national 12-digit CEAP model it is necessary to identify stations which are most representative of the average weather within each of 83,000 HUC-12 in the contiguous US. Most HUC-12s had no weather station within their boundaries and must be represented by an exterior station that may be many kilometers away. For each HUC-12 the three most representative stations were identified from all GHCN stations using a ranking algorithm based on factors deemed most important to SWAT and APEX in the context of the CEAP effort. The most critical factors are precipitation frequency, intensity, and long term annual totals. It is far more important that the distributional nature of precipitation is realistic than that any single event is accurate.
Three factors were considered and weighted into a final score for each candidate station. The first criterion was completeness. No station with less than 10% measured precipitation data during the period 1980–2015 was considered. This excluded 56% of all GHCN stations. The second criterion was the distance from the centroid of the HUC-12 to each candidate station, with closer stations being preferred. The final and most heavily weighted criterion was the ratio of average annual precipitation between the HUC-12 and each candidate station. PRISM 30-Year (1981–2010) normal precipitation (800 m resolution) [22] was used to estimate annual precipitation at the centroid of each HUC-12. The centroid was selected as it would be the most ideal single location for a weather station within a given HUC-12. This criterion was weighted more heavily than the others to increase the likelihood that the selected stations for a particular HUC-12 have the same topographic context. PRISM precipitation estimates make extensive use of topographic factors including elevation and aspect. This prevents an HUC-12 in a valley bottom from being represented by a station on a nearby mountaintop, where the precipitation would be very different.
Various criteria weights and completeness cutoffs were examined iteratively and ultimately based on professional judgement. Only stations with precipitation records that were more than 10% complete were considered. The estimated accuracy of the entire record at stations with 10% complete records was 77%; stations that were 50% complete were estimated to be 84% accurate. This marginal improvement in accuracy would have resulted in the disqualification of 12,800 stations (61% of available stations). Using stations with 10% complete records seemed an appropriate compromise. Interpolated temperature was more accurate, presumably due to less spatial variability. Stations with 10% complete records were estimated to be 94.4% and 96.2% accurate for minimum and maximum temperature respectively.
Initially, completeness, distance, and the HUC-12 to station precipitation ratio were equally weighted. A sample of resulting station selections were mapped and examined manually. Many station selections exhibited a notable bias in PRISM estimated precipitation. Given the intended use of these data, it was determined that the bias should be reduced by more heavily weighting the HUC-12 to station precipitation ratio. Ultimately criteria weights of 1, 1, and 3 were selected for completeness, distance, and the HUC-12 to station precipitation ratio. The top three scoring stations were selected for each HUC-12 for use in SWAT and APEX models.
2.6. SWAT and APEX Testing
It is not possible to fully test these data, but inferences can be drawn from the precipitation dataset by applying it with SWAT and APEX and examining the output. Using Shepard’s weighted interpolation has the potential to introduce some of the same spatial aggregation issues described previously. Because averaging is weighted inversely by distance, we would expect less modification of the statistical nature of the interpolated estimate, and only on days when there are no measured data at a selected station. A single field APEX and SWAT model template was set up to simulate a fallow field with a common agricultural soil. Each selected station was incorporated into these models and executed for a 40-year period. Simulated runoff and sediment yields were recorded, along with the completeness (percent of non-interpolated data) of the climate record for that station.
3. Results
3.1. Station Selection
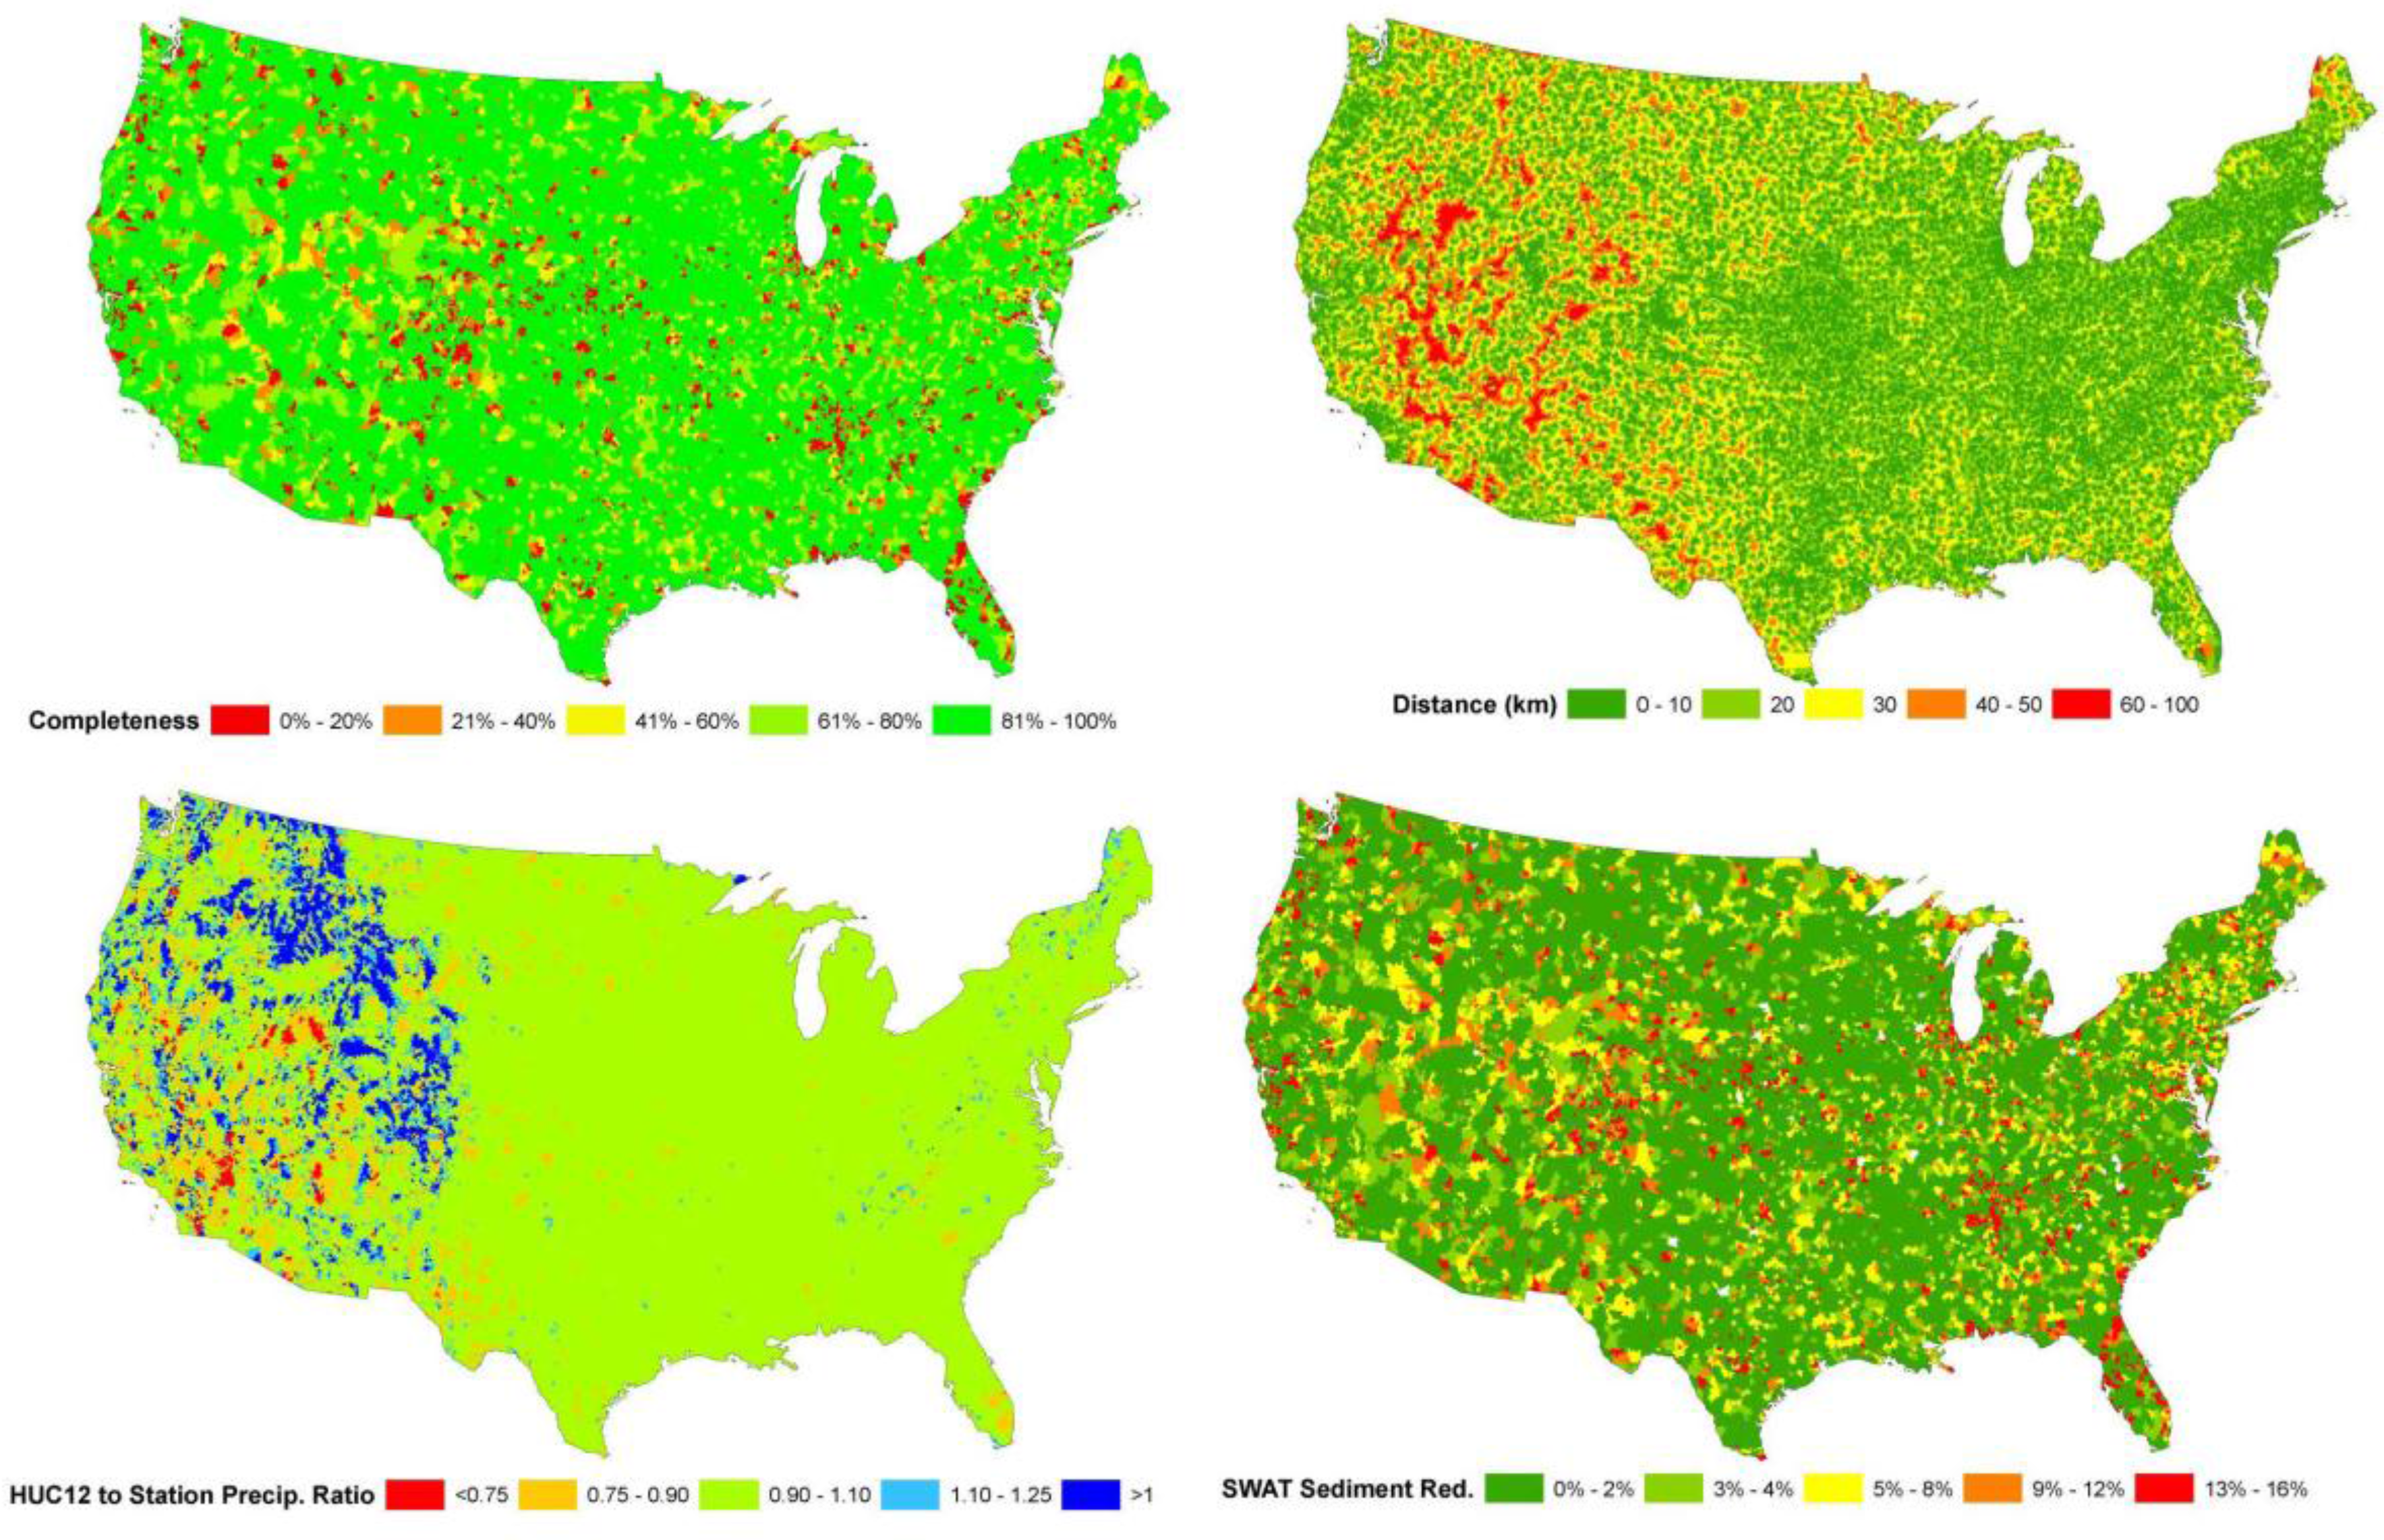
While the ultimate reliability of these data is difficult to assess, we can spatially examine the selection criteria to qualitatively assess where limitations are likely to occur. The three metrics used for station selection (completeness, distance, and HUC-12 to station precipitation ratio) are given for the best candidate station for each HUC-12 in Figure 2. Station completeness varied spatially, with slightly more complete stations selected in the central US agricultural regions, but the pattern is minimal. Distance from HUC-12 to the selected station was strongly related to GHCN station density, with fewer stations available in western US. The final factor, HUC-12 to station precipitation ratio indicated that annual precipitation for stations selected in primarily agricultural areas were within 10% of the PRISM estimates. This precipitation ratio is more variable in the western areas where station density is low and spatial precipitation variability is greater due to topographic effects. There is potential for increased model error in these mountainous areas due to greater bias, but given minimal agriculture there is little concern for the intended use of the data.
3.2. SWAT and APEX Testing
Multiple regression was used to gage the importance of causal factors in SWAT and APEX predicted sediment yield. Station precipitation was by far the most important factor, but station completeness was also significant (α = 0.05). We found that for each 10% reduction in station completeness, sediment yields were depressed by 1.5% in SWAT and 2.3% in APEX. This regression was applied spatially in Figure 2. While this does not indicate how much interpolation is too much, it does indicate the relative impact. Even though stations with as little as 10% measured data were included in the selection process, the average completeness across all selected stations was 80%. This indicates that on average sediment yields would be expected to be depressed approximately 3% in SWAT and less than 5% in APEX due to the use of interpolated data. Sediment yield depression was significantly greater in some HUC12s than others. While we would prefer that there was no overall bias, less than 5% on average is an acceptable bias given the uncertainty of the original precipitation data and the intended use of the data.
4. Conclusions
Climatic data are critically important in the application of natural resource models like SWAT and APEX. There are many potential data sources and processing techniques that can be used to provide these data. The purpose of this effort was to develop a dataset to meet the needs of a specific modeling application; other applications may be best served by other weather data. Given the array of potential weather data sources, it is possible, even likely that a more accurate final weather product could be produced with additional effort. A full evaluation of other data sources and more complex techniques would require more resources than are available and increase the potential for unforeseen consequences. We conclude that the data described in this work are suitable for the intended SWAT and APEX application. These data are also suitable for other modeling efforts, and are freely provided via the web.
Acknowledgments
This work was funded by the U.S. Department of Agriculture, Agricultural Research Service. USDA is an equal opportunity provider and employer.
Author Contributions
Michael J. White developed the processing methods and wrote the manuscript. Jeffrey Arnold aided in the conception of the methodology for data development. Marilyn Gambone processed data for web release and designed the web portal. Elizabeth Haney and Jungang Gao tested the data using models and aided in manuscript preparation.
Conflicts of Interest
The authors declare no conflict of interest.
Appendix A
Daily station data in SWAT, ArcSWAT, and APEX formats are available on the web for download at https://nlet.brc.tamus.edu/Home/Swat. This site includes several model based decision support tools and is a repository of US SWAT and APEX formatted data.
References
- Arnold, J.G.; Srinivasan, R.; Muttiah, R.S.; Williams, J.R. Large area hydrologic modeling and assessment. Part I: Model development. J. Am. Water Resour. Assoc. 1998, 34, 73–89. [Google Scholar] [CrossRef]
- Williams, J.R.; Arnold, J.G.; Srinivasan, R. The APEX Model; BRC Report No. 00-06; Texas Agricultural Experiment Station, Texas Agricultural Extension Service, Texas A&M University: Temple, TX, USA, 2000. [Google Scholar]
- Di Luzio, M.; Johnson, G.L.; Daly, C.; Eischeid, J.K.; Arnold, J.G. Constructing retrospective gridded daily precipitation and temperature datasets for the Conterminous United States. J. Appl. Meteorol. Climatol. 2008, 47, 475–497. [Google Scholar] [CrossRef]
- Daly, C.; Neilson, R.P.; Phillips, D.L. A statistical-topographic model for mapping climatological precipitation over mountainous terrain. J. Appl. Meteorol. 1994, 33, 140–158. [Google Scholar] [CrossRef]
- White, M.J.; Santhi, C.; Kannan, N.; Arnold, J.G.; Harmel, D.; Norfleet, L.; Allen, P.; DiLuzio, M.; Wang, X.; Atwood, J.; et al. Nutrient delivery from the Mississippi River to the Gulf of Mexico and effects of cropland conservation. J. Soil Water Conserv. 2014, 69, 26–40. [Google Scholar] [CrossRef]
- Santhi, C.; Kannan, N.; White, M.; Di Luzio, M.; Arnold, J.G.; Wang, X.; Williams, J.R. An integrated modeling approach for estimating the water quality benefits of conservation practices at river basin scale. J. Environ. Qual. 2014, 43, 177–198. [Google Scholar] [CrossRef]
- Arnold, J.G.; Williams, J.R.; Maidment, D.R. Continuous-time water and sediment-routing model for large basins. J. Hydraul. Eng. 1995, 121, 171–183. [Google Scholar] [CrossRef]
- Williams, J.R.; Nicks, A.D.; Arnold, J.G. Simulator for water resources in rural basins. J. Hydraul. Eng. 1985, 111, 970–986. [Google Scholar] [CrossRef]
- Knisel, W.G. Creams: A Field Scale Model for Chemicals, Runoff, and Erosion from Agricultural Management Systems; United States Department of Agriculture, Science and Education Administration: Quilcene, WA, USA, 1980.
- Leonard, R.; Knisel, W.; Still, D. Gleams: Groundwater loading effects of agricultural management systems. Trans. ASAE 1987, 30, 1403–1418. [Google Scholar] [CrossRef]
- Williams, J.R. The erosion-productivity impact calculator (EPIC) model: A case history. Philos. Trans. R. Soc. Lond. B Biol. Sci. 1990, 329, 421–428. [Google Scholar] [CrossRef]
- Daly, C. Guidelines for assessing the suitability of spatial climate data sets. Int. J. Climatol. 2006, 26, 707–721. [Google Scholar] [CrossRef]
- Saha, S.; Moorthi, S.; Pan, H.; Wu, X.; Wang, J.; Nadiga, S.; Tripp, P.; Kistler, R.; Woollen, J.; Behringer, D.; et al. The NCEP climate forecast system reanalysis. Bull. Am. Meteorol. Soc. 2010, 91, 1015–1057. [Google Scholar] [CrossRef]
- AgriLife Research. Global Weather Data for SWAT, Texas A&M University, 2014. Available online: http://globalweather.tamu.edu/ (accessed on 15 June 2017).
- Price, K.; Purucker, S.T.; Kraemer, S.R.; Babendreier, J.E.; Knightes, C.D. Comparison of radar and gauge precipitation data in watershed models across varying spatial and temporal scales. Hydrol. Process. 2014, 28, 3505–3520. [Google Scholar] [CrossRef]
- Zhang, X.; Srinivasan, R. GIS-based spatial precipitation estimation using next generation radar and raingauge data. Environ. Modell. Softw. 2010, 25, 1781–1788. [Google Scholar] [CrossRef]
- Gali, R.; Douglas-Mankin, K.; Li, X.; Xu, T. Assessing NEXRAD P3 data effects on stream-flow simulation using SWAT model in an agricultural watershed. J. Hydrol. Eng. 2012, 17, 1245–1254. [Google Scholar] [CrossRef]
- Menne, M.J.; Durre, I.; Korzeniewski, B.; McNeal, S.; Thomas, K.; Yin, X.; Anthony, S.; Ray, R.; Vose, R.S.; Gleason, B.E.; et al. Global Historical Climatology Network—Caily (GHCN-Daily), version 3; NOAA National Climatic Data Center: Asheville, NC, USA, 2012. [Google Scholar]
- Gao, J.; Sheshukov, A.Y.; Yen, H.; White, M.J. Impacts of alternative climate information on hydrologic processes with SWAT: A comparison of NCDC, PRISM and NEXRAD datasets. Agric. Ecosyst. Environ. 2017, 156, 353–364. [Google Scholar] [CrossRef]
- NOAA’s FTP Servers. Available online: ftp://ftp.ncdc.noaa.gov/pub/data/ghcn/daily/all/ (accessed on 16 June 2017).
- Shepard, D. A two-dimensional interpolation function for irregularly-spaced data. In Proceedings of the 1968 ACM National Conference, New York, NY, USA, 27–29 August 1968; pp. 517–524. [Google Scholar]
- PRISM Climate Group. PRISM Climate Data, 2013. Available online: http://prism.oregonstate.edu (accessed on 15 June 2017).
Figure 1.
Soil and Water Assessment Tool (SWAT) model predictions for a single Hydraulic Response Unit (HRU) (winter wheat) in the Illinois River (Eastern Oklahoma/Western Arkansas) as a function of increasingly aggregated Next Generation Weather Radar (NEXRAD) precipitation data.
Figure 1.
Soil and Water Assessment Tool (SWAT) model predictions for a single Hydraulic Response Unit (HRU) (winter wheat) in the Illinois River (Eastern Oklahoma/Western Arkansas) as a function of increasingly aggregated Next Generation Weather Radar (NEXRAD) precipitation data.

Figure 2.
The three metrics used for station selection (completeness, distance, and HUC-12 to station precipitation ratio) and estimated SWAT sediment yield depression for the best candidate station selected for each HUC12 in this research.
Figure 2.
The three metrics used for station selection (completeness, distance, and HUC-12 to station precipitation ratio) and estimated SWAT sediment yield depression for the best candidate station selected for each HUC12 in this research.

© 2017 by the authors. Licensee MDPI, Basel, Switzerland. This article is an open access article distributed under the terms and conditions of the Creative Commons Attribution (CC BY) license (http://creativecommons.org/licenses/by/4.0/).
Share and Cite
MDPI and ACS Style
White, M.J.; Gambone, M.; Haney, E.; Arnold, J.; Gao, J. Development of a Station Based Climate Database for SWAT and APEX Assessments in the US. Water 2017, 9, 437. https://0-doi-org.brum.beds.ac.uk/10.3390/w9060437
AMA Style
White MJ, Gambone M, Haney E, Arnold J, Gao J. Development of a Station Based Climate Database for SWAT and APEX Assessments in the US. Water. 2017; 9(6):437. https://0-doi-org.brum.beds.ac.uk/10.3390/w9060437
Chicago/Turabian StyleWhite, Michael J., Marilyn Gambone, Elizabeth Haney, Jeffrey Arnold, and Jungang Gao. 2017. "Development of a Station Based Climate Database for SWAT and APEX Assessments in the US" Water 9, no. 6: 437. https://0-doi-org.brum.beds.ac.uk/10.3390/w9060437
Note that from the first issue of 2016, this journal uses article numbers instead of page numbers. See further details here.