
Techno-Economic Analysis and Environmental Impact of Electric Buses


1
Faculty of Integrated Technologies, Universiti Brunei Darussalam Jln. Tungku Link, Darussalam BE1410, Brunei
2
Faculty of Engineering and Information Technology, University of Technology Sydney, Ultimo, NSW 2007, Australia
3
Department of Electrical Engineering, Universiti Tenaga Nasional, Kajang 43000, Selangor, Malaysia
*
Author to whom correspondence should be addressed.
World Electr. Veh. J. 2021, 12(1), 31; https://0-doi-org.brum.beds.ac.uk/10.3390/wevj12010031
Submission received: 25 December 2020
/
Revised: 22 January 2021
/
Accepted: 2 February 2021
/
Published: 19 February 2021
Abstract
:Electric vehicles are a leading candidate in the clean energy market. This paper aims to analyse the feasibility of the deployment of electric buses (EB) based on the existing bus routes in Brunei, by the use of life cycle cost analysis and the analysis of the parameters that influence the overall life cycle cost. The findings from the study revealed that EB are significantly more expensive than diesel buses (DB), with their acquisition and maintenance costs contributing substantially to their overall life cycle cost. In order to promote EB deployment, the government needs to look simultaneously into providing subsidies for EB and imposing taxes on DB, the provision of charging infrastructure, and ensuring maintenance capability, as well as increasing the current subsidised diesel price. It was also shown that increasing the cost of diesel to the average US diesel price of USD$3.101/L, an initial subsidy of USD$67,586 towards the purchase of EB, and a tax of USD$67,586 for the purchase of DB would allow EB to compete in the market, with the amount of tax and subsidy being gradually reducible over time, as EB and battery technology becomes more mature. From an environmental perspective, the emissions from EB come out higher than the emissions from DB. The efficiency of electric power generation needs to be enhanced, and renewable energy sources and the adoption of carbon capture technology need to be explored in order to exploit the full benefit of EB and ensure more environmentally sustainable bus operation.
1. Introduction
Demographic expansion around the world has drastically increased the number of private and public vehicles on the road, escalating various issues—from traffic problems to environmental concerns and climate change—to the extent that it is affecting human health [1,2,3]. According to a study across the US, UK, France and Germany, road congestions have not only cost about one percent of the gross domestic product, but recent data have also indicated that about 4.5 million premature deaths per year have resulted from polluted air, due in part to traffic congestions [3].
Governments and researchers have put in a lot of effort to mitigate the environmental effect due to the increase in the number of vehicles. Many countries have adopted fuel standards and labelling [4] to restrict only vehicles above a certain level of efficiency to be sold in the market. Other researchers have suggested the use of cleaner alternative sources of fuel, such as biodiesel [5], solar energy [6] and hydrogen [7], thereby reducing greenhouse gas (GHG) emissions from the transportation sector, as well as reducing the dependence on scarce fossil fuels. However, the technologies associated with these alternative energy sources are relatively new, are not without challenges, and hence have seen very limited adoption rates [8]. Alternatively, electric vehicles have also been suggested due to their environmentally-friendly zero tailpipe emissions [9,10]; at the moment, they are receiving a lot of interest.
Other than tackling the problem from the technological perspective, researchers have also proposed non-technological initiatives and policies to encourage the use of public transport, and hence to reduce the number of private vehicles on the road [11,12]. Directly, this would reduce traffic congestion, and its effect can be compounded by additionally introducing other technical measures to limit GHG emissions from public transport. One such measure is the introduction of electric mobility for public transportation. Combined, the benefit of using public transportation can compound the advantages from EB: zero tailpipe emissions, higher efficiency through braking energy recovery, an absence of idling energy loss [13], and the potential of energy recovery through vibrational energy harvesters [14,15].
To date, China is the largest manufacturer, greatest user, and current leader in the deployment of EB [16]. In 2017, about 99% of the 385,000 EBs deployed worldwide were in China [17]. Within Europe, Sweden executed actions to decarbonize its local bus system as early as 2007, with fossil-free fuel buses noticeably increasing from 8% in 2008 to almost 60% in 2014 [18].
Several authors [19,20,21] have attempted to evaluate the economic competitiveness of EBs compared to conventional DBs in different states in the US. Reference [19] uses a probabilistic approach to assess the Life Cycle Cost (LCC) of the transit system in California by comparing diesel, diesel-hybrid, compressed natural gas (CNG), CNG low-NOx, and electric buses. High purchase and infrastructure costs, including charging systems and depot facilities upgrades, mainly contribute to the high LCC of EB. In [22], the purchase cost has also been used to explain the high LCC of EB in Slovakia, with the authors recommending financial support in the form of self-governance, government, and European standards for funding to promote the competitiveness of EB. Similarly, comparisons between hybrid EB, battery EB, fuel cell EB and DB [23] have shown that EBs have a higher LCC as compared to DB, with fuel cell EB being the most expensive. Again, these are mostly due to the higher purchase and infrastructure costs of EBs, with the additionally higher LCC of fuel cell-EB being attributed to the maintenance and operating costs of the new technology.
Conversely, reference [20] reveals that, although the initial purchase cost of EB is significantly higher than DB, the lower operation and maintenance costs of EB largely offset the initial cost differential, and—with the addition of healthcare costs reduction from benefits derived by using a more environmentally-friendly means of transportation—further leads to more attractive investments in EBs. The author highlighted that the low costs of electricity, combined with the bus drive train and low maintenance costs, collectively contribute to the lower lifetime costs of EBs. Similarly, a study in India showed that the LCC of EB are lower than DB [24], with the fuel, operating and maintenance costs of DBs mainly contributing to the higher overall LCC of DB. These, coupled with the anticipated increase in future diesel prices in the country, have made EB a more attractive alternative. A similar conclusion was derived in [25], with the LCC of EB being largely influenced by electricity costs, battery consumption, operating conditions, and the charging facility.
The LCC analysis of conventional buses fueled by diesel or a biodiesel blend, hybrid-EB, compressed natural gas buses or liquefied natural gas buses, and battery-EB using fast or slow charging were given in [21], by considering two scenarios: when external funding is available to cover 80% of the purchase cost, and when no external funding is available. When combined with the low operational costs of EB, the ability to tap into external funding results in battery-EBs and hybrid-EBs becoming more cost-effective compared to conventional buses. On the other hand, the absence of funding results in conventional DBs having among the cheapest LCC.
Similarly, [26] performed an LCC analysis for European cities by comparing DB and two types of EBs, each utilizing overnight and opportunity charging, while incorporating external costs on health due to environmental pollution and noise, and also the climate cost of GHG. The study concludes that omitting external costs leads to the slightly higher LCC of EBs than DBs, and vice versa. It has been shown that lower mileage leads to more expensive EBs. Also, lower electricity costs and the reduction in battery prices lower the LCC of EB, especially for overnight charging EB, since their battery size is larger than EB employing opportunity charging.
The discussions above indicate that the main obstacle to widespread EB adoption is the evidently high investment cost required to purchase the EB. Despite this, mixed results have been demonstrated on the economic-viability of EB to compete in the market, with overall competitiveness of EB highly dependent on other cost components respective to the market considered. As such, this paper aims to use LCC to analyse the feasibility of EB in Brunei, with the use of local market data, and to analyse the influence of changes in different cost components to its feasibility. The methodology developed in this paper is transferable, and can also be used to analyse the feasibility of EB in other market.
Geographically, Brunei is an oil- and gas-exporting country in Southeast Asia. Albeit a small country, Brunei has one of the highest rates of vehicle ownership worldwide, with two vehicles per capita [27], and was also ranked as the eleventh highest transport per capita emissions of CO2 in 2012 [28]. In line with the country’s target to lower its energy intensity to 45% by the year 2035, Brunei has put in place plans to increase the adoption of hybrid and electric vehicles as one of the action plans to enhance the energy efficiency performance in the transport sector [29], and to address the issue of private car dependency [30] by promoting public bus usage. An LCC analysis of EB is beneficial in this case, to identify focus areas in order to make the target more achievable. Additionally, its environmental impact was also assessed, in order to reap maximum environmental benefit from EB.
2. Methodology
2.1. Bus Selection
The objective of this study is to analyse the feasibility of EB in Brunei by comparing their LCC against the existing DB commonly used in the Brunei–Muara district, the smallest and most populous district in Brunei. Additionally, the environmental impact of the EB was also analysed.
There are 21 intra-district routes in Brunei–Muara district, serviced by a total of 105 DBs, with each bus being expected to provide service for up to three times a day, operating every hour from 06:00–20:00 h daily [31,32], starting and ending at the main bus terminal in the capital. The distances for the routes range from 64.2 km to 140 km.
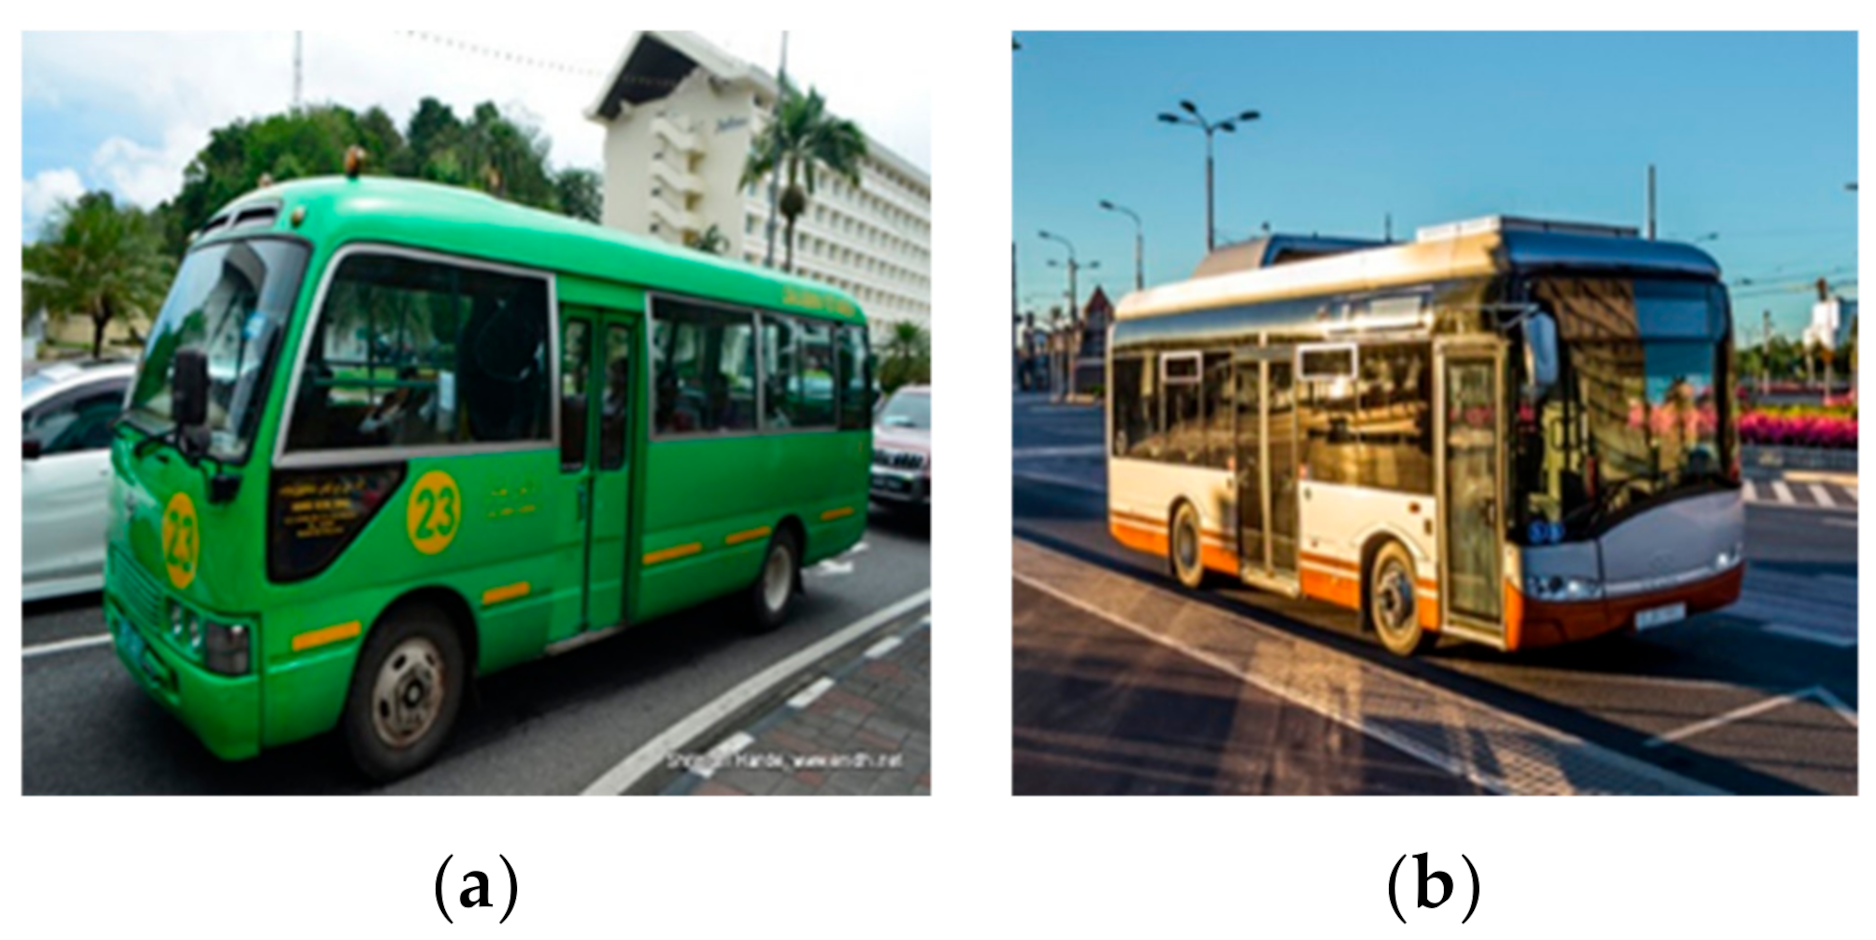
The most common DB in Brunei is the Toyota Coaster, which has a 22-seated passenger capacity. In order to analyse the feasibility of EB in Brunei, the EB needs to be chosen such that it allows a realistic comparison with the existing DB used. Considering an EB with larger dimensions would increase the passenger capacity; however, the EB would have heavier curb and gross weight, resulting in a generally-higher fuel consumption per distance travelled, and higher fuel costs. For a fairer comparison, the EB was chosen based on its passenger capacity, as this would allow the replacement of DBs without actually changing the current bus schedules, as well as ensuring social acceptance. To this effect, the Urbino 8.9LE was chosen as the corresponding EB to be analysed. Figure 1 depicts the two buses, with the technical specifications illustrated in Table 1.
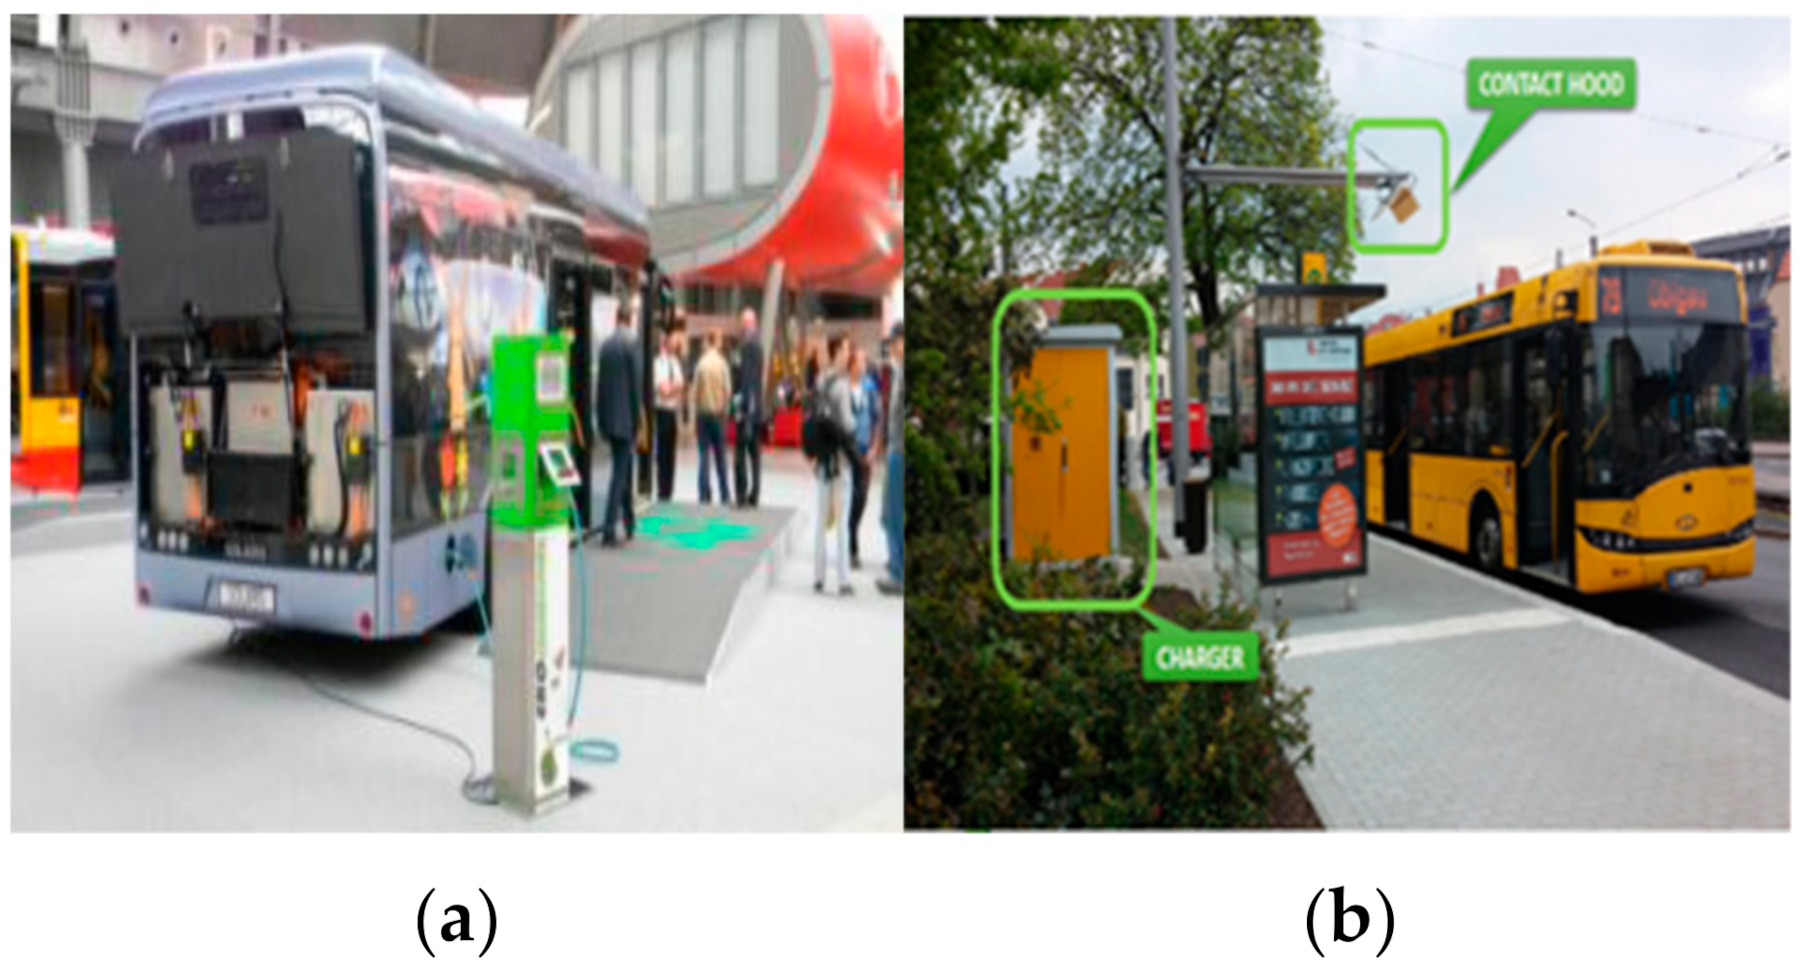
Two types of charging facilities are considered for the EB: plug-in chargers at the bus terminal, and pantograph chargers for en-route charging. Plug-in chargers are the most economical and commonly-used options for charging EB; however, they require a longer time period to fully charge large capacity batteries, and hence are more commonly used for overnight charging. On the other hand, pantograph charging is an automated, albeit more expensive, charger, which works by producing high conductive energy capable of charging within shorter time period. A pantograph charger is needed to compensate for the short driving range limitations of the selected EB. Figure 2 gives a depiction of the plug-in and pantograph chargers considered.
2.2. Techno-Economic Analysis
Life Cycle Cost (LCC) [33] estimates the cost of technology throughout its useful lifespan by taking into account the time value of money, and may be used to appraise the economic feasibility of the deployment of new technology against currently used technology. In this study, it is used to analyse the feasibility of the deployment of EB, which is touted as a more environmentally-friendly option, against the widely-used DBs. Furthermore, LCC is also used to identify the dominant cost components that affect its feasibility, allowing manufacturers and researchers to focus on significant areas to improve feasibility, as well as allowing the government to roll out efficient policy to encourage its usage.
LCC constitutes four main components: acquisition, operating, maintenance, and disposal costs. Discounting, the process of converting the costs and benefits encountered at different points in time into a single time dimension by employing a discount rate that denotes the change in the money value per time period, may be employed. Given interest rate r, the relationship between Present Value (PV) and Future Value (FVi) in year i is given by:
The Cumulative Present Value over the vehicle’s life-time of n years is given by:
2.2.1. Acquisition Cost
The Acquisition Cost (AC) corresponds to the cost of acquiring the bus, as well as the associated equipment required for its operation at the initial stage. Also included are the different taxes levied during the initial purchase. It is assumed that the buses are purchased through a private lump sum payment without external financing, freeing ACs from the effect of varying interest rates.
For DB, the AC is taken to be the average retail value of the Coaster, approximated from interviews with local bus owners and companies. The additional infrastructure cost needed for the operation of EB—particularly the plug-in and pantograph chargers—are excluded from the AC of the Urbino, and are accounted for separately.
2.2.2. Operating Cost
The Operating cost (OC) is constituted of all of the costs required for the operations of the vehicles, including fuel costs, i.e., annual diesel fuel cost () for DB and annual electricity cost () for EB; annual vehicle license (); and annual insurance cover ().
To quantify the fuel costs for both EB and DB, two existing bus routes with a minimum distance of 64.2 km and maximum distance of 140 km, are considered, in order to derive annual distance travelled . The annual fuel cost () for DB in year i is calculated based on the average fuel consumption of the DB [34], and the local subsidized diesel price [24].
It is evident from Equation (3), above, that the cost of fuel increases with the increase in distance travelled, the diesel price , and the average fuel consumption of the DB or fuel efficiency . Generally, the more efficient the DB is, the lower the fuel cost, although high-efficiency vehicles usually do come with an increased acquisition cost. Fuel efficiency is dependent on driving patterns, quality of fuel, and the use of auxiliary systems such as air-conditioning systems, with more aggressive driving (with plenty of accelerations, stopping and going, etc.) and usage of auxiliary systems reducing fuel efficiency. The use of low grade fuel may also reduce fuel efficiency, but on the other hand, low grade fuel generally has a lower . The average fuel consumption, as specified by the manufacturer, is used for this feasibility study in order to ensure a realistic comparison between DB and EB, as the average fuel consumption from the manufacturer commonly uses set testing criteria to determine its value [35].
In the case of EB, the fuel costs are calculated based on electrical energy consumption during each charging activity of the battery, the frequency of charging required for its operation, and the type of charger used. Given a charger with power and efficiency , the time required to charge the EB, with capacity Eb from the initial state of charge (SOC) value of to the final SOC value of , is given by:
The amount of energy required from the grid for a one-time charge of the Eb-capacity battery, from to , can then be determined:
The battery capacity of the EB is a fixed constant determined primarily by the EB manufacturer. From Equation (4), the time needed to charge the battery is dependent on the power and efficiency of the charger used, with higher powered and more efficient chargers being capable of reducing the charging time. The amount of energy for a one-time charge of the battery is, however, only dependent on the efficiency of the charger, as can be seen from Equation (5). Generally, a high-powered and highly-efficient charger is more expensive than others. A pantograph charger has a higher power than a plug-in charger, and is thus capable of fast charging the EB in a shorter period of time. However, it is more expensive than a plug-in charger.
Given that and are the energy required for one-time charging, and and are the annual number of charges required to service a particular route, using the pantograph and plug-in chargers, respectively, the annual electricity cost () for the EB in year i using the local subsidized per unit electric of is given by:
Annual vehicle licensing is imposed on EBs in Brunei for road usage, whilst insurance costs cover accidental damage for the EB, which is dependent on cover type. These fees are assumed to be identically imposed on both DB and EB. OC can then be obtained as:
where is either or , depending on the bus type considered.
2.2.3. Maintenance Cost
The maintenance cost (MC) covers the cost of maintaining the bus throughout its lifetime, which includes battery replacement (BRi), tyre replacement (TRi), oil replacement (ORi), scheduled maintenance (SMCi), and unscheduled maintenance (UMCi) costs. SMCi is expected at a set interval, and accounts for costs such as exhaust system and cooling system repairs [36], whilst UMCi accounts for the costs of unplanned repair and servicing.
Battery, tyre and oil replacement costs are incurred as required, with ORi only being applicable for DB. Due to the larger battery capacity of the EB, it is expected to contribute more to the LCC of the EB, as compared to DB. However, this can be expected to be reduced as battery technology becomes more mature, consequently reducing the MC of the EB [37,38].
TRi is calculated based on the tyre count (TC), tyre price (TP), tyre change fee (TCF), and average annual number of tyre changes (TCI).
For DB only, ORi is determined by the oil tank volume (OV), oil price (OP), and annual number of oil changes (OCI).
SMCi and UMCi are normally estimated by the manufacturer, and are given in cost per distance travelled. Given that SMR and UMR are the scheduled and unscheduled maintenance rate, respectively, then,
Overall, the maintenance cost is then given by:
2.2.4. Disposal Cost
Batteries and old buses may be recycled, with costs recovered from their recycling, which is accounted for under Disposal cost (DC):
where is the salvage value of the battery at year i, whilst is the salvage value of the bus at the end of its lifetime. The battery for DB needs more regular replacement compared to EB. However, due to its lower battery capacity, its salvage value may be lower.
2.2.5. Life Cycle Cost
The Overall Life Cycle Cost (LCC) is simply the summation of the acquisition, operation and maintenance costs, less the disposal cost obtained from the recycling of the batteries and buses at the end of their lifetime. The LCC value of EB can be used to determine the feasibility of EB in the market by comparing it with the LCC value of the currently available DB. A lower LCC indicates a more affordable bus.
2.3. Sensitivity Analysis
The LCCs of both DB and EB form the basis for the determination of feasibility of EB to enter and compete in the market. However, these calculations are performed based on market values and assumptions. Whilst extreme efforts have been made to provide information that is as accurate as possible, assumption errors may still creep in. Furthermore, these market values and assumptions are also susceptible to changes from time to time, due to different factors such as supply and demand, technological advancement, policies, public perceptions, and many others, which may alter the outcomes.
Sensitivity analysis can be utilized to assess the influence of varying different cost parameters on the LCC calculations. It can also be used to identify influential parameters which may significantly improve the feasibility of EB, and as such, provide insights to manufacturers, policy-makers and others to efficiently focus their efforts to make EB more affordable. The analyzed parameters are the acquisition cost, battery prices, maintenance costs, and fuel costs.
The acquisition cost is composed of the up-front purchase cost of the Urbino or Coaster, the only component in the LCC calculations that is not affected by interest rates. Of course, tax and subsidy can be, and have been, used by the government to influence the marketability of a product. The provision of a subsidy for EB and the imposition of a tax on DB would, theoretically, improve the feasibility of EB. As such, an analysis on the changes in acquisition costs of both EB and DB would be interesting, especially for the policy maker. Furthermore, as EB is a relatively new technology with limited market penetration, there is limited information available. Most of the information used to estimate its purchase cost is based on publications and news articles, which in turn, may also base their information from other estimates as well. Being a new technology in the developmental stage, it is also evolving very quickly to adapt to demands.
Another important parameter related to new technology is its maintenance rate. Whilst the maintenance rate (MR) of DB is very much established, with the actual rates borne by the local bus operator being used as our basis, the MR of EB is less certain, and is based on estimates from the manufacturer, which may not be familiar with the local market conditions. As such, a sensitivity analysis of the MR of this new technology is crucial.
OC is composed mostly of fuel costs, with both electricity and diesel being subsidized commodities in Brunei, making the analysis of these two commodities particularly interesting. Although the current local electricity price is already low, such that further reduction may be improbable, increasing diesel fuel costs would increase the LCC of DB, making its substitute—i.e., EB—more attractive, and vice versa.
Finally, previous studies [37,38] have indicated that battery price is an important factor that may influence the feasibility of EB. Not only does the reduction in battery price affects battery replacement cost, it will also affect the purchase cost of EB. It would be interesting to see the effect of the battery price dropping to USD$147/kWh, the threshold price at which electric vehicles in general are expected to become mainstream in the US and Europe. An analysis on battery price would provide a clearer picture on the extent of the influence of battery price on the feasibility of EB in Brunei.
2.4. Environmental Impact Analysis
The overall GHG emissions (as defined in the Kyoto Protocol [39]) during the service life of each bus are also investigated. Emissions during other stages, such as during extraction, manufacturing, and end-of-life, are however not considered, as Brunei is primarily a user—rather than a manufacturer—of technology, with no extraction of minerals nor end-of-life processing performed locally. Furthermore, the emissions from the distribution of the fossil fuels are not considered, in order to limit the assumptions of this study. This study is limited only to emissions during the conversion of the fossil fuels into other forms of energy.
Carbon dioxide (CO2), methane (CH4) and nitrous oxide (N2O) emissions are considered, which are aggregated in terms of carbon dioxide equivalence, using weighted-factors of 1, 21 and 310, respectively, to give their greenhouse intensity. The emission of other compounds are omitted due to their minimal contribution during the combustion process [39].
For DB, direct tailpipe emissions are considered during the operation phase, with the emissions being estimated based on the amount of diesel fuel consumed. This is given by:
Despite the fact that EB produces zero tailpipe emissions, GHG are still emitted during electrical generation. For electricity obtained from renewable energies—such as from solar, wind, hydro, etc.—no GHG may be produced, resulting in a fully-zero emission. However, as most countries still rely on some forms of hydrocarbon energy supplies, the GHG emitted at the electricity generation plants need to be taken into consideration.
Given that is the amount of energy required for a one-time charge of the EB, the effective energy requirement that needs to be produced by the power plant must take into account the energy lost during transmission and distribution [40]. For the transmission and distribution system efficiency given by , the effective energy requirement is
Then, the amount of fuel required for the charging of the EB can be calculated as follows:
where and are the power plant efficiency and heating value of the fuel used in the power plant, respectively.
The GHG emissions for EB and DB during the operational stage may then be derived using Equations (15) and (17), respectively, by considering the emission factors of their respective fuels. Diesel fossil fuels are considered in the case of DB, whilst the respective fuel used by the electrical power plant is considered in the case of EB. In order to minimise GHG emissions, the efficiencies—such as power plant efficiency , distribution efficiency and charger efficiency —need to be kept as high as possible.
3. Results and Discussions
The feasibility of EB was determined using the methodologies given above. The data for the calculations were obtained from interviews with local bus companies, research papers, technical notes and specifications from manufacturers, government publications, and subject matter experts, as well as current market prices obtained from various sources. As much as possible, local data were used.
3.1. Data Requirement
The economic feasibility of the EB, specifically the Urbino, was assessed using LCC in Equation (14), and compared to that of DB, specifically the Coaster. Table 2 shows the important parameters that were used to determine the LCC of both DB and EB, with a comparison made in USD$. Where required, the currency conversion was performed with the prevailing exchange rate as of 2019, which was USD$1.00 = B$1.37, with the effect of currency fluctuations being excluded from the calculations. The lifetime n of both buses was taken to be 10 years.
In terms of distance travelled, two extremes were taken: for bus servicing, the route with the minimum distance of 64.2 km and the route with the maximum distance of 140 km from the current intra-district route were considered. According to the scheduling information, each bus was expected to service its assigned route three times a day for the whole year, giving minimum and maximum annual distances of 70,263 km/year and 153,300 km/year, respectively. Plug-in charging at the depot and pantograph charging en-route were considered. For EB on the minimum distance route, only one-time charging was required for each trip, with a plug-in charger being used after the completion of the route. On the other hand, for the EB on the maximum distance route, additional recharging was required during each trip due to the long distance of the full route. In this regard, en-route charging using the pantograph charger was then necessary during the route, on top of the plug-in charging. Table 3 depicts the important parameters of the two chargers.
The EB employs a high-power Lithium Iron Phosphate (LFP) battery with a capacity of 160 kWh and an average battery consumption of 0.8km/kWh [41]. The suggested state of charge (SOC) usage for LFP batteries is between 10–90% [42]. It was noted that many countries adopted a peak and non-peak electricity charging system. In such a case, the annual electricity fuel cost may vary between the lower off-peak electricity cost and the higher peak electricity cost [43]. However, electricity charges for non-residential buildings in Brunei follow a tiered-tariff system, with the electricity cost for charging being fixed at USD$0.04/kWh, which is the common tier for most non-residential buildings in Brunei. The annual road tax and insurance fees for both buses were approximated to be USD$204.38 and USD$1459.85, respectively. These costs are incurred at the beginning of the year.
The scheduled and unscheduled maintenance rates for DB were estimated at rates of USD$0.14/km and USD$0.56/km, respectively, whilst for EB, the rates were USD$0.13/km and USD$0.50/km, respectively. These values were obtained from the manufacturers, as well as local distributors. The scheduled and unscheduled maintenance rates for EB were around 8% and 11%, respectively, which are lower than those for DB due to the EB having fewer movable parts, and consequently less wear and tear. These maintenance costs exclude tyre and oil replacements for DB, which were accounted separately, based on local market information. Also excluded was the battery replacement cost, which represents one of the major costs for EB. It was assumed that the battery replacement occurs every 5 years [44], with battery degradation causing annual capacity loss in the battery [45].
3.2. Techno-Economic Analysis
The overall LCCs of Coaster and Urbino for the two distance scenarios, the minimum and maximum distance travelled, are shown in Table 4 and Figure 3.
For both scenarios, the LCC of EB is comparatively higher than the LCC of DB. For buses on the minimum distance route, the LCCs of EB and DB are USD$932,760 and USD$558,547, respectively, showing that EB is 67% more expensive than DB. For buses on the maximum distance route, the difference is less, with EB only 31.6% more expensive than DB. LCCs of EB and DB for maximum distance route are USD$1,347,343 and USD$1,023,993, respectively. These indicate that EB is still economically infeasible in Brunei. Different parameters, for instance tax and subsidy structures, as well as fuel prices, may affect the feasibility of EB to penetrate the market. Countries such as France, China and many others, have already started to adopt EBs as replacements for their diesel public buses by putting in various efforts for their promotion. As such, it is very important, at this stage, to identify the dominant factors that influence the feasibility of EB in a particular market.
It can be observed that MC represents a large proportion of the total LCCs, for both buses. In fact, with the exception of Urbino on the minimum distance route, MCs contribute the largest proportion to their LCCs, with 79.9%, 86.9%, and 61.8% of the LCCs for the Coaster on the minimum and maximum distance route, and the Urbino on the maximum distance route, respectively. Even for the Urbino on the minimum distance route, MC still accounts for 47.1% of its LCC. MC includes scheduled and unscheduled maintenance costs, and battery, tyre and engine oil replacement costs; and the high mileage requirement of the buses requires regular maintenance and upkeep, and hence, the high MC.
MC is followed by AC, and then, OC, with the exception of the Urbino on the minimum distance route. Both electricity and diesel fuel are highly subsidized items in Brunei, with the government setting consistently low purchase prices of USD$0.04/kWh and USD$0.23/L, respectively. As such, OC, which is constituted only of fuel cost, represents only a small proportion of the total LCCs.
It is observed that the MC for Urbino is slightly lower than for the Coaster (in terms of both discounted values as well as percentages of LCCs) for both scenarios. For the buses on the minimum distance route, the MCs are USD$439,291 (47.1%) and USD$446,329 (79.9%) for the Urbino and Coaster, respectively, for a small difference in discounted value of USD$7,038. The difference is larger for the buses on the maximum distance route, with MCs of USD$832,136 (61.8%) and USD$989,538 (86.9%) for the Urbino and Coaster, respectively, giving a difference of USD$157,402. The reason for these differences may be the fact that DBs have more moving parts than EBs, and thus regular maintenance of the different moving parts of a DB is required, with higher distances travelled and other factors—such as driving style and road conditions—making the MC for diesel even higher. This is despite the fact of the high battery replacement cost of the EB’s 160 kWh LPF battery during the fifth year of its operation.
In terms of OC, the Urbino costs slightly more than the Coaster. For buses on the minimum distance route, the OCs are USD$33,308 and USD$32,050 for the Urbino and Coaster, respectively, whilst for the buses on the maximum distance route, the OCs are USD$55,047 and USD$54,285 for the Urbino and Coaster, respectively. These slight differences may be due to the fact that more frequent recharging is required for EB to compensate for the limitations in their short driving range capacity. OCs represent only between 3.6–5.7% of the total LCC. These low percentages are due to the highly-subsidized nature of both diesel and electricity in Brunei.
Another very notable difference between the Urbino and Coaster is in their ACs, with the AC for the Coaster being significantly lower than for the Urbino. ACs represent the initial cost incurred for the purchase of the buses. The Urbino costs USD$460,650, i.e., USD$380,358 more—approximately 475% more—than the Coaster. EB is a relatively new technology in its ascent phase, with limited early adopters, compared to DB technology, which has already matured. Some of the huge price difference may be attributed to the generally-high battery prices, especially for EB, which requires a high capacity LPF battery, resulting in an overall increase in its AC. The exclusion of the high cost of the LPF battery would significantly reduce the purchase cost of the Urbino from USD$460,650 to USD$384,282; however, this is still a far cry from the low cost of the Coaster, at USD$80,292. Additionally, the adoption of EB would definitely require new charging infrastructure to be put in place, which was excluded from the LCC calculations. EBs on the minimum distance route would only require the relatively cheaper plug-in charger, with a purchase cost of USD$110,000, which can then be shared among 8–14 EBs, depending on the scheduling. This would necessitate additional costs of between USD$7,900-USD$13,750 per EB. On the other hand, EBs on the maximum distance route would require at least the pantograph charger. With a purchase cost of USD$230,000, this would necessitate additional costs of between USD$5,750 and USD$23,000 per EB, assuming scheduling among 10–40 EBs.
The DCs are only able to offset a small amount from the total cost, due to the meagre amount offered for scrapped batteries and buses. The Urbino is, however, able to offer slightly more DC, due to its higher capacity battery and heavier weight.
This shows that, despite the fact that the MC for EB is lower than DB, and with almost similar OCs for both buses, the high initial AC of EB represents the most significant barrier to the adoption of EB in Brunei. This is similar to other works in the literature [19,22,23].
Looking specifically at the cost breakdown for the Urbino, it can be seen that, for EB on the minimum distance route, AC contributes the most to its LCC with USD$460,650, or 49.4% of the overall LCC. This is followed by MC with USD$439,291, or 47.1% of its LCC. Approximately 12.7% of the MC is due to the battery replacement cost. OC only represents 3.6% of the LCC, with DC recouping 0.05% from the overall cost. It is noted that the exclusion of the high cost of battery during acquisition and replacement reduces the LCC value from USD$932,760 to USD$801,006, or 15% from the total LCC.
On the other hand, for EB on the maximum distance route, MC contributes the most to its LCC with USD$832,136, or 61.81% of the overall LCC, followed by AC with USD$460,650, or 34.2% of its LCC. OC only represents 4.1% of the LCC, with DC recouping 0.04% from the overall cost. It is noted that the exclusion of the high cost of battery during acquisition and replacement reduces the LCC value from USD$1,347,343 to USD$1,215,589, or 10% from the total LCC.
3.3. Sensitivity Analysis
A sensitivity analysis was then performed to investigate the effect of varying the six selected parameters: the acquisition costs (AC) for both buses, maintenance rate of EB (both the scheduled and unscheduled maintenance rates), electricity fuel cost (), diesel fuel cost (), and battery price. Varying the AC and maintenance rate of EB, electricity fuel cost and battery price affect LCC of EB. On the other hand, varying AC of DB and diesel fuel cost, directly affect the LCC of DB only, however, it indirectly influence the feasibility of EB.
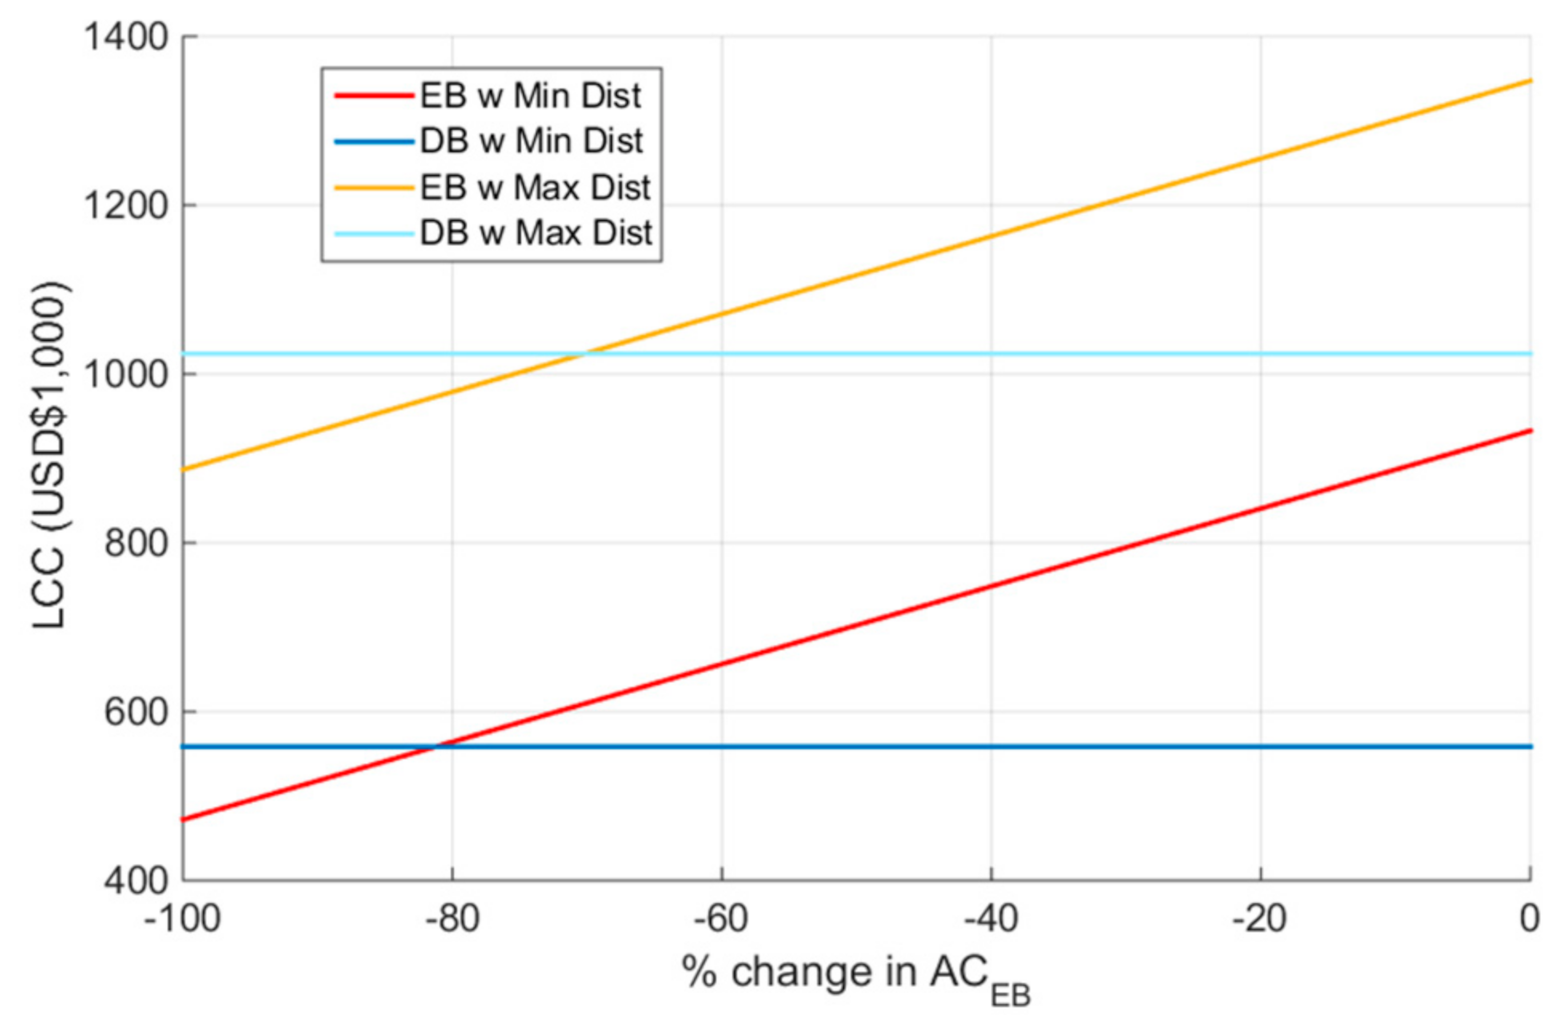
It was previously shown that EB has a higher LCC than DB. The effect of increasing the AC of DB on the competitiveness of EB, for buses on the minimum and maximum routes, is shown in Figure 4. It can be seen that EB can be made more attractive by increasing the AC of DB. For buses on the minimum distance route, the AC of DB would have to be increased by approximately 467%—i.e., from USD$80,292 to USD$455,255—for EB to be cheaper than DB, whilst for buses on the maximum distance route, the AC would have to be increased by approximately 403%, i.e., from USD$80,292 to USD$403,868. The AC of DB can be increased by imposing taxes, thereby discouraging the purchase of new DB over EB.
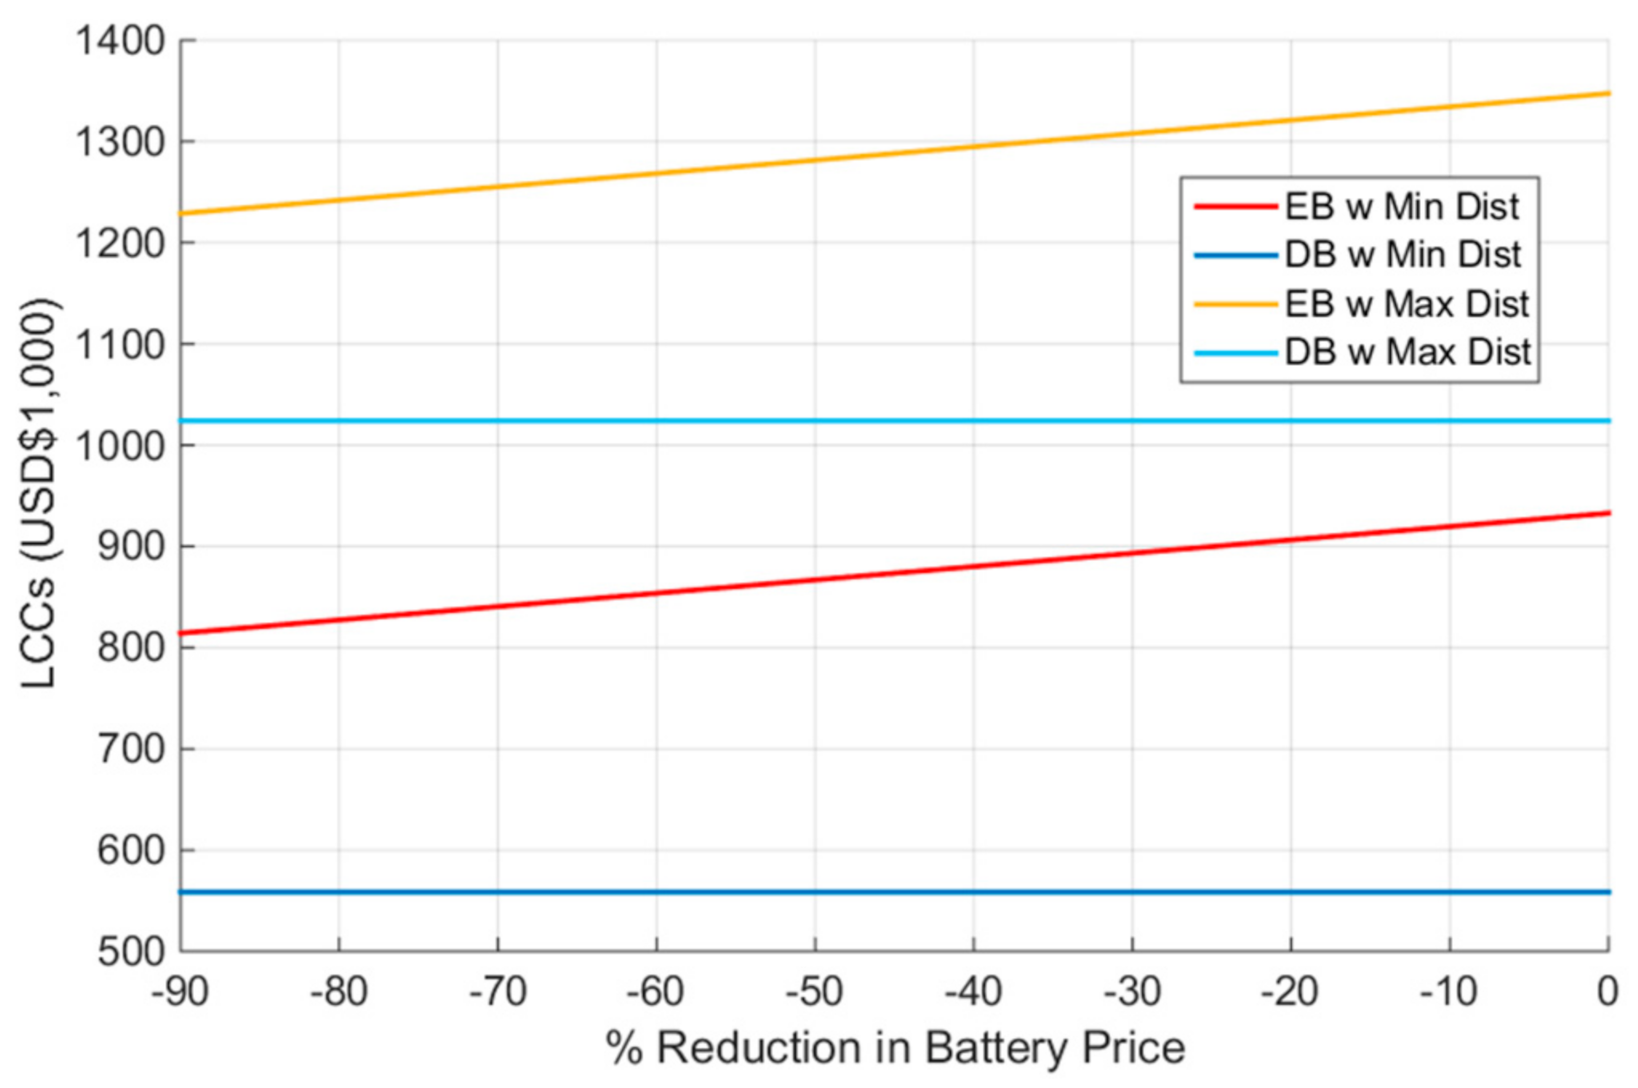
An alternative would be the reduction of the AC of EB directly via subsidy. Figure 5 shows the LCCs of both buses for different percentage reductions of the AC of EB. It can be seen from the figure that, even with the current low price of DB, there is a possibility of making EB more competitive in the local market through adjustments to its AC. Reducing it by approximately 81.5% and 70.5% for buses on the minimum and maximum distances routes, respectively, would make EB cheaper. These equate to reductions of USD$324,758 and USD$375,430, respectively, from its current price of USD$460,650.
Obviously, relying on subsidy alone to improve the feasibility of EB would be very expensive. On the other hand, imposing more than a 400% tax over the price of DB would be a very risky endeavor, and potentially a policy suicide. A more realistic approach would be to implement both taxes and subsidies in differing amounts.
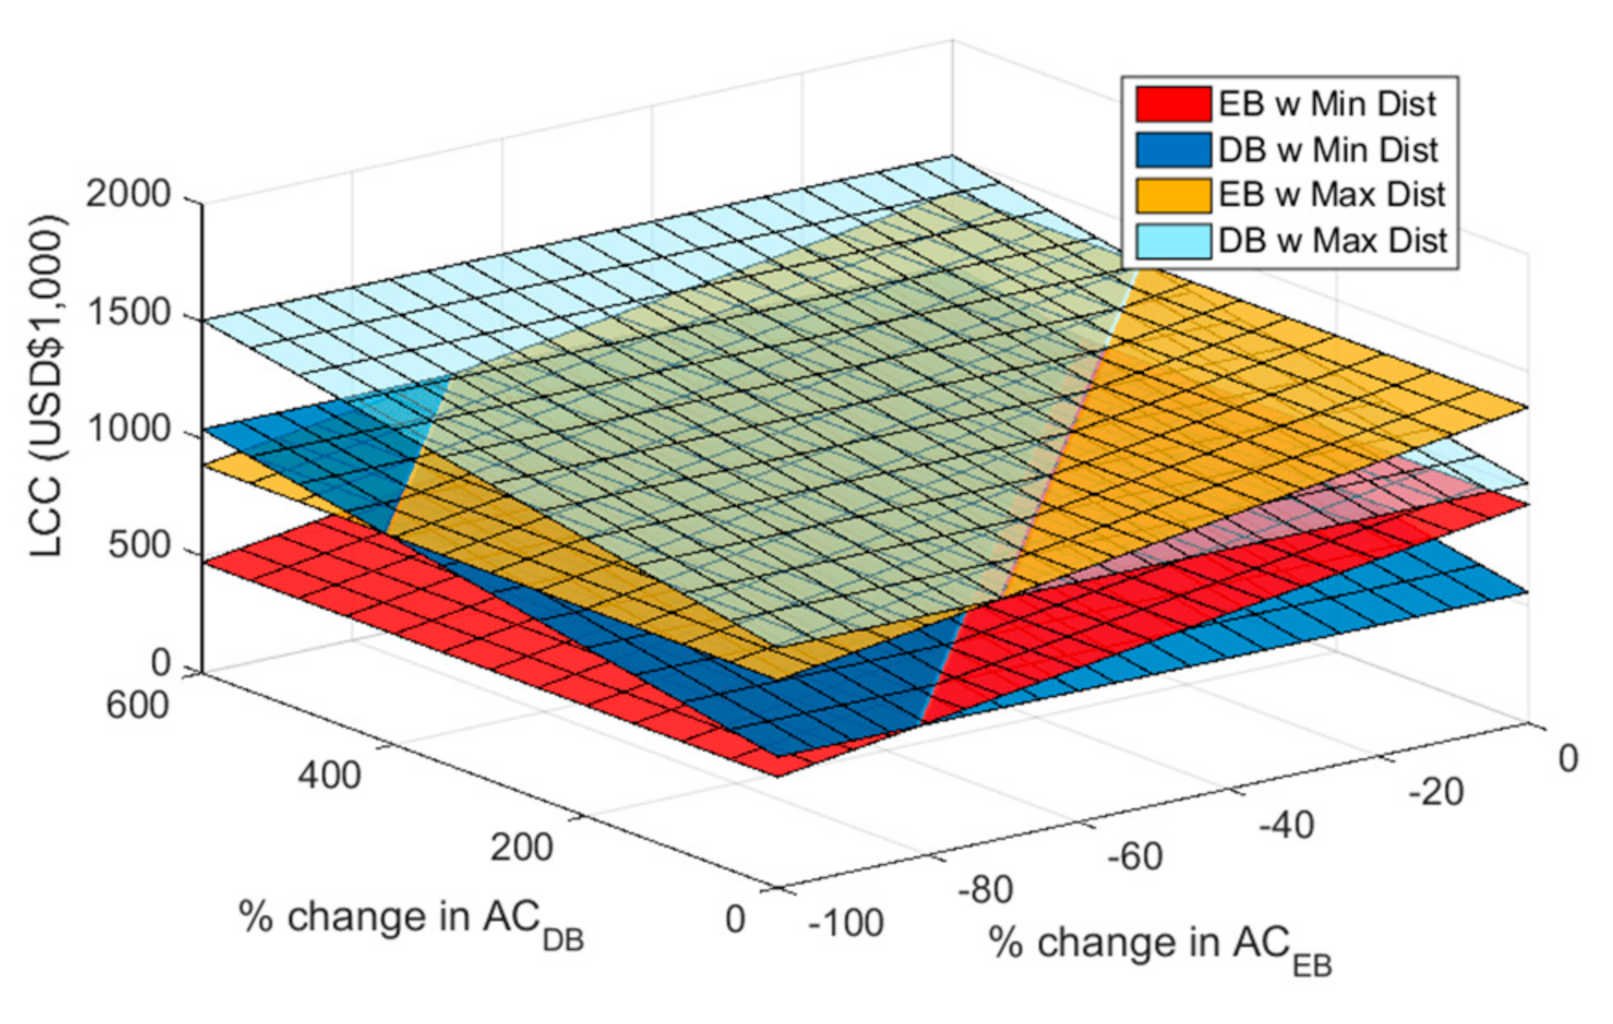
The effect of varying the ACs of both buses on their LCCs is shown in Figure 6, with the changing AC also changing its respective LCC. It can be observed that the combination of an increase in the AC of DB through tax, and a decrease in the AC of EB through subsidy would actually make the LCC of EB lower than that of DB, and hence make it economically feasible. In fact, for a given adjustment in the AC of EB through subsidy, there is a corresponding adjustment in the AC of DB that would make the LCC of EB lower than the LCC of DB. For instance, the combined introduction of a 230% tax on the cost of DB and subsidy of 40.5% on the cost of EB would make EB more competitive to DB, with equal costs of approximately USD$186,000 tax and subsidy. Thus, the ACs of both buses play important roles in promoting the use of EB, with both ACs being controllable through tax and subsidy.
The results from the previous section indicate that MCs represent substantial contributions to the LCCs of both buses. Whilst the MC for DB was estimated based on local market information, and hence is very much reflective of its real MC, the MC for EB was made based on estimates from the manufacturer, which may have very limited knowledge of the local market conditions. This makes the MC for EB somewhat more prone to error. Furthermore, being a relatively new technology, its maintenance may also be subject to changes according to the progress of the technology. As such, a sensitivity analysis on maintenance rate of EB is necessary, which is given in Figure 7. It can be seen that, for buses on the minimum distance route, no reduction in the maintenance rate of the scheduled and unscheduled maintenance would make the LCC of EB lower than that of DB. This is because AC, rather than MC, is the dominant factor in the high LCC of EB on the minimum distance route. On the other hand, for buses on the maximum distance route, the reduction of the maintenance rate by approximately 44% is able to make EB more competitive in terms of LCC.
A sensitivity analysis on the effect of changing the battery price on LCCs is shown in Figure 8, with a reduction in the battery price reducing both the acquisition and battery replacement costs, especially for EB due to its larger battery capacity. It was reported that electric vehicles, generally, would be expected to be mainstream with the dropping of battery price to USD$147/kWh [37,48]. Whilst the LCC of EB does reduce with a reduction in battery prices, it just does not reduce enough for EB to be competitive with DB. This is rather expected. Although MC contributes a large proportion to the LCC of EB, battery replacement only contributes around 13% and 7% of the MC for the minimum and maximum distance route, respectively, with other types of maintenance contributing more to the LCC of the high mileage bus.
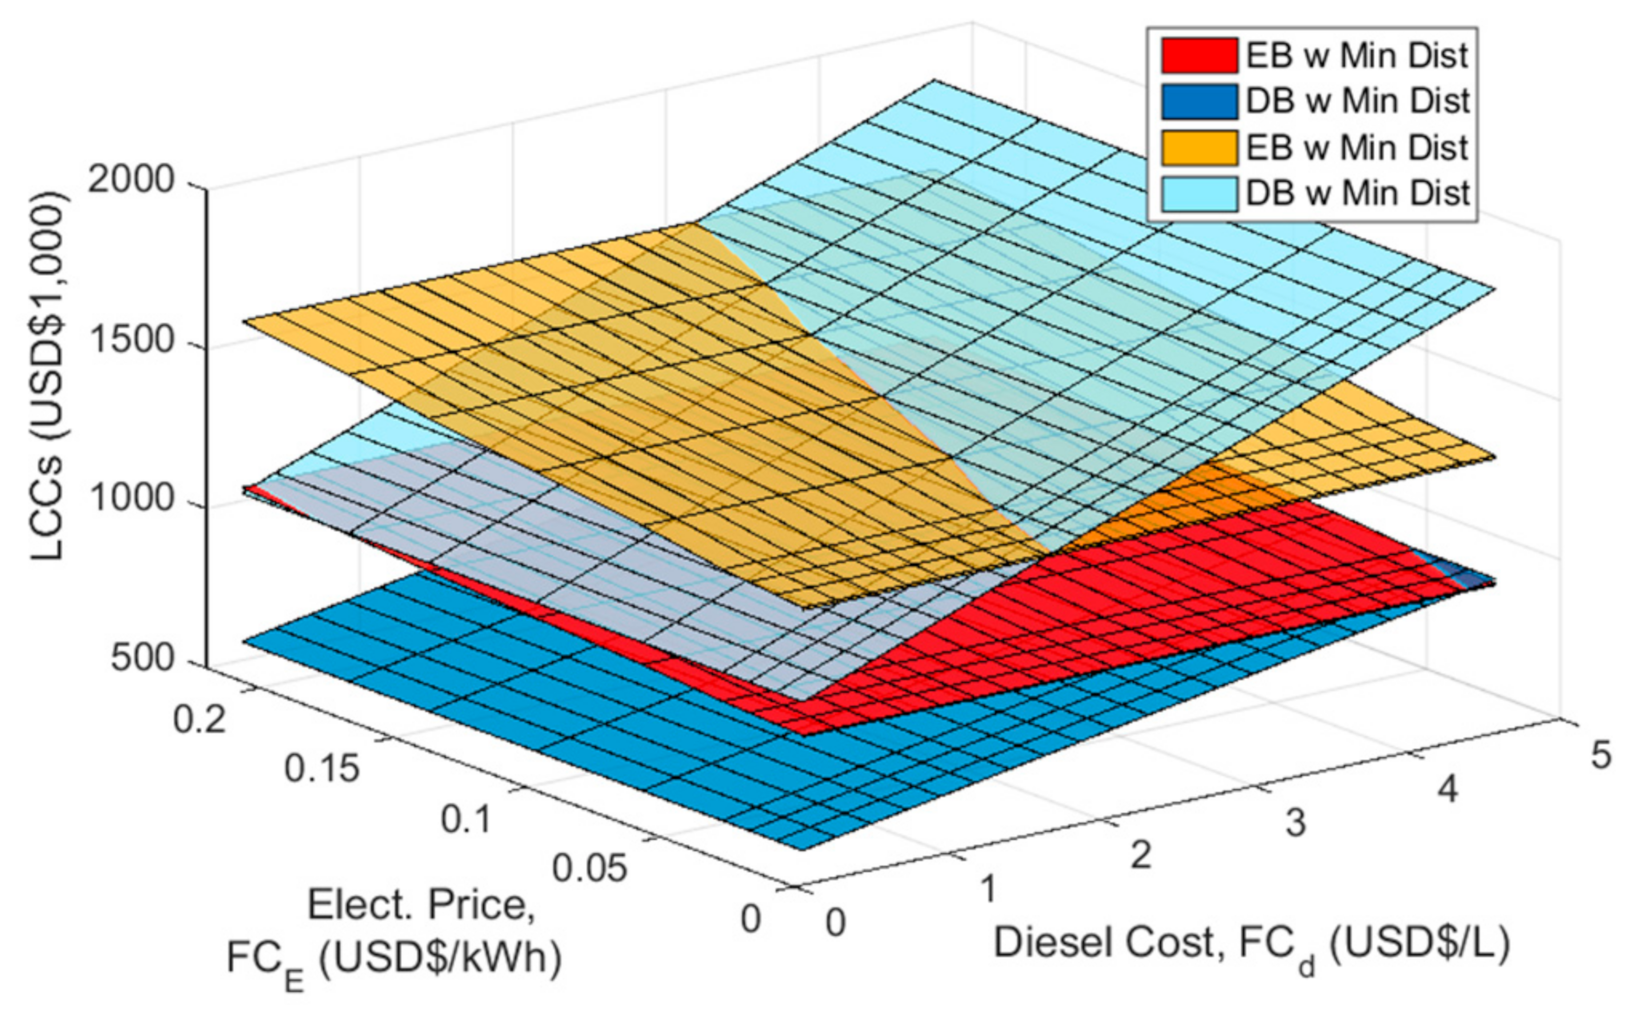
The relationship between the LCCs of both buses with diesel cost and electric price is shown in Figure 9. Due to the different fuel requirements of EB and DB, increasing electric price only increases the LCC of EB, with the LCC of DB remaining constant. On the other hand, increasing diesel cost increases the LCC of DB, with the LCC of EB remaining constant. It can be observed that for every electricity price, there exists a corresponding diesel price that would make the LCC of EB reach a parity to the LCC of DB. Increasing the diesel price beyond this parity diesel price would make EB cheaper in terms of LCC. Similarly, it can also be said that, for a given diesel price, there exists a corresponding parity electricity price, with the lowering the electricity price below this parity electricity price being capable of making EB more affordable. Both electricity and diesel are highly-subsidized commodities in Brunei, and can be used by policy makers to promote EB through the manipulation of their prices.
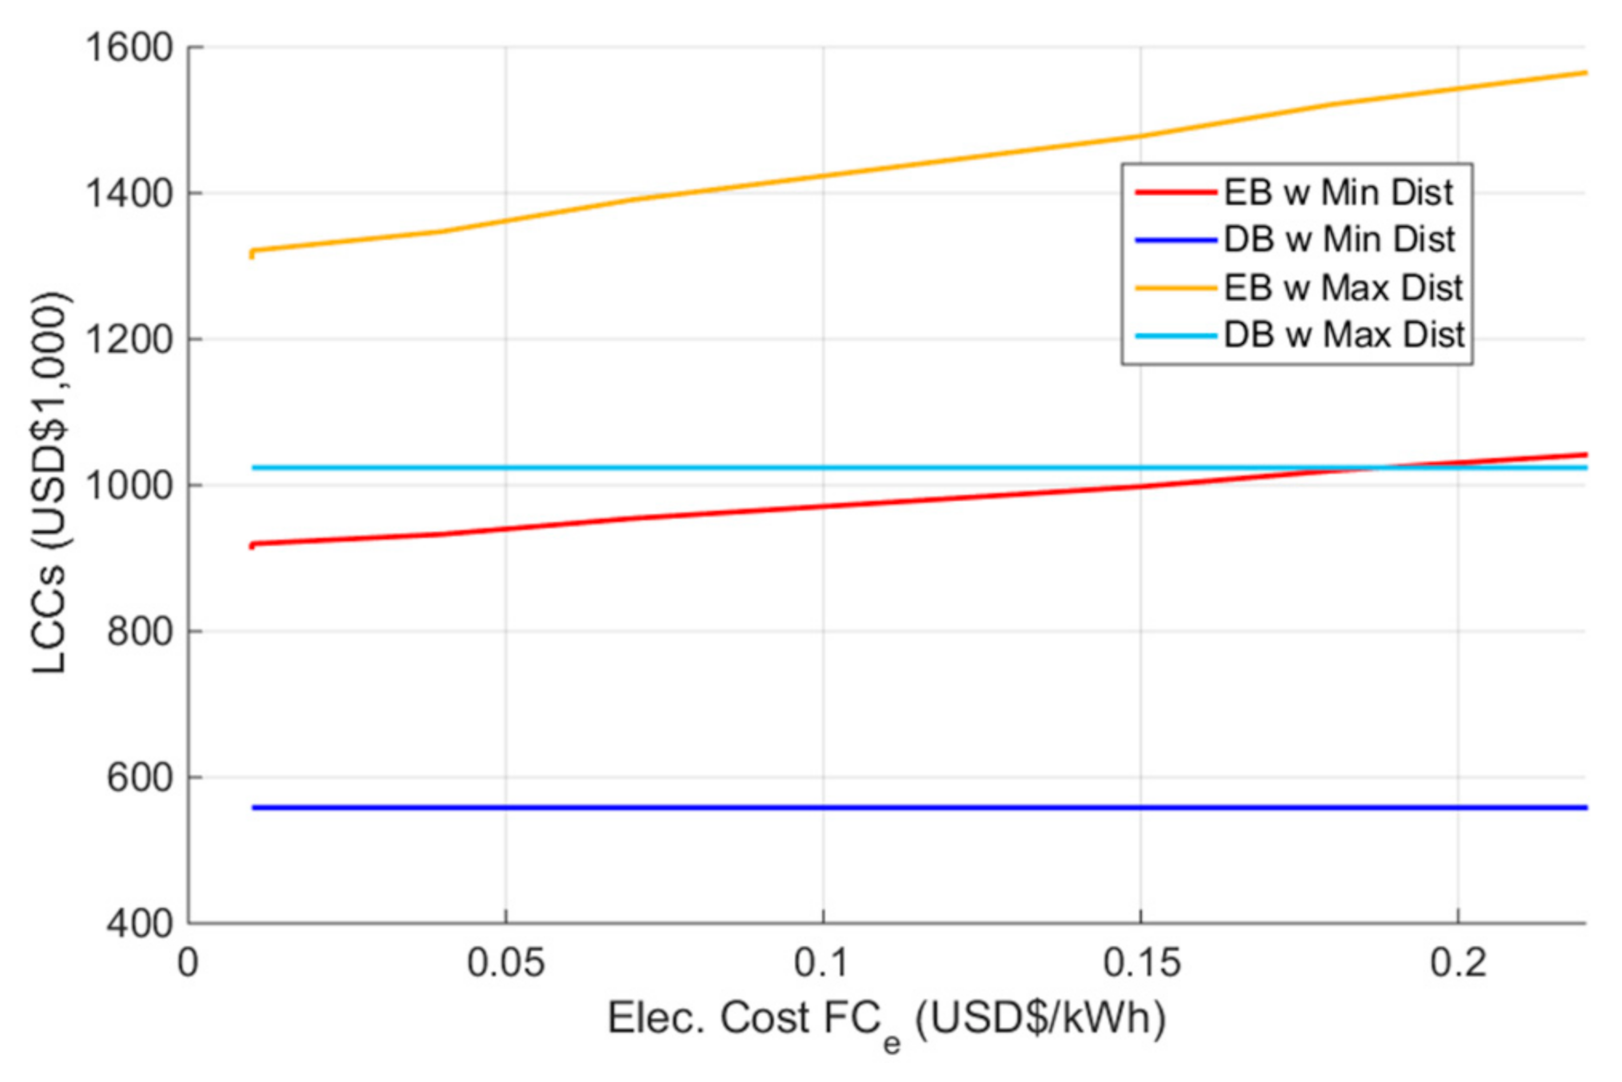
An electricity cost of USD$0.036/kWh was used as a basis for the LCC calculations, whilst the subsidized price for diesel fuel was fixed at USD$0.23/L. The effect of changing the price of either electricity or diesel, whilst keeping the other price at the current subsidized costs, may be analyzed by dissecting the 3D plot of Figure 9 at the subsidized prices of diesel and electricity, in order to produce Figure 10 and Figure 11, respectively.
The effect of varying the electricity price from the current USD$0.036/kWh on the LCCs of both EB and DB at the current subsidized diesel rate of USD$0.23/L is shown in Figure 10. Due to the already low electricity price, lowering the electricity price further to USD$0.01/kWh does lower the LCC of EB; however, it just does not lower it enough to make EB more attractive than DB. As such, lowering the electricity price of what is already one of the cheapest electricity prices in the world [49] may not be a feasible option to encourage EB usage.
The effect of varying diesel cost on LCCs, with the electricity price fixed at USD$0.036/kWh, is given Figure 11. It can be seen that diesel price would need to be increased to USD$4.70/L and USD$2.00/L for EB to be cheaper than DB for buses on the minimum and maximum distances route, respectively. These are huge 800% and 2000% increases from the current subsidized price of USD$0.23/L. However, to put it in a bigger picture, these prices are reasonable given the one-year average diesel price in the US—as per 2019—of USD$3.101/L, and still lower than the highest recorded average diesel price in the US of USD$4.845/L [50]. Indeed, a direct correlation exists between EB adoption and diesel price, as was reported in [51].
Our previous analysis has shown that AC and MC are the two dominant components which contribute significantly to the LCC of EB. The manufacturers of EB need focus their efforts on reducing these two components, in order to ensure that EB becomes competitive.
In the meantime, in order to encourage the adoption of EB in Brunei, the government needs to look into introducing strong incentives. Indeed, previous studies have indicated that interventions from governments are necessary [52,53], at least in the initial stage, during the adoption of a new technology. It is incumbent that infrastructures, including chargers, are in place for the use of EB to take off, as well as for the maintenance rate to be kept as low as possible, by ensuring the maintenance capabilities of workshops, especially for the basic and preventive maintenance of EB. Combinations of direct subsidies to reduce the AC of EB, and tax for DB, may be necessary, as our results have indicated that subsidies alone may be a very expensive exercise to be borne by the government alone. Additionally, the price of diesel fuel may need to be revised by reducing the amount of subsidies, in order to make it more in line with other countries which have successfully adopted EB, such as US and France.
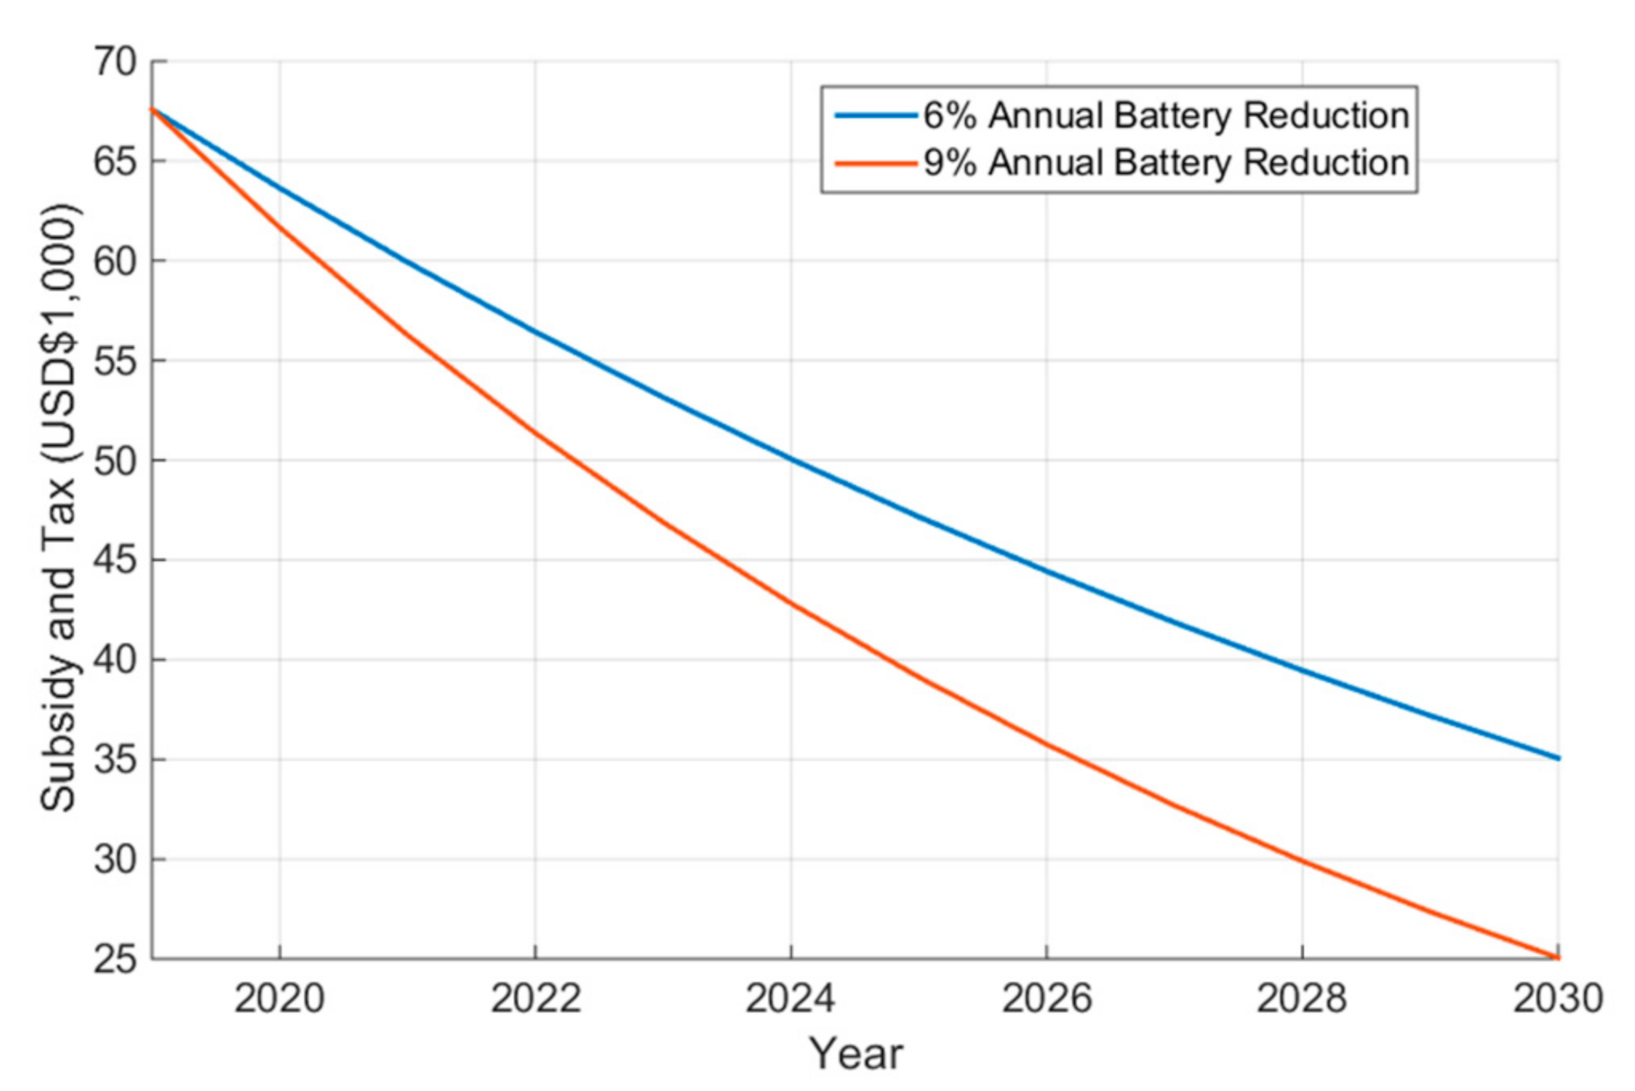
By increasing diesel costs to USD$3.101/L (similar to the one year average diesel price in the US, as per 2019), EB already turns out cheaper than DB for buses on the maximum distance route. However, for buses on the minimum distance route, a subsidy of USD$67,586 towards the purchase of EB, and tax of USD$67,586 for the purchase of DB are necessary for EB to be on par with DB. With the expected decline in battery prices of between 6–9% annually until 2030 [37], the amount of tax and subsidy can be tapered gradually whilst continuously encouraging the use of EB. Figure 12 shows the amount of subsidy and tax required for EB to be at least at a par or cheaper than DB, between 2019 and 2030, for buses on the minimum distance route, with diesel prices set to USD$3.101/L. Although, initially, a large tax and subsidy of USD$67,586 are required, the amount gradually reduces. However, even in the year 2030, when battery prices are expected to stabilize, a tax and subsidy of USD$35,062 and USD$25,054 for assumed annual battery reductions of 6% and 9%, respectively, are still required.
The disposal cost of batteries may also affect the LCC of both buses, but specifically EB, due to its larger battery size. At the moment, the salvage value of batteries actually reduces LCCs. If the disposal cost of batteries is increased, the salvage value of batteries may reduce or even worse, the users may need to pay to dispose of their batteries. In such cases, the LCCs of both DB and EB would increase, with the LCC of EB having a larger increase due to its larger battery size. In order to properly analyze the effect of changes in the cost of battery disposal, a sensitivity analysis may be performed. However, it is noted that, in the current circumstances, the disposal cost contributes minimally (only 0.04% and 0.01% for the maximum distance considered for EB and DB, respectively) towards reducing LCC, and hence is not considered for sensitivity analysis.
3.4. Environmental Impact Analysis
The estimations of the GHG emissions during the operational stage of both buses were calculated using the combustion emission factors of their respective fuel types. Mobile diesel fuel combustion data were used for DB. Since natural gas is the main energy source of electrical generation plants in Brunei, stationary combustion data for natural gas were used for EB. The parameters for the mobile combustion of diesel fuel and the stationary combustion emission factors for natural gas are shown in Table 5 [54]. The efficiency of the power plant and the average efficiency of transmission are assumed to be 28.4% and 93.586% [55], respectively.
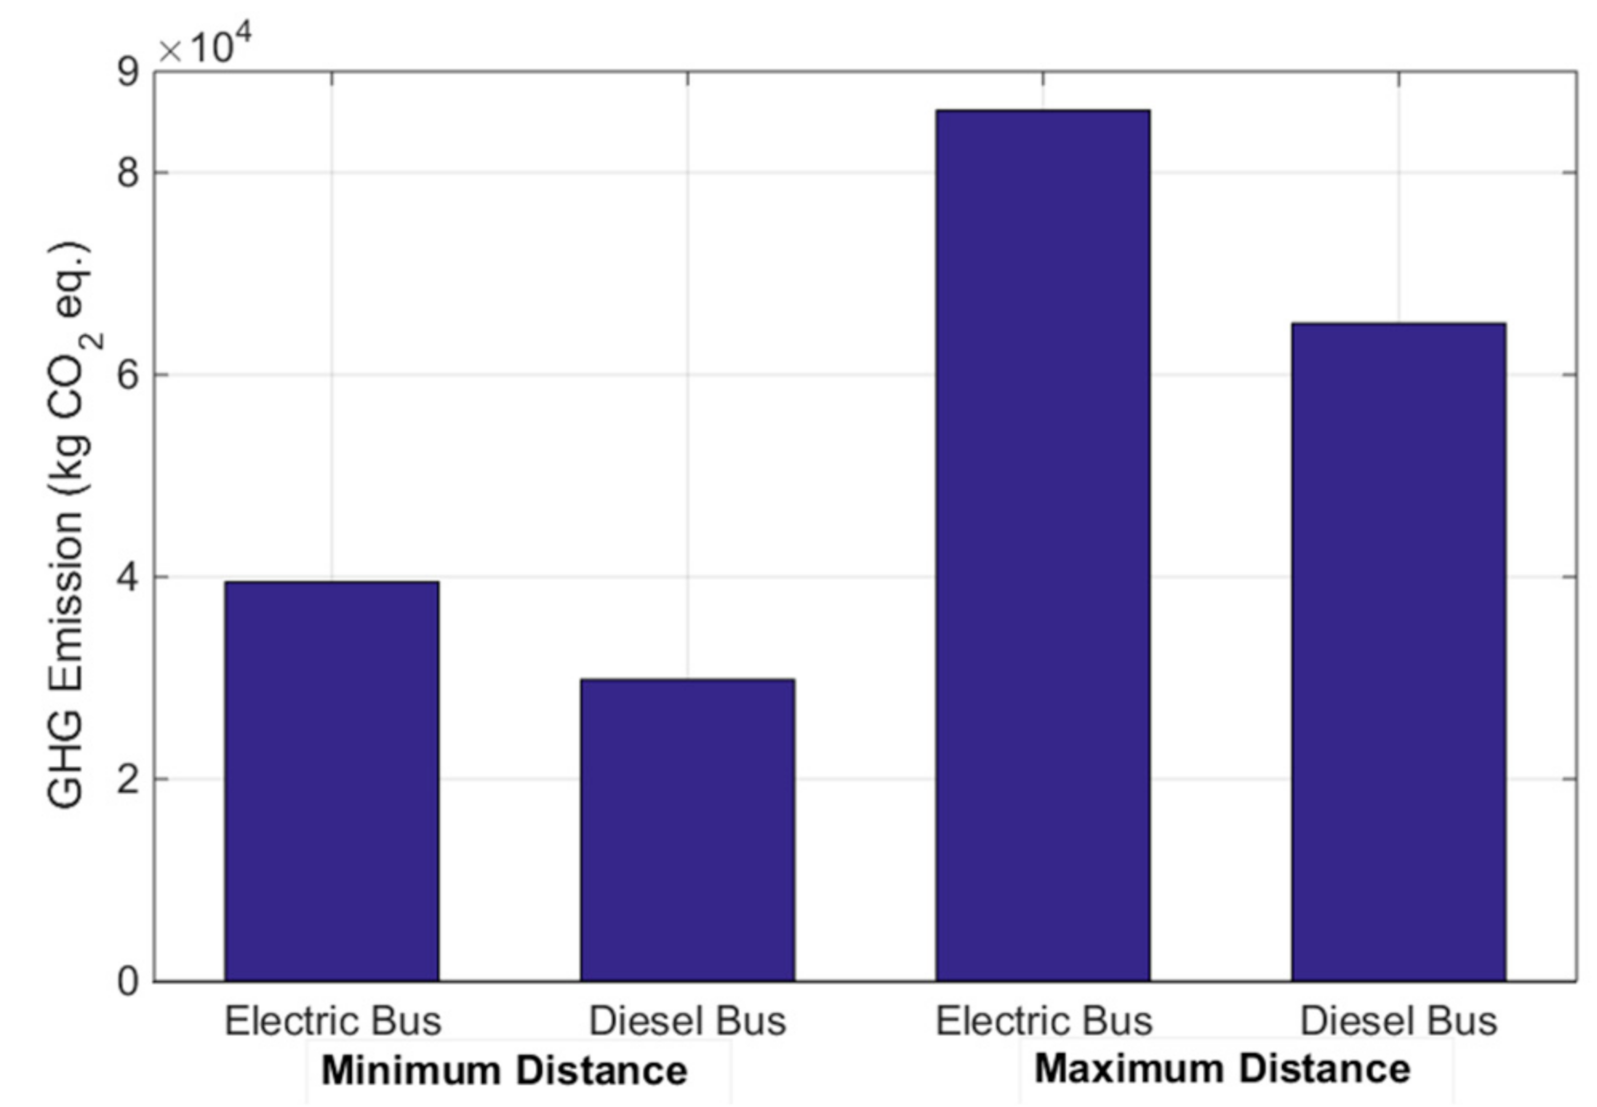
Figure 13 and Table 6 show the annual GHG emissions for EB and DB, for both the minimum and maximum distance routes. In both cases, it can be observed that the GHG emissions from EB are notably higher than those of DB. In total, 39,482 kgCO2 equivalent and 86,142 kgCO2 equivalent of emissions are produced annually by EB, not at its tailpipe but at the electricity generation power plant, for the minimum and maximum distance routes, respectively. These are in contrast to DB, with emissions of 29,823 kgCO2 equivalent and 65,069 kgCO2 equivalent. The emissions from EB represent approximately 75.5% and 32.4% more emissions over the emissions from DB for the minimum and maximum distance routes, respectively. These results are, indeed, disconcerting, as EB was touted as a cleaner substitute of DB, with zero tailpipe emissions. In fact, in order to take full advantage of the environmental advantages of using EB, considerations need to be taken to the whole power supply chain, from generation to distribution, by improving the efficiency of the charger , the efficiency of the distribution , the efficiency of the power plant , and, importantly, using environmentally-cleaner fuel sources for electricity generation.
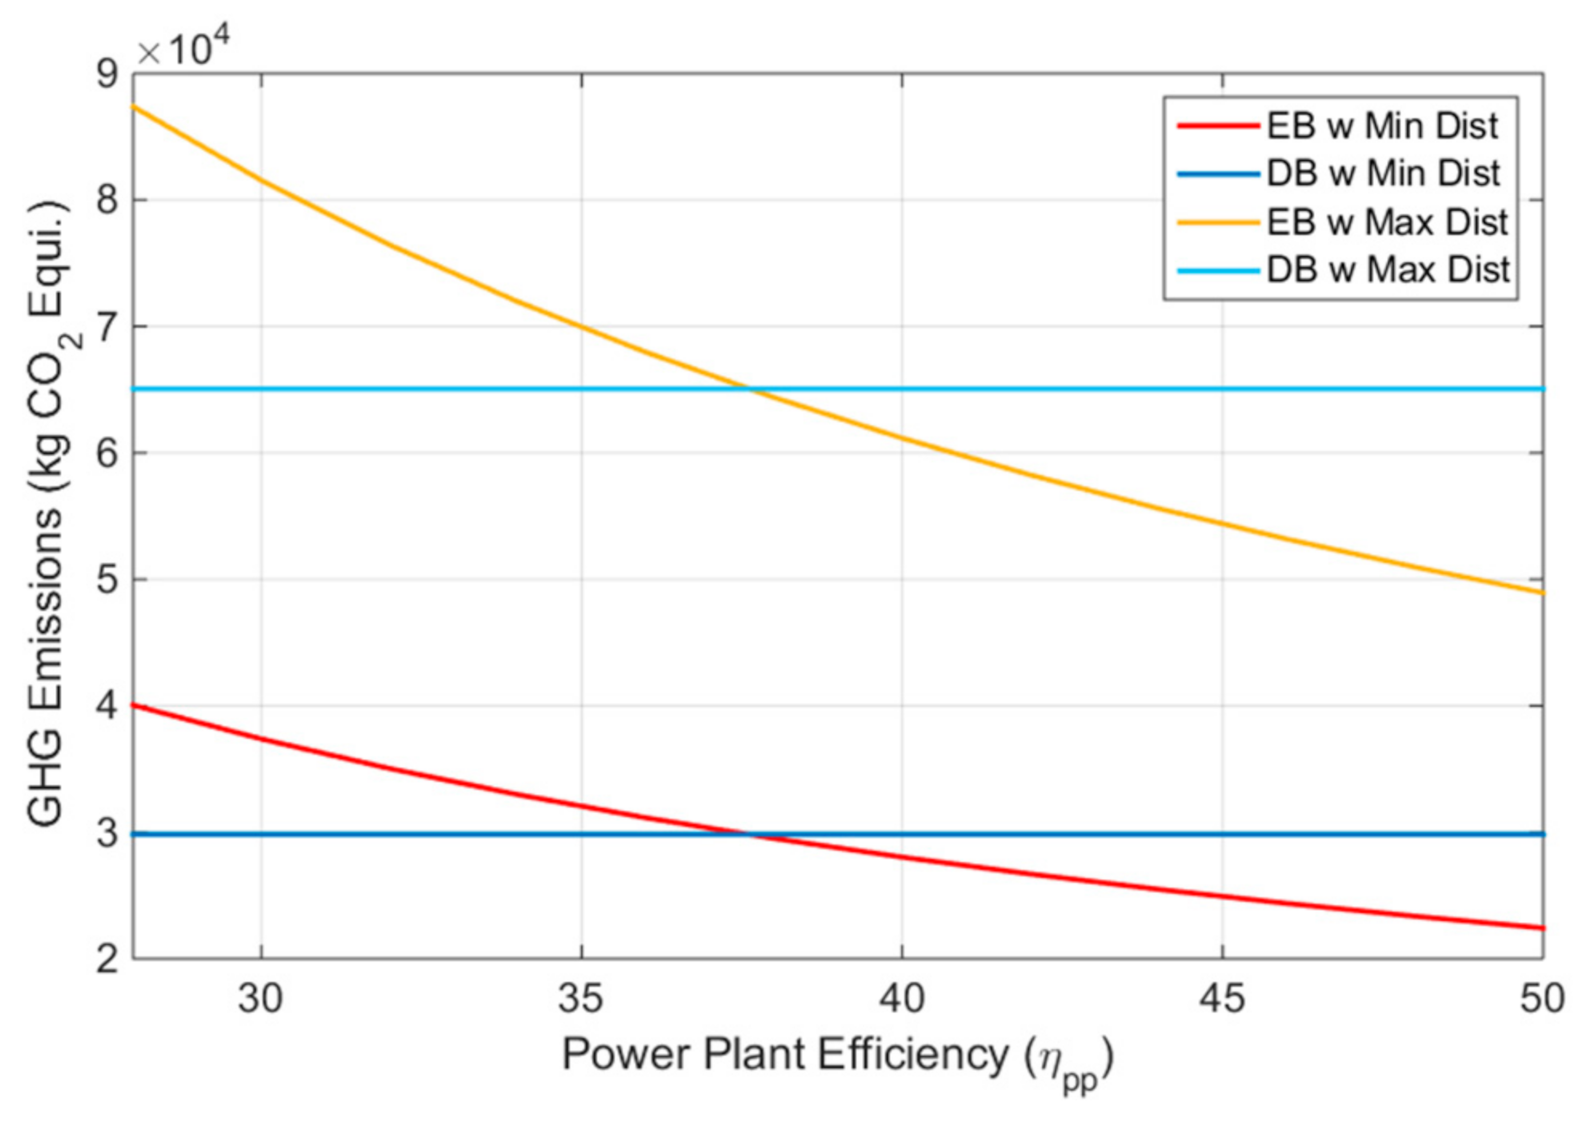
For the case under consideration, the efficiency of the power plant is relatively low, at 28.4%, with more efficient power plants (as high as 42%) having been reported in the literature utilizing multi-fuel generation [56]. Figure 14 shows the GHG emissions from EB for different power plant efficiencies, . It can be seen that both buses emitted the same GHG amount at 37.6% power plant efficiency.
Another way of taking advantage of EB is by using renewable energy sources, such as solar power [57,58], in which Brunei has an edge in this regard due to its equatorial location [59]. Brunei sourced 99% of its electricity generation from natural gas, which is a relatively cleaner source of energy than other fossil sources, such as coal and diesel. The emissions from these natural gas plant can be curbed further by adopting carbon capture technology, in order to minimize the amount of CO2 released by the power plant into the environment [60].
4. Conclusions
This paper has presented a method of quantifying the LCC and environmental impact of buses, and used it to analyze the feasibility of EB to enter and compete in a given market against established diesel technology. It was also used to determine the main cost components that influence the feasibility of EB, by considering the minimum and maximum distance scenarios from the existing bus routes in Brunei.
The LCC of the Urbino (as a representative model for EB) was calculated to be USD$932,760 and USD$1,347,343 for the minimum and maximum distance routes, respectively, which was more expensive than the LCC of the diesel Coaster by 67% and 31.6%, respectively. The analysis showed that AC and MC dominate the LCC of the Urbino, with OC representing only a small proportion of its LCC, due to the low subsidized electricity price.
The manufacturers of EB need to focus their efforts on the reduction of AC and MC in order to allow EB to economically compete in the market. Unlike electric vehicles [55] in general, the reduction of battery prices does not significantly affect the feasibility of EB.
It is proposed that the government needs to look into introducing a combination of strong incentives, subsidies for the purchase of EB, and infrastructure support; ensuring that maintenance supports are available; and introducing taxes on the purchase of DB and diesel fuel, in order to make EB economically more sensible, at least at the initial stage. By increasing the cost of diesel to USD$3.101/L, it was shown that a subsidy of USD$67,586 towards the purchase of EB and a tax of USD$67,586 for the purchase of DB are required. With the natural reduction of the price of batteries of around 9% per annum, the amount of tax and subsidy needed are expected to be reduced to only USD$25,054 tax and subsidy required in the year 2030. In order to ensure the success of these drives, appropriate government regulations are required, both to regulate and monitor these different drives, as well as support by various government and non-governmental agencies.
The study has also analyzed the environmental impact of EB operation using the local natural-gas power plant. Despite the fact that EB produces zero tailpipe emissions, the emissions at the electricity generation plant produce significantly higher GHG than from DB. In order to maximize the benefit from EB, improvement in the efficiency of electric power generation is required, with power plant efficiencies over 37.6% leading to a more environmentally sustainable EB. Renewable energy sources for the electric power generation also need to be considered, in addition to the adoption of carbon capture technology to enable the control of CO2 released from power plant.
The findings from the study showed that the promotion of EB adoption in Brunei would require extensive supports from the government in terms of the provision of financial incentives such as tax and subsidies on ACs and diesel prices, in addition to ensuring the availability of suitable infrastructures such as chargers, and also in recruiting competent maintenance capabilities at workshops for EB, in order to assure low maintenance rates. Additionally, the enhancement of power generation efficiency is necessary to take full advantage of the environmental benefit of EB.
Author Contributions
N.K.Y. and P.E.A. conceived of the presented idea and developed the methodology, N.K.Y. performed the computations, P.E.A. verified the analytical methods. All authors discussed the results, contributed to the final manuscript, and reviewed. All authors have read and agreed to the published version of the manuscript.
Funding
This work was supported by UBD Research Grant No: UBD/RSCH/1.3/FICBF(b)/2018/001.
Conflicts of Interest
The authors whose names are listed immediately below certify that they have NO affiliations with or involvement in any organization or entity with any financial interest, or non-financial interest in the subject matter or materials discussed in this manuscript.
References
- Gallet, M.; Massier, T.; Hamacher, T. Estimation of the energy demand of electric buses based on real-world data for large-scale public transport networks. Appl. Energy 2018, 230, 344–356. [Google Scholar] [CrossRef]
- Pojani, D.; Stead, D. Sustainable Urban Transport in the Developing World: Beyond Megacities. Sustainability 2015, 7, 7784–7805. [Google Scholar] [CrossRef] [Green Version]
- Fossil Fuel Free Streets Declaration. Available online: https://www.c40.org/other/green-and-healthy-streets (accessed on 8 May 2020).
- Abas, A.E.P.; Mahlia, T.M.I. Development of energy labels based on consumer perspective: Room air conditioners as a case study in Brunei Darussalam. Energy Rep. 2018, 4, 671–681. [Google Scholar] [CrossRef]
- Mahlia, T.; Syazmi, Z.; Mofijur, M.; Abas, A.P.; Bilad, M.; Ong, H.C.; Silitonga, A. Patent landscape review on biodiesel production: Technology updates. Renew. Sustain. Energy Rev. 2020, 118, 109526. [Google Scholar] [CrossRef]
- Ezzat, M.; Dincer, I. Development, analysis and assessment of a fuel cell and solar photovoltaic system powered vehicle. Energy Convers. Manag. 2016, 129, 284–292. [Google Scholar] [CrossRef]
- Turoń, K. Hydrogen-powered vehicles in urban transport systems—Current state and development. Transp. Res. Procedia 2020, 45, 835–841. [Google Scholar] [CrossRef]
- Technology Roadmap—Biofuel for Transport; International Energy Agency: Paris, France, 2011.
- Ehrenberger, S.; Dunn, J.B.; Jungmeier, G.; Hewu, W. An international dialogue about electric vehicle deployment to bring energy and greenhouse gas benefits through 2030 on a well-to-wheels basis. Transp. Res. Part D Transp. Environ. 2019, 74, 245–254. [Google Scholar] [CrossRef]
- Zhang, C.; Yang, F.; Ke, X.; Liu, Z.; Yuan, C. Predictive modeling of energy consumption and greenhouse gas emissions from autonomous electric vehicle operations. Appl. Energy 2019, 254, 113597. [Google Scholar] [CrossRef]
- Chang, C.-Y.; Chung, C.-L. Greenhouse gas mitigation policies in Taiwan’s road transportation sectors. Energy Policy 2018, 123, 299–307. [Google Scholar] [CrossRef]
- Rahman, S.M.; Khondaker, A.N.; Hasan, M.A.; Reza, I. Greenhouse gas emissions from road transportation in Saudi Arabia—A challenging frontier. Renew. Sustain. Energy Rev. 2017, 69, 812–821. [Google Scholar] [CrossRef]
- Gao, Z.; Lin, Z.; La Clair, T.J.; Liu, C.; Li, J.-M.; Birky, A.K.; Ward, J. Battery capacity and recharging needs for electric buses in city transit service. Energy 2017, 122, 588–600. [Google Scholar] [CrossRef] [Green Version]
- Menéndez, O.; Kouro, S.; Pérez, M.; Cheein, F.A. Mechatronized maximum power point tracking for electric field energy harvesting sensor. AEU Int. J. Electron. Commun. 2019, 110, 152830. [Google Scholar] [CrossRef]
- Iqbal, M.; Nauman, M.M.; Khan, F.U.; Abas, E.; Cheok, Q.; Iqbal, A.; Aïssa, B. Multimodal Hybrid Piezoelectric-Electromagnetic Insole Energy Harvester Using PVDF Generators. Electronics 2020, 9, 635. [Google Scholar] [CrossRef] [Green Version]
- Patella, D.; Perchel, A.; Jaques, I.; Lee-Brown, J.; Baker, M.; Joy, O.; Armato, C.; Steinmetz, R.; Van der Ploeg, R.; Breen, E.; et al. Electric Mobility and Development: An Engagement Paper from the World Bank and the International Association of Public Transport; The National Academies of Sciences, Engineering, and Medicine: Washington, DC, USA, 2018; p. 71. [Google Scholar]
- Electric Buses in Cities: Driving Towards Cleaner Air and Lower CO2; Bloomberg New Energy Finance: New York, NY, USA, 2018; p. 63.
- Xylia, M.; LeDuc, S.; Patrizio, P.; Kraxner, F.; Silveira, S. Locating charging infrastructure for electric buses in Stockholm. Transp. Res. Part C Emerg. Technol. 2017, 78, 183–200. [Google Scholar] [CrossRef]
- Ambrose, H.; Pappas, N.; Alissa, K.P. Exploring the Costs of Electrification for California’s Transit Agencies. ITS Rep. 2017, 2017, 3. [Google Scholar]
- Aber, J. Electric Bus Analysis for New York City Transit; Columbia University: New York, NY, USA, 2016. [Google Scholar]
- Tong, F.; Hendrickson, C.; Biehler, A.; Jaramillo, P.; Seki, S. Life cycle ownership cost and environmental externality of alternative fuel options for transit buses. Transp. Res. Part D Transp. Environ. 2017, 57, 287–302. [Google Scholar] [CrossRef]
- Potkány, M.; Hlatká, M.; Debnár, M.; Hanzl, J. Comparison of the lifecycle cost structure of electric and diesel buses. Nase More 2018, 65, 270–275. [Google Scholar] [CrossRef]
- Stowell, D.; Plumbley, M.D. Automatic large-scale classification of bird sounds is strongly improved by unsupervised feature learning. PeerJ 2014, 2, e488. [Google Scholar] [CrossRef] [Green Version]
- Sheth, A.; Sarkar, D. Life Cycle Cost Analysis for Electric vs Diesel Bus Tansit in an Indian Scenario. Life 2019, 10, 105–115. [Google Scholar]
- Teoh, L.E.; Khoo, H.L.; Goh, S.Y.; Chong, L.M. Scenario-based electric bus operation: A case study of Putrajaya, Malaysia. Int. J. Transp. Sci. Technol. 2018, 7, 10–25. [Google Scholar] [CrossRef]
- Mathieu, L. Electric Buses Arrive on Time—Marketplace, Economic, Technology, Environmental and Policy Perspectives for Fully Electric Buses in the EU; European Federation for Transport and Environment: Brussels, Belgium, 2018. [Google Scholar]
- Peer Review on Energy Report for the APEC Energy Working Group; Asia-Pacific Economic Cooperation: Canberra, Australia, 2013.
- Low-Carbon Transport for Development; Islamic Development Bank: Jeddah, Saudi Arabia, 2018.
- Land Transport White Paper; Ministry of Communications: Bandar Seri Begawan, Brunei, 2012.
- A Study of Long-Term Transport Action Plan for ASEAN; Association of Southeast Asian Nations: Jakarta, Indonesia, 2014.
- TransportBN. Available online: https://www.gov.bn (accessed on 8 May 2020).
- Review to Formulate a Roadmap and Draft National Masterplan for a Sustainable Land Transportation System for Brunei Darussalam; Centre for Strategic and Policy Studies: Bandar Seri Begawan, Brunei, 2014; Volume 5, p. 97.
- Abas, P.E.; Mahlia, T.M.I. Techno-Economic and Sensitivity Analysis of Rainwater Harvesting System as Alternative Water Source. Sustainability 2019, 11, 2365. [Google Scholar] [CrossRef] [Green Version]
- SBT—Global Car Exporter. Available online: https://www.sbtjapan.com/ (accessed on 8 May 2020).
- Mahlia, T.M.I.; Tohno, S.; Tezuka, T. A review on fuel economy test procedure for automobiles: Implementation possibilities in Malaysia and lessons for other countries. Renew. Sustain. Energy Rev. 2012, 16, 4029–4046. [Google Scholar] [CrossRef]
- Eudy, L.; Jeffers, M. Zero-Emission Bus Evaluation Results: County Metro Battery Electric Buses; FTA Report No. 0118; National Renewable Energy Laboratory: Golden, CO, USA, 2018. [Google Scholar]
- Nykvist, B.; Nilsson, M. Rapidly falling costs of battery packs for electric vehicles. Nat. Clim. Change 2015, 5, 329–332. [Google Scholar] [CrossRef]
- Berckmans, G.; Messagie, M.; Smekens, J.; Omar, N.; Vanhaverbeke, L.; Van Mierlo, J. Cost Projection of State of the Art Lithium-Ion Batteries for Electric Vehicles Up to 2030. Energies 2017, 10, 1314. [Google Scholar] [CrossRef] [Green Version]
- Ranganathan, J.; Bhatia, P. The Greenhouse Gas Protocol: A Corporate Accounting and Reporting Standard; World Resources Institute: Washington, DC, USA, 2004. [Google Scholar]
- Alonzo, R.J. Electrical Transmission and Distribution Systems. In Electrical Codes, Standards, Recommended Practices and Regulations; William Andrew Publishing: Boston, MA, USA, 2010; Chapter 12; pp. 405–467. [Google Scholar]
- An Updated Overview of Electric Buses in Europe; ZeEUS eBus Report #2; Zero Emission Urban Bus System: Brussels, Belgium, 2018.
- LiFePO4—Lithium Iron Phosphate Technical Specification. Available online: https://power.tenergy.com/battery-packs/lifep04-packs/ (accessed on 8 May 2020).
- Miller, I.; Arbabzadeh, M.; Gençer, E. Hourly Power Grid Variations, Electric Vehicle Charging Patterns, and Operating Emissions. Environ. Sci. Technol. 2020, 54, 16071–16085. [Google Scholar] [CrossRef]
- Amtu, J. Charge Station by Induction on the Street; Tecnocampus: Barcelona, Spain, 2015; pp. 1–23. [Google Scholar]
- Yang, F.; Xie, Y.; Deng, Y.; Yuan, C. Predictive modeling of battery degradation and greenhouse gas emissions from U.S. state-level electric vehicle operation. Nat. Commun. 2018, 9, 1–10. [Google Scholar] [CrossRef]
- Elin, K. Charging Infrastructure for Electric City Buses; KTH Skolan för Elektrooch Systemteknik: Stockholm, Sweden, 2016. [Google Scholar]
- Göhlich, D.; Fay, T.-A.; Jefferies, D.; Lauth, E.; Kunith, A.; Zhang, X. Design of urban electric bus systems. Des. Sci. 2018, 4, 1–28. [Google Scholar] [CrossRef] [Green Version]
- Van Vliet, O.; Brouwer, A.S.; Kuramochi, T.; Broek, M.V.D.; Faaij, A. Energy use, cost and CO2 emissions of electric cars. J. Power Sources 2011, 196, 2298–2310. [Google Scholar] [CrossRef] [Green Version]
- Electricity Prices. Available online: https://www.globalpetrolprices.com/electricity_prices/ (accessed on 8 May 2020).
- AAA. Gas Prices. Available online: https://gasprices.aaa.com/ (accessed on 9 May 2020).
- Wang, N.; Tang, L.; Pan, H. A global comparison and assessment of incentive policy on electric vehicle promotion. Sustain. Cities Soc. 2019, 44, 597–603. [Google Scholar] [CrossRef]
- Yan, S. The economic and environmental impacts of tax incentives for battery electric vehicles in Europe. Energy Policy 2018, 123, 53–63. [Google Scholar] [CrossRef]
- Palmer, K.; Tate, J.E.; Wadud, Z.; Nellthorp, J. Total cost of ownership and market share for hybrid and electric vehicles in the UK, US and Japan. Appl. Energy 2018, 209, 108–119. [Google Scholar] [CrossRef]
- Emission Factors for Greenhouse Gas Inventories; United States Environmental Protection Agency: Washington, DC, USA, 2014; pp. 1–5.
- Abas, E.; Yong, J.; Mahlia, T.M.I.; Hannan, M.A. Techno-Economic Analysis and Environmental Impact of Electric Vehicle. IEEE Access 2019, 7, 98565–98578. [Google Scholar] [CrossRef]
- Mahlia, T.M.I.; Lim, J.Y.; Aditya, L.; Riayatsyah, T.M.I.; Abas, E. Methodology for implementing power plant efficiency standards for power generation: Potential emission reduction. Clean Technol. Environ. Policy 2017, 20, 309–327. [Google Scholar] [CrossRef] [Green Version]
- Mahlia, T.M.I.; Syaheed, H.; Abas, A.E.P.; Kusumo, F.; Shamsuddin, A.H.; Ong, H.C.; Bilad, M.R. Organic Rankine Cycle (ORC) System Applications for Solar Energy: Recent Technological Advances. Energies 2019, 12, 2930. [Google Scholar] [CrossRef] [Green Version]
- Al-Shetwi, A.Q.; Hannan, M.A.; Jern, K.P.; Alkahtani, A.A.; Abas, E. Power Quality Assessment of Grid-Connected PV System in Compliance with the Recent Integration Requirements. Electronics 2020, 9, 366. [Google Scholar] [CrossRef] [Green Version]
- Malik, A. Assessment of the potential of renewables for Brunei Darussalam. Renew. Sustain. Energy Rev. 2011, 15, 427–437. [Google Scholar] [CrossRef]
- Tola, V.; Pettinau, A. Power generation plants with carbon capture and storage: A techno-economic comparison between coal combustion and gasification technologies. Appl. Energy 2014, 113, 1461–1474. [Google Scholar] [CrossRef]
Figure 1.
(a) Coaster Diesel, and (b) Urbino Electric Buses.

Figure 2.
Illustration of (a) plug-in, and (b) pantograph chargers for electric buses.

Figure 3.
LCCs of diesel and electric buses, with breakdown of their ACs, MCs, OCs and DCs.

Figure 4.
LCCs of the electric and diesel buses, against the percentage change of the AC of diesel buses.
Figure 4.
LCCs of the electric and diesel buses, against the percentage change of the AC of diesel buses.

Figure 5.
LCCs of the electric and diesel buses, against the percentage change of the AC of EB.

Figure 6.
Relationship between the LCCs of electric and diesel buses, with different percentage changes in their acquisition costs.
Figure 6.
Relationship between the LCCs of electric and diesel buses, with different percentage changes in their acquisition costs.

Figure 7.
LCCs of the electric and diesel buses, against the percentage change of the scheduled and unscheduled maintenance rate of electric buses.
Figure 7.
LCCs of the electric and diesel buses, against the percentage change of the scheduled and unscheduled maintenance rate of electric buses.

Figure 8.
Effect of the reduction in battery prices on the life-cycle costs of electric and diesel buses.
Figure 8.
Effect of the reduction in battery prices on the life-cycle costs of electric and diesel buses.

Figure 9.
LCCs of electric and diesel buses, against diesel cost and electric price.

Figure 10.
LCCs of electric and diesel buses, against the varying electricity cost for diesel prices at the current subsidized rate of USD$0.23/L.
Figure 10.
LCCs of electric and diesel buses, against the varying electricity cost for diesel prices at the current subsidized rate of USD$0.23/L.

Figure 11.
LCCs of electric and diesel buses, against the varying diesel cost for electric prices at current subsidized rate of USD$0.036/kWh.
Figure 11.
LCCs of electric and diesel buses, against the varying diesel cost for electric prices at current subsidized rate of USD$0.036/kWh.

Figure 12.
The amount of tax and subsidy required for electric buses to be at least on a par or cheaper than diesel buses between 2019 and 2030, with diesel costs of USD$3.101/L, for buses on the minimum distance route.
Figure 12.
The amount of tax and subsidy required for electric buses to be at least on a par or cheaper than diesel buses between 2019 and 2030, with diesel costs of USD$3.101/L, for buses on the minimum distance route.

Figure 13.
Diesel and electric bus emissions during the operational phase for the minimum distance and maximum distance routes.
Figure 13.
Diesel and electric bus emissions during the operational phase for the minimum distance and maximum distance routes.

Figure 14.
GHG emissions of electric and diesel buses, against power plant efficiency.


Table 1.
Specifications of the buses considered.
| Mechanical Specifications | Diesel Bus (Coaster) | Electric Bus (Urbino) |
|---|---|---|
| Maximum Speed | 60–80 km/h (local bus speed limits) | 50 km/h |
| Passenger capacity | 22 | 21–29 |
| Length | 6990 mm | 8950 mm |
| Width | 2080 mm | 2400 mm |
| Height | 2635 mm | 3400 mm |
| Traction batteries | - | LiFePO4 Lithium ion (LFP) |
| Charging system | - | Plug-in and Pantograph (optional) |
| Input Data | Urbino | Coaster | |
|---|---|---|---|
| Purchase cost | USD$ | 460,650 | 80,291.97 |
| BND$ | 631,090.50 | 110,000 | |
| Electricity Price | USD$/kWh | 0.036 | - |
| BND$/kWh | 0.05 | - | |
| Fuel Efficiency | L/km | - | 0.157 |
| Diesel Price | USD$/L | - | 0.23 |
| BND$/L | - | 0.31 | |
| Ann. road tax fee | USD$ | 204.38 | 204.38 |
| BND$ | 280 | 280 | |
| Ann. Insurance fee | USD$ | 1459.85 | 1459.85 |
| BND$ | 2000 | 2000 | |
| Ann. battery Replacement | USD$ | - | 175.18 |
| BND$ | - | 240 | |
| LFP Battery Price | USD$/kWh | 477.30 | - |
| BND$/kWh | 653.90 | - | |
| LFP Battery Capacity | kWh | 160 | - |
| LFP Battery Lifetime | 3300 Cycles within 5 years | - | |
| Oil tank volume | L | - | 10 |
| Motor oil price | USD$/L | - | 10.22 |
| BND$/L | - | 14 | |
| Oil change freq | Times/yr | - | 24 |
| Price per tyre | USD$ | 131.39 | 131.39 |
| BND$ | 180 | 180 | |
| Tyre count | 6 | 6 | |
| Tyre change freq. | Times/yr | 9 | 9 |
| Scheduled maintenance rate | USD$/km | 0.13 | 0.14 |
| BND$/km | 0.18 | 0.20 | |
| Unscheduled maintenance rate | USD$/km | 0.50 | 0.56 |
| BND$/km | 0.68 | 0.77 | |
| Scrap value for battery | USD$/kg | 0.29 | 0.29 |
| BND$/kg | 0.4 | 0.4 | |
| Scrap value for bus | USD$/kg | 0.04 | 0.04 |
| BND$/kg | 0.05 | 0.05 | |
Table 3.
Chargers considered for the electric bus.
| Plug-in Fast Charger | Pantograph | |
|---|---|---|
| Charger price (USD$) | 110,000 | 230,000 |
| Charger power (kW) | 80 | 240 |
| Charger Efficiency (%) | 0.97 | 0.97 |
Table 4.
Life cycle cost of electric and diesel buses, for the minimum and maximum routes.
| Min Dist | Max Dist | ||||
|---|---|---|---|---|---|
| Urbino 8.9 | Coaster | Urbino 8.9 | Coaster | ||
| AC | USD$ | 460,650 | 80,292 | 460,650 | 80,292 |
| % LCC | 49.4% | 14.4% | 34.2% | 7.8% | |
| OC | USD$ | 33,308 | 32,050 | 55,047 | 54,285 |
| % LCC | 3.6% | 5.7% | 4.1% | 5.3% | |
| MC | USD$ | 439,291 | 446,329 | 832,136 | 989,538 |
| % LCC | 47.1% | 79.9% | 61.8% | 86.9% | |
| DC | USD$ | 489 | 123 | 489 | 123 |
| % LCC | −0.05% | −0.02% | −0.04% | −0.01% | |
| LCC | USD$ | 932,760 | 558,547 | 1,347,343 | 1,023,993 |
Table 5.
Stationary combustion emission factors for natural gas.
| Heating Value | CO2 Factor | CH4 Factor | N2O Factor | |
|---|---|---|---|---|
| Natural Gas | 0.001026 mmBtu/scf | 53.06 kg CO2/mmbtu | 1 g CH4/mmbtu | 0.1 g N2O/mmbtu |
| Diesel Fuel | 2.697 kg CO2 per unit | 0.0051 g/mile | 0.0048 g/mile |
Table 6.
C02, CH4 and N20 emissions of electric and diesel buses during the operational stage.
| Min Dist Route | Max Dist Route | |||
|---|---|---|---|---|
| Urbino | Coaster | Urbino | Coaster | |
| Annual Fuel Consumption | 724,532 scf of natural gas | 11,031 L of diesel fuel | 1,580,796 scf of natural gas | 24,068 L of diesel fuel |
| Annual CO2 emission (kg/yr) | 39,444 | 29,753 | 86,059 | 64,916 |
| Annual CH4 emission (kg/yr) | 0.746 | 0.223 | 1.628 | 0.486 |
| Annual N20 emission (kg/yr) | 0.0725 | 0.210 | 0.158 | 0.457 |
| Annual CO2 equi. (kg/yr) | 39,482 | 29,823 | 86,142 | 65,069 |
Publisher’s Note: MDPI stays neutral with regard to jurisdictional claims in published maps and institutional affiliations. |
© 2021 by the authors. Licensee MDPI, Basel, Switzerland. This article is an open access article distributed under the terms and conditions of the Creative Commons Attribution (CC BY) license (http://creativecommons.org/licenses/by/4.0/).
Share and Cite
MDPI and ACS Style
Yusof, N.K.; Abas, P.E.; Mahlia, T.M.I.; Hannan, M.A. Techno-Economic Analysis and Environmental Impact of Electric Buses. World Electr. Veh. J. 2021, 12, 31. https://0-doi-org.brum.beds.ac.uk/10.3390/wevj12010031
AMA Style
Yusof NK, Abas PE, Mahlia TMI, Hannan MA. Techno-Economic Analysis and Environmental Impact of Electric Buses. World Electric Vehicle Journal. 2021; 12(1):31. https://0-doi-org.brum.beds.ac.uk/10.3390/wevj12010031
Chicago/Turabian StyleYusof, Nurizyan Khairiah, Pg Emeroylariffion Abas, T. M. I. Mahlia, and M. A. Hannan. 2021. "Techno-Economic Analysis and Environmental Impact of Electric Buses" World Electric Vehicle Journal 12, no. 1: 31. https://0-doi-org.brum.beds.ac.uk/10.3390/wevj12010031