
Proton Exchange Membrane Fuel Cell Ejector Test Platform Design and Ejector Test Analysis

1
School of Automotive Studies, Tongji University, Shanghai 201804, China
2
System Integration Department, Shaoxing Xuesen Energy Technology Co., Ltd., Shaoxing 312000, China
*
Author to whom correspondence should be addressed.
World Electr. Veh. J. 2021, 12(3), 103; https://0-doi-org.brum.beds.ac.uk/10.3390/wevj12030103
Submission received: 13 July 2021
/
Revised: 26 July 2021
/
Accepted: 27 July 2021
/
Published: 29 July 2021
(This article belongs to the Special Issue Towards Intelligent E-Mobility—Selected Papers from The 34th International Electric Vehicles Symposium and Exhibition (Nanjing, China))
Abstract
:The hydrogen recirculation system is essential to the performance of the fuel cell system; the ejector device plays an important role in the hydrogen recirculation system. In this paper, a test platform which can simulate the fuel cell anode system is integrated for ejector performance testing. Based on the ejector test platform, an ejector device was tested under different operating conditions. The design of the ejector test platform, the test method and test process are introduced in detail. The test results of the ejector are compared with the Computational Fluid Dynamics (CFD) simulation results of different turbulence models. The results show that the standard k-e model is more accurate than other turbulence models at small and medium flow rates. At a large flow rate, the realizable k-e model has a higher simulation accuracy than other turbulence models.
1. Introduction
The Proton Exchange Membrane Fuel Cell (PEMFC) is an energy conversion device; it can provide power by means of an electrochemical reaction of hydrogen and oxygen. With the characteristics of zero emission, no pollution, high efficiency and high energy density [1,2,3,4], PEMFC can reduce traffic energy consumption effectively and alleviate urban pollution [5,6], which is the future development direction of new energy vehicle power [7,8,9]. Moreover, hydrogen energy is also an important part of the energy management applications of microgrids systems [10].
During the chemical reaction, nitrogen and water from the cathode will permeate to the anode through the proton exchange membrane; it will hinder the diffusion of hydrogen in the gas diffusion layer if the gas does not flow in the anode, and it can also cause fuel cell starvation. The starvation can make the cell polarity reverse and even damage the stack. If the anode is set to the flow-through mode, this will lead to a great waste of hydrogen. Generally, mechanical pumps [11] or ejectors [12,13] are used for hydrogen recirculation, both of which have their advantages and disadvantages. The advantage of the mechanical pump is that it is easy to control and has a wide range of operation; the disadvantage is the existence of parasitic power, noise and vibration. Compared to the mechanical pump, ejectors have the advantages of silence, no power consumption, no relative moving parts and a reliable performance [14,15,16,17].
Ejectors are widely used and researched in many fields, including aviation [18], refrigeration [19,20,21] and desalination [22,23]. They can pump the secondary flow gas to realize the recycling of hydrogen and improve the utilization rate of hydrogen, so a large number of studies focus on using ejectors to realize hydrogen recirculation and improve system efficiency [24,25]. At present, these researches concentrate on the structural parameter optimization and internal flow field analysis of ejectors. For example, Hwang et al. [26] used a numerical simulation to study the influence of the inlet mass flow rate and nozzle throat diameter on the pressure, Mach number, temperature, suction channel mass flow, outlet channel mass flow and suction channel entrainment ratio. Nikiforow et al. [27] designed an ejector for a 5-kW static PEMFC system. The experimental results showed that the boundary conditions of the flow field had a significant effect on the performance of the ejector. However, there has been no detailed investigation of the ejector test method. The purpose of this study is to find a new method for the fuel cell ejector test and a turbulence model suitable for ejector simulation. The test method can verify the performance of the ejector in the actual fuel cell system, and the validation of the turbulence model can provide some suggestions for the Computational Fluid Dynamics (CFD) simulation of the ejector. The research questions in this study focused on the design of the ejector test platform, the performance test of the ejector and turbulence model validation.
2. Ejector Test Platform Design
2.1. Fuel Cell Operational Principle
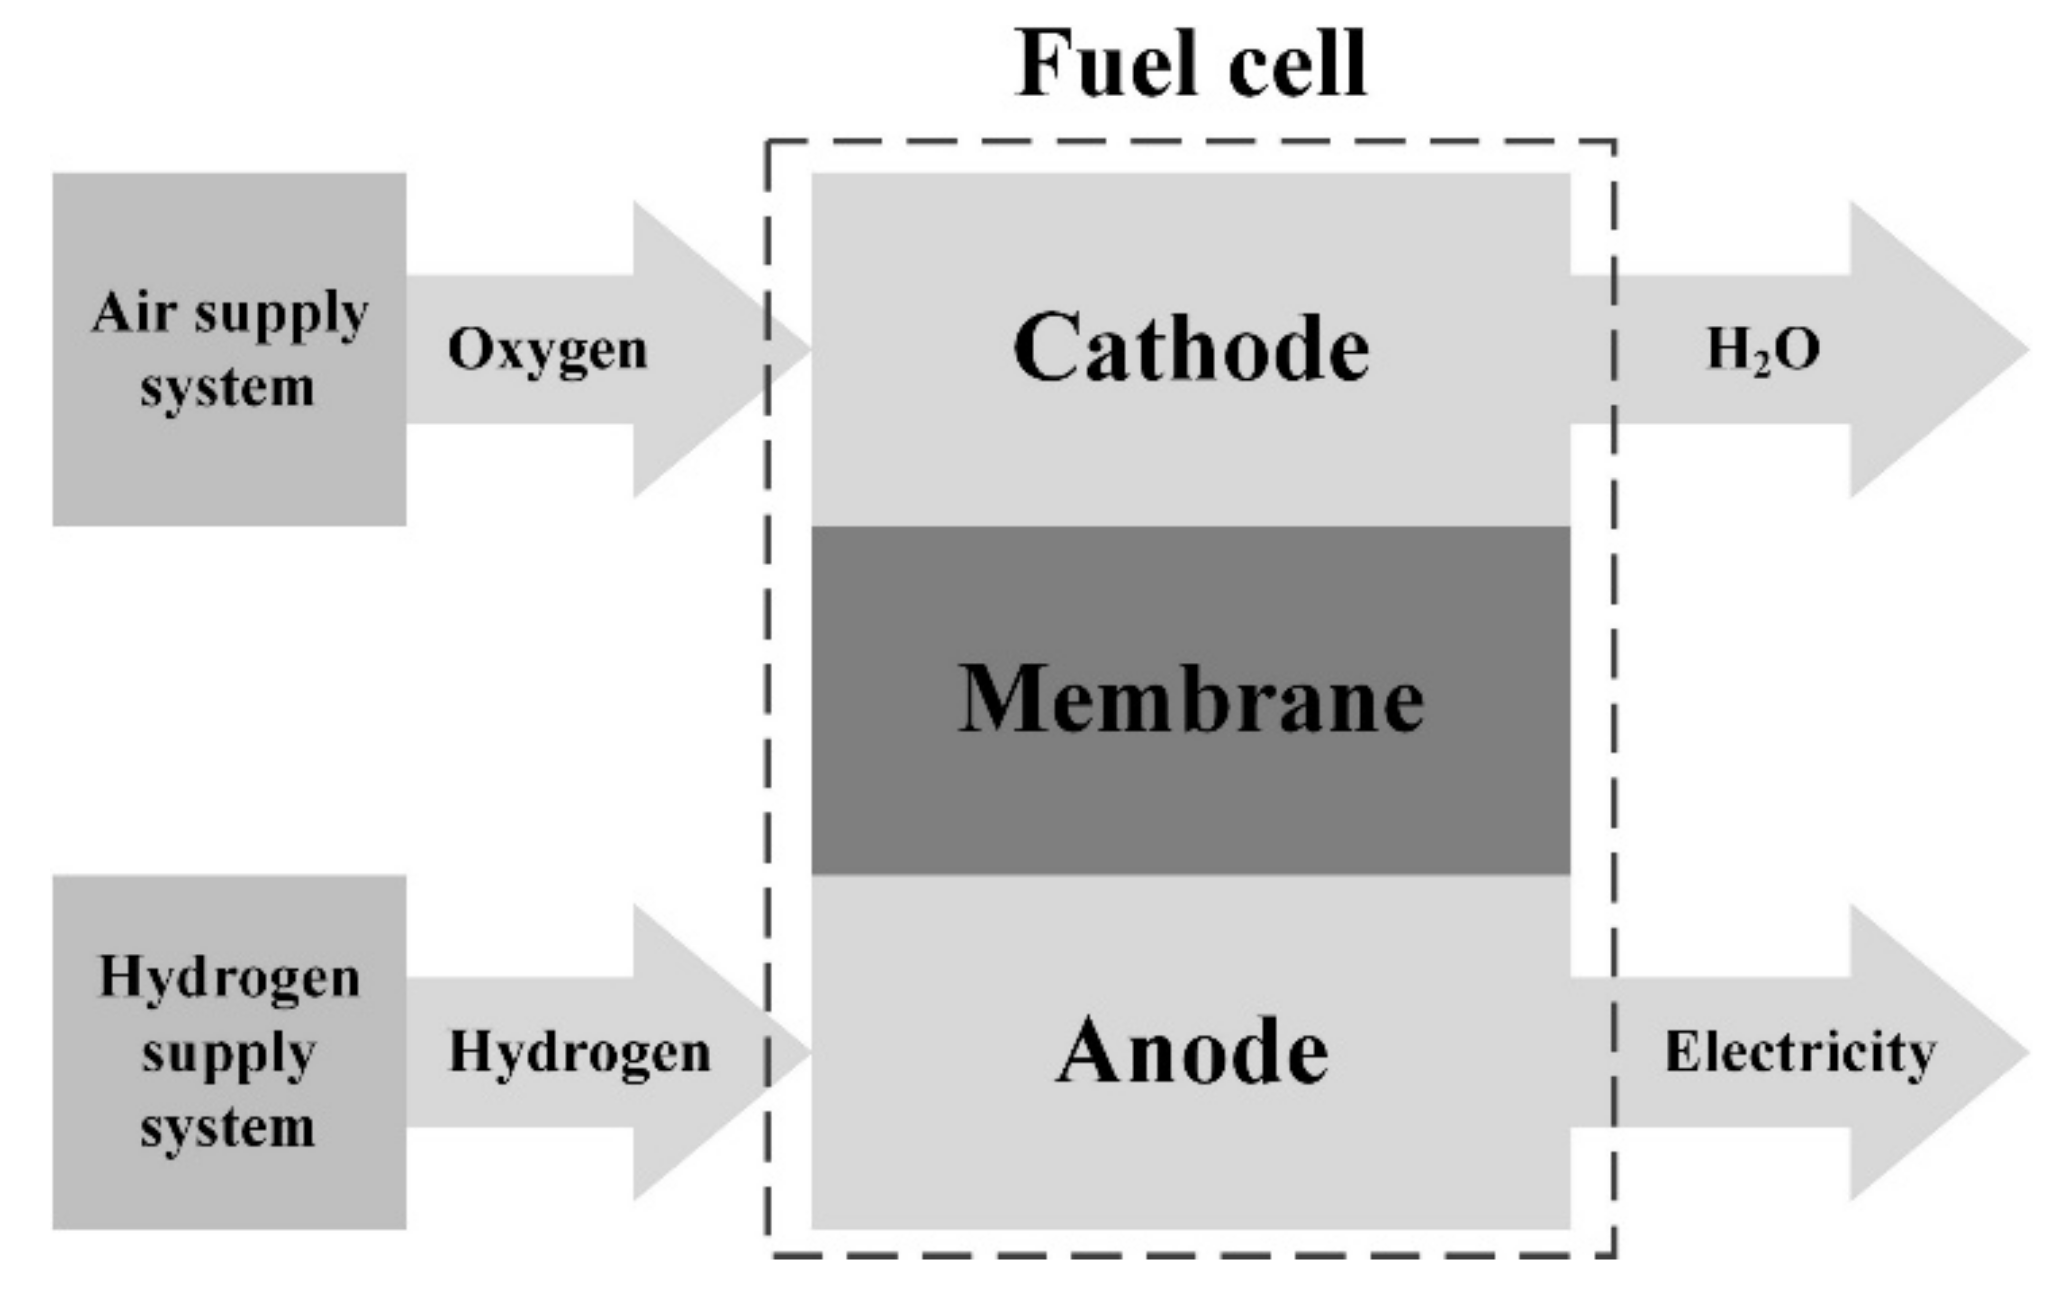
The fuel cell is an electrochemical energy conversion device. It can convert chemical energy in fuel into electricity through electrochemistry. A fuel cell involves a cathode and an anode. The cathode is continuously supplied with oxygen by the air supply system, and the anode is continuously supplied with hydrogen by the hydrogen supply system, respectively. The hydrogen chemical reaction is split into two electrochemical half-reactions. The oxidation occurs at the anode electrode and the reduction occurs at the cathode electrode. The schematic diagram of the fuel cell operational principle is shown in Figure 1.
The chemical equation is as follows:
At the anode:
At the cathode:
Overall reaction:
2.2. Fuel Cell Hydrogen Supply System
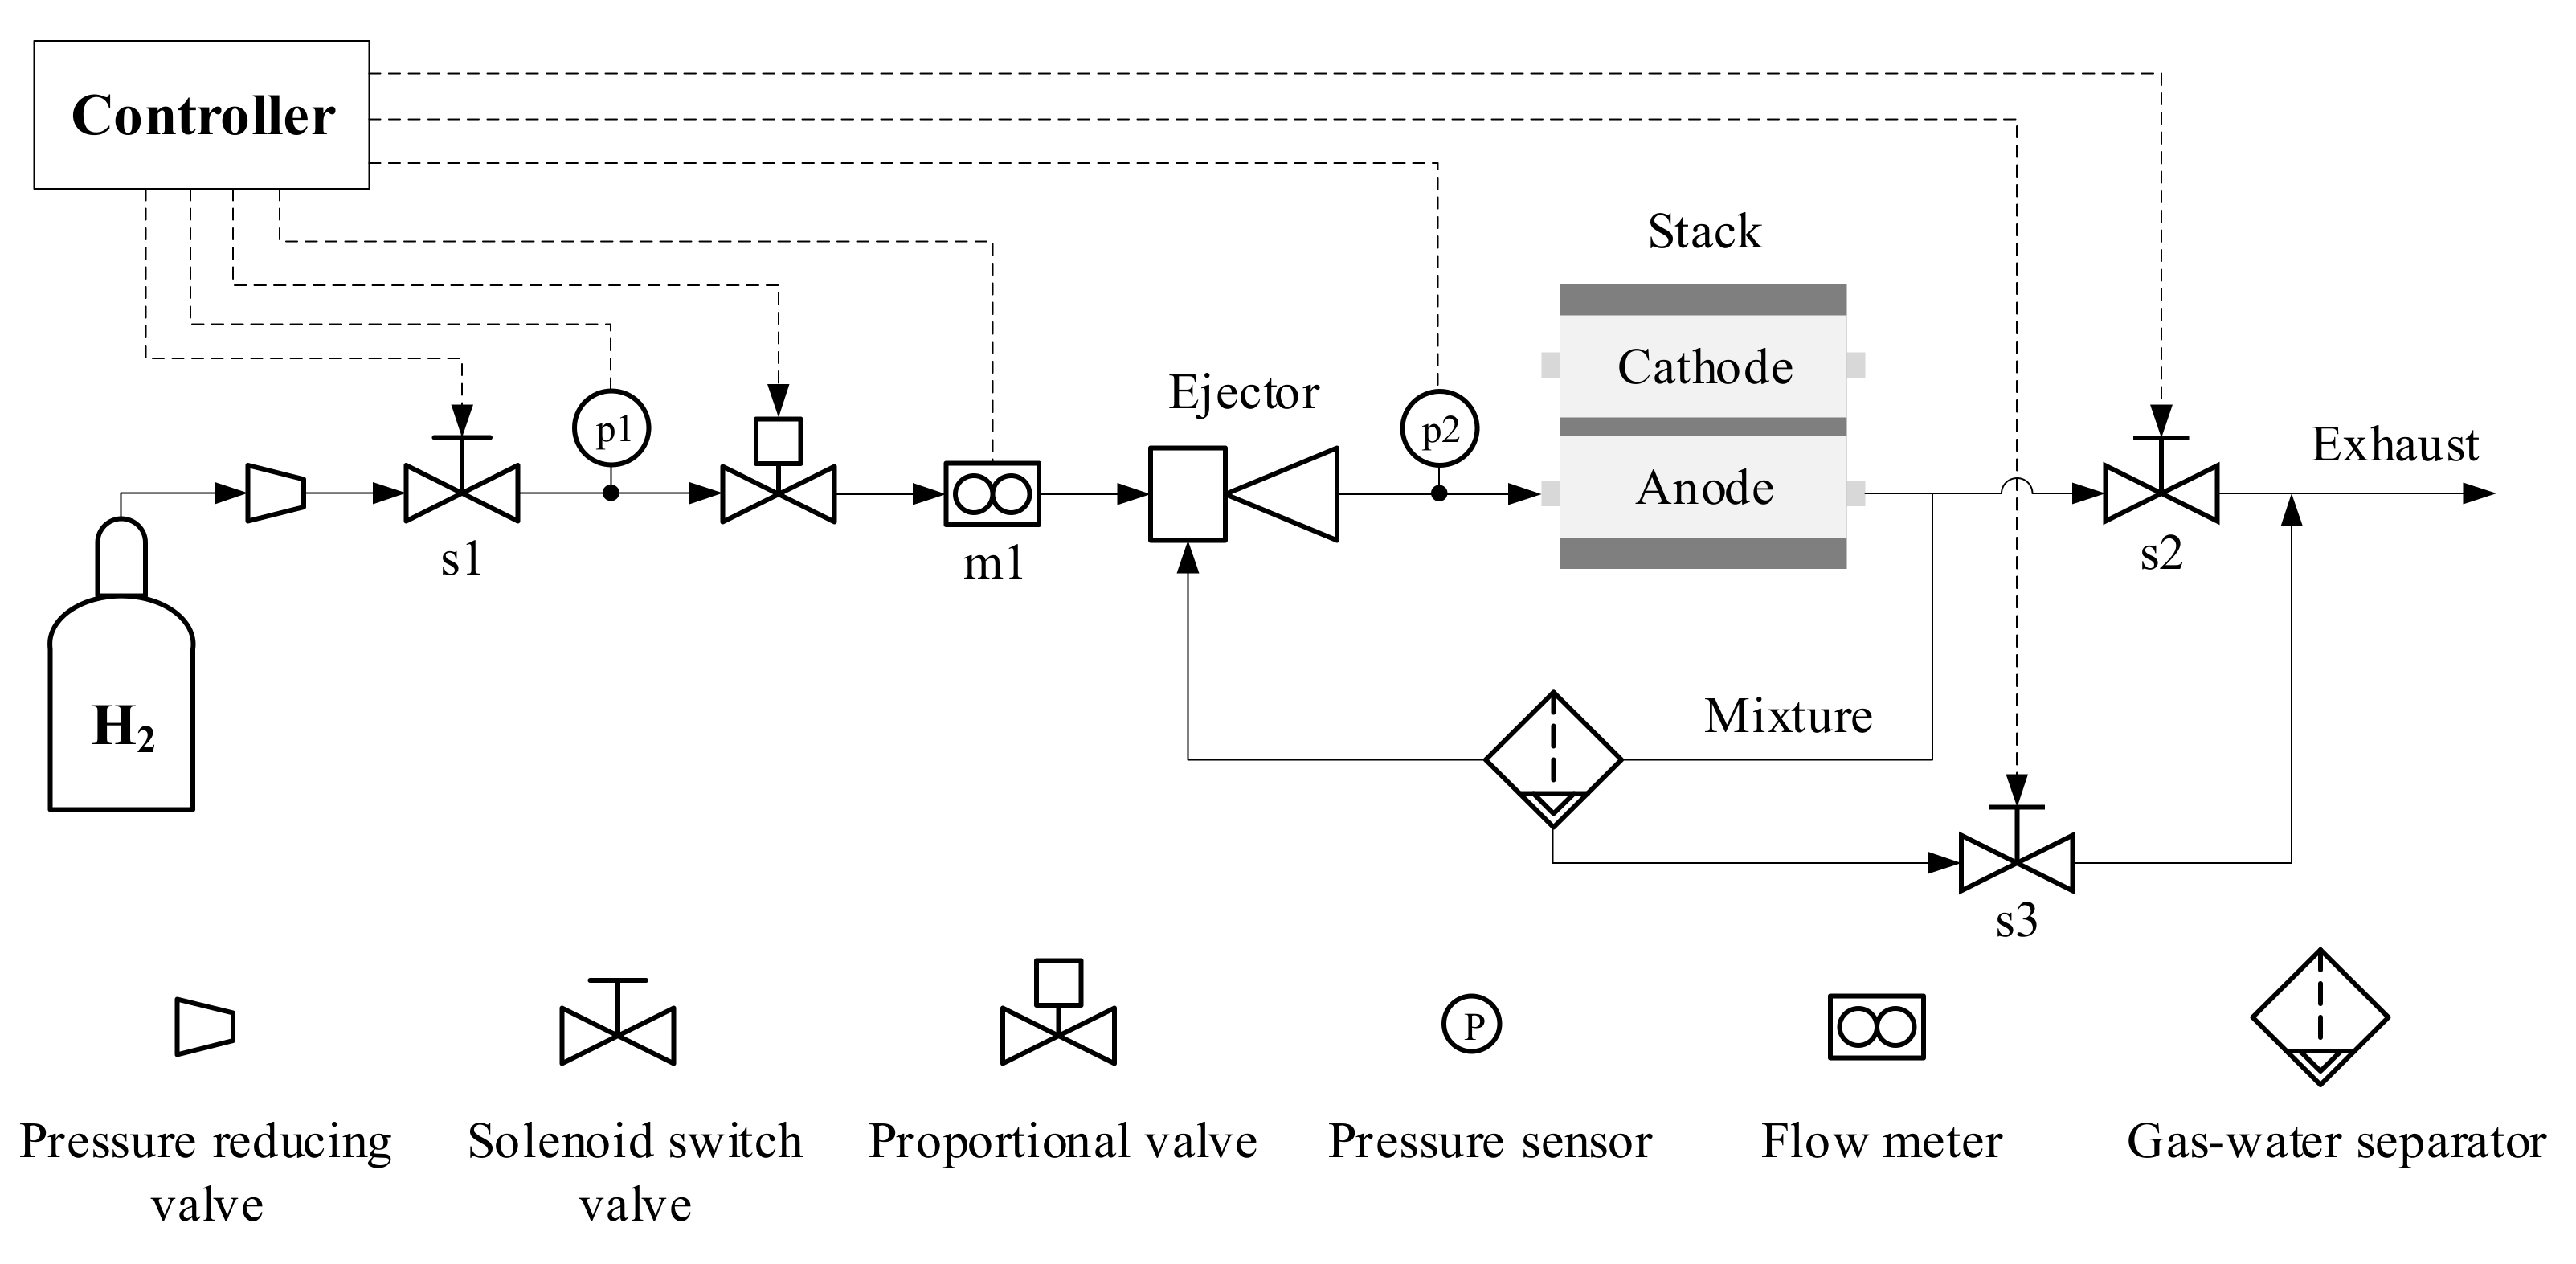
The fuel cell hydrogen supply system generally has two functions. On the one hand, it can provide stable pressure and flow rate hydrogen for fuel cell systems. The hydrogen reacts with oxygen in the fuel cell to produce electricity. At the cathode of the fuel cell, hydrogen ions, electrons and oxygen undergo a redox reaction to generate a lot of moisture and a lot of remaining nitrogen. The moisture and nitrogen can pass through the membrane to the anode and accumulate. If the anode gas does not flow, the hydrogen concentration of the anode will decrease, which will affect the performance of the fuel cell. If the anode gas is discharged to the outside directly, the gas contains a large amount of hydrogen, which will cause a waste of hydrogen. Therefore, on the other hand, to avoid the accumulation of moisture and nitrogen at the anode and the waste of hydrogen, the fuel cell hydrogen supply system can recycle the gas including unreacted hydrogen at the anode using the ejector to improve the efficiency of hydrogen utilization and at the same time improve the water balance in the stack. The schematic diagram of the fuel cell hydrogen supply system is shown in Figure 2.
The main components of the fuel cell hydrogen supply system include a pressure reducing valve, solenoid switch valve, proportional valve, flow meter, pressure sensor, ejector and gas-water separator. The schematic diagram of the ejector is shown in Figure 3.
The work process of the fuel cell hydrogen supply system can be described as follows: the controller controls the solenoid switch valve s1 to open it, and the high-pressure hydrogen in the hydrogen storage tank passes through the pressure-reducing valve to reduce the high pressure to the required pressure. The pressure p2 of the stack inlet was controlled by adjusting the proportional valve; The flow meter m1 is used to detect the flow rate of hydrogen into the stack, which is the actual consumption of hydrogen in the chemical reaction; the pressure sensor p1 is used to detect the pressure before the proportional valve; The gas-water separator is used to separate the water from the gas mixture which comes out of the stack. When the liquid level of the gas-water separator reaches the set point, the solenoid switch valve s3 is opened to discharge the water into the atmosphere. The ejector is mainly used to recycle unreacted hydrogen in the system; The impurity of the gas accumulates in the anode, and the solenoid switch valve s2 is opened to purify the gas in the system when the impurity concentration of the gas affects the performance of the system.
2.3. Fuel Cell Ejector Test Platform Design
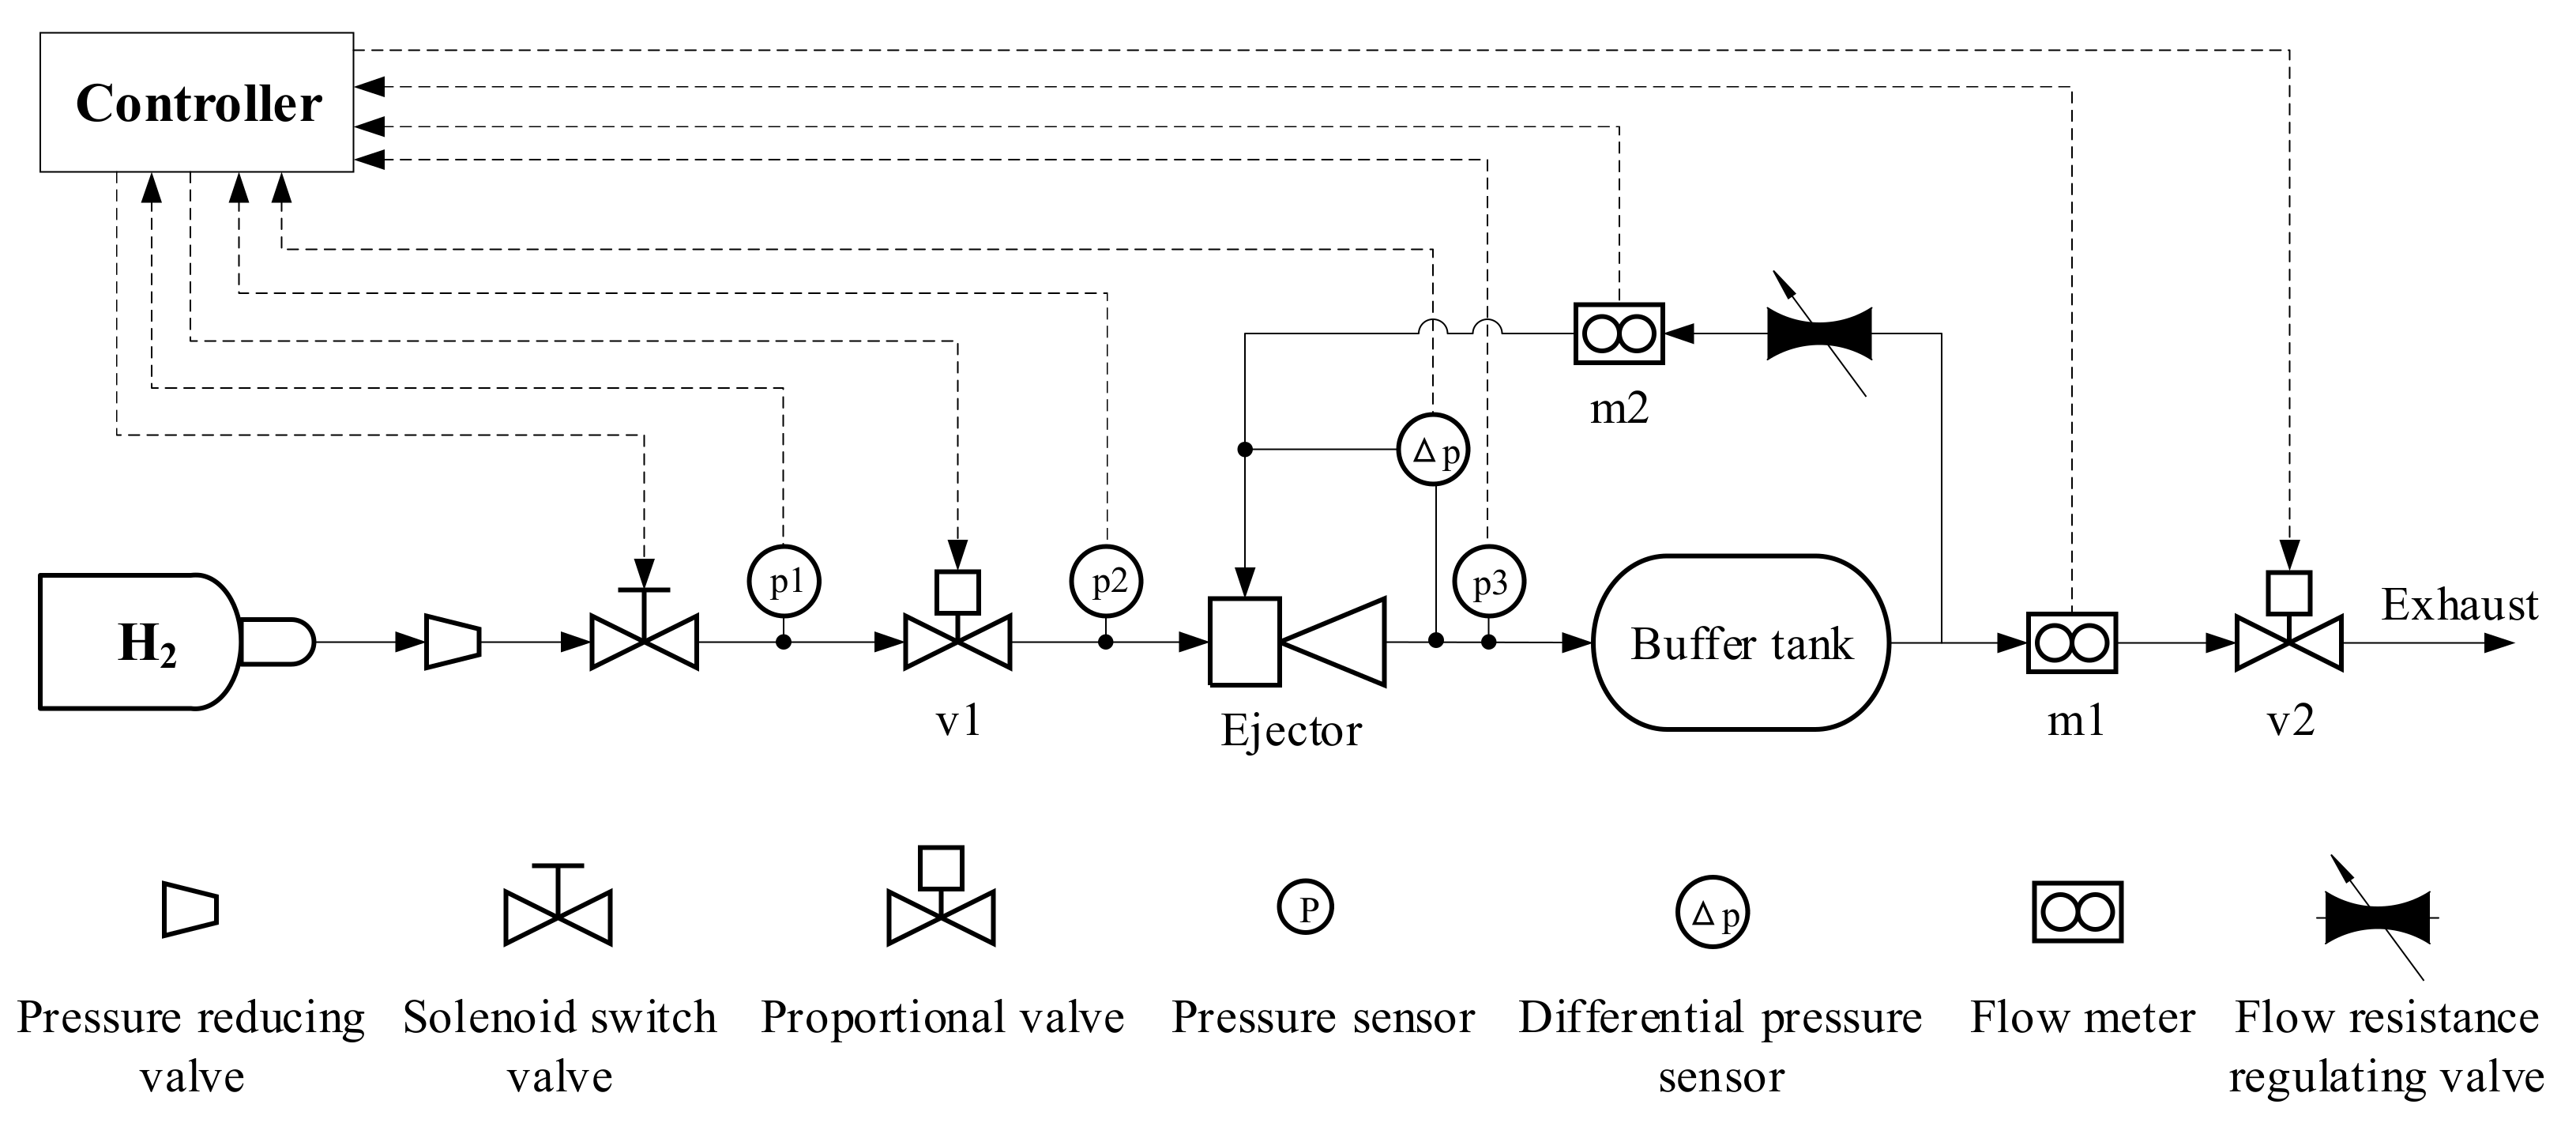
The test platform of the fuel cell ejector has been carried out in a simplified manner based on the hydrogen supply system of the fuel cell. The stack and gas-water separator have been removed from the ejector test platform, and the buffer tank and flow resistance regulating valve have been added. The buffer tank can simulate the fuel cell stack, and the flow resistance regulating valve can adjust the flow resistance of the fuel cell anode system. The design of the ejector test platform can reflect the physical characteristics of the fuel cell anode system to a certain extent.
The main components of the test platform include a pressure reducing valve, solenoid switch valve, proportional valve, pressure sensor, differential pressure sensor, flow meter, flow resistance regulating valve, buffer tank, controller and gas tube. For safety, hydrogen is discharged into open space. The schematic diagram of the ejector test platform that was established in this study is shown in Figure 4.
According to the law of conservation of mass, the amount of hydrogen entering the fuel cell anode system is equal to the amount of hydrogen being reacted. In the ejector test platform, the amount of hydrogen from the primary flow rate of the ejector is equal to the amount of hydrogen being exhausted. Therefore, the flow meter m1 is installed at the rear end to measure the amount of hydrogen being exhausted, which is equal to the primary flow rate of the ejector. The medium used in this test is hydrogen.
The test platform tube design must ensure that the pressure drop at the maximum flow rate is less than the actual system; because the flow resistance has a direct relationship with the tube diameter, to reduce the flow resistance so that the tube flow resistance has a large range of adjustment, it is necessary to estimate the tube diameter. The design must ensure that the maximum pressure drop is less than fifteen kilopascal at the maximum flow rate. In this study, we assume that the maximum flow rate is two thousand standard liters per minute. The tube diameter is twenty millimeters, and the pressure drop can be guaranteed to be less than fifteen kilopascal.
According to the Darcy–Weisbach Formula, the frictional drag can be defined as:
where is the coefficient of frictional drag, is the length of the tube, is the tube diameter, is the velocity of flow and is the gravity.
The pressure drop of frictional drag can be described as:
where is the density of fluid.
where is the Reynolds number; it can be defined as:
where is the kinematic viscosity.
where is the volume flow rate, and is the cross-section area of the tube.
The pressure drop of local resistance can be defined as:
where is the coefficient of local resistance.
3. Ejector Simulation and Test
In this research, six operating conditions were simulated and tested, including two small flow rates, two medium flow rates and two large flow rates. These operating conditions cover the entire power range of the ejector. The operating conditions are shown in Table 1.
3.1. Ejector Simulation
The ejector simulation used commercial CFD software ANSYS FLUENT 19.0. It is a fact that no single turbulence model is universally accepted as being superior for all classes of problems. Thus, four turbulence models were used in this simulation, including the Standard k-e model, Realizable k-e model, RNG (renormalization group) k-e model and SST (shear-stress transport) k-w model. The k-e model used nonequilibrium wall functions, the primary inlet boundary conditions used mass-flow-inlet, the secondary inlet boundary conditions used pressure-inlet and the outlet boundary conditions used pressure-outlet. The primary inlet, secondary inlet and outlet boundary conditions of temperature are set to 300 K. The solution methods selected the Pressure-Implicit with Splitting of Operators (PISO) pressure-velocity coupling scheme. The second-order upwind was selected in the spatial discretization of pressure, density, momentum, turbulent kinetic energy, turbulent dissipation rate and energy. The calculation was completed until the residual of the equations was less than 10−6.
3.2. Ejector Test
The tube and buffer tank of the ejector test platform should be purged using hydrogen before the test because there is a lot of air in it. The molecular weight between hydrogen and air is different; this can influence the test results of the ejector. The purge process is described as follows: open all valves with the controller and purify the tube and the buffer tank using a small flow rate of hydrogen to ensure the concentration of the hydrogen in the system before the test. In this research, the purge time is set to one minute.
In addition, the airtightness of the system must be detected to ensure the safety of the test. According to the maximum working pressure of the fuel cell systems, adjust the pressure in the tube of the ejector test platform and maintain the pressure, then detect the pipe joints using the hydrogen concentration sensor to ensure that the system is not leaking. In this test, the pressure was set to three standard atmospheres.
Finally, define the control objectives according to the fuel cell system. The pressure of the stack inlet is a significant parameter and can influence the performance and safety of the stack. In this test, the pressure of p3 is equal to the pressure of the stack inlet, making it an objective of control. Moreover, make the flow rate of m1 an objective of control in order to simulate the consumption of the fuel cell because on the test platform there is no chemical reaction of hydrogen.
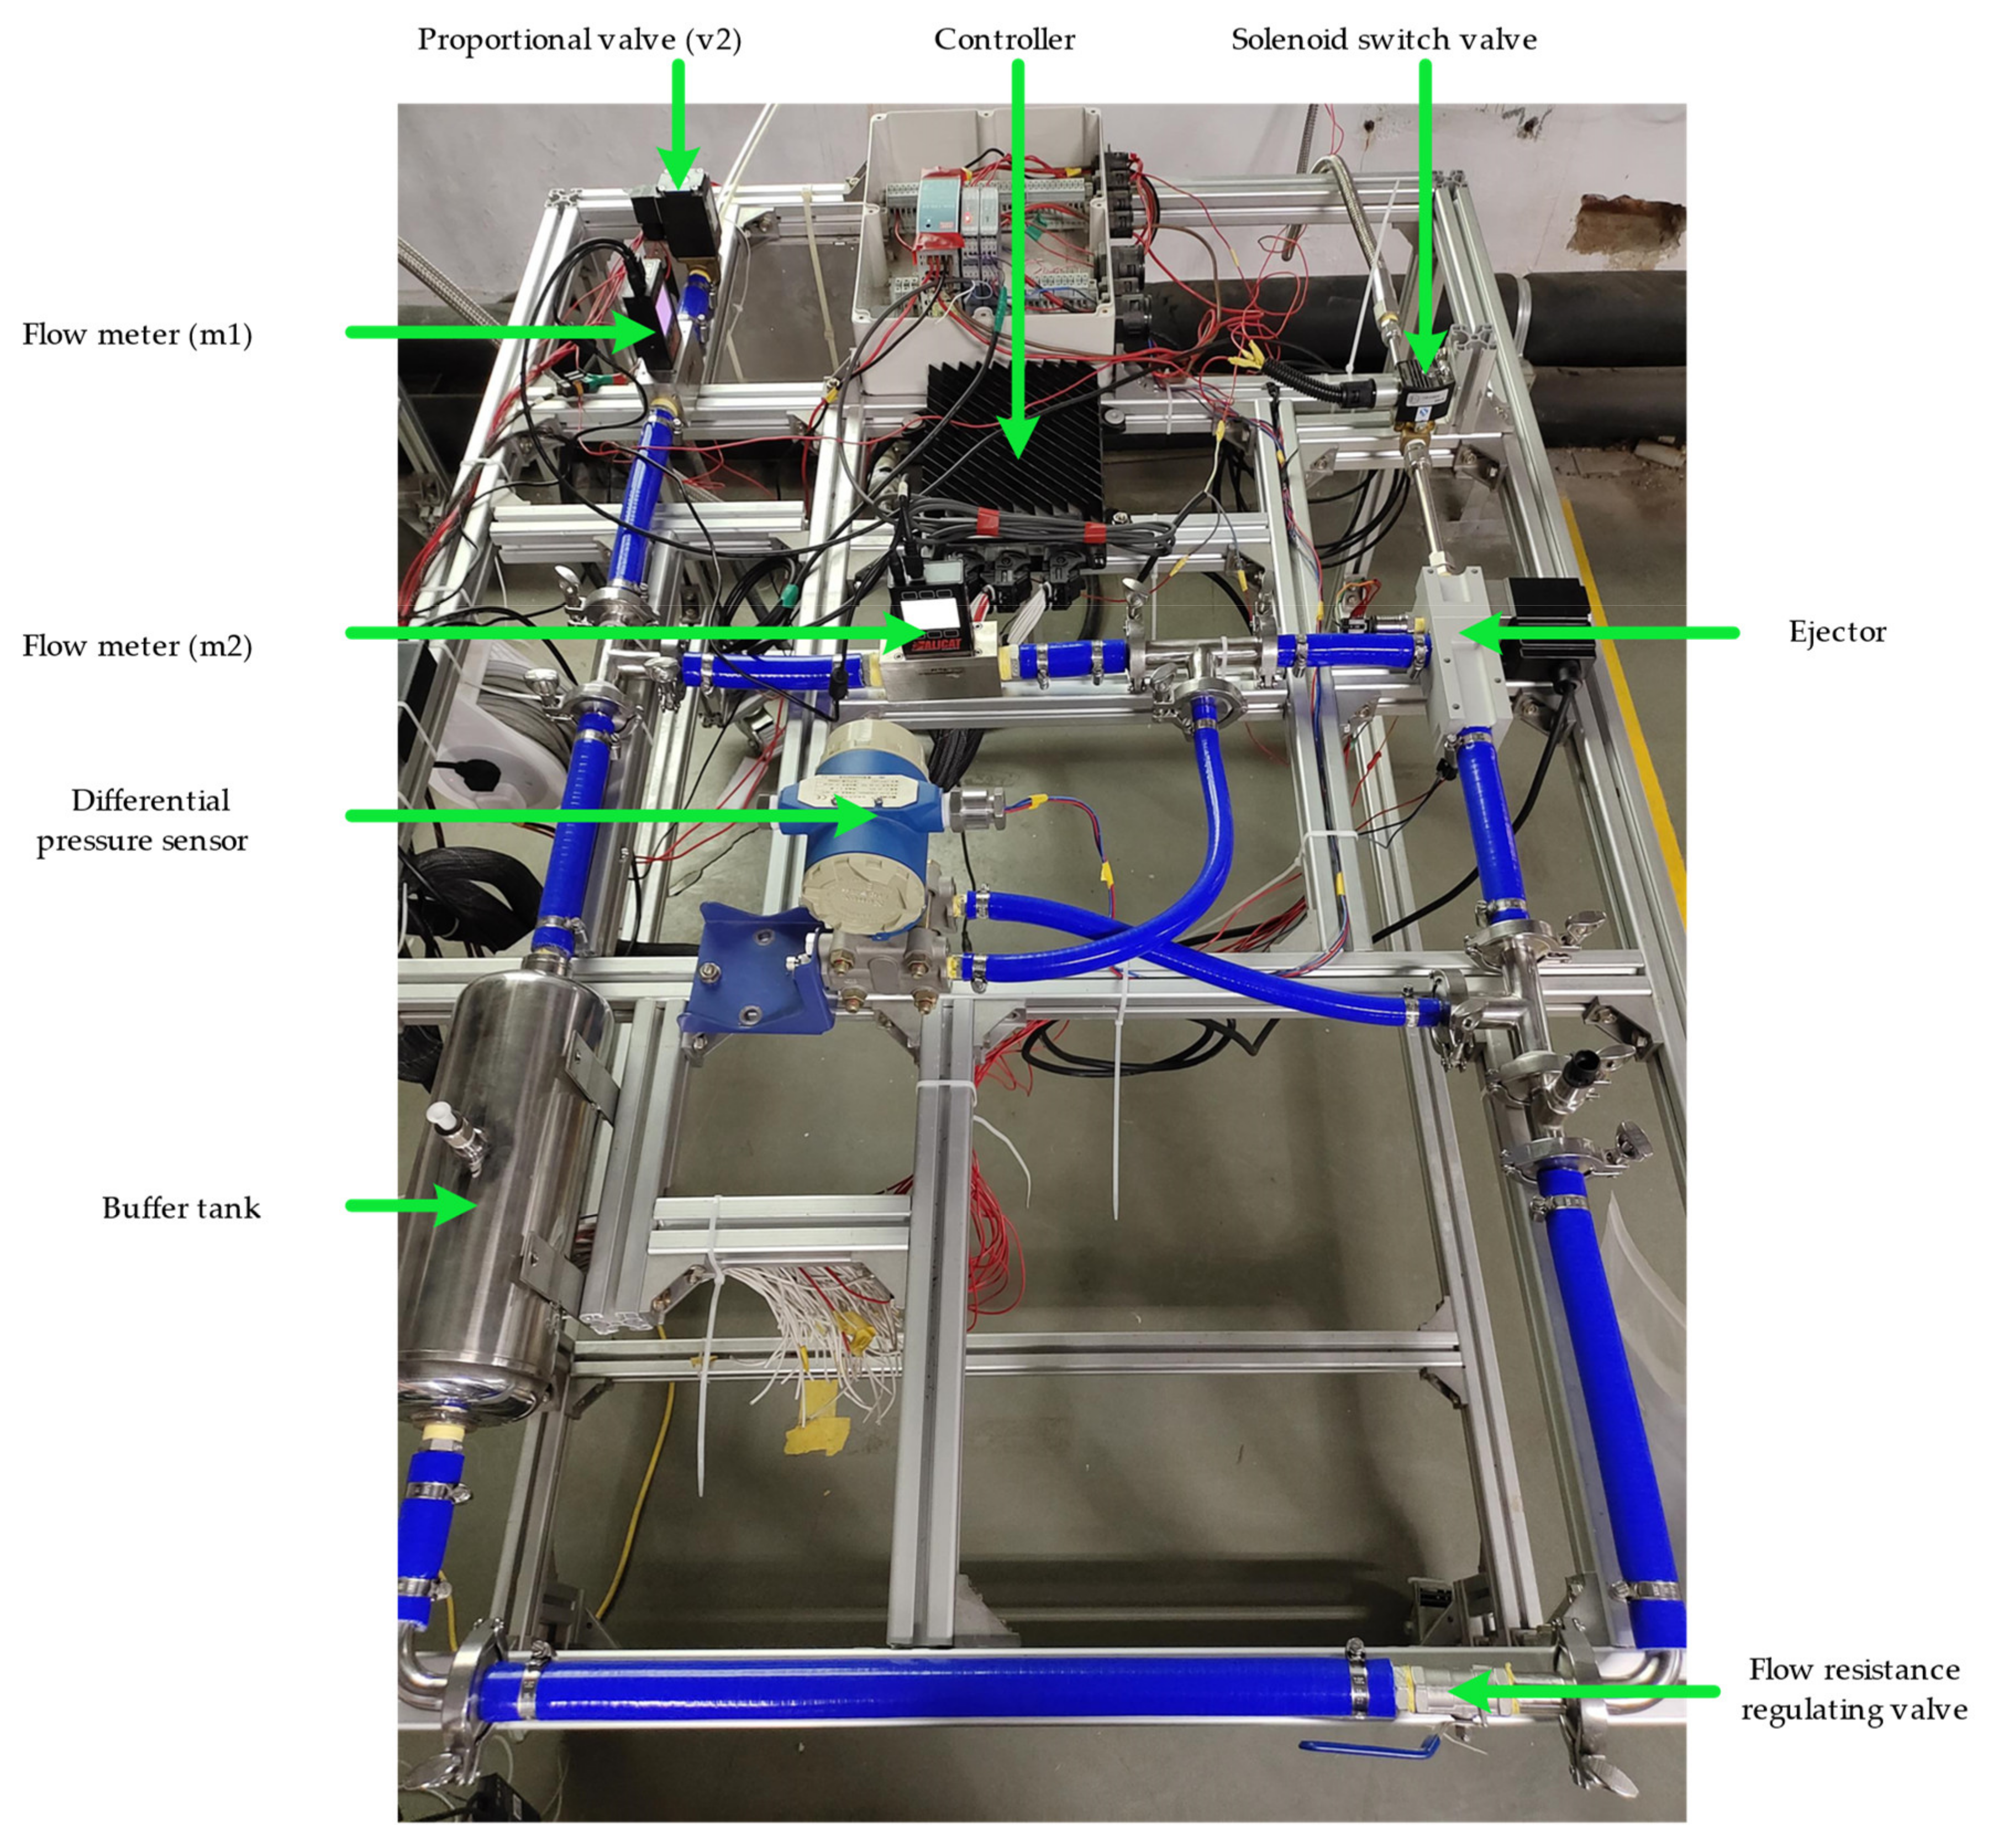
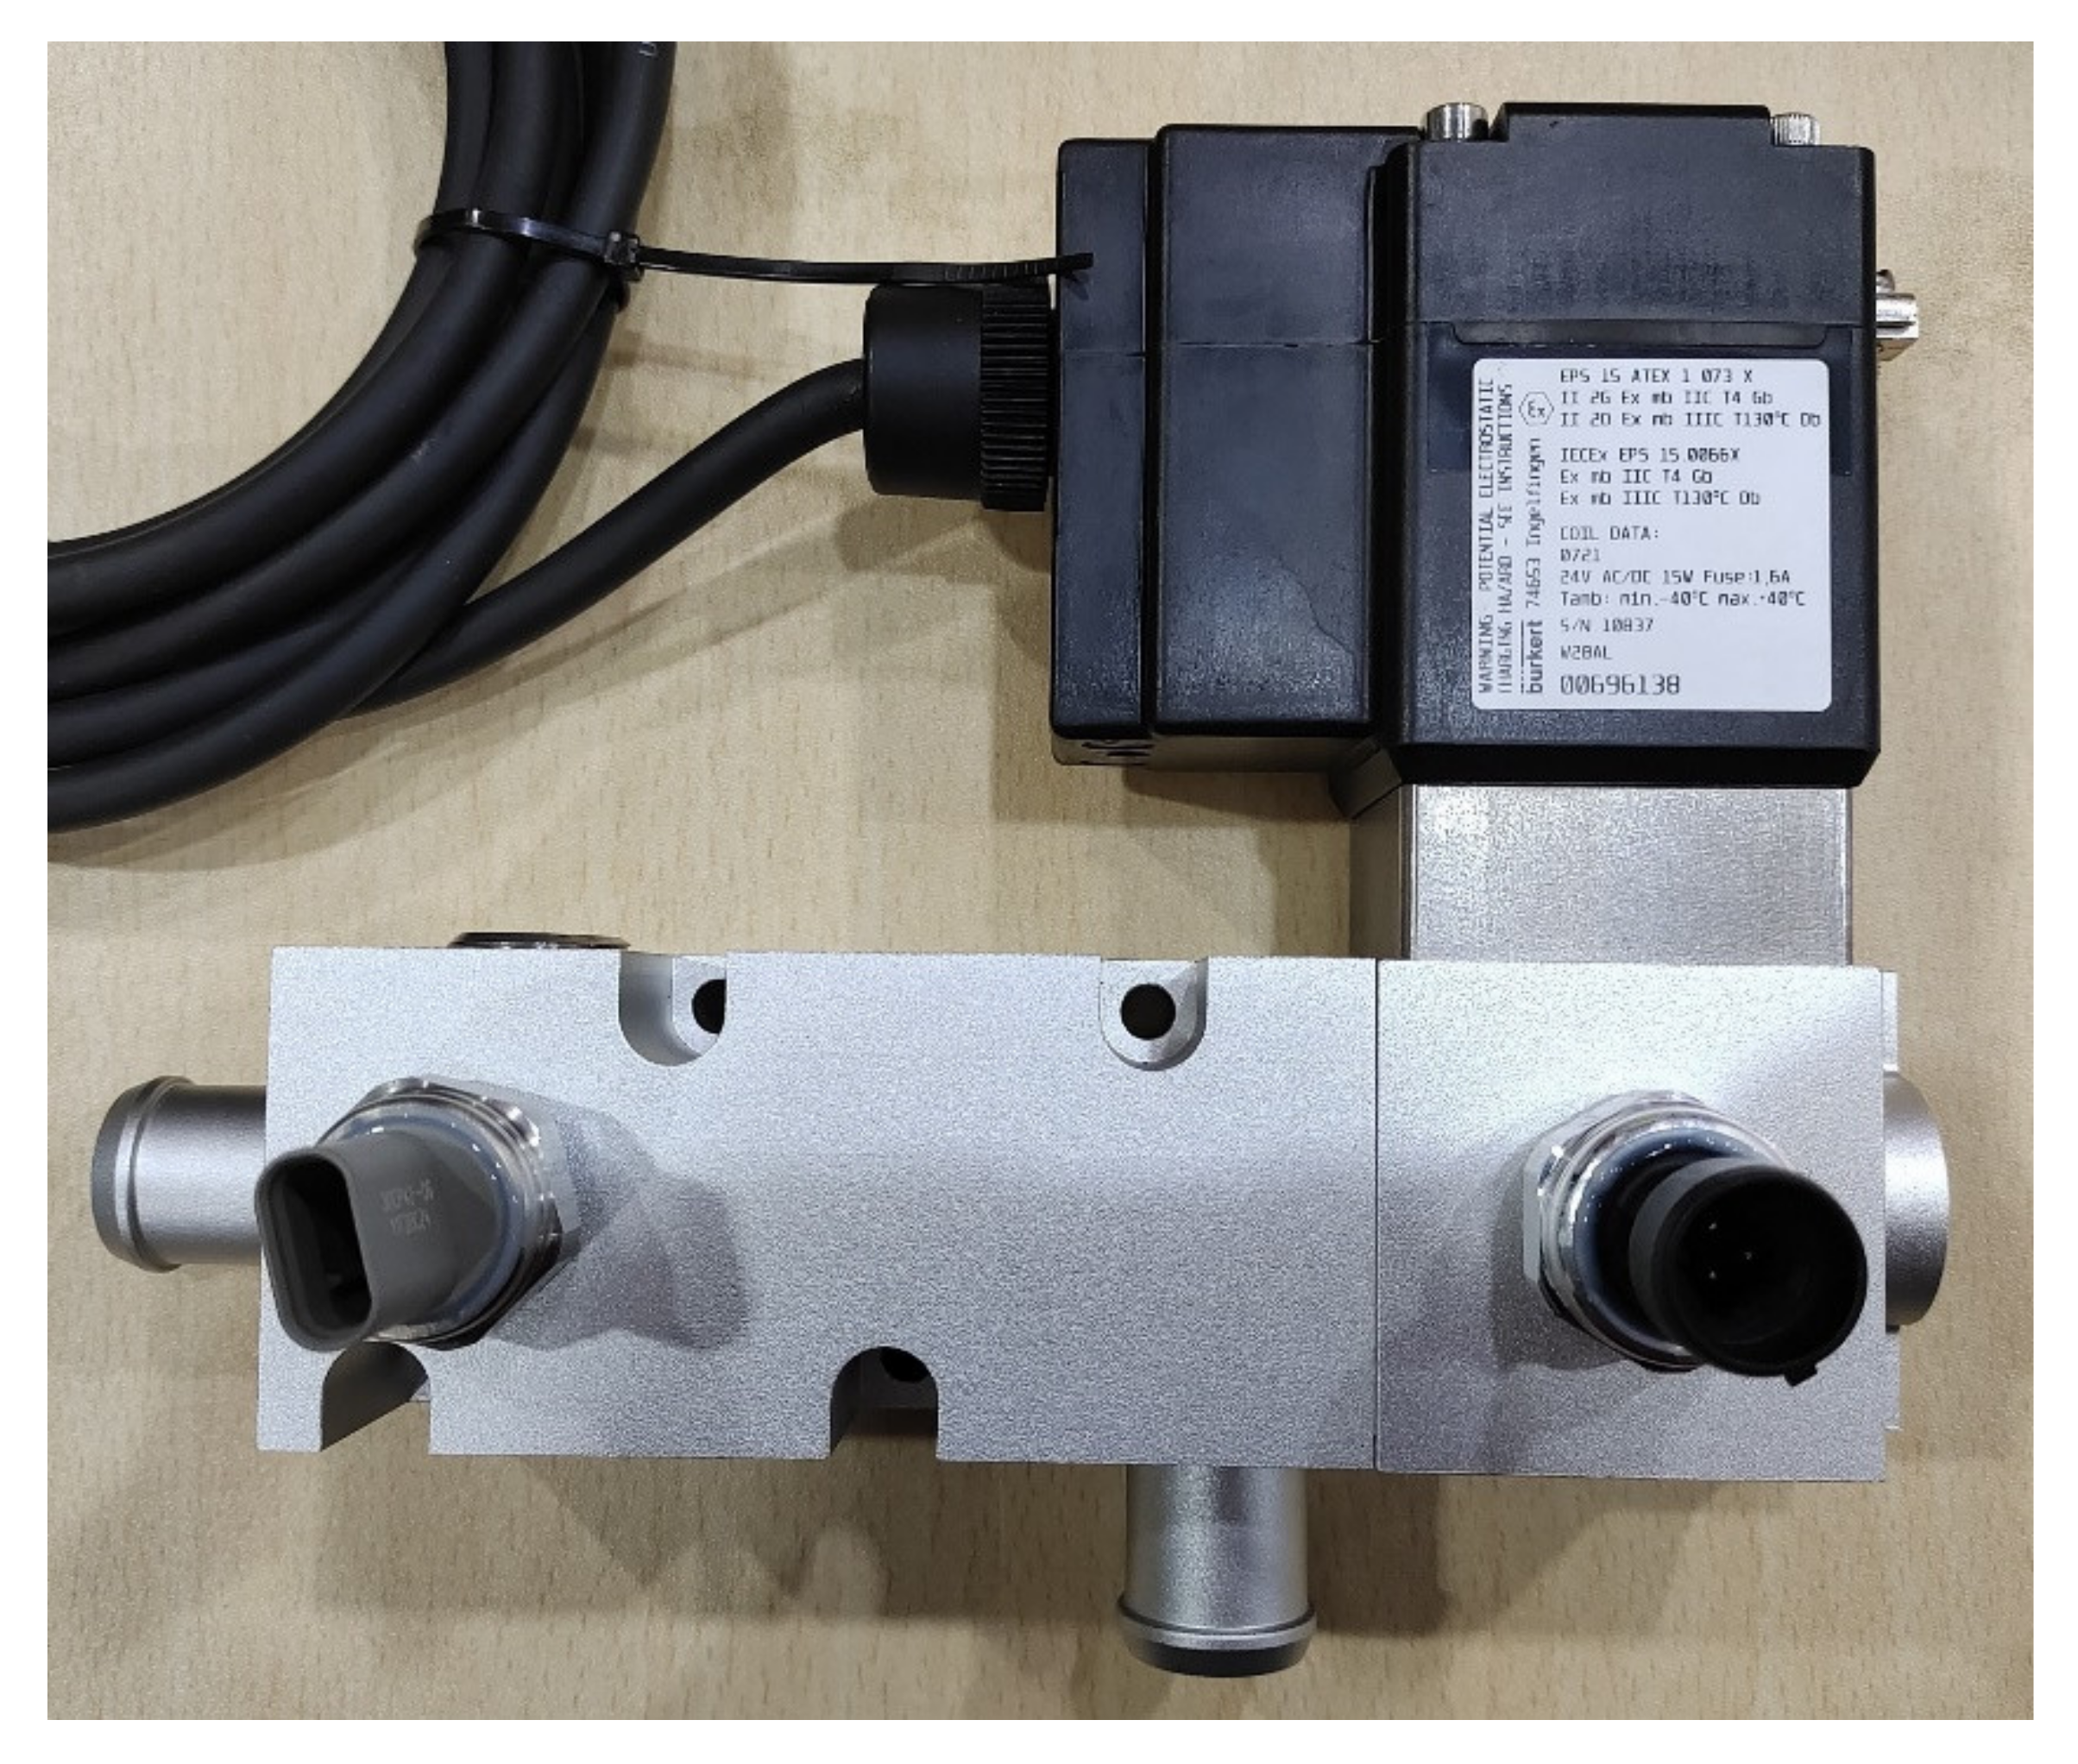
The procedure of the test can be described as follows: adjust the flow rate of hydrogen according to the power level of the fuel cell ejector, and then adjust the flow resistance of the tube by adjusting the flow resistance regulating valve. The flow resistance of the fuel cell anode system can affect the performance of the ejector. The greater the flow resistance, the worse the performance of the ejector. The flow resistance of the fuel cell anode system is generally about twenty kilopascal. To study the performance of the ejector in this test, adjust the flow resistance to thirty kilopascal when the flow rate of hydrogen reaches the maximum operating condition. The flow resistance at other operating conditions decreases when the flow rate decrease. The test data collection period is set to thirty seconds when the state of the pressure and flow rate in the system is stable. Figure 5 shows the image of the test platform. Figure 6 shows the image of the ejector being tested.
4. Results and Discussions
4.1. Comparison of Test and Simulation
The simulated data and the tested data of the ejector are shown in Table 2.
The entertainment ratio can be defined as:
where is the primary flow rate and is the secondary flow rate.
The relative error (R) can be defined as:
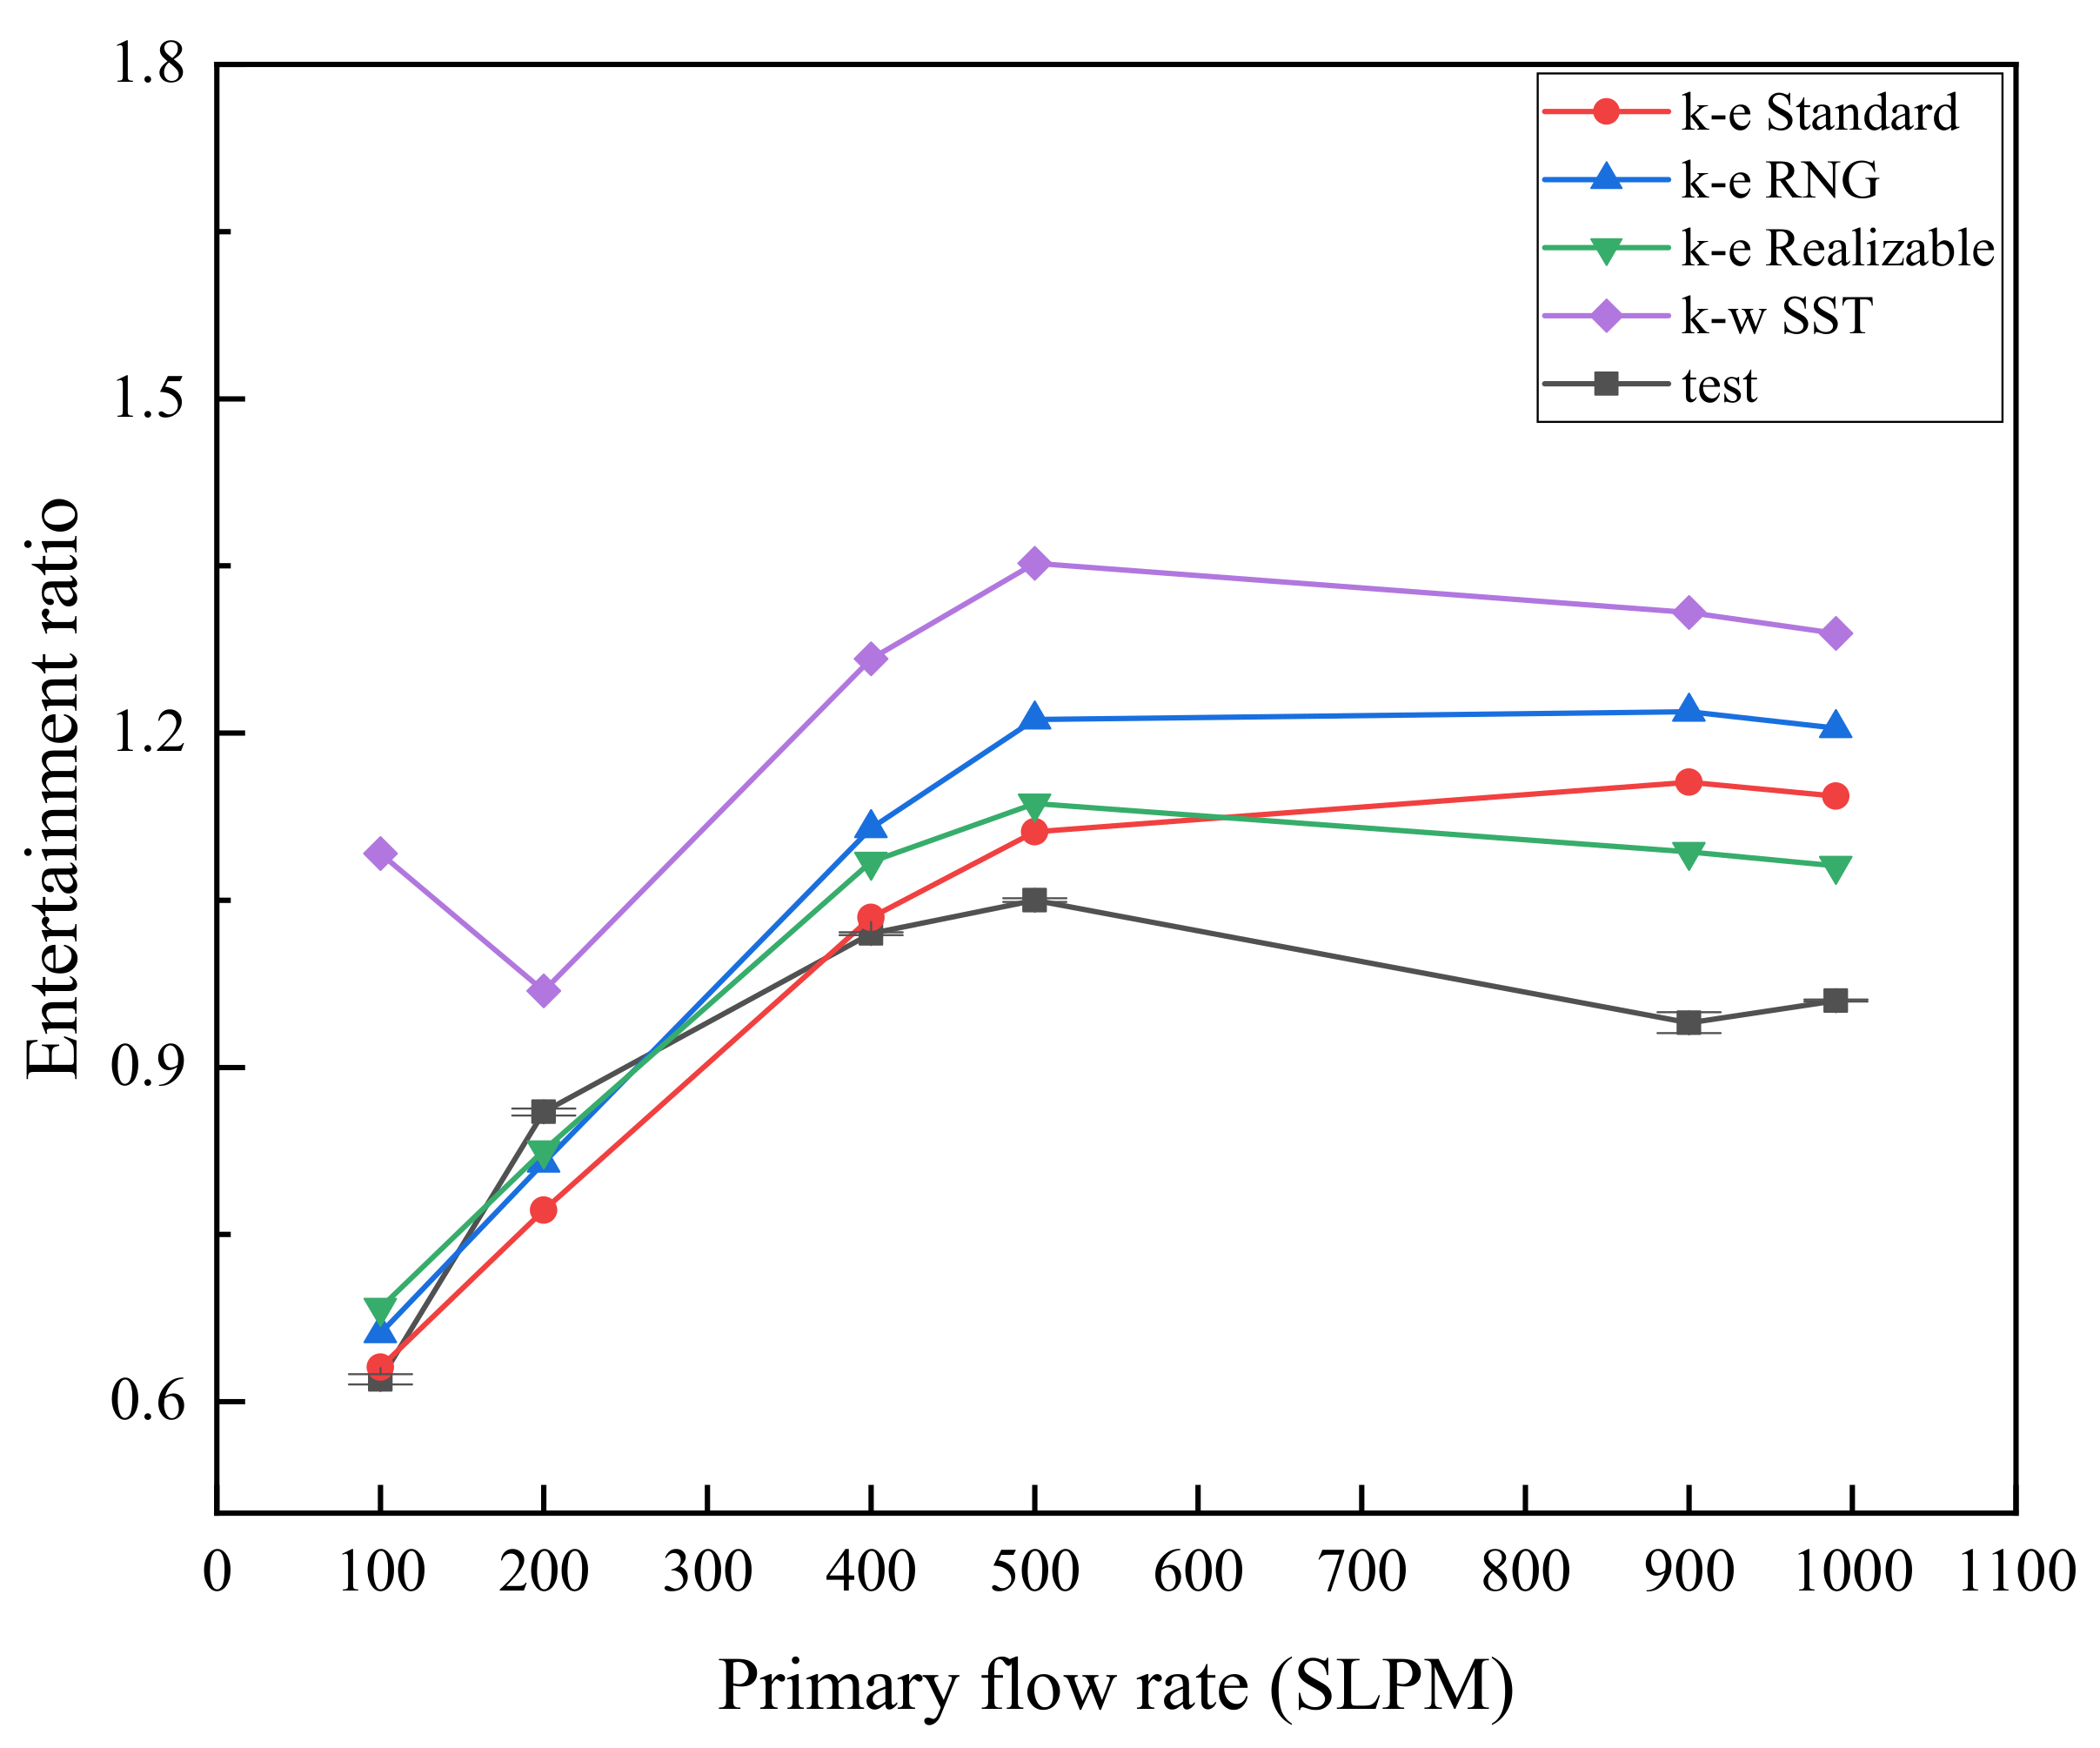
where is the entertainment ratio of simulation and is the entertainment ratio of the test. The test results and simulation results are shown in Figure 7, and the relative error between the simulation and test is shown in Figure 8.
From Figure 7 and Figure 8, the Standard k-e model is more accurate than other turbulence models at the low and medium flow rates, with a relative error under 10%. The Realizable k-e model is more accurate than other turbulence models at a large flow rate. The Standard k-e model and the Realizable k-e model can ensure a simulation accuracy of less than 20% for the entire power range of the ejector. The simulation accuracy of the RNG k-e model is acceptable at a low flow rate and medium flow rate with a relative error under 20%; at a large flow rate, the relative error exceeds 20%. The SST k-w model has the worst accuracy at a low flow rate, and the relative error is greater than for other models under other operating conditions.
The relative error is caused by many reasons, including the computational accuracy of the turbulence model, the machining accuracy, the measurement accuracy of test components and the layout of measuring points. The accumulation of these errors leads to a larger overall error.
4.2. Primary Flow Rate and Flow Resistance
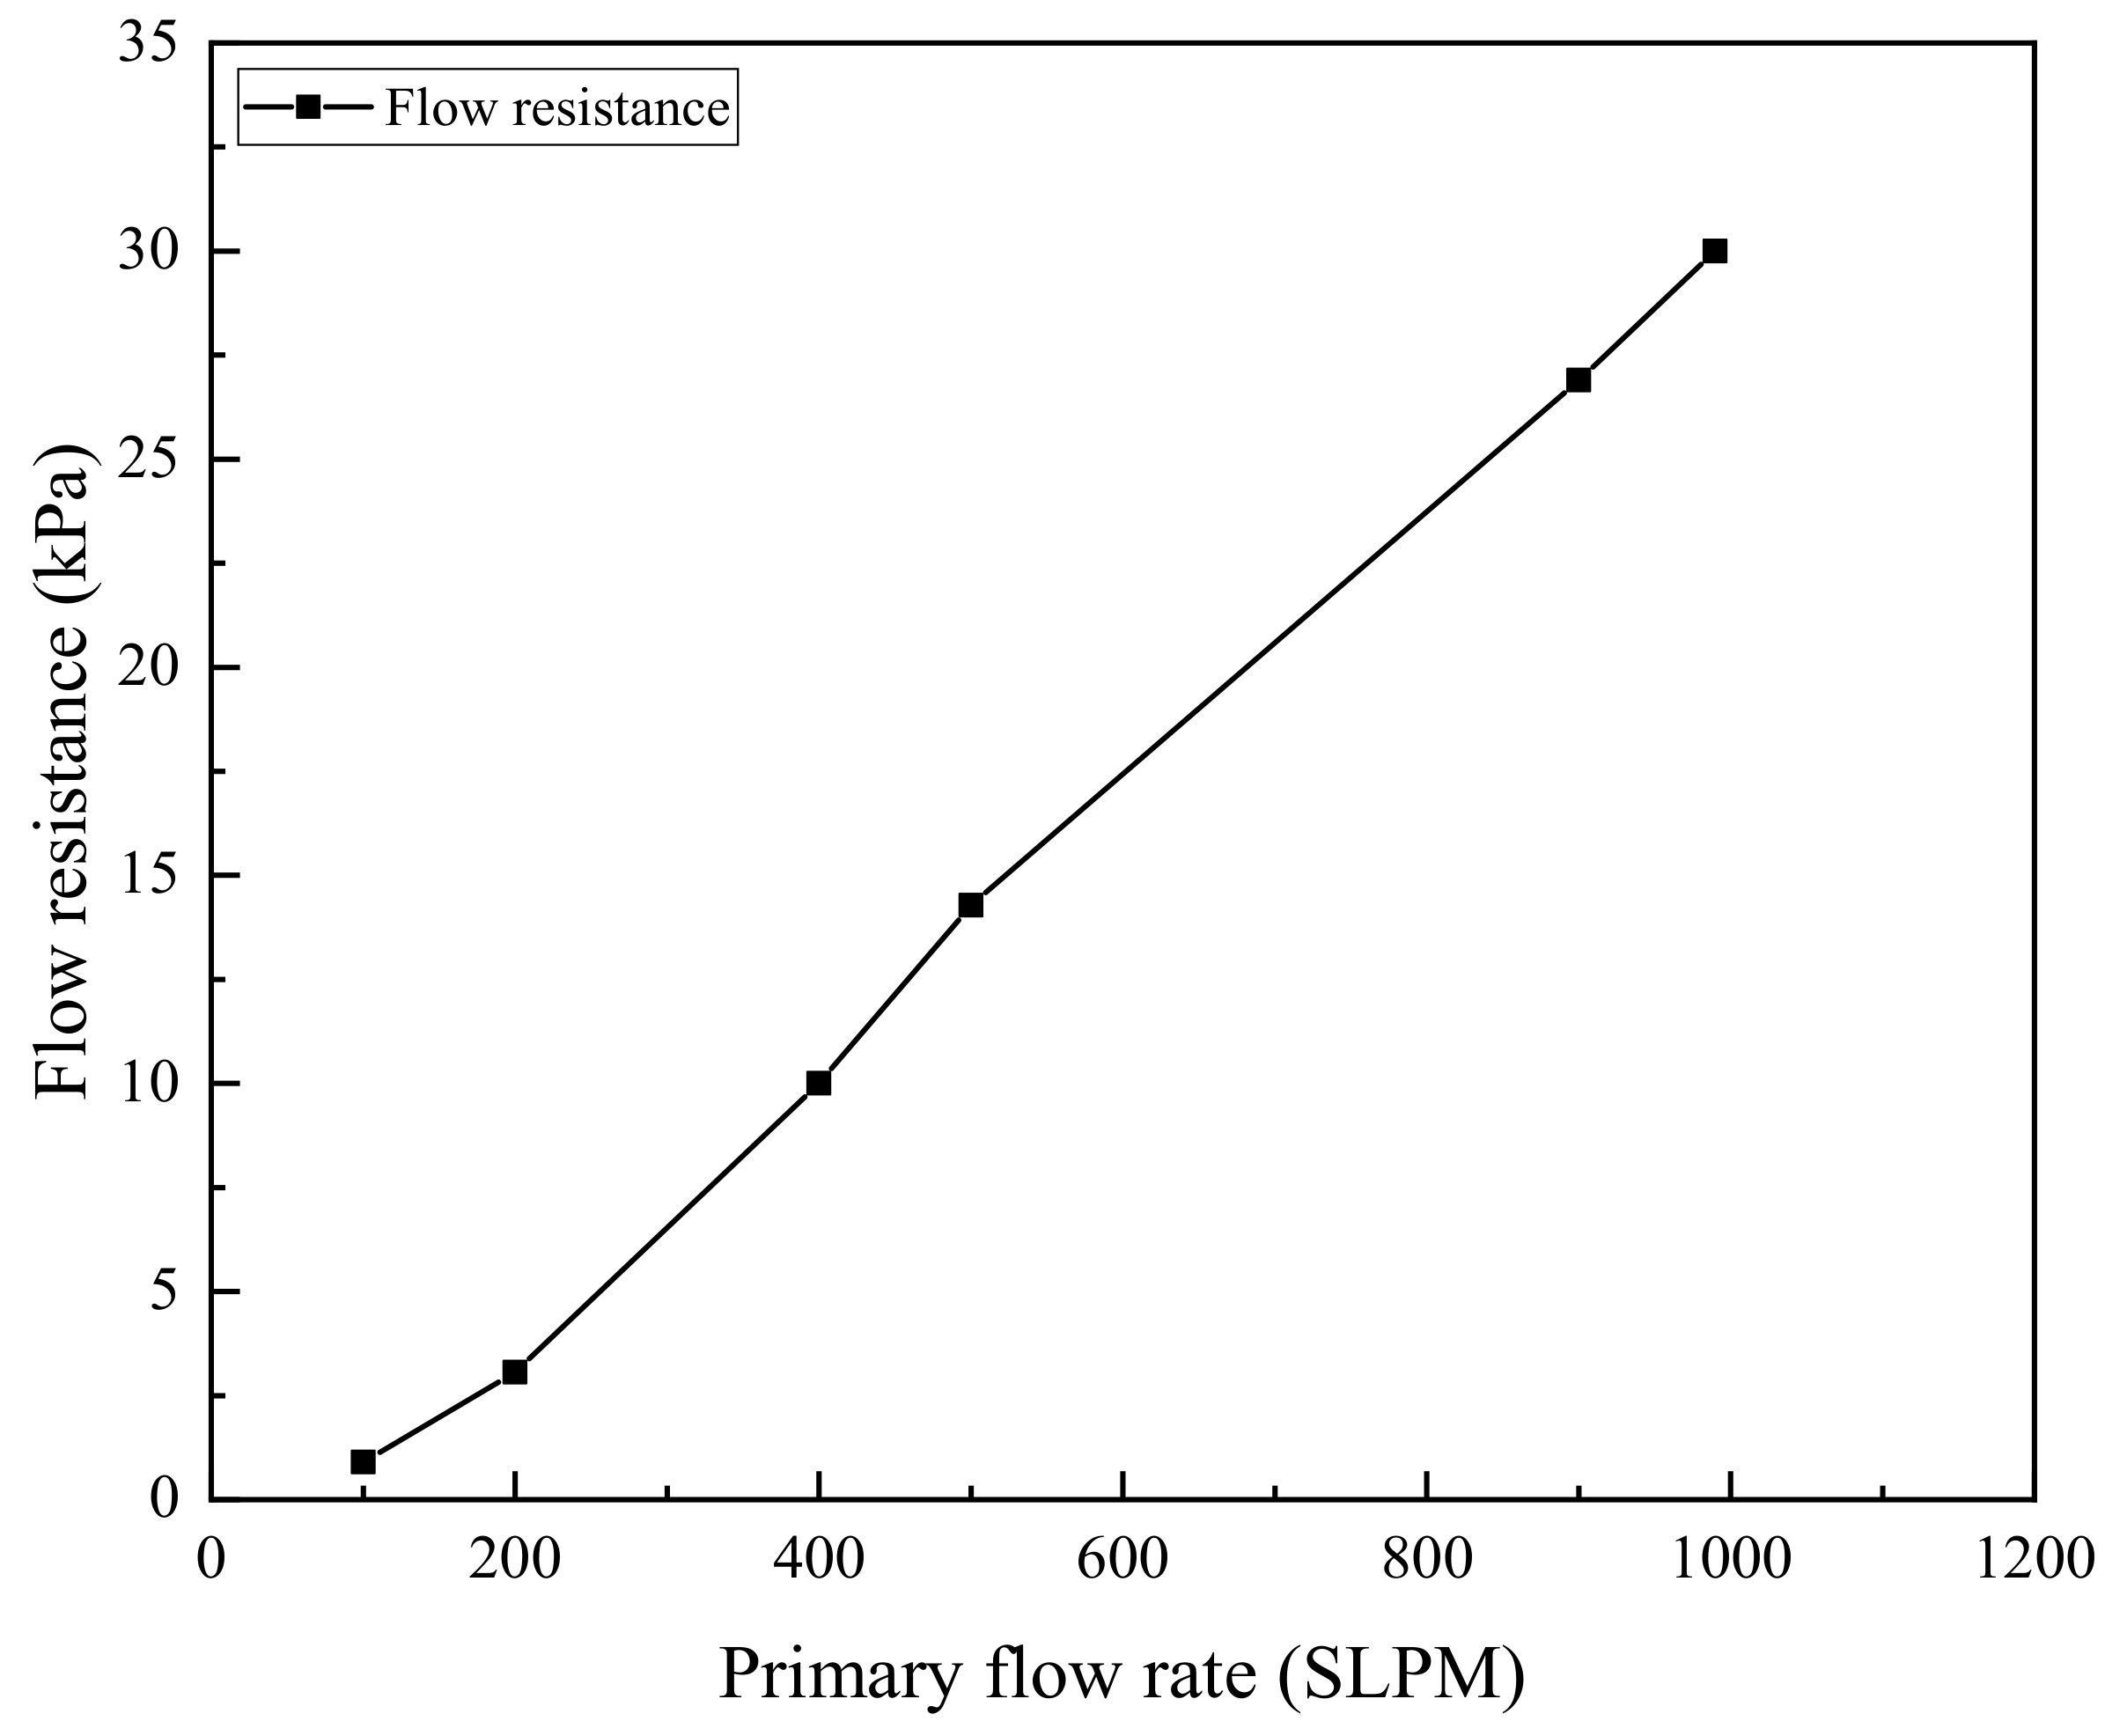
Flow resistance is a key indicator that affects ejector performance, and it is related to the flow rate, tube diameter, tube length and the resistance coefficient of each component. Figure 9 reveals the relationship between the flow resistance and primary flow rate, showing that the flow resistance increases as the primary flow rate increases.
The flow resistance of each operating condition is a fixed value when the fuel cell hydrogen supply system design is completed, and it can reach the maximum when the flow rate is at the maximum. In this research, the maximum flow resistance at the rated power operating conditions is set to thirty kilopascals; then, the flow resistance of other operating conditions changes as the flow rate changes, according to the physical properties of the tube and component. The operating conditions designed in this study can reflect the state of the ejector in the fuel cell hydrogen supply system. It is reasonable to use this method to test the ejector.
5. Conclusions
In this paper, an ejector test platform was established, and the performance of the fuel cell ejector was studied in a simulation and test. The following conclusions can be drawn from the research:
- 1.
- The physical characteristics of the fuel cell hydrogen supply system can be simulated utilizing the buffer tank and flow resistance valve. The ejector test platform established in this study can test the entertainment ratio of the ejector accurately.
- 2.
- The Standard k-e model is more accurate than other turbulence models at a low and medium flow rate. The Realizable k-e model is more accurate than other turbulence models at a large flow rate. The Standard k-e model and the Realizable k-e model are more suitable for ejector simulation and can be used to evaluate the performance of fuel cell ejectors.
- 3.
- When the system design is completed, the flow resistance increases when the flow rate increases. Along with the flow resistance of other operating conditions changing with the change of flow rates, testing the ejector with the method that fixes the flow resistance at the rated power operating condition can reflect the ejector performance at the full operating conditions.
Author Contributions
Conceptualization, F.C.; methodology, F.C. and M.H.; software, J.L. and Y.P.; validation, M.H., J.L. and Y.W.; formal analysis, F.C., M.H. and J.L.; investigation, M.H. and Y.W.; resources, F.C.; data curation, J.L. and Y.P.; writing—original draft preparation, M.H.; writing—review and editing, F.C. and M.H.; visualization, M.H. and Y.P.; supervision, F.C.; project administration, M.H.; funding acquisition, F.C. All authors have read and agreed to the published version of the manuscript.
Funding
This research was funded by National Key R&D Program of China (grant number 2017YFB0103104).
Institutional Review Board Statement
Not applicable.
Informed Consent Statement
Not applicable.
Conflicts of Interest
The authors declare no conflict of interest.
References
- Hong, Z.; Li, Q.; Han, Y.; Shang, W.; Zhu, Y.; Chen, W. An energy management strategy based on dynamic power factor for fuel cell/battery hybrid locomotive. Int. J. Hydrogen Energy 2018, 43, 3261–3272. [Google Scholar] [CrossRef]
- Peng, X.; Xu, S. Three-dimensional Modeling of Gas Purge in a Polymer Electrolyte Membrane Fuel Cell with Co-flow and Counter-flow Pattern. Fuel Cells 2017, 17, 794–808. [Google Scholar]
- Dadvar, M.; Afshari, E. Analysis of design parameters in anodic recirculation system based on ejector technology for PEM fuel cells: A new approach in designing. Int. J. Hydrogen Energy 2014, 39, 12061–12073. [Google Scholar] [CrossRef]
- Wang, X.; Xu, S.; Xing, C. Numerical and experimental investigation on an ejector designed for an 80 kW polymer electrolyte membrane fuel cell stack. J. Power Sources 2019, 415, 25–32. [Google Scholar] [CrossRef]
- Chang, X.; Ma, T.; Wu, R. Impact of urban development on residents’ public transportation travel energy consumption in China: An analysis of hydrogen fuel cell vehicles alternatives. Int. J. Hydrogen Energy 2019, 44, 16015–16027. [Google Scholar] [CrossRef]
- Liu, F.; Zhao, F.; Liu, Z.; Hao, H. The impact of fuel cell vehicle deployment on road transport greenhouse gas emissions: The China case. Int. J. Hydrogen Energy 2018, 43, 22604–22621. [Google Scholar] [CrossRef]
- Shimpalee, S.; Lilavivat, V.; McCrabb, H.; Khunatorn, Y.; Lee, H.-K.; Lee, W.-K.; Weidner, J. Investigation of bipolar plate materials for proton exchange membrane fuel cells. Int. J. Hydrogen Energy 2016, 41, 13688–13696. [Google Scholar] [CrossRef] [Green Version]
- Chen, F.; Gao, Y. An Algorithm for On-line Measurement of the Internal Resistance of Proton Exchange Membrane Fuel Cell. Fuel Cells 2015, 15, 337–343. [Google Scholar] [CrossRef]
- Jang, J.H.; Yan, W.M.; Chiu, H.C.; Lui, J.Y. Dynamic cell performance of kW-grade proton exchange membrane fuel cell stack with dead-ended anode. Appl. Energy 2015, 142, 108–114. [Google Scholar] [CrossRef]
- Tostado-Véliz, M.; Arévalo, P.; Jurado, F. A comprehensive electrical-gas-hydrogen Microgrid model for energy management applications. Energy Convers. Manag. 2021, 228, 113726. [Google Scholar] [CrossRef]
- Zhang, Q.Q.; Feng, J.M.; Zhang, Q.Q.; Peng, X.Y. Performance prediction and evaluation of the scroll-type hydrogen pump for FCVs based on CFD-Taguchi method. Int. J. Hydrogen Energy 2019, 44, 15333–15343. [Google Scholar] [CrossRef]
- Hou, J.; Yang, M.; Zhang, J. Active and passive fuel recirculation for solid oxide and proton exchange membrane fuel cells. Renew. Energy 2020, 155, 1355–1371. [Google Scholar] [CrossRef]
- Xue, H.; Wang, L.; Zhang, H.; Jia, L.; Ren, J. Design and investigation of multi-nozzle ejector for PEMFC hydrogen recircula-tion. Int. J. Hydrogen Energy 2020, 45, 14500–14516. [Google Scholar] [CrossRef]
- Besagni, G.; Mereu, R.; Inzoli, F.; Chiesa, P. Application of an integrated lumped parameter-CFD approach to evaluate the ejector-driven anode recirculation in a PEM fuel cell system. Appl. Therm. Eng. 2017, 121, 628–651. [Google Scholar] [CrossRef]
- Yang, L.; Zhengkai, T.; Siew, H.C. Applications of ejectors in proton exchange membrane fuel cells: A review. Fuel Process. Technol. 2021, 214, 1–12. [Google Scholar]
- Yang, Y.; Du, W.; Ma, T.; Lin, W.; Cong, M.; Yang, H.; Yu, Z. Numerical studies on ejector structure optimization and performance prediction based on a novel pressure drop model for proton exchange membrane fuel cell anode. Int. J. Hydrogen Energy 2020, 45, 23343–23352. [Google Scholar] [CrossRef]
- Jenssen, D.; Berger, O.; Krewer, U. Improved PEM fuel cell system operation with cascaded stack and ejector-based recircula-tion. Appl. Energy 2017, 195, 324–333. [Google Scholar] [CrossRef]
- Yang, Q.; Shi, W.; Chang, J.; Bao, W. Maximum thrust for the rocket-ejector mode of the hydrogen fueled rocket-based com-bined cycle engine. Int. J. Hydrogen Energy 2015, 40, 3771–3776. [Google Scholar] [CrossRef]
- Chen, Q.; Yan, G.; Yu, J. Performance analysis of an ejector enhanced refrigeration cycle with R290/R600a for application in domestic refrigerator/freezers. Appl. Therm. Eng. 2017, 120, 581–592. [Google Scholar] [CrossRef]
- Šarevski, M.N.; Šarevski, V.N. Characteristics of R718 refrigeration/heat pump systems with two-phase ejectors. Int. J. Refrig. 2016, 70, 13–32. [Google Scholar] [CrossRef]
- Chen, Z.; Dang, C.; Hihara, E. Investigations on driving flow expansion characteristics inside ejectors. Int. J. Heat Mass Transf. 2017, 108, 490–500. [Google Scholar] [CrossRef]
- Tamburini, A.; Cipollina, A.; Micale, G.; Piacentino, A. CHP (combined heat and power) retrofit for a large MED-TVC (multi-ple effect distillation along with thermal vapour compression) desalination plant: High efficiency assessment for different de-sign options under the current legislative EU framework. Energy 2016, 115, 1548–1559. [Google Scholar] [CrossRef]
- Askari, I.B.; Ameri, M. Techno economic feasibility analysis of Linear Fresnel solar field as thermal source of the MED/TVC desalination system. Desalination 2016, 394, 1–17. [Google Scholar] [CrossRef]
- Toghyani, S.; Afshari, E.; Baniasadi, E. A parametric comparison of three fuel recirculation system in the closed loop fuel supply system of PEM fuel cell. Int. J. Hydrogen Energy 2019, 44, 7518–7530. [Google Scholar] [CrossRef]
- Liu, Z.; Liu, Z.; Jiao, K.; Yang, Z.; Zhou, X.; Du, Q. Numerical investigation of ejector transient characteristics for a 130-kW PEMFC system. Int. J. Energy Res. 2020, 44, 3697–3710. [Google Scholar] [CrossRef]
- Hwang, J.J.; Cho, C.C.; Wu, W.; Chiu, C.H.; Chiu, K.C.; Lin, C.H. Numerical and experimental investigation into passive hy-drogen recovery scheme using vacuum ejector. J. Power Sources 2015, 275, 539–546. [Google Scholar] [CrossRef]
- Nikiforow, K.; Koski, P.; Karimäki, H.; Ihonen, J.; Alopaeus, V. Designing a hydrogen gas ejector for 5 kW stationary PEMFC system—CFD-modeling and experimental validation. Int. J. Hydrogen Energy 2016, 41, 14952–14970. [Google Scholar] [CrossRef]
Figure 1.
Schematic diagram of the fuel cell operational principle.

Figure 2.
Schematic diagram of the fuel cell hydrogen supply system.

Figure 3.
Schematic diagram of the ejector.

Figure 4.
Schematic diagram of the ejector test platform.

Figure 5.
Image of the ejector test platform.

Figure 6.
Image of the ejector.

Figure 7.
The entertainment ratio vs. primary volume flow rate under simulation and testing (the error bar represents the standard deviation).
Figure 7.
The entertainment ratio vs. primary volume flow rate under simulation and testing (the error bar represents the standard deviation).

Figure 8.
The relative deviation of the entertainment ratio vs. primary volume flow rate under simulation.
Figure 8.
The relative deviation of the entertainment ratio vs. primary volume flow rate under simulation.

Figure 9.
The flow resistance vs. primary volume flow rate.


Table 1.
Operating conditions.
| Operating Conditions | Primary Flow Rate (SLPM) | Outlet Pressure (kPa) |
|---|---|---|
| 1 | 100 | 130 |
| 2 | 200 | 140 |
| 3 | 400 | 160 |
| 4 | 500 | 180 |
| 5 | 900 | 230 |
| 6 | 990 | 250 |
Table 2.
The simulated data and the tested data of the ejector.
| Operating Conditions | Primary Flow Rate (SLPM) | Outlet Pressure (kPa) | Flow Resistance (kPa) | Entrainment Ratio | ||||
|---|---|---|---|---|---|---|---|---|
| k-e Standard | k-e RNG | k-e Realizable | k-w SST | Test | ||||
| 1 | 100 | 130.00 | 0.90 | 0.63 | 0.66 | 0.68 | 1.09 | 0.62 |
| 2 | 200 | 140.00 | 3.06 | 0.77 | 0.81 | 0.83 | 0.97 | 0.86 |
| 3 | 400 | 160.00 | 10.00 | 1.03 | 1.11 | 1.08 | 1.27 | 1.02 |
| 4 | 500 | 180.00 | 14.28 | 1.11 | 1.21 | 1.14 | 1.35 | 1.05 |
| 5 | 900 | 230.00 | 26.90 | 1.16 | 1.22 | 1.09 | 1.31 | 0.94 |
| 6 | 990 | 250.00 | 30.00 | 1.14 | 1.20 | 1.08 | 1.29 | 0.96 |
Publisher’s Note: MDPI stays neutral with regard to jurisdictional claims in published maps and institutional affiliations. |
© 2021 by the authors. Licensee MDPI, Basel, Switzerland. This article is an open access article distributed under the terms and conditions of the Creative Commons Attribution (CC BY) license (https://creativecommons.org/licenses/by/4.0/).
Share and Cite
MDPI and ACS Style
Chen, F.; Hou, M.; Li, J.; Pei, Y.; Wang, Y. Proton Exchange Membrane Fuel Cell Ejector Test Platform Design and Ejector Test Analysis. World Electr. Veh. J. 2021, 12, 103. https://0-doi-org.brum.beds.ac.uk/10.3390/wevj12030103
AMA Style
Chen F, Hou M, Li J, Pei Y, Wang Y. Proton Exchange Membrane Fuel Cell Ejector Test Platform Design and Ejector Test Analysis. World Electric Vehicle Journal. 2021; 12(3):103. https://0-doi-org.brum.beds.ac.uk/10.3390/wevj12030103
Chicago/Turabian StyleChen, Fengxiang, Mingtao Hou, Jianhui Li, Yaowang Pei, and Yangyang Wang. 2021. "Proton Exchange Membrane Fuel Cell Ejector Test Platform Design and Ejector Test Analysis" World Electric Vehicle Journal 12, no. 3: 103. https://0-doi-org.brum.beds.ac.uk/10.3390/wevj12030103