Article

Simultaneous Long-Term Planning of Flexible Electric Vehicle Photovoltaic Charging Stations in Terms of Load Response and Technical and Economic Indicators

by
Morteza Azimi Nasab
1,2,
Mohammad Zand
1,2,
Sanjeevikumar Padmanaban
1,2,* and
Baseem Khan
3
1
CTiF Global Capsule, Department of Business Development and Technology, 7400 Herning, Denmark
2
Renewable Energy Lab (REL), Communication and Networking Department, College of Engineering, Prince Sultan University, Riyadh 11586, Saudi Arabia
3
Department of Electrical and Computer Engineering, Hawassa University, Hawassa 05, Ethiopia
*
Author to whom correspondence should be addressed.
World Electr. Veh. J. 2021, 12(4), 190; https://0-doi-org.brum.beds.ac.uk/10.3390/wevj12040190
Submission received: 19 September 2021 / Revised: 3 October 2021 / Accepted: 6 October 2021 / Published: 15 October 2021
(This article belongs to the Special Issue Feature Papers in World Electric Vehicle Journal in 2021)

Abstract

:
Photovoltaic charging stations (PVCSs) are one of the most important pieces of charging equipment for electric vehicles (EVs). Recently, the process of designing solar charging stations as flexible sources has been growing and developing. This paper presents a relatively complete design of a solar charging station as a flexible economic resource in a 10-year planning horizon based on a genetic algorithm in two scenarios. PVCSs are not considered in the first scenario. This scenario is only to confirm the results, and the proposed method is proposed. However, in the second scenario, the effects of PVCSs and the demand response strategy (DR) on this development are considered. Copula probability distribution functions are used to create appropriate scenarios for vehicles during different planning years. The proposed energy management system shows a stable performance in terms of the annual load growth index and electricity price of each level of demand over the time horizon along with minimizing power losses and costs required, which makes PVCS efficiency higher and gives them a suitable structure and stability. The modeling results in terms of uncertainties in the system indicate that the use of load management along with PVCS design and flexible electric vehicle charge control strategies improves power quality parameters and optimizes system cost over a period of 10 years. Compared to the obtained results with the traditional case, it is observed that long-term planning in terms of DR and PVCSs and the technical specifications of the network have been improved. As a result of this proposed long-term planning, PVCSs are more flexible.

1. Introduction

The expansion of PVCSs is an effective measure to reduce our dependence on fossil fuels, and its widespread expansion across all countries will occur soon. Due to the advancement in flexible electric vehicles, it is expected that numerous EVs will soon be connected to the power grid for charging [1]. The energy needed to charge these vehicles can be modeled as an additional load for the primary power grid [2]. In order to promote the proper development of EVs and their charging equipment in the power grid, the planning of the future distribution network of both EV charging demand factors and their discharge capacity should be considered [3,4,5,6]. Therefore, in addition to meeting the demand for power in routine distribution network scheduling, distribution network performance planning, including charging stations, requires solutions to other technical issues such as charging station capacity planning, charging station installation location, power feeder scheduling and substation scheduling, includes EV charging stations [7,8]. Distribution network development planning is a traditional and large-scale optimization problem that determines how to distribute distribution network equipment over several years to ensure a reliable supply of increasing load. Usually, the objective function of the DEP problem is modeled as a cost function, which includes the cost of upgrading or replacing equipment, constructing or increasing the capacity of substations over different time periods. Recently, useful meta-heuristic algorithms have been proposed by researchers [3,4,5,6,7,8,9]. In recent years, several models and methods have been proposed to solve the DEP problem using DG. In the reference [9], the modified particle aggregation algorithm (MPSO) is introduced to solve the DEP problem by considering DG and sources of electrical energy storage. The proposed model optimally selects the total investment and operating costs of the DG and the distribution network. The authors in [10] have put on their agenda a dynamic model for the development of distribution networks to determine the appropriate location, time and capacity of the DG and the appropriate planning to increase the capacity of the lines in the distribution network. Additionally, the DGEP problem is solved with the help of SST and optimal load distribution (OPF) in the reference [11]. Similarly, the reference [12] has proposed a combined method to solve the DGEP problem to reduce the peak load of scattered products. Additionally, the issue of DGEP in reference [13], with the approach of minimizing the total investment costs and current operation in distribution networks in the presence of DG, has been considered. In [14], improved genetic algorithm and XGBoost classifier for power transformer fault diagnosis is utilized. In [15], an effective model for the DGEP problem is proposed. By solving the proposed model in the form of a complex multivariate optimization problem with a variety of discrete and continuous variables, the optimal location of DG installation and the optimal strategy to increase the capacity of existing lines in the network for a certain period of time are determined. The main goal of network design development planning is to create a reliable service with high reliability and cost-effectiveness for customers, EVs and owners of parking lots so that the quality of voltage and power within the allowable range is guaranteed [16]. Therefore, considering the objectives of reliability and cost to provide a complete model of the problem seems necessary. Additionally, in recent years, with the increasing influence of distributed generation at the distribution level, the planning of distributed generation resources is usually performed in conjunction with network development. In this regard, once PQ or PV are included in the problem, distributed generation sources can be modeled broadly or precisely as wind power or other types of power plants, as shown in [17,18]. In the reference [19], the uncertainty of scattered wind production is also considered for more accurate modeling. In order to model the wind speed uncertainty, rail probability distribution functions have been used, which are created after the discretization of probabilistic scenarios. In [20], a study has been conducted on determining the optimal charging profile for demands in peak hours. It has also investigated the effect of the charge profile on the distribution network. The optimum parking location for electric vehicles connected to the network was specified by respecting energy loss and reliability as economic constraints. The production of electric vehicles that can travel long distances necessitates the expansion of charging stations offering a notable amount of electrical energy to supply vehicles. Therefore, due to the progressing employment of electric vehicles globally, a futuristic plan for raising the number of such stations is apparent [21]. For this reason, extensive research has already been conducted or is underway in various aspects of the modeling, planning, designing and operating of charging stations. In [22], dynamic combined economic emission dispatch integrating plug-in electric vehicles and renewable energy sources is performed. A network with optimal parking locations and distributed sources is improved so that, in addition to providing the desired reliability, the losses also reach the optimal level. The goal of [23] was to maximize profit by modeling smart parking. In the proposed model, several economic and technical indicators were considered, along with the security constraints of the system. The authors in [6] presented a multi-objective algorithm regarding the number of electric vehicle parking lots, the location and capacity of these parking lots and the energy scheduling of power supply sources in the system [24]. Due to the growing adoption of electric vehicles in urban areas, researchers in [25] have examined electric vehicle charging demand models for urban settings. The authors in [26] developed a time–space model combining transport analysis with a power system analysis. The authors in [27] provided a time-based electric vehicle-demand-forecast model with multiple charging stations in an urban area. Through a cell transfer traffic model, the vehicle entry rate at a charging station was predicted. The authors in [28] estimated the time–space character of a charging station by modeling and simulating according to actual traffic data. In [29], an innovative dual model is proposed; a new model for parking electric vehicles at charging stations is presented at the first level. Moreover, a novel model is developed at the second level to minimize overall system costs, considering technical constraints on progressing distribution networks. Additionally, applying renewable sources such as photovoltaic cells is included. The advancement of solar charging equipment is deemed a clean and workable energy supply infrastructure for electric vehicles [25]. There is no restriction concerning the location of photovoltaic charging stations; such stations have been placed in commercial buildings and residential complexes [30]. Significant efforts have been made to study the energy management strategies of photovoltaic charging stations, such as displaying charging methods for network-connected hybrid electric vehicles (PHEVs). Based on [31], a substantial number of grid-connected hybrid electric vehicles are linked to the grid in a coordinated manner. Following the management of an entity, such as an electric vehicle parking lot, they can be set up as a small virtual power plant with a short start-up time and no considerable cost. Accordingly, in [32,33,34,35,36], fast energy management algorithms have been implemented for grid-connected charging parks in industrial/commercial locations. Additionally, in [37], an innovative operation strategy is proposed for micro-grids of commercial buildings, including photovoltaic array systems. Principles of decision-making strategies concerning the improvement of consumption of photovoltaic-based energy and a reduction in adverse effects on the power grid are discussed. In [38,39,40,41], classifications of electric vehicles for photovoltaic charging stations (PVCSs) are introduced, which diminishes energy costs associated with power supply. Further, the power system flexibility issues are also discussed with the renewable energy generation. An Energy Management System (EMS) is essential to achieve the maximum capabilities of micro-grids, such as increasing reliability, improving power quality, reducing the cost of energy supply and reducing greenhouse gas emissions. Thus, the optimal performance of the network in the micro-grid will be attainable. Different structures for EMSs employing different optimization algorithms and different shapes for micro-grids are presented in relevant research, some of which aim to optimize the performance of the source in the micro-grid system and minimize operating costs [42]. Economic aspects have been discussed in other proposed EMS schemes, and associated strategies have been reported to achieve maximum profit [43]. According to [44], various methods have been proposed to establish energy balance in micro-grids due to limitations in applying renewable energy sources. In [45], fault locating transmission lines with thyristor-controlled series capacitors by fuzzy logic method is performed. In [46], short-channel effects improvement of carbon nanotube field effect transistors is discussed. In [47], an overview on functional integration of hybrid renewable energy systems in multi-energy buildings is performed.
Although comprehensive studies have been conducted in the long-term planning of simultaneous photovoltaic charging stations of electric vehicles, a deep understanding of terms associated with load response and economic indicators is demanding. There are various resolutions to meet the requirements of supplying the increasing number of electric vehicles. Some people are of the opinion that increasing the number of power plants will improve the final amount of electricity needed, consequently resulting in environmental side-effects and high costs. This paper aims to optimally plan the charging stations and electric vehicles parked in their lots. It is plausible to consider the charging stations as temporary batteries during non-peak hours by saving the extra amount of electricity from the network and returning this energy during peak hours.
Accordingly, the same procedure is presumable for electric vehicles since they are manufactured with high-capacity batteries. Electric vehicle owners are free to choose whether they contribute to meeting the high energy demands during peak hours by linking their vehicles’ batteries to the grid while they have parked their EVs. In this regard, this article is structured as follows. In Section 2, the formulation of the optimization problem is stated. In Section 3, the proposed method and an expression of data are asserted. Furthermore, in Section 4, according to the load response programs in different scenarios, the results and outputs of the simulation are given before the conclusion. Section 5 contains the conclusions and policy implications.

2. The General Framework of the Optimization Problem
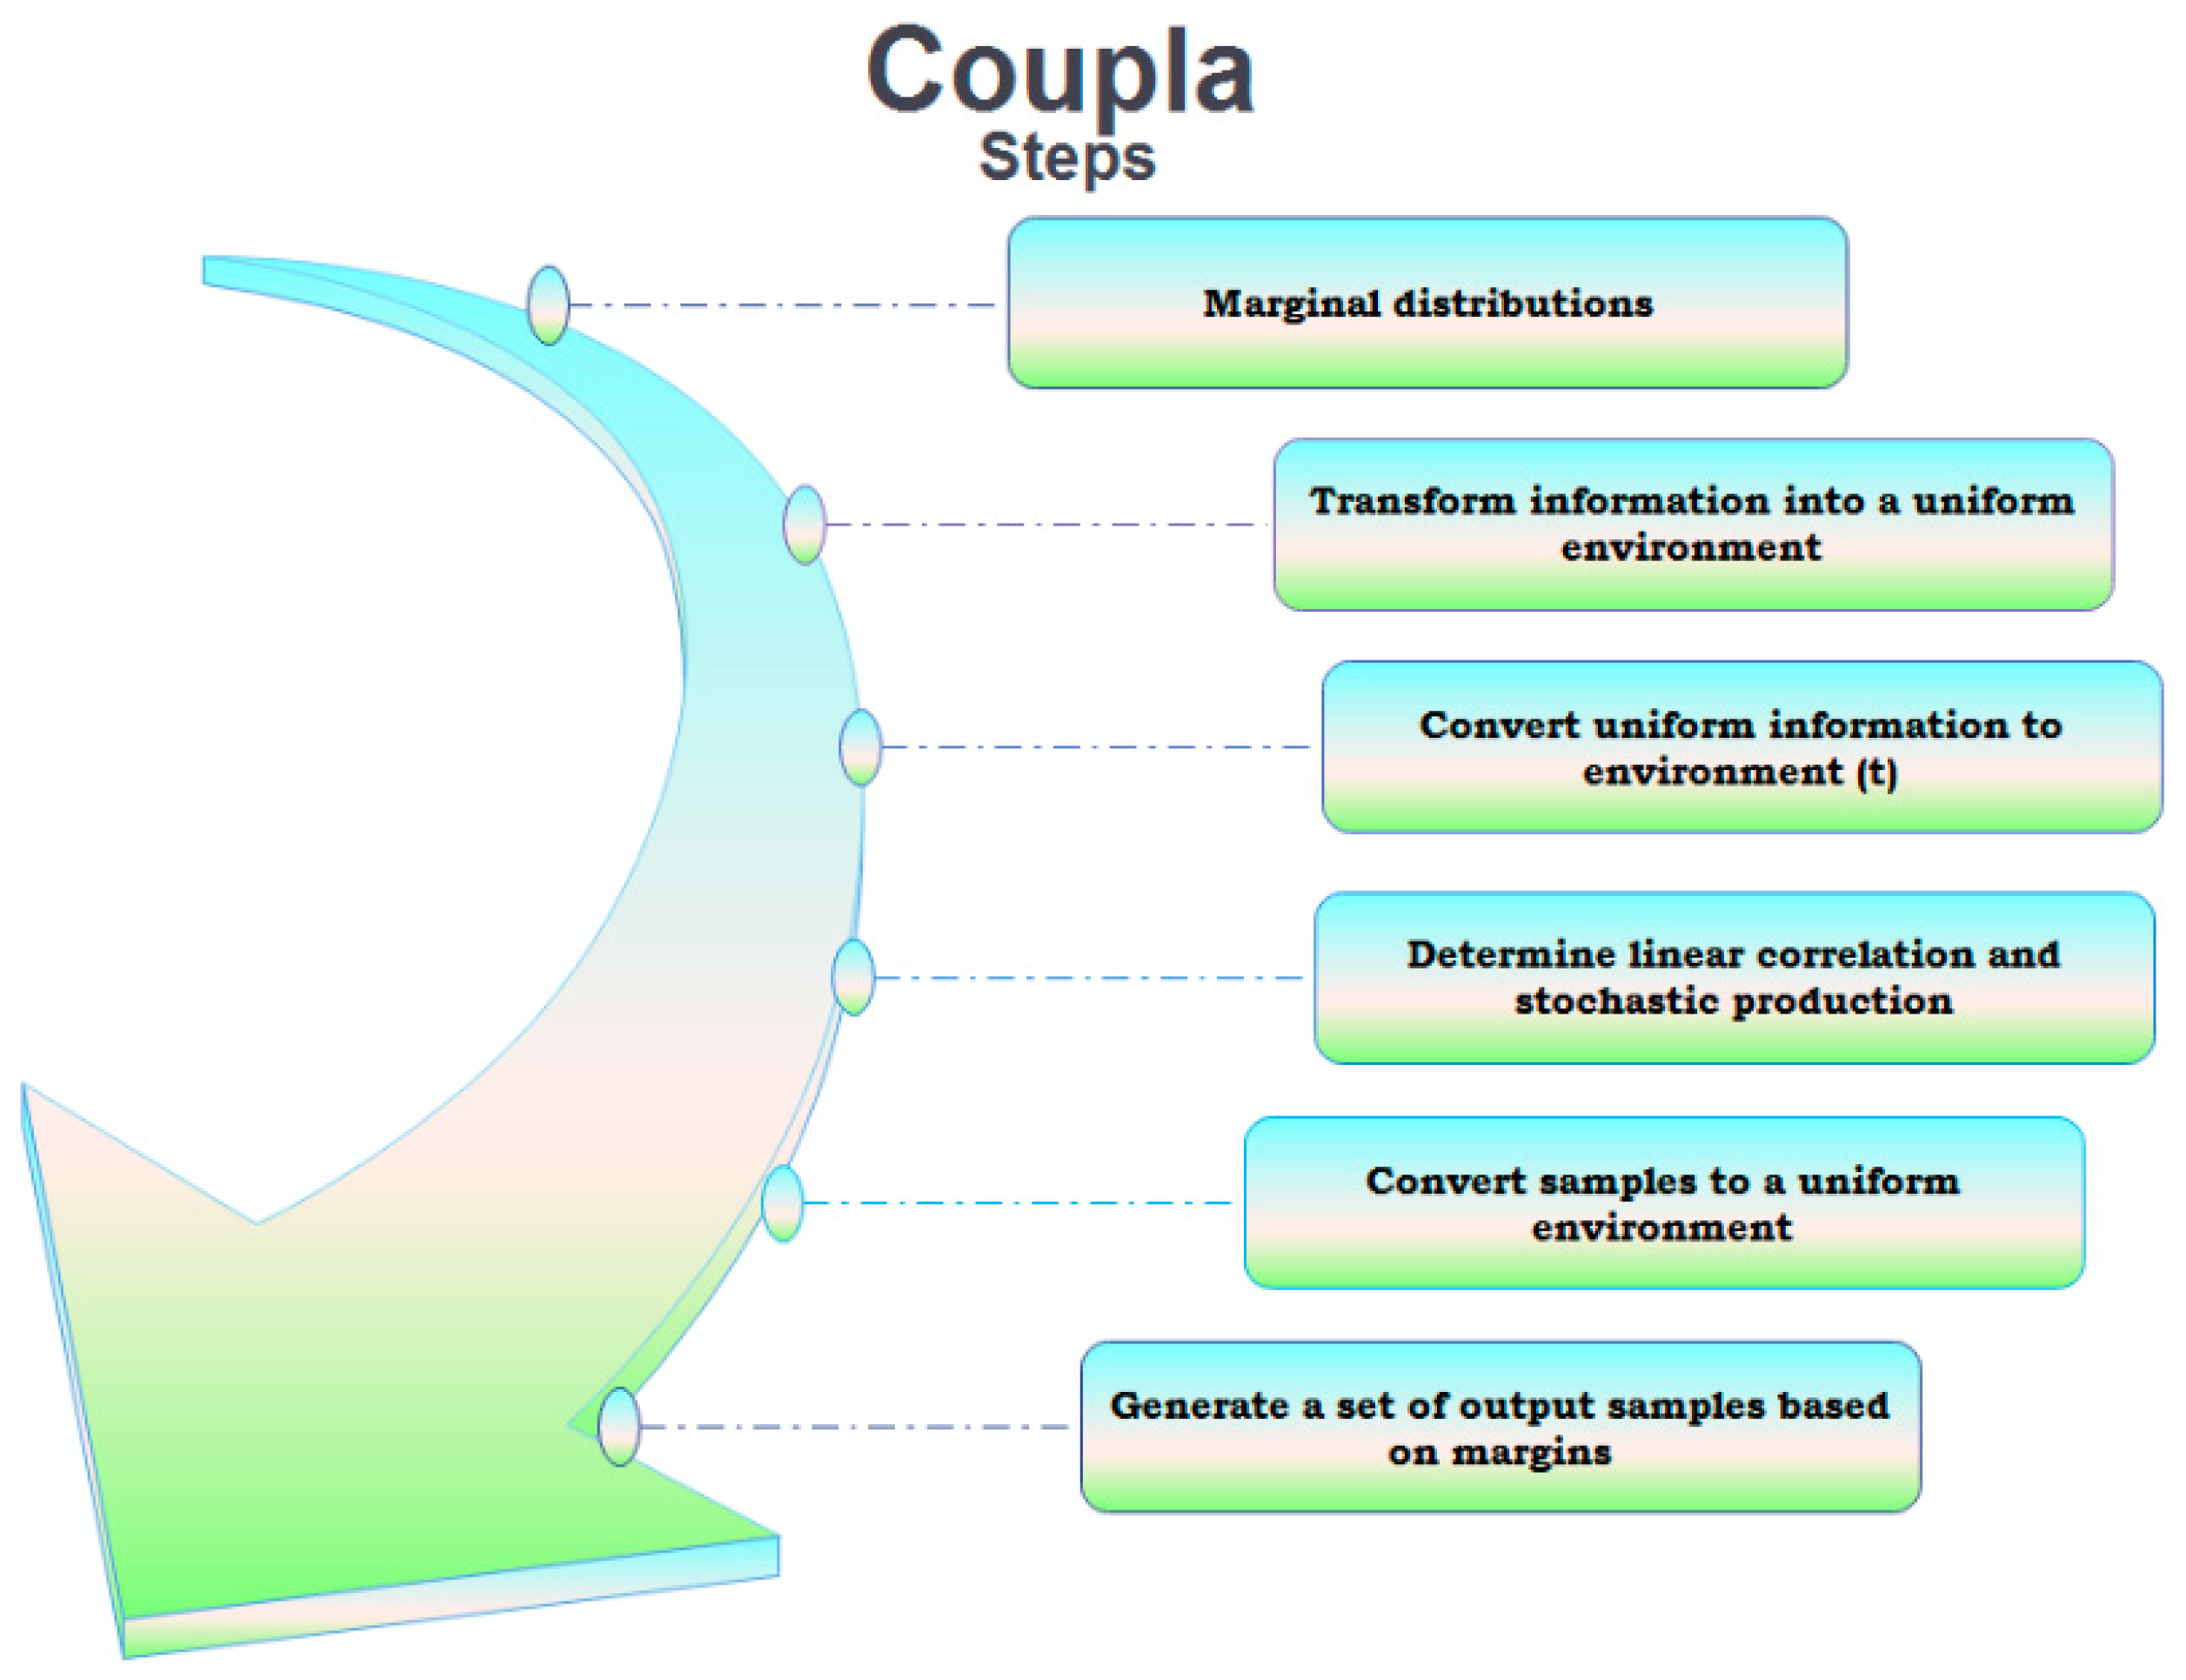
In recent years, many methods have been used by researchers to model the uncertainty of possible quantities. Among these techniques, we can mention the methods of probability tree, Monte Carlo, fuzzy method, etc. The capillary method is another method that has received more attention in recent years. In summary, the most attractive advantage of capillary functions is their ability to estimate limit functions and the degree of correlation. Examples of random variables are copulas. Considering the dependence between variables, this creates a multivariate distribution function. The following is a summary of capillary performance steps in various issues as shown below:
(1)
First, the sample amount of the problem variables that should be examined and analyzed with the information about the problem are determined through the available real statistics.
(2)
Then, these amounts are normalized and mapped to zero and one.
(3)
The capillary function is then applied to the normalized information, and the correlation coefficients between the variables are obtained.
(4)
Then, random samples are produced in large numbers using real normalized information and the obtained correlation coefficients.
(5)
Finally, the samples are mapped to their true range from zero to one.
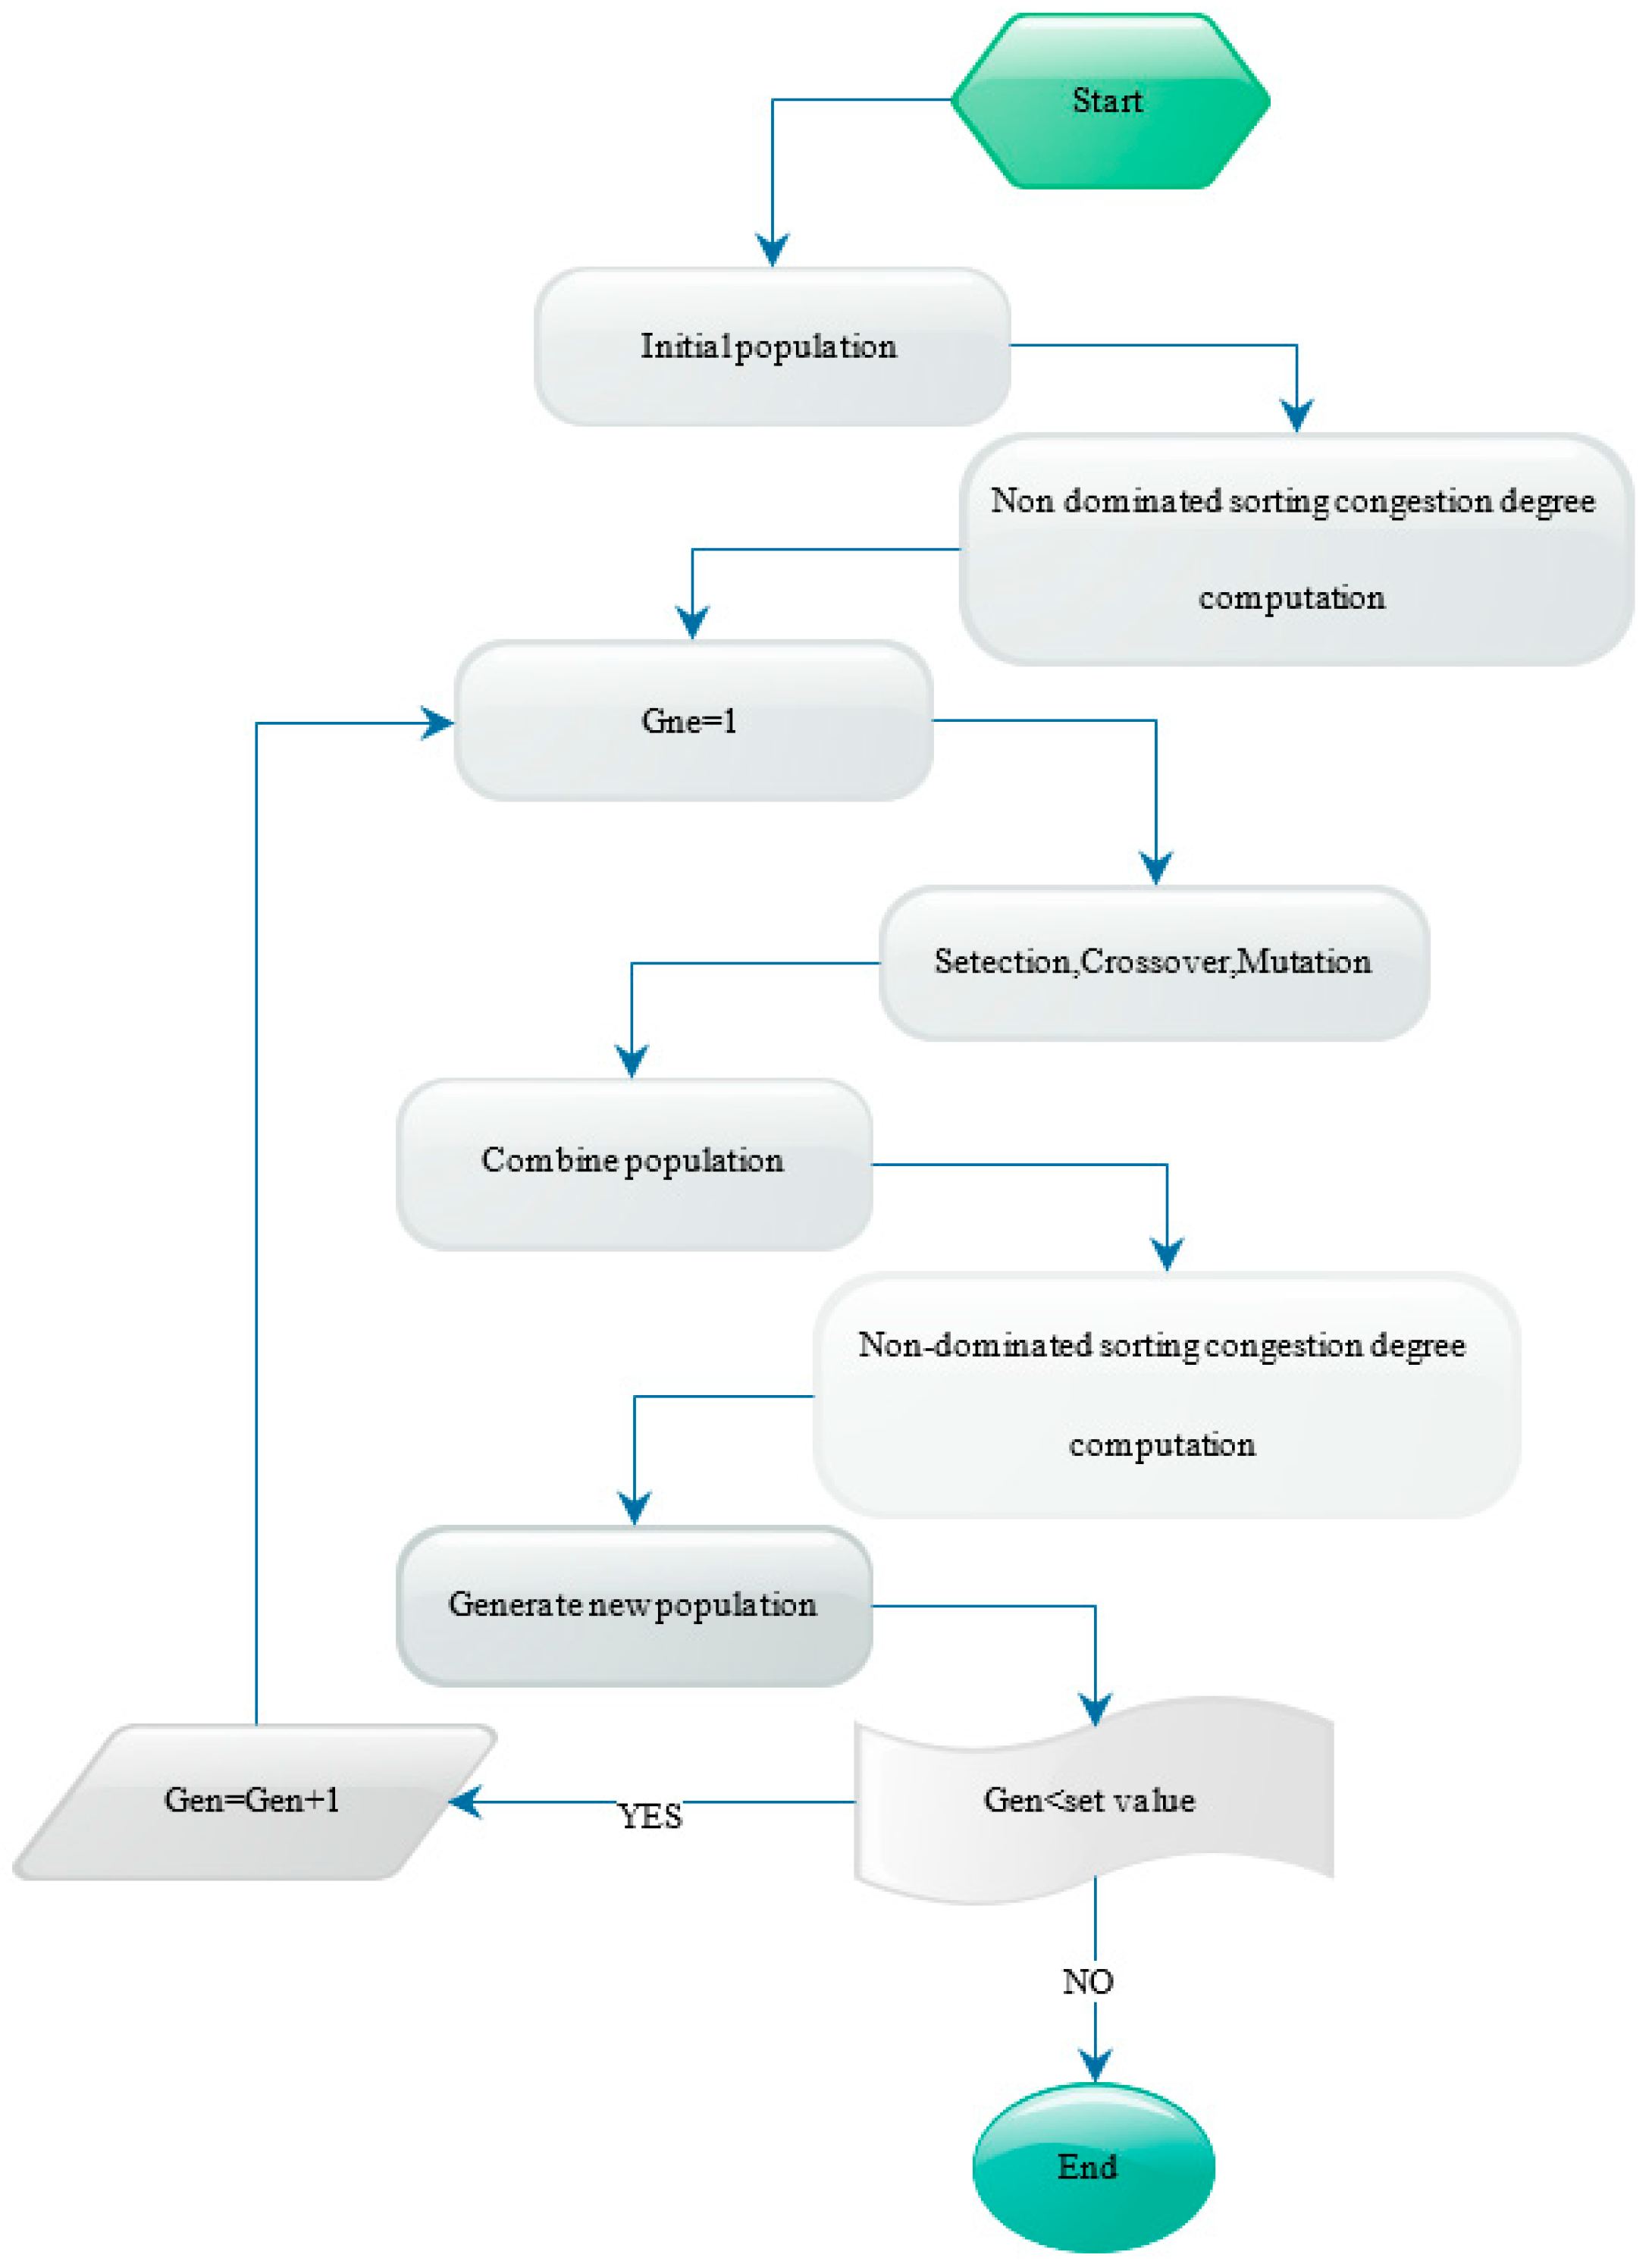
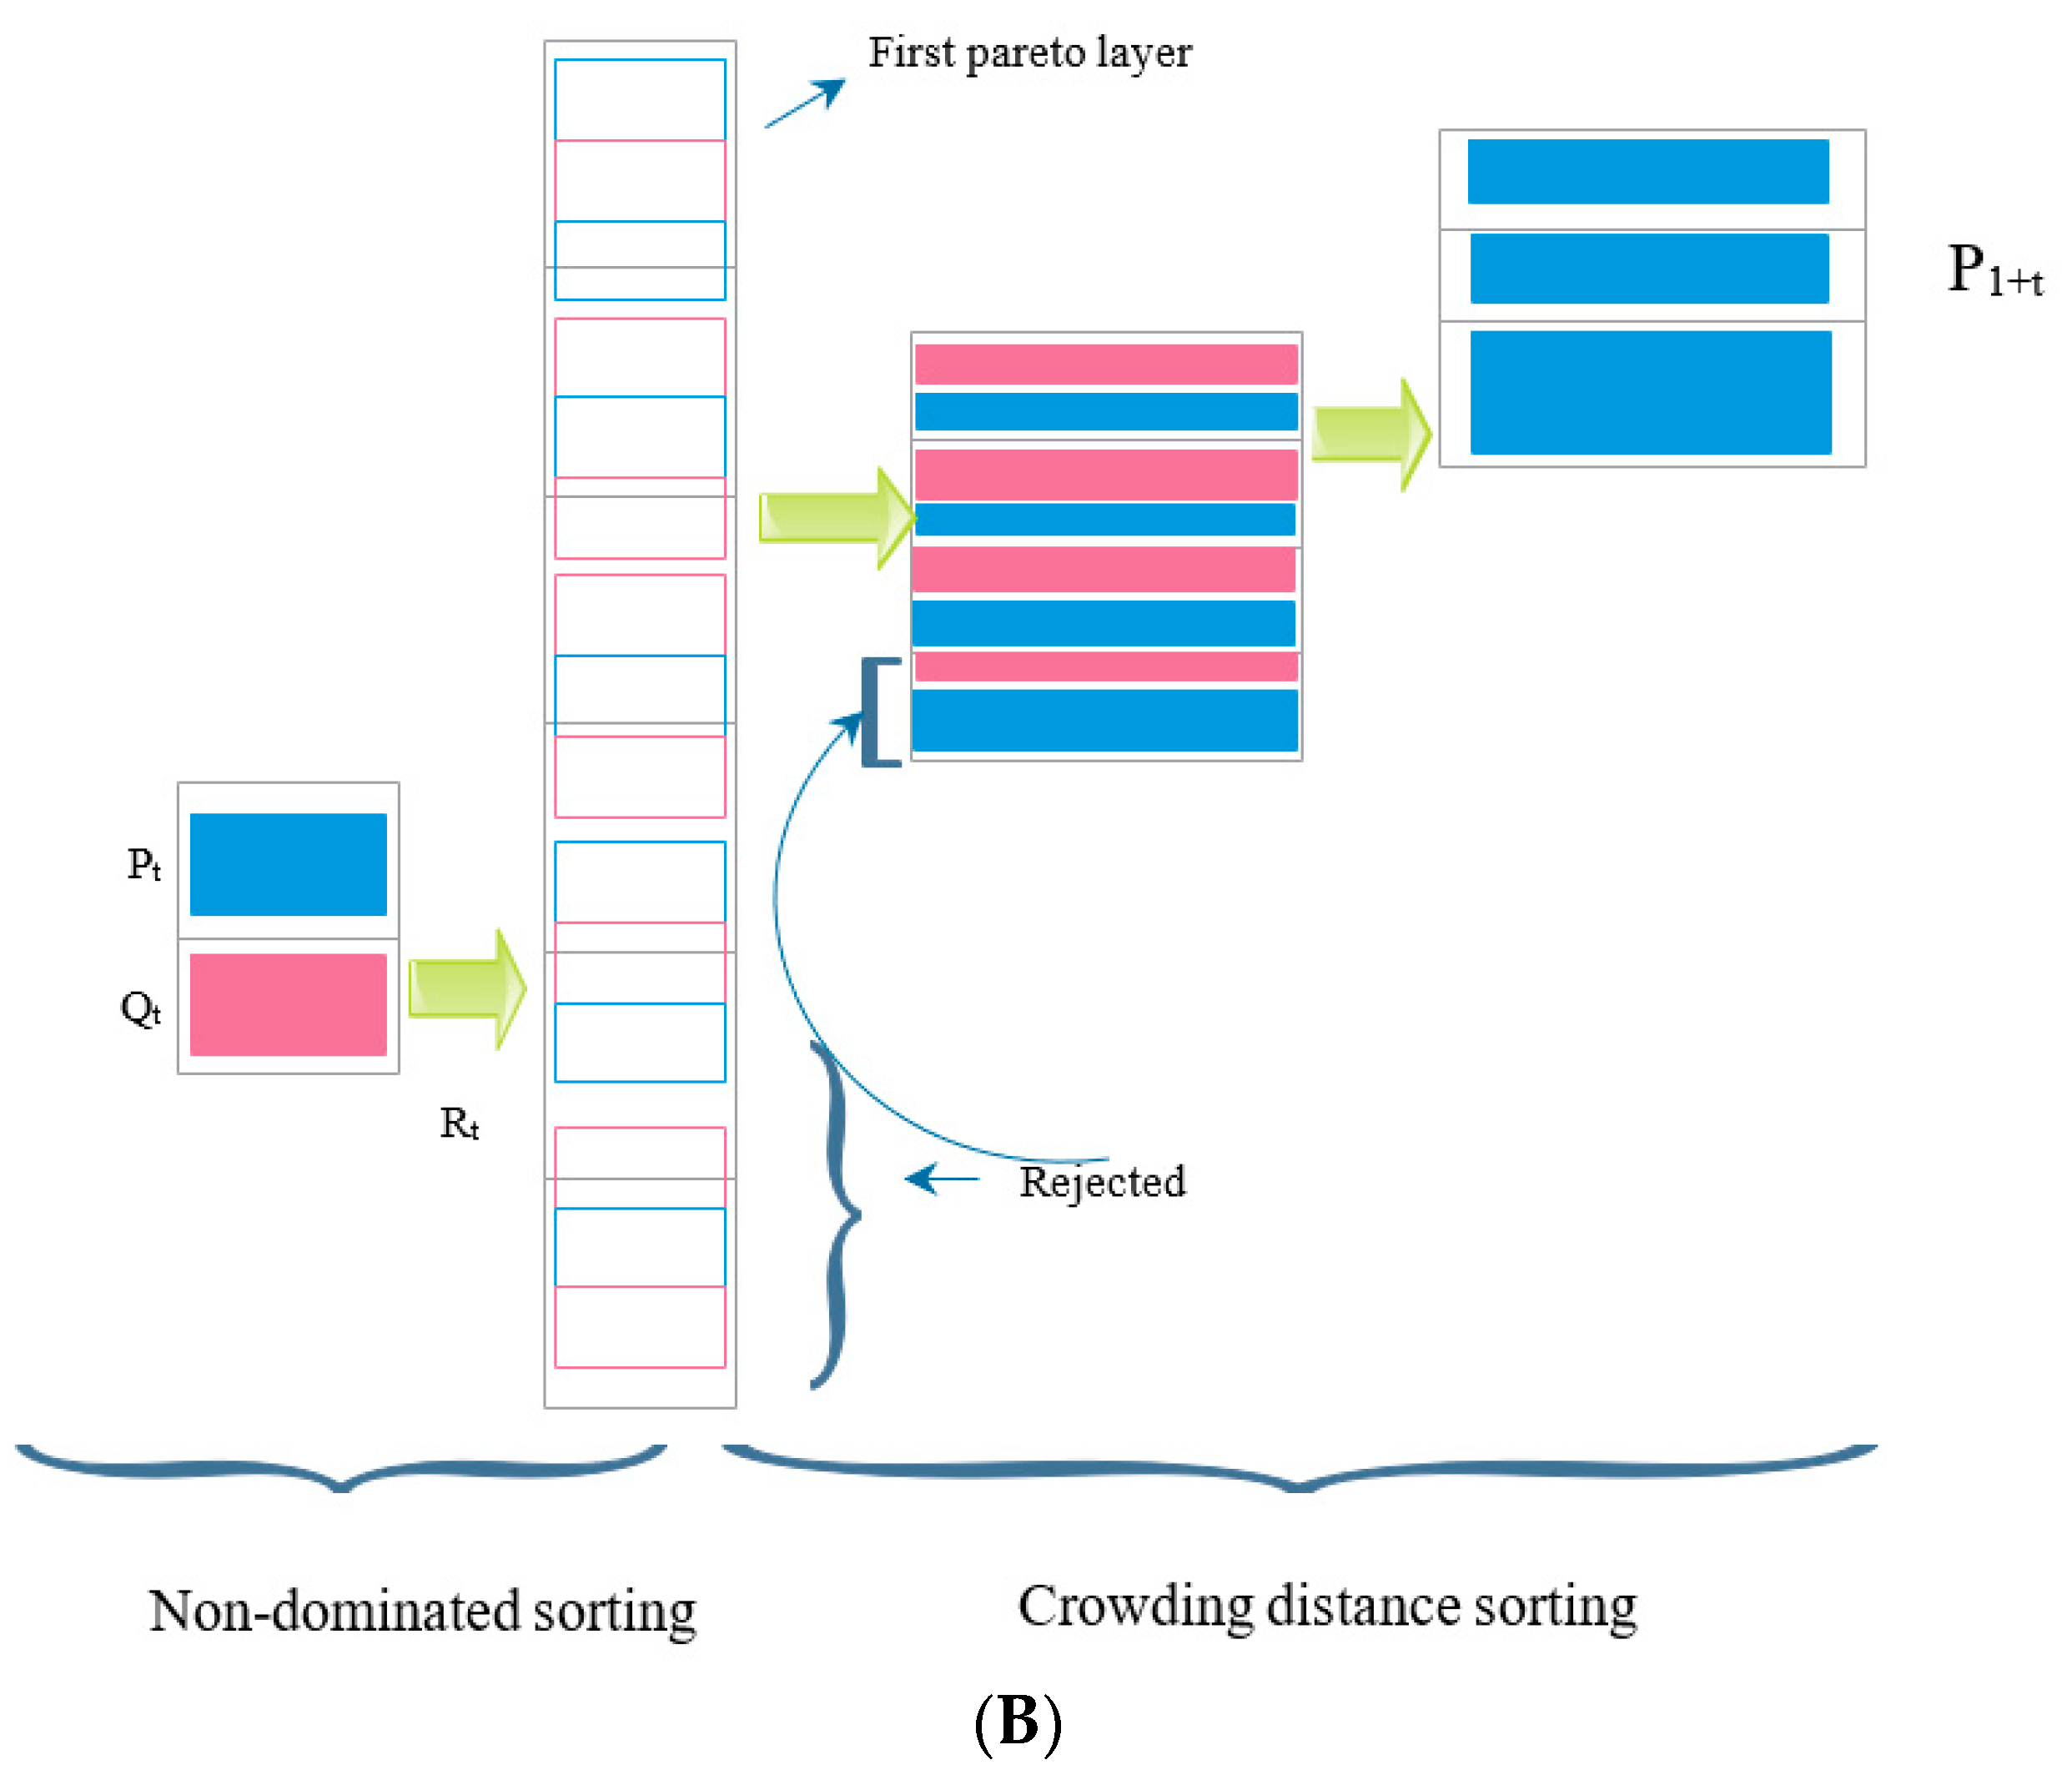
In addition, the charging station owner, who is considered the distribution system manager in this study, can purchase batteries from battery manufacturers in bulk and at a reduced price, lowering the cost to EV owners. Charging stations can charge EVs to supply the energy needed to operate an EV and exchange power with the grid, and utilize the EVs’ battery storage potential. EV owners can request a charge based on the pricing for charging EVs that has been announced. The charging station and solar power generation unit are designed to boost the distribution system’s capability and meet the driving needs of electric vehicle users, according to the criteria indicated. The placement challenge is designed once the charging station and solar power-producing unit have been modeled. The issue of placement must be addressed in such a way that the operating factors are preserved. The optimal position and capacity of the solar power-producing unit and charging station will result from the planning problem. It should be emphasized that Monte Carlo simulation is utilized to answer the uncertainties in this paper, and multi-objective genetic algorithms are employed to solve the optimization problems. The multi-objective genetic algorithm is depicted in the flowchart below.
The proposed method’s convergence is dependent on the number of starting solutions, just as other evolutionary algorithms. The algorithm begins by generating a random generation from the parent population because it is demographic. It uses a rapid non-defeat sorting strategy with computing complexity (MN2) to regulate non-defeated answers from the parent population. M is the number of objectives, and N is the population size. According to the layer in which it is positioned, each of the answers within a Pareto layer is assigned a reasonable value. Within each layer, the density distance criterion is utilized to measure and rank the solutions. This initiative has been launched multiple times for this purpose, with varying initial populations of 50, 100, 150 and 200 people. The proposed algorithm’s convergence is depicted in Figure 1, indicating that an initial population of 150 people may be adequate to produce an optimal solution. As a result, we set the population value to 150 in the simulations in this paper. Figure 2 presented the flowchart of multi-objective genetic algorithm. In summary, based on Figure 3, the typical production pattern of the nth generation in NSGA-II is as follows:
(1)
Combine the population of parents ( P o =   P t ) and children ( Q o   = Q t ) and form the population ( R t = P t Q t ) with size 2N.
(2)
Run the unsuccessful sort on R t to specify the different layers F i . i = 1, 2,…, l.
(3)
Create a population of P i + 1 size N by selecting superior solutions from non-dominant layers ( F 1 , F 2 , , F i ) in order of priority.
(4)
Calculate the population Q i + 1 of children of size N using RKGA operators.
(5)
Continue steps 1 to 4 until the convergence criteria are reached.
Figure 4 shows the execution time curve of the NSGA-II-based programming algorithm for the sample system based on the number of initial responses. This almost linear curve of program execution time demonstrates the necessity of selecting the number of early populations optimally. It should be mentioned that all simulations were performed on a computer with a memory of 32 GB, and Table 1 lists the major parameters of the proposed method as well as program execution time for core7, ram16G and graphic8G.
Chromosome coding: A string of chromosomes the size of a row of the dataset (number of characteristics in the dataset) is represented by a binary digit D for the task of selecting a subset of attributes. Each binary digit represents an attribute. A perspective of a chromosome used in this method is shown in Table 2.
In general, coding is the mapping from the search space to the space of strings made with length L and an alphabetic set of n characters, indicating the absence of features.

3. Modeling Uncertainties

Due to the wide use of distributed generation resources, different optimization methods have been proposed to find the optimal location and capacity, which are significantly affected by the load model and electricity price. However, since the load curve of subscribers and the cost of electricity are obtained from forecasting methods, their changes have a percentage of error and are not known definitively. In this study, uncertainties in the load continuity curve and electricity price are probabilistically modeled using the normal distribution. It should be noted that the Monte Vehicle log method has been used to simulate a load model and electricity price. Table A1 and Table A2, in Appendix A, provided the descriptions of various parameters and indices utilized in below mentioned equations.

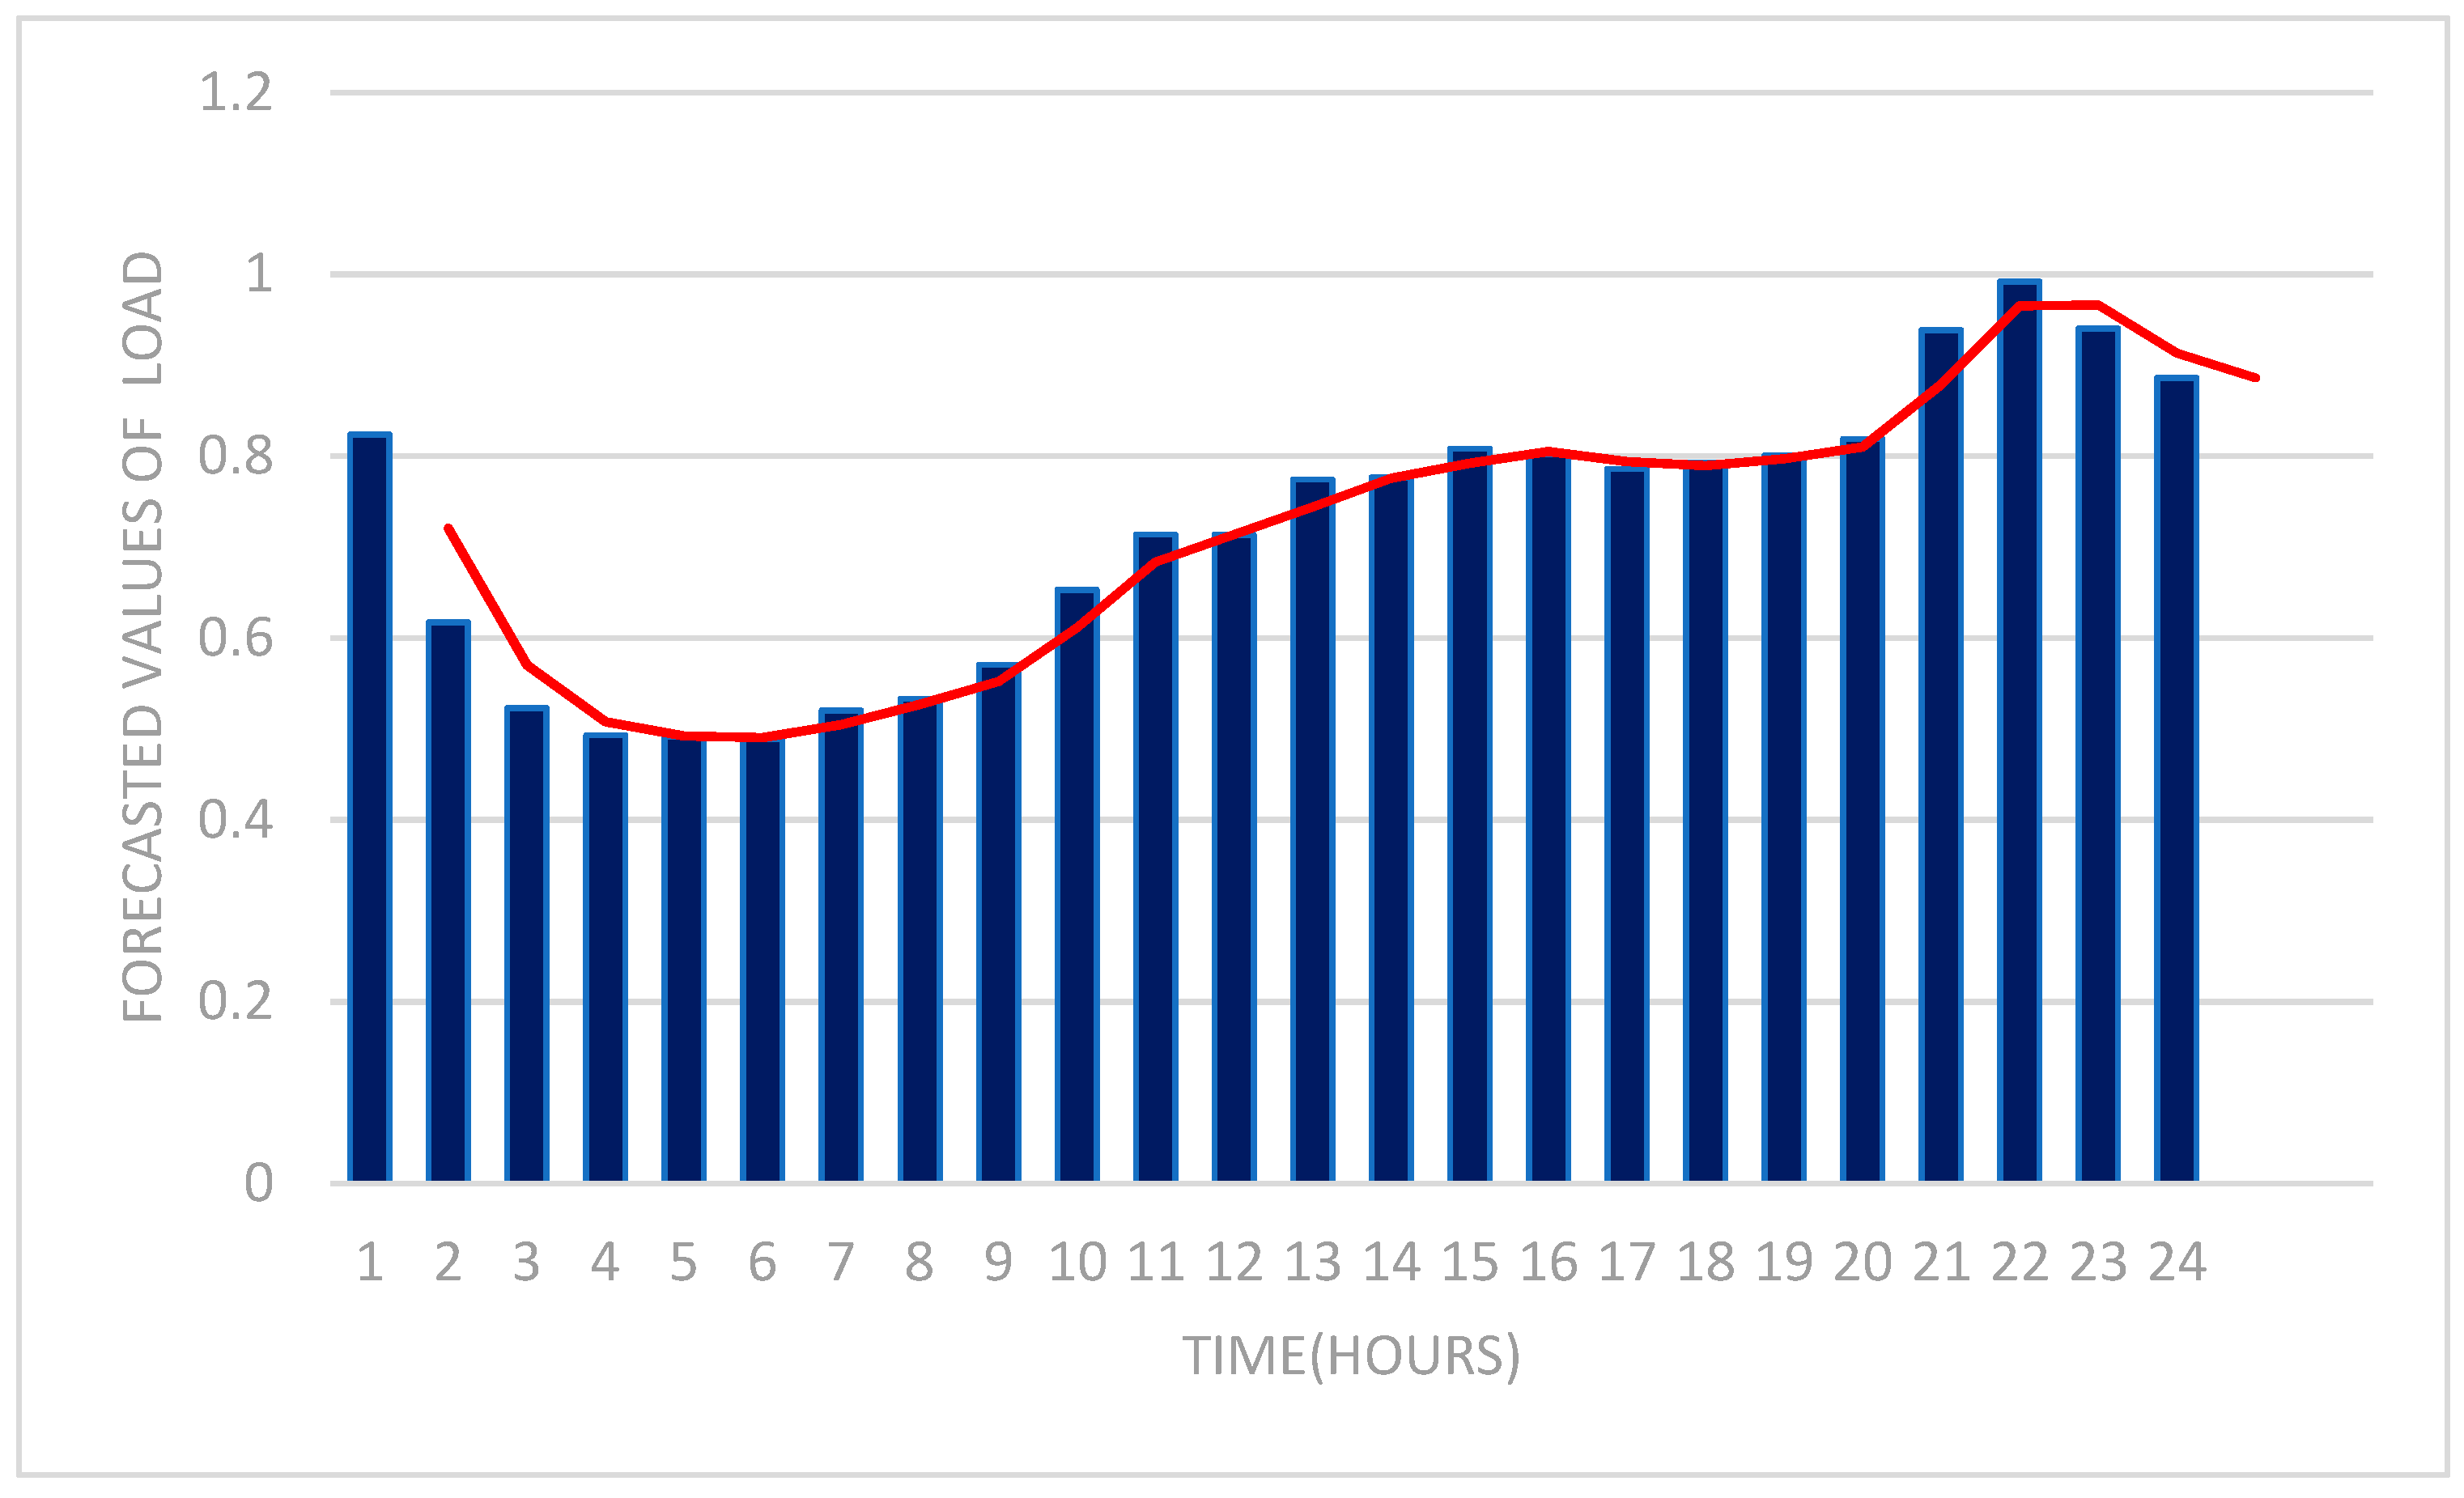
3.1. Load Uncertainty

According to the varied behavior patterns of distribution system subscribers in electricity consumption, daily load changes in each year of the planning period are modeled using the following parameters. The first parameter is the amount of load consumed in the first year of the planning period. Each year of the planning period is divided into: N d l . The demand level is h and the duration of each demand level ( h ) is τ . The second parameter of the load model is the demand level factor, which is obtained using the probability density function as follows [32]:
D L F i , t , h e = μ i , t , h D + λ i , t , h D , e × σ i , t , h D
λ is a random variable produced using the normal distribution function with a mean value of zero and a standard deviation of one for each level of demand. μ and σ are the predicted values of the load demand and their standard deviation, respectively. Figure 5 and Equation (3) express the default load demand curve, and Figure 6 illustrates the default electricity price.
Considering α the load growth rate for each year, the amount of electricity consumption at each level of demand is calculated [31]. The demand for active and passive power is presented in Equations (2) and (3), and apparent power demand is in Equation (4). The superscript e shows that the parameters belong to the Monte Carlo experiment e.
P i , t , h e = P i , b a s e × D L F i , t , h e × ( 1 + α ) t
Q i , t , h e = Q i , b a s e × D L F i , t , h e × ( 1 + α ) t
S i , t , h e = P i , t , h e + j Q i , t , h e

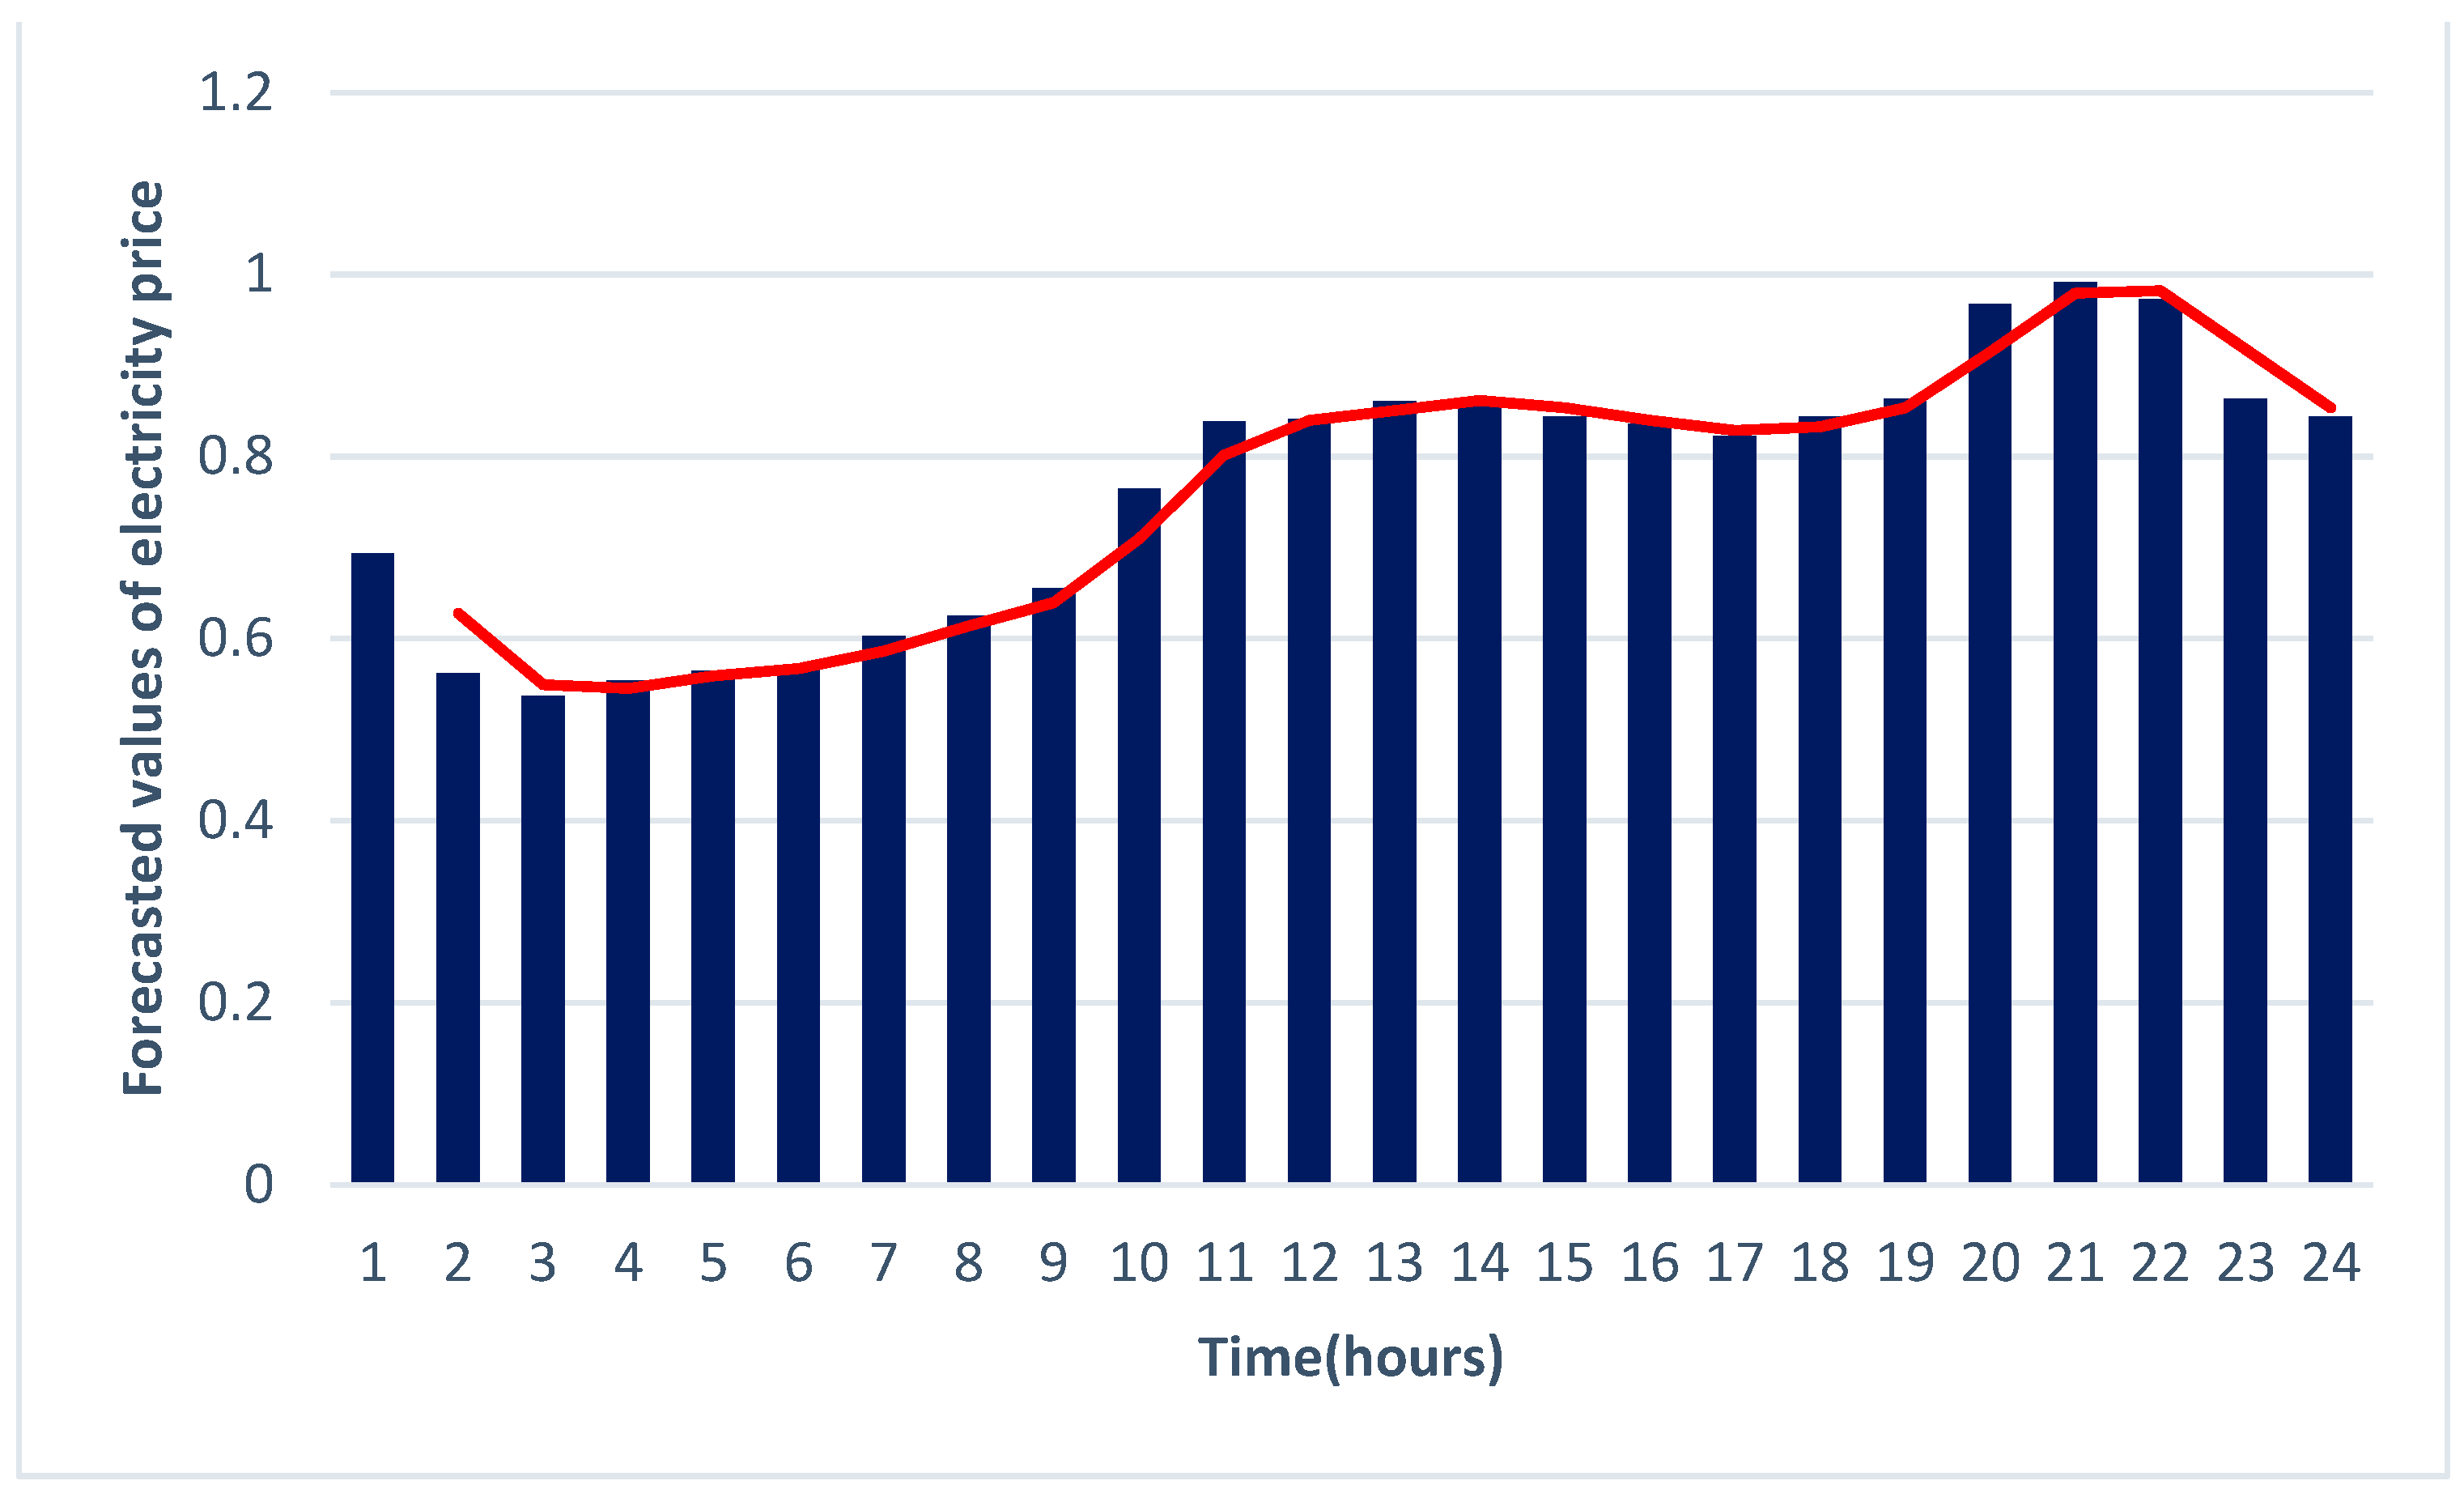
3.2. Electricity Price Uncertainty

Depending on the amount of electricity consumption and the behavior of electricity market users, the price is determined for the electricity purchased from the primary grid. Based on Equation (5), this amount changes for the cost of electricity at the specific level of demand each year of the planning period. Changes in this quantity are modeled by multiplying two parameters, the base price of electricity for each level of demand and the price level index [35]—Equation (5).
ρ t , h = ρ × P L F t , h e
ρ is the price level index that shows the behavior of the electricity market in the year t and the demand level of h. It is calculated using the probability density function as follows (Equation (6)):
P L F t , h e = μ t , h ρ + λ t , h ρ , e × σ t , h ρ
σ t , h ρ = 0.1 × μ t , h ρ

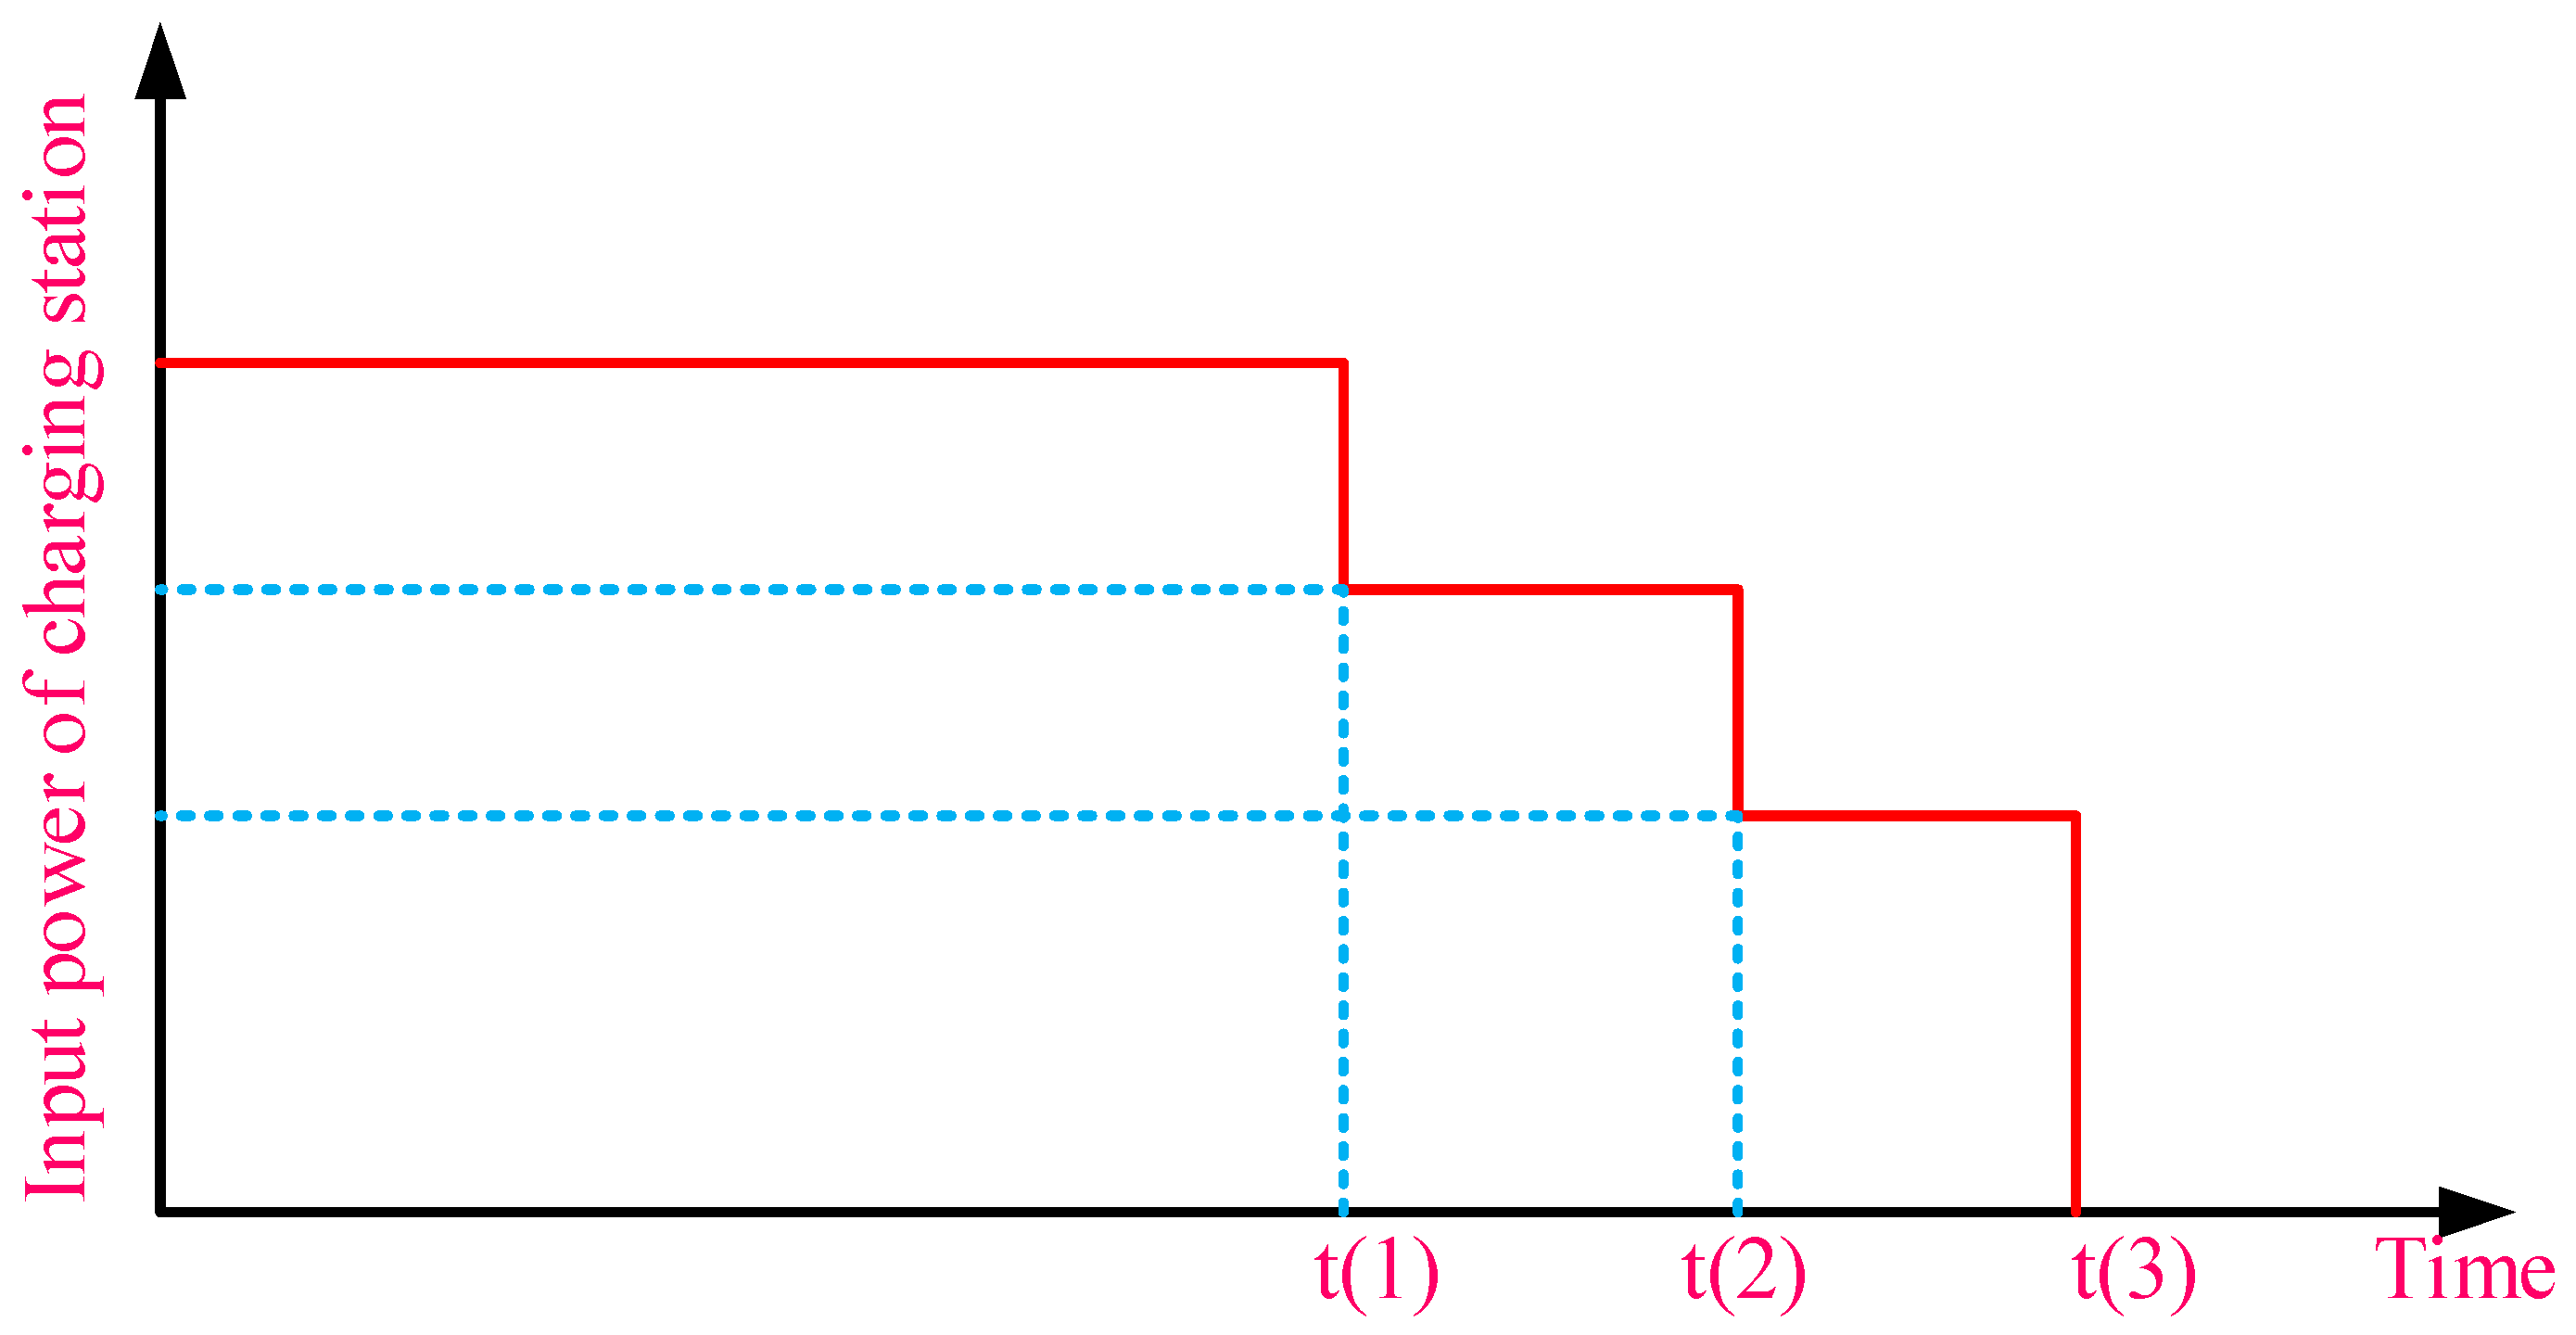
4. Charging Station Modeling

Charging station power depends on the used battery technical specifications in the vehicle, such as the type and capacity, the amount of initial charge and the number of vehicles available at the charging station. Such parameters are not fixed and have high variability. Therefore, the location and operating conditions of the stations should be examined, and their characteristics should be considered in the model used. Electric vehicle owners’ behavior is also the most influential factor in modeling these uncertain parameters compared to others discussed in this study. First, the modeling used for these parameters is discussed in this paper.

5. Type and Capacity of Vehicle Batteries

The companies that manufacture these batteries use different technologies, which has led to a variety of products. This diversity represents non-uniform consumers and makes the design of charging stations more complex. Here, the considered parameters are influenced by factors such as the amount of construction and development of batteries and each type’s public acceptance rate in the station locations. In this paper, a 25-kWh battery is used, and its life is estimated at ten years.

5.1. The Initial Charge of Vehicle Batteries

The ratio of energy stored in a battery to its capacity is defined as the initial charge between 0 and 100. This parameter increases when the EV battery is being charged. SOC is reduced by consuming battery power (power delivery to the grid or vehicle). The battery storage capacity of the EVs is not used while they are charging at the charging station. Using this feature will depend on the initial charge of the EV’s battery. Due to the variability of the distance traveled by EVs, their efficiency and the type of EV batteries, the amount of initial energy remaining in EV batteries will not be known. This paper considers the amount of initial charge of vehicles referring to the charging station at three levels in Table 3.

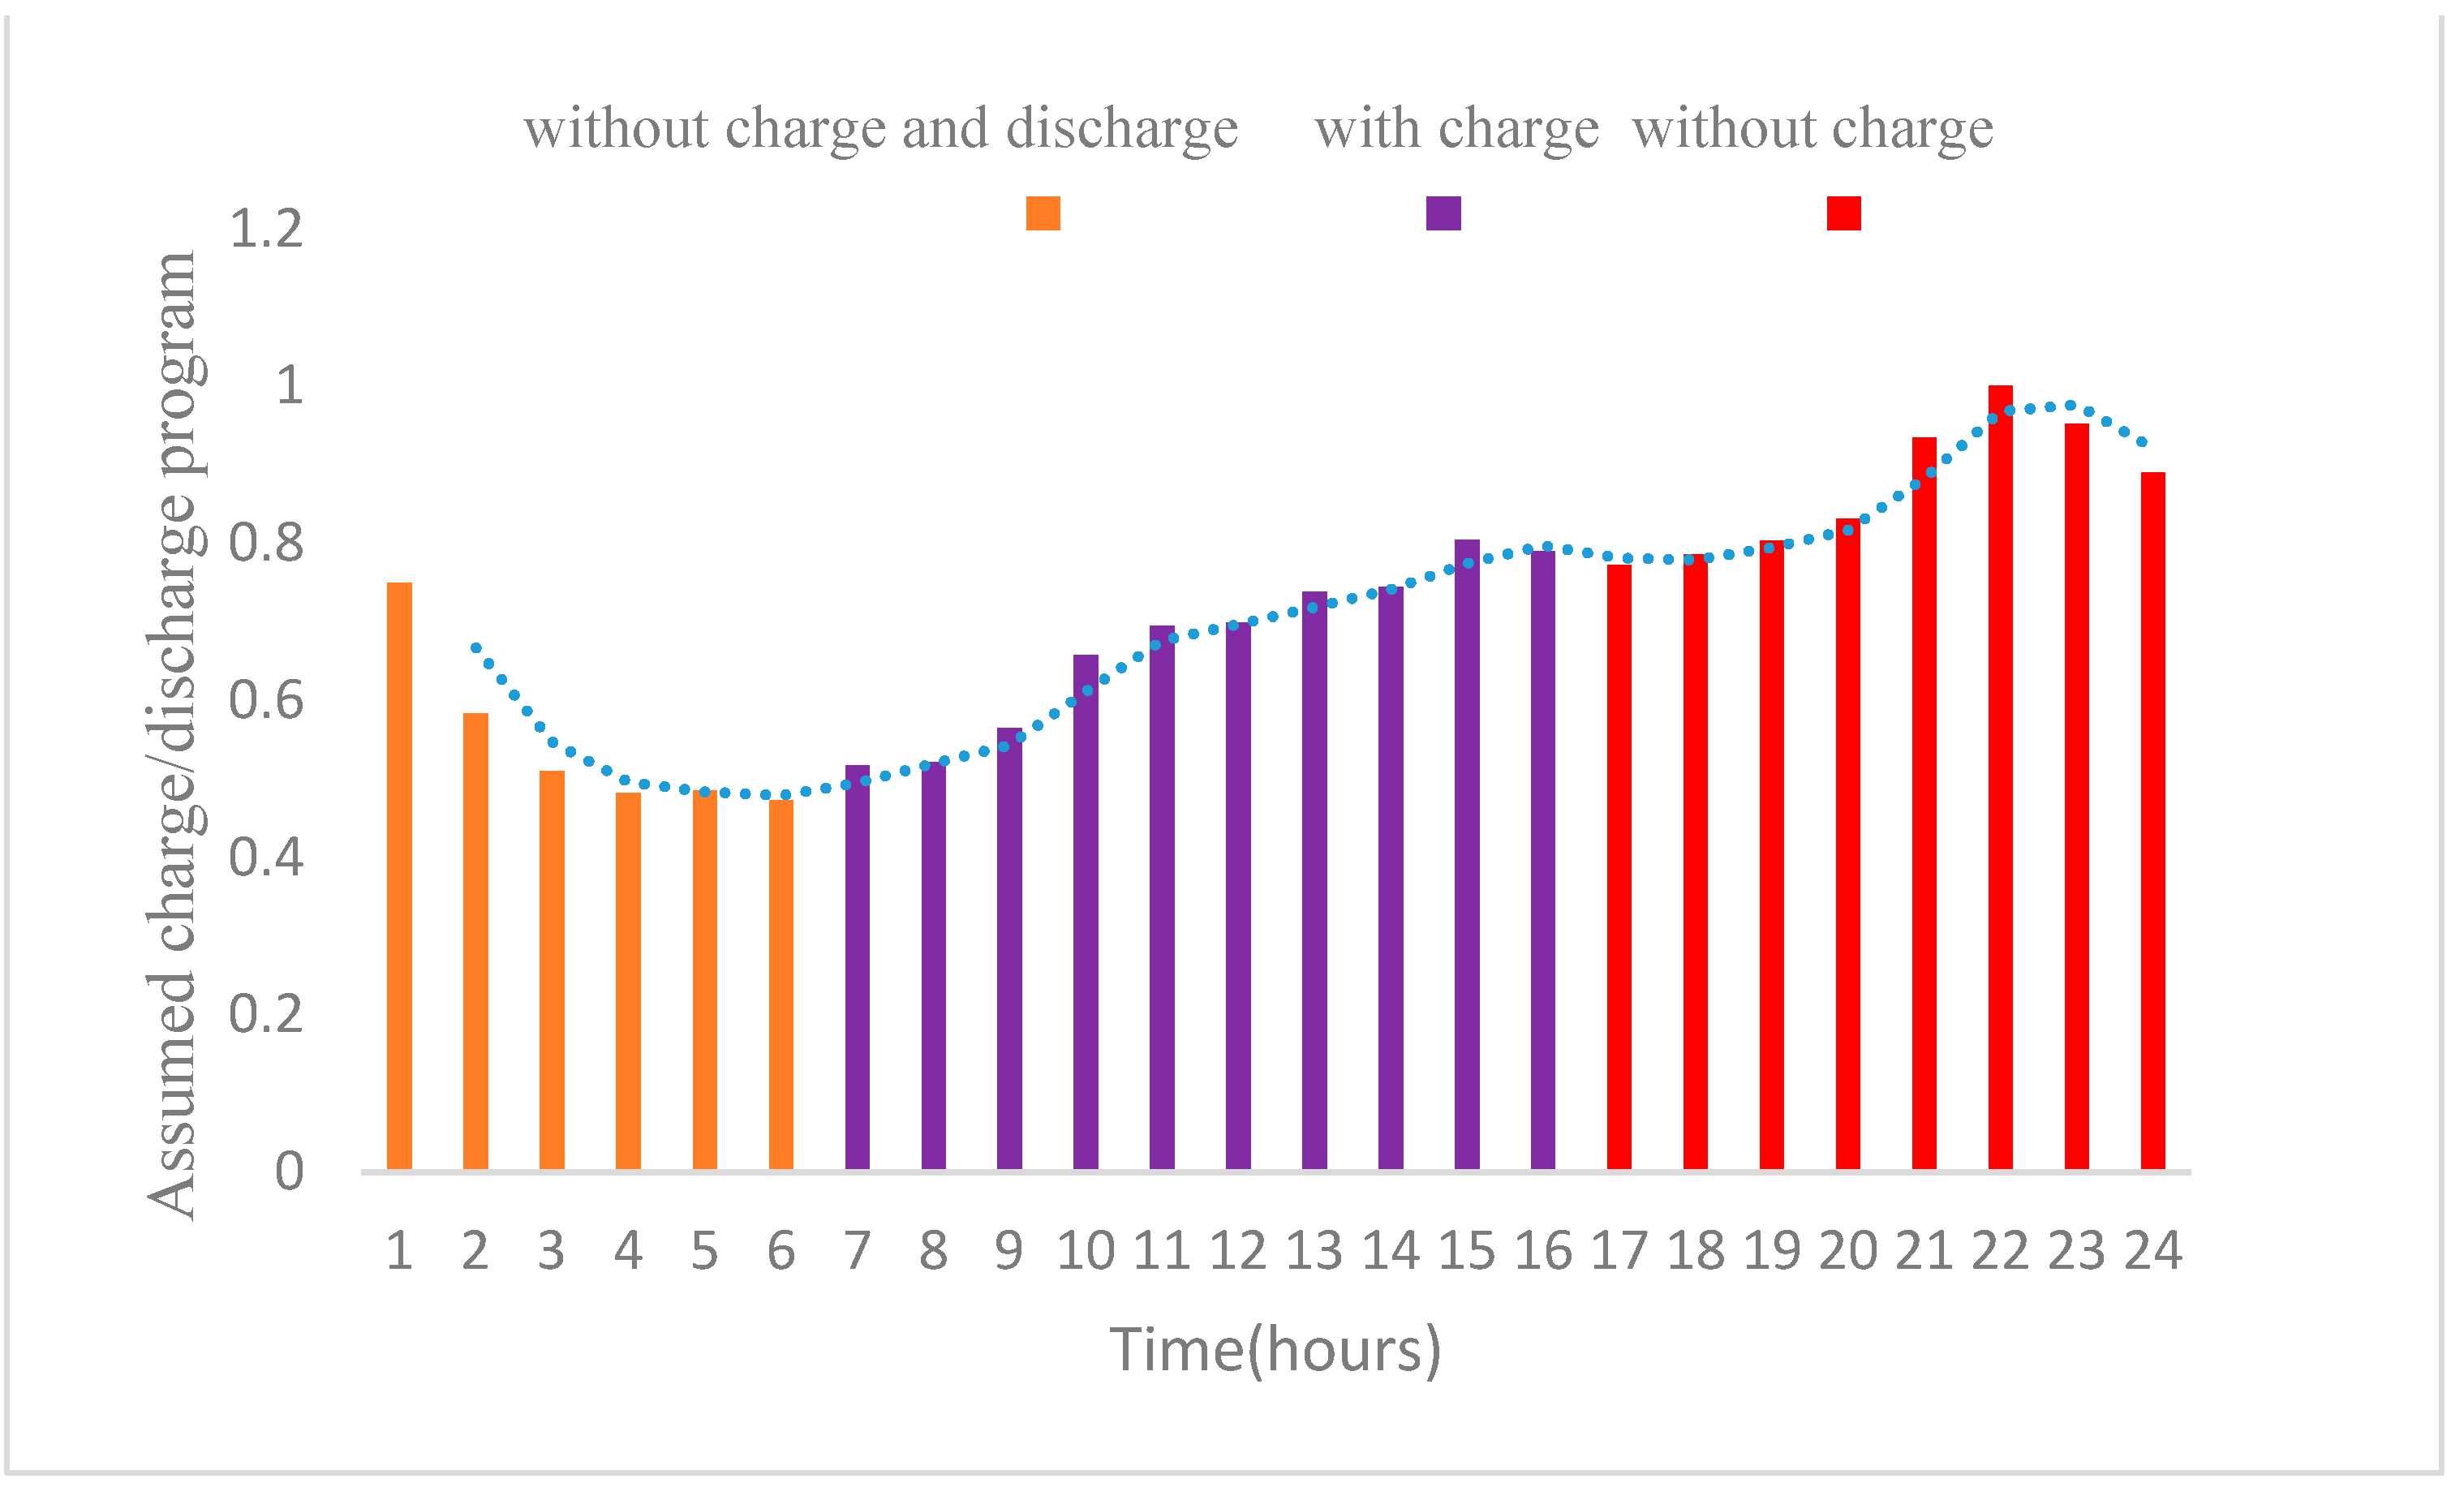
5.2. Vehicle Charging Schedule

By each vehicle at charging stations, the initial and required final charge and the departure time from the charging station are asked from the vehicle owners. Then, according to this information, by considering the profit from using the vehicles as storage and the cost of charging the batteries for driving, the optimal charging/discharging program for vehicles in the charging station is determined. The time required for full charge/discharge of vehicle batteries is calculated using the initial charge amount as follows [33]:
t c h a r g e ( j ) = ( S O C m a x S O C j ) × E S j P v
t d i s c h a r g e ( j ) = ( S O C j S O C m i n ) × E S j P v
S O C m a x and S O C m i n are the maximum and minimum flux values for the vehicle battery. E S is the capacity of a vehicle battery and P v is the rate of power transition. In this section, the mathematical modeling of charge station power is discussed. Due to the uncertainties mentioned in the previous sections and the terms of them, the input and output power of the electric vehicle charging station will be following Figure 7 and Equations (12) and (13).

6. Modeling the Location Problem

To model the placement problem in the first step, the placement goals must be specified. In this project, maximizing profits for the distribution system manager (charging station owner) is considered the optimization problem’s goal. Profit from charging/discharging patterns of electric vehicles in the charging station, profit from reducing the active power losses in the distribution network, the cost of power supply through the upstream network and the investment cost for constructing the charging station as a profit function are considered. In the following, the average of the mentioned objective functions is discussed.

6.1. Profits from Discharge Programs

The battery capacity of electric vehicles in electrical energy storage enables charging stations to provide part of the network power at a lower price than the upstream network during peak times. It reduces the cost for the distribution system manager. The profit for using the power transmission technology from the vehicle to the network is calculated from Equations (10) and (11). As shown in Equation (12), the difference between revenue from power transmission to the network ( R t o t a l d i s c h a r g e ) and the total cost for supplying discharge service ( C t o t a l d i s c h a r g e ) is equal to the profit of the charging station and grid cooperation.
C t o t a l d i s c h a r g e = t = 1 T h = 1 N h i = 1 N C S ( ρ t , h , p u r E V μ c o n v + c d ) × P t , i , h c s × τ i , h × ( 1 + I n f R 1 + I n t R ) t
R t o t a l d i s c h a r g e = t = 1 T h = 1 N h i = 1 N C S ρ t , h × P t , i , h c s × τ i , h × ( 1 + I n f R 1 + I n t R ) t
B t o t a l d i s c h a r g e = R t o t a l d i s c h a r g e C t o t a l d i s c h a r g e
c d is the cost of equipment depreciation due to the use of power injection technology from the vehicle to the network and τ i , h is the efficiency rate of charging station inverters.

6.2. Profits from Recharge Programs

Most electric vehicle drivers go to the charging station for their daily chores and short trips to recharge their batteries. The owners of the charging stations can increase their profit by providing charging services for vehicle drivers. The gain obtained from recharging vehicle batteries is calculated from the following equations. Same as the previous section, Equation (15) represents the profit of the recharge program, while Equations (13) and (14), respectively, show the total cost ( C t o t a l c h a r g e ) and revenue ( R t o t a l c h a r g e ) gained from supplying charging service for whole planning years.
C t o t a l c h a r g e = t = 1 T h = 1 N h i = 1 N C S ( ρ t , h , p u r g r i d μ c o n v + c d ) × P t , i , h c s × τ i , h × ( 1 + I n f R 1 + I n t R ) t
R t o t a l c h a r g e = t = 1 T h = 1 N h i = 1 N C S ρ t , h × P t , i , h c s × τ i , h × ( 1 + I n f R 1 + I n t R ) t
B t o t a l c h a r g e = R t o t a l c h a r g e C t o t a l c h a r g e

6.3. Profits from Reduced Power Purchases from the Upstream Network

Since most of the power of the distribution network is supplied from the upstream network, by infiltrating the charging stations in the distribution system, this amount of power supply by the upper network can be reduced. The charging station reduces the cost of energy purchased, thereby increasing profits for the distribution system manager. The profit from this activity is shown in Equation (18), which equals the difference between cost savings and income, calculated from Equations (16) and (17).
C t o t a l l o a d = h = 1 T i = 1 N h ( ρ t , h , p u g r i d × ρ t , h g r i d + τ t , h g r i d ) × ( 1 + I n f R 1 + I n t R ) t
R t o t a l l o a d = h = 1 T i = 1 N h ( ρ t , h × P D t , h   + τ t , h l o a d ) × ( 1 + I n   f R 1 + I n t R ) t
B t o t a l l o a d = R t o t a l l o a d C t o t a l l o a d
As shown in Equation (19), the grid power, denoted by the uppercase grid, can be divided into three intervals. The first period is the network fertility period and is dl1 (park demand level). Naturally, during this period, the price of electricity is high, and the stations try to charge the batteries before this period arrives. By entering this period, they inject the batteries’ energy into the network. The other interval, dl4 (low load demand l), is the low load interval of the network. This interval is the opposite of the previous interval and the decrease in demand reduces the price of electricity, and this is when station attendants generally charge the batteries. Finally, the intervals indicated by dl2 and dl3 (medium demand level) are placed between the previous two periods in terms of price and demand. The regular activity of stations and networks occurs. Usually, the electricity networks are designed to meet the needs of consumers quickly at these intervals.
P t , h g r i d { P t , h D + P t , h l o s s i = 1 N C S P i , t , h c s d l 1 P t , h D + P t , h l o s s + i = 1 N C S P i , t , h c s d l 2 , d l 3 P t , h D + P t , h l o s s d l 4
One of the essential issues in the design of power plants and power generation centers is the ability of the network to respond to the peak interval. By looking at this subject from the electricity network viewpoint, this section can be justified as follows. Assuming stations are massive batteries, energy is stored in them during low load times. To supply energy during peak hours, instead of increasing the pressure on power plants, batteries meet part of the needs of consumers. By doing this, the network also benefits, which can be calculated using Equation (20). By injecting the energy stored in the electric vehicle battery into the grid, the losses are reduced. The profit from the sale of the stored electricity is increased.
B t o t a l l o s s = i = 1 T h = 1 N h [ ( P l o s s t , h w i t h o u t C S P l o s s t , h w i t h   C S ) × ρ t , h ] × ( 1 + I n f R 1 + I n t R ) t
P l o s s t , h w i t h o u t C S   a n d   P l o s s t , h w i t h   C S at each level of demand are with and without the charging station, respectively.

7. Numerical Simulation of the Proposed Method

Scattered product locating is a large-scale, multi-constrained issue that requires comprehensive search methods to resolve. Therefore, in the case of this type, intelligent techniques are used. Factors such as load uncertainty and electricity prices make this an optimization issue. In this project, locating the units is solved by the Genetic Algorithm, which is a well-known method to solve optimization problems. The random load and the price of electricity are also modeled by the Monte Carlo method. For evaluating the efficiency of the proposed method, planning has been performed on the 9-bus distribution network introduced in the reference. The studied network and its specifications are given in Figure 8 and Table 3. The test network has a reference bus with a voltage of 20 kV and eight load buses, where switches separate the distribution lines.
All loads are selected as candidate bases for the installation of scattered production units. It should be noted that the time of entry and exit of vehicles to the charging station is randomly generated according to the distribution function according to the load curve. In Figure 6, the curve of the EV charging and discharging programs is presented.
The results are stated in Table 4, Table 5 and Table 6 according to the parameters defined in the article. Each table is provided with a specific number of electric vehicle parking spaces. Figure 9 also shows the change in the total cost of the optimization function at the time of optimization execution, which reaches its optimal value after a few periods. According to the mentioned tables, implementing load management programs reduces the cost of purchasing energy from the overhead network and reduces the overall costs of the network. The execution of load programs also reduces losses during peak hours. To compare the different scenarios in Table 4, Table 5 and Table 6, the effect of the vehicle load management programs and increasing the number of electric vehicles parking on different network costs is presented. Clearly, the increase in parking lots for electric vehicles will decrease the losses and the cost of purchasing from the overhead network. Still, in the case of the cost related to the construction of the parking lot, the total profit will fall. Additionally, by carefully looking at the tables, implementing cargo management programs makes electric vehicle parking and scattered production resources more economical.
The location of the charging station is well represented in Table 4, Table 5 and Table 6 in the second rows according to the different DR scenarios, including maximum load supply profit, charge program benefit, profit from purchasing energy from the overhead network, profit from loss reduction, investment cost and finally total profit, shown in the section ‘Numerical Simulation of the Proposed Method’. In addition to the positive effect of the proposed method on the cost of operation and the peak load, this method has a significant impact on improving the voltage profile and noise reduction. The proposed method can also solve the problems caused by load growth in the long run. Figure 10, presented the rate of active losses of the studied network in different scenarios.
Figure 11 and Figure 12 show the effect of the proposed method in reducing network losses with annual load growth for different years. It can be seen that the combined use of load management programs and parking locations together has significantly diminished both the maximum losses and the total energy wasted in the network.
Additionally, the proposed method can decrease the network peak and modify the network load curve in the first year and subsequent years and control the load growth well. According to Figure 12, it can be seen that the proposed method has reduced the network peak in the best possible way among the scenarios (Figure 13). Results are obtained for the two solar parking lots that had the best costs. The results show that with the increase in load in all cases, the network losses increase with a sharp slope, but solar parking can significantly inhibit load growth. Moreover, the proposed method utilization in the first year reduces about 13% of the peak load. About 4% of it is for the share of the load management program, and 9% is related to the share of charge/discharge control programs for electric vehicles. Additionally, the proposed method can increase the load more effectively during non-peak hours and improve the load factor.
To better understand the effect of the proposed method on load growth, Figure 13 and Figure 14 of the standard year and tenth year voltage curves are shown by considering the load growth in different scenarios. As shown, load management and locating the electric vehicle parking with the help of distributed generation sources have caused the voltage to remain within the allowable range even after ten years of load growth.
It is clearly shown in Figure 13 and Figure 14 that regardless of the number of parking spaces of electric vehicles in all modes of the network, after a specific load growth, it will have a non-standard voltage curve in some buses. The existence of electric vehicles and the growth of other loads lead to improper operation. It is clear from these problems that using only load management programs cannot solve voltage drop and only delays it. In these figures, the bus voltage reached the unauthorized range in the last year. If electric vehicle charge and discharge control programs are used singly, it is observed that the voltage will remain within the allowable range, while the use of electric vehicle management programs and load management better prevents voltage drops due to load growth. Therefore, it can be concluded that cargo management programs, regardless of the number of parking spaces of electric vehicles, have the most excellent effect on improving the network voltage in different years.

8. Conclusions

This paper presents a long-term simultaneous planning period of electric vehicle solar charging stations in terms of load response and technical and economic indicators in the 10-year planning horizon based on a multi-objective genetic algorithm. In addition, several different scenarios of the implementation of load management programs in the long-term horizon studied to reduce the cost of purchasing energy from the upstream network are presented, which reduced the total cost of the network. The implementation of load management programs has also reduced losses during peak network hours. To compare different scenarios, the effect of power management programs and also increasing the number of electric vehicle parking spaces on different network costs have been presented. It is observed that with the increase in the number of EV parking lots, losses and the cost of purchasing from the overhead network will decrease, but instead, the cost of constructing solar panels in the parking lot will reduce the total profit, which can be compensated in the long run. It was also clearly demonstrated from the numerical results that implementing the proposed load management programs makes the operation of PVCSs much more economical and reduces the adverse effects of charging EVs in the system.

9. Offers

For investors and future work, solar trees in real-time planning for the development of production and intelligent electrical systems and their integration with solar charging stations can be suggested.

Author Contributions

Conceptualization, S.P.; methodology, M.Z. and M.A.N.; validation, M.A.N. and M.Z.; formal analysis, S.P.; data curation, M.A.N.; writing—original draft preparation, M.Z.; writing—review and editing, B.K. and S.P.; supervision, S.P.; project administration, M.A.N. and M.Z. All authors have read and agreed to the published version of the manuscript.

Funding

This research received no external funding.

Conflicts of Interest

The authors declare no conflict of interest.

Appendix A

The explanation of parameters and indices associated with equations:
Table A1. The explanation of parameters associated with equations.
ParameterCorresponding Description
D L F i , t , h e Demand level factor (in Monte Carlo experiment, in bus i, year t, demand level h)
P L F t , h e
DNO
DGOs
Price level factor in year t, demand level h, and Monte Carlo experiment e
Distribution network operators
Distribution generation owners
μ i , t , h D The forecasted mean value of demand level factor (in bus i, year t, demand level h)
λ i , t , h D , e Random demand (in Monte Carlo experiment, in bus i, year t, demand level h)
σ i , t , h D Standard deviations of demand level factors (in bus i, year t, demand level h)
P i , t , h e Base active power demand (in Monte Carlo experiment, in bus i, year t, demand level h)
P i , b a s e Base active power (in bus i)
Q i , t , h e Base reactive power demand (in Monte Carlo experiment, in bus i, first year, demand level h)
Q i , b a s e Base reactive power (in bus i)
S i , t , h e Base apparent power (in Monte Carlo experiment, in bus i, first year, demand level h)
S i , b a s e Base apparent power (in bus i)
ρ t , h The base price of power purchased from the grid (year t, demand level h)
μ i , t , h ρ The forecasted mean value of price level factor (in bus i, year t, demand level h)
λ i , t , h ρ , e Random demand (in Monte Carlo experiment, in bus i, year t, demand level h)
σ i , t , h ρ Standard deviations of demand level factors (in bus i, year t, demand level h)
SOCAmount of charge of vehicle batteries
P v Power of charging the batteries
E s Battery capacity
t c h a r g e Required time to charging in hours
t d i s c h a r g e Required time to discharge in hours
C t o t a l d i s c h a r g e The cost of discharge service
R t o t a l d i s c h a r g e Total gained revenge from discharging vehicle battery
B t o t a l d i s c h a r g e Total profit from discharging vehicle battery
C t o t a l c h a r g e The cost of charge service
R t o t a l c h a r g e Total gained revenge from charging vehicle battery
B t o t a l c h a r g e Total profit from charging vehicle battery
P t , h D Demand power (year t, demand level h)
P t , h l o s s Power loss (year t, demand level h)
P i , t , h c s Transmitted power of charging station (in bus i, year t, demand level h)
I n f R Inflation rate (percent)
I n t R Interest rate (percent)
Table A2. The explanation of indices associated with equations.
IndicesCorresponding Description
i Base i
t Year
h Demand level
ρ Power price
D Demand
e Monte Carlo experiment

References

  1. Miller, I.; Arbabzadeh, M.; Gençer, E. Hourly Power Grid Variations, Electric Vehicle Charging Patterns, and Operating Emissions. Environ. Sci. Technol. 2020, 54, 16071–16085. [Google Scholar] [CrossRef]
  2. Wang, B.; Zhao, D.; Dehghanian, P.; Tian, Y.; Hong, T. Aggregated Electric Vehicle Load Modeling in Large-Scale Electric Power Systems. IEEE Trans. Ind. Appl. 2020, 56, 5796–5810. [Google Scholar] [CrossRef]
  3. Li, M.-W.; Wang, Y.-T.; Geng, J.; Hong, W.-C. Chaos cloud quantum bat hybrid optimization algorithm. Nonlinear Dyn. 2021, 103, 1167–1193. [Google Scholar] [CrossRef]
  4. Zhang, Z.; Hong, W.-C. Application of variational mode decomposition and chaotic grey wolf optimizer with support vector regression for forecasting electric loads. Knowl. Based Syst. 2021, 228, 107297. [Google Scholar] [CrossRef]
  5. Sanjeevikumar, P.; Zand, M.; Nasab, M.A.; Hanif, M.A.; Bhaskar, M.S. Using the Social Spider Optimization Algorithm to Determine UPFC Optimal Size and Location for Improve Dynamic Stability. In Proceedings of the ECCE-Asia, Singapore, 24–27 May 2021. [Google Scholar]
  6. Zand, M.; Nasab, M.A.; Hatami, A.; Kargar, M.; Chamorro, H.R. Using Adaptive Fuzzy Logic for Intelligent Energy Management in Hybrid Vehicles. In Proceedings of the 28th Iranian Conference on Electrical Engineering (ICEE), Tabriz, Iran, 4–6 August 2020; pp. 1–7. [Google Scholar]
  7. Nasri, S.; Nowdeh, S.A.; Davoudkhani, I.F.; Moghaddam, M.J.H.; Kalam, A.; Shahrokhi, S.; Zand, M. Maximum Power Point Tracking of Photovoltaic Renewable Energy System Using a New Method Based on Turbulent Flow of Water-Based Optimization (TFWO) Under Partial Shading Conditions. In Energy Systems in Electrical Engineering; Springer: Cham, Switzerland, 2021; pp. 285–310. ISBN 9789813364561. [Google Scholar]
  8. Tightiz, L.; Nasab, M.A.; Yang, H.; Addeh, A. An intelligent system based on optimized ANFIS and association rules for power transformer fault diagnosis. ISA Trans. 2020, 103, 63–74. [Google Scholar] [CrossRef] [PubMed]
  9. Ghasemi, M.; Akbari, E.; Zand, M.; Hadipour, M.; Ghavidel, S.; Li, L. An Efficient Modified HPSO-TVAC-Based Dynamic Economic Dispatch of Generating Units. Electr. Power Compon. Syst. 2019, 47, 1826–1840. [Google Scholar] [CrossRef]
  10. Nasab, M.A.; Zand, M.; Eskandari, M.; Sanjeevikumar, P.; Siano, P. Optimal Planning of Electrical Appliance of Residential Units in a Smart Home Network Using Cloud Services. Smart Cities 2021, 4, 1173–1195. [Google Scholar] [CrossRef]
  11. Zand, M.; Nasab, M.A.; Sanjeevikumar, P.; Maroti, P.K.; Holm-Nielsen, J.B. Energy management strategy for solid-state transformer-based solar charging station for electric vehicles in smart grids. IET Renew. Power Gener. 2020, 14, 3843–3852. [Google Scholar] [CrossRef]
  12. Ngo, H.; Kumar, A.; Mishra, S. Optimal positioning of dynamic wireless charging infrastructure in a road network for battery electric vehicles. Transp. Res. Part D Transp. Environ. 2020, 85, 102385. [Google Scholar] [CrossRef]
  13. AlHajri, I.; Ahmadian, A.; Elkamel, A. Stochastic day-ahead unit commitment scheduling of integrated electricity and gas networks with hydrogen energy storage (HES), plug-in electric vehicles (PEVs) and renewable energies. Sustain. Cities Soc. 2021, 67, 102736. [Google Scholar] [CrossRef]
  14. Zhanhong, W.; Mingbiao, Z.; Zhenheng, L.; Xuejun, C.; Yonghua, H. Improved Genetic Algorithm and XGBoost Classifier for Power Transformer Fault Diagnosis. Front. Energy Res. 2021, 9, 1–10. [Google Scholar] [CrossRef]
  15. Wang, N.; Tang, L.; Pan, H. A global comparison and assessment of incentive policy on electric vehicle promotion. Sustain. Cities Soc. 2019, 44, 597–603. [Google Scholar] [CrossRef]
  16. Olatunde, O.; Hassan, M.Y.; Abdullah, P.; Rahman, H.A. Hybrid photovoltaic/small-hydropower microgrid in smart distribution network with grid isolated electric vehicle charging system. J. Energy Storage 2020, 31, 101673. [Google Scholar] [CrossRef]
  17. Zand, M.; Neghabi, O.; Nasab, M.A.; Eskandari, M.; Abedini, M. A Hybrid Scheme for Fault Locating in Transmission Lines Compensated by the Thyristor-Controlled Series Capacitors. In Proceedings of the 15th International Conference on Protection and Automation of Power Systems (IPAPS), Shiraz, Iran, 30–31 December 2020. [Google Scholar]
  18. Orsi, F. On the sustainability of electric vehicles: What about their impacts on land use? Sustain. Cities Soc. 2021, 66, 102680. [Google Scholar] [CrossRef]
  19. Zou, Y.; Zhao, J.; Ding, D.; Miao, F.; Sobhani, B. Solving dynamic economic and emission dispatch in power system integrated electric vehicle and wind turbine using multi-objective virus colony search algorithm. Sustain. Cities Soc. 2021, 67, 102722. [Google Scholar] [CrossRef]
  20. Li, H.; Rezvani, A.; Hu, J.; Ohshima, K. Optimal day-ahead scheduling of microgrid with hybrid electric vehicles using MSFLA algorithm considering control strategies. Sustain. Cities Soc. 2021, 66, 102681. [Google Scholar] [CrossRef]
  21. Zhang, Y.; Liu, X.; Zhang, T.; Gu, Z. Review of the electric vehicle charging station location problem. Commun. Comput. Inf. Sci. 2019, 1123, 435–445. [Google Scholar] [CrossRef]
  22. Behera, S.; Behera, S.; Barisal, A.K. Dynamic Combined Economic Emission Dispatch integrating Plug-in Electric Vehicles and Renewable Energy Sources. Int. J. Ambient Energy 2021. Accepted for publication. [Google Scholar] [CrossRef]
  23. Muratori, M.; Elgqvist, E.; Cutler, D.; Eichman, J.; Salisbury, S.; Fuller, Z.; Smart, J. Technology solutions to mitigate electricity cost for electric vehicle DC fast charging. Appl. Energy 2019, 242, 415–423. [Google Scholar] [CrossRef]
  24. Azimi, Z.; Hooshmand, R.-A.; Soleymani, S. Energy management considering simultaneous presence of demand responses and electric vehicles in smart industrial grids. Sustain. Energy Technol. Assess. 2021, 45, 101127. [Google Scholar] [CrossRef]
  25. Khan, Z.; Iyer, G.; Patel, P.; Kim, S.; Hejazi, M.; Burleyson, C.; Wise, M. Impacts of long-term temperature change and variability on electricity investments. Nat. Commun. 2021, 12, 1–12. [Google Scholar] [CrossRef]
  26. Wang, L.; Nian, V.; Li, H.; Yuan, J. Impacts of electric vehicle deployment on the electricity sector in a highly urbanised environment. J. Clean. Prod. 2021, 295, 126386. [Google Scholar] [CrossRef]
  27. Heinisch, V.; Göransson, L.; Erlandsson, R.; Hodel, H.; Johnsson, F.; Odenberger, M. Smart electric vehicle charging strategies for sectoral coupling in a city energy system. Appl. Energy 2021, 288, 116640. [Google Scholar] [CrossRef]
  28. Farias, H.O.; Rangel, C.S.; Stringini, L.W.; Canha, L.N.; Bertineti, D.P.; Brignol, W.D.S.; Nadal, Z.I. Combined Framework with Heuristic Programming and Rule-Based Strategies for Scheduling and Real Time Operation in Electric Vehicle Charging Stations. Energies 2021, 14, 1370. [Google Scholar] [CrossRef]
  29. Mehrjerdi, H. Resilience-robustness improvement by adaptable operating pattern for electric vehicles in complementary solar-vehicle management. J. Energy Storage 2021, 37, 102454. [Google Scholar] [CrossRef]
  30. Migliavacca, G.; Rossi, M.; Siface, D.; Marzoli, M.; Ergun, H.; Rodríguez-Sánchez, R.; Hanot, M.; Leclerq, G.; Amaro, N.; Egorov, A.; et al. The Innovative FlexPlan Grid-Planning Methodology: How Storage and Flexible Resources Could Help in De-Bottlenecking the European System. Energies 2021, 14, 1194. [Google Scholar] [CrossRef]
  31. Zeng, B.; Liu, Y.; Xu, F.; Liu, Y.; Sun, X.; Ye, X. Optimal demand response resource exploitation for efficient accommodation of renewable energy sources in multi-energy systems considering correlated uncertainties. J. Clean. Prod. 2021, 288, 125666. [Google Scholar] [CrossRef]
  32. Nezamabad, H.A.; Zand, M.; Alizadeh, A.; Vosoogh, M.; Nojavan, S. Multi-objective optimization based robust scheduling of electric vehicles aggregator. Sustain. Cities Soc. 2019, 47, 101494. [Google Scholar] [CrossRef]
  33. Hamwi, M.; Lizarralde, I.; Legardeur, J. Demand response business model canvas: A tool for flexibility creation in the electricity markets. J. Clean. Prod. 2021, 282, 124539. [Google Scholar] [CrossRef]
  34. Mowry, A.M.; Mallapragada, D.S. Grid impacts of highway electric vehicle charging and role for mitigation via energy storage. Energy Policy 2021, 157, 112508. [Google Scholar] [CrossRef]
  35. Xiang, Y.; Cai, H.; Liu, J.; Zhang, X. Techno-economic design of energy systems for airport electrification: A hydrogen-solar-storage integrated microgrid solution. Appl. Energy 2021, 283, 116374. [Google Scholar] [CrossRef]
  36. Zand, M.; Nasab, M.A.; Khoobani, M.; Jahangiri, A.; Hosseinian, S.H.; Kimiai, A.H. Robust Speed Control for Induction Motor Drives Using STSM Control. In Proceedings of the 12th Power Electronics, Drive Systems, and Technologies Conference (PEDSTC), Tabriz, Iran, 2–4 February 2021. [Google Scholar]
  37. Huang, P.; Sun, Y.; Lovati, M.; Zhang, X. Solar-photovoltaic-power-sharing-based design optimization of distributed energy storage systems for performance improvements. Energy 2021, 222, 119931. [Google Scholar] [CrossRef]
  38. Kühnbach, M.; Bekk, A.; Weidlich, A. Prepared for regional self-supply? On the regional fit of electricity demand and supply in Germany. Energy Strat. Rev. 2021, 34, 100609. [Google Scholar] [CrossRef]
  39. Chondrogiannis, S.; Poncela-Blanco, M.; Marinopoulos, A.; Marneris, I.; Ntomaris, A.; Biskas, P.; Bakirtzis, A. Power system flexibility: A methodological analytical framework based on unit commitment and economic dispatch modelling. In Mathematical Modelling of Contemporary Electricity Markets; Academic Press: Cambridge, MA, USA, 2021; pp. 127–156. [Google Scholar]
  40. Basu, M. Heat and power generation augmentation planning of isolated microgrid. Energy 2021, 223, 120062. [Google Scholar] [CrossRef]
  41. Alismail, F.; Abdulgalil, M.; Khalid, M. Optimal Coordinated Planning of Energy Storage and Tie-Lines to Boost Flexibility with High Wind Power Integration. Sustainability 2021, 13, 2526. [Google Scholar] [CrossRef]
  42. Parsa, N.; Bahmani-Firouzi, B.; Niknam, T. A social-economic-technical framework for reinforcing the automated distribution systems considering optimal switching and plug-in hybrid electric vehicles. Energy 2021, 220, 119703. [Google Scholar] [CrossRef]
  43. Lugovoy, O.; Gao, S.; Gao, J.; Jiang, K. Feasibility study of China’s electric power sector transition to zero emissions by 2050. Energy Econ. 2021, 96, 105176. [Google Scholar] [CrossRef]
  44. Alshaalan, A. Basic Concepts of Electric Power System Planning. In Advances in Business Information Systems and Analytics; IGI Global: Hershey, PA, USA, 2021; pp. 306–325. [Google Scholar]
  45. Zand, M.; Nasab, M.A.; Neghabi, O.; Khalili, M.; Goli, A. Fault locating transmission lines with thyristor-controlled series capacitors By fuzzy logic method. In Proceedings of the 14th International Conference on Protection and Automation of Power Systems (IPAPS), Tehran, Iran, 31 December 2019–1 January 2020; pp. 62–70. [Google Scholar] [CrossRef]
  46. Zand, Z.; Hayati, M.; Karimi, G. Short-Channel Effects Improvement of Carbon Nanotube Field Effect Transistors. In Proceedings of the 28th Iranian Conference on Electrical Engineering (ICEE), Tabriz, Iran, 4–6 August 2020; pp. 1–6. [Google Scholar] [CrossRef]
  47. Canale, L.; Di Fazio, A.; Russo, M.; Frattolillo, A.; Dell’Isola, M. An Overview on Functional Integration of Hybrid Renewable Energy Systems in Multi-Energy Buildings. Energies 2021, 14, 1078. [Google Scholar] [CrossRef]
Figure 1. Flowchart of the steps of Proposed Method.
Wevj 12 00190 g001
Figure 2. Flowchart of multi-objective genetic algorithm.
Wevj 12 00190 g002
Figure 3. NSGA-II procedure. (A) Convergence of the proposed algorithm; (B) Step of algorithm.
Wevj 12 00190 g003aWevj 12 00190 g003b
Figure 4. Number of initial population versus time of program implementation.
Wevj 12 00190 g004
Figure 5. Default load demand curve.
Wevj 12 00190 g005
Figure 6. Default electricity price level curve.
Wevj 12 00190 g006
Figure 7. Charging station input/output power modeling.
Wevj 12 00190 g007
Figure 8. Charging/discharging programs of vehicles in the studied system.
Wevj 12 00190 g008
Figure 9. Cost function changes for parking location in different optimization periods.
Wevj 12 00190 g009
Figure 10. Rate of active losses of the studied network in different scenarios.
Wevj 12 00190 g010
Figure 11. The amount of energy lost by the studied network in different scenarios.
Wevj 12 00190 g011
Figure 12. Load curve of the studied network in different scenarios and application of 10-year load growth.
Wevj 12 00190 g012
Figure 13. Voltage curve of the studied network in different scenarios and 10-year load growth application considering two parking spaces of electric vehicles.
Wevj 12 00190 g013
Figure 14. Voltage curve of the studied network in different scenarios and 10-year load growth application considering three electric vehicle parking lots.
Wevj 12 00190 g014
Table 1. The main parameters of the proposed method and program execution time for the studied systems.
ParametersIntended Value
Number of population150
Maximum repetition100
Solving time (seconds)159.7
Mutation rates0.02
Crossover rate0.03
Marriage rate0.10
Table 2. Chromosome representation in the algorithm used.
ChromosomesRepresentation
Chromosome 111011|00100110110
Chromosome 211011|11000011110
Offspring 111011|11000011110
Offspring 211011|00100110110
Table 3. Initial charge amount of vehicle charging station batteries.
The Initial ChargeSOC1SOC2SOC3
Number of vehiclesn1n2n3
Table 4. Simulation results for the location of an electric vehicle park.
Load InformationWithout DRPWith DRP
Maximum load supply profit (USD)--
Charge program benefit (USD)--
Profit from purchasing energy from the overhead network (USD) 2.9742   × 107 2.9911   × 107
Profit from loss reduction (USD)- 7.9246   × 107
Investment cost (USD)--
Total profit (USD) 2.9742   × 107 3.0703   × 107
Table 5. Simulation results for the location of two electric vehicle parking lots.
Load InformationWithout DRPWith DRP
Bass number
Optimal capacity of the power plant (kW)
8
741
9
895
8
649
9
784
Maximum load supply profit (USD) 2.0357   × 106 1.7831   × 106
Charge program benefit (USD) 0.8086   × 105 0.7083   × 105
Profit from purchasing energy from the overhead network (USD) 3.8281   × 107 3.7343   × 107
Profit from loss reduction (USD) 7.5998   × 105 1.4047   × 106
Investment cost (USD) 1.1092   × 107 0.9715   × 107
Total profit (USD) 3.0070   × 107 3.0890   × 107
Table 6. Simulation results for the location of three electric vehicle parking lots.
Load InformationWithout DRPWith DRP
Bass number
Optimal capacity of the power plant (kW)
6
547
8
791
9
895
6
463
8
580
9
654
Maximum load supply profit (USD) 2.7785   × 106 2.1116   × 106
Charge program benefit (USD) 1.1038   × 105 0.8388   × 105
Profit from purchasing energy from the overhead network (USD) 4.1348   × 107 3.8693   × 107
Profit from loss reduction (USD) 9.8129   × 105 1.4950   × 106
Investment cost (USD) 1.5139   × 107 1.1505   × 107
Total profit (USD) 3.0085   × 107 3.0883   × 107
Publisher’s Note: MDPI stays neutral with regard to jurisdictional claims in published maps and institutional affiliations.

