Published online Apr 7, 2005. doi: 10.3748/wjg.v11.i13.1995
Revised: September 11, 2004
Accepted: October 6, 2004
Published online: April 7, 2005
AIM: To determine fibrosis progression and hepatocellular carcinoma (HCC), using simultaneous gene expression analysis.
METHODS: Total RNA samples were extracted from liver biopsies from 19 patients with hepatitis C virus (HCV) infection and 3 patients without HCV infection. Among the 19 HCV-infected patients, 7 and 12 patients had grade F1-2 and F3-4 fibrosis, respectively. Of the 12 patients with F3-4 fibrosis, 8 had HCC. Gene expression in the liver samples was determined using an oligonucleotide microarray. The following comparisons were performed: normal livers vs HCV-infected livers; F1-2 vs F3-4; and F3-4 with HCC vs F3-4 without HCC. Genes that were differentially expressed between these groups were identified based on signal-to-noise ratios.
RESULTS: In the HCV-infected livers, genes involved in immune responses were highly expressed. Expression levels of genes for plasma proteins and drug-metabolizing enzymes were decreased and those of genes involved in the cell cycle and oncogenesis were increased in the F3-4 cases as compared to the F1-2 cases. Among the F3-4 cases, genes involved in carbohydrate metabolism tended to be more highly expressed in patients with HCC than in patients without HCC.
CONCLUSION: We identified genes that are associated with fibrosis progression and hepatocarcinogenesis. This information may be used to detect increased carcinogenic potential in the livers of patients with HCV infection.
- Citation: Shao RX, Hoshida Y, Otsuka M, Kato N, Tateishi R, Teratani T, Shiina S, Taniguchi H, Moriyama M, Kawabe T, Omata M. Hepatic gene expression profiles associated with fibrosis progression and hepatocarcinogenesis in hepatitis C patients. World J Gastroenterol 2005; 11(13): 1995-1999
- URL: https://www.wjgnet.com/1007-9327/full/v11/i13/1995.htm
- DOI: https://dx.doi.org/10.3748/wjg.v11.i13.1995
Hepatitis C virus (HCV) infection causes chronic hepatitis, which can lead to life-threatening sequelae, cirrhosis and hepatocellular carcinoma (HCC)[1]. The progression of chronic hepatitis C infection involves various cellular and molecular mechanisms, including cellular infiltration, remodeling, apoptosis and the interferon system[2]. Alterations in the expression of genes associated with immune responses to HCV have been reported in studies using peripheral blood mononuclear cells derived from patients with fulminant hepatitis or with hepatitis C treated with interferon[3]. The gene expression patterns, associated with adenomatous hyperplasia in hepatocarcinogenesis, have also been reported[4]. In addition, candidate markers for HCC, which include the overexpression of VANGL1 and the genes for glypican 3 and serine threonine kinase 15, have been reported[5-7]. These genomic approaches to identify the molecular mechanisms of HCV-related liver diseases have contributed to improvements in disease diagnosis and treatment.
In this study, we used simultaneous gene expression analysis to elucidate genes with altered expression in the livers of patients with chronic HCV infection, with particular emphasis on genes related to fibrosis progression and HCC.
We evaluated 19 patients (mean age, 57 years; range, 23-74 years; 9 males, 10 females) with chronic HCV infection who were admitted to the University of Tokyo Hospital for treatment of chronic hepatitis or HCC. All of the patients were positive for anti-HCV antibody, as assessed by the second-generation enzyme immunoassay (Ortho Diagnostics, Tokyo, Japan), and/or for HCV-RNA, as detected using the Amplicor HCV assay, version 1 (Roche, Tokyo, Japan). All of the patients were negative for hepatitis B surface antigen (Abbott Laboratories, North Chicago, IL). No individual had an ethanol intake of ≥80 g/d for more than 10 years, i.e., none of the patients had a history of alcohol abuse. As controls, we included 3 patients (mean age, 77 years; range, 69-85 years; 1 male, 2 females) with metastatic liver tumors but without HCV-associated chronic liver disease. Fine-needle liver biopsy specimens were obtained from all the patients and fibrotic staging was determined by liver histology according to the internationally recognized scale[8]: F0, no fibrosis; F1, mild fibrosis; F2, moderate fibrosis; F3, severe fibrosis; and F4, cirrhosis. Diagnosis of HCC was made by several imaging modalities and confirmed histologically from sonography-guided fine-needle biopsy specimens. The staging of HCC was based on the Japanese classification system[9]. The following clinical parameters of the patients were recorded at the time of blood sampling: age, gender, levels of serum albumin, total bilirubin, alanine aminotransferase (ALT), gamma-glutamyl-transpeptidase (GGT) and prothrombin time. In the initial screening examination, the patients showed no signs of any other disease that might cause liver fibrosis. Written informed consent was obtained from each patient according to the Helsinki Declaration. We also obtained approval for this study from the institutional ethics committee.
Gene expression was determined using an oligonucleotide microarray of 3800 genes (Atlas array; Clontech, Palo Alto, CA). Total RNA samples were extracted from biopsy specimens of the non-tumorous or non-cirrhotic ‘background’ liver tissues using the ISOGEN RNA Extraction Kit (Nippon-Gene, Tokyo, Japan), according to the manufacturer’s instructions. The quality of the total RNA was assessed from the ratio between the 28S and 18S ribosomal RNAs after agarose gel electrophoresis.
To validate our microarray results, we carried out semi-quantitative RT-PCR for the cytochrome P450 (CYP) 2C8 gene (CYP2C8) using SuperScript One-Step RT-PCR with Platinum Taq (Invitrogen, Carlsbad, CA), according to the manufacturer’s instructions. The following primers were used: for CYP2C8, 5’-TCCCTGTCTGAAGAATGCT-3’ (sense) and 5’-GCAGTGACCTGAACAACTCTC-3’ (antisense); and for GAPDH, 5’-ACCACAGTCCATGCCATCAC-3’ (sense) and 5’-TCCACCACCCTGTTGCTGTA-3’ (antisense). The number of PCR cycles was optimized for each gene to ensure product intensity within the linear phase of amplification. The PCR products were separated by electrophoresis on 1.5% agarose gels and visualized under UV light after ethidium bromide staining. We determined the mean band densities using a Scion Image beta 4.02 (Scion Corp., MA, USA) imaging analysis system and calculated the levels of CYP2C8 expression relative to those of the GAPDH gene for each sample. The Pearson correlation coefficient was calculated to examine the relationship between the gene expression levels obtained from the microarray analyses and those assessed by RT-PCR.
To evaluate significance in the analysis of the clinical parameters, one-way ANOVA and Kruskal-Wallis tests were applied for the continuous variables and Fisher’s exact test was used for the categorical data. Two-tailed P-values were calculated.
Each of the microarray measurements was normalized globally, and a variation filter (max-min >100 units; max/min >3) was applied. Genes that were expressed differentially between the groups were selected using the signal-to-noise ratios (group 1 mean-group 2 mean)/(group 1 SD+group 2 SD). We used a significance level of P<0.05 in the random permutation test.
Among the HCV-infected patients, 7 cases had grade F1 or F2 (F1-2) fibrosis and 12 cases had grade F3 or F4 (F3-4) fibrosis. Among the patients with F3-4 fibrosis, 8 had HCC (Table 1). With regard to patients with HCC, 3, 2 and 3 cases were stage I, II and III, respectively. In the older patients, relatively advanced liver disease, i.e., the presence of fibrosis and HCC, was observed (P = 0.01). The serum albumin levels (P = 0.023) and prothrombin times (P = 0.045) were significantly decreased in patients with advanced liver disease. There were no significant differences in the levels of serum bilirubin and ALT among the patients with HCV infection as compared with the subjects without HCV infection.
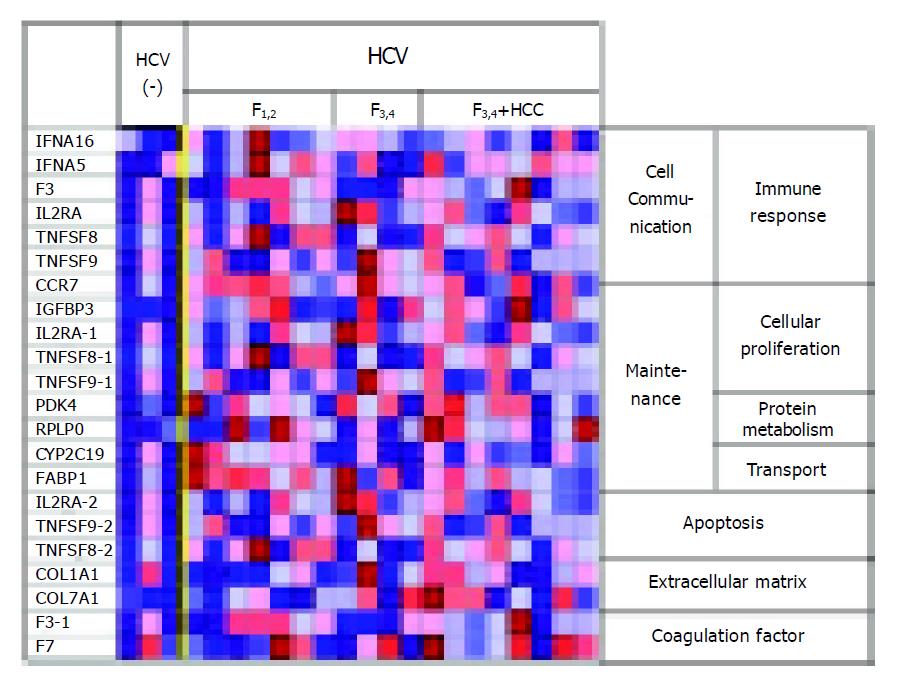
A number of genes involved in immune responses (IFNA16, IFNA5, F3, IL2RA, TNFSF8, TNFSF9 and CCR7; e.g., the interferon, interleukin, tumor necrosis factor superfamilies and chemokine receptor-related genes) were highly expressed in the livers of patients with HCV infection as compared to the levels in the livers of patients without HCV infection (Figure 1). These findings suggest the induction of changes in gene expression by HCV infection.
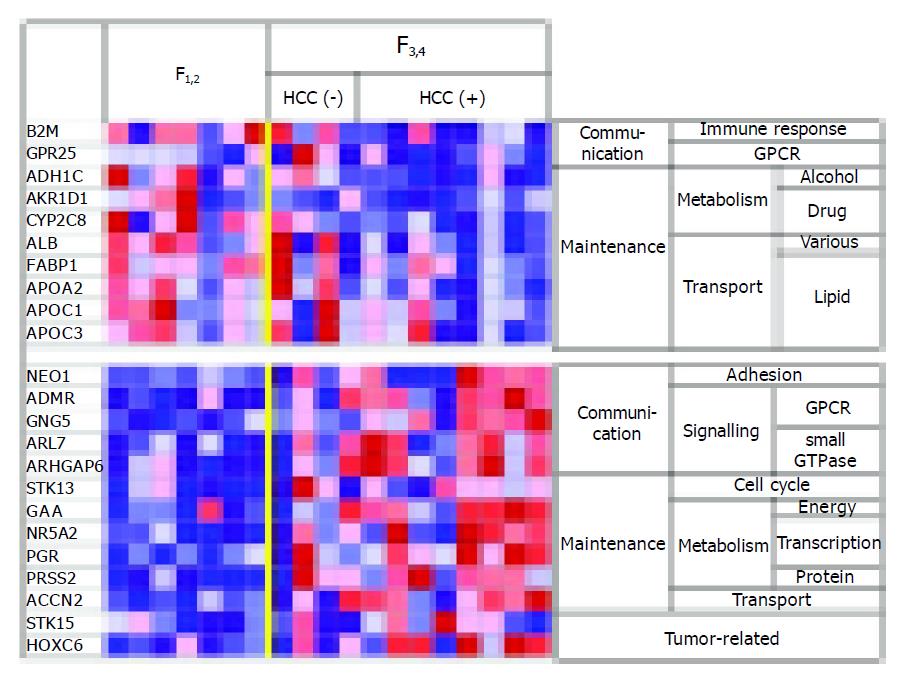
In the HCV-infected livers with grade F3-4 fibrosis, the expression levels of genes that encode plasma proteins (e.g., albumin and apolipoprotein) and drug-metabolizing enzymes (e.g., the aldo-ketoreductase and cytochrome P450 families) were decreased in comparison with the levels in livers with grade F1-2 fibrosis, which suggests a correlation between impaired liver function and the progression of liver fibrosis (Figure 2). On the other hand, genes involved in the cell cycle and oncogenesis (e.g., serine/threonine kinases) were highly expressed in the livers of patients with F3-4 fibrosis as compared to the levels in livers of patients with F1-2 fibrosis. These findings indicate the hypercarcinogenic state of livers with advanced fibrosis.
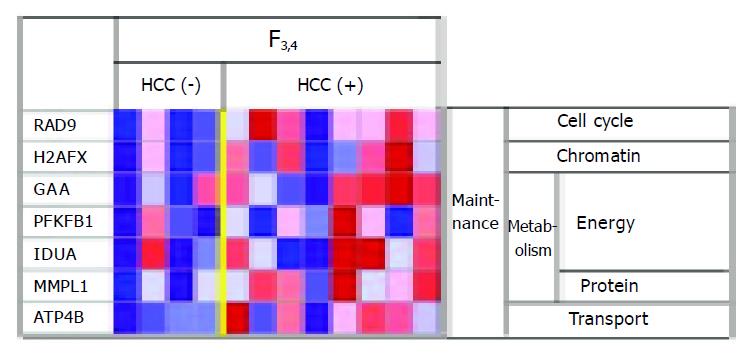
Among the F3-4 patients, genes involved in carbohydrate metabolism (e.g., glucosidase) tended to be more highly expressed in cases with HCC than in cases without HCC, suggesting that livers with HCC are in a hypermetabolic state (Figure 3).
The semi-quantitative RT-PCR data for CYP2C8 showed a tendency to correlate with the microarray data, with a Pearson correlation coefficient (P-value) of 0.775 (P = 0.123).
Liver fibrosis in chronic HCV infection progresses in a stepwise manner from hepatitis to cirrhosis[10,11]. In this study, we evaluated the sequential alterations in hepatic gene expression relative to the progression of liver disease in patients with chronic HCV infection. Through these analyses, we identified genes that are potentially associated with fibrosis progression and hepatocarcinogenesis. The genes that we selected for further analysis are consistent with the stepwise progression of HCV-related chronic liver disease and may represent biomarkers and/or therapeutic targets for HCV-related liver diseases.
In this study, we used disease status-based comparisons to identify genes that discriminated the clinically important stages of disease such as liver fibrosis and HCC. In the comparisons of cases with and without HCV infection, genes that were associated with inflammation and immune responses were identified, reflecting the direct consequences of active hepatitis caused by chronic HCV infection. Thus, our results are consistent with those reported previously[12].
Many cirrhosis-associated sequelae are related to impaired protein synthesis in the liver; they include abnormalities both in blood coagulation and in the maintenance of colloid osmotic pressure. In our analysis, these changes were paralleled by changes in the gene expression profiles. In addition to protein synthesis-related genes, genes associated with lipid metabolism (APO) and drug-metabolism showed decreased expression in livers with advanced cirrhotic fibrosis (F3-4). In HCV-related HCC, it has been hypothesized that the accumulation of carcinogens in the liver owing to the impaired expression of enzymes involved in drug metabolism is one of the causes of hepatocarcinogenesis[13,14]. Our results are consistent with this hypothesis. It remains possible that our results merely reflect decreased numbers of hepatocytes in each biopsy specimen owing to the increased formation of fibrous septa. However, even a decrease in the bulk expression of these genes owing to accumulation of fibrous septa might cause the aforementioned cirrhosis-associated sequelae.
In the comparison of the livers with F3-4 fibrosis with and without HCC, it was possible to evaluate the HCC-related differences in gene expression, as the amount of fibrous septa contained in the biopsy specimens should be similar in the two groups. Although the differences that we detected in this study were subtle, they suggest that the presence of HCC may be deduced from specimens taken from the non-tumorous ‘ background’ liver tissue. In addition, the changes in gene expression may reflect the hypercarcinogenic state of livers with HCC. Assuming that the existence of HCC changes the gene expression profile of the background liver tissue, this type of analysis may be useful for testing of residual and/or recurrent HCC after radical treatment, such as surgical resection and/or percutaneous ablation.
As the results of fine-needle biopsy-based diagnoses of fibrosis are often ambivalent, we separated the patients into two groups, F1-2 and F3-4, in order to select genes that were associated with the progression of liver fibrosis. However, it was difficult to identify small differences between these two groups owing to inadequate discrimination of cell types as a result of the variability of the cell populations in the biopsy samples. This problem might be overcome by using surgical specimens in further analyses. In addition, it might be possible to calibrate biopsy specimen data using surgical specimen data in future analyses of biopsy specimens in clinical practice. Our study also has the limitation of a small sample size, which should be resolved in future studies. In addition, the size of the microarray used was not sufficient for genome-wide screening. Thus, large-scale analyses should be performed in the future.
In summary, we identified genes associated with fibrosis progression and hepatocarcinogenesis in patients with chronic HCV. Using this information, we hope, in the future, to be able to detect increased carcinogenic potential in the livers of patients with HCV infection.
We thank Mitsuko Tsubouchi for technical assistance, and we are also grateful to many colleagues for the helpful discussions during the course of this work.
Science Editor Li WZ Language Editor Elsevier HK
| 1. | Yoshida H, Shiratori Y, Moriyama M, Arakawa Y, Ide T, Sata M, Inoue O, Yano M, Tanaka M, Fujiyama S. Interferon therapy reduces the risk for hepatocellular carcinoma: national surveillance program of cirrhotic and noncirrhotic patients with chronic hepatitis C in Japan. IHIT Study Group. Inhibition of Hepatocarcinogenesis by Interferon Therapy. Ann Intern Med. 1999;131:174-181. [PubMed] [DOI] [Cited in This Article: ] [Cited by in Crossref: 833] [Cited by in F6Publishing: 857] [Article Influence: 34.3] [Reference Citation Analysis (0)] |
| 2. | Smith MW, Yue ZN, Korth MJ, Do HA, Boix L, Fausto N, Bruix J, Carithers RL, Katze MG. Hepatitis C virus and liver disease: global transcriptional profiling and identification of potential markers. Hepatology. 2003;38:1458-1467. [PubMed] [DOI] [Cited in This Article: ] [Cited by in Crossref: 87] [Cited by in F6Publishing: 85] [Article Influence: 4.0] [Reference Citation Analysis (0)] |
| 3. | Ji X, Cheung R, Cooper S, Li Q, Greenberg HB, He XS. Interferon alfa regulated gene expression in patients initiating interferon treatment for chronic hepatitis C. Hepatology. 2003;37:610-621. [PubMed] [DOI] [Cited in This Article: ] [Cited by in Crossref: 89] [Cited by in F6Publishing: 92] [Article Influence: 4.4] [Reference Citation Analysis (0)] |
| 4. | Anders RA, Yerian LM, Tretiakova M, Davison JM, Quigg RJ, Domer PH, Hoberg J, Hart J. cDNA microarray analysis of macroregenerative and dysplastic nodules in end-stage hepatitis C virus-induced cirrhosis. Am J Pathol. 2003;162:991-1000. [PubMed] [DOI] [Cited in This Article: ] [Cited by in Crossref: 29] [Cited by in F6Publishing: 32] [Article Influence: 1.5] [Reference Citation Analysis (0)] |
| 5. | Sung YK, Hwang SY, Park MK, Farooq M, Han IS, Bae HI, Kim JC, Kim M. Glypican-3 is overexpressed in human hepatocellular carcinoma. Cancer Sci. 2003;94:259-262. [PubMed] [DOI] [Cited in This Article: ] [Cited by in Crossref: 92] [Cited by in F6Publishing: 105] [Article Influence: 5.0] [Reference Citation Analysis (0)] |
| 6. | Yagyu R, Hamamoto R, Furukawa Y, Okabe H, Yamamura T, Nakamura Y. Isolation and characterization of a novel human gene, VANGL1, as a therapeutic target for hepatocellular carcinoma. Int J Oncol. 2002;20:1173-1178. [PubMed] [Cited in This Article: ] |
| 7. | Smith MW, Yue ZN, Geiss GK, Sadovnikova NY, Carter VS, Boix L, Lazaro CA, Rosenberg GB, Bumgarner RE, Fausto N. Identification of novel tumor markers in hepatitis C virus-associated hepatocellular carcinoma. Cancer Res. 2003;63:859-864. [PubMed] [Cited in This Article: ] |
| 8. | Desmet VJ, Gerber M, Hoofnagle JH, Manns M, Scheuer PJ. Classification of chronic hepatitis: diagnosis, grading and staging. Hepatology. 1994;19:1513-1520. [PubMed] [DOI] [Cited in This Article: ] [Cited by in Crossref: 1582] [Cited by in F6Publishing: 1461] [Article Influence: 48.7] [Reference Citation Analysis (0)] |
| 9. | Liver Cancer Study Group of Japan. Classification of primary liver cancer. Kanehara & Co., Ltd., Tokyo 1997. . [Cited in This Article: ] |
| 10. | Shiratori Y, Imazeki F, Moriyama M, Yano M, Arakawa Y, Yokosuka O, Kuroki T, Nishiguchi S, Sata M, Yamada G. Histologic improvement of fibrosis in patients with hepatitis C who have sustained response to interferon therapy. Ann Intern Med. 2000;132:517-524. [PubMed] [DOI] [Cited in This Article: ] [Cited by in Crossref: 547] [Cited by in F6Publishing: 569] [Article Influence: 23.7] [Reference Citation Analysis (0)] |
| 11. | Takano S, Yokosuka O, Imazeki F, Tagawa M, Omata M. Incidence of hepatocellular carcinoma in chronic hepatitis B and C: a prospective study of 251 patients. Hepatology. 1995;21:650-655. [PubMed] [DOI] [Cited in This Article: ] [Cited by in Crossref: 256] [Cited by in F6Publishing: 222] [Article Influence: 7.7] [Reference Citation Analysis (0)] |
| 12. | Honda M, Kaneko S, Kawai H, Shirota Y, Kobayashi K. Differential gene expression between chronic hepatitis B and C hepatic lesion. Gastroenterology. 2001;120:955-966. [PubMed] [DOI] [Cited in This Article: ] [Cited by in Crossref: 132] [Cited by in F6Publishing: 141] [Article Influence: 6.1] [Reference Citation Analysis (0)] |
| 13. | Okabe H, Satoh S, Kato T, Kitahara O, Yanagawa R, Yamaoka Y, Tsunoda T, Furukawa Y, Nakamura Y. Genome-wide analysis of gene expression in human hepatocellular carcinomas using cDNA microarray: identification of genes involved in viral carcinogenesis and tumor progression. Cancer Res. 2001;61:2129-2137. [PubMed] [Cited in This Article: ] |
| 14. | Wang Y, Kato N, Hoshida Y, Otsuka M, Taniguchi H, Moriyama M, Shiina S, Kawabe T, Ito YM, Omata M. UDP-glucuronosyltransferase 1A7 genetic polymorphisms are associated with hepatocellular carcinoma in japanese patients with hepatitis C virus infection. Clin Cancer Res. 2004;10:2441-2446. [PubMed] [DOI] [Cited in This Article: ] [Cited by in Crossref: 53] [Cited by in F6Publishing: 56] [Article Influence: 2.8] [Reference Citation Analysis (0)] |


