Published online Mar 7, 2010. doi: 10.3748/wjg.v16.i9.1129
Revised: December 9, 2009
Accepted: December 16, 2009
Published online: March 7, 2010
AIM: To investigate the diverse characteristics of different pathological gradings of gastric adenocarcinoma (GA) using tumor-related genes.
METHODS: GA tissues in different pathological gradings and normal tissues were subjected to tissue arrays. Expressions of 15 major tumor-related genes were detected by RNA in situ hybridization along with 3’ terminal digoxin-labeled anti-sense single stranded oligonucleotide and locked nucleic acid modifying probe within the tissue array. The data obtained were processed by support vector machines by four different feature selection methods to discover the respective critical gene/gene subsets contributing to the GA activities of different pathological gradings.
RESULTS: In comparison of poorly differentiated GA with normal tissues, tumor-related gene TP53 plays a key role, although other six tumor-related genes could also achieve the Area Under Curve (AUC) of the receiver operating characteristic independently by more than 80%. Comparing the well differentiated GA with normal tissues, we found that 11 tumor-related genes could independently obtain the AUC by more than 80%, but only the gene subsets, TP53, RB and PTEN, play a key role. Only the gene subsets, Bcl10, UVRAG, APC, Beclin1, NM23, PTEN and RB could distinguish between the poorly differentiated and well differentiated GA. None of a single gene could obtain a valid distinction.
CONCLUSION: Different from the traditional point of view, the well differentiated cancer tissues have more alterations of important tumor-related genes than the poorly differentiated cancer tissues.
- Citation: Liu GY, Liu KH, Zhang Y, Wang YZ, Wu XH, Lu YZ, Pan C, Yin P, Liao HF, Su JQ, Ge Q, Luo Q, Xiong B. Alterations of tumor-related genes do not exactly match the histopathological grade in gastric adenocarcinomas. World J Gastroenterol 2010; 16(9): 1129-1137
- URL: https://www.wjgnet.com/1007-9327/full/v16/i9/1129.htm
- DOI: https://dx.doi.org/10.3748/wjg.v16.i9.1129
Malignant tumor is one of the leading causes of death, with a mortality of 12.5%[1]. Stomach adenocarcinoma is one of the major types of gastric cancer which is the second major cause of oncologic death worldwide. Although the incidence and mortality of stomach adenocarcinoma have been obviously declined, it is still one of the most serious health burdens in the world[2-4], and surgical resection remains the only curative treatment to improve the survival of patients with gastric cancer[5,6]. Generally, clinicians consider the degree of malignancy based on the histopathological grade of tumors, and predict the prognosis of patients and estimate the survival rates according to the pertinent criteria and the intraoperative findings[7,8]. Although histological classifications are widely used for gastric adenocarcinoma (GA), their prognostic value is still controversial. The degree of malignancy always implies the early cancer metastasis, invasion and the mortality rates[9-11]. Because the occurrence of cancer is closely related to the tumor-related genes, we explored the diverse characteristics of different pathological gradings of GA by investigating 15 tumor-related genes, which have been currently proved to be closely related to carcinogenesis. They represent different cancer formation mechanisms and have tight connection and mutual regulation[12-15]. Among them, the C-myc[16] is an oncogene, Cyclin D1[17] is a cell cycle protein, BCL10[18] is an anti-apoptotic gene, KAI1 and NM23[19] are metastatic suppressor genes, Beclin1[20] and UVRAG[21] are cellular autophagy genes, TP53[22], RB[23], PTEN[24], Ptch[25], BRCA1, BRCA2[26], FHIT[27] and APC[28] are tumor suppressor genes.
One hundred and twelve primary samples of GA and normal tissues were snap-frozen and stored at -70°C. There were 40 samples from patients (age range: 42-78 years, 22 males and18 females) with poorly differentiated GA, 28 samples from patients with well differentiated GA (age range: 50-81 years, 18 males and 10 females), and 44 samples of normal tissues (age range: 38-72 years, 30 males and 14 females). All the patients were Chinese, who underwent operations at the Affiliated Zhongshan Hospital of Xiamen University between 2000-2006.
Tissue blocks measuring approximately 1.5 cm × 1.5 cm × 0.3 cm and non-pathologic organs were fixed in phosphate-buffered saline (PBS) containing 4% paraformaldehyde (1‰ DEPC, pH 7.4) for 24 h, dehydrated through gradient ethanol, and embedded in paraffin. A hematoxylin and eosin (HE)-stained section was made from each block to define the representative tumor region. Representative areas in different lesions were carefully selected on HE-stained sections and marked on individual paraffin blocks. Tissue cylinders with a diameter of 1 mm were then punched from tumor areas in each “donor” tissue block and put into a recipient paraffin block using a custom-made precision instrument. Five-mm sections of the resulting multiple tumor tissue microarray (TMA) blocks were transferred to glass slides using the paraffin sectioning aid system [adhesive-coated slides (PSA-CS4x), adhesive tape, and UV lamp; Instru-Medics, Inc., Hackensack, NJ], supporting the cohesion of 0.6-mm array elements. The final TMA consisted of cores of 1 mm in diameter each spaced at 0.8 mm between core centers. A section stained with HE was reviewed to confirm the presence of morphologically representative areas in the original lesions.
Antisense probe perfectly matched to corresponding sequence, Lock nucleic acid modified probe increased the stability of the probe and sensitivity. The type of tumor-related gene and probe sequence are shown in Table 1. All probes were synthesized by Shanghai Sheng Gong Corporation.
| Tumor-related genes | Probe sequence |
| APC | 5-TTGGTTCCCAGATGACTTGTCAGCC(T)TCGAGGTGCAGAGTGTGTG CTACTAG-3dig |
| Bcl10 | 5-CTGTATCAGGAAGTTCTGTG(T)TTTTTCTCGCCGAATAG ATTCAACAAGGGTG-3dig |
| Beclin1 | 5-CCAAGCAGCATTAATCTCATTCCA(T)TCCACGGGAACACTGGGCAGGCGACC-3dig |
| BRCA1 | 5-CCTCTTTCTTCATCATCTGAAACCAAT(T)CCTTGTCACTCAGACCAACTCCCT-3dig |
| BRCA2 | 5-AAGCGATGATAAGGGCAGAGGAAAAGG(T)CTAGGGTC AGGAAAGAATCCAAGT-3dig |
| FHIT | 5-AGTCCTCCTTGTCATGTTTCTGGAGC(T)CCTCATAGATGCTGT CATTCCTGTG-3dig |
| KAI1 | 5-GCAGAAGCCCTTCCTCACAGAAAGGC(T)GTTGTCCTCT TCCCCCTTGACTTCGC-3dig |
| NM23 | 5-GGAATCCTTTCTGCTCAAAACGC(T)TGATAATCTCTCCCACAAGACCCCGCTG-3dig |
| Ptch | 5-CGCTTCTGTGGTCAGGACAT(T)AGCACCTTCTTCTTTAG GGGTCTGTATCAT-3dig |
| PTEN | 5-CCTCTTGATATCTCCTTTTGTTTC(T)GCTAACGATCTCTTTGATGATGGCTG-3dig |
| RB | 5-TGAGCACACGGTCGCTGTTACA(T)ACCATCTGATTTATTTTCTGGAA CTTCT-3dig |
| UVRAG | 5-CTCCTTGTTCTTGGCTAGGGTGCACA(T)TCGCGTGGCCT CCGTTTAAGCTGCCAAC-3dig |
| TP53 | 5-CCAGGACAGGCACAAACACGCACCT*CAAAGCTGTTC CGTCCCAGTAGATTAC-3dig |
| Cyclin D1 | 5-CCTCCTCGCACTTCTGTTCCTCGCAGACCT*CCAGCATCCAGGTGGCGACGATCTTCCG-3dig |
| C-myc | 5-CTTCCTCATCTTCTTGTTCCTCCTCAGAGT*CGCTGCTGGTGGTGGGCGGTGTC-3dig |
Hybridization procedures were performed based on the instructions of RNA in situ hybridization (RISH) kits (Cybrdi, USA) with some modifications. The glassware was washed, rinsed in distilled deionized water, and autoclaved before use. Gloves were worn when the glassware and slides were handled to prevent RNase contamination on the tissues. Because of the differences in tissues and probes, we performed different pilot-experiments to achieve the best results (Table 1). Deparaffinized sections were mounted onto Denhardt-coated glass slides and treated with pepsin (0.25 mg/mL in DEPC H2O-HCl) for 25-30 min in a 37°C water bath. The treated sections were then processed for in situ hybridization at 42-45°C for 36-48 h. The hybridization mixture contained the labeled oligonucleotide probe, 50% formamide, 10 mmol/L Tris-HCl, 1 mmol/L vanadyl-ribonucleoside complex (Sigma 94740), 1 mmol/L CTAB (Sigma 855820, pH 7.0), 0.15 mol/L Nacl, 1 mmol/L EDTA (pH 7.0), 1 × Denhardt’s mixture and 10% dextran sulfate. After hybridization, the slides were washed three times, 30 min each time, in 0.1 mol/L TBS at room temperature, then treated with TBS (100 mmol/L Tri, pH 7.5, 150 mmol/L Nacl) containing a 1% blocking reagent (Roche) and 0.03% Triton X-100 for 30 min at room temperature and incubated for 30 min with anti-digoxigenin alkaline phosphataseconjugated antibodies (Roche) diluted at 1:500 in TBS containing 0.03% Triton X-100 and a 1% blocking reagent. After being washed three times, 15 min each time, in TBS and 0.05% Tween, the slides were rinsed in a DAP-buffer (100 mmol/L Tris, pH 9.5, 100 mmol/L Nacl, 50 mmol/L MgCl2) and subsequently hybridization signals were visualized using nitroblue tetrazolium and 5-brom-4-chlor-3-indolyl phosphate as substrates [DAP-buffer in 10% PVA (Sigma 341584)].
Two techniques for data analysis were adopted: a statistical method used to calculate the P values of genes in different samples, and a machine learning method applied to further discover the relationship between genes and corresponding samples.
The significance level of the 15 tumor-related genes were analyzed by Wilcoxon rand sum test, which is an efficient nonparametric statistical method to compare two groups of data and determine their differences. It is important to choose an efficient machine learning method to further explore the connections between genes and different cancers. However, it is hard to decide what kind of functions the 15 tumor-related genes would have for the different types of cases. So it is necessary to separately analyze the effects of both a single gene and different gene groups in different specimens. However, since there are so many ways to construct a gene group within 15 genes, efficient methods are required to shrink the scope of gene group construction. To achieve this, four classical feature selection methods were used to analyze gene expression levels, including: t test, entropy, Bhattacharyya and Wilcoxon. All these methods were provided in bioinformatics toolbox embedded in Matlab 7.1. Based on different criteria for feature selection, different methods would result in genes in different order of importance. The genes were classified into different groups. The discrimination ability of the gene groups was measured by support vector machine (SVM). The genes with biological significance were discovered by comparing the results.
There were three steps to analyze gene expressions: firstly, the gene expressions of different specimens were measured with the Wilcoxon rank sum test, so that P value of each gene can be calculated, and then used to evaluate the homologic extent of the two specimens. Secondly, the classification ability of each gene was analyzed singly among different tissues to further assess the importance of each gene in different tissues. Thirdly, the results obtained by the combination of different genes were investigated. The relationship among genes could be discovered in this way. It is easy to evaluate the classification ability of a single gene using SVM with 10-fold cross-validation (CV) directly. However, since there are many ways to select the 15 genes to form a gene group, it is necessary to take a reliable selection method. In our analysis, a gene group starts from an empty one. A filter method was applied to rank the genes, and then a gene was added to the group according to the score of the rank. The gene group was used to discriminate the samples in two types of tissues using SVM by the 10-fold CV method. This process ended when all genes were added to the group. In addition, as the sample sizes varied in different diseases, the Area Under Curve (AUC) of the receiver operating characteristic (ROC) was deployed in our experiments. A ROC curve represents the true positive rate as a function of the corresponding false positive rate, and AUC provides a measure of performance that is sensitive to the distribution of the activity classes in test sets. Finally, the best gene subsets can be found by the highest AUC.
The tissue micro-array technology was substantially different from the traditional multi-tissue blocks. The most important advantages of TMA technology include increased capacity, negligible damage to the original tissue blocks, precise positioning of tissue specimens, and possibility of automatic construction and analysis of arrays. In this study, we chose 4% paraformaldehyde in PBS (1‰ DEPC PBS) as a fixation agent, which can decrease the degradation of RNA and yield a good morphology. The analysis of RISH showed that 80%-95% of tumor samples were interpretable. RISH-related weak hybridization, background, and tissue damage were responsible for about one-sixth of the non-informative cases.
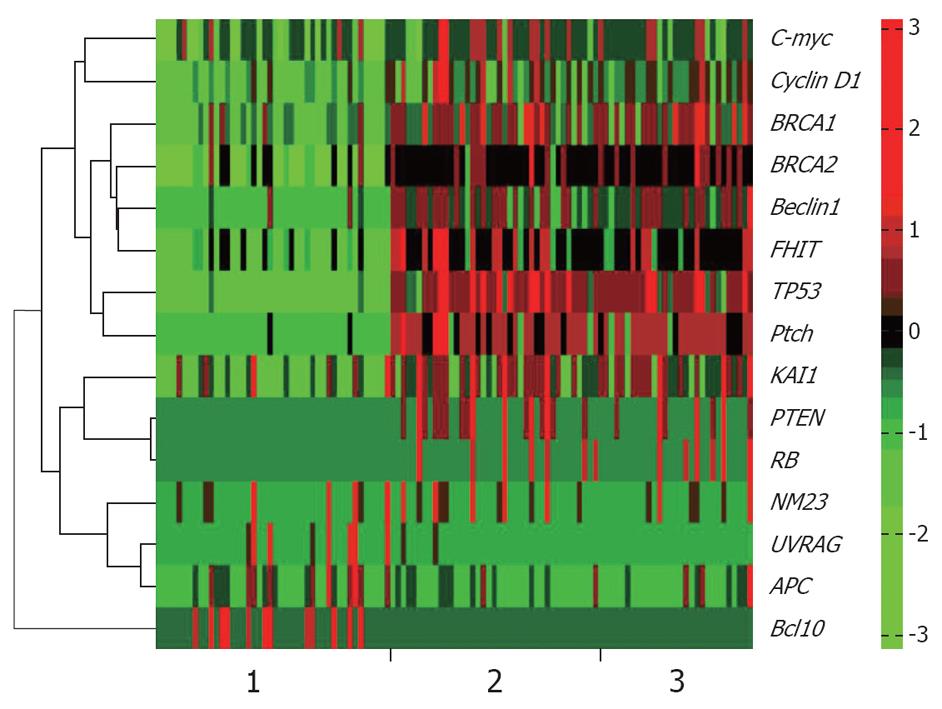
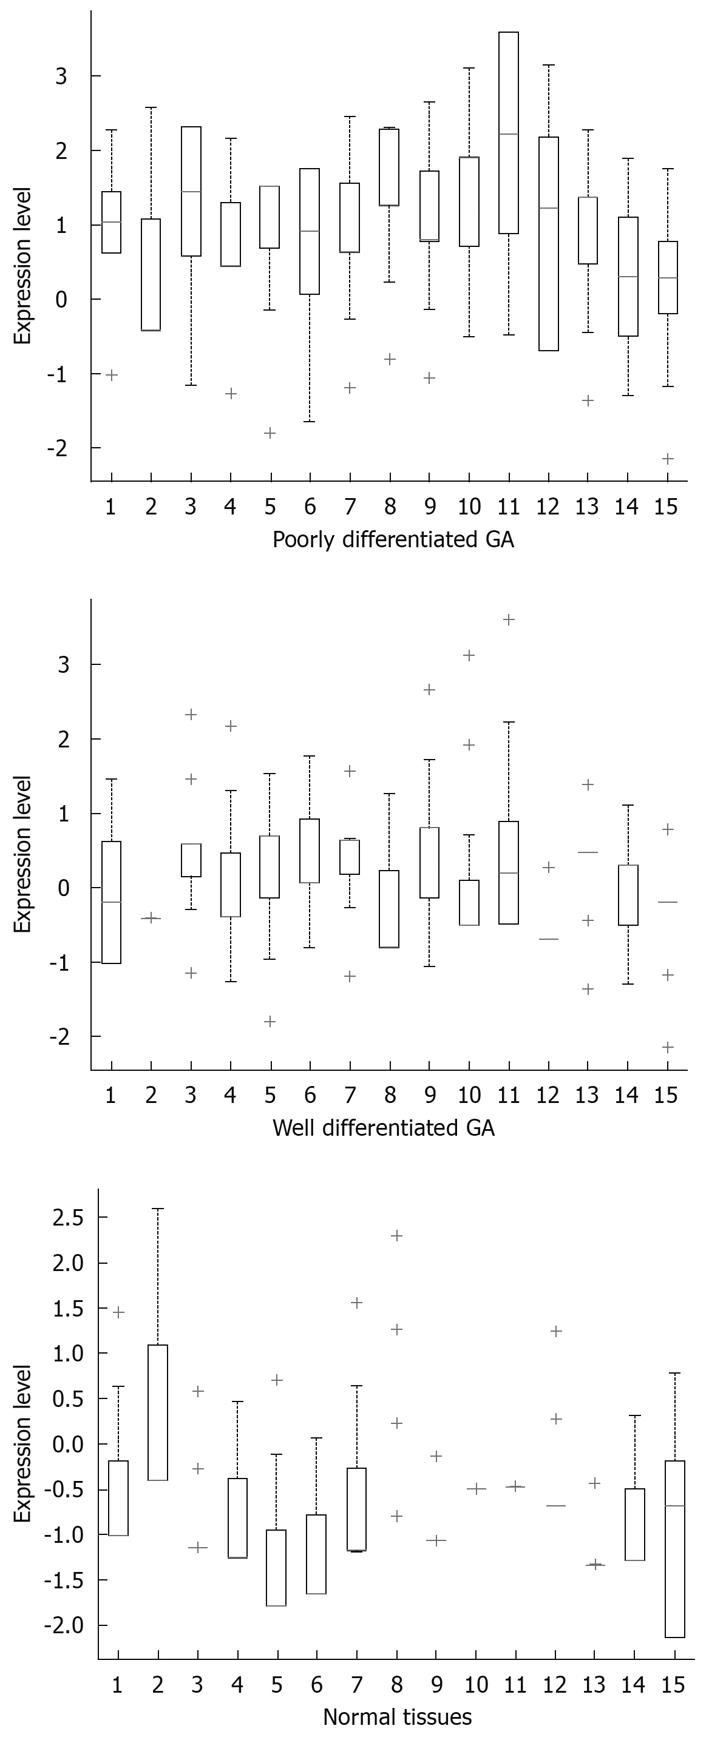
RISH was used to detect specific RNAs in situ. The typical results of ISH were observed as amethyst dots on arrays, RNA analysis and quantification required completely intact, non-degraded RNA samples to produce optimal results. Vanadium oxide ions and formation of complex nucleoside could protect RNA degradation from RNase. Cetyltrimethylammonium bromide could stabilize the Oligo probe and target sequence formation of double-stranded structures, thus improving the reannealing speed. The monomer containing LNA greatly improved the stability and sensitivity of RNA-targeted in situ hybridization. According to the results of RISH, positive organizational coloring cell counts were classified under the microscope (Figures 1 and 2).
Results obtained at the first step: The gene expressions of different specimens were measured with the Wilcoxon rank sum test. Table 2 shows the P value obtained in experiments. From the results, we found that the normal tissues were quite different from the cancer tissues. The P value of different genes indicated that there were 12 out of 15 genes and 14 out of 15 genes with significant biological difference in comparison of normal tissues with the cancer tissues.
| APC | Bcl10 | Beclin1 | BRCA1 | BRCA2 | FHIT | KAI1 | NM23 | Ptch | PTEN | RB | UVRAG | TP53 | Cyclin D1 | C-myc |
| 0.0523 | 0.0002 | 0.0000 | 0.0000 | 0.0000 | 0.0000 | 0.0000 | 0.2603 | 0.0000 | 0.0006 | 0.0000 | 0.5295 | 0.0000 | 0.0000 | 0.0048 |
| 0.0000 | 0.7527 | 0.0000 | 0.0000 | 0.0000 | 0.0000 | 0.0000 | 0.0000 | 0.0000 | 0.0000 | 0.0000 | 0.0000 | 0.0000 | 0.0000 | 0.0001 |
| 0.0000 | 0.0018 | 0.0001 | 0.0371 | 0.0028 | 0.1999 | 0.0129 | 0.0000 | 0.1142 | 0.0001 | 0.0009 | 0.0000 | 0.0092 | 0.3676 | 0.0158 |
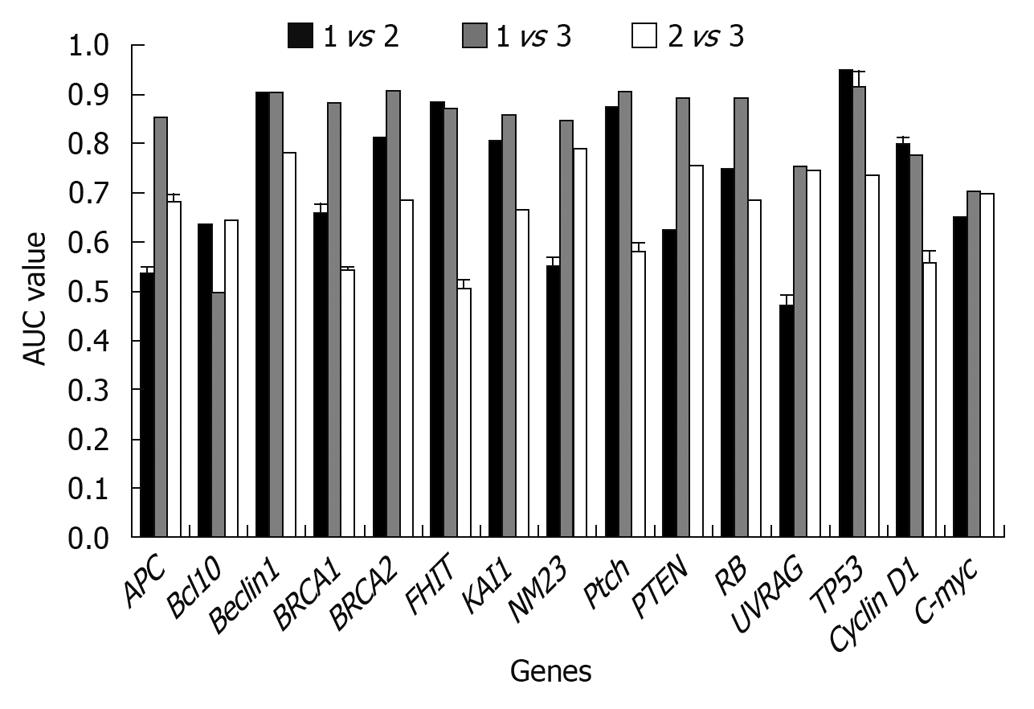
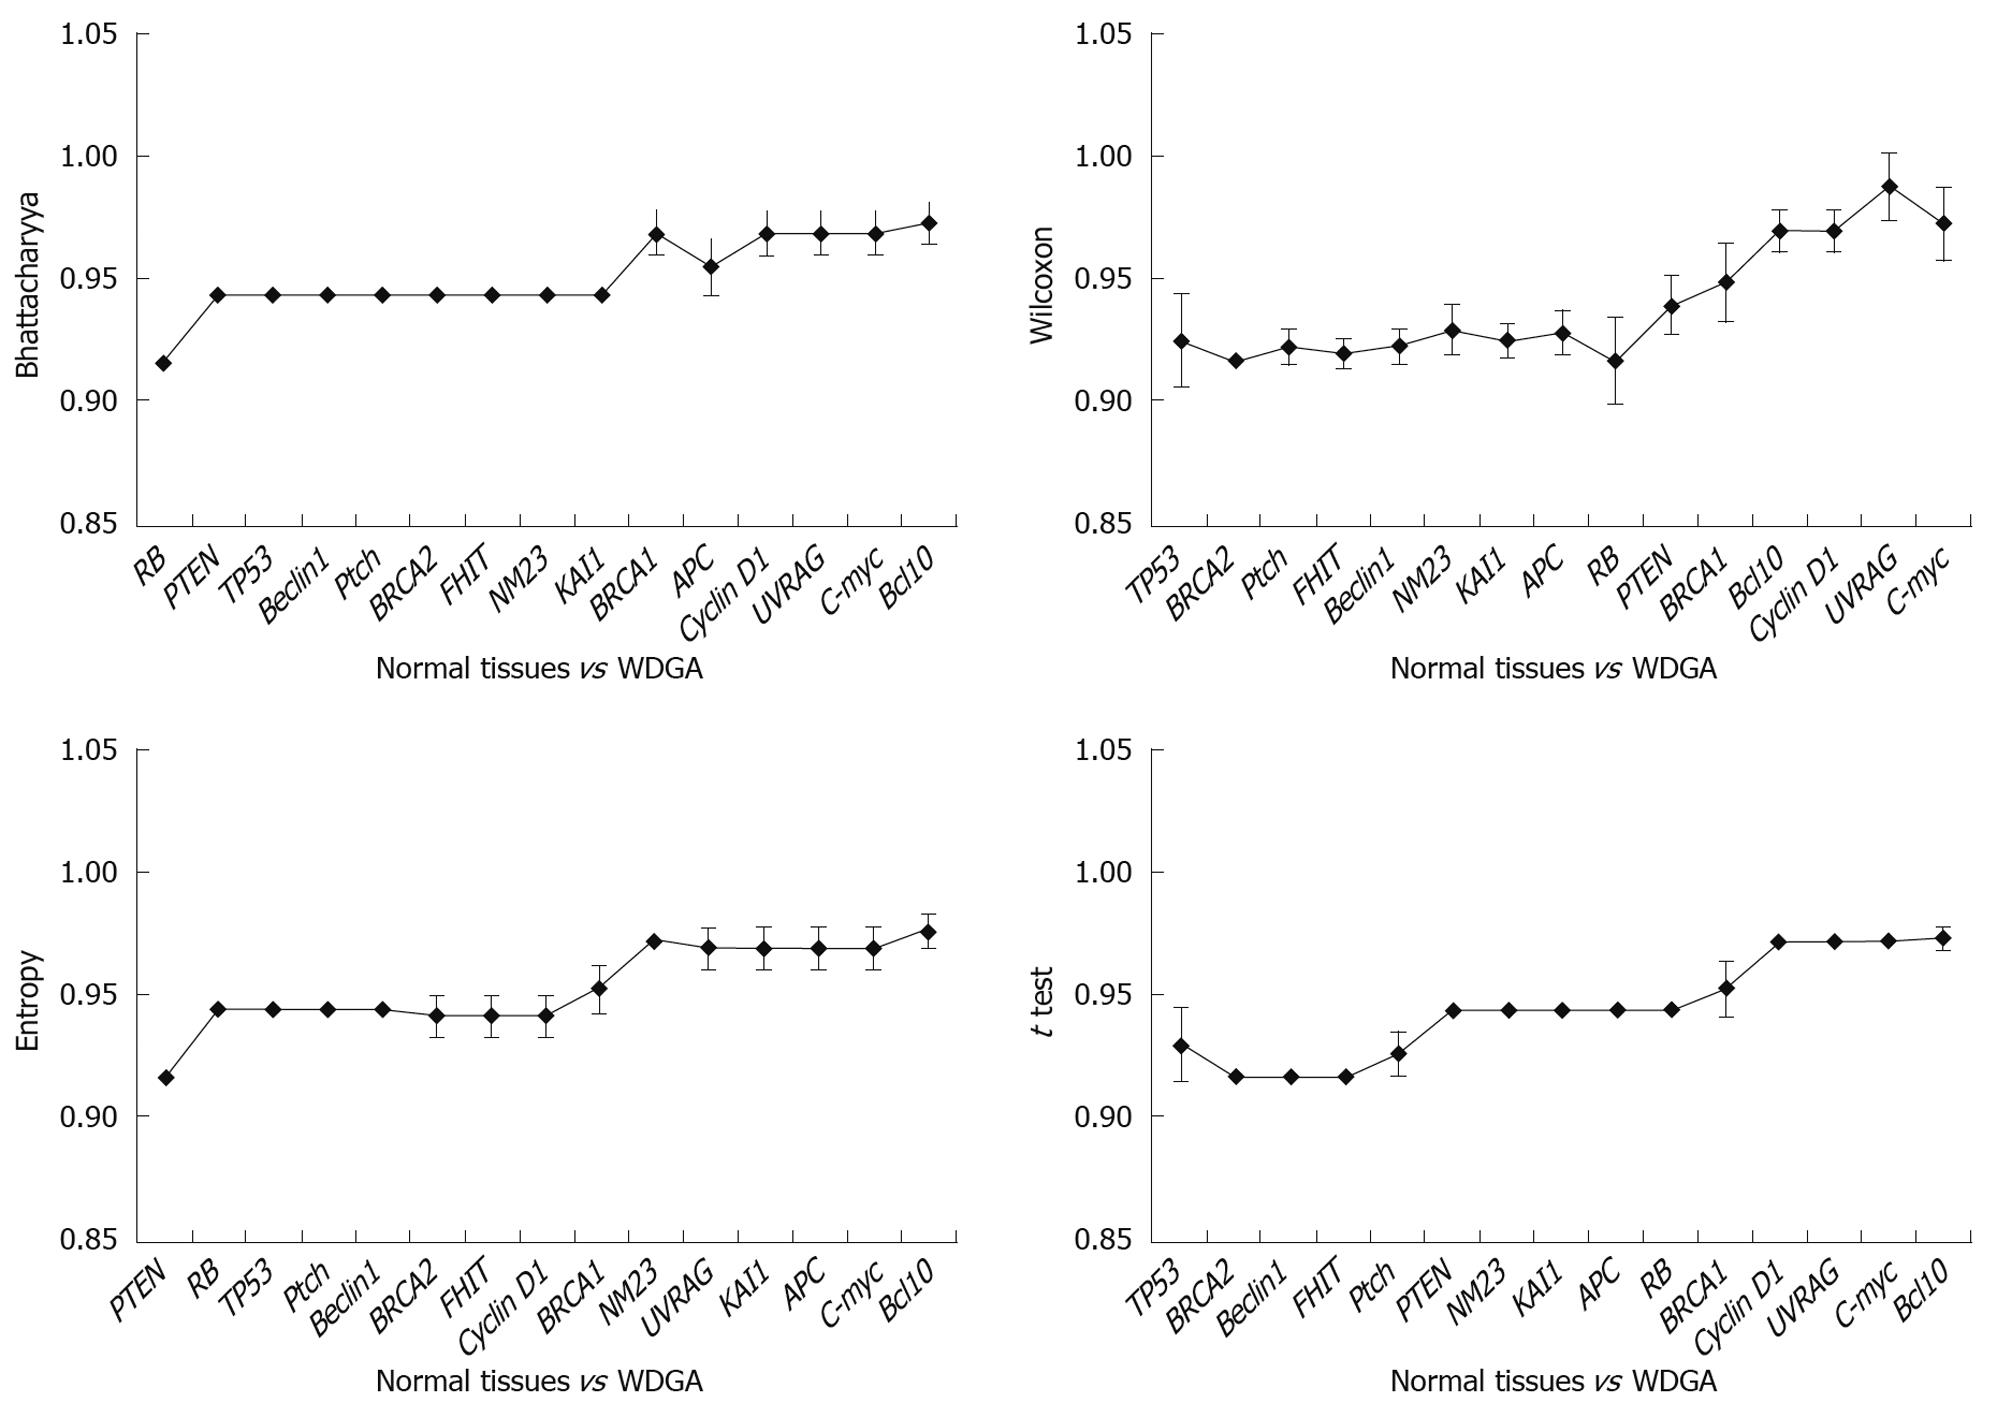
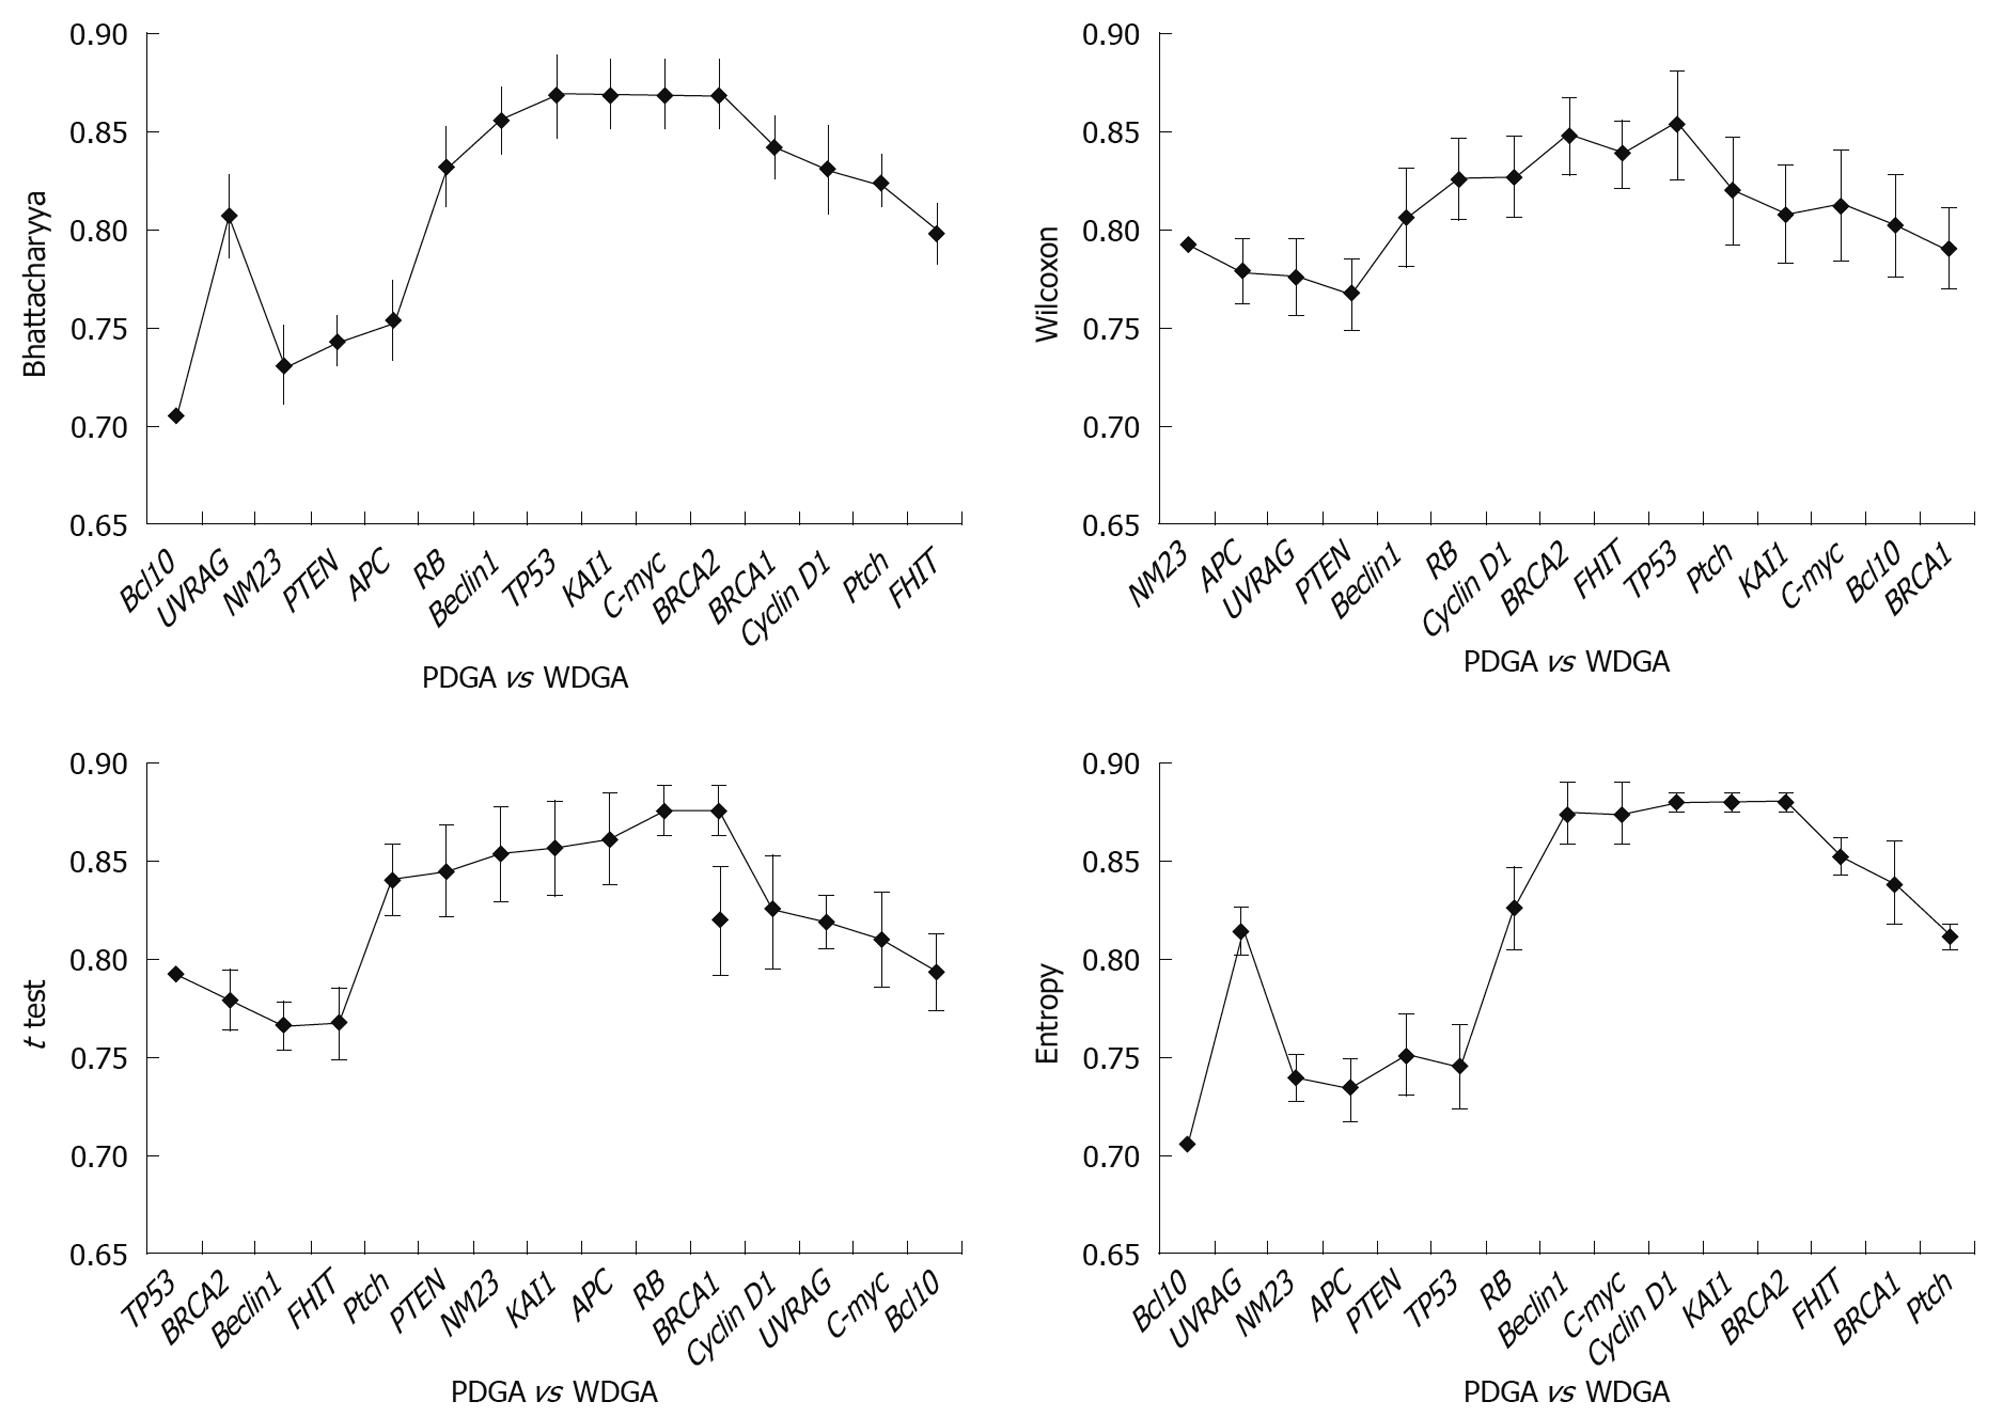
Results obtained at the second step: The classification ability of each gene was analyzed singly among different tissues. From Figure 3, it could be found that when using a single gene, both well differentiated GA and poorly differentiated GA could be well distinguished from the normal tissues. When compared with normal tissues, two different gene subsets were discovered respectively: Beclin1, BRCA2, FHIT, KAI1, Ptch, TP53; and APC, Beclin1, BRCA1, BRCA2, FHIT, KAI1, NM23, Ptch, PTEN, RB, TP53 in poorly and well differentiated GAs. In comparison of well and poorly differentiated GA, none of the single genes could achieve a high classification performance.
In this analysis, when the AUC results were lower than 80%, the corresponding gene(s) had no classification power under our hypothesis. If a gene can improve the AUC by more than 80%, it can be regarded as a key gene as it can classify two different sample groups.
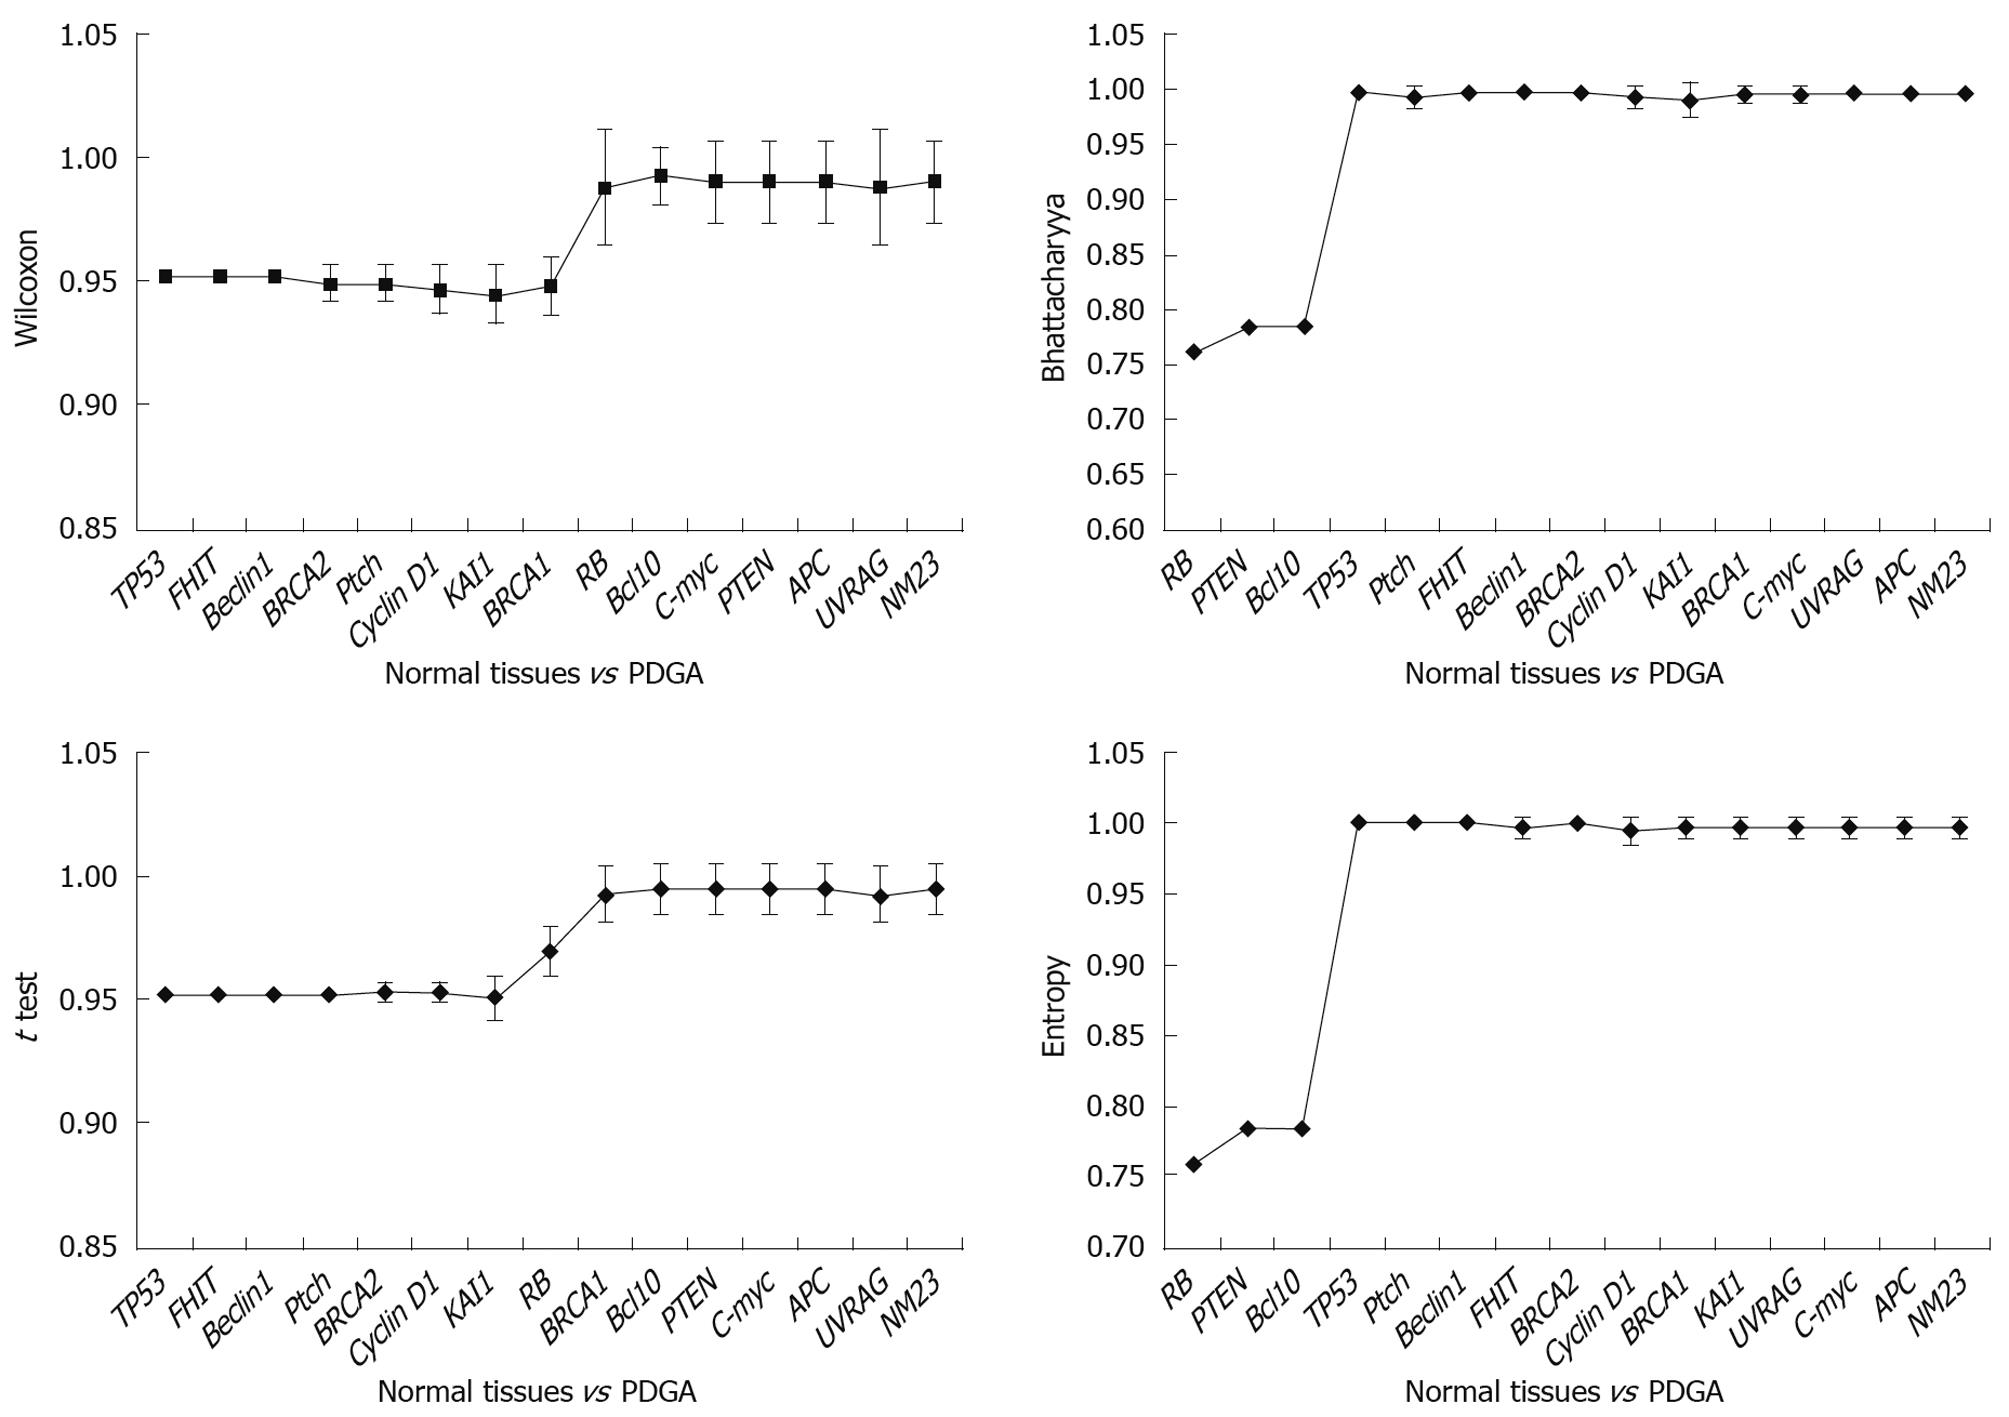
Results obtained at the third step: The results were analyzed in three aspects: (1) The poorly differentiate GA was compared with normal tissues, and the results indicated that TP53 was the key gene for distinguishing the two tissues (Figure 4). It was obvious that when TP53 was used, the AUC results were immediately improved; (2) Well differentiated GA was compared with normal tissues, and the results showed that TP53, RB, and PTEN are the key genes, which had high classification abilities (Figure 5); and (3) We compared the poorly differentiated with well differentiated GA, and seven genes (Bcl10, UVRAG, APC, Beclin1, NM23, PTEN, and RB) were found to be closely related to different pathological gradings of gastric cancers (Figure 6).
Histopathological differentiation level represents the deterioration degree of tumors. The stomach carcinoma is one of the most prevalent cancer types in the world[1,2]. Only a limited number of biomarkers are available for its detection and prognostic evaluation. Up to now, the clinicians still determine the degree of malignancy by histopathological differentiation method. Two major types of stomach carcinoma are distinguished according to their morphological and clinicopathological classifications: well-differentiated/intestinal type and poorly differentiated/diffuse type[6,29]. Here, the well or poorly differentiated level represents the malignant degree of tumors, and implies different prognosis. The study of Muro-Cacho et al[30] indicated that only the degree of necrosis and phenotypic differentiation toward smooth muscle were found to be indicators of poor prognosis in the multivariate analysis. Based on their observations, a classification scheme for gastrointestinal stromal tumors was proposed. Lee et al [31] clarified the importance of the mucin phenotype in clinic. Despite a well-defined correlation between histological differentiation and Lauren’s classification of GA, the mucin phenotype was not in agreement entirely with Lauren’s classification. Instead of the histologic differentiation and Lauren’s classification, I-phenotypic expression was an independently important prognostic factor of gastric cancers. We have often observed that the level of pathological differentiation and prognosis are inconsistent in clinic. It is well known that the higher degree of malignancy, the earlier occurrence of cancer metastasis and invasion, and the more important alterations of tumor-related genes. So our research about the relationship between different histopathological grades and the tumor-related genes in GA is of great clinical significance.
The characteristics of the two major types of gastric cancer can be attributed to different tumor-related gene activations. A large number of tumor-related genes involved in signal transductions and cell cycle regulation have been implicated in gastric cancer progression. The study of Wu et al[32] indicates that according to the molecular pathological background, mucinous adenocarcinomas of the stomach consist of at least three subtypes: the mutator-type, the suppressor (p53-type) and the unclassified tumors. It would provide clinicians with useful information for clinical diagnosis by further exploration of carcinomas with more detailed morphological and biological phenotyping. Wang et al[33] indicated that the MUC1 gene might be an indicator of poor prognosis. Based on these studies, we explored the alteration of tumor-related genes in different pathological differentiation levels to obtain TNM-Gene diagnosis in GA. Although the data of gene expressions are complicated and irregular, we attempted to discover the their correlations using SVM by a 10-fold CV method[34-36].
Tumor grade represents a gestalt of all molecular changes in malignant tumors and reflects their aggressiveness. In addition, it has been proved to enhance prognostic information. Chandler et al[37] evaluated the degree of inter-observer variation in grading by conducting a nationwide survey of histopathologists, and drew an important conclusion: given the fact that the histopathological criteria of stage and grade still provide the mainstay of prognostication and clinical decision-making, we should make more efforts to improve grading criteria and standardize the low- and high-grade categories. However, this conclusion is contradictory to ours. It is usually considered that poorly differentiated GA is a high-grade carcinoma with poor prognosis, and have multiple important alterations of tumor-related genes, and well differentiated GA means low-grade carcinoma with better prognosis, and the reason may be that tumor-related gene alteration was caused by cumulation of injury and repair. But our results indicate that TP53 is the key tumor-related gene relating closely to the canceration of poorly differentiated GA; and there are multiple tumor-related gene alterations in well differentiated GA. We suggest that the alteration level of tumor-related genes is bound up with grade of malignancy, histopathological grading and prognosis. So we have come up with a conclusion: the alterations of tumor-related genes do not exactly match the histopathological grades. Furthermore, we suspect that histopathological tumor grade does not exactly match the degree of malignancy. There are slight differences between poorly and well differentiated GA. No single tumor-related gene can distinguish the two groups of tumors, and only one gene subset consisting of seven genes can distinguish the two tumors. So we speculate that synergistic actions of multiple genes lead to different specimens.
Compared with general pathological diagnosis, the TNM-Gene diagnostic methods are more accurate to determine the extent of malignancy of tumors and prognoses. TP53 is the most important tumor-related gene[38-45]. Among the 15 genes, only the alteration of TP53 closely relates to poorly differentiated GA. But besides TP53, other ten genes are connected with the well differentiated GA. To sum up the results, TP53 alters in both groups of tumors, but leading to different Edmonson, we speculate that the alterations of TP53 may have completely different subtypes, which have the different functions.
Gastric cancer is the second major cause of oncologic death worldwide. Because the occurrence of cancer is closely related with the tumor-related genes, the authors explored the diverse characteristics of different pathological gradings of gastric adenocarcinomas (GAs) by investigating 15 tumor-related genes. It has been proved that the 15 critical tumor-related genes selected are involved in carcinogenesis, and they represent different formation mechanism of cancers.
TNM-Gene diagnosis of gastric cancer is a better diagnostic criterion. The characteristics of two major types of gastric cancer can be attributed to different tumor-related gene activations. A large number of tumor-related genes involved in signal transductions and cell cycle regulation have been implicated in gastric cancer progression. So the authors explored the alteration of tumor-related genes in different pathological differentiation levels in an attempt to obtain TNM-Gene about different GAs.
Tumor grade represents a gestalt of all molecular changes in malignant tumors and reflects their aggressiveness. The results of this study is different from the traditional opinions as the well differentiated cancer tissues have more alterations of important tumor-related genes than those of the poorly differentiated cancer tissues.
To sum up the results, TP53 alters in both groups of tumors, but leading to different Edmonson, the authors speculate that the alterations of TP53 may have completely different subtypes, which have the different functions. Additionally, there are slight differences among tumor-related genes between poorly differentiated and well differentiated GAs, and the associated alterations of gene subset, Bcl10, UVRAG, APC, Beclin1, NM23, PTEN and RB, are closely related to different pathological gradings of GAs.
ROC: receiver operating characteristic, a graphical plot of the sensitivity vs (1-specificity); AUC: the area under the ROC curve, reflecting the relationship between sensitivity and specificity for a given test; SVM: support vector machines, a set of related supervised machine learning methods used for classification or regression.
The study is aimed to identify biomarkers of poorly and well differentiated GAs. The authors found that among tumor related genes tested only p53 significantly changed in poorly differentiated GA, whereas well differentiated tumor showed alterations in several tumor-related genes, including p53, Rb and PTEN.
Peer reviewer: Anna S Gukovskaya, Professor, VA Greater Los Angeles Health Care System, University of California, Los Angeles, 11301 Wilshire Blvd, Los Angeles, CA 91301, United States
S- Editor Wang JL L- Editor Ma JY E- Editor Zheng XM
| 1. | Garcia M, Jemal A, Ward EM, Center MM, Hao Y, Siegel RL, Thun MJ. Global cancer facts & figures 2007. Atlanta (GA): American Cancer Society 2007; 1-50. [Cited in This Article: ] |
| 2. | Correa P. Human gastric carcinogenesis: a multistep and multifactorial process--First American Cancer Society Award Lecture on Cancer Epidemiology and Prevention. Cancer Res. 1992;52:6735-6740. [Cited in This Article: ] |
| 3. | Espey DK, Wu XC, Swan J, Wiggins C, Jim MA, Ward E, Wingo PA, Howe HL, Ries LA, Miller BA. Annual report to the nation on the status of cancer, 1975-2004, featuring cancer in American Indians and Alaska Natives. Cancer. 2007;110:2119-2152. [Cited in This Article: ] |
| 4. | Howe HL, Wu X, Ries LA, Cokkinides V, Ahmed F, Jemal A, Miller B, Williams M, Ward E, Wingo PA. Annual report to the nation on the status of cancer, 1975-2003, featuring cancer among U.S. Hispanic/Latino populations. Cancer. 2006;107:1711-1742. [Cited in This Article: ] |
| 5. | Jemal A, Tiwari RC, Murray T, Ghafoor A, Samuels A, Ward E, Feuer EJ, Thun MJ. Cancer statistics, 2004. CA Cancer J Clin. 2004;54:8-29. [Cited in This Article: ] |
| 6. | Hur H, Park CH. [Surgical treatment of gastric carcinoma]. Korean J Gastroenterol. 2009;54:83-98. [Cited in This Article: ] |
| 7. | Kakudo K, Bai Y, Katayama S, Hirokawa M, Ito Y, Miyauchi A, Kuma K. Classification of follicular cell tumors of the thyroid gland: analysis involving Japanese patients from one institute. Pathol Int. 2009;59:359-367. [Cited in This Article: ] |
| 8. | Gonda G, Bajtai A, Nagy P, Szántó I, Kiss J. Quantitative analysis of p53 expression and cell proliferation in gastric carcinomas. An immunohistochemical study. Hepatogastroenterology. 2004;51:273-276. [Cited in This Article: ] |
| 9. | Lazăr D, Tăban S, Sporea I, Dema A, Cornianu M, Lazăr E, Goldiş A, Vernic C. Gastric cancer: correlation between clinicopathological factors and survival of patients. II. Rom J Morphol Embryol. 2009;50:185-194. [Cited in This Article: ] |
| 10. | Ochiai T, Hayashi H, Suzuki T, Nakajima K, Shimada H, Hishikawa E, Yasumoto A, Takeda A, Isono K. Evaluation of a new staging system by the Japanese Research Society for Gastric Cancer. Surg Today. 1998;28:1015-1021. [Cited in This Article: ] |
| 11. | Wang JY, Hsieh JS, Huang CJ, Huang YS, Huang TJ. Clinicopathologic study of advanced gastric cancer without serosal invasion in young and old patients. J Surg Oncol. 1996;63:36-40. [Cited in This Article: ] |
| 12. | Saab R, Rodriguez-Galindo C, Matmati K, Rehg JE, Baumer SH, Khoury JD, Billups C, Neale G, Helton KJ, Skapek SX. p18Ink4c and p53 Act as tumor suppressors in cyclin D1-driven primitive neuroectodermal tumor. Cancer Res. 2009;69:440-448. [Cited in This Article: ] |
| 13. | Morselli E, Galluzzi L, Kepp O, Vicencio JM, Criollo A, Maiuri MC, Kroemer G. Anti- and pro-tumor functions of autophagy. Biochim Biophys Acta. 2009;1793:1524-1532. [Cited in This Article: ] |
| 14. | Guan-Zhen Y, Ying C, Can-Rong N, Guo-Dong W, Jian-Xin Q, Jie-Jun W. Reduced protein expression of metastasis-related genes (nm23, KISS1, KAI1 and p53) in lymph node and liver metastases of gastric cancer. Int J Exp Pathol. 2007;88:175-183. [Cited in This Article: ] |
| 15. | Holstege H, Joosse SA, van Oostrom CT, Nederlof PM, de Vries A, Jonkers J. High incidence of protein-truncating TP53 mutations in BRCA1-related breast cancer. Cancer Res. 2009;69:3625-3633. [Cited in This Article: ] |
| 16. | Yoo YG, Hayashi M, Christensen J, Huang LE. An essential role of the HIF-1alpha-c-Myc axis in malignant progression. Ann N Y Acad Sci. 2009;1177:198-204. [Cited in This Article: ] |
| 17. | Sanchez G, Delattre O, Auboeuf D, Dutertre M. Coupled alteration of transcription and splicing by a single oncogene: boosting the effect on cyclin D1 activity. Cell Cycle. 2008;7:2299-2305. [Cited in This Article: ] |
| 18. | Thome M. CARMA1, BCL-10 and MALT1 in lymphocyte development and activation. Nat Rev Immunol. 2004;4:348-359. [Cited in This Article: ] |
| 19. | Horak CE, Lee JH, Marshall JC, Shreeve SM, Steeg PS. The role of metastasis suppressor genes in metastatic dormancy. APMIS. 2008;116:586-601. [Cited in This Article: ] |
| 20. | Jin S, White E. Role of autophagy in cancer: management of metabolic stress. Autophagy. 2007;3:28-31. [Cited in This Article: ] |
| 21. | Liang C, Feng P, Ku B, Oh BH, Jung JU. UVRAG: a new player in autophagy and tumor cell growth. Autophagy. 2007;3:69-71. [Cited in This Article: ] |
| 22. | Meek DW. Tumour suppression by p53: a role for the DNA damage response? Nat Rev Cancer. 2009;9:714-723. [Cited in This Article: ] |
| 23. | Burkhart DL, Sage J. Cellular mechanisms of tumour suppression by the retinoblastoma gene. Nat Rev Cancer. 2008;8:671-682. [Cited in This Article: ] |
| 24. | Diaz-Meco MT, Abu-Baker S. The Par-4/PTEN connection in tumor suppression. Cell Cycle. 2009;8:2518-2522. [Cited in This Article: ] |
| 25. | Lindström E, Shimokawa T, Toftgård R, Zaphiropoulos PG. PTCH mutations: distribution and analyses. Hum Mutat. 2006;27:215-219. [Cited in This Article: ] |
| 26. | Titus TA, Yan YL, Wilson C, Starks AM, Frohnmayer JD, Bremiller RA, Cañestro C, Rodriguez-Mari A, He X, Postlethwait JH. The Fanconi anemia/BRCA gene network in zebrafish: embryonic expression and comparative genomics. Mutat Res. 2009;668:117-132. [Cited in This Article: ] |
| 27. | Pichiorri F, Palumbo T, Suh SS, Okamura H, Trapasso F, Ishii H, Huebner K, Croce CM. Fhit tumor suppressor: guardian of the preneoplastic genome. Future Oncol. 2008;4:815-824. [Cited in This Article: ] |
| 28. | Phelps RA, Broadbent TJ, Stafforini DM, Jones DA. New perspectives on APC control of cell fate and proliferation in colorectal cancer. Cell Cycle. 2009;8:2549-2556. [Cited in This Article: ] |
| 29. | Wu CW, Chi CW, Lin WC. Gastric cancer: prognostic and diagnostic advances. Expert Rev Mol Med. 2002;4:1-12. [Cited in This Article: ] |
| 30. | Muro-Cacho CA, Cantor AB, Morgan M. Prognostic factors in malignant gastrointestinal stromal tumors. Ann Clin Lab Sci. 2000;30:239-247. [Cited in This Article: ] |
| 31. | Lee OJ, Kim HJ, Kim JR, Watanabe H. The prognostic significance of the mucin phenotype of gastric adenocarcinoma and its relationship with histologic classifications. Oncol Rep. 2009;21:387-393. [Cited in This Article: ] |
| 32. | Wu M, Semba S, Li D, Yokozaki H. Molecular pathological analysis of mucinous adenocarcinomas of the stomach. Pathobiology. 2004;71:201-210. [Cited in This Article: ] |
| 33. | Wang Z, Liu XY, Liu FY, Chen JH. Lymph node occult micrometastasis in patients with non-small cell lung carcinoma: genetic diagnosis and its impact on prognosis. Ai Zheng. 2003;22:1204-1208. [Cited in This Article: ] |
| 34. | Brown MP, Grundy WN, Lin D, Cristianini N, Sugnet CW, Furey TS, Ares M Jr, Haussler D. Knowledge-based analysis of microarray gene expression data by using support vector machines. Proc Natl Acad Sci USA. 2000;97:262-267. [Cited in This Article: ] |
| 35. | Liu KH, Xu CG. A genetic programming-based approach to the classification of multiclass microarray datasets. Bioinformatics. 2009;25:331-337. [Cited in This Article: ] |
| 36. | Liu KH, Li B, Wu QQ, Zhang J, Du JX, Liu GY. Microarray data classification based on ensemble independent component selection. Comput Biol Med. 2009;39:953-960. [Cited in This Article: ] |
| 37. | Chandler I, Houlston RS. Interobserver agreement in grading of colorectal cancers-findings from a nationwide web-based survey of histopathologists. Histopathology. 2008;52:494-499. [Cited in This Article: ] |
| 38. | Hollstein M, Sidransky D, Vogelstein B, Harris CC. p53 mutations in human cancers. Science. 1991;253:49-53. [Cited in This Article: ] |
| 39. | Greenblatt MS, Bennett WP, Hollstein M, Harris CC. Mutations in the p53 tumor suppressor gene: clues to cancer etiology and molecular pathogenesis. Cancer Res. 1994;54:4855-4878. [Cited in This Article: ] |
| 40. | Levine AJ, Momand J, Finlay CA. The p53 tumour suppressor gene. Nature. 1991;351:453-456. [Cited in This Article: ] |
| 42. | Lane DP. Cancer. A death in the life of p53. Nature. 1993;362:786-787. [Cited in This Article: ] |
| 43. | Green DR, Kroemer G. Cytoplasmic functions of the tumour suppressor p53. Nature. 2009;458:1127-1130. [Cited in This Article: ] |
| 44. | Efeyan A, Serrano M. p53: guardian of the genome and policeman of the oncogenes. Cell Cycle. 2007;6:1006-1010. [Cited in This Article: ] |
| 45. | Mukhopadhyay UK, Mak AS. p53: is the guardian of the genome also a suppressor of cell invasion? Cell Cycle. 2009;8:2481. [Cited in This Article: ] |


