

Abstract
Dendritic cells (DCs) residing in different tissues and exposed to different organisms are likely to have different reactivities to their surrounding environment. Many studies use in vitro generated DCs to examine functions of these cells, but such cells may not truly reflect the nature of DCs and their in situ activities in vivo. We have used magnetic label-based technique to isolate colonic DCs to conduct derailed characterization of these cells. Colonic DCs comprise mainly CD11b+ DCs with few CD8α+ DCs or plasmacytoid DCs. Functionally, isolated colonic DCs are able to endocytose and process proteins, undergo maturation, and stimulate T cells to proliferate. Importantly, expression of TLRs by colonic DCs is significantly lower than that of their spleen counterparts; however, they appear to be as, or more, responsive to stimulation by oligodeoxynucleotides containing CpG motif based on their cytokine production. We speculate that colonic DCs have unique reactivities differing from DCs residing in other lymphoid tissues and are adapted for the unique microenvironment of the colonic mucosa and that these cells react uniquely to their environment.
Innate immune cells, such as dendritic cells (DCs),3 APCs that link innate and adaptive arms of the immune system by capturing, processing, and presenting Ags to T cells are critical to the induction of protective immunity from pathogenic infection at specific tissue sites, particularly so for mucosal immunity. It has become evident that innate immune cells do much more than simply link the two systems; they also determine the type and quality of subsequent adaptive responses depending on the situation (1). Furthermore, pattern recognition receptors, such as TLRs, are critically involved in the detection of infectious agents by innate immune cells and induction of adaptive immunity (2, 3), recognizing specific stimulation occurring at different mucosal sites.
DCs are critical for host protection against invading pathogens because of their primary ability to present Ags to naive T cells (4, 5). DCs at mucosal tissues are of particular importance because these sites are constantly exposed to the outside environment. Moreover, because each mucosal tissue is unique due to differences in commensal populations and physiological functions, it is likely that DCs from different tissue sites exhibit unique properties, reflecting exposure to different Ags, influence of the tissue microenvironment, and stage of maturation of the DCs in the tissue. Indeed, DCs isolated from Peyer’s patches and small intestine lamina propria have been shown to differ in their subset compositions compared with splenic DCs. Peyer’s patch DCs have a distinct ability to produce IL-10 and to induce Th2 differentiation of naive CD4+ T cells (6). Small intestine lamina propria DCs are composed mainly of CD11b+CD8α− cells. Unlike splenic DCs, these cells were shown to constitutively express IL-10 and type I IFN (7). Similarly, pulmonary DCs isolated from lung-draining lymph nodes have been shown to produce IL-10 upon Ag encounter and induce development of CD4+ T cells with regulatory cell characteristics (8). Aside from mucosal sites, liver DCs also possess distinct features. They have a different subset composition compared with splenic DCs, having a greater proportion of plasmacytoid DCs (pDCs) and are less immunogenic than splenic DCs (9), having lower TLR4 expression that correlates with lower responsiveness to LPS (10). Furthermore, differences in phenotypes and TLR expression have been observed in macrophages isolated from various tissues (11, 12). As such, it is likely that colonic DCs also possess unique features that allow them to manage the distinct microenvironment in colonic tissue that is rich in specific commensal organisms and other exogenous molecules.
It is conceivable that colonic DCs are involved both in immune homeostasis and immune induction in colonic tissue. To study this DC population in detail, we have used a previously established method of isolating intestinal leukocytes (13) along with MACS to rapidly isolate significant numbers of DCs from colonic tissue of mice with minimal manipulation. Isolated colonic DCs are identified by normal DC markers and are able to perform expected functions of APCs. Moreover, colonic DCs, compared with splenic DCs, have a significantly lower gene expression of several important receptors of the TLR family but are able to respond to specific bacterial stimuli equal to or better than splenic DCs. These results highlight previously unknown aspects of colonic DCs and provide further support for functional differences of DCs residing in different tissue sites.
Materials and Methods
Mice
Female and male C57BL/6 and BALB/c mice at 6–8 wk of age were purchased from Charles River Laboratories, and female and male OT-I- and OT-II-transgenic mice were bred at the McMaster University Central Animal Facility (Hamilton, Canada). All procedures were approved by the Animal Research Ethics Board of McMaster University.
Immunofluorescent staining of colonic tissue
Colonic tissue was dissected from the mouse and embedded in Tissue-Tek OCT compound (Sakura Finetek). Sections of 5 μm were fixed in cold acetone and stained for CD11c and MHC class II. Sections were treated with purified hamster anti-mouse CD11c mAb (BD Pharmingen) and biotinylated mouse anti-hamster Ig Ab (Southern Biotech) in 20% normal mouse serum. CD11c staining was detected by treatment of sections with streptavidin-HRP and Alexa Fluor 488-tyramide (Molecular Probes). Concomitantly, MHC class II was detected by treating sections with rat anti-mouse MHC class II mAb (eBioscience) and Alexa Fluor 680-conjugated goat anti-rat IgG Ab (Molecular Probes). Slides were mounted with Vectashield mounting medium with 4′,6′-diamidino-2-phenylindole (DAPI; Vector Laboratories) and visualized using the DM-RA microscope (Leica) and overlaid using Adobe Photoshop software. In control sections, primary Abs were omitted, and no staining was observed in these sections.
Isolation of DCs from colonic and lung tissues
Mice were sacrificed by cervical dislocation and the entire large intestine, from just below the cecum to the rectum, was obtained. Luminal contents were flushed with PBS, and the tissues were cut open longitudinally, then cut into <5-mm pieces, and washed extensively in HEPES-buffered HBSS (Invitrogen Life Techologies). The pieces were incubated three times for 20 min at 37°C with continuous agitation in Ca2+Mg2+-free HBSS (Invitrogen Life Techologies) supplemented with 10% FBS, 10 mM HEPES, 100 μg/ml gentamicin (Invitrogen Life Techologies), and 5 mM EDTA to remove epithelial cells and digested in RPMI 1640 (Invitrogen Life Techologies) supplemented with 300 U/ml collagenase type VIII (Sigma-Aldrich), 10% FBS (Invitrogen Life Technologies), 2 mM l-glutamine, 10 mM HEPES, and 100 μg/ml gentamicin (collagenase-supplemented RPMI 1640) for 1 h at 37°C with continuous agitation. The resulting cell suspension was passed through a 100-μm pore size cell strainer (BD Falcon) and washed once in PBS. Colonic cells were further purified using 43%/63% Percoll (Amersham Biosciences) density gradient centrifugation, and cells at the interface were collected and washed with PBS twice. For lung DC isolation, lungs were dissected, perfused with 10 ml HBSS through the right ventricle to remove RBC, cut into small (∼2-mm) pieces, and digested for 1 h at 37°C in collagenase-supplemented RPMI 1640 with continuous agitation. Lung pieces were then triturated through a 100-μm pore size cell strainer (BD Falcon) and washed once in PBS. The resulting colonic or lung cells were incubated with CD11c microbeads (Miltenyi Biotec) according to the manufacturer’s instructions. CD11c+ cell purification was conducted over MS+ columns on an OctoMACS separator (Miltenyi Biotec). Samples were run through MACS separation columns twice to achieve higher purity. We consistently achieved an enriched population of >90% CD11c+ cells.
Splenocyte isolation
Mice were sacrificed by cervical dislocation, and spleens were excised, infused with collagenase-supplemented RPMI 1640, cut into small pieces, and incubated for 30 min at 37°C. They were then strained through a 100-μm pore size cell strainer (BD Falcon), and RBC were removed by treatment with 2 ml of M-lyse buffer (R&D Systems). Cells were filtered through a 40-μm pore size cell strainer (BD Falcon) and washed with PBS. Splenic DCs were isolated by MACS in a manner similar to colonic DC isolation described above. Splenic T cells were isolated using a pan-T cell, CD4+ T cell, or CD8+ T cell isolation kit (Miltenyi Biotec) and AutoMACS (Miltenyi Biotec) according to the manufacturer’s instructions. Purified T cells were routinely >90% pure based on CD3, CD4, or CD8 staining.
In vitro endocytosis assay
DCs isolated using CD11c MACS (1 × 10⁵ in 200 μl) were incubated for 1 h at 37°C with DQ-OVA (Molecular Probes) at 100 μg/ml in RPMI 1640 supplemented with 10% FBS, 100 U/ml penicillin, 100 μg/ml streptomycin (Invitrogen Life Technologies), 100 μg/ml gentamicin, 2 mM l-glutamine (Sigma-Aldrich), 10 mM HEPES, and 50 μM 2-ME (Invitrogen Life Technologies; complete medium), and analyzed by flow cytometry.
Ex vivo DC culture
For DC activation analysis, cells were either kept at 4°C or incubated at 37°C with or without 2 μg/ml LPS (Escherichia coli 026:B6; Sigma-Aldrich) or 6 μM CpG oligodeoxynucleotide (ODN) 1826 (5′-TCCATGACGTTCCTGACGTT-3′; McMaster University Mobix Lab, Hamilton, Canada) in complete medium and analyzed for activation markers (MHC class II, CD40, and CD86) using FACS. For cytokine production upon LPS or CpG ODN stimulation, colonic DCs were cultured at 2 × 10⁴ cells in 200 μl for 36 h, and supernatants were analyzed for cytokine levels. For TLR expression analysis and cytokine production analysis, isolated colonic and splenic DCs were cultured at 8 × 10⁴ cells in 200 μl with varying doses of CpG ODN. After 36 h, culture supernatants were used for cytokine analysis, and cells were collected for RNA isolation.
MLR
MACS-purified BALB/c splenic T cells were labeled with 5 μM CFSE (Molecular Probes), 5 × 10⁵ CFSE-labeled T cells were cocultured for 4 days with C57BL/6 colonic CD11c+ cells, and T cell proliferation (CFSE dilution) was examined by FACS.
In vitro proliferation assay
DCs were either pulsed with 500 ng/ml MHC class I-restricted OVA peptide (SIINFEKL) or incubated with 100 μg/ml OVA protein (grade V; Sigma-Aldrich). OT-I CD8+ T cells or OT-II CD4+ T cells were labeled with CFSE as described in MLR. Then, 5 × 10⁵ T cells per well were cocultured for 4 days with various numbers of SIINFEKL- or OVA-pulsed colonic CD11c+ DCs.
In vivo proliferation assay
OT-I splenic CD8+ T cells and colonic CD11c+ DCs were prepared as described in In vitro proliferation assay. CFSE-labeled OT-I CD8+ T cells (4 × 10⁶) were injected i.v. into C57BL/6 mice; 24 h later, 4 × 10⁵ colonic CD11c+ DCs, pulsed overnight with OVA protein (100 μg/ml), were injected i.v. Four days post-DC injection, mice were sacrificed, and spleen and iliac lymph nodes were obtained. Spleens were processed as described previously. Lymph nodes were processed by grinding between sterile, frosted slides in PBS and filtering through a 40-μm pore size cell strainer. T cell proliferation was examined by CFSE dilution using flow cytometry.
Flow cytometry
Surface markers were detected using anti-CD3, anti-CD4, anti-CD8α, anti-CD11b, anti-CD11c, anti-CD40, anti-CD44, anti-CD86, anti-CD103, anti-B220, anti-I-Ab (all BD Pharmingen), and anti-PDCA-1 (Miltenyi Biotec). Nonviable cells were detected using Via-Probe (7-aminoactinomycin D; BD Pharmingen). Samples were run on an LSR II system (BD Biosciences); and data were analyzed using FlowJo software (Tree Star).
TLR gene expression analysis
Total RNA was isolated from cells using the RNeasy Mini kit (Qiagen) and cDNA synthesized using a RETROscript kit (Ambion), and real time-PCR gene expression using an ABI PRISM 7900HT (Applied Biosystems) and TaqMan Gene Expression Assays for TLR2, TRL4, TLR5, TLR9, and ribosomal protein L32 (Applied Biosystems).
Cytokine measurement
Cytokine production by cultured cells was determined using ELISA kits for murine IL-10, IL-12p70, and TNF-α (R&D Systems). These assays have detection thresholds of 4.0, 2.5, and 5.1 pg/ml, respectively.
Data analysis
Data are expressed as mean ± SD. Statistical significance of the data was determined by an unpaired, two-tailed Student t test. Values of p < 0.05 were considered statistically significant.
Results
Detection of DCs in colonic tissue
Colonic tissue sections of naive adult C57BL/6 mice were stained for CD11c and MHC class II by double-immunofluorescence staining. CD11c staining cells were observed at low frequency in lamina propria just beneath the epithelial cell layer (Fig. 1, A–D). Most CD11c-staining cells were also positive for MHC class II; however, not all MHC class II-staining cells were positive for CD11c. MHC class II-staining cells were scattered around the lamina propria in a higher frequency relative to CD11c-staining cells. Cells that stained for MHC class II alone may represent other APCs, such as macrophages, that can also express MHC class II (14). In some of the sections examined, lymphoid aggregates were also observed in which higher frequencies of CD11c and MHC class II-staining cells were present (Fig. 1, E and F). DCs are present in colonic mucosa and seem to be well situated for capturing and processing Ags.

Immunofluorescence detection of colonic tissue DCs. Cryostat cross sections of colonic tissue from naive C57BL/6 mice were examined for the expression of CD11c and MHC class II by three-color immunofluorescence. Sections were double-labeled with anti-CD11c and anti-MHC class II Abs. CD11c signal was amplified by tyramide-conjugated Alexa Fluor 488; MHC class II signal was detected by Alexa Fluor 680. Sections were also stained with DAPI for nuclei visualization. Images show overlays of CD11c (green), MHC class II (red), and DAPI (blue) in different magnifications where dotted boxes indicate the magnified areas. A–D, Cross-section of colonic tissue from a naive C57BL/6 mouse at different magnifications. E and F, Longitudinal section of colonic tissue of naive C57BL/6 mouse showing colonic patch. Sections from at least three mice were examined; a representative section is shown here. Scale bars: 200 μm (A); 100 μm (B and E); 50 μm (C and F); 20 μm (D).
Immunofluorescence detection of colonic tissue DCs. Cryostat cross sections of colonic tissue from naive C57BL/6 mice were examined for the expression of CD11c and MHC class II by three-color immunofluorescence. Sections were double-labeled with anti-CD11c and anti-MHC class II Abs. CD11c signal was amplified by tyramide-conjugated Alexa Fluor 488; MHC class II signal was detected by Alexa Fluor 680. Sections were also stained with DAPI for nuclei visualization. Images show overlays of CD11c (green), MHC class II (red), and DAPI (blue) in different magnifications where dotted boxes indicate the magnified areas. A–D, Cross-section of colonic tissue from a naive C57BL/6 mouse at different magnifications. E and F, Longitudinal section of colonic tissue of naive C57BL/6 mouse showing colonic patch. Sections from at least three mice were examined; a representative section is shown here. Scale bars: 200 μm (A); 100 μm (B and E); 50 μm (C and F); 20 μm (D).
Isolation of colonic DCs
We used immunomagnetic bead-based methods to provide a means of rapid cell isolation from colonic tissue. This method has been previously applied in a number of studies for DC isolation (9, 15, 16). Recognizing that the purity of isolated cells is often lower than desirable especially for rare cells like DCs (17), we have coupled an immunomagnetic label-based method with Percoll density gradient centrifugation pre-enrichment to increase the purity of isolated DCs. A similar protocol was previously used effectively for isolation of DCs from mouse small intestinal lamina propria (15). We consistently achieve >90% purity of CD11c+ cells from colonic tissue of naive mice after excluding nonviable cells by flow cytometric analysis (Fig. 2 A), and in general we recover 50,000–100,000 CD11c+ cells from colonic tissue of a single naive mouse which can then be used for various analyses.

Isolation and phenotypic characterization of colonic CD11c+ cells. Colonic tissues from naive C57BL/6 mice were washed well and cut into small pieces; epithelial cells were removed by incubation in EDTA. Tissue pieces were digested using collagenase, Percoll gradient centrifugation was conducted, and cells from the interface were collected for further purification. Cells were labeled with anti-CD11c microbeads and separated using MACS. Positive fractions from MACS were labeled for various surface markers and analyzed by flow cytometry. A, Typical CD11c-staining profile of positive fraction from CD11c MACS. B, Expression of surface markers by MACS isolated CD11c+ cells (gated on CD11c+ cells in A). Representative histograms from at least 3 experiments are shown. Solid lines, specific staining; Shaded histograms, Appropriate isotype controls. The numbers represent percent ± SD of specific staining.
Isolation and phenotypic characterization of colonic CD11c+ cells. Colonic tissues from naive C57BL/6 mice were washed well and cut into small pieces; epithelial cells were removed by incubation in EDTA. Tissue pieces were digested using collagenase, Percoll gradient centrifugation was conducted, and cells from the interface were collected for further purification. Cells were labeled with anti-CD11c microbeads and separated using MACS. Positive fractions from MACS were labeled for various surface markers and analyzed by flow cytometry. A, Typical CD11c-staining profile of positive fraction from CD11c MACS. B, Expression of surface markers by MACS isolated CD11c+ cells (gated on CD11c+ cells in A). Representative histograms from at least 3 experiments are shown. Solid lines, specific staining; Shaded histograms, Appropriate isotype controls. The numbers represent percent ± SD of specific staining.
Cellular phenotype of colonic CD11c+ cells
In mice, DCs represent a heterogeneous cell population expressing the pan-DC marker CD11c (18). We characterized the isolated cell surface marker phenotype and found that colonic CD11c+ cells consist of both MHC class II-positive (∼70%) and -negative cells, many of which also expressed CD11b (Fig. 2,B). A small but detectable portion of CD11c+ cells were CD4+, and an even smaller portion expressed CD8α (Fig. 2,B). pDCs have been intensely studied in the past few years (19), and we found that in staining with pDC-specific Ab, anti-PDCA-1, <3% of CD11c+ cells isolated from the colon express PDCA-1, indicating that these cells were mostly non-pDCs (S. Takenaka, unpublished data). However, some CD11c− cells from the negative fraction of MACS were also positive for PDCA-1, leaving some concerns regarding the specificity of Ab reaction. pDCs can also be characterized as CD11c+ B220+ cells (20, 21); however, when B220 expression by isolated colonic CD11c+ cells was examined, <4% of CD11c+ cells stained for B220 (Fig. 2 B). Expression of CD103 by colonic DCs was also examined, and it was found that 14% of CD11c+ cells expressed CD103.
Splenic and lung DCs were also isolated, and their phenotypes were examined for comparison purpose (Fig. 2,B and Table I). Interestingly, DCs from peripheral tissues (colon and lung) had a similar, but not identical, surface marker phenotype which was very different from that found in the spleen. Specifically, a large portion of lung CD11c+ cells were also CD11b+ cells, and hardly any cells were CD8α+ or B220+. Therefore, colonic DCs, like DCs from other sites, are a heterogeneous population, differing, however, in subset proportions, relative to findings in isolated splenic DC preparations.
Percent expression of surface markers on CD11c+ cells isolated from different tissuesa
| MHC Class II | CD11b | CD8α | CD4 | B220 | CD103 | |
|---|---|---|---|---|---|---|
| Colon | 67.1 ± 5.2 | 65.5 ± 4.7 | 4.1 ± 1.5 | 8.9 ± 1.7 | 3.1 ± 0.3 | 14.0 ± 0.7 |
| Spleen | 87.3 ± 2.3 | 76.2 ± 5.2 | 29.8 ± 4.9 | 54.6 ± 2.5 | 6.8 ± 1.4 | 2.7 ± 0.7 |
| Lung | 51.1 ± 2.1 | 46.9 ± 5.2 | 2.9 ± 2.4 | NAb | 2.3 ± 1.8 | NA |
All values are percent ± SD from at least three separate experiments.
NA, Not available.
Isolated colonic DCs are active endocytic cells
One of the main functions of DCs is to sample their surroundings for Ags to subsequently be presented on MHC molecules (22, 23). The endocytic capacity of isolated colonic cells was examined by using DQ-OVA, a self-quenched OVA conjugate that fluoresces green upon proteolytic degradation and is detected using FACS. The shift in FL-1 fluorescence observed when colonic CD11c+ cells were incubated at 37°C with DQ-OVA (Fig. 3, white histogram), relative to the control, colonic CD11c+ cells incubated at 4°C with DQ-OVA (Fig. 3, gray histogram), shows that they are able to endocytose and process OVA protein. The difference between mean fluorescence intensities of cells incubated at 37°C (288.3 ± 26.6) and 4°C (111.3 ± 2.5) was statistically significant (p < 0.05). Isolated colonic DCs are active endocytic cells that can take up and process protein Ags.

Endocytic ability of colonic DCs. Purified colonic DCs from naive mice were incubated with 100 μg/ml DQ-OVA, stained with fluorochrome-conjugated anti-CD11c and anti-MHC class II mAbs, and analyzed by flow cytometry for DQ-OVA uptake and processing. The histograms shown are gated on CD11c+ cells. Open histogram, colonic CD11c+ cells incubated at 37°C; Shaded histogram, colonic CD11c+ cells incubated at 4°C used as a negative control. Representative result from three experiments is shown.
Endocytic ability of colonic DCs. Purified colonic DCs from naive mice were incubated with 100 μg/ml DQ-OVA, stained with fluorochrome-conjugated anti-CD11c and anti-MHC class II mAbs, and analyzed by flow cytometry for DQ-OVA uptake and processing. The histograms shown are gated on CD11c+ cells. Open histogram, colonic CD11c+ cells incubated at 37°C; Shaded histogram, colonic CD11c+ cells incubated at 4°C used as a negative control. Representative result from three experiments is shown.
Isolated colonic DCs can be induced to mature further ex vivo
DCs in peripheral tissues are known to exist in their immature form expressing only low levels of MHC and costimulatory molecules on their surface, but they induce expression upon maturation (24, 25) to allow them to induce immunity by activating T cells (26). Examining the maturation state of isolated colonic CD11c+ cells, freshly isolated CD11c+ cells consisted of both MHC class II+ and MHC class II− cells and were CD40− and CD86mid (Fig. 4). Upon overnight incubation at 37°C with or without additional exposure to LPS, MHC class IIhigh population expanded whereas the MHC class II− population decreased. Also, expression of CD40 and CD86 were induced leading to the appearance of CD40+ and CD86high cells (Fig. 4). Moreover, when cells were incubated at 37°C with CpG ODN, expression of MHC class II, CD40, and CD86 was further induced (Fig. 4,A). Even though it did not enhance the maturation of DCs any more than the medium control as assumed by maker expression, LPS stimulation slightly enhanced the production of TNF-α and IL-10 by colonic DCs. CpG ODN stimulation, in contrast, induced a significant production of TNF- α and a minimal but detectable level of IL-12p70 production by colonic DCs in addition to a comparable slight increase in IL-10 production (Fig. 4 B). These results suggest that isolated cells were in an immature or semimature state and can be further induced to mature upon ex vivo stimulation. Furthermore, the results are suggestive of the fact that colonic DCs may have unique responsiveness to different TLR ligands.
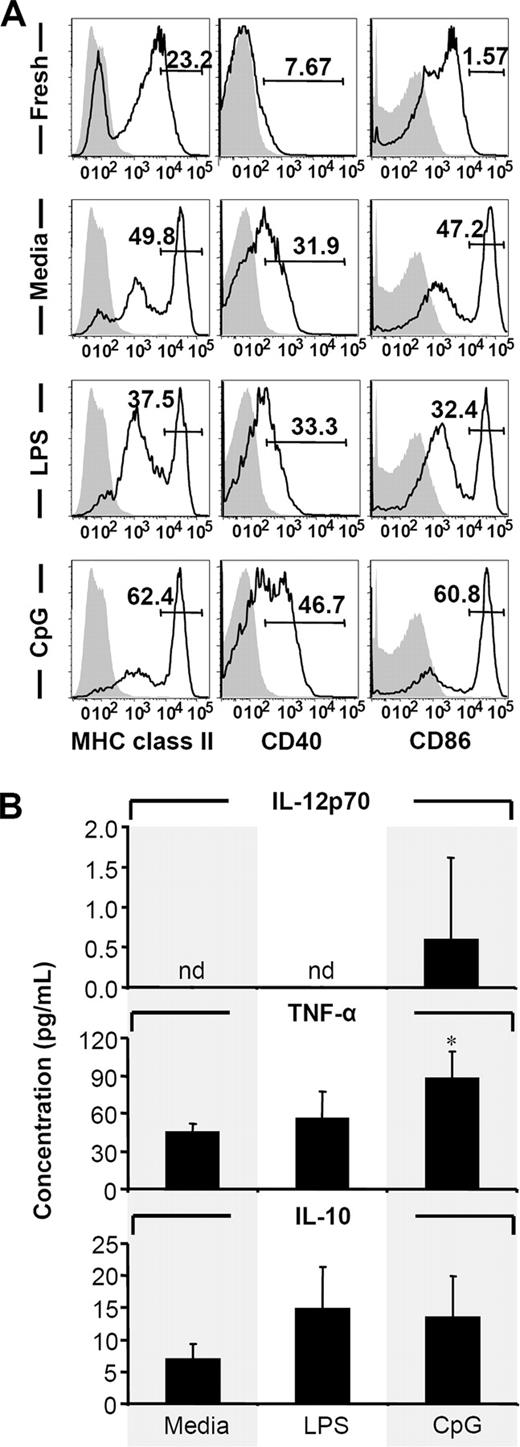
Induction of colonic DC maturation and cytokine expression by TLR ligands. Freshly isolated cells were incubated at 4°C or 37°C in complete medium. LPS and CpG ODN were used as additional stimulus where indicated. A, After overnight incubation, cells were stained for CD11c, MHC class II, CD40, and CD86 by FACS. Numbers represent percent of MHC class IIhigh, CD40+, or CD86high cells. White histograms, specific staining of viable CD11c+ cells; gray histograms, appropriate isotype controls. Representative results from three experiments are shown. B, IL-12p70, TNF-α, and IL-10 secreted by colonic DCs (2 × 10⁴ cells/well in 200 μl) cultured for 36 h with medium alone, LPS, or CpG ODN measured by ELISA. Results are representative of three experiments and are presented as mean ± SD. ∗, p < 0.05 relative to corresponding medium controls. nd, Not detectable.
Induction of colonic DC maturation and cytokine expression by TLR ligands. Freshly isolated cells were incubated at 4°C or 37°C in complete medium. LPS and CpG ODN were used as additional stimulus where indicated. A, After overnight incubation, cells were stained for CD11c, MHC class II, CD40, and CD86 by FACS. Numbers represent percent of MHC class IIhigh, CD40+, or CD86high cells. White histograms, specific staining of viable CD11c+ cells; gray histograms, appropriate isotype controls. Representative results from three experiments are shown. B, IL-12p70, TNF-α, and IL-10 secreted by colonic DCs (2 × 10⁴ cells/well in 200 μl) cultured for 36 h with medium alone, LPS, or CpG ODN measured by ELISA. Results are representative of three experiments and are presented as mean ± SD. ∗, p < 0.05 relative to corresponding medium controls. nd, Not detectable.
Isolated colonic CD11c+ cells can induce allogeneic and Ag-specific T cell proliferation in vitro
DCs capture, process, and present Ags to T cells by loading them on MHC molecules. To determine the functionality of MHC class I and MHC class II molecules on isolated colonic DCs, MLR was performed. Freshly isolated colonic CD11c+ cells from C57BL/6 mice were able to stimulate T cells from allogeneic mice (BALB/c) indicated by dilution of CFSE. At a DC:T cell ratio of 1:50, colonic CD11c+ cells were able to induce proliferation of both CD4+ and CD8+ allogeneic T cells at equal magnitude where 15.7 ± 3.5% of CD4+ and 23.0 ± 7.9% of CD8+ T cells in the culture were dividing cells (unpublished data). These data show that isolated colonic DCs possess functional MHC class I and MHC class II molecules on their surface and are capable of stimulating T cells.
Because isolated colonic DCs can capture and process Ags, can be induced to mature and have functional MHC molecules on their surface, they should be able to stimulate T cells in an Ag-specific manner when provided with Ag by presenting Ags in the context of MHC. To test this, isolated CD11c+ cells were incubated with purified OVA protein overnight and then cocultured with either OT-I CD8+ T cells or OT-II CD4+ T cells. After 4 days of coculture, proliferation of both CD8+ and CD4+ T cells were detected by CFSE dilution (Fig. 5), indicating that colonic CD11c+ cells are fully functional APCs. DC:T cell ratios of 1:10 and 1:50 resulted in statistically significant proliferation where 4.7 ± 0.5 and 2.1 ± 0.3% of CD4+ T cells and 42.1 ± 3.5% and 15.5 ± 3.1% of CD8+ T cells were shown to be proliferating, respectively (Fig. 5). Even though a greater level of CD8+ T cell proliferation was observed in our study, these data do not imply that colonic DCs are more efficient at inducing CD8+ T cells than CD4+ T cells. This is because the T cells used in these experiments were from difference sources (OT-I and OT-II mice); also, they were cultured with colonic DCs separately, and no direct comparison can be made. Nonetheless, our data show that isolated colonic DCs are fully functional DCs that can capture and process proteins, costimulate T cells, and present Ags to induce T cell proliferation. Moreover, despite being CD8α−, colonic DCs can induce proliferation of both CD8+ and CD4+ T cells.
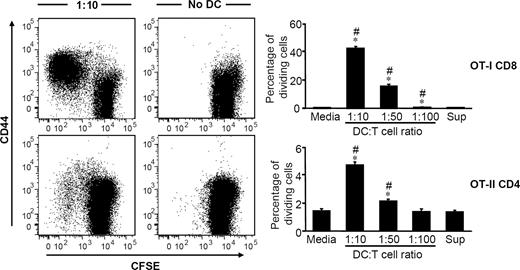
In vitro Ag-specific T cell proliferation by protein-pulsed colonic DCs. OVA protein-pulsed colonic DCs from C57BL/6 mice were incubated for 4 days with CFSE-labeled splenic CD8+ or CD4+ T cells from OT-I or OT-II mice, respectively. Representative CFSE dilution and CD44 expression profiles for a DC:T cell ratio of 1:10 and control sample without DCs are shown for CD8+ T cells (top) and CD4+ T cells (bottom). T cell proliferation was measured by dilution of CFSE and is reported as percent of dividing cells. Results are representative of at least three experiments and are presented as mean ± SD. ∗, p < 0.05 relative to corresponding medium controls. #, p < 0.05 relative to corresponding wash supernatant controls.
In vitro Ag-specific T cell proliferation by protein-pulsed colonic DCs. OVA protein-pulsed colonic DCs from C57BL/6 mice were incubated for 4 days with CFSE-labeled splenic CD8+ or CD4+ T cells from OT-I or OT-II mice, respectively. Representative CFSE dilution and CD44 expression profiles for a DC:T cell ratio of 1:10 and control sample without DCs are shown for CD8+ T cells (top) and CD4+ T cells (bottom). T cell proliferation was measured by dilution of CFSE and is reported as percent of dividing cells. Results are representative of at least three experiments and are presented as mean ± SD. ∗, p < 0.05 relative to corresponding medium controls. #, p < 0.05 relative to corresponding wash supernatant controls.
Isolated colonic CD11c+ cells can induce Ag-specific T cell proliferation in vivo
The ability of isolated colonic CD11c+ cells to prime T cells in vivo was also examined. Isolated CD11c+ cells were incubated with whole OVA protein overnight and then transferred to syngeneic mice which had previously received CFSE-labeled OT-I CD8+ T cells. At day 4, dilution of CFSE staining was detectable in both spleen and iliac lymph nodes of mice that received OVA-loaded colonic CD11c+ cells, but not in control mice that received untreated colonic CD11c+ cells (Fig. 6,A). The proliferation observed in the spleen (29.4 ± 11.0%) and iliac lymph nodes (9.9 ± 4.5%) of mice that received OVA-loaded colonic CD11c+ cells were significantly greater than those of controls (Fig. 6 B). Thus, CD11c+ cells isolated from colonic tissue of naive animals using the method shown herein are fully functional APCs that can induce Ag specific T cell responses in vivo.

In vivo Ag-specific T cell proliferation by protein-pulsed colonic DCs. OVA protein-pulsed colonic DCs were adoptively transferred i.v. to C57BL/6 mice that had received CFSE-labeled splenic CD8+ T cells from OT-I mice 24 h earlier. As a control, colonic DCs without OVA pulsing were used. Cells from spleen and iliac lymph nodes were examined 4 days later by FACS. A, Representative CFSE dilution and CD44 expression profiles for cells from spleen are shown for mice that received OVA pulsed DCs (left) and mice that received unpulsed DCs (right). B, T cell proliferation was measured by dilution of CFSE and is reported as percentage of dividing cells. Results from iliac lymph nodes (left) and spleen (right) are shown. Results are representative of three experiments and are presented as mean ± SD. ∗, p < 0.05 relative to corresponding OVA− control.
In vivo Ag-specific T cell proliferation by protein-pulsed colonic DCs. OVA protein-pulsed colonic DCs were adoptively transferred i.v. to C57BL/6 mice that had received CFSE-labeled splenic CD8+ T cells from OT-I mice 24 h earlier. As a control, colonic DCs without OVA pulsing were used. Cells from spleen and iliac lymph nodes were examined 4 days later by FACS. A, Representative CFSE dilution and CD44 expression profiles for cells from spleen are shown for mice that received OVA pulsed DCs (left) and mice that received unpulsed DCs (right). B, T cell proliferation was measured by dilution of CFSE and is reported as percentage of dividing cells. Results from iliac lymph nodes (left) and spleen (right) are shown. Results are representative of three experiments and are presented as mean ± SD. ∗, p < 0.05 relative to corresponding OVA− control.
Colonic CD11c+ cells compared with spleen have decreased TLR gene expression
Pattern recognition receptors, such as TLRs, provide the means for cells to sense potentially harmful events, such as invading microorganisms or inflammation (27, 28). Colonic and splenic DCs may express different types of TLRs at different levels. The expression of TLRs that are involved in detection of bacterial products (TLR2, TLR4, TLR5 and TLR9) was examined using quantitative real-time PCR on colonic and splenic DCs. cDNA copies of total cellular RNA samples from isolated colonic DCs and splenic DCs from naive mice were synthesized and used. It was found that all TLRs examined were expressed by both colonic and splenic DCs, but the levels of TLR4, TLR5, and TLR9 gene expression were significantly lower in colonic DCs than in splenic DCs when their expression levels were normalized to ribosomal protein L32 expression (Fig. 7 A). A similar trend was also observed when β2 microglobulin was used as the housekeeping gene instead of L32 (S. Takenaka, unpublished data). Therefore, our data show differential expression of TLRs by colonic DCs relative to those by splenic DCs, and the down-regulation may reflect the enhanced commensal bacterial environment of the colon.

TLR expression by colonic DCs and their response to in vitro CpG ODN stimulation. Total RNA was obtained from freshly isolated colonic and splenic CD11c+ cells or from cells cultured for 36 h with CpG ODN and used for real-time RT-PCR gene expression analysis, and culture supernatants were analyzed for cytokine levels. A, TLR mRNA expressions by freshly isolated CD11c+ cells. Total RNA was isolated from freshly isolated colonic and spelenic CD11c+ cells and used for TaqMan gene expression analysis for TLRs 2, 4, 5, and 9. Relative mRNA expressions of TLRs are presented relative to L32 ribosomal protein mRNA expression. Results are representative of at least three experiments and are presented as mean ± SD. ∗, p < 0.05 when colonic and splenic data are compared. B, IL-12p70, TNF-α and IL-10 secreted by CpG ODN-stimulated colonic and splenic DCs (8 × 10⁴ cells/well in 200 μl) measured by ELISA. Results are representative of three experiments and are presented as mean ± SD. ∗, p < 0.05 relative to splenic data for same treatment; #, p < 0.05 relative to corresponding medium controls. C, TLR9 mRNA expression by freshly isolated and cultured colonic and splenic CD11c+ cells. TLR mRNA expressions are presented relative to L32 ribosomal protein mRNA expression. ∗, p < 0.05 relative to corresponding fresh DCs; #, p < 0.05 relative to corresponding medium controls. ▪, Colonic CD11c+ cells; □, splenic CD11c+ cells for all panels. nd, Not detectable.
TLR expression by colonic DCs and their response to in vitro CpG ODN stimulation. Total RNA was obtained from freshly isolated colonic and splenic CD11c+ cells or from cells cultured for 36 h with CpG ODN and used for real-time RT-PCR gene expression analysis, and culture supernatants were analyzed for cytokine levels. A, TLR mRNA expressions by freshly isolated CD11c+ cells. Total RNA was isolated from freshly isolated colonic and spelenic CD11c+ cells and used for TaqMan gene expression analysis for TLRs 2, 4, 5, and 9. Relative mRNA expressions of TLRs are presented relative to L32 ribosomal protein mRNA expression. Results are representative of at least three experiments and are presented as mean ± SD. ∗, p < 0.05 when colonic and splenic data are compared. B, IL-12p70, TNF-α and IL-10 secreted by CpG ODN-stimulated colonic and splenic DCs (8 × 10⁴ cells/well in 200 μl) measured by ELISA. Results are representative of three experiments and are presented as mean ± SD. ∗, p < 0.05 relative to splenic data for same treatment; #, p < 0.05 relative to corresponding medium controls. C, TLR9 mRNA expression by freshly isolated and cultured colonic and splenic CD11c+ cells. TLR mRNA expressions are presented relative to L32 ribosomal protein mRNA expression. ∗, p < 0.05 relative to corresponding fresh DCs; #, p < 0.05 relative to corresponding medium controls. ▪, Colonic CD11c+ cells; □, splenic CD11c+ cells for all panels. nd, Not detectable.
Colonic and splenic CD11c+ cells respond differently to stimulation by CpG ODN
To examine whether DCs from colonic tissue respond differently than splenic DCs to stimulation by TLR ligands, freshly isolated colonic and splenic CD11c+ cells were incubated with various doses of CpG ODN. Culture supernatants were examined for cytokine levels using ELISA, and cDNA copies of total cellular RNA were synthesized and used for TLR9 gene expression analysis. IL-12p70, IL-10, and TNF-α were all produced by both colonic and splenic DCs when stimulated with CpG ODN in a dose-dependent manner. Similar amounts of IL-12p70 were secreted by colonic and splenic DCs at various CpG ODN doses. Colonic and splenic DCs produced very little IL-12p70 even at a high CpG dosage (6 μM), but the amount produced by CpG-treated cells were significantly greater than that by cells cultured in medium alone (Fig. 7 B). IL-10 was secreted by colonic DCs in greater amounts with or without CpG treatment. Also, CpG-treated colonic DCs secreted significantly greater amounts of IL-10 at all doses of CpG tested. Even though splenic DCs produce IL-10 in a dose-dependent manner upon CpG stimulation, the amounts never reached statistical significance. TNF-α was secreted in a more robust manner by both colonic and splenic DCs than were other cytokines examined. At higher dosages (1 and 6 μM) of CpG, both colonic and splenic DCs produced significantly greater amounts of TNF-α relative to their corresponding medium controls, but secretion of TNF-α by colonic DCs was at higher level than that by splenic DCs.
We also examined the level of TLR9 gene expression by colonic and splenic DCs after CpG ODN stimulation and saw a significant reduction in expression by splenic DCs upon culture (Fig. 7,C). Also, CpG ODN treatment of splenic DCs induced greater levels of TLR9 mRNA relative to cells cultured with medium alone; however, their levels were much lower than those expressed by freshly isolated splenic DCs. In contrast, TLR9 mRNA expression by colonic DCs was unchanged upon culturing with or without CpG ODN relative to that by freshly isolated colonic DCs (Fig. 7 C). These data extend the differences seen between colonic and splenic DCs, and suggest not only phenotype differences but also functional differences between these two cell populations isolated from different tissues.
Discussion
Despite an important role that colonic DCs likely play in both innate protection of the colon and induction of local mucosal immunity, only a limited number of studies have examined murine colonic DCs, and mostly in the context of inflammatory bowel diseases (16, 29, 30). In this study, we have isolated and examined the characteristics of colonic DCs from unmanipulated naive mice. We opted not to expand DCs in vivo, using growth factors such as Flt3 ligand (31), because such a treatment likely affects DC function (31, 32, 33).
Murine DCs represent a heterogeneous population of cells expressing a different set of surface molecules in the normal noninflamed or infected tissue (18). We found that colonic DCs are composed of a heterogeneous cell population similar to that found in other tissues and are distinguishable on the basis of surface markers such as CD11b, CD8α, CD4, and B220 (20, 21). We found that CD11b+ cells are predominant in colonic tissue, whereas very small fractions of these cells were CD8α+ or B220+, representing potential pDCs. Interestingly, this colonic DC cell marker phenotype was very similar to that of lung DCs, but very different from that of splenic DCs. This may be indicative of the similarity in functions conducted by mucosal DCs; however, it will require further studies to adequately assess this possibility. Aside from B220, splenic and lymph node pDCs are also detectable by PDCA-1 (34) or CD45RA (35). Even though there were a few colonic CD11c+ cells that were also PDCA-1+, no cells were double-positive for both B220 and PDCA-1 (S. Takenaka, unpublished data), suggesting that there are no typical pDCs present in the colonic tissue. CD45RA expression by colonic DCs was not examined in this study; however, it appears that the majority of colonic DCs phenotypically resemble what is referred to as double-negative DCs (CD8α− CD45RA− CD11chigh). Also, a population that is CD11clowCD11bhighMHC class II−/low found in the cells isolated from colonic tissue may be macrophages based on their size and granulation. This cell population accounts for ∼5% of purified cells (S. Takenaka, unpublished data). Collectively, DCs in the colonic tissue are composed of similar DC subsets found in other tissues, but each subset is present in different proportions when compared with the spleen.
Recently, it was reported that CD103+ DCs, but not CD103− DCs, are capable of inducing expression of intestine-homing CCR9 receptor by T cells (15, 36). In accordance with these reports, we too found a sizable fraction of colonic DCs to be CD103+. The phenotypic characteristics of colonic DCs described herein are similar to what was reported from studies of colonic cells isolated from naive mice by gating on CD11c+ MHC class II+ cells during flow cytometric analysis (17) and detected by immunofluorescence analysis (37). Thus, isolation of colonic DCs using MACS does not seem to cause phenotypic alteration, and this method appears to allow for isolation of different DC populations without biasing one subset over another.
We examined the functionality of isolated colonic DCs and found that colonic DCs were able to perform normal DC functions including Ag uptake, Ag processing, and Ag presentation. A large fraction of freshly isolated colonic DCs were immature or semimature and matured upon overnight culture. Addition of LPS to the culture did not enhance this maturation whereas addition of CpG ODN induced further maturation. Also, cytokine response upon CpG ODN stimulation was somewhat greater than that upon LPS stimulation. This may be due to the high concentration of LPS in colonic DC preparations, because colonic tissue has high bacterial colonization. An alternative interpretation of the data is that colonic DCs are not responsive, or at least less responsive, to LPS stimulation. This is plausible considering the high bacterial load of the colonic mucosa and the reports that some intestinal cells are unresponsive to TLR ligand stimulation in humans (38). The low TLR4 mRNA expression by colonic DCs shown in this study also supports this concept. Because the overnight culture of colonic DCs without exogenous stimulus induced up-regulation of MHC class II molecules, it was not surprising to find that these isolated cells induced a robust allogeneic T cell MLR proliferation (S. Takenaka, unpublished data). More importantly, colonic DCs were capable of performing Ag-specific T cell priming in vitro and in vivo. Collectively, colonic DCs isolated using the current methods are fully functional APCs.
Recent evidence suggests that in vivo presentation of exogenous Ags to CD8+ and CD4+ T cells are conducted specifically by CD8α+ DCs and CD8α− DCs, respectively. It has been suggested in vivo that only CD8α+ DCs can cross-present cell-associated or soluble Ags to induce CTL responses in the spleen (39, 40). In the current study, we show that colonic DCs from naive mice are predominantly CD8α− in agreement with data from other studies (16, 17, 29). Accordingly, it is not surprising that isolated colonic DCs were able to stimulate allogeneic and Ag specific CD4+ T cells. However, we found that colonic DCs are potent inducers of CD8+ T cell activation similar to other in vitro data (41). Here, we show that CD8+ T cell proliferation is induced by a soluble Ag (OVA protein)-pulsed colonic DCs in vitro and in vivo. In addition to the response to whole protein Ag, colonic DCs pulsed with MHC class I-restricted OVA peptide (SIINFEKL)-induced robust OT-I CD8+ T cell proliferation in vitro (S. Takenaka, unpublished data). The in vivo data may be explained by the possibility of Ag transfer from CD8α− DCs to CD8α+ DCs present in the spleen or lymph nodes (42), but the in vitro data cannot be explained by this mechanism because purified T cell preparations were used in these studies. It is possible that a small number of CD8α+ colonic DCs are enough to induce proliferation of CD8+ T cells; however, they would not likely be adequate to induce the robust CD8+ T cell proliferation observed. Another possibility is that CD8α− colonic DCs are able to prime CD8+ T cells. Because the data for the specialized cross-presenting ability of CD8α+ DCs come from studies of DCs from spleen and lymph nodes (39, 40), it may be that CD8α− colonic DCs possess a unique ability to prime CD8+ T cells. In fact, a recent study shows that CD8α− DCs and not CD8α+ DCs are responsible for cross-presentation of intestinal Ag to CD8+ T cells (43). In addition, the source of Ag being cross-presented is likely to be a factor (44); thus, further studies are required to clearly understand mucosal DC cross-presentation.
Pattern recognition receptors such as TLRs provide the means for immune cells to detect a wide variety of molecules. In mice, splenic DCs have been shown to express all known TLRs (45); however, TLR expression by DCs from the colonic mucosa has not been examined in detail. Given that the mucosal surface of the gastrointestinal tract is constantly exposed to a high dose and wide variety of microorganisms (46), we can speculate that the expression of TLRs by colonic DCs would differ from that by DCs from other sites such as spleen. From a limited amount of evidence, it is thought that TLR expression in the colonic mucosa is generally low to prevent dysregulated immune induction (38). Indeed, it has been shown in healthy humans that fewer small intestinal DCs express TLR2 and TLR4 compared with blood-derived DCs (47).
We examined TLR mRNA expression by freshly isolated colonic DCs from unmanipulated naive mice. Because the cell population used in this study is heterogeneous and may contain ∼5% of other cells such as macrophages, the expression of these TLRs should be taken to represent the phenotype of colonic DCs but until highly purified and homogeneous cell populations are achieved, the data should remain indicative. Relative to DCs isolated from spleen, colonic DCs have significantly lower TLR mRNA expression. To our knowledge, this is the first report of TLR expression by murine colonic DCs and at different levels compared with spleen counterparts. Low-level expression of TLRs may make colonic DCs more tolerant to stimulation by bacterial products. From the relative mRNA expression data, we suspected that spleen DCs would respond more robustly to CpG ODN stimulation. To the contrary, colonic DCs responded more robustly by producing a significantly greater amount of IL-10 and TNF-α compared with splenic DCs. One possible explanation would be up-regulation of TLR9 by colonic DCs upon CpG ODN stimulation; however, no such TLR9 induction was observed in our study. In fact, the difference in TLR9 expression by colonic and splenic DCs diminishes upon their stimulation in vitro. From the current data, this seems to be due to reduced TLR9 mRNA expression by splenic DCs. Down-regulation of TLR4 mRNA expression has been observed upon stimulation of macrophages with LPS (48), and it is possible that similar regulation may occur for TLR9 expression by splenic DCs upon CpG ODN stimulation. Because TLR9 mRNA expression was reduced for splenic DCs cultured with medium alone, it may be that the down-regulation of TLRs is related to the maturation of DCs. Such a phenomenon has been previously observed with human monocyte-derived DCs (49, 50). In contrast, LPS stimulation has been shown to up-regulate expression of TLR2 or TLR9 by human or mouse macrophages, respectively (51, 52). This discrepancy seems to be due to length of cell stimulation, where TLR expression is up-regulated initially at early time points and down-regulated at later time points. Observed TLR9 expression down-regulation by splenic DCs is in accordance to this idea, given that the cells were incubated for a relatively long period of time. Recently, a study has shown that CD11c+ cells isolated from the small intestine lamina propria express a higher level of TLR5 and respond better to flagellin stimulation compared with those isolated from the spleen (53). This is in contrast to our finding that TLR5 is expressed at a higher level by splenic DCs than by colonic DCs. This discrepancy may suggest that DCs from the colonic tissue and small intestine have different TLR expression patterns; however, it may also be the result of difference in the cell isolation protocols.
The production of IL-10 by colonic DCs, but not by splenic DCs, in the control culture without exogenous stimulus and the greater ability of colonic DCs to produce regulatory cytokines compared with splenic DCs upon stimulation may be indicative of colonic DCs being more regulatory under steady state conditions as it has been suggested previously (54). This is in accordance with the idea that the colonic tissue is continuously exposed to bacterial products that signal via TLRs and therefore may require a greater level of immune regulation to avoid unwanted immune induction (55). DCs can regulate the immune system by secreting regulatory cytokines such as IL-10 that lead to regulatory T cell development (56, 57). Unlike IL-10, TNF-α is thought to be an inflammatory cytokine, but more recently, regulatory properties of TNF-α have also become apparent (58, 59, 60). As such, the greater level of TNF-α production by colonic DCs may also contribute toward their regulatory role in a steady state condition. Furthermore, the characteristics of colonic DCs described herein are similar to the observations for Peyer’s patch DCs, in that they preferentially produce regulatory cytokines in steady state conditions (6, 61). Such DC activity has been implicated for the induction of regulatory T cells (58, 62).
Only a small amount of IL-12p70 was produced by both colonic DCs and splenic DCs at all CpG ODN doses used in this study. This is not surprising because the production of IL-12p70 by DCs is tightly regulated. Without additional stimulation via CD40 ligation (63) or appropriate factors such as IFN-γ (63, 64) or GM-CSF (9, 65), DCs isolated from human or mouse tissues generally do not produce high levels of IL-12p70 even upon TLR ligand stimulation. Despite the small amount of IL-12p70 produced by colonic DCs, the fact that they can be induced to produce this cytokine to an extent similar to that of splenic DCs suggests that they have the ability to induce proinflammatory responses.
Taken together, murine colonic DCs isolated from unmanipulated mice generally produce slightly greater levels of cytokines upon stimulation compared with DCs isolated from spleen. It will be interesting to further examine how colonic DCs function in different conditions such as during immunization and/or infection. Also, the subpopulations of DCs distinguishable by phenotype that appear to be present in colonic tissue must be further subdivided by flow cytometric cell sorting or some other method. This will allow us to examine the possible functional specialization by each population.
In conclusion, the findings presented herein provide new insights into the nature of colonic DCs that were previously ambiguous or unknown. Moreover, these data strengthen the idea that differences exist between different lymphoid tissues and prompt us to extend our studies in this area of immunology. Studies of mucosal DCs are in an early stage, and further studies are required to gather an in-depth knowledge of this important cell population to provide guidance as to their use in therapeutic and preventative measures for various diseases.
Acknowledgments
We thank Drs. J. Bramson, A. Macpherson, and Y. Wan for their variable inputs during the preparation of the manuscript. We also extend our appreciation to Drs. M. Divangahi and G. Martin for their help in preparing the manuscript and J. Leitch for technical assistance.
Disclosures
The authors have no financial conflict of interest.
Footnotes
The costs of publication of this article were defrayed in part by the payment of page charges. This article must therefore be hereby marked advertisement in accordance with 18 U.S.C. Section 1734 solely to indicate this fact.
This work was supported by the Canadian Institute of Health Research.
Abbreviations used in this paper: DC, dendritic cell; DAPI, 4′,6′-diamidino-2-phenylindole; ODN, oligodeoxynucleotide; pDC, plasmacytoid DC.
