

Abstract
As a natural ligand for CD4, IL-16 has been shown to preferentially induce migration in Th1 cells, and, in long-term cultures with IL-2, IL-16 facilitates the expansion of CD4+CD25+ cells. In addition, IL-16 has an immunomodulatory role in asthmatic inflammation, as exogenous administration significantly reduces inflammation and airway hyperreactivity. The mechanism for this, however, is not clear. Based on its functional characteristics and potential immunomodulatory role, we investigated the ability of IL-16 to recruit and influence the development of T regulatory (Treg) cells. We now demonstrate that IL-16 preferentially induces migration in a CD25+CTLA-4+ human T cell subset and that responding cells produce IFNγ and TGFβ but not IL-10. These cells are relatively unresponsive to antigenic stimulation and can suppress proliferation and IL-5, but not IFNγ, production by autologous T cells. We further demonstrate that IL-16-recruited cells are enriched for Forkhead box P3 (Foxp3). In addition, we find that IL-16 stimulation may facilitate de novo induction of Foxp3+ Treg cells, because the stimulation of FoxP3-negative T cells for 48 h results in the expression of FoxP3 mRNA and protein. These data indicate that at sites of inflammation IL-16 may contribute to selective Treg cell expansion through the preferential induction of a migratory response from existing Treg cells, as well as by the induction of de novo generation of FoxP3+ cells. These findings offer a potential mechanism for the immunosuppressive effects of IL-16 seen in Th2-mediated inflammation.
Interleukin-16 is a pleiotropic cytokine that is a natural ligand of CD4 (1, 2), and has been identified at sites of allergic inflammation in both the murine and the human airway epithelium and bronchoalveolar lavage specimens (3, 4, 5, 6, 7). It is a known chemoattractant for CD4+ T cells, monocytes, eosinophils and dendritic cells, with preferential chemoattractant activity for the Th1 subset of CD4+ T cells (8, 9, 10, 11). IL-16 has been shown to induce the high affinity IL-2R receptor (CD25) on CD4+ T cells that imparts responsiveness to IL-2 (12, 13). In vivo studies suggest that administration of IL-16 results in the attenuation of inflammation and airway hyperreactivity (7). The mechanism for this regulatory effect on inflammation, however, has not been identified.
Recently, a number of studies have identified a role for CD4+ immunoregulatory T (Treg)3 cells in modulating inflammation associated with various types of disease ranging from autoimmune disease to allergic disorders (14, 15, 16). Treg cells have been classified into three major groups: CD4+CD25+ cells, Tr1 cells, and Th3 cells (17, 18). These cells are distinct in terms of cytokine production and suppressive function. CD4+CD25+ cells generated in the thymus, also termed natural Treg cells, secrete both IL-10 and TGFβ and have been shown by in vitro studies to be suppressive through cell-cell contact (19). Tr1 cells are inducible and develop in the periphery in the presence of high levels of IL-10. They secrete IL-10 and can inhibit the development of Th2-mediated inflammation (17, 18). Th3 cells are also inducible and develop in the periphery in association with high levels of TGFβ. These cells secrete TGFβ with variable amounts of IL-10 or IL-4 secretion (17, 18).
Stock et al. (20) and others have reported that the adoptive transfer of CD4+ Treg cells results in a significant reduction in asthmatic inflammation. Stock et al. characterized these cells as CD25+, which produce high levels of IL-10 and IFN-γ as well as express both Forkhead box P3 (FoxP3) and T-bet. These authors suggest therefore that the suppressive cells represent a Th1/Treg phenotype (20). Because IL-16 stimulation results in an increased expression of CD25, has a preferential migratory effect on Th1 cells, and has an immunosuppressive effect in a murine model of allergic asthma, we investigated whether IL-16 has any preferential migratory activity or developmental effects on Treg cells.
In this study we show that IL-16 stimulation results in enhanced migration of a T cell subpopulation that is CD25+CTLA-4+FoxP3+ and is capable of suppressing the proliferation and production of Th2 cytokines of autologous T cells. In addition, we demonstrate that IL-16 stimulation induces de novo production of FoxP3 mRNA and protein, even in the absence of detectable IL-2. These studies suggest for the first time that the presence of IL-16 may contribute to recruitment and induction of the peripheral expansion of Treg cells at sites of inflammation.
Materials and Methods
Isolation of primary human CD4+ T cells
Primary human mononuclear cells were obtained from consenting normal donors using protocols approved by the Boston University School of Medicine Institutional Review Board (Boston, MA). The cells were generated by Hypaque Ficoll (Amersham Biosciences) density centrifugation of mononuclear cell buffy coat or whole blood. Following a wash step in M199 containing 0.4% BSA and penicillin/streptomycin, the T cells were isolated by nylon wool (Polysciences) adherence and were routinely >95% CD3+ according to flow cytometry assessment. The cells were cultured overnight in M199 containing BSA/penicillin/streptomycin before conducting the chemotaxis assay. In some experiments, before chemotaxis the cells were further purified into CD4+ T cells by positive Ab and a magnetic bead isolation kit (Dynal Biotech).
Chemotaxis assays
The chemotactic activity of IL-16, MIP-1β, and RANTES was assessed by measuring lymphocyte migration through an 8-μm pore polycarbonate filter in 6-well Transwell chambers (Corning Costar). Briefly, 3 × 10⁶ freshly isolated peripheral blood human CD4+ T cells suspended in 1.5 ml of complete medium (M199 from Sigma-Aldrich containing 200 U/ml penicillin, 200 μg/ml streptomycin, 2 mM glutamine, 20 mM HEPES, and 10% FBS) were added to the top chamber. rIL-16 (10−8 M), MIP-1α (CCL3), and RANTES (CCL5) at 50 ng/ml in 2.4 ml of complete medium were added to the bottom chamber. These cytokine concentrations had been determined to induce maximal cell migration within this system. After 2 h of incubation at 37°C with 5% CO2, and 30 min of incubation at 4°C, cells in both chambers, the top chamber for nonmigrating cells and bottom one for migrating cells, were harvested and counted. The chemotactic activity was expressed as a migration index defined as the ratio of lymphocyte migration in the presence of the chemoattractant factor to the migration of lymphocytes to medium control. Because the migration to medium alone was significantly less than that in the presence of a chemoattractant, control cell migration was conducted in 3–4 separate wells to assure sufficient cell yields for migrating cells.
Flow cytometric analysis
Expression of CD4, CD25, CTLA-4, CD44, CD62L, and CD45RO were analyzed using FITC or PE fluorescently conjugated Abs (R&D Systems). Briefly, the cells were recovered from the top and bottom wells of the Transwell chamber, washed and resuspended at a concentration of 1 × 10⁶ cells/500μl in staining buffer containing PBS with 0.1% sodium azide and 1% BSA. Five microliters of the appropriate Ab was added for 30 min at 4°C before washing. The cells were analyzed using a FACScan flow cytometer (BD Biosciences), and data were processed using CellQuest software. (BD Biosciences). Intracellular staining for FoxP3 was performed using the PCH101 mAb and the FoxP3 staining kit available from eBioscience, which was used according to the manufacturer’s specifications.
Proliferation assays and ELISA quantization
The proliferative capacity of IL-16-stimulated cells from Transwell chemotaxis assays was assessed by a standard lymphocyte proliferation assay. Cells (2 × 10⁵/well) were cultured in anti-CD3-coated (1 μg/well; R&D Systems), round-bottom 96-well plates (Corning Costar) for 4 days in a humidified 37°C, 5% CO2 incubator. To assess cell proliferation, [3H]thymidine was added to the cultures at 1μCi/well for the final 24 h of culture. Cells were harvested onto glass fiber filters and [3H]thymidine incorporation was assessed using a beta scintillation counter. In parallel cultures, the cells obtained from the bottom wells (migrating cells) were stimulated with plate bound anti-CD3 Ab for 48 h and then analyzed for IL-10, TGFβ1, and IFN-γ cytokine production using ELISA kits obtained from BioSource International. Some cultures also received anti-IFN-γ Ab (5 μg/ml) (BioSource International). The Student t test was used for statistical analysis, and statistical significance was established at 5% confidence.
Suppressor assays
The suppressive capacity of transmigrated cells was assessed by their ability to inhibit anti-CD3 Ab-activated autologous human T cell proliferation. Migrating and nonmigrating cells from each Transwell condition were added at ratios of 1:1 to 1:15 to freshly isolated responder T cells for a total of 106 cells/well. Cell proliferation in these assays was determined after 4 days of culture. To assess cell proliferation, [3H]thymidine was added to cultures at 1μCi/well for the final 24 h of culture. The cells were harvested onto glass fiber filters and [3H]thymidine incorporation was assessed on a beta scintillation counter. To assess the effect of IL-16-responsive cells on cytokine generation, parallel cultures were established using a ratio of 1:10 migrating cells to freshly isolated cells in anti-CD3-coated plates. After 48 h of stimulation the supernatants were harvested and levels of IL-5 and IFN-γ were assessed by commercially available ELISA kits (BD Biosciences). Some cultures also received anti-IL-16 Ab (clone 14.1; 1–10 μg/ml) treatment at concentrations sufficient to neutralize bioactivity.
Induction of Foxp3+ Treg cells by IL-16
A FoxP3-negative population was prepared by labeling primary T cells with anti-CD127 Abs, clone IL-7R-M21 (BD Pharmingen) and anti-CD25 (clone BC96; eBioscience), and then sorting on the CD127+ (i.e., Treg-negative) cell population by flow cytometry using a DakoCytomation MoFlo cytometer. The lack of FoxP3 protein was confirmed by intracellular staining and flow cytometric analysis. These cells were then incubated with IL-16 (10−8 M) for 48 h, and FoxP3 mRNA expression was determined by quantitative real-time PCR where RNA was extracted from cells and reverse transcribed using avian myeloblastosis virus reverse transcriptase and a cDNA synthesis kit (Promega). Quantitative real-time PCR of the cDNA preparations was then performed on an ABI Prism 7000 Sequence Detection System (Applied Biosystems) using the following thermal cycling parameters: 50°C for 2 min and 95°C for 10 min followed by 40 cycles of 95°C for 30 s, 60°C for 30 s, and 72°C for 30 s. FoxP3 gene expression was detected using the Hs00203958 assay (Applied Biosystems) containing primers that generate an amplicon of 64 bp from the transcript (GenBank accession number NM_014009.2) of the human FoxP3 gene and a FAM dye-labeled TaqMan minor groove binder (MGB) probe. FoxP3 mRNA expression in each sample was calculated using the relative quantization method, with human β-actin mRNA from the same sample used as an endogenous control.
Results
Phenotype of cells migrating to IL-16
To investigate the effect of IL-16 on the chemoattraction of human T cells of a regulatory cell phenotype, Transwell chemotaxis assays were conducted on freshly isolated human CD4+ T cells. Consistent with earlier reports using a nitrocellulose filter-based assay (2, 12), IL-16-stimulated cells demonstrated a consistently increased migratory response compared with cells stimulated with medium alone. A dose response indicated that peak migration was obtained with IL-16 at a concentration of 1 × 10⁻⁸ M (average migration index of 3.4 ± 0.4). The magnitude of this migratory response was comparable to the peak response induced by MIP-1β and RANTES (50 ng/ml for both; peak migration index 3.2 ± 0.3 and 3.5 ± 0.5, respectively). MIP-1β and RANTES were used for comparison because the migratory responses are also either selective (MIP-1β) or inclusive (RANTES) for Th1-type cells, and the magnitude of the responses have been shown to be comparable to those of IL-16 (11).
Having established conditions that resulted in a consistent migratory response to IL-16, surface phenotype of the responding cells were assessed by FACS analysis. Using a panel of Abs to cell surface markers, it was determined that IL-16 induced migration preferentially in cells expressing CD25 and CTLA4 when compared with cells migrating to medium alone, RANTES, or MIP-1β (Fig. 1 and Table I). Additional staining of the IL-16-responding cell population demonstrated that 73 ± 6% were CCR5+, 90 ± 10% were CD44+, 25 ± 8% were CD62L+, and 65 ± 7% were CD45RO+, suggesting a primarily Th1 effector population (data not shown). Interestingly, RANTES stimulation resulted in an increase in migration of CD25+ cells; however the percentage of cells expressing CTLA-4 remained unchanged compared with cells migrating to medium alone. Because CD25 and CTLA-4 have classically been identified with Treg cells, these findings suggested for the first time a preferential effect of IL-16 on a subset of CD4+ T cells of the Treg phenotype. However, surface markers are not a consistent predictor of Treg function, and a demonstration of a lack of direct proliferation as well as immunosuppressive activity of autologous T cells is necessary before the Treg phenotype can be confirmed.

Expression of CD25 and CTLA-4 for cells migrating in response to IL-16, RANTES, or medium alone (Control). Following the migration assay where human CD4+ T cells were stimulated with either IL-16 (10−8 M), RANTES (50 ng/ml), or control buffer alone, the cells were harvested from the bottom (migrating) chambers and labeled with fluorescently conjugated Abs to CD25 and CTLA-4. Staining was assessed by flow cytometry. This is a representative profile of 10 separate experiments. The averaged numbers from all the experiments (n = 10 different donors) are shown in Table I.
Expression of CD25 and CTLA-4 for cells migrating in response to IL-16, RANTES, or medium alone (Control). Following the migration assay where human CD4+ T cells were stimulated with either IL-16 (10−8 M), RANTES (50 ng/ml), or control buffer alone, the cells were harvested from the bottom (migrating) chambers and labeled with fluorescently conjugated Abs to CD25 and CTLA-4. Staining was assessed by flow cytometry. This is a representative profile of 10 separate experiments. The averaged numbers from all the experiments (n = 10 different donors) are shown in Table I.
Chemotaxis of T cellsa
| Chemoattractant | Percentage of Positive Cells | ||||
|---|---|---|---|---|---|
| CD25 | CTLA-4 | Migrating Cells (×104/ml) | |||
| Control | |||||
| Top | 4 ± 2 | 8 ± 1 | |||
| Bottom | 5 ± 2 | 7 ± 2 | 2.3 | ||
| IL-16 | |||||
| Top | 7 ± 1 | 5 ± 2 | |||
| Bottom | 18 ± 4b | 15 ± 3b | 31.3b | ||
| MIP-1β | |||||
| Top | 6 ± 2 | 8 ± 3 | |||
| Bottom | 7 ± 1 | 8 ± 2 | 31.1b | ||
| RANTES | |||||
| Top | 5 ± 3 | 7 + 3 | |||
| Bottom | 11 ± 3b | 7 ± 1 | 29.6b | ||
Phenotype of responding cells by selective chemoattractants. Human T cells were harvested from the top and bottom chambers of a Transwell migration assay and stained for expression of membrane markers associated with Treg cells. Cell counts for migrating cells represent cells collected from the bottom well for each condition. Cells (3 × 10⁶) were loaded onto the upper well for each condition at the start of the migration assay. All numbers are average values obtained from four separate wells for each condition per experiment. Each experiment was conducted 10 separate times using different donors. The asterisk (
) denotes values significantly different from corresponding control values, p< 0.05.
Direct proliferative responses of migratory and nonmigratory cells
We then characterized those cells migrating to IL-16 with respect to their ability to proliferate following direct stimulation by anti-CD3 Ab. As shown in Fig. 2, cells that had migrated to IL-16 were consistently unresponsive to mitogenic stimulation in culture when compared with nonmigrating cells or to cells that had responded to MIP-1β or RANTES. The ability of MIP-1β- or RANTES-induced cells to proliferate comparably to control cells indicates that the act of motility alone does not affect the proliferative response and indicates further that IL-16-induced cells contain a select subpopulation.
![FIGURE 2. Proliferative responses of cells migrating to IL-16, MIP-1β, or RANTES. Following Transwell migration to IL-16 (10−8 M), MIP-1β (MIP-1b) and RANTES (both at 50 ng/ml), or to control buffer, human CD4+ T cells were stimulated for proliferation. T cells (1 × 10⁵) from both the migrating and nonmigrating populations for each stimulant were collected and assessed for proliferative responsiveness to anti-CD3 Ab (1 μg/ml) stimulation. The filled bars represent the proliferation of migration-responsive cells obtained from the bottom wells, whereas the open bars represent nonmigratory cells that were harvested from the top wells. The data are expressed as average values from four separate experiments. For each experiment the cells were cultured for 4 days before pulsing with [3H]thymidine for 18 h. The asterisk (∗) denotes significantly different proliferation compared with control conditions, p < 0.05.](https://aai.silverchair-cdn.com/aai/content_public/journal/jimmunol/179/10/10.4049_jimmunol.179.10.6439/3/m_zim0220760850002.jpeg?Expires=1716305444&Signature=jnMqKjrzYfVE3abd0Inb~X4LbmkgCW8jYNA7m5c-LH3KPMKAONPHx3XWqMMxH2jiUKbxEBgHdwurrVZwH50w09WTCVc7~ec-Uybs8HaDVmKffXF0M2MCvgE~9Uzhuc7m5Ph5s9WIEt8r3rcOVv3T9YnxTtDu6IcKO2ATKDTsk9Yzuss85qBrC40jfmz4o27lieeyDYmTLJJNjUwKNFoqFgW-8qH5xvw~p8bn-OCQ~JWxx147UiT1nR1qhXe6GMqFbHy2YSb1XB-6ulIpGBtL6XqTigxk6-8GLYPmv6oSdq6R30WdS4adwktnTGTarntXMvRp0WVVrel4zOctR--Csw__&Key-Pair-Id=APKAIE5G5CRDK6RD3PGA)
Proliferative responses of cells migrating to IL-16, MIP-1β, or RANTES. Following Transwell migration to IL-16 (10−8 M), MIP-1β (MIP-1b) and RANTES (both at 50 ng/ml), or to control buffer, human CD4+ T cells were stimulated for proliferation. T cells (1 × 10⁵) from both the migrating and nonmigrating populations for each stimulant were collected and assessed for proliferative responsiveness to anti-CD3 Ab (1 μg/ml) stimulation. The filled bars represent the proliferation of migration-responsive cells obtained from the bottom wells, whereas the open bars represent nonmigratory cells that were harvested from the top wells. The data are expressed as average values from four separate experiments. For each experiment the cells were cultured for 4 days before pulsing with [3H]thymidine for 18 h. The asterisk (∗) denotes significantly different proliferation compared with control conditions, p < 0.05.
Proliferative responses of cells migrating to IL-16, MIP-1β, or RANTES. Following Transwell migration to IL-16 (10−8 M), MIP-1β (MIP-1b) and RANTES (both at 50 ng/ml), or to control buffer, human CD4+ T cells were stimulated for proliferation. T cells (1 × 10⁵) from both the migrating and nonmigrating populations for each stimulant were collected and assessed for proliferative responsiveness to anti-CD3 Ab (1 μg/ml) stimulation. The filled bars represent the proliferation of migration-responsive cells obtained from the bottom wells, whereas the open bars represent nonmigratory cells that were harvested from the top wells. The data are expressed as average values from four separate experiments. For each experiment the cells were cultured for 4 days before pulsing with [3H]thymidine for 18 h. The asterisk (∗) denotes significantly different proliferation compared with control conditions, p < 0.05.
Suppressive effects of IL-16-induced migratory and nonmigratory cells
The primary function of Treg cells is to suppress the proliferation of autologous T cells, thus significantly increasing their ability to regulate inflammation. To address this, IL-16-responsive and nonresponsive cells were washed three times and then added, at a ratio of 1:10, to freshly isolated T cells to determine their ability to suppress proliferation. Cultures that received IL-16-responsive cells, but not those that received IL-16-nonresponsive cells or cells obtained following MIP-1β or RANTES stimulation, demonstrated reduced proliferation to anti-CD3 stimulation (Fig. 3). The suppressive effect of the IL-16-responsive cells was also dose dependent, as suppression was observed at ratios of 1:1, 1:5, and 1:10; however, the effect was not detected in cultures at a ratio of 1:15. These findings demonstrate that IL-16 induces migration in a population of CD4+ T cells that are phenotypically and functionally consistent with the general classification of Treg cells. IL-16 alone has been shown to have suppressive activity (21, 22) and, despite extensive washing of migratory cells before coculture, we wanted to eliminate any potential direct effects of residual IL-16 in the suppression assay. To address this, we repeated the migration assay and then conducted the coculture assays in the presence of 1–10 μg/ml neutralizing anti-IL-16 Ab (clone 14.1). For all concentrations of Ab used, the suppressive effect induced by the migratory cells was not affected (data not shown), indicating that direct effects of IL-16 on T cell proliferation were not involved.
![FIGURE 3. Suppressive effects of IL-16-responsive cells. Migrating and nonmigrating cells were obtained from Transwell plates following stimulation with IL-16, MIP-1β (MIP-1b), RANTES, or buffer control. The harvested migratory cells were cocultured with autologous mixed T cells at ratios of 1:1 (right hashed bars), 1:5 (horizontal bars), 1:10 (filled bars), and 1:15 (left hashed bars) for a total of 1 × 10⁶ cells/well. Cells obtained from the top chamber (nonmigratory) for each stimulant were cocultured at a ratio of 1:1 (open bars). A, The proliferative responses in cultures that were stimulated with plate-bound anti-CD3 Ab (1 μg/ml) for 4 days before pulsing with [3H]thymidine for 18 h. B, Production of IL-2 obtained in parallel cultures. These cultures were conducted in 48-well plates for 48 h before assessing the cell supernatant for IL-2 by ELISA. Both assays were conducted on cells obtained from 10 different donors. The asterisk (∗) denotes being statistically different from control conditions, p < 0.05.](https://aai.silverchair-cdn.com/aai/content_public/journal/jimmunol/179/10/10.4049_jimmunol.179.10.6439/3/m_zim0220760850003.jpeg?Expires=1716305444&Signature=o0lxtzYROu3QyG64oOpEvdi5dh7Fkw5QfBOxE8Di2DCZvXzt9a00xYU9C0907HF7Q-hRYNnHM-zR1Bidf3jW2bcGQM3SMy1yB6JMx800xWV4kOwLqUbzyPRuZxLKOaKXgQ4DDpVNXgaUvRmiH44GJ0pRXMf5NpGoX5UirSj7F9bjOXdzuu80sf5oVs8kCMPB7zNA3H6bODzBNEfyw9knLnc-aqLz5-kcLaaVwxAVYK9R04Ew5b9uRjyhPoeQ4TEW4pT44brqKDJSfoYYKs48CAh~uSIwthQDGtKLYIMcCjVa0mmv-1huexWLy9EYnD1FL~DqgbU~ohtkIom9hvu5sw__&Key-Pair-Id=APKAIE5G5CRDK6RD3PGA)
Suppressive effects of IL-16-responsive cells. Migrating and nonmigrating cells were obtained from Transwell plates following stimulation with IL-16, MIP-1β (MIP-1b), RANTES, or buffer control. The harvested migratory cells were cocultured with autologous mixed T cells at ratios of 1:1 (right hashed bars), 1:5 (horizontal bars), 1:10 (filled bars), and 1:15 (left hashed bars) for a total of 1 × 10⁶ cells/well. Cells obtained from the top chamber (nonmigratory) for each stimulant were cocultured at a ratio of 1:1 (open bars). A, The proliferative responses in cultures that were stimulated with plate-bound anti-CD3 Ab (1 μg/ml) for 4 days before pulsing with [3H]thymidine for 18 h. B, Production of IL-2 obtained in parallel cultures. These cultures were conducted in 48-well plates for 48 h before assessing the cell supernatant for IL-2 by ELISA. Both assays were conducted on cells obtained from 10 different donors. The asterisk (∗) denotes being statistically different from control conditions, p < 0.05.
Suppressive effects of IL-16-responsive cells. Migrating and nonmigrating cells were obtained from Transwell plates following stimulation with IL-16, MIP-1β (MIP-1b), RANTES, or buffer control. The harvested migratory cells were cocultured with autologous mixed T cells at ratios of 1:1 (right hashed bars), 1:5 (horizontal bars), 1:10 (filled bars), and 1:15 (left hashed bars) for a total of 1 × 10⁶ cells/well. Cells obtained from the top chamber (nonmigratory) for each stimulant were cocultured at a ratio of 1:1 (open bars). A, The proliferative responses in cultures that were stimulated with plate-bound anti-CD3 Ab (1 μg/ml) for 4 days before pulsing with [3H]thymidine for 18 h. B, Production of IL-2 obtained in parallel cultures. These cultures were conducted in 48-well plates for 48 h before assessing the cell supernatant for IL-2 by ELISA. Both assays were conducted on cells obtained from 10 different donors. The asterisk (∗) denotes being statistically different from control conditions, p < 0.05.
To confirm the suppressive effect of the IL-16-responsive cells on autologous T cell activation, IL-2 protein was assessed in the culture supernatant. As shown in Fig. 3 and consistent with the proliferation data, the addition of IL-16-responsive cells, at a ratio of 1:10 significantly reduced the level of detectable IL-2 protein. As expected, this effect was also present for the 1:1 and 1:5 cultures but not present for the 1:15 cultures (data not shown). There was no effect on IL-2 levels in cultures receiving cells following control, MIP-1β, or RANTES stimulation.
Cytokine determination of IL-16-transmigrating cells
A variety of Treg cells have been identified and categorized primarily based on cytokine production. The two major cytokines produced as a result of Treg cell activation are IL-10 and TGFβ. To further characterize IL-16 responsive cells by cytokine production, IL-10 and TGFβ were assessed as well as the Th1-predominant cytokine IFN-γ. Following migration in the Transwell chemotaxis assay, cells were harvested and stimulated by plate-bound anti-CD3 Ab for 24–48 h. The cytokines were quantified by ELISA and, as shown in Fig. 4, IL-16-transmigrating cells secreted significantly increased levels of TGFβ, but there was no change in the production of IL-10. In addition to TGFβ, there was also a significant increase in IFN-γ production by IL-16-responsive cells, consistent with a preferential response by Th1 cells (11). There was no selective recruitment for TGFβ-producing cells following stimulation by either MIP-1β or RANTES (data not shown). As expected, MIP-1β induced the migration of IFN-γ-producing cells.

Cytokine production by migratory and nonmigratory T cells. Following chemotaxis induced by IL-16, MIP-1β (MIP-1b), or control buffer alone, 1 × 10⁶ migratory or nonmigratory T cells were stimulated with plate-bound anti-CD3 (1 μg) for 48 h. The cytokine TGFβ, IL-10, or IFN-γ (IFNg) was then assessed in the supernatants by a commercial ELISA kit. The data represent the average values obtained from six different experiments using six different donors. The asterisk (∗) denotes significantly different cytokine values as compared with control conditions, p < 0.05.
Cytokine production by migratory and nonmigratory T cells. Following chemotaxis induced by IL-16, MIP-1β (MIP-1b), or control buffer alone, 1 × 10⁶ migratory or nonmigratory T cells were stimulated with plate-bound anti-CD3 (1 μg) for 48 h. The cytokine TGFβ, IL-10, or IFN-γ (IFNg) was then assessed in the supernatants by a commercial ELISA kit. The data represent the average values obtained from six different experiments using six different donors. The asterisk (∗) denotes significantly different cytokine values as compared with control conditions, p < 0.05.
Selective inhibitory effect on Th2 cytokine production
We next characterized IL-16-transmigrating cells with respect to their ability to inhibit cytokine production. Cells were harvested following migration to IL-16 or under control conditions (buffer alone). Similar to the proliferation studies (Fig. 2), all cells were extensively washed and then cultured on anti-CD3-coated plates at a ratio of 1:10 with freshly isolated autologous T cells. After 48 h of stimulation, the cytokines IL-5 and IFN-γ were assessed by ELISA and compared with production by T cells that had not undergone migration, used as a positive control. As shown in Fig. 5, IL-16-recruited cells were inhibitory for IL-5 production; however, they had no significant effect on IFN-γ production. The inhibitory effect on IL-5 was not attributable to IFN-γ production, as the addition of neutralizing concentrations of anti-IFN-γ (5 μg/ml) did not alter IL-5 production (data not shown). This suggests a selective regulatory effect on Th2 cells and may explain in part previous observations on the ability of IL-16 treatment to selectively inhibit Th2, but not Th1, cytokine production (7, 23, 24).

Effect of IL-16 responsive cells on autologous cell generation of IL-5 and IFN-γ (IFNg). IL-16-responsive cells or cells stimulated with control buffer alone were cultured with freshly isolated autologous T cells at a 1:10 ratio on anti-CD3 coated plates (1 μg/ml) for 48 h. A total of 1 × 10⁶ cells/well were used. The supernatants were harvested and assessed by ELISA for IL-5 (filled bars) and IFN-γ (open bars) production. The data represent the average values for five separate experiments. Note: for graphing purposes the detection of IFN-γ was conducted on supernatants that had been diluted 1:10 before ELISA detection. The asterisk (∗) denotes significant difference from control for medium stimulation for each cytokine, p < 0.05.
Effect of IL-16 responsive cells on autologous cell generation of IL-5 and IFN-γ (IFNg). IL-16-responsive cells or cells stimulated with control buffer alone were cultured with freshly isolated autologous T cells at a 1:10 ratio on anti-CD3 coated plates (1 μg/ml) for 48 h. A total of 1 × 10⁶ cells/well were used. The supernatants were harvested and assessed by ELISA for IL-5 (filled bars) and IFN-γ (open bars) production. The data represent the average values for five separate experiments. Note: for graphing purposes the detection of IFN-γ was conducted on supernatants that had been diluted 1:10 before ELISA detection. The asterisk (∗) denotes significant difference from control for medium stimulation for each cytokine, p < 0.05.
Thus, in addition to expressing a Treg surface phenotype, these data demonstrate that cells migrating to IL-16 show typical functional characteristics of human Treg cells with a cytokine profile previously shown to be associated with Treg cell function (25, 26, 27). Although not an absolute requirement, most Treg cells appear to express the FoxP3 transcription factor (28, 29). We next determined whether IL-16 stimulation could enrich for cells expressing FoxP3. This was assessed at both the message and the protein level.
Assessment of FoxP3 mRNA and protein expression in IL-16 responsive cells
FoxP3, a member of the Forkhead transcription factor family, has been identified as a master-switch in Treg cell differentiation (28, 29, 30). FoxP3 mRNA expression in IL-16-responsive cells was first quantified by real-time PCR, with results normalized to the expression of endogenous human β-actin. As shown in Fig. 6, cells migrating to IL-16 showed a significant increase in FoxP3 mRNA expression when compared with cells that were unresponsive to IL-16. There was also no change in FoxP3 mRNA in cultures stimulated by either control buffer alone or by MIP-1β (Fig. 6). These findings were confirmed when migrating cells were assessed for intracellular expression of FoxP3 protein (Fig. 6). It was determined that, within the CD4+ T cell population of migrating cells under control conditions, ∼3% were FoxP3+. This percentage was identical with that seen in the nonmigrating population (data not shown). IL-16-responsive cells, however, demonstrated a 3-fold increase in CD4+FoxP3+ cells to ∼9.5% (Fig. 6). MIP-1β stimulation, while inducing comparable total T cell migration as IL-16, did not affect selective recruitment of FoxP3+ cells. Similarly, RANTES stimulation had no effect on enrichment for FoxP3+ cells (data not shown).
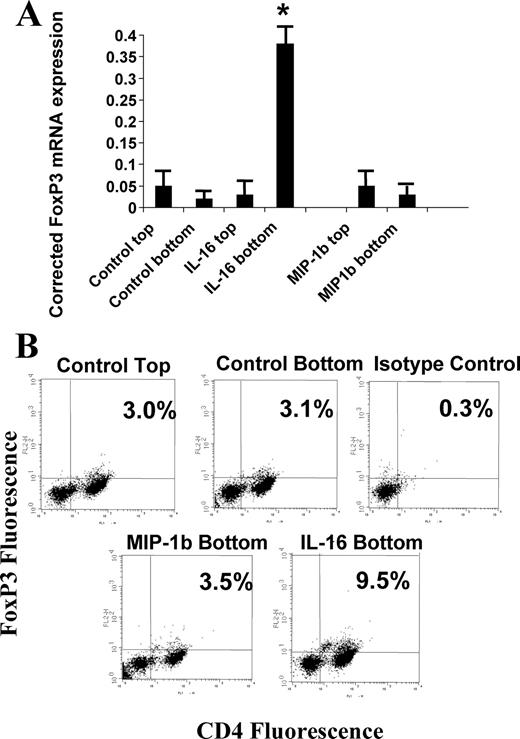
FoxP3 expression in IL-16- and MIP-1β-responsive cells. A, Following migration to IL-16 or MIP-1β (MIP-1b), responsive and nonresponsive T cells were assessed for FoxP3 mRNA by quantitative real-time PCR. The values expressed have been normalized to human β-actin message levels. The data represents the average values for six separate experiments. The asterisk (∗) denotes significantly different levels as compared with values obtained from control cells for each condition. B, Representative FACS plot for cells stained for surface expression of CD4 (x axis) and intracellular levels of FoxP3 protein (y axis). The pattern for FoxP3 expression in the panel labeled “Control Top” (3.0% CD4+FoxP3+ cells) was similar to the staining pattern observed for cells obtained from the top chamber following migration induced by both IL-16 and MIP-1β. The regions for CD4+ and FoxP3+ cells were established using isotype control Abs for both proteins.
FoxP3 expression in IL-16- and MIP-1β-responsive cells. A, Following migration to IL-16 or MIP-1β (MIP-1b), responsive and nonresponsive T cells were assessed for FoxP3 mRNA by quantitative real-time PCR. The values expressed have been normalized to human β-actin message levels. The data represents the average values for six separate experiments. The asterisk (∗) denotes significantly different levels as compared with values obtained from control cells for each condition. B, Representative FACS plot for cells stained for surface expression of CD4 (x axis) and intracellular levels of FoxP3 protein (y axis). The pattern for FoxP3 expression in the panel labeled “Control Top” (3.0% CD4+FoxP3+ cells) was similar to the staining pattern observed for cells obtained from the top chamber following migration induced by both IL-16 and MIP-1β. The regions for CD4+ and FoxP3+ cells were established using isotype control Abs for both proteins.
Induction of FoxP3+ cells by IL-16
Previous studies have indicated that IL-16 stimulation results in expression of CD25 (13). Although these cells were considered to be activated T cells, they produced little cytokine and, despite the addition of IL-2, grew at a slow rate even when stimulated with anti-CD3. This finding suggested the presence of Treg cells within the cultures. To determine the effect of IL-16 on development of Treg cells, primary T cells were cultured with IL-16 for 48 h and then FoxP3 expression was assessed by quantitative real-time PCR and protein expression. As shown in Fig. 7, the addition of IL-16 to the cultures resulted in an increase in the FoxP3 message. To confirm the real-time PCR findings and to determine the percentage of FoxP3+ cells, the cells were also stained for intracellular expression of FoxP3 protein. It was determined that, following IL-16 stimulation, the percentage of FoxP3+ cells increased 4-fold from 3% to ∼12%. As expected, only the CD4+ population demonstrated an increase. The increase was not altered by the addition of 5 μg of anti-IL-2 neutralizing Ab (data not shown) and there was no additional increase by adding IL-2 (10 U/ml) (Fig. 7), suggesting that, unlike factors such as TGFβ that required IL-2 for induction of FoxP3 (30), IL-16 alone appeared to be sufficient. In the event that IL-2 was produced endogenously following IL-16 stimulation, we also assessed IL-2 levels by ELISA. Using this approach, no IL-2 protein was detected (lower detection limit of 7 pg/ml).

Induction of FoxP3+ cells by IL-16. Human T cells (2 × 10⁶) were cultured in the presence of IL-16 (10−9 M) or IL-16 + IL-2 (50 U/ml). A, Relative quantization of FoxP3 mRNA by real-time PCR following 6 h of incubation with IL-16 or IL-16 plus IL-2 (IL-16+IL-2) or under control conditions. The values have been normalized to human β-actin levels. These are average values obtained from four separate experiments. The asterisk (∗) denotes significantly different values compared with unstimulated (control) values, p < 0.05. B, Increase in FoxP3 protein staining following incubation with IL-16 or IL-16 plus IL-2 or under control conditions for 48 h. Following incubation, the cells were harvested and stained for surface expression of CD4 and intracellular levels of FoxP3 protein using anti-FoxP3 Ab and assessed by FACS analysis. These are representative graphs from five separate experiments.
Induction of FoxP3+ cells by IL-16. Human T cells (2 × 10⁶) were cultured in the presence of IL-16 (10−9 M) or IL-16 + IL-2 (50 U/ml). A, Relative quantization of FoxP3 mRNA by real-time PCR following 6 h of incubation with IL-16 or IL-16 plus IL-2 (IL-16+IL-2) or under control conditions. The values have been normalized to human β-actin levels. These are average values obtained from four separate experiments. The asterisk (∗) denotes significantly different values compared with unstimulated (control) values, p < 0.05. B, Increase in FoxP3 protein staining following incubation with IL-16 or IL-16 plus IL-2 or under control conditions for 48 h. Following incubation, the cells were harvested and stained for surface expression of CD4 and intracellular levels of FoxP3 protein using anti-FoxP3 Ab and assessed by FACS analysis. These are representative graphs from five separate experiments.
The increase in FoxP3+ cells following IL-16 stimulation could represent an expansion of existing FoxP3+ cells or an induction of de novo FoxP3+ cells. To address this, we sorted CD4+ T cells using CD127 as a marker of non-Treg cells as recently reported (31, 32). As shown in Fig. 8, most T cells are CD127+. Treg cells have been characterized as CD127lowCD25high (Fig. 8, region 1) (31, 32). To eliminate potential contamination with CD127low Treg cells (Fig. 8, region 1), cells expressing the highest level of CD127 were sorted (Fig. 8, region 2). Sorted cells from both regions were assessed for FoxP3 mRNA by quantitative real-time PCR, and cells from region 2 were found to have very low to undetectable levels while cells from region 1 had detectable levels (Fig. 8). Cells from both regions were then cultured with IL-16 (10−8 M) for 48 h and FoxP3 mRNA was assessed. As shown in Fig. 8, IL-16 stimulation resulted in an increase in FoxP3 mRNA in both cell groups as compared with human β-actin, indicating that IL-16 stimulation results in the de novo induction of FoxP3 as well as the increase in expression in FoxP3+ cells. Taken together, these data suggest that IL-16 stimulation can facilitate the recruitment of FoxP3+ Treg cells and, in addition, functions to induce de novo generation of FoxP3 mRNA, which is necessary for peripheral expansion.

Induction of FoxP3 mRNA from CD127highCD25low and CD127lowCD25high+ cells. To obtain a relatively FoxP3-negative population, human CD4+ T cells were labeled for surface expression of CD25 and CD127. A, Representative plot of CD127 and CD25 staining with regions identified that were used for sorting. Sorting was accomplished using a DakoCytomation MoFlo cytometer. Region 1 represents CD127lowCD25high cells that have been shown to express FoxP3 while region 2 identifies CD127highCD25low cells known to lack FoxP3. B, Scatterplot of the quantitative real-time PCR assessment of sorted cells for both region 1 and region 2 for the expression of FoxP3 mRNA before and after IL-16 stimulation. The cells were stimulated with IL-16 (10−8 M) for 48 h before assessment. Cells from five different donors were used; however, region 1 was assessed on only four of the donors. All values have been normalized to human β-actin levels. The horizontal bars represent average values for each group whereas the asterisk (∗) denotes being significantly different from unstimulated cells at the 5% confidence level.
Induction of FoxP3 mRNA from CD127highCD25low and CD127lowCD25high+ cells. To obtain a relatively FoxP3-negative population, human CD4+ T cells were labeled for surface expression of CD25 and CD127. A, Representative plot of CD127 and CD25 staining with regions identified that were used for sorting. Sorting was accomplished using a DakoCytomation MoFlo cytometer. Region 1 represents CD127lowCD25high cells that have been shown to express FoxP3 while region 2 identifies CD127highCD25low cells known to lack FoxP3. B, Scatterplot of the quantitative real-time PCR assessment of sorted cells for both region 1 and region 2 for the expression of FoxP3 mRNA before and after IL-16 stimulation. The cells were stimulated with IL-16 (10−8 M) for 48 h before assessment. Cells from five different donors were used; however, region 1 was assessed on only four of the donors. All values have been normalized to human β-actin levels. The horizontal bars represent average values for each group whereas the asterisk (∗) denotes being significantly different from unstimulated cells at the 5% confidence level.
Discussion
As is the case for all leukocytes, Treg cell accumulation is likely determined by the expression of a limited repertoire of chemotactic factor receptors, the local secretion of the cognate ligands, and the selective expression of tissue-specific adhesion molecules. To date, the chemokine receptors CCR4 and CCR8 have been identified on Treg cells with responses to CCL22 (MDC), CCL17 (TARC), CCL1 (I-309), and viral MIP-1 (33, 34). Our data would also indicate that IL-16 has chemoattractant activity for Treg cells, because FoxP3+ immunosuppressive cells were enriched by IL-16 but not by MIP-1β or RANTES despite comparable overall migratory effects.
The IL-16-recruited cell population has the phenotype of other described Treg cells with increased expression of CD25 and CTLA-4. However, likely the best marker is expression of the Treg-specific transcription factor FoxP3. In the short-term chemotaxis assay, IL-16 induced migration in a population of cells that were enriched for FoxP3. These cells were hyporesponsive to direct mitogenic stimulation and suppressive in nature for autologous cell activation. Although the exact cell source has not been identified, the IL-16-responding cell population produced higher levels of TGFβ as compared with nonresponsive cells or cells that responded to other chemoattractants such as RANTES and MIP1β. Interestingly, there was no alteration in detectable IL-10 produced by these cells. There also appears to be a selective inhibitory effect by these cells, because IL-5 production was blocked in the add-back experiments whereas the production of IFN-γ was not affected. Inhibition of IL-5 production was independent of the effects of IFN-γ, suggesting the presence of some other Th2-selective mechanism. This is consistent with previous reports demonstrating the preferential effect of IL-16 on Th1 cell migration (11) and the selective inhibition of Th2 cytokines (23, 24).
Previous work had demonstrated that IL-16, in combination with IL-2, could induce in vitro expansion of hyporesponsive CD25+ cells (13). We now demonstrate that the exposure of a primary T cell population to IL-16 for 24–48 h results in an increase of up to 4-fold in FoxP3+ cells. This effect indicates that IL-16 cannot only induce the enrichment of Treg cells through migratory recruitment but that longer-term stimulation of naive T cells by IL-16 enhances the expression of FoxP3. The observed expansion of FoxP3+ cells could arise from either de novo induction of the FoxP3 gene or by increased proliferation and survival by existing FoxP3+ cells. The isolation and stimulation of CD127highFoxP3low to negative cells by IL-16 suggest that the overall effect is at least in part due to de novo induction. Based on the limits of detection for FoxP3 mRNA by quantitative real-time PCR, the sorted CD127high population was FoxP3 low or negative depending on the donor and demonstrated an increase in FoxP3 mRNA following IL-16 stimulation. Although these data are suggestive of de novo induction, this concept will need to be confirmed by studies investigating the effects of IL-16 stimulation on the FoxP3 promoter.
Interestingly, the induction of Foxp3 by IL-16 was detected in the absence of exogenously added IL-2. This is distinct from studies using TGFβ, which identified the requirement of IL-2 for Foxp3 induction (35). Although no IL-2 was added, there was also no endogenously produced IL-2 detected by ELISA. In addition, culturing in the presence of anti-IL-2 Ab had no effect. This suggests that the IL-16 effect on Foxp3 expression is independent of IL-2. This concept is further supported by the findings that IL-16 stimulation inhibits IL-2 production by activated T cells (36). In addition, studies have now identified the role of IL-2 for Foxp3 expression as primarily for maintaining the homeostatic state of natural CD4+CD25+ Treg cells; however, it is not required for the induction phase (37, 38).
IL-16 protein is detected at various inflammatory sites in association with a number of different disease states (39, 40, 41, 42, 43). Using animal models, it has been reported that blocking IL-16 bioactivity with neutralizing Abs results in the attenuation of inflammation in inflammatory bowel disease (44), delayed-type hypersensitivity (42), and experimental autoimmune encephalomyelitis (45). Conversely, exogenous administration of IL-16 protein results in the decrease of inflammation as well as airway hyperreactivity in a murine model of allergic airway inflammation (7). Interestingly the diseases in which anti-IL-16 Ab treatment is beneficial are generally classified as Th1-mediated, whereas IL-16 treatment is beneficial in Th2-mediated diseases. The data presented in the current study may identify a potential mechanism that would be consistent with these reported studies. Taken together, our data suggest the potential of IL-16 to recruit CD4+ T cells that are primarily Th1, including a preferential effect on Treg cells that have the ability to inhibit Th2 cell activation without affecting Th1 cell activity. The concept of Th1-type Treg cells in asthmatic inflammation has been demonstrated by Stock et al. (20), and the high levels of IL-16 found in asthmatic lungs (4) may provide a potential mechanism that could in part contribute to the accumulation of these cells. However, additional studies are required to more fully elucidate the IL-16-responsive cell populations in vitro and then to address selective T cell subset recruitment and expansion in various animal models of disease.
Disclosures
William Cruikshank and David Center are listed on patents regarding bioactivities of IL-16.
Footnotes
The costs of publication of this article were defrayed in part by the payment of page charges. This article must therefore be hereby marked advertisement in accordance with 18 U.S.C. Section 1734 solely to indicate this fact.
This work was supported in part by National Institutes of HealthGrants HL32802, AI35680, and AI50516.
Abbreviations used in this paper: Treg, immunoregulatory T; FoxP3T, Forkhead box P3.
