Impact of Climate Variability on Crop Yields in Southern Togo
Received: 04-Jan-2018 / Accepted Date: 08-Feb-2018 / Published Date: 16-Feb-2018 DOI: 10.4172/2573-458X.1000148
Abstract
The objectives of this study were to investigate the trend in monthly and annual precipitation, minimum and maximum air temperature using the Mann-Kendall test and Sen’s slope estimator and to evaluate the impact of precipitation and temperature variability on crop yields in southern Togo using multiple regression analysis. Monthly precipitation and temperature for four weather stations were collected from 1970 to 2014. A non-significant increasing trend in annual precipitation (P>0.05) was noticed in Atakpamé, Lomé and Tabligbo, while Kouma-konda revealed a non-significant decreasing trend (P>0.05). During the growing season, July had the highest precipitation (208.7 mm) in Atakpamé, June had the highest precipitation in Lome (198.5 mm) and Tabligbo (158.7 mm). Amongst the locations, Kouma-konda has the highest monthly precipitation (226.2 mm) obtained in June. There was a significant increasing trend (P<0.0001) in Tmin and Tmax at all locations except in Kouma-konda where Tmax has decreased insignificantly. In Atakpame and Tabligbo, the precipitation and temperature have non-significant effect on the crop yields with very low coefficient of determination ranging from 0.024 to 0.107. In Kouma-konda, the increase of temperature has significant effect on maize and bean. Therefore, climate projection studies and adaptation strategies for agriculture are recommended for yield stability in locations where crops are affected by climatic variability.
Keywords: Trend analysis; Mann-Kendall test; Theil-Sen estimator; Multiple regression
Introduction
Rain fed agriculture constitutes the prime sector in Togo that governs the rural economy, given its contribution to gross domestic product (GDP), employment, and food supply. It represents about 38.8% of GDP in 2013 and 41.7% of GDP in 2014, sustains two thirds of the population and provides more than 20% of export earnings [1]. The sector plays critical roles in the national strategy for hunger reduction and poverty alleviation. Food crops are the main agricultural economy subsector in Togo and represents 68% of the country's agricultural GDP [2]. Togolese diet is based mainly on corn (Zea mays), rice (Oryza sativa), cassava (Manihot esculenta) and cowpea (Vigna unguiculata). Climate is the most important factor that governs food production and causes interannual variability in socio economic and environmental systems related to the availability of water resources [3]. Climate change is referred as a change in average weather conditions or long-term variation in climate variables. According to the Intergovernmental Panel on Climate Change (IPCC) Fifth Assessment Report (AR5), the global surface mean temperature (Tmean) rose by 0.85°C during the 1880-2012 period, which is likely due to the observed increase in anthropogenic greenhouse gas concentrations [4]. In fact, global near-surface air temperatures have increased at a rate unequal to any other periods on record including paleo periods [5,6]. Such increases have substantial consequences on precipitation and its variability, especially drought and flood episodes in both the tropics and the subtropics [7,8]. The developing countries rely more on agriculture. They are more likely to be affected by climate change making the climate variability a developing countries issue in recent time because of its largely harmful impacts on agriculture. The main climate risks facing West Africa are combination of flooding, drought, poor distribution of rain, late rains, violent winds and coastal erosion. High population growth, deforestation, very traditional agriculture techniques and improper use of land have resulted in massive land degradation with losses of fertile soil. Today, many rural families can barely make their living from agriculture. The basic climatic elements such as precipitation and temperature show seasonal or annual fluctuations somewhat different from expected climatic conditions, which are very important to agriculture production. Precipitation fluctuation has significant long and short term impacts on natural resources particularly forests, lakes, wetlands and rivers. Regardless of the presence of surface and groundwater resources, the low precipitation over the growing season seriously affects the region's agricultural activities that lead to food insecurity.
In Togo, the analysis of farmers’ perception to climate change by revealed that farmers perceived high increase in temperature [9]. Some studies in Togo revealed a rainfall deficit since 1970 [10-15]. Sogbedji [16] also found that the decrease in seasonal rainfall amount represents a serious threat to maize growth during the second growing season. Poudel and Shaw [17] used multiple regression analysis to determine the relationship between climate variables such precipitation and temperature on crop yields in Nepal. Regression models based on historical yield data and climate data are relatively accurate for the prediction of changes in the yield due to climate change [18]. To analyse the effects of climatic variables on crop production in Patigi, Nigeria, Tunde [19] used the correlation and regressions analyses and concluded that the climatic variables such as precipitation and temperature have impact to certain limit on the selected crop yield. Adamgbe and Ujoh in Nigeria reported that rainy days and rainfall amount had strong positive relationship with maize yield [20] (r=0.747 and r=0.599, respectively). Several other studies have discussed long-term linear tendencies of climate variables such as precipitation, temperature and others climatic parameters [3,21-25]. However, modest information data between climatic variables and crop yields exists on Togo, particularly in southern Togo which plays an important role in Togo’s economy. The objective of this study was (i) to investigate the change in precipitation and temperature, (ii) evaluate the impact of climatic variability on crop yields. The results of this study will help different actors such as farmers, universities, crop consultants, NGO, hydrologist, and environmentalists to develop and adopt adaptation strategies for agriculture development and sustainable environment.
Materials and Methods
Site description and data collection
Togo is a small West African nation with estimated population of about 6,191,155 inhabitants [26]. It borders in the south by Atlantic Ocean; Ghana lies to the west; Benin to the east; and the north of Togo is bound by Burkina Faso. Togo lies mostly between Latitudes 6° and 11°N and Longitudes 0° and 2°E (Figure 1). Monthly average air maximum and minimum temperature and precipitation obtained from daily data series for four weather stations such as Lomé, Tabligbo, Atakpamé and Kouma-konda were obtained from the Meteorological Department of Togo covering the period 1970 to 2014. The geographical coordinates, the long-term mean climatic variables and standard deviation under study are summarized in Table 1. Annual means of air maximum and minimum temperature and precipitation were estimated and used in trend analysis. Crops yields data were provided by Ministère de l’Agriculture, de l’Elevage et de l’hydraulique (MAEH) Togo. Amongst the selected crops, only rice is irrigated, the other such as maize, cassava, cowpea and groundnut are not irrigated.

Figure 1: Presentation of the study sites within southern Togo.
| Characteristics | Atakpamé | Kouma-konda | Lomé | Tabligbo | |
|---|---|---|---|---|---|
| Latitude | 7°31’37”N | 6°95′N | 6°9′56″N | 6°34′59″N | |
| Coordinates | Longitude | 1°7’36”E | 0°58′E | 1o15′16.24″E | 1°30′00″E |
| Elevation (m) | 250 | 643 | 22 | 76 | |
| Precipitation (mm) | 1397 ± 413 | 1597 ± 386 | 829 ± 220 | 902 ± 365 | |
| Climate variables: | Tmin (°C) | 21.5 ± 0.44 | 20.0 ± 0.57 | 23.9 ± 0.77 | 22.6 ± 0.51 |
| long-term average | Tmax (°C) | 31.5 ± 0.55 | 28.9 ± 0.52 | 31.3 ± 0.61 | 32.9 ± 0.57 |
| Tmean (°C) | 26.5 ± 0.48 | 24.4 ± 0.32 | 27.6±0.64 | 27.8±0.49 |
Table 1: Coordinates, mean annual values and standard deviations of climate variables under study at the meteorological stations.
Trend analysis
For the analysis of trend in annual and monthly maximum and minimum air temperature and annual and monthly precipitation, the Mann-Kendall test [27-29], a nonparametric method for trend analysis, was used. It should be noted that the Mann-Kendall test is a statistical test widely used for the analysis of trend in climatologic [30,31] and hydrologic time series [32,33]. There are two advantages of using this test: it is a nonparametric test and does not require the data to be normally distributed and the test has low sensitivity to abrupt breaks due to inhomogeneous time series [34]. According to this test, the null hypothesis (H0) assumes that there is no trend (the data is independent and randomly ordered) and this is tested against the alternative hypothesis (H1), which assumes that there is a trend. The Mann-Kendall test statistic S is given as follows:

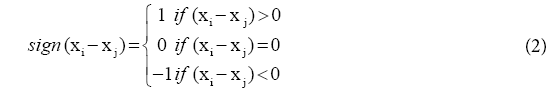
where xi is the data value at time i, n is the length of the dataset and sign (xi-xj) is the sign function which can be computed as:
For n>10, the test statistic Z approximately follows a standard normal distribution:
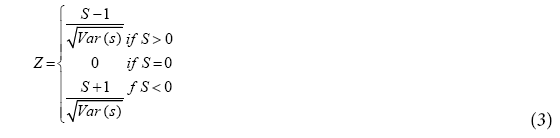
in which Var(S) is the variance of statistic S.
A positive value of Z indicates that there is an increasing trend, and a negative value indicates a decreasing trend. The null hypothesis, Ho, that there is no trend in the records is either accepted or rejected depending on whether the computed Z statistics is less than or more than the critical value of Z statistics obtained from the normal distribution table [35]. The Theil-Sen estimator (TSE) is an unbiased estimator of the true slope in simple linear regression [36]. If there is a trend in the data, the magnitude of the change in any variable can be denoted by trend slope ß [36,37]:
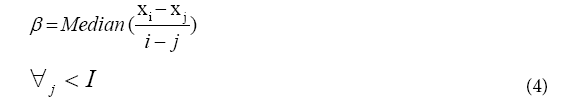
where xi and xj are data values at time ti and tj (i> j), respectively.
Linear regression
Linear regression analysis was applied for analyzing trends in the time series. The main statistical parameter drawn from regression analysis is the slope that indicates the mean temporal change in the variable under study. Positive values of the slope show increasing trends. The coefficient of determination R square drawn from regression analysis is also used. The total change during a decade was obtained by multiplying the slope by 10 years [34].
Impact of variation in climatic variables on crop yields
The precipitation and temperature data were tested against crop yields in southern part of Togo. Yield records of 5 major crops commonly grown in southern of Togo was collected at the Ministry of agriculture, livestock and hydraulic from 1990 to 2014. Lome is not an agriculture production area so; no yield record has been obtained. The crops for which data are available are maize, rice, cassava, cowpea and groundnut. Amongst these crops, only rice is irrigated in southern Togo. Multiple regression analysis was carried out on the crop yield using growing season precipitation and temperature values covering 1990 to 2014 period. The Statistical analysis software STATA was used to perform the Student t-test. This had enabled the possible determination of relationships between the precipitation, temperature and crop yield in southern of Togo. When the probability associated with t-student is less than 5%, then the independent variable has a significant influence or contributes to the variation in crop yield. The equation associated with the change in yield as a function of precipitation and temperature is:
γ =C + aT + bT +∈
Where γ is the yield (kg), a temperature-related coefficient, T temperature data (°C), b precipitation coefficient, P the precipitation data (mm) and ε error term or other variables which have an influence on the yields, C the constant.
Results and Discussion
Trend in climatic variables
Trend in annual precipitation: Figure 2 presented the time series annual precipitation. Annual precipitation varied with location and ranged from a maximum of 2344 mm registered in 1985 at Koumakonda to a minimum of 423 mm at Lomé in 2000. Annual precipitation had relatively low coefficient of determination R2 with years ranging from 0.000 at Kouma-konda to 0.036 at Tabligbo (Figure 2) indicating inter-annual variability in total precipitation. At Kouma-konda, annual precipitation varied from 618.6 to 2344.4 mm with the 1970-2014 annual mean precipitation of 1597 mm. A non-significant decreasing trend (P>0.05) in annual precipitation was noted in Kouma-konda (Table 2). Annual precipitation at Atakpamé varied from 767.3 mm in 1977 to 1850.1 mm in 2009 and insignificantly increased in time (P>0.05). Long term annual mean in Atakpamé was 1397. Annual precipitation at Lomé fell within the range of 423.9-1416.7 mm at an average 829 mm. A nonsignificant increase (P>0.05) in annual precipitation was noticed at Lomé. At Tabligbo, mean annual precipitation varied from 674 mm (1977) to 1341.5 mm (1999) and averaged 902 mm and has insignificantly increased (P>0.05) (Table 2). Precipitation in Lomé was found to have increased (11 mm/year) more than the other stations such as Atakpamé (2.62 mm/year) and Tabligbo (2.53 mm/year). Our results confirmed the findings of Amouzou et al. [15] who reported an increase of precipitation by 20% from 2001 to 2010. On the other hand, Djaman and Ganyo [33] revealed a slight decrease of precipitation from 1961 to 2011 at Tabligbo and Lomé. This is an evidence of uneven distribution of precipitation in the study location which is of great importance for farmers because more than 70% of the population relies on agriculture [1].

Figure 2: Annual mean precipitation at four meteorological stations in southern Togo during the 1970-2014 periods.
| Locations | First year | Last year | n | Mean | Test Z | Significance | Sen’s slope estimate |
|---|---|---|---|---|---|---|---|
| Precipitation(mm) | |||||||
| Atakpamé | 1970 | 2014 | 45 | 1397 | 0.6 | n.s. | 2.17 |
| Kouma-konda | 1970 | 2014 | 45 | 1597 | -0.34 | n.s. | -1.3 |
| Lomé | 1970 | 2014 | 45 | 829 | 0.95 | n.s. | 2.33 |
| Tabligbo | 1971 | 2014 | 44 | 902 | 1.1 | n.s. | 2.26 |
| Maximum temperature (°C) | |||||||
| Atakpamé | 1971 | 2014 | 44 | 31.5 | 6.04 | *** | 0.034 |
| Kouma-konda | 1971 | 2014 | 44 | 28.9 | -0.46 | n.s. | -0.003 |
| Lomé | 1971 | 2014 | 44 | 31.3 | 5.99 | *** | 0.04 |
| Tabligbo | 1971 | 2014 | 44 | 32.9 | 5.18 | *** | 0.036 |
| Minimum temperature (°C) | |||||||
| Atakpamé | 1971 | 2014 | 44 | 21.5 | 6.39 | *** | 0.027 |
| Kouma-konda | 1971 | 2014 | 44 | 20 | 5.42 | *** | 0.035 |
| Lomé | 1971 | 2014 | 44 | 23.9 | 6.26 | *** | 0.048 |
| Tabligbo | 1971 | 2014 | 44 | 22.6 | 5.17 | *** | 0.029 |
n.s.: Non-Significant
***Significant: 0.1%
Table 2: Summary of the Mann-Kendall trend test in annual precipitation and annual minimum and maximum monthly temperature.
Trend in monthly precipitation during the growing season: The growing period is April to October in Togo. The trend in monthly precipitation during the growing season in Atakpame, Kouma-konda, Lome and Tabligbo is presented in Table 3. The results revealed an increasing trend of precipitation in all the growing season at Atakpame, Lome and Tabligbo except in June and September respectively in Lomé and Tabligbo where a decreasing trend was noticed but not statistically significant (P>0.05). During the growing season in Kouma-konda, only the month of May and October revealed an increasing trend, the other months such as April, June to September denoted a decreasing trend. Amongst the four (4) locations, only Kouma-kona showed a decreased in seasonal precipitation, the other station denoted a slight increase in seasonal precipitation. During the growing season July had the highest precipitation with 208.7 mm in Atakpamé, June had the highest precipitation in Lome and Tabligbo with respectively 198.5 mm and 158.7 mm. Our result confirmed the findings of by Amouzou et al. [15] and Koudahe et al. [38] that June is the wettest month in Lome and Tabligbo. Amongst the four (4) locations, Kouma-konda has the highest monthly precipitation with 226.2 mm obtained in June.
| Atakpamé | Kouma-konda | Lomé | Tabligbo | |||||||||
|---|---|---|---|---|---|---|---|---|---|---|---|---|
| Months | Mean | Sen’s slope | Significance | Mean | Sen’s slope | Significance | Mean | Sen’s slope | Significance | Mean | Sen’s slope | Significance |
| Precipitation | ||||||||||||
| January | 6.6 | 0.00 | n.s | 23.5 | 0.00 | n.s | 11.4 | 0.00 | n.s | 7.5 | 0.00 | n.s |
| February | 23.6 | -0.07 | n.s | 52.5 | 0.47 | n.s | 21.9 | 0.00 | n.s | 31.0 | -0.34 | n.s |
| March | 76.1 | -1.64 | * | 117.9 | -1.74 | * | 55.7 | 0.13 | n.s | 96.1 | -0.05 | n.s |
| April | 125.2 | 0.17 | n.s | 153.0 | -0.63 | n.s | 94.1 | 0.20 | n.s | 117.1 | 0.17 | n.s |
| May | 158.2 | 0.39 | n.s | 163.9 | 0.03 | n.s | 155.0 | 0.45 | n.s | 152.3 | 0.26 | n.s |
| June | 188.3 | 0.03 | n.s | 226.2 | -0.07 | n.s | 198.5 | -0.14 | n.s | 158.7 | 0.70 | n.s |
| July | 208.7 | 1.02 | n.s | 197.1 | -0.64 | n.s | 76.5 | 0.50 | n.s | 89.6 | 0.77 | n.s |
| August | 196.1 | 0.58 | n.s | 154.0 | -1.13 | n.s | 32.3 | 0.43 | + | 55.5 | 0.47 | n.s |
| September | 204.1 | 0.63 | n.s | 238.5 | -0.01 | n.s | 69.1 | 0.49 | n.s | 121.2 | -0.10 | n.s |
| October | 124.2 | 0.56 | n.s | 192.4 | 0.41 | n.s | 87.9 | 1.19 | + | 130.6 | 0.81 | n.s |
| November | 14.5 | -0.01 | n.s | 70.9 | 0.52 | n.s | 18.5 | 0.05 | n.s | 41.4 | 0.64 | + |
| December | 13.2 | 0.00 | n.s | 30.5 | 0.00 | n.s | 7.8 | 0.00 | * | 14.7 | 0.00 | n.s |
n.s.: Non-Significant
+ Significant at 10%
* Significant at 5%
Table 3: Summary of the trends analysis in monthly precipitation during growing season in Atakpamé, Kouma-konda, Lomé and Tabligbo.
Trends in annual and monthly maximum and minimum temperatures: The long term trend in Tmin and Tmax at Atakpamé, Kouma-konda, Lomé and Tabligbo is presented respectively in Figures 3 and 4. Annual average Tmin from 1971 to 2014 at Atakpamé, Kouma-konda, Lomé and Tabligbo is respectively 21.5, 20.0, 23.9 and 22.6°C. Annual average Tmax varied from 30 to 32°C at Atakpamé and Lomé and varied from 28 to 30°C at Kouma-konda, from 31 to 34°C at Tabligbo. The average Tmax is 31.5, 28.9, 31.3 and 32.9°C, respectively Atakpamé, Kouma-konda, Lomé and Tabligbo (Figure 4). There was significant increasing trend (P<0.0001) in Tmin and Tmax at all stations during the period 1971 to 2014 except Kouma-konda where Tmax exhibited a nonsignificant decreasing trend (P>0.05). Tmin increased by 0.3, 0.5 and 0.3°C per decade at Atakpamé, Lomé and Tabligbo, respectively. Tmax increased by 0.3, 0.4 and 0.4°C per decade at Atakpamé, Lomé and Tabligbo respectively. Some studies [15,38] indicated also an increase of temperature in these locations. In Kouma-konda, Tmin rose by 0.4°C and Tmax decreased by 0.3 per decade. It is found that minimum temperature increased faster than maximum temperature in southern Togo (Table 4). The same result was obtained in Senegal by Djaman et al. [3] who revealed that Tmin increased more rapidly than Tmax (0.4 vs. 0.2°C decade-1) at Podor and (0.8 vs. 0.4°C decade-1) at St Louis from 1950-2000. The same result was also obtained by Easterling [39] and Caesar et al. [40]. Our results are consistent with Vose et al. [41] who reported that Tmin increased more rapidly than Tmax (0.204 vs. 0.14°C decade-1) from 1950 to 2004. It is also found that amongst study stations, the coastal area (Lomé) had the highest increase in annual Tmin and Tmax with Sen’s slope 0.048, 0.040, respectively. The increasing of temperature in southern Togo is not surprising but it only proves that global warming revealed for the whole world by Vose et al. [41] and Weart [42], can be identified even at local scales (southern Togo). The finding is in agreement with IPCC prediction which states in 2007 that, the Earth could warm by 3°C this century.

Figure 3: Annual minimum monthly temperature (Tmin, °C) at Atakpamé, Kouma-konda, Lomé and Tabligbo.

Figure 4: Annual maximum monthly temperature (Tmax, °C) at Atakpamé, Kouma-konda, Lomé and Tabligbo.
| Atakpamé | Kouma-konda | Lomé | Tabligbo | ||||||||||||||
|---|---|---|---|---|---|---|---|---|---|---|---|---|---|---|---|---|---|
| Months | Mean | Sen’s slope | Significance | Change per decade | Mean | Sen’s slope | Significance | Change per decade | Mean | Sen’s slope | Significance | Change per decade | Mean | Sen’s slope | Significance | Change per decade | |
| Minimum temperature (°C) | |||||||||||||||||
| January | 21.9 | 0.029 | *** | 0.3 | 19.8 | 0.057 | *** | 0.6 | 23.3 | 0.05 | ** | 0.5 | 21.6 | 0.023 | n.s. | 0.2 | |
| February | 22.5 | 0.034 | *** | 0.3 | 20.8 | 0.035 | *** | 0.4 | 24.8 | 0.05 | *** | 0.5 | 23.1 | 0.045 | ** | 0.5 | |
| March | 22.6 | 0.035 | *** | 0.4 | 20.8 | 0.045 | *** | 0.5 | 25.4 | 0.056 | *** | 0.6 | 24 | 0.024 | ** | 0.2 | |
| April | 22.2 | 0.025 | *** | 0.3 | 20.7 | 0.03 | *** | 0.3 | 25.1 | 0.044 | *** | 0.4 | 23.7 | 0.029 | *** | 0.3 | |
| May | 21.9 | 0.031 | *** | 0.3 | 20.4 | 0.025 | *** | 0.3 | 24.3 | 0.05 | *** | 0.5 | 23.5 | 0.02 | ** | 0.2 | |
| June | 21.2 | 0.033 | *** | 0.3 | 19.9 | 0.02 | *** | 0.2 | 23.5 | 0.043 | *** | 0.4 | 22.5 | 0.034 | *** | 0.3 | |
| July | 20.8 | 0.025 | *** | 0.3 | 19.3 | 0.026 | *** | 0.3 | 23.2 | 0.044 | *** | 0.4 | 22.2 | 0.021 | *** | 0.2 | |
| August | 20.6 | 0.026 | *** | 0.3 | 19.4 | 0.01 | * | 0.1 | 22.9 | 0.038 | *** | 0.4 | 21.9 | 0.022 | ** | 0.2 | |
| September | 20.7 | 0.029 | *** | 0.3 | 19.5 | 0.024 | *** | 0.2 | 23.3 | 0.041 | *** | 0.4 | 22.1 | 0.037 | *** | 0.4 | |
| October | 21 | 0.029 | *** | 0.3 | 19.6 | 0.026 | *** | 0.3 | 23.5 | 0.041 | *** | 0.4 | 22.4 | 0.014 | *** | 0.1 | |
| November | 21.5 | 0.03 | *** | 0.3 | 19.9 | 0.027 | *** | 0.3 | 24 | 0.067 | *** | 0.7 | 22.5 | 0.035 | *** | 0.4 | |
| December | 21.6 | 0.033 | *** | 0.3 | 19.6 | 0.056 | *** | 0.6 | 23.5 | 0.071 | *** | 0.7 | 21.9 | 0.044 | *** | 0.4 | |
| Maximum temperature (°C) | |||||||||||||||||
| January | 33.3 | 0.026 | * | 0.3 | 30.8 | 0 | n.s. | 0 | 32.3 | 0.033 | *** | 0.3 | 34.9 | 0.013 | n.s. | 0.1 | |
| February | 34.6 | 0.035 | ** | 0.4 | 32.2 | -0.01 | n.s. | -0.1 | 32.9 | 0.043 | *** | 0.4 | 35.4 | 0.052 | *** | 0.5 | |
| March | 34.3 | 0.033 | ** | 0.3 | 31.3 | 0.008 | n.s. | 0.1 | 32.9 | 0.035 | *** | 0.4 | 35.3 | 0.013 | n.s. | 0.1 | |
| April | 32.9 | 0.03 | ** | 0.3 | 30.2 | 0 | n.s. | 0 | 32.6 | 0.037 | *** | 0.4 | 34.1 | 0.042 | *** | 0.4 | |
| May | 31.6 | 0.03 | ** | 0.3 | 29.2 | -0.014 | n.s. | -0.1 | 31.9 | 0.039 | *** | 0.4 | 33.2 | 0.018 | + | 0.2 | |
| June | 29.9 | 0.042 | *** | 0.4 | 27.3 | -0.005 | n.s. | -0.1 | 30.2 | 0.033 | *** | 0.3 | 31.2 | 0.04 | *** | 0.4 | |
| July | 28.4 | 0.039 | *** | 0.4 | 25.8 | 0.002 | n.s. | 0 | 28.8 | 0.037 | *** | 0.4 | 30.3 | 0.035 | *** | 0.4 | |
| August | 28.2 | 0.025 | *** | 0.3 | 25.8 | -0.021 | * | -0.2 | 28.5 | 0.029 | *** | 0.3 | 30.1 | 0.009 | n.s. | 0.1 | |
| September | 29.1 | 0.035 | *** | 0.4 | 27 | -0.021 | * | -0.2 | 29.5 | 0.032 | *** | 0.3 | 31 | 0.042 | *** | 0.4 | |
| October | 30.7 | 0.031 | *** | 0.3 | 28.1 | -0.006 | n.s. | -0.1 | 31 | 0.033 | *** | 0.3 | 32.2 | 0.03 | *** | 0.3 | |
| November | 32.7 | 0.029 | ** | 0.3 | 29.4 | 0 | n.s. | 0 | 32.4 | 0.043 | *** | 0.4 | 33.5 | 0.048 | *** | 0.5 | |
| December | 32.6 | 0.05 | *** | 0.5 | 29.5 | 0.02 | * | 0.2 | 32.4 | 0.056 | *** | 0.6 | 34 | 0.056 | *** | 0.6 | |
n.s.: Non-Significant
+ Significant at 10%
* Significant at 5%
** Significant at 1%
***Significant at 0.1%
Table 4: Summary of the trends analysis in monthly minimum and maximum temperature at Atakpamé, Kouma-konda, Lomé and Tabligbo.
The trend analysis in monthly Tmin is presented in Table 4 shows an increasing trend in Tmin at all four locations (P<0.0001). For the four locations, the trend in Tmin revealed the lowest slopes from April to October which is the growing season and the highest slope from November to March which coincide with the dry season in southern Togo. A non-significant trend (P>0.05) of Tmax was observed in January, March and August in Tabligbo, in January to July, October and November at Kouma-Konda. The highest increased in Tmax at all locations was observed in December (Table 4). It can be deducted that decadal change increase in Tmin varied from 0.1 to 0.7 with more warming tendency in November to March at all locations which corresponds to the dry period in southern Togo. Overall, the increase in annual and monthly average Tmin and Tmax from 1971 to 2014 could have a serious implication in agricultural productions, reduced crop yields in tropical areas leading to increased risk of hunger [43]. Overall, the coastal area (Lomé) has the highest increase in monthly average Tmin and Tmax. This could be explained by urban heat island. Lomé is capital city and is the most populated city in Togo (40% of the population and over 90% of domestic industries). The results of this study are in agreement with Gadédjisso [9] who revealed an increase of air temperature throughout Togo. Similar trends in air temperature were reported in West Africa by Sylla et al. [22].
Impact of variation in climatic variables on crop yield: The results of multiple regressions of precipitation and temperature on crop yields are presented in Table 5. In Atakpame, the results revealed that the precipitation and temperature have non-significant effect on the yields record. In Kouma-konda, the results revealed that the temperature has significant influence on the variation of maize yields (p<0.1) and on cowpea (p<0.01). For other selected crops in Kouma-konda, it is showed that the variation of precipitation and temperature have nonsignificant effect on them. In Tabligbo, for all the selected crops, the variation of precipitation and temperature have non-significant effect on the crop yields. The non-effect of precipitation and temperature variability on the selected crop yields obtained in this study is also obtained by in Northern part of Nigeria [44]. This is an indication that precipitation and temperature variability may not necessary affect some selected crops. Despite the climate variability, farmers used drought resistant seed to adapt their production system to climate change. Our results indicated a slight increase in growing season precipitation with non-significant effect on crop yields, which is in contradiction with Sogbedji [16] who revealed that in Togo a decrease in seasonal rainfall amount represents a serious threat to maize growth. It has also been reported by Adamgbe and Ujoh [20] in Nigeria that rainy days and rainfall amount had strong positive relationship with maize yield (r=0.747 and r=0.599, respectively). In addition, Adamgbe and Ujoh [20] observed that rainfall characteristics jointly contributed 67.4% in explaining the variations in the yield of maize per hectare in Nigeria. The effect of water deficiency depended on growth stages, deficiency level and environmental changes during drought conditions. During later productive stages, yield losses from drought decreases as crop is approaching physiological maturity.
| Coefficient | t (Student) | P>|t| | Constant | R-squared | ||||
|---|---|---|---|---|---|---|---|---|
| Maize | ||||||||
| Temperature | -1881.89 | -1.31 | 0.205 | 58263.5 | 0.029 | |||
| Precipitation | 0.595 | 0.35 | 0.733 | |||||
| Rice | ||||||||
| Temperature | -39.431 | -0.01 | 0.988 | 13565.8 | 0.039 | |||
| Precipitation | -7.327 | -0.92 | 0.368 | |||||
| Cassava | ||||||||
| ATAKPAME | Temperature | 529.275 | 0.4 | 0.692 | -12414.6 | 0.035 | ||
| Precipitation | 1.669 | 0.8 | 0.435 | |||||
| Bean | ||||||||
| Temperature | 90.162 | 0.55 | 0.587 | -2525.9 | 0.093 | |||
| Precipitation | 0.193 | 1.38 | 0.184 | |||||
| Groundnut | ||||||||
| Temperature | 114.647 | 0.74 | 0.469 | -3021.2 | 0.024 | |||
| Precipitation | 0.078 | 0.4 | 0.693 | |||||
| Maize | ||||||||
| Temperature | 326.172 | 1.94* | 0.066 | -8095.2 | 0.208 | |||
| Precipitation | 0.321 | 1.41 | 0.175 | |||||
| Rice | ||||||||
| Temperature | 19.903 | 0.04 | 0.966 | 1535.1 | 0.033 | |||
| Precipitation | -0.762 | -0.85 | 0.404 | |||||
| Cassava | ||||||||
| Temperature | 165.346 | 0.23 | 0.819 | 1484.1 | 0.012 | |||
| KOUMA KONDA | Precipitation | 0.577 | 0.63 | 0.535 | ||||
| Bean | ||||||||
| Temperature | 196.294 | 2.87*** | 0.009 | -4834.7 | 0.21 | |||
| Precipitation | -0.108 | -1.17 | 0.256 | |||||
| Groundnut | ||||||||
| Temperature | 34.719 | 0.13 | 0.902 | -801.3 | 0.008 | |||
| Precipitation | 0.132 | 0.38 | 0.711 | |||||
| Maize | ||||||||
| Temperature | -1103.77 | -0.95 | 0.352 | 34318.3 | 0.107 | |||
| Precipitation | 2.519 | 1 | 0.33 | |||||
| Cassava | ||||||||
| Temperature | -363.691 | -0.38 | 0.712 | 15615.4 | 0.068 | |||
| Precipitation | 2.557 | 1.29 | 0.212 | |||||
| Bean | ||||||||
| Temperature | 75.704 | 0.57 | 0.576 | -2140.2 | 0.031 | |||
| Precipitation | -0.065 | -0.45 | 0.657 | |||||
| Groundnut | ||||||||
| TABLIGBO | Temperature | 52.956 | 0.44 | 0.666 | -1174.4 | 0.05 | ||
| Precipitation | -0.207 | -1.2 | 0.243 | |||||
| Robust t-statistics | ||||||||
| *** p<0.01, ** p<0.05, * p<0.1 | ||||||||
Table 5: Multiple regression analysis between precipitation, temperature and crops yields during growing season.
Morover, Kouma-Konda is situated in forest zone and deforestation during the last decades may have contributed to the slight decreasing of precipitation and increasing of temperature. Maize and bean are affected by the increasing of temperature. The same result is also obtained by Amouzou et al. [15] who revealed that climate variability minimally affected the yield of maize in maritime region of Togo. Serious attention need to be paid to the affected crops by climate variability in some locations, otherwise, the effect will increase and affect the other crops. With changes in climate parameters, mostly an increasing trend in air temperature combined with precipitation variability, several actions have been taken by agricultural and water resources actors to contrast the effects of climate change on Togo’s agriculture. As climate conditions change, crop growers are increasingly receptive to new agricultural technologies offered by extension services [33]. These farmers and extension service capacity to adapt to climate variability may explain the non effect of precipitation and temperature on crop yields. The use of drought-resistant seeds is becoming more common, which minimizes the risk of crop failure due to prolonged drought. The PNIASA program initiated by the government of Togo in 2010 is consistent with the National Poverty Reduction Strategy, and has a balanced focus of investment in support of improved agricultural production, improving the institutional framework, and physical infrastructure for higher productivity in the agricultural sector. Several other actions are being taken by the government of Togo, such as rehabilitation of water reservoirs, rehabilitation of irrigation schemes, and agricultural land development of 666 hectares at Mission-Tove and 585.5 hectares at Agome Glozou and implementing the national environmental policy and disaster management policy. Despite the adoption of strategic options, there is a need to continue implementing them and more participative decision-making is necessary for the durability of the innovation. Moreover, policy-makers should be involved at every step from the introduction to the adoption process. In addition, more research should be done on all of the strategic options to strengthen the system.
Conclusion
The objective of this study was to analyze the trend in climatic variables such as annual and monthly precipitation, annual and monthly Tmin, Tmax using historical data from four weather stations through the year 1970 to 2014 using the Mann-Kendall test and Sen’s slope estimator and to evaluate the impact of climatic variability on crop yields in southern Togo using multiple regression analysis. Results showed a non-significant increasing trend (P>0.05) in annual precipitation at Atakpamé, Lomé, Tabligbo and non-significant decreasing trend (P>0.05) at Kouma-konda from 1970 to 2014. There was a significant warming trend (P<0.0001) in Tmin, Tmax in Atakpamé, Kouma-konda, Lomé and Tabligbo during 1971-2014 period. Tmin increased by 0.3, 0.5 and 0.3°C per decade at Atakpamé, Lomé and Tabligbo respectively and Tmax increased by 0.3, 0.4 and 0.4°C per decade at Atakpamé, Lomé and Tabligbo, respectively. In Kouma-konda, Tmin rose by 0.4°C and Tmax decreased by 0.3 per decade. Tmin is found to increase faster than Tmax. The coastal area (Lomé) has the highest increase in annual and monthly Tmin and Tmax. Results of multiple regression analysis revealed that in Atakpame and Tabligbo, neither the precipitation nor the temperature have effect on the selected crop yields. In Kouma-konda, it revealed that the increased of temperature has significant effect on maize and bean. The increasing trend in Tmin and Tmax imply an increase in evapotranspitation which is of great concern to crop producers. Therefore, specific actions such as water management practices, crop diversification, new drought-resistant seed etc. are needed for resource planning and management for the sustainability of agriculture for future generations.
References
- MAEP Rice study in Togo (2013) Ministry of agriculture, livestock and hydraulics, Togo.
- MAEP Strategy of revival of agricultural production, emergency action plan (2010) Ministry of agriculture, livestock and fisheries, Togo.
- Djaman K, Balde AB, Rudnick DR, Ndiaye O, Irmak S (2016) Long-term trend analysis in climate variables and agricultural adaptation strategies to climate change in the Senegal river basin. Int J Climatol 37: 2873-2888.
- Stocker T. F, Qin D, Plattner G-K, Tignor M, Allen S. K, et al. (2013) Climate change 2013: The physical science basis. In contribution of working group I to the fifth assessment report of the Intergovernmental Panel on Climate Change. IPCC Cambridge University.
- Hartmann DL, Klein T, Rusticucci M, Alexander LV, Bronnimann S, et al. (2013) Observations: Atmosphere and surface, pp: 159-254
- Karl TR, Arguez A, Huang B, Lawrimore JH, Menne MJ, et al. (2015) Possible artifacts of data biases in the recent global surface warming hiatus. Science 348: 1469–1472.
- Zwiers FW, Alexander LV, Hegerl GC, Knutson TR, Kossin J, et al. (2013) Challenges in estimating and understanding recent changes in the frequency and intensity of extreme climate and weather events. Climate Science for Serving Society: Research, Modeling and Prediction Priorities.
- Giorgi F, Coppola E, Raffaele F (2014) A consistent picture of the hydroclimatic response to global warming from multiple indices: Models and observations. J Geophys Res Atmos 119: 11,695-11,708.
- Gadédjisso TA (2015) Understanding farmers’ perceptions of and adaptations to climate change and variability: The case of the maritime, plateau and Savannah regions of Togo. Agri Sci 6: 1441-1454.
- Klassou KS (1996) Recent climatic and hydrological evolution and impact on the environment: the case of the Mono river watershed (Togo-Benin). University Michel de Montaigne Bordeaux 3.
- Badameli KSM (1996) Climate variability and agricultural production in Togo. University of Bordeaux III.
- Badameli KSM (1998) Analysis and taking account of climate risks in agriculture; Case of the maritime region of Togo. Works and geographical research.
- Adewi E (2002) Agricultural Strategies of the Climate crisis Management in Togo. Université de Lomé.
- Adewi E, Badameli KSM, Dubreuil V (2010) Evolution of seasonal potentially useful rains in Togo from 1950 to 2000. Climatologie 7: 89-107.
- Amouzou KA, Ezui KS, Sogbedji JM (2013) impacts of climate variability and soil fertility management strategies on maize grain yield on ferrralsols in coastal Western Africa. J Rene Agric 1: 44-52.
- Sogbedji JM (1999) Maize nitrogen utilization and nitrate leaching modeling in Togo and New York. Cornell University.
- Poudel S, Shaw R (2016) The relationships between climate variability and crop yield in a mountainous environment: A case study in lamjung district, Nepal. Climate 4: 1-3
- Lobell DB, Field CB (2017) Global scale climate-crop yield relationships and the impacts of recent warming. Environ Res Lett 2: 1-7.
- Tunde AM, Usman BA, Olwepo VO (2011) Effect of climatic variables on crop production in patigi L. G. A, Kwara State, Nigeria. J geo regi plan 4: 695-700.
- Adamgbe EM, Ujoh, F (2013) Effect of variability in rainfall characteristics on maize yield in Gboko, Nigeria. J Enviro Protection 4: 881-887.
- Koudahe K, Djaman K, Bodian A, Irmak S, Sall M, Diop L, Balde BA, Rudnick RD (2017) Trend analysis in rainfall, reference evapotranspiration, and aridity index in Southern Senegal: Adaptation to the vulnerability of rainfed rice cultivation to climate change. Atmos Clim Sci 7: 476-495.
- Sylla MB, Nikiema PM, Gibba P & Kebe I (2016) Climate Change over West Africa:Recent trends and future projections. Springer International Publishing Switzerland .
- Thompson DWJ, Wallace JM, Hegerl GC (2000) Annular modes in the extra-tropical circulation. Part II: trends. J Clim13: 1018-1036.
- Tuomenvirta H, Alexandersson H, Drebs A, Frich P, Nordli PO (2000) Trends in Nordic and Arctic temperature extremes and ranges. J Clim13: 977-990.
- Tank KAMG (2002) Daily surface air temperature and precipitation data set 1901-1999 for European Climate Assessment (ECA). Int J Climatol22: 1441-1453.
- Quatrième Recensement Général de la Population et de l’Habitat au Togo RGPH (2010). Direction Générale de la Statistique et de la Comptabilité Nationale.
- Mann HB (1945) Nonparametric tests against trends. Econometrica 13: 245-259.
- Kendall MG (1975) Rank correlation methods. Charles Griffin publication.
- Caloiero T, Coscarelli R, Ferrari E, Mancini M (2011) Trend detection of annual and seasonal rainfall in Calabria (Southern Italy). Int. J. Climatol. 31: 44-56.
- Mavromatis T, Stathis D (2011). Response of the water balance in Greece to temperature and precipitation trends. Theor Appl Climatol 104: 13-24.
- Tabari H, Hossein P, Talaee Z (2011a) Analysis of trends in temperature data in arid and semi-arid regions of Iran. Global Planet Change79: 1-10.
- Yue S, Wang C (2004) The Mann-Kendall test modified by effective sample size to detect trend in serially correlated hydrological series. Water Resour Manage18: 201-218
- Djaman K, Ganyo K (2015) Trend analysis in reference evapotranspiration and aridity index in the context of climate change in Togo. Journal of Water and Climate Change 5: 848-864.
- Tabari H, Marofi S, Aeini A, Talaee PH, Mohammadi K (2011) Trend analysis of reference evapotranspiration in the western half of Iran. Agr Forest Meteorol151: 128-136.
- Some’e BS, Ezani A, Tabari H (2013) Spatiotemporal trends of aridity index in arid and semi-arid regions of Iran. Theor Appl Climatol 111: 149-160.
- Sen PK (1968) Estimates of the regression coefficient based on Kendall’s TAU. J Am Stat Assoc 63: 1379-1389.
- Theil H (1950) A rank-invariant method of linear and polynomial regression analysis. Adv Stud Theoret Appl Econometrics 53: 386-392.
- Koudahe K, Adewumi JK, Awokola OS, Adekunle AA, Djaman K (2017) Trend analysis in standardized precipitation index and standardized anomaly index in the context of climate change in Southern Togo. Atmospheric and Climate Sciences 7: 401-423.
- Easterling DR (1997) Maximum and minimum temperature trends for the globe. Atmospheric Science277: 364-367.
- Caesar J, Alexander L, Vose R (2006) Large-scale changes in observed daily maximum and minimum temperatures: creation and analysis of a new gridded data set. J Geophys Res111: 1-5.
- Vose RS, Easterling DR, Gleason B (2005) Maximum and minimum temperature trends for the globe: an update through 2004. Geophys Res Lett32: 1-3.
- Weart SR (2003) The discovery of global warming. Havard University Press.
- IPCC (2007) Climate change: Fourth assessment report of the intergovernmental panel on climate change. Cambridge University Press.
- Binbol NL, Adebayo AA, Zemba AA (2015) A measure of drought-Crop relationship in northern Nigeria. 6th International Conference and Annual General meeting.
Citation: Koudahe K, Koffi D, Kayode JA, Awokola SO, Adebola AA (2018) Impact of Climate Variability on Crop Yields in Southern Togo. Environ Pollut Climate Change 2: 148. DOI: 10.4172/2573-458X.1000148
Copyright: © 2018 Koudahe K, et al. This is an open-access article distributed under the terms of the Creative Commons Attribution License, which permits unrestricted use, distribution, and reproduction in any medium, provided the original author and source are credited.
Share This Article
Open Access Journals
Article Tools
Article Usage
- Total views: 3334
- [From(publication date): 0-2018 - Apr 27, 2024]
- Breakdown by view type
- HTML page views: 2670
- PDF downloads: 664