
Abstract
Aims: The aim of this study was to define the shape variations, including diameters and angles, of the major coronary artery bifurcations.
Methods and results: Computed tomographic angiograms from 300 adults with a zero calcium score and no stenoses were segmented for centreline and luminal models. A computational atlas was constructed enabling automatic quantification of 3D angles, diameters and lengths of the coronary tree. The diameter (mean±SD) of the left main coronary was 3.5±0.8 mm and the length 10.5±5.3 mm. The left main bifurcation angle (distal angle or angle B) was 89±21° for cases with, and 75±23° for those without an intermediate artery (p<0.001). Analogous measurements of diameter and angle were tabulated for the other major bifurcations (left anterior descending/diagonal, circumflex/obtuse marginal and right coronary crux). Novel 3D angle definitions are proposed and analysed.
Conclusions: A computational atlas of normal coronary artery anatomy provides distributions of diameter, lengths and bifurcation angles as well as more complex shape analysis. These data define normal anatomical variation, facilitating stent design, selection and optimal treatment strategy. These population models are necessary for accurate computational flow dynamics, can be 3D printed for bench testing bifurcation stents and deployment strategies, and can aid in the discussion of different approaches to the treatment of coronary bifurcations.
Background
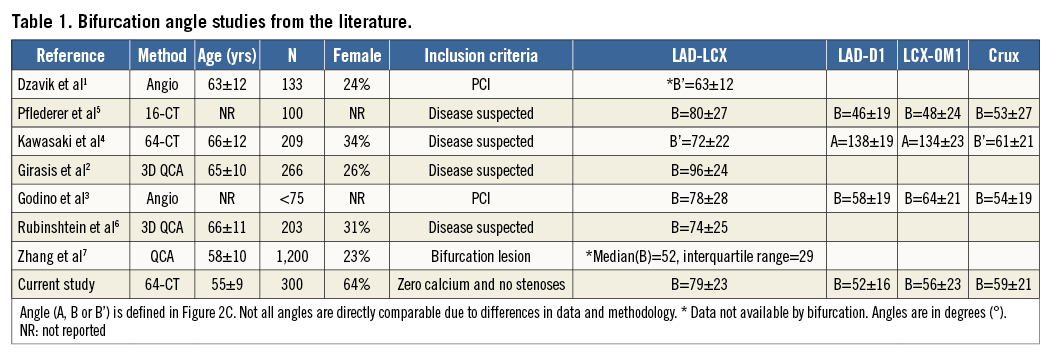
Information on normal coronary artery anatomy, including bifurcations, is surprisingly limited, and the available data, summarised in Table 1, have important limitations1-7. Previous studies of coronary anatomy differ in their inclusion criteria, imaging protocol, definition of angles, and measurement technique. Knowledge of the quantitative size, shape and variability of the coronary arteries is important for stent selection, stent deployment, and potentially for dedicated stent design8. A detailed luminal surface shape is also required for computational fluid dynamic simulations9 and to construct accurate 3D coronary artery models for bench testing devices and strategies.
We have created a three-dimensional (3D) CT computational atlas of the coronary artery anatomy. Previous studies were derived from a manually searched for projection plane which minimises the foreshortening of the vessel, assuming that the bifurcation is two-dimensional as opposed to its true 3D shape. Our methodology is free from inter-observer and projection variability and allows the reproducible and accurate assessment of angles and diameters from the computational models. Where common features are extracted from each individual subject, these databases are often termed “atlases”10. The presented computational database can generate new insights on demand: any mathematically formulated measurement can be queried, for any subpopulation.
Methods
DATA
This study was approved by the institutional review committee and all subjects gave written informed consent. The study population was a retrospective sample of 300 consecutive consenting patients (after exclusion) referred for a coronary computed tomography angiogram (CCTA) but who were found to have a calcium score of zero and no stenoses identified by an experienced cardiologist. Imaging was performed with a multidetector CT scanner (GE LightSpeed™ 64 scanner; GE Healthcare, Little Chalfont, United Kingdom) using retrospective ECG gating following administration of 60-80 ml of Omnipaque 350 contrast medium (GE Healthcare). Beta blockage aimed to achieve a resting heart rate of approximately 60 bpm. Sublingual nitroglycerine spray was administered before imaging.
The end-diastolic CT (at 75% of the cycle) image data were rendered in a 3D volume of approximately 200 transverse-plane stacked images.
SEGMENTATION
A standardised analysis pipeline was defined to process all cases consistently with minimal user interaction. The segmentation procedure was performed by an experienced analyst using a previously validated semi-automatic method that took approximately 20 minutes per study10.
The segmentation pipeline and typical results are shown in Figure 1. All meshes were visually checked for quality and, if poor, the mesh was excluded from the atlas (seven cases). MATLAB, Release 2013b (The MathWorks, Inc., Natick, MA, USA) was used to compute all vessel measurements.
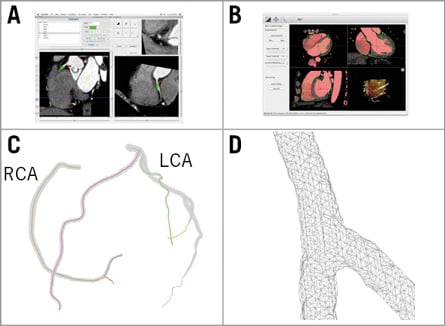
Figure 1. Atlas construction workflow. A) Centreline generation: virtual catheters were inserted at the ostia in the CTA images. B) Luminal mesh generation: extracted centrelines from panel A were input into the custom software MIALite. C) Result: coronary arteries shown in colour and luminal surface mesh in grey. D) Detail: close-up of the triangulated surface mesh at a bifurcation.
LABELLING
Each centreline was manually labelled as one of the following: left anterior descending (LAD), diagonal (D1), septal, left circumflex (LCX), obtuse marginal (OM1), intermediate, right coronary artery (RCA) and acute marginal. Other centrelines were ignored. In those with right-dominant circulations, the bifurcation giving rise to the posterior descending and the posterolateral branches (crux) was identified.
If more than one vessel fitted a description, e.g., there was more than one diagonal, only the first branch was analysed.
DEFINITION AND COMPUTATION OF ANGLES
A bifurcation point was automatically calculated from the centrelines at the point where the centrelines split (Figure 2A). Measurements were taken at a range of depths from this bifurcation point in 0.5 mm steps, following the centrelines. At every step, a bifurcation plane (a least-square plane fitted to all of the centreline points from the bifurcation point to the selected depth) was defined (Figure 2B).
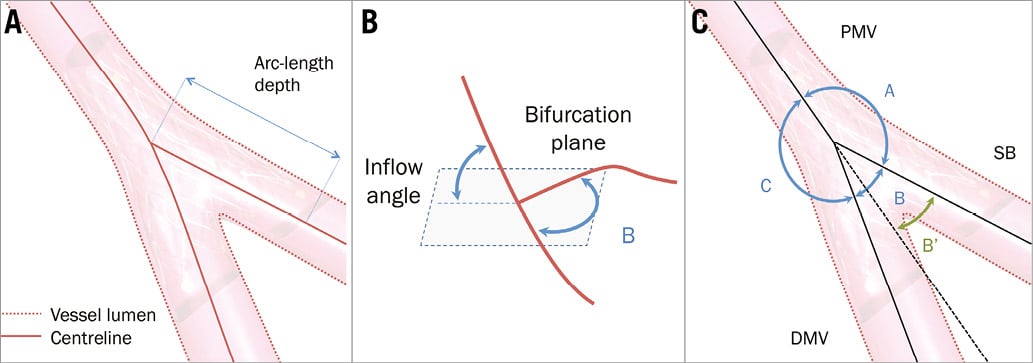
Figure 2. Definitions. A) The bifurcation is represented by a luminal surface and a centreline. To compute distances, the arc length (length of the curve in 3D) was used. B) Inflow angle. Given a distance from the bifurcation point (depth), a least-square bifurcation plane is defined. The inflow angle is defined as the angle with which the vessel enters this plane (either from above or underneath the plane). C) Angle definitions previously used in the literature. The European Bifurcation Club recommendation is shown in blue (angles A, B and C). B’ is the angle that would arise from the prolongation of the PMV1. DMV: distal main vessel; PMV: proximal main vessel; SB: side branch
At each bifurcation we analysed four angles in 3D (Figure 2B): the inflow angle, defined as the angle with which the proximal vessel enters the bifurcation plane, and the bifurcation angle (angle B), defined as the angle of the bifurcation between the distal main vessel and the side branch. In addition we measured the angle between the proximal main vessel and side branch (angle A), and the angle between the proximal and distal main vessel (angle C), as shown in Figure 2C. For comparison, we have included angle B’ which discounts the curvature of the distal main vessel1. Computationally, these angles have to be defined with linear approximations of the centrelines.
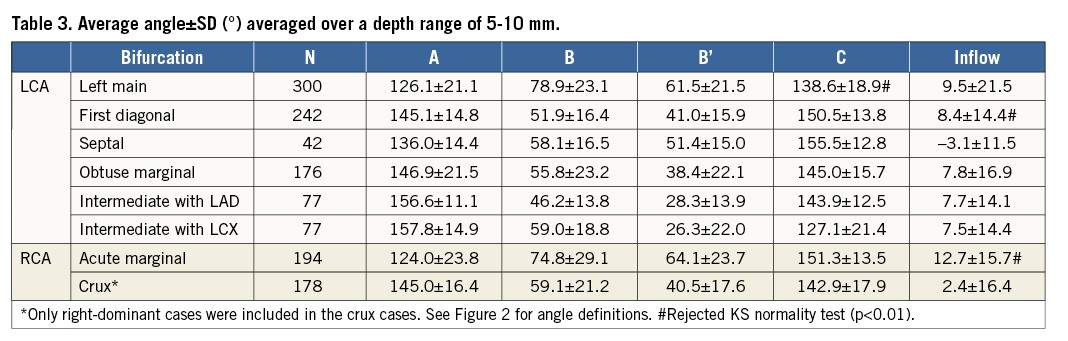
In Figure 3A we show the bifurcation angle as a function of distance from the bifurcation point (or depth). Angle measurements are defined as the average in the 5-10 mm depth interval where variation is typically small.
We include a sign convention for the inflow angle relative to the centre of the heart. When the bifurcation follows the convex curvature of the heart, a positive sign is used; when the bifurcation goes against the expected convex curvature of the heart, a negative sign is used.
COMPUTATION OF DIAMETERS
For each centreline, the diameter of the vessel was calculated every 0.5 mm from the ostium (Figure 3B), or previous main bifurcation and to the last available point.
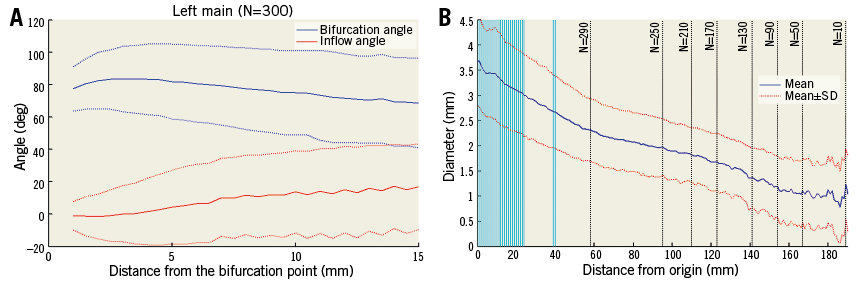
Figure 3. Angle and diameter as functions of depth in the left main bifurcation. A) Bifurcation angle B and inflow angles calculated at different distances from the left main bifurcation point between the LAD and the LCX (solid line represents the mean, and dashed lines one standard deviation). B) Diameter of the left main trunk and LAD calculated at different distances from origin (mean is shown in blue, one standard deviation in red). Vertical lines show where the left main bifurcation occurs. Black dotted vertical lines indicate sample size (as distance increases fewer cases are available).
At each point, the mesh was intersected with a plane normal to the centreline. This resulted in a polygon shape from which the area was calculated. From the area (A), effective radius (R) and diameter were determined (A=πR2). At a bifurcation, the effective radius briefly increases in the polygon of confluence11. In this region where the area is maximal within the bifurcation, an ellipse was fitted yielding two diameters from the major and minor axes, enabling the computation of eccentricity.
STATISTICS
Statistics were computed in SPSS Statistics, Version 21 (IBM Corp., Armonk, NY, USA) and MATLAB, Release 2013b (The MathWorks, Inc.). Histograms were used to report diameter and angle data (Figure 4, Figure 5). A Kolmogorov-Smirnov (KS) test12 was used to test for normality (α=0.01). Linear regression was used to test for differences due to sex and size13. A p-value of p<0.01 was considered significant.
Results
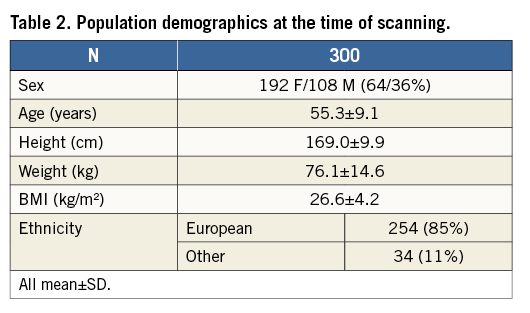
Sample demographics can be found in Table 2.
MEASUREMENTS
The left main bifurcation angle slowly decreases as the measurement is taken further from the bifurcation point (Figure 3A). Most distributions shown in the histograms (Figure 4, Figure 5) passed the normality test (Table 3).
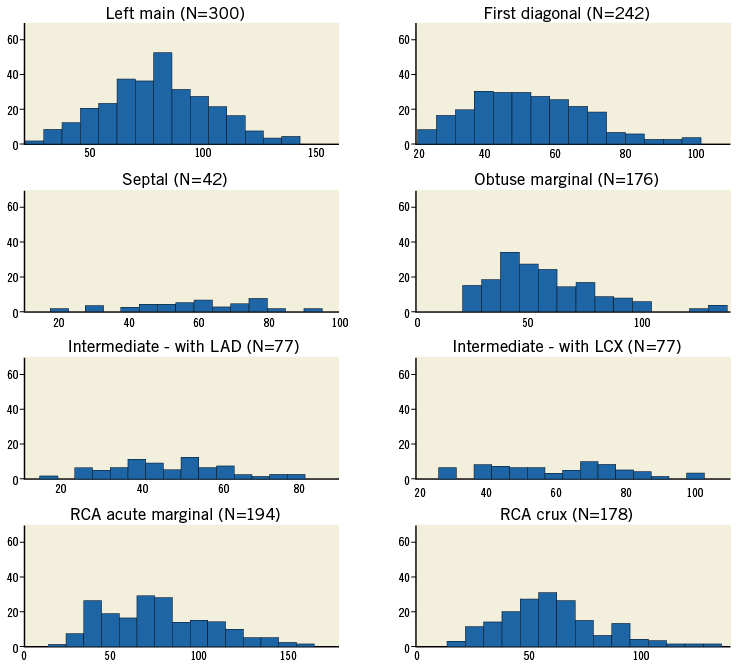
Figure 4. Bifurcation angle (B) shown as a histogram for each bifurcation. The horizontal axes show the angle (°) and the vertical axes represent the number of cases (frequency).
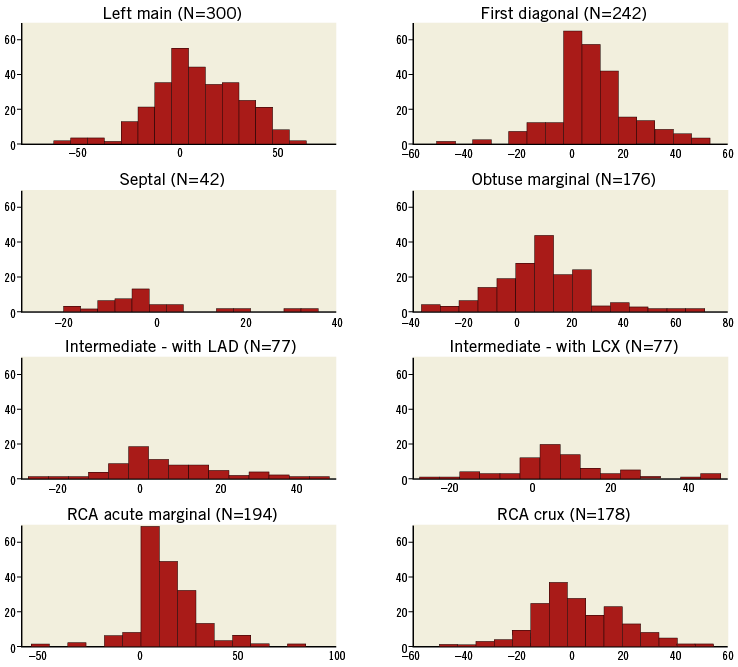
Figure 5. Inflow angle shown as a histogram for each bifurcation. The horizontal axes show the angle (°) and the vertical axes represent the number of cases. Positive angles indicate that the proximal vessel enters the bifurcation plane with convex curvature consistent with the long-axis curvature of the ventricle, whereas negative values indicate concave curvature.
The length of the left main coronary artery is 10.5±5.3 mm (Table 4). Other left-coronary bifurcations typically occurred around 30-40 mm (e.g., first diagonal and septal) but with substantial variation as shown by the large standard deviation. Comparatively, the crux was found at the furthest point from its ostium, with greater variability14.
The average effective diameter at the ostium of the left main coronary artery is 3.7 mm (Table 5), and LAD diameters decrease distally in an approximately linear fashion (Figure 6). Diameters were measured until fewer than 40 cases were available with an adequate luminal mesh.
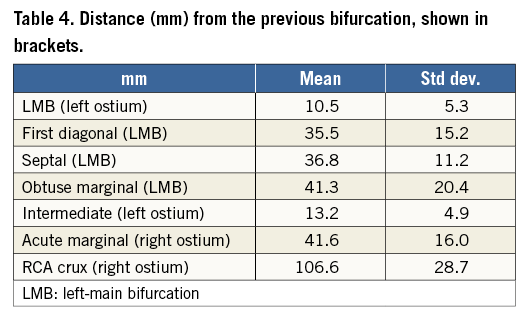
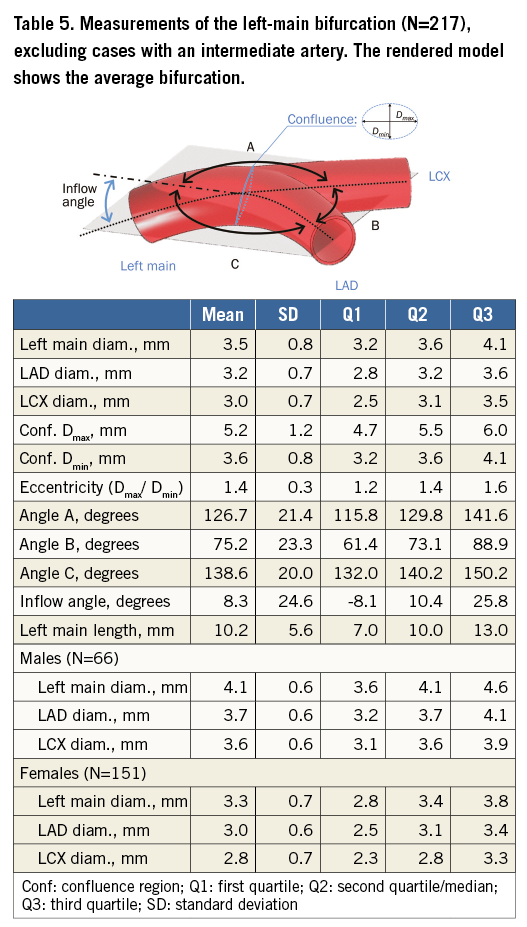
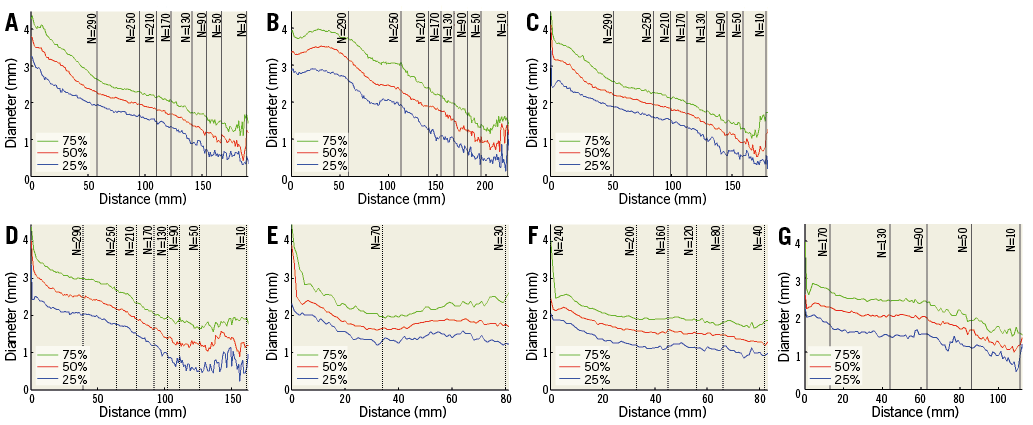
Figure 6. Effective diameters vs. distance from bifurcation or ostium shown in quartiles. A) Left main from ostia (continuing to LAD). B) RCA from ostia downward. C) LAD from bifurcation. D) LCX from bifurcation. E) Intermediate from bifurcation. F) First diagonal from bifurcation. G) Obtuse marginal from bifurcation.
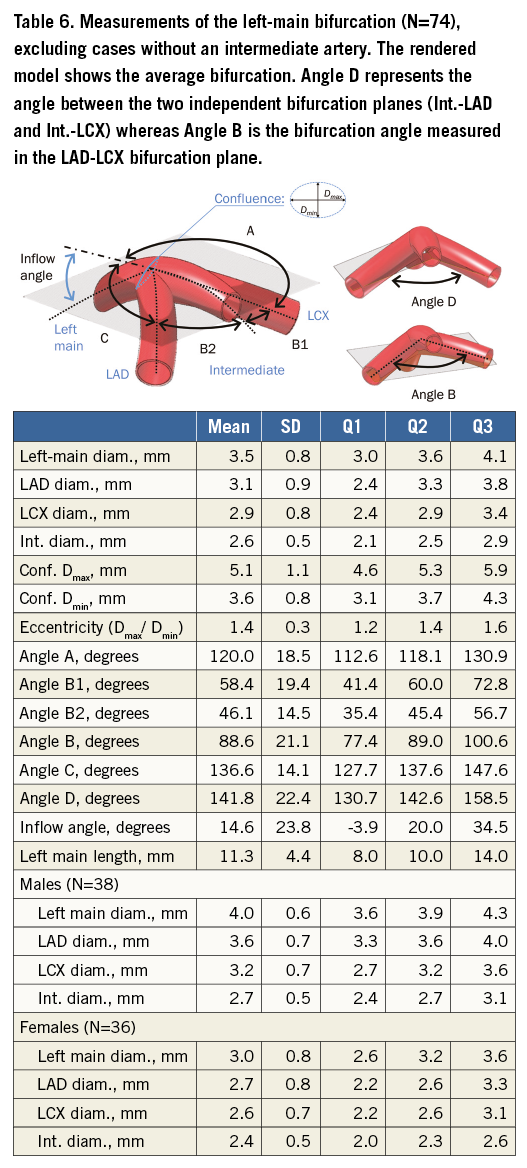
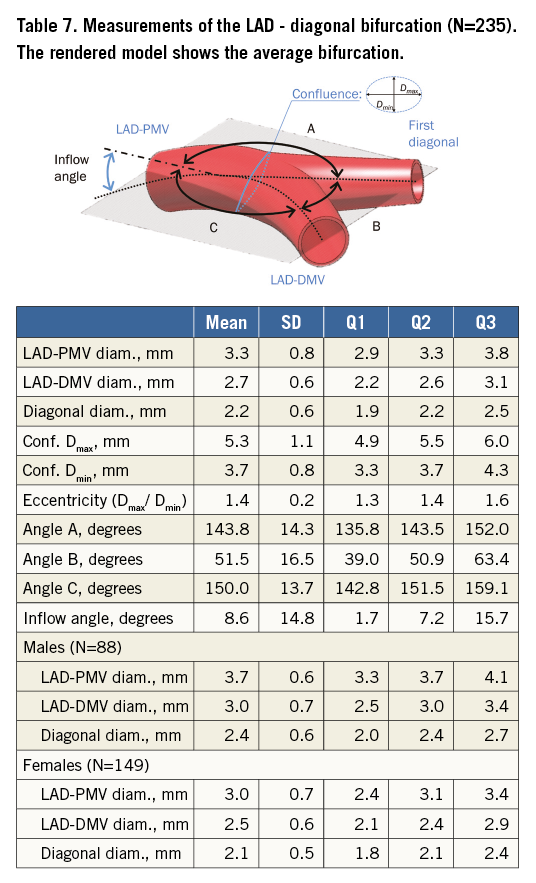
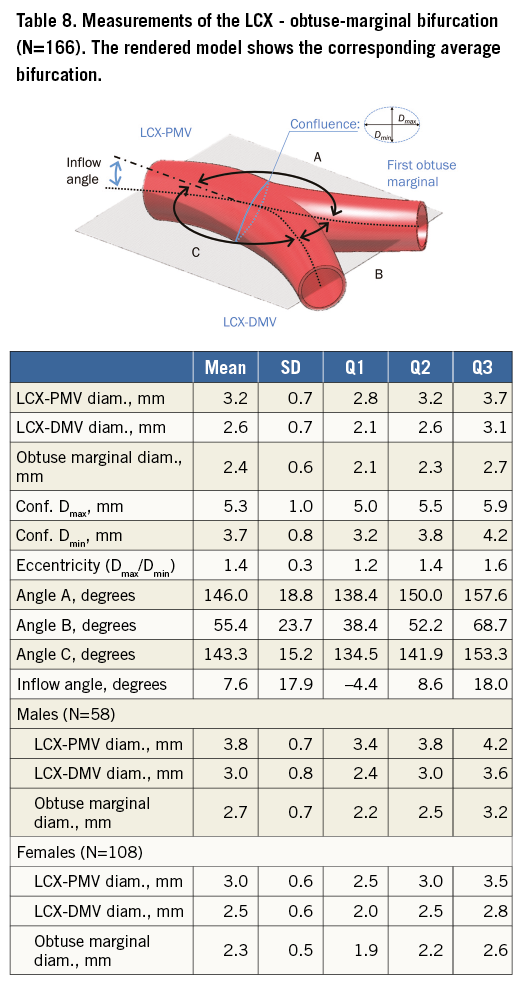
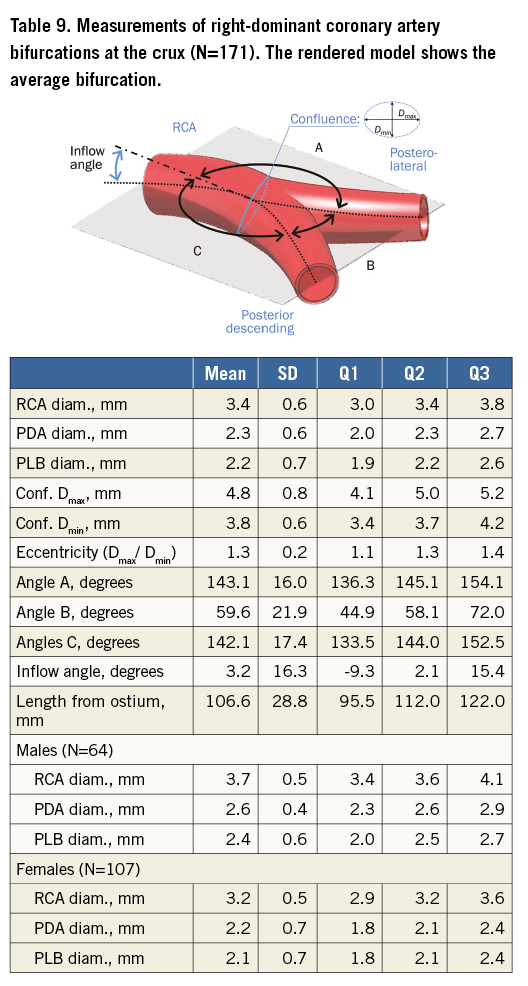
Table 5 tabulates angles and diameters for the left main bifurcation. Table 6-Table 9 summarise the measurements for the other major bifurcations.
DIFFERENCES BY SEX AND SIZE
An ANOVA analysis revealed that diameters in the left main are significantly different for men and women (p<0.001). The bifurcation angle was wider in males (85º vs. 74°, p<0.001), and females had slightly more pronounced inflow angles (12° vs. 6°, p=0.07).
Arterial diameters were not significantly related to patient size calculated from BMI when this was included in a linear regression (p>0.001). Bifurcation angles were still different by sex (p=0.002) in a regression model including height; however, inflow angles did not show a significant difference in the same regression model. Patients with an intermediate artery had a larger bifurcation angle than those without (89° and 75°, respectively, p<0.001) but there was no difference in inflow angle or left main diameter.
Discussion
This data set serves as a reference for describing the coronary artery shape features for a population without coronary stenoses and without calcification. The methodology employed for the measurement (after segmentation) is fully automatic, reproducible and three-dimensional, thus avoiding several potential sources of error found in previous studies, including the use of 2D projections.
ANGLES
We wish to extend the European Bifurcation Club definition of bifurcation angles15 where angles are called A, B and C as shown in Figure 2C and bifurcation is considered a 2D structure. Bifurcation anatomy is more complex and we wish to incorporate the concept of bifurcations existing in three dimensions. The inflow angle, less well recognised, is the angle between the plane of the daughter vessels and the upstream main vessel before it divides. While the three angles (A, B and C) add up to 360° in a 2D plane, this is not necessarily true in 3D.
Averaging angles in the 5-10 mm interval ensures a more robust measurement than a single point. The inflow angle does not flatten off with respect to distance from the bifurcation because the coronary arteries curve towards the apex of the heart. Measurement of this angle using only two points is therefore highly dependent on the selected distance.
The absolute inflow angle rarely exceeds 30°, except in very small hearts with a high curvature. Its mean is positive indicating convex curvature, except for the septal bifurcation which is slightly concave (Table 3).
The difference in inflow angle between males and females, albeit moderate, aligns well with previous findings of heart shape variation in asymptomatic populations where female hearts were found to be more spherical16 and would therefore require higher inflow curvature.
Measurements made using a projected straight centreline from the proximal main vessel are reported1. In order to compare our findings, we also calculated this angle B’ (Figure 2C). In general, B’ is
Previous studies have looked primarily at patients with disease (Table 1). In comparison, the proposed methodology has improved robustness because angle measurements are averaged over the vessel length. Due to flow dynamics, angle values are expected to be larger compared with a healthy population. Differences with literature are therefore probably due to: 1) the lack of disease in our sample; 2) the different demographics, i.e., higher proportion of females and younger patients in our sample (Table 2); and 3) different measuring methodology.
Notwithstanding these differences, previously reported angles were indeed typically larger, with the closest results reported by Pflederer5 and Godino3. Kawasaki4 and Dzavik1 reported lower angular B’ values for the left main bifurcation due to the previously mentioned methodology differences. In line with other studies in Table 1, we have further established a consistent angular difference of ~30° between the left main (average of 80°) and other major bifurcations (~50°).
DIAMETERS
The average diameter along the LAD shows some fluctuation at the site of bifurcations where the artery can sometimes depart from tubular vessel geometry. Beyond bifurcations, the average diameter stabilises with a smooth reduction of approximately 0.25 mm per 10 mm of length.
The diameter data (D) from our atlas were in close agreement with Finet’s ratio17 where DPMV/(DDMV+DSB)=0.678 (PMV: proximal main vessel; DMV: distal main vessel; SB: side branch). This ratio was 0.6576±0.083 in our data sample. In comparison with other diameter ratio models based on flow17, a least-square data fit to an exponential model DaPMV=DaDMV+DaSB yielded a minimum for α=2.4, closest to the Huo-Kassab model.
The left-main diameter interquartile range of 3.2-4.1 mm (Table 5) agrees well with previous studies using QCA (3.1-4.2 mm)18-20 but differs from post-mortem measurements (4.9±0.8 mm)21. The latter measurements depend on how the tissues are handled post mortem, whether pressure fixation was used and whether the lumen or outside diameters were measured. Circumflex coronary artery diameter (3.1±0.7 mm) was also found to be in agreement with previous findings (3.10±0.54 mm)22. The length of the left-main trunk (10.5±5.3 mm) (Table 4) was similar to observations from previous studies using QCA (9.7±4.3 mm)23 and post-mortem measurements. An interesting observation in the right coronary artery is that it seems to increase in diameter before decreasing monotonically (Figure 6). The sharp decrease in diameter after the bifurcation point represented by the origin or zero length in all secondary bifurcations (excluding the top row) is explained by the increase in diameter in the region of confluence of the bifurcation.
Noise becomes more noticeable as the number of patients decreases below 50. This provides an indirect indication of the sample size required to determine diameter robustly in this population. Assuming a resolution of 0.5 mm and a diameter variance of 0.7 mm, N=47 is indeed enough to achieve 99% power (1−β) with a Type I error rate of α=0.01.
Limitations
Our study population was younger and had more females (64%) than previous studies (Table 1) or in an average population having bifurcation stenting22. The ethnic homogeneity of the population might also have contributed to differences.
Because of limitations in resolution, some cases (3%) were not suitable for mesh generation. These cases were mostly from smaller female hearts.
Our problem of insufficient data is manifest in the septal coronary data where there were not enough cases to characterise the empirical distribution function fully.
Selecting only the first diagonal, septal, or obtuse marginal artery for analysis when more side branches exist could be less representative. Extending the analysis to include secondary arteries could be the object of future research.
We analysed an end-diastolic time point; however, the heart moves during the contraction and relaxation cycles. Accordingly, the angle between the vessels changes, as shown by Girasis et al2. Under this computational framework, in future, we intend to quantify these changes over the cardiac cycle.
Future work
The atlas construction is independent of the segmentation algorithm and therefore can take advantage of improved segmentation. Further work could include study of the aortic sinus and the ostia, and a comparison with patients having coronary atherosclerosis.
| Impact on daily practice We present a computational atlas of coronary anatomy with a focus on interventional measurements such as angles, diameters and lengths. These data define normal anatomical variation, facilitating stent design, selection and optimal treatment strategy. These population models are important for accurate and realistic simulations of computational flow dynamics and can be 3D printed for bench testing bifurcation stents and deployment strategies. We hope that these data are valuable in planning and discussing different approaches to the treatment of coronary bifurcations including choice of stent, evaluation of diameters and length and use of dedicated devices. |
Acknowledgements
The authors wish to acknowledge the staff at Auckland Heart Group and Mercy Radiology for their support, in particular Aleem Shah, Ross Longdon and Suzanne Endicott-Davies for their commitment to this project. The authors would like to thank Renee Miller and Greg Gamble from the University of Auckland for their assistance.
Funding
P. Medrano-Gracia and S. Beier would like to acknowledge with gratitude the support of the Auckland Heart Group Charitable Trust. P. Medrano-Gracia is grateful for the support received from the Green Lane Research and Educational Fund.
Conflict of interest statement
J. Ormiston is on the medical advisory boards of Abbott Vascular and Boston Scientific. The other authors have no conflicts of interest to declare.