Abstract
Aims: To develop a simplified approach of virtual functional assessment of coronary stenosis from routine angiographic data and test it against fractional flow reserve using a pressure wire (wire-FFR).
Methods and results: Three-dimensional quantitative coronary angiography (3D-QCA) was performed in 139 vessels (120 patients) with intermediate lesions assessed by wire-FFR (reference standard: ≤0.80). The 3D-QCA models were processed with computational fluid dynamics (CFD) to calculate the lesion-specific pressure gradient (ΔP) and construct the ΔP–flow curve, from which the virtual functional assessment index (vFAI) was derived. The discriminatory power of vFAI for ischaemia-producing lesions was high (area under the receiver operator characteristic curve [AUC]: 92% [95% CI: 86-96%]). Diagnostic accuracy, sensitivity and specificity for the optimal vFAI cut-point (≤0.82) were 88%, 90% and 86%, respectively. Virtual-FAI demonstrated superior discrimination against 3D-QCA–derived % area stenosis (AUC: 78% [95% CI: 70-84%]; p<0.0001 compared to vFAI). There was a close correlation (r=0.78, p<0.0001) and agreement of vFAI compared to wire-FFR (mean difference: −0.0039±0.085, p=0.59).
Conclusions: We developed a fast and simple CFD-powered virtual haemodynamic assessment model using only routine angiography and without requiring any invasive physiology measurements/hyperaemia induction. Virtual-FAI showed a high diagnostic performance and incremental value to QCA for predicting wire-FFR; this “less invasive” approach could have important implications for patient management and cost.
Introduction
Measurement of the fractional flow reserve (FFR) in the catheterisation laboratory has become the gold standard for assessing the haemodynamic significance of intermediate stenoses1,2. FFR reliably identifies ischaemia-producing lesions and improves clinical decision making as well as patient outcomes when used for PCI guidance3-5. However, FFR assessment requires insertion of a costly pressure-sensor guidewire in the coronary artery and administration of a vasodilator for inducing hyperaemia, which, among other factors, may contribute to the low adoption rate of FFR in clinical practice (<10% of intermediate stenoses evaluated by FFR in the recent US CathPCI Registry)6.
While obstructive coronary anatomy is directly linked to haemodynamic sequelae and, consequently, the production of ischaemia/anginal symptoms in patients, the accuracy of stand-alone anatomic measures (e.g., %diameter stenosis [%DS]) derived from invasive angiography or coronary computed tomographic angiography [CCTA]) is limited when assessing the functional significance of stenoses7,8. This is not surprising given the multitude of geometric features along with the specific flow rate that contribute to the calculation of the translesional pressure gradient as initially observed by Gould9 and Young10. Physiology models for the coronary circulation using basic principles of physics have been proposed previously; early efforts attempted to use simplified coronary artery dimensions assessed by quantitative arteriography for computing pressure gradients at pre-specified flow rates, thereby evaluating the haemodynamics of a stenosis from anatomy11,12, while dedicated indices like stenosis flow reserve were also presented13,14. Recently, advanced computational fluid dynamics (CFD) techniques have been applied to human CCTA imaging datasets providing a more comprehensive approach; these were shown to enhance the diagnostic performance of CCTA for predicting FFR15-17.
In the current report, we extend the previous work and present an approach for fast and simplified virtual functional assessment of coronary stenoses using three-dimensional quantitative coronary angiography (3D-QCA) and blood flow simulation. We test the diagnostic performance of the derived virtual index in a real-world patient population with intermediate lesions that were haemodynamically assessed by a pressure-sensor guidewire (wire-FFR).
Methods
A detailed description of the methods is included in the Online Appendix.
PATIENT POPULATION
Patients from four tertiary University Hospitals who underwent coronary angiography and FFR measurements for assessing intermediate lesions were retrospectively included in this study (data spanning from June 2005 to July 2013). Patients presenting with stable or unstable angina or non-ST-elevation myocardial infarction and stenoses in a major epicardial artery (left anterior descending artery [LAD], left circumflex [LCx]/obtuse marginal [OM] and right coronary artery [RCA]) were eligible for inclusion in the study. Exclusion criteria were: significant left main stem disease; vessels with bifurcational lesions; infarct-related vessels; vessels distally protected by bypass grafts; vessels with ostial stenoses; and presence of chronic total occlusions. All lesions included in the study had documented adenosine administration and wire-FFR/pressure recordings, as well as suitable angiographic projections for 3D-QCA (as described in the Methods and the Online Appendix). The study protocol was approved by the local ethics committees and written informed consent was provided by each patient for using the data for research purposes.
CARDIAC CATHETERISATION AND WIRE-FFR DATA ACQUISITION
Wire-FFR assessment was performed in vessels with intermediate lesions (30-70 %DS by visual estimation) as clinically indicated at the discretion of the operator. The recording of the position of the pressure wire distally in the coronary artery at the time of wire-FFR assessment was available, and enabled the comparison of the virtual functional assessment against the measured wire-FFR at the same location. Wire-FFR values ≤0.80 were considered diagnostic of ischaemia4.
QUANTITATIVE CORONARY ANGIOGRAPHY AND BLOOD FLOW SIMULATION
Three-dimensional QCA was performed off-line with the validated CAAS QCA-3D system (Pie Medical Imaging, Maastricht, The Netherlands)18. The end-diastolic frames of the best two full-contrast angiographic views (angle difference >30°) of the studied artery before insertion of guidewires were used for 3D-QCA reconstruction. Percentage area stenosis (%AS), %DS, minimum luminal area (MLA) and minimum luminal diameter (MLD) were derived from the 3D-QCA model. Additionally, conventional two-dimensional-QCA (2D-QCA) analysis of both projections used in 3D-QCA was performed for calculating max %DS, which may reflect daily practice in the catheterisation laboratory better.
The obtained 3D lumen geometries were further processed with computational fluid dynamics (CFD) techniques for solving the 3D transport equations governing the conservation of mass and momentum. A reference pressure of 100 mmHg (corresponding to the average aortic pressure in humans) was imposed at the inlet. Blood flow was assumed to be laminar and incompressible, and steady flow (fully developed) was specified as boundary condition at the outlet; two separate simulations with a steady flow of 1 and 3 ml/s (approximately corresponding to the average flow at rest and the hyperaemic flow increase in human coronary arteries, respectively)19,20 were performed. The pressure gradient at these two flow rates was calculated from the difference of the average pressure at the inlet (Pa) and outlet (Pd) of the CFD simulations.
DATA ANALYSIS AND CALCULATION OF THE VIRTUAL FUNCTIONAL ASSESSMENT INDEX
The simulation results were further processed in order to construct the artery-specific pressure gradient (ΔP)–flow relationship which is characteristic for every coronary obstruction21. The computed ΔP values at 1 and 3 ml/s were used to define a quadratic equation: ΔP=0+ƒv Q+ƒs Q2 (i.e., zero intercept), where ΔP is the pressure gradient (mmHg), Q is the flow rate (ml/s), ƒv (mmHg s/ml) is the coefficient of pressure loss due to viscous friction and ƒs (mmHg s2/ml2) is the coefficient of pressure loss due to flow separation9-11. From the ΔP–Q curve, the relationship of the Pd/Pa ratio vs. flow was calculated. Finally, we calculated the virtual Functional Assessment Index (vFAI) as the ratio of the area, defined by the constant Pd/Pa vs. flow relationship in a normal artery up to 4 ml/s (chosen as a universal and fixed upper limit corresponding approximately to the mean+2SD hyperaemic flow rate increase in normal human coronary arteries starting from an average flow rate of 1 ml/s at rest20, although it is an unrealistic hyperaemic flow rate in some subjects as presented in the Supplemental results in the Online Appendix and discussed in the limitations section), which is covered by the area of the artery-specific Pd/Pa vs. flow relationship. Note that the numeric value for vFAI as computed here is not mathematically equal to the value for wire-FFR (Online Appendix and Online Figure 1).
STATISTICS
The correlation between derived variables (vFAI and anatomic measures) and wire-FFR was investigated using the Pearson (r) and Spearman (rs) correlation coefficients. Bland-Altman analysis was performed with wire-FFR as the standard of reference, and the paired t-test was used to test any significant difference between the vFAI and wire-FFR. Receiver operator characteristic (ROC) curve analysis was performed to evaluate the discrimination of vFAI and QCA-derived anatomic measures (e.g., %AS) for predicting wire-FFR ≤0.80 (reference standard). Diagnostic measures including sensitivity, specificity, positive/negative predictive value and accuracy were calculated, and the optimal cut-off for vFAI and anatomic measures was determined. Except for the patient characteristics, analyses were performed on a per-vessel basis. A two-sided p-value <0.05 was considered significant.
Results
CFD processing was successfully completed in all of the selected vessels (mean length of 3D-QCA models: 59.43±21.01 mm). The average total time required for the procedure, including the extraction of the 3D-QCA anatomy (≈5 minutes), the CFD mesh construction (≈3 minutes) and the CFD computational time (≈7 minutes), was approximately 15 minutes per vessel using an off-the-shelf workstation with a quad-core 2.4 GHz (Intel core i7-3630QM) processor unit (8 GB of RAM). The average time required for the 2D-QCA analysis of the two projections was approximately five minutes/vessel.
CLINICAL AND LESION CHARACTERISTICS
A total of 139 vessels in 120 patients were studied (Table 1). The majority of patients presented with stable disease (65.8%). More than a third of the patients had a prior revascularisation procedure and 31% had a history of prior myocardial infarction.
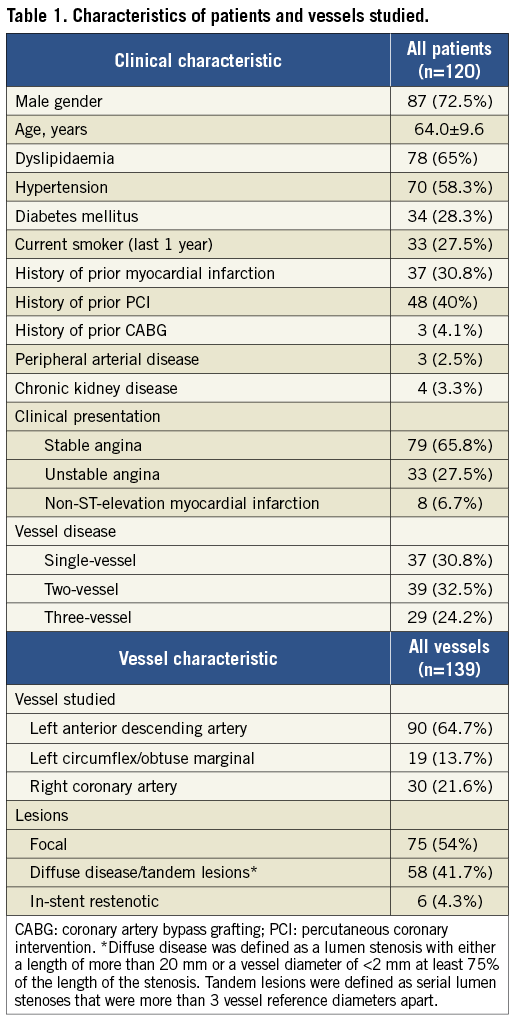
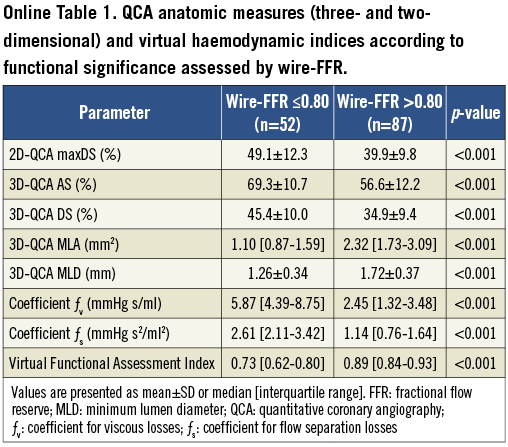
The majority of vessels had focal lesions (54%). Mean max %DS by 2D-QCA was 43.4±11.6%, whereas mean %AS and %DS by 3D-QCA were 61.4±13.1 and 38.8±10.9%, respectively. The majority of vessels had 25-50 max %DS by 2D-QCA (n=95; 68%), while there were 37 (27%) with 50-75 max %DS. Wire-FFR assessment showed that there were functionally significant lesions (wire-FFR ≤0.80) in 52 vessels (37%). The majority of cases had a wire-FFR value between 0.70 and 0.90 (n=84; 60%) reflecting the intermediate severity of the lesions studied (median FFR: 0.84 [0.75-0.90]). Computed haemodynamic indices including vFAI as well as QCA-based anatomic measures were significantly different between the two wire-FFR groups (≤0.80 vs. >0.80; Online Table 1).
DIAGNOSTIC ACCURACY OF vFAI FOR IDENTIFYING HAEMODYNAMICALLY SIGNIFICANT DISEASE
Discriminatory power of vFAI against wire-FFR was very good (AUC: 91.9% [95% CI: 86.3-96%]), and the optimal cut-point for vFAI was 0.82 (Figure 1). Diagnostic performance based on the optimal vFAI cut-point is listed in Table 2. There were 47 true positives (33.8%), 75 true negatives (54%), 12 false positives (8.6%) and five false negatives (3.6%). Sensitivity, specificity and overall diagnostic accuracy were 90.4%, 86.2% and 87.8%, respectively. A vFAI value above 0.90 had a 100% negative predictive value indicating perfect accuracy for detecting functionally non-significant disease. Representative examples of vessels with and without ischaemia-producing lesions are illustrated in Figure 2 and Figure 3, respectively (additional data in Online Figure 2).
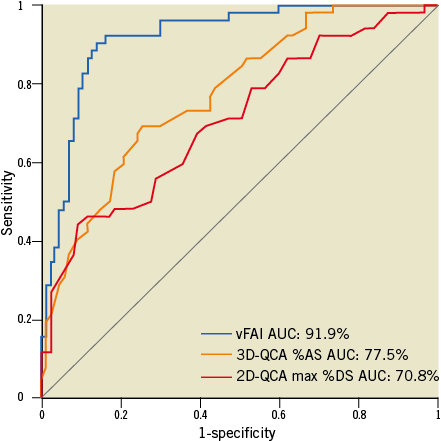
Figure 1. Receiver operator characteristic (ROC) curve analysis for the virtual functional assessment index (vFAI) against the fractional flow reserve cut-point (≤0.80: reference standard). The area under the ROC curve (AUC) was 91.9% (95% CI: 86-96%). The respective AUC for 3D-QCA %area stenosis (%AS; AUC: 77.5% [95% CI: 69.9-84.3%]; values on the ROC curve represent 1-AS) and 2D-QCA max %diameter stenosis (%DS; AUC: 70.8% [95% CI: 62.2-77.9%]; values on the ROC curve represent 1-DS) showed that vFAI had significantly higher discriminatory power (p<0.001 for both).
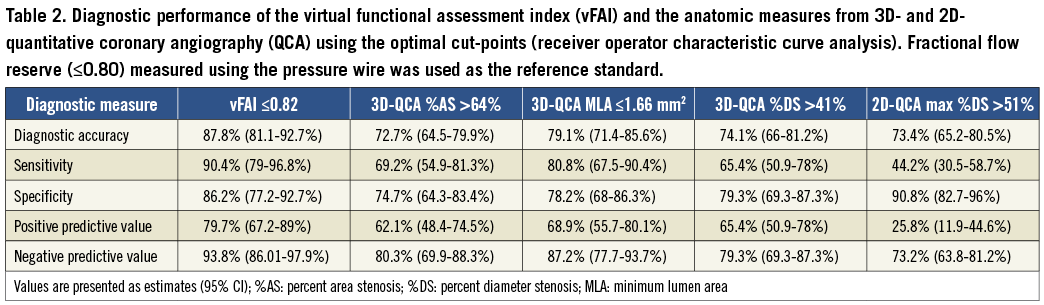
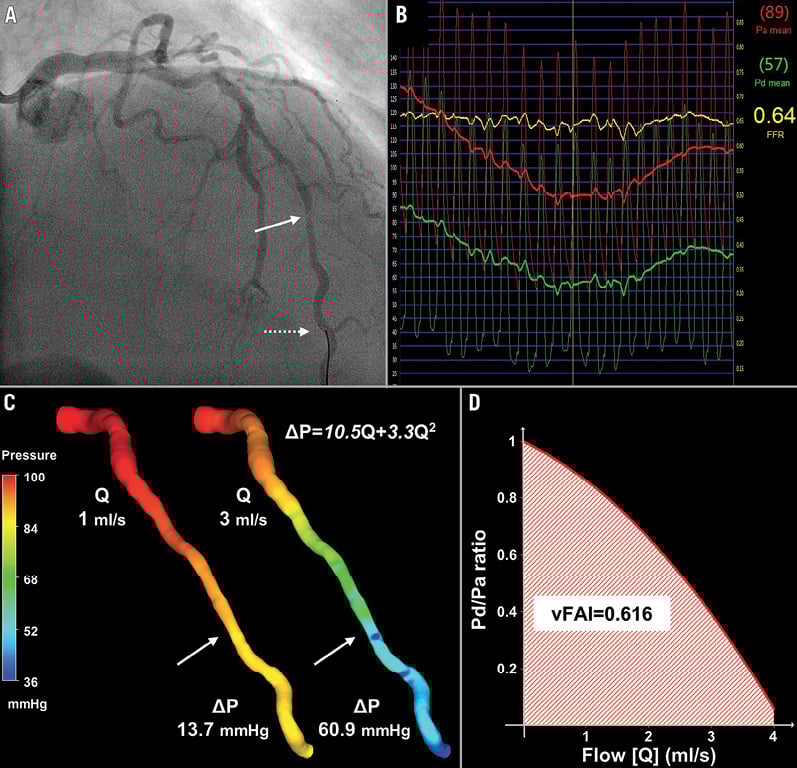
Figure 2. Intermediate lesion with haemodynamic significance. (A) Representative example of a left anterior descending artery (LAD) with a moderate lesion (arrow: maximal stenosis) in angiography (3D-QCA %diameter stenosis: 35%) that had (B) a low fractional flow reserve (FFR=0.64) measured at a distal location (dotted arrow) using the pressure wire. (C) 3D-QCA coronary lumen reconstruction with the pressure distribution in a colour-coded map for two different flow rates (Q), which resulted in a pressure gradient (ΔP) of 13.7 and 60.9 mmHg. The computed artery-specific ΔP–Q relationship is provided. The arrows denote the location of maximal stenosis. (D) Relationship between the ratio of distal to aortic pressure (Pd/Pa) and flow for the studied artery, and calculation of the artery-specific virtual functional assessment index (vFAI: 0.62) shows the good agreement with wire-FFR.
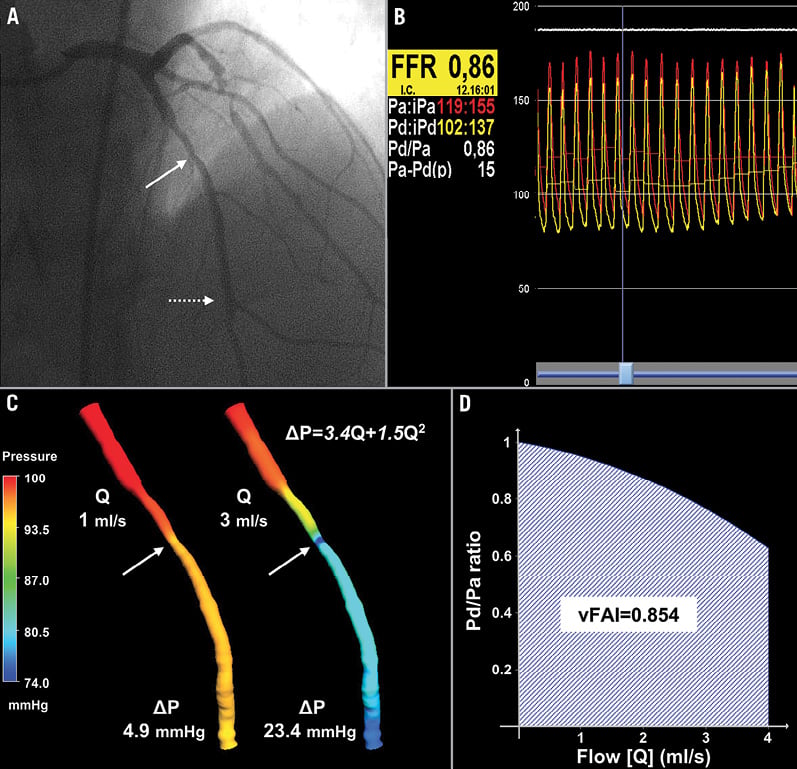
Figure 3. Intermediate lesion without haemodynamic significance. (A) Representative example of a LAD with a moderate lesion (arrow: maximal stenosis) in angiography (3D-QCA %diameter stenosis: 51%) that had (B) a high FFR (0.86) measured at a distal location (dotted arrow) using the pressure wire. (C) 3D-QCA coronary lumen reconstruction with the pressure distribution in a colour-coded map for the different flow rates. The arrows denote the location of maximal stenosis. (D) Artery-specific vFAI (0.85) shows good agreement with FFR.
Although vFAI values are not intended to be mathematically equivalent to wire-FFR values, enforcing the same cut-point (≤0.80) for vFAI as for wire-FFR yielded only a small decrease in vFAI diagnostic performance: 85.6% accuracy (95% CI: 78.7-91%); 78.8% sensitivity (95% CI: 65.3-88.9%), 89.7% specificity (95% CI: 81.3-95.2%), positive predictive value of 82% (95% CI: 68.6-91.4%) and negative predictive value of 87.6% (95% CI: 79-93.7%).
DIAGNOSTIC PERFORMANCE OF VIRTUAL FUNCTIONAL ASSESSMENT AGAINST QCA
In our exploratory analyses of diagnostic performance using wire-FFR as the reference standard, vFAI (AUC: 91.9%) demonstrated superior discrimination to QCA anatomic measures: (i) 3D-QCA %AS (AUC: 77.5%; p<0.001; Figure 1), (ii) 3D-QCA MLA (AUC: 83.9%; p<0.001) and (iii) 2D-QCA max %DS (AUC: 70.8%; p<0.001; Figure 1). Of note, 3D-QCA %AS had a borderline trend for superiority against 2D-QCA max %DS (p=0.053).
The optimal vFAI cut-point (0.82) had a higher performance for all diagnostic measures compared to the respective values of the optimal cut-points for %AS (>64%) and MLA (≤1.66 mm2) by 3D-QCA, and max %DS (>51%) by 2D-QCA as presented in Table 2.
CORRELATION AND AGREEMENT BETWEEN VIRTUAL FUNCTIONAL ASSESSMENT AND WIRE-FFR
There was a close correlation between vFAI and wire-FFR values (r=0.78, p<0.0001; rs=0.73, p<0.0001; Figure 4A), and the agreement was good (mean difference: −0.0039±0.085, p=0.59; Figure 4B).
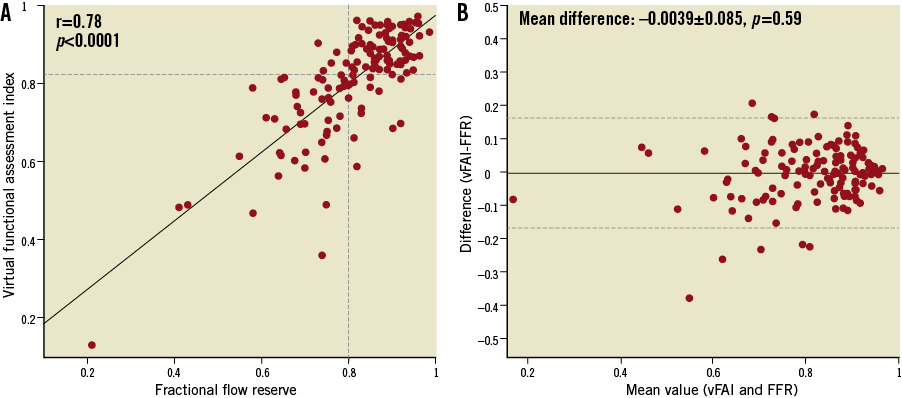
Figure 4. (A) There was a close correlation between the virtual functional assessment index (vFAI) and fractional flow reserve (FFR; r=0.78). The horizontal dashed line indicates the optimal cut-point (0.82) derived from the receiver operator characteristic curve analysis. (B) The Bland-Altman plot (provided for comparison purposes only since vFAI and FFR are not intended to be mathematically equivalent) for the agreement between vFAI and FFR showed a mean difference of −0.0039 (solid line); the dashed lines represent the values at mean±2SD.
CORRELATION BETWEEN QCA ANATOMIC MEASURES AND WIRE-FFR
There was a weaker correlation between wire-FFR and (i) %AS (r= −0.42, p<0.0001; rs=−0.49, p<0.0001), MLA (r=0.53, p<0.0001; rs=0.61, p<0.0001), %DS (r=−0.42, p<0.0001; rs=−0.47, p<0.0001) by 3D-QCA, (ii) max %DS by 2D-QCA (r=−0.39, p<0.0001; rs=−0.36, p<0.0001) compared to the correlation of vFAI with wire-FFR (Online Figure 3).
COMPARISON OF vFAI PRE- AND POST-INTERVENTION
Separate pairwise analysis was performed for post-PCI vFAI assessment in 27 cases with FFR ≤0.80 (52%) and available suitable post-PCI angiographic projections for 3D-QCA. Post-PCI vFAI was significantly increased compared to the corresponding pre-PCI value (0.70±0.14 vs. 0.89±0.05, p<0.001).
Discussion
We have developed a simplified approach for fast virtual functional assessment of diseased coronary arteries using 3D-QCA and CFD modelling based only on routine coronary angiographic data; our workflow does not require any additional patient-specific information and pressure measurements at any stage of the process, enabling both prospective and retrospective physiology assessment. The diagnostic testing of vFAI that we performed in real-world patients with intermediate coronary lesions demonstrated that this approach has a high diagnostic accuracy, correlates well with wire-FFR showing no bias, yet with wide standard deviation, and presents superior discriminatory power/diagnostic performance against stand-alone 2D/3D-QCA–derived anatomic measures of lesion severity. Our approach can be potentially implemented in any catheterisation laboratory using commercially available 3D-QCA and CFD software without requiring any additional costly systems. Currently, this is the first study testing the application of CFD in conventional angiography for “less invasive” assessment of the haemodynamic significance of coronary stenoses without requiring either the pressure wire or any vasodilator administration.
COMPARISON OF vFAI TO PREVIOUS VIRTUAL PHYSIOLOGY MODELS
Early simple and latest advanced physiology models for the coronary circulation have been proposed exploiting the information within the images from cardiovascular patients14-17,22,23. The current method only requires routine coronary angiographic data for 3D-QCA, proposing a “less invasive” functional assessment without the need for the pressure wire and drug-induced vasodilation as compared to wire-FFR assessment. This is similar to the workflow applied by Morris et al22 to a very limited sample (Table 3); however, they used rotational coronary angiography for acquiring coronary geometry data, which is both less readily available and more demanding to perform. Additionally, they employed a lumped approach (Windkessel) to model the downstream boundary conditions of resistance, which is based on empirically derived pressure values over the heart cycle (i.e., pulsatile pressure profile), thereby requiring invasive measurements similar to the ones performed during the wire-FFR procedure for optimisation purposes. Furthermore, owing to pulsatile flow CFD simulations, which are much more time-consuming (≈24 hrs), their workflow would be hard to implement in the future in an on-line fashion in the catheterisation laboratory. In contrast, we present a simplified approach taking advantage of fundamental haemodynamic relationships and CFD applications in patient-specific coronary geometries, thus providing fast virtual functional assessment without requiring any additional personalised data, such as pressure measurements, at any stage of the process. Our approach also enables vFAI calculation between any two locations selected along the single artery studied (e.g., as would be required for separate assessment of tandem lesions).
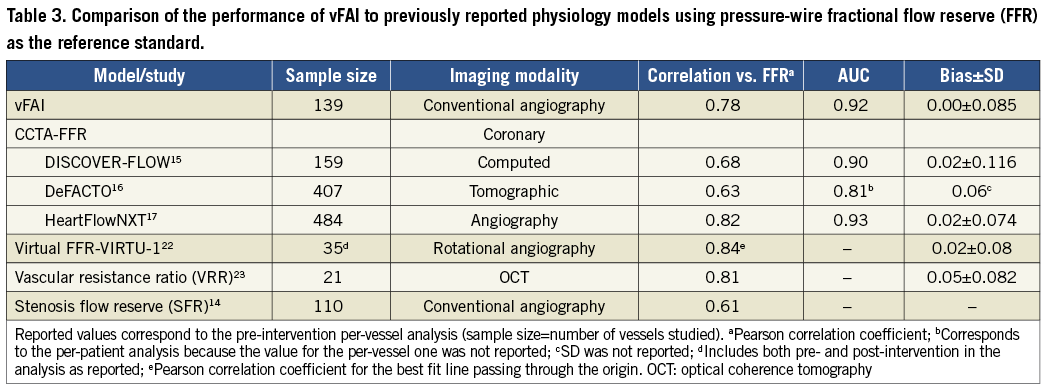
Recently, CCTA-FFR was developed to provide non-invasive functional/anatomical assessment of the coronary tree. CCTA-FFR uses CFD coupled with an elaborate combination of lumped models for both the systemic circulation and the coronary microcirculation requiring approximately five hours of processing time per patient24,25. The CCTA-FFR studies showed that the non-invasive virtual index correlated well with wire-FFR (r≈0.6-0.8; Table 3) and had significantly increased discriminatory power against stand-alone CCTA considering wire-FFR as the reference standard15-17. The latest data from the NXT trial reflecting close adherence to CTA image acquisition protocols and technological improvements demonstrated a per-vessel diagnostic accuracy of 86%17.
The correlation between vFAI and wire-FFR was in the same range as in previous studies presenting physiology models (Table 3), while agreement and diagnostic performance (accuracy: 88%) were very good; vFAI also provided superior discrimination/diagnostic performance against the QCA anatomic measures, thereby justifying its potential use as an adjunctive modality in the patient-management workflow. However, it becomes evident from previous work as well as from our own that all virtual indices perform similarly with reasonable behaviour for the group (i.e., small mean difference) but demonstrate a significant scatter (i.e., substantial standard deviation) in comparison with wire-FFR, which may remain insufficient for individual patient decisions.
CHALLENGES AND CLINICAL IMPLICATIONS OF VIRTUAL FUNCTIONAL ASSESSMENT USING ROUTINE ANGIOGRAPHY
Blood flow simulation can provide a comprehensive approach by taking full advantage of the 3D anatomical data and by directly adding the missing functional element. Nonetheless, realistic artery-specific anatomy is the foundation for any CFD process and, thus, both the resolution of raw images and the accuracy of the 3D reconstruction by existing algorithms and their approximations are critical for the simulation results.
Physiological parameters of coronary microcirculation and resistance of the underlying myocardium as well as their influence in coronary flow during hyperaemia are difficult to model, even with sophisticated algorithms. Reduced vasodilation of arterioles with increased resistance after hyperaemia induction, such as in cases of dysfunction (e.g., diabetes) or damage (i.e., myocardial infarct), certainly pose a challenge for modelling purposes. In such cases, virtual functional assessment would overestimate the haemodynamic lesion severity compared to wire-FFR, which, conversely, is known to yield higher FFR values than expected21.
Despite the challenges of modelling physiology, virtual functional assessment is a promising approach providing an incremental value to stand-alone coronary imaging. Coupled with the superior resolution of invasive angiography, which remains the cornerstone for coronary disease diagnosis, playing an essential role in the path towards intervention, virtual functional assessment –as presented in the current study– could prove to be a valuable tool, overcoming the limitations of angiography as shown by the superiority of vFAI vs. 2D/3D-QCA metrics. However, we acknowledge that the point-by-point comparison of vFAI vs. wire-FFR presents quite a large variation, as was also the case in previous studies exploring similar virtual indices (Table 3), thereby making this approach too imprecise for substituting the well-established wire-FFR in clinical practice. Still, rather than considering the proposed approach as competitive with wire-FFR assessment, we would emphasise the complementary role that our proposed approach could acquire for clinical use. Given the high diagnostic accuracy and, particularly, the high negative predictive performance of vFAI (a vFAI value above 0.90 had a 100% negative predictive value in our patient population), vFAI could potentially guide clinical decisions by defining a group of patients that would not need further evaluation with wire-FFR, thereby reducing the additional use of the pressure wire/vasodilators. Of note, following such a strategy would translate into 27% of the cases (i.e., those with vFAI >0.90) being deferred from wire-FFR assessment according to the results in our population with intermediate lesions. Consequently, this less expensive and less invasive strategy could broaden the application of haemodynamic assessment in catheterisation laboratories, thereby increasing the number of well-informed clinical decisions and overall, could be proven to be time- and cost-effective.
LIMITATIONS
This is a medium-sized population study and thus further prospective studies with much larger patient populations are warranted for validating our approach. Additionally, our CFD models did not include the effect of any side branches and therefore made the assumption that coronary flow remains the same along the length of each single artery across proximal or more distal lesions. Incorporation of at least one major side branch in the 3D model, which is feasible with existing 3D-QCA software, could be added in future work and would address this issue to a large extent, at least when evaluating stenoses in proximal and middle coronary segments where clinical interest is primarily focused. Nonetheless, we acknowledge that modelling of a large branched network would he highly demanding, increasing the complexity of the 3D-CFD process. Also, due to the use of pre-specified uniform flow values, the mass and functional capacity of the distal myocardial bed, which affect coronary flow, are not incorporated into the proposed model. Our simulations show that a universal hyperaemic flow limit of 4 ml/sec produces implausible pressure gradients in some cases. Therefore, our assumption of a fixed value oversimplifies a complex boundary condition; further work on vFAI will explore methods to adjust the maximum flow rate. Finally, 3D-QCA is not widely available in catheterisation laboratories and may pose an additional cost.
Conclusions
This study investigated the diagnostic performance of a virtual functional assessment approach from routine angiographic data empowered with CFD analysis. The proposed approach does not require any pressure measurements/hyperaemia induction and provides virtual functional assessment in a simplified and fast manner, enabling on-line prospective or post hoc/retrospective (off-line) evaluations. Our analysis in a real-world patient population, with lesions of intermediate angiographic severity, namely those of great clinical interest, showed that our derived virtual index has superior diagnostic performance to stand-alone angiographic measures for predicting wire-FFR. Therefore, the proposed approach is promising and worthy of further investigation that would also test the potential benefit in patient management and cost.
| Impact on daily practice Fractional flow reserve measured invasively using the pressure wire after hyperaemia induction has been established as a valuable method for assessing the haemodynamic significance of coronary stenoses and guiding percutaneous coronary intervention, but it is not widely adopted in clinical practice. Conventional angiography has a pivotal role in coronary artery disease diagnosis and, as shown in this study, can also be used for virtual functional assessment of coronary lesions employing three-dimensional quantitative coronary angiography and blood flow simulation techniques. This less invasive strategy, based on routine angiographic data without requiring the pressure wire and vasodilator-induced hyperaemia, could be applied in daily practice for easier, wider, and potentially less expensive application of haemodynamic assessment of coronary lesions in the catheterisation laboratory. |
Guest Editor
This paper was guest edited by Nicolas Foin, MSc, PhD; National Heart Centre, Singapore.
Acknowledgements
We acknowledge the support of the George D. Behrakis Fellowship. We thank Antonis Sakellarios, BSc, for technical support with the CFD simulations.
Funding
This work is partly funded by the European Union (European Regional Development Fund - ERDF) and the Greek national funds through the Operational Program “THESSALY - MAINLAND GREECE AND EPIRUS - 2007-2013” of the National Strategic Reference Framework (NSRF 2007-2013; MIS 348133).
Conflict of interest statement
The authors have no conflicts of interest to declare. The Guest Editor has no conflicts of interest to declare.
Appendix. Supplemental methods
CARDIAC CATHETERISATION AND WIRE-FFR DATA ACQUISITION
Routine cardiac catheterisation and coronary angiography were performed according to standard clinical practice, and angiographic images were acquired using monoplane or biplane systems with or without flat panel detectors (AXIOM-Artis; Siemens Healthcare, Munich, Germany; Integris Allura, Allura Xper, Integris H; Philips Medical Systems, Amsterdam, The Netherlands). At least two full-contrast projections optimised for angle according to cardiac position were available in all studied arteries. Wire-FFR assessment was performed in vessels with intermediate lesions (30-70 %DS by visual estimation) as clinically indicated at the discretion of the operator. After administration of nitroglycerine, a pressure-sensor guidewire (PressureWire/RadiAnalyzer; St. Jude Medical Systems, Uppsala, Sweden; PrimeWire Prestige or ComboWire; Volcano Corporation, San Diego, CA, USA) was advanced distally in the coronary artery past a region with luminal stenosis(es). The recording of the position of the pressure wire distally in the coronary artery at the time of wire-FFR assessment was available and enabled the comparison of the virtual functional assessment against the measured wire-FFR at the same location. In a minority of cases where a projection with the pressure wire was not available, the location for wire-FFR assessment was selected based on an anatomical landmark (side branch) distal to the lesion. Maximal hyperaemia was induced by administration of either intravenous (140 μg/kg per minute) or intracoronary (60 and 50 μg in the left and right coronary artery, respectively) adenosine. Wire-FFR was measured as the ratio of mean distal coronary pressure (Pd) to mean aortic coronary pressure (Pa) during hyperaemia. Wire-FFR values ≤0.80 were considered diagnostic of ischaemia4.
QUANTITATIVE CORONARY ANGIOGRAPHY AND BLOOD FLOW SIMULATION
Three-dimensional QCA was performed off-line with the validated CAAS QCA-3D system (Pie Medical Imaging, Maastricht, The Netherlands)18. The end-diastolic frames of the best two full-contrast angiographic views (angle difference >30°) of the studied artery before insertion of guidewires were used for 3D-QCA reconstruction. All cases included in the study had angiographic data with documented values for the angulation and source-to-image intensifier distance in the DICOM files as needed for the 3D-QCA procedure. Proximal and distal landmarks for 3D-QCA were defined manually as (i) the ostium of the epicardial artery studied (i.e., ostium of LAD, LCx or RCA; the left main artery was not included in the model of the left arteries), and (ii) the location corresponding to the position of the pressure-sensor guidewire distally where the wire-FFR measurement was performed or a side branch distal to the lesion(s) assessed. Percentage area stenosis (%AS), %DS, minimum luminal area (MLA) and minimum luminal diameter (MLD) were derived from the 3D-QCA model. Additionally, conventional 2D-QCA analysis of the two projections used in 3D-QCA was performed for all cases for calculating max %DS by 2D-QCA, which may reflect daily practice in the catheterisation laboratory better.
The obtained 3D lumen geometries were further processed with computational fluid dynamics (CFD) techniques that can provide the detailed characteristics of intravascular blood flow and the pressure field, thus enabling the computation of the pressure gradient between the inlet and outlet of the studied coronary segment. A finite volume mesh of approximately 1.4 million tetrahedrons on average was generated in order to perform blood flow simulation by solving the 3D transport equations governing the conservation of mass and momentum (ICEM CFD and CFX 11; Ansys, Canonsburg, PA, USA). Blood was treated as a homogeneous and Newtonian fluid with a dynamic viscosity of 0.0035 Pa·s and a density of 1,050 kg/m3. The arterial wall was considered to be rigid and no-slip conditions were applied at the vessel wall, while a reference pressure of 100 mmHg (corresponding to the average aortic pressure in humans) was imposed at the inlet. Blood flow was assumed to be laminar and incompressible and steady flow (fully developed) was specified as boundary condition at the outlet. Two separate simulations with a steady flow of 1 and 3 ml/s (approximately corresponding to the average flow at rest and the hyperaemic flow increase in human coronary arteries, respectively)19,20 were performed. The pressure gradient at these two flow rates was calculated from the difference of the average pressure at the inlet (Pa) and outlet (Pd) of the CFD simulations.
RATIONALE AND CALCULATION OF THE VIRTUAL FUNCTIONAL ASSESSMENT INDEX
The difficulty in virtually assessing FFR primarily arises from the fact that a boundary condition of coronary flow (e.g., at the outlet of the coronary artery studied) is required to perform the CFD simulation. However, hyperaemic flow, as required for FFR assessment, is variable, not known, and difficult to quantify for each specific artery without inserting a catheter26, since flow intrinsically depends on the vasodilation of the underlying myocardium (i.e., resistance of coronary microcirculation) and the haemodynamic status of the patient27.
The foundation of our approach for calculating the virtual functional assessment index (vFAI) is the artery-specific quadratic pressure gradient (ΔP)–flow relationship: ΔP=0+ƒv Q+ƒs Q2 (i.e., zero intercept; Equation 1), where ΔP is the pressure gradient (mm Hg), Q is the flow rate (ml/s), ƒv (mmHg s/ml) is the coefficient of pressure loss due to viscous friction and ƒs (mmHg s2/ml2) is the coefficient of pressure loss due to flow separation9-11. In each case studied, the two computed ΔP values at 1 and 3 ml/s from the CFD simulations were used in order to solve the fully determined system of this quadratic equation with two unknown parameters (i.e., the two coefficients ƒv and ƒs).
From the ΔP–Q equation, the equation describing the relationship of the Pd/Pa ratio vs. flow was calculated as Pd/Pa=1−ƒv Q/Pa−ƒs Q2/Pa by substituting ΔP with (Pa − Pd) in Equation 1 and then transforming Equation 1 (i.e., by dividing both sides of the equation with Pa) so that in the end Pd/Pa is calculated. A reference value of 100 mmHg (mean aortic pressure in humans) was used for Pa and since the two coefficients were calculated in the previous step, all parameters on the right side of the Pd/Pa vs. flow equation are known. To account for the “overall behaviour” of the artery/stenosis-specific Pd/Pa vs. flow relationship in each case, the area under the Pd/Pa vs. flow curve was calculated (i.e., calculation of the integral of the equation); the area was calculated for a flow range of 0 to 4 ml/sec (corresponding approximately to the mean+2SD hyperaemic flow rate increase in normal human coronary arteries starting from an average flow rate of 1 ml/s at rest)20. In the large epicardial coronary arteries without atherosclerotic disease/stenoses, resistance is trivial and thus there is virtually no pressure drop and the Pd/Pa ratio is equal to 1; consequently, in normal arteries the Pd/Pa vs. flow relationship can be considered to be approximately constant, and the area under the horizontal line for a flow range from 0 to 4 ml/sec is also known (reference area for normal artery without a stenosis). Finally, vFAI was calculated as the ratio of the area under the artery-specific Pd/Pa vs. flow curve to the reference area (Online Figure 1).
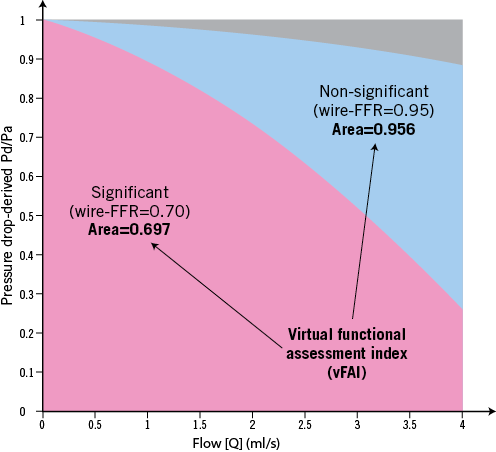
Online Figure 1. Calculation of the virtual functional assessment index (vFAI). The relationship of the Pd/Pa ratio vs. flow was calculated as Pd/Pa=1−ƒv Q/Pa−ƒs Q2/Pa, where Pa is the aortic pressure, Pd the coronary pressure distal to the stenosis, Q is the flow rate (ml/s), and ƒv (mmHg s/ml) and ƒs (mmHg s2/ml2) are the coefficients of pressure loss due to viscous friction and flow separation, respectively. A reference value of 100 mmHg (mean aortic pressure in humans) was used for Pa. To calculate vFAI, (1) we consider that there is no pressure loss through normal arteries (i.e., Pa is transmitted completely along a normal artery), and thus Pd/Pa is constant and equal to 1; (2) the area under the curve of a normal artery up to Q=4 ml/s (i.e., approximately the mean+2SD of hyperaemic flow in human coronary arteries) is used as a normal reference value; and (3) the area-under-the curve of the studied coronary segment is calculated based on the specific Pd/Pa vs. flow curve and is expressed as a ratio compared to the reference area. The figure demonstrates two representative examples of an artery with haemodynamically significant stenosis (wire-FFR=0.70) and vFAI=0.697 (red area) and an artery with non-significant stenosis (wire-FFR=0.95; vFAI=0.956). The grey area represents the difference between the reference area (i.e., normal artery) and the area of the artery with non-significant stenosis, while the blue area represents the difference in areas between the two arteries.
Note that vFAI is not mathematically equivalent to wire-FFR since
![]()
using a flow range of 0 to 4 ml/sec. While FFR has an accepted physiologic interpretation, namely the ratio of maximum flow with the stenosis to maximum flow without the stenosis, vFAI has only a geometric interpretation. Namely, vFAI equals the ratio of the area (up to a universal and fixed flow limit) under the pressure drop versus flow curve with the stenosis to the ideal area without a stenosis. Although FFR values generally do not fall below about 0.2 due to a complex interplay among collateral flow, zero-flow pressure, and/or venous pressure, this area contributes to vFAI for every stenosis regardless of severity.
STATISTICS
Categorical variables are presented as counts and percentages, and continuous variables as mean±SD and median [interquartile range] as appropriate. The unpaired t-test was used to compare normally distributed continuous variables between two groups, whereas the Mann-Whitney U test was used for non-normally distributed variables. The correlation between derived variables (vFAI and anatomic measures) and wire-FFR was investigated using the Pearson (r) and Spearman (rs) correlation coefficients. Bland-Altman analysis was performed with wire-FFR as the standard of reference, and the paired t-test was used to test any significant difference between the vFAI and wire-FFR. Receiver operator characteristic (ROC) curve analysis was performed to evaluate the discrimination of vFAI and QCA-derived anatomic measures (e.g., %AS) for predicting wire-FFR ≤0.80 (gold standard); the areas under the ROC curve (AUCs) were calculated with binomial exact confidence intervals and were compared using the DeLong method. Diagnostic measures including sensitivity, specificity, positive/negative predictive value and accuracy were calculated, and the optimal cut-off for vFAI and anatomic measures was determined (ROC criterion: max[sensitivity+specificity]). Except for the patient characteristics, analyses were performed on a per-vessel basis (assuming independence of lesion-specific ischaemia in vessels) using SPSS 17.0 (SPSS Inc., Chicago, IL, USA) and Stata 10.0 (StataCorp LP, College Station, TX, USA). A two-sided p-value <0.05 was considered significant.
Supplemental results
PRESSURE GRADIENT USING A UNIVERSAL UPPER LIMIT FOR FLOW RATE
We tested our fixed hyperaemic flow limit by performing additional simulations for all cases using a boundary condition of 4 ml/sec for coronary flow. Given the range of derived pressure gradients at this high flow rate (mean: 48.96±54.36 mmHg; interquartile range: 22.78-59.1 mmHg; 5-95% percentile: 11.81-104.83 mmHg; max: 573.1 mmHg; min: 9.7 mmHg), the selection of a pre-specified aortic pressure value and hyperaemic flow limit poses a problem since there were even some cases with a pressure gradient of >200 mmHg, which is above any values (even in hypertensive cases) present in human conditions. However, we also note that in most cases (as presented by the 95% percentile: 104.83 mmHg) the above-mentioned selection yields a rather realistic value of pressure gradient for human coronaries, reflecting our original assumption corresponding to the mean +2SD hyperaemic flow rate increase in normal human coronary arteries starting from an average flow rate of 1 ml/s at rest4.
Online references
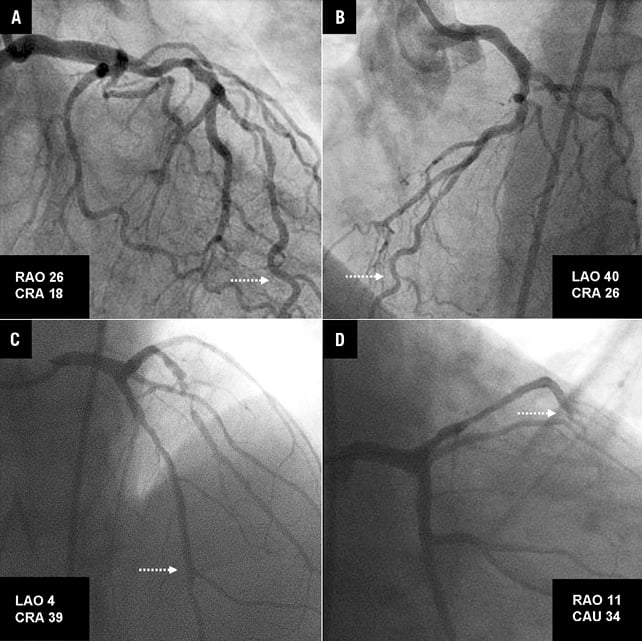
Online Figure 2. Pairs of projections used for 3D-QCA reconstruction of the coronary segments presented in the examples of Figure2 (corresponding to A and B in this figure) and Figure3 (corresponding to C and D in this figure) of the main manuscript. The dotted arrows mark the location of the distal landmark of the reconstruction where the pressure wire was positioned for fractional flow reserve assessment.
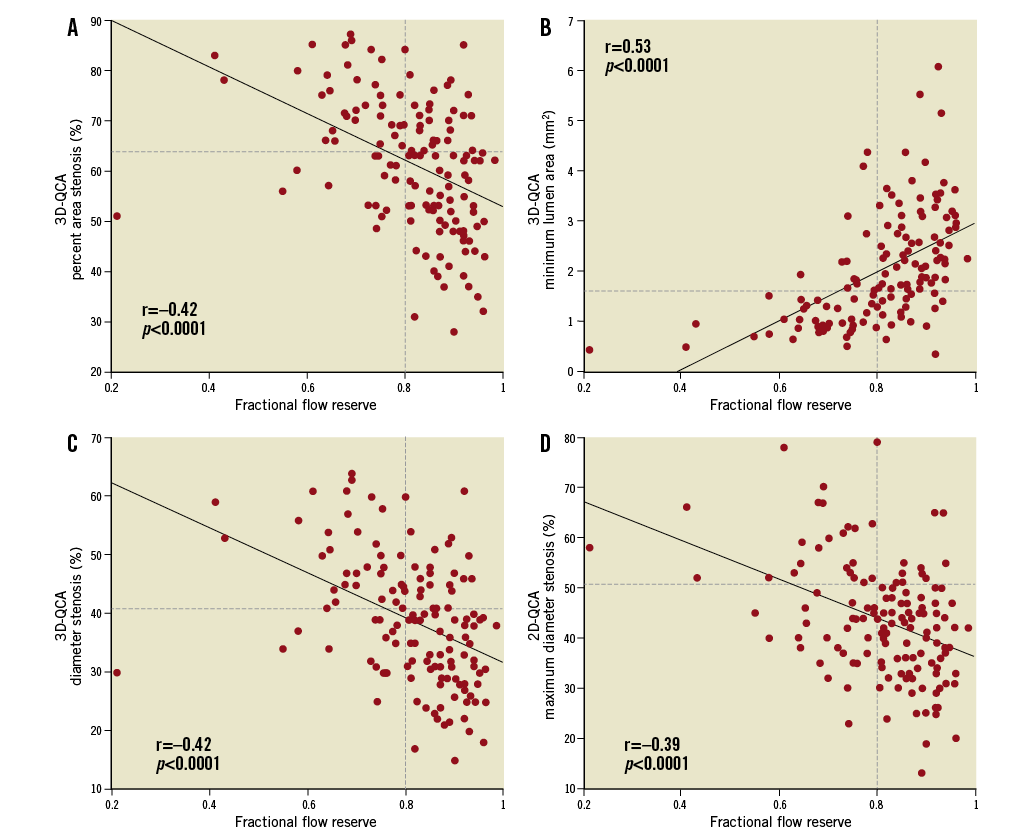
Online Figure 3. There was a moderate correlation between 2D/3D-QCA-derived anatomic measures (A: % area stenosis; B: minimum lumen area; C: % diameter stenosis; D: maximum % diameter stenosis) and fractional flow reserve by the pressure wire. Horizontal dashed lines indicate the optimal cut-points (64%, 1.66 mm2, 41%, and 51%, respectively) derived from the receiver operator characteristic curve analysis. QCA: quantitative coronary angiography.