Introduction
Case-control studies have always played a significant role in identifying risk factors for chronic diseases associated with lifestyle and their influence on chronic diseases, including the risk of developing coronary artery disease (CAD) [1]. Currently, the connection between classic risk factors, such as smoking tobacco, hyperlipidaemia, diabetes and arterial hypertension, and the development of atherosclerosis is well known. Despite this fact, in Europe, 16% of deaths in males and 10% in females under 65 years old are caused by CAD. Premature occurrence of CAD is a particularly strong risk factor for first-degree relatives, who may also develop premature CAD [2]. Moreover, premature CAD may also be connected with hereditary lipid metabolism disorders [3] or dietary patterns [4]. Genome-wide association studies (GWASs) have made progress in elucidating single nucleotide polymorphisms (SNPs) associated with the occurrence of premature CAD [5]. Additionally, over the past couple of years, there has been an increased interest in high-throughput methods, such as mass spectrometry (MS) and proton nuclear magnetic resonance spectroscopy (1HNMR) [6], and their abilities to simultaneously determine a number of metabolites in body fluids. Advanced statistical analysis of the results obtained using these methods allows for the creation of a metabolic profile of the examined samples and evaluation of their connection to known CAD risk factors. The research hypothesis of the MAGNETIC project is based on the assumption that there are differences in metabolic profiles between a group of patients with a positive family history (FH) of premature CAD and a group of patients with identifiable genetic (SNP identified in GWASs) or classic (obesity, smoking tobacco, and hypercholesterolaemia among others) CAD risk factors.
The main aim of this study is to broaden knowledge about the pathogenesis of atherosclerosis by answering questions regarding the mechanisms by which FH of premature CAD increases the risk of CAD, using an assessment of dietary habits, lifestyle and genetic factors and the metabolic profiles of young healthy individuals with and without FH of premature CAD.
Material and methods
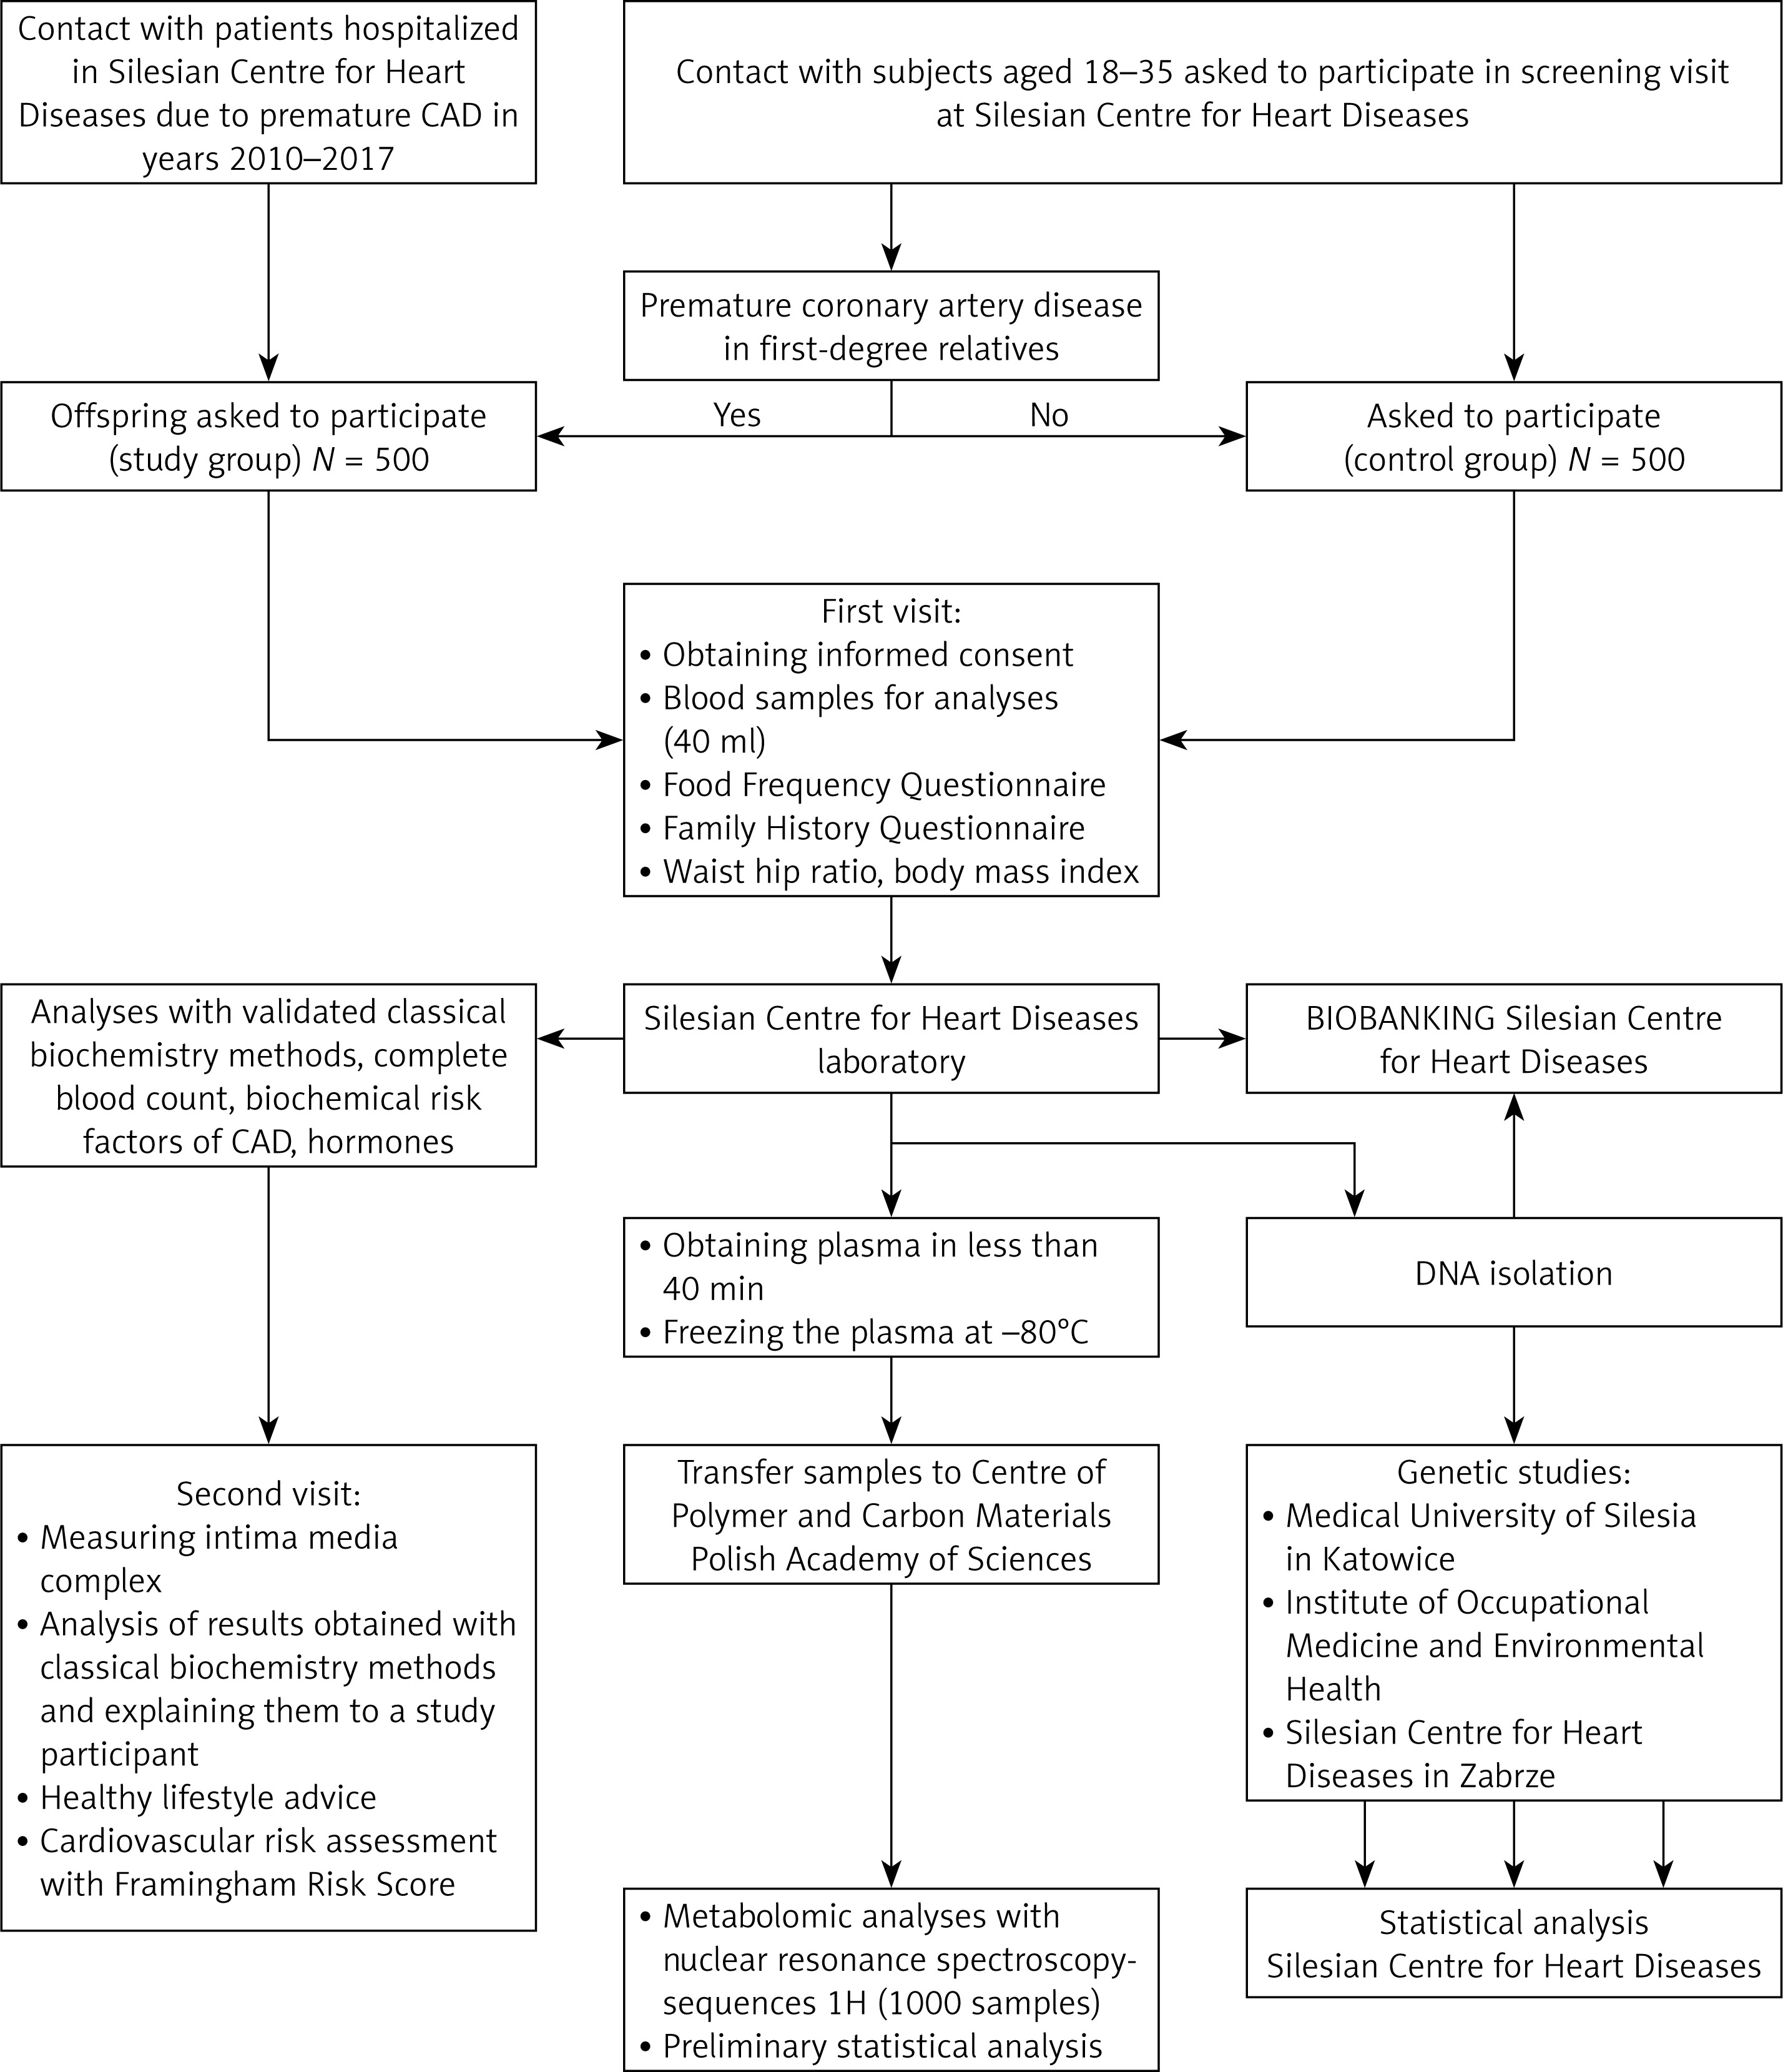
Metabolic and genetic profiling of young adults with and without a family history of premature coronary heart disease (MAGNETIC) is a case-control study. The study is financed by the National Science Centre (UMO-2014113IBINZ5/03166, OPUS 7). The study is being conducted in accordance with the Declaration of Helsinki and good clinical practice guidelines. The study protocol has been approved by the Ethics Committee at the Institute of Occupational Medicine and Environmental Health, Sosnowiec (Resolution no. 03/2013).
The study design is presented in Figure 1.
Research hypothesis and aims of the project
The research hypothesis of the MAGNETIC project is based on the assumption that there are differences in metabolic profiles between a group of patients with a positive FH of premature CAD and a group of patients with identifiable genetic (SNP identified in GWASs) or classic CAD risk factors (obesity, smoking tobacco, and hypercholesterolaemia among others). The aims of this study are to a) determine metabolic profiles using 1HNMR spectroscopy in a group with a positive FH or a negative FH of premature CAD; b) analyse the relationship between the metabolic profile evaluated by 1HNMR spectroscopy and CAD-related SNP; c) assess a metabolome for a new CAD-related biomarker/biomarkers in a group of young adults; and d) evaluate the relationships between intima media thickness (IMT) and the metabolome and SNPs associated with an increased risk of premature CAD occurrence.
Examined population
Patients with a positive FH of premature CAD (study group) are being recruited from the offspring of Silesian Centre for Heart Diseases patients who were hospitalized due to premature CAD and agreed to telephone contact after their treatment finishes. The control group is being recruited from people aged 18–35 years without an FH of CAD. The criteria for inclusion and exclusion are presented in Table I.
Demographics, FH and physical examination
Information regarding age, place of residence, education of probands and their parents, jobs and physical activities performed at work and at leisure will be obtained by means of a structured questionnaire. The recruited patients together with a qualified interviewer will fill in a detailed questionnaire regarding a positive or negative FH of cardiovascular diseases and other chronic diseases: diabetes, neoplastic diseases, or connective tissue diseases. Arterial blood pressure, pulse, weight, height, and waist and hip circumference will be measured. The female patients will be asked to report the first day of their menstrual cycle.
Evaluation of dietary patterns
Dietary patterns are evaluated by using the only validated questionnaires available in Poland, i.e., a food frequency questionnaire (FFQ-6) [7] and a questionnaire on eating behaviour (KomPAN) designed by scientists from the Polish Academy of Sciences [8].
The FFQ is a semi-quantitative questionnaire measuring the frequency of food intake over the last 12 months. The main part of the FFQ-6 regards the consumption frequency of 62 food groups. Respondents may choose from 6 frequency categories of food intake: (1) never or hardly ever, (2) once a month or less often, (3) several times a month, (4) several times a week, (5) every day, and (6) several times a day [7].
The KomPAN questionnaire was designed as a supplement to the previously used questionnaire on eating behaviour (QEB) [8]. The KomPAN questionnaire includes four separate parts evaluating the dietary patterns, information regarding frequency of food intake, views on food and nutrition and questions regarding lifestyle [8].
Laboratory tests
Blood will be drawn from every patient between 7 am and 9 am, approx. 8–10 h after the last meal. Complete blood count (CBC) will be analysed by a Sysmex XE2100 (Sysmex Corporation, Kobe, Japan), whereas biochemistry tests will be analysed by a Cobas 6000 (Roche Diagnostics, Indianapolis, IN, USA) using Roche reagents. The list of performed tests can be found in Table II. Additional biochemical tests may be carried out.
Table II
Laboratory tests performed
All patients will receive healthy lifestyle advice and receive medical consultation in the context of the laboratory test results that they are given.
IMT measurement
Carotid artery ultrasound with IMT measurement is to be performed in all patients included in the study. The ultrasound will be performed on a VIVID E9 system (GE, Healthcare) using a 7-1-MHz linear probe by a qualified technician who is blinded to the patient’s FH. IMT measurement will be done automatically during diastole (R wave peak) using dedicated software, at the 10-mm section, 5-10 mm away from the bulb, by means of the VIVID E9 system (GE, Healthcare) with a 7–14-MHz linear probe.
Genetic profiling
In all patients included in the study, single nucleotide polymorphisms (SNPs) with a verified relation to premature coronary heart disease (CHD) in GWAS are to be assessed, as shown in Table III [9–19]. The criterion for selecting the analysed SNPs was verification of their relation to premature CHD in the European population in at least two GWASs. However, the list of SNPs is open, and we will consider analysing other SNPs, provided that there will be sufficient data to support such analyses. Ten of the polymorphisms analysed in this study were independently identified as increasing the risk of myocardial infarction in three GWASs, whereas the relation of the other analysed SNPs appeared in four GWASs. SNP genotyping uses dedicated probes with a fluorescent reporter dye and real-time PCR (Cobas, Roche), as described previously [20]. Briefly, the TaqMan genotyping assays use 5′ nuclease analysis to amplify and detect specific SNP alleles. Each assay will contain two primers and two TaqMan MGB (minor groove binder) probes to detect alleles. The MGB probes consist of a reporter dye: VIC dye at the 5′ end of the allele 1 probe and 6FAM dye linked to the 5′ end of the allele 2 probe, an MGB, and a non-fluorescent quencher (NFQ) at the 3′ end of each probe. During the data analysis, an increase in VIC dye fluorescence will be observed for homozygosity of allele 1, whereas an increase in 6FAM dye fluorescence will be observed for homozygosity of allele 2. High fluorescence of both dyes is observed when the alleles are heterozygous. Unknown samples will be genotyped with negative and positive controls. At least 10% of samples will undergo repeat genotyping for quality control.
Table III
SNPs identified in at least two GWASs associated with premature MI
| Chromosome region/gene | Polymorphism | Frequency in European population (%) | References |
|---|---|---|---|
| 1.p13.3, PSRC1 | rs599839 | 77 | [9–11] |
| 2q33.2 WDR12 | rs6725887 | 14 | [11, 12] |
| 3q22.3, MRAS | rs9818870 | 15 | [13] |
| 6q26-27, SLC22A3 | rs2048327 | 18 | [11] |
| 6q26-27, LPAL2 | rs3127599 | 18 | [11] |
| 6q26-27, Lp(a) | rs7767084 | 18 | [11] |
| 6q26-27, Lp(a) | rs10755578 | 18 | [11] |
| 6p24, PHACTR1 | rs12526453 | 65 | [9–11] |
| 9p21.3, CDKN2A, CDKN2B | rs1333049 | 52 | [9–11] |
| 9p34.2, AB0 | rs579459 | 26 | [14–16] |
| 10q11, CxCL12 (SDF-1) | rs501120 | 84 | [9–11] |
| 12q24.3 HNFA1 | rs2258287 | 36 | [17, 18] |
| 15q25.1 ADAMTS7 | rs3825807 | 27 | [14, 19] |
| 21g22, MRPS6, KCNE2 | rs9982601 | 13 | [11] |
[i] PSRC1 – proline/serine-rich coiled-coil 1, WDR12 – WD repeat domain 12, MRAS – muscle RAS oncogene homolog, SLC22A3 – solute carrier family 22 (organic cation transporter), member 3, LPAL2 – lipoprotein, Lp(a)-like 2, pseudogene LPA – lipoprotein Lp(a), PHACTR1 – phosphatase and actin regulator 1, CDKN2A – cyclin-dependent kinase inhibitor 2A, CDKN2B – cyclin-dependent kinase inhibitor 2B, AB0 – transferase A, a 1-3-N-acetylgalactosaminyltransferase, transferase B, a 1-3-galactosyltransferase, CXCL12 – chemokine (C-X-C motif) ligand 12, SDF-1 – stromal cell-derived factor 1, HNFA-1 – hepatocyte nuclear factor 1, ADAMTS7 – ADAM metallopeptidase with thrombospondin type 1 motif, 7, MRPS6 – mitochondrial ribosomal protein S6, KCNE2 – potassium voltage-gated channel, Isk-related family, member 2.
Sequencing
Sequencing will be used to validate the positive controls of the analysed SNPs. PCR amplicons will be purified (BigDye XTerminator Purification Kit, Thermo Fisher, USA) and then will be sequenced directly, in both directions, using an ABI PRISM BigDye Terminator v3.1 Cycle Sequencing Kit (Thermo Fisher, USA) in a 3130 Genetic Analyser (Thermo Fisher, USA); the results will be analysed with Applied Biosystems Sequencing Analysis Software (Thermo Fisher, USA).
Metabolomic profiling
Metabolomic profiling is to be performed using a high-sensitivity Bruker AVANCE II 600 MHz Ultra Shield Plus NMR spectroscope. 1H sequences will be used. Blood will be collected using appropriate vacutainers for plasma isolation. Three 5-ml aliquots will be taken from each patient to secure blood for metabolomic analyses. Vacutainers for plasma collection will be centrifuged at 820 RCF (relative centrifugal force) for 10 min at 4°C. Next, the supernatant will be collected and used for the preparation of NMR samples. Samples will be transported in liquid nitrogen. For each extraction 500 μl of blood plasma will be used. Methanol will be used to denature proteins. Lipids will be extracted from 0.5 ml of blood plasma, using a Folch extraction optimized for blood plasma. Blood-derived NMR samples will be prepared by adding 300 μl of sodium phosphate buffer (70 mM Na2HPO4, 38 mM NaN3 and 55 mM trimethylsilyl propionate (TMSP) in D2O, pH 7.4) to 300 μl of the low-weight metabolite layer. A total of 450 μl of this mixture will be transferred into a 5-mm NMR tube. NMR spectra: the WATERGATE (water suppression by gradient-tailored excitation scheme) (delay 85 μs) will be used to achieve suppression of the NMR water signal. For each of the spectra, 256 scans (acquisition time 2 s, 8 s relaxation delay between scans) consisting of 18,000 data points will be accumulated. All acquired free induction decays will be zero-filled, Fourier transformed, manually phased and baseline corrected using TopSpin software (version 2.0, Bruker, Germany).
Laboratory test results
Assuming that the study and control groups include 500 patients and α = 0.05 as the level of significance, it will be possible to detect, with 80% power, differences of:
A total of 0.09 units or less for variables whose expected standard deviation is 0.5 or lower, e.g., ceruloplasmin [g/l], cystatin c [mg/l], HbA1c [%], apoA1 [g/l], apoB [g/l], HDL [mmol/l], glucose [mmol/l], red blood cell count [million/mm3], and monocyte count [K/mm3].
A total of 0.09–0.18 units for variables whose expected standard deviation is within 0.5–1.0, e.g., lymphocytes [K/mm3], most blood-based inflammatory markers, total cholesterol [mmol/l], LDL cholesterol [mmol/l], and triglyceride level [mmol/l].
A total of 0.18–1.8 units for variables whose expected standard deviation is within 1.0–10.0, e.g., white blood cells [K/mm3], haematocrit [%], sodium [mmol/l], potassium [mmol/l], total protein [g/l], albumin [g/l], folic acid [ng/ml], bilirubin [μmol/l], and vitamin D [ng/ml].
A total of 1.8–8.9 units for variables whose expected standard deviation is within 10.0–50.0, e.g., creatinine [μmol/l], alkaline phosphatase [U/I], aminotransferases [U/I], γ-glutamyl transpeptidase [U/I], platelets [K/mm3], lipoprotein a [nmol/l].
A total of 8.09–14.2 units for variables whose expected standard deviation is within 50–80 – fibrinogen [mg/dl] and uric acid [μmol/l].
Genetic analyses
The next stage of statistical analysis will compare the frequency of the occurrence of SNPs related to premature CAD. Having considered the conservative Bonferroni correction, with α set to 0.013 (p = 0.05/14), and assuming that the occurrence frequency of the rarer allele is at the 5–25% level and that the genotype distribution (dominant homozygote, heterozygote, recessive homozygote) is in accordance with the Hardy-Weinberg principle, it will be possible to detect differences in the log-odds ratio between the study and control groups at a level of 0.168 to 0.096 with 80% power. Additionally, a genetic risk score for each patient will be calculated. To create the genetic risk score, the number of risk alleles at each SNP (0, 1, or 2) will be multiplied by its published β-coefficient for premature coronary artery risk and summed.
Metabolomic analyses
The statistical analysis of metabolomic data will be the most complex stage of the analysis. Pre-processed NMR spectra (range: 0.6 ppm–8.0 ppm) will be divided into consecutive bins of 0.005, 0.01, 0.02, 0.03 or 0.04 ppm using Chenomx NMR Suite software (version 8.2, Chenomx Inc., Edmonton, Alberta, Canada). Water regions will be excluded to avoid interference by water resonance. Data will be normalized to the total spectral area. Data will be scaled using Pareto or auto scaling. Principal component analysis (PCA) will be used to assess the dimensional structure of the data. Outliers will be defined based on their location outside Hoteling’s 95% confidence ellipse. In subsequent steps, a supervised linear classification method, partial least squares-discriminant analysis (PLSA-DA), will be employed to analyse the differences between the study and control groups. The quality assessment (Q2) statistics will be calculated. Additionally, permutation testing will be constructed. Providing we find differences between the study and control groups, spectral regions that are responsible for the differences will be identified based on their importance, according to projection scores. The metabolites corresponding to these spectral regions will be identified and quantified using the Chenomx NMR Suite, which will also be used for pathway analysis.
Partial least squares regression (PLSR) will be employed to analyse the differences between metabolome profiles and continuous variables such as genetic risk score.
Results
Baseline characteristics
Case and control groups will be compared with regard to anthropometric data (BMI, WHR), intima media thickness (IMT), and blood test results, including lipid profile and hormonal profiles. We will also analyse the education levels, financial situations and physical activity, both at work and in leisure time, of the study participants and their parents.
Dietary pattern analysis
The dietary patterns identified, based on two food frequency questionnaires validated for the Polish population, will be compared between patients with and without an FH of premature CAD.
Genetic and metabolome analyses
We will compare metabolic profiles between cases and controls. We will also analyse metabolic profiles with genetic risk scores as the dependent variable, with multidimensional analyses such as PLSR. Similar analyses will be conducted in order to analyse metabolic profiles with classical risk factors and IMT thickness as dependent variables.
Discussion
Studies of subjects with an FH of premature CAD showed a higher frequency of lipid disorders, elevated lipoprotein a and homocysteine levels in this group of patients [21–25].
We will also conduct similar analyses using our study as a point of reference. Additionally, a hormonal profile including gonadal hormones will be assessed, as it is likely that gonadal hormones may play a role in the pathogenesis of atherosclerosis. However, thus far, data on the association between gonadal hormones and an FH of premature CAD are scarce at best [26, 27].
Analysis of data on dietary habits based on food frequency questionnaires will be of particular importance. It was proved that unhealthy dietary habits influence the risk of CAD [28, 29]. Identification of differences in dietary patterns between patients with and without an FH of premature CAD will verify the hypothesis about whether unhealthy dietary patterns among patients with an FH of premature CAD can partially explain the higher risk of development of premature atherosclerosis in this group of patients. We will also analyse the influence of dietary patterns on the metabolome. According to the authors’ knowledge, such an analysis has not been conducted in a group of patients with an FH of premature CAD. However, studies assessing the association of dietary patterns and the metabolome are feasible and have been successfully carried out [30].
To the best of our knowledge, this is the first study devoted to a simultaneous analysis of the metabolome and the SNPs associated with premature CAD in young healthy individuals. Assessment of metabolome changes in relation to genetic risk score may provide insight into the mechanisms behind the increased risk of cardiovascular incidents in patients with an FH of premature CAD. Similar studies pertaining to genetic and metabolic risk factors in the development of type 2 diabetes factors showed that metabolic and genetic scores based on the SNPs related to type 2 diabetes risk provide complementary information for the prediction of the occurrence of type 2 diabetes [31].
The limitations of this study come from its case-control design, which is, however, common in metabolomic studies. Another limitation of our study is the fact that some of the patients from the control group will have parents younger than the threshold for premature CAD. Therefore, there might be parents of patients from the control group who may still suffer premature CAD, although their risk is not higher than that of the general population. The strengths of this study include its attempt to contact all patients who were hospitalized due to premature CAD at our centre between 2005 and 2017, a detailed FH interview, anthropometric measurements, a wide spectrum of laboratory tests, genetic testing, dietary patterns and intima media thickness, which will enable us to adjust the results of the metabolomic analyses.
In conclusion, the results of this study will deepen knowledge of the aetiopathogenesis of atherosclerosis through the identification of metabolic patterns associated with a positive FH of premature CAD. Detailed FH will enable adjustment for major risk factors of premature CAD in the proband’s first-degree relatives. This research project also provides a chance to discover new biomarkers associated with the risk of premature CAD and to identify potentially novel metabolic pathways associated with atherosclerosis.