the Creative Commons Attribution 4.0 License.
the Creative Commons Attribution 4.0 License.
 | 08 Dec 2020
Development of a standard database of reference sites for validating global burned area products
Melanie K. Vanderhoof
Dimitris Stavrakoudis
Ioannis Z. Gitas
Ekhi Roteta
Marc Padilla
Emilio Chuvieco
Over the past 2 decades, several global burned area products have been produced and released to the public. However, the accuracy assessment of such products largely depends on the availability of reliable reference data that currently do not exist on a global scale or whose production require a high level of dedication of project resources. The important lack of reference data for the validation of burned area products is addressed in this paper. We provide the Burned Area Reference Database (BARD), the first publicly available database created by compiling existing reference BA (burned area) datasets from different international projects. BARD contains a total of 2661 reference files derived from Landsat and Sentinel-2 imagery. All those files have been checked for internal quality and are freely provided by the authors. To ensure database consistency, all files were transformed to a common format and were properly documented by following metadata standards. The goal of generating this database was to give BA algorithm developers and product testers reference information that would help them to develop or validate new BA products. BARD is freely available at https://doi.org/10.21950/BBQQU7 (Franquesa et al., 2020).


Validation is defined by the Committee on Earth Observation Satellites Working Group on Calibration and Validation (CEOS-WGCV) as “the process of assessing, by independent means, the quality of the data products derived from the system outputs” (CEOS-WGCV, 2012). Validation helps in evaluating the utility and limitations of using any remote sensing (RS) product, particularly whether user accuracy requirements are met. For this reason, validation should be part of any RS project, even though it requires additional effort and cost that is aimed not at improving accuracy but rather measuring it. Validation implies comparing our results to reference data, assumed to represent the actual conditions of the target variable at the satellite overpass time. In the case of global studies, it is very difficult to generate reference data for the wide variety of planetary conditions, thereby complicating validation. Some of the global variables (e.g. temperature and surface radiation) can be validated from ground sensor networks, such as weather stations, buoys or Aerosol Robotic NETwork (AERONET) sensors. Other variables are more difficult to validate, as they require generating global reference data that are based on higher-resolution sensors than those used to obtain the global product. This is the case of land cover or burned area products, which require first designing a sample strategy using statistically valid protocols and then extracting from the selected sites the reference polygons to be compared with the global datasets. Despite the time and effort required to derive reference datasets, accuracy assessment is a critical part of any global RS project, and making these reference datasets publicly available will facilitate product comparison and lower the burden of validating future products.
Several global burned area (BA) products have been produced in the last 2 decades, providing an estimation of fire activity worldwide (Chuvieco et al., 2019). The first of these products was Global Burned Area (GBA2000), based on daily VEGETATION (VGT, 1 km resolution) images acquired in the year 2000, and was generated by the Joint Research Centre of the European Union (Grégoire et al., 2003). In the same year, the European Space Agency developed the GLOBSCAR BA product, also at 1 km2, derived from daytime ERS-2 (European Remote Sensing Satellite) ATSR-2 (Along Track Scanning Radiometer) data (Simon et al., 2004). Other 1 km resolution global BA products released by European projects include the L3JRC (Tansey et al., 2008), covering the period from 2000 to 2007; GlobCarbon (Plummer et al., 2006), produced from 1998 to 2007; and the Copernicus GIO_GL1_BA products. These three products were derived from VGT images, although in the GlobCarbon project, ATSR images were used as well. More recently, the FireCCI (Climate Change Initiative) project (https://climate.esa.int/en/projects/fire, last access: 3 December 2020), part of the European Space Agency (ESA) CCI programme, has generated three global BA products, based on the Medium Resolution Imaging Spectrometer (MERIS) at 300 m resolution (FireCCI41: Alonso-Canas and Chuvieco, 2015) and Moderate Resolution Imaging Spectroradiometer (MODIS) 250 m data (FireCCI50: Chuvieco et al., 2018; FireCCI51: Lizundia-Loiola et al., 2020). NASA (National Aeronautics Space Administration) released in mid-2008 the MCD45A1 product derived from 500 m MODIS imagery (Roy et al., 2008), which has now been superseded by MCD64A1 at the same resolution but with a different BA algorithm approach (Giglio et al., 2009, 2018).
These global BA products have been validated by comparing them with reference data generated from medium-resolution sensors (such as those on board the Landsat, SPOT (Satellite Pour l'Observation de la Terre) or Sentinel-2 missions). These reference data were typically derived from multitemporal pairs of images to properly date the validation period.
According to the representativeness of samples used to perform product validation, the CEOS-WGCV Land Product Validation (LPV) subgroup defined four validation stages with the level of sampling effort and statistical rigour increasing at each stage (https://lpvs.gsfc.nasa.gov/, last access: 3 December 2020). Early validation exercises were subjected to a first-stage validation, which is usually based on small samples of reference sites that were not selected using a probability sampling design but instead were typically chosen using a convenience sampling based on data availability or expert knowledge to ensure that diverse wildfire conditions are included in the sample (Tansey et al., 2004; Roy et al., 2005). Roy and Boschetti (2009), for instance, reported validation results for the MCD45A1 product using a set of 11 Landsat scenes distributed across southern Africa. Chuvieco et al. (2008) validated a regional product for Latin America using 19 Landsat scenes and 9 China–Brazil Earth Resources Satellite (CBERS) scenes that were donated by regional space agencies when access to the Landsat archive was not yet free and open to the public, thereby limiting the number of selected validation sites. The MCD64A1 Collection 5 was not formally validated, and the most recent MCD64A1 Collection 6 product was first validated using a set of 108 Landsat scenes distributed across a wide range of fire-affected ecosystems but not selected via probability sampling (Giglio et al., 2018). A recent study has provided a validation of the MCD64A1 product implementing a probability sampling design and using Landsat 8 Operational Land Imager (OLI) images but only for a single year (Boschetti et al., 2019). Previous statistical validation of NASA and FireCCI BA products were conducted by Padilla et al. (2014, 2015) using a set of 105 randomly selected Landsat scenes for a single year (2008) and by Chuvieco et al. (2018) using a multitemporal reference dataset of 12 years. Other projects covering large areas have been developed in the USA using Landsat data across 6 years (Vanderhoof et al., 2017) and Africa using Sentinel-2 Multispectral Instrument (MSI) images (Roteta et al., 2019), where validation sites were selected through probability sampling. In all cases, reference datasets were created based on independent interpretation of BA, controlled by visual inspection. The importance of applying probability sampling to collect reference data has been highlighted by different authors as a critical feature of the sampling design protocol to achieve statistically rigorous assessment (Stehman, 2001, 2009; Olofsson et al., 2014; Stehman and Foody, 2019). Thus, in contrast to such reference data collected by convenience, ease of access or other methods that lack randomization, data collection through probability sampling makes it possible to obtain rigorous estimates of accuracy.
The main bottleneck for validating global BA products or global BA algorithms is the generation of reference BA datasets. To facilitate the activity of BA algorithm developers, this paper aims to present and deliver to the scientific community the Burned Area Reference Database (BARD), a set of reference BA perimeters that can be used as reference data for validation of BA products or to help the development of BA algorithms (obviously, the same files cannot be used for both training and validating an algorithm). These validation files were compiled from different international projects and years; therefore the resulting database will facilitate the assessment of BA algorithms in a wide range of ground conditions.
BARD includes the following datasets of reference data: FireCCI global (2008), FireCCI global (2003–2014), FireCCI Africa (2016) and FireCCI Africa S2 (2016) that were produced within the framework of the FireCCI project; CONUS (contiguous United States) Landsat Burned Area (1988–2013), developed within the Landsat Level-3 Science Products project; and NOFFi Greece (National Observatory of Forest Fires, 2016–2018) that was produced within the NOFFi project.
The paper presents the methods that were used to generate the BA reference data, paying particular attention to the sampling design and reference data retrieval methods applied to the different BARD datasets. The data specifications to transform all the files to a common standard format and file structure are then presented. Finally, a detailed description of each dataset included in BARD is provided, and the main dataset features are then summarized to facilitate a general overview.
2.1 Selection of validation sites: sampling design
High-quality reference data generation is an expensive and time-consuming task, which constrains the total number of validation sites that can be established in any validation exercise. For this reason, sampling design is critical to make the most of the resources available and ensure the highest precision of accuracy estimates given the available resources to generate reference data. Padilla et al. (2014, 2015) implemented a stratified random sampling design that allowed for global BA accuracy inferences for the first time. Boschetti et al. (2016) extended the sampling design to include the temporal dimension of the sampling units. More recently, Padilla et al. (2017) presented a first approach to efficiently stratify the population and allocate the samples across strata. Chuvieco et al. (2018) conducted a multi-annual accuracy assessment across 12 calendar years (2003–2014), reporting for the first time the temporal accuracy variation of global BA products. Meanwhile, Boschetti et al. (2019) validated the MCD64 C6 BA product, but instead of using the calendar year, the authors used a fire year (from 1 March 2014 to 19 March 2015) as defined in Boschetti and Roy (2008).
The sampling design protocols to validate BA products were therefore developed considering the rarity and ephemeral nature of the BA, which is indeed a special case of land cover change (Stehman and Foody, 2019). When selecting samples for obtaining probability inferences, the allocation of samples should follow a probability sampling design to compute unbiased population estimates. For BA product validation, this implies selecting samples considering the spatial and temporal dimension. The spatial dimension of sampling units is usually defined by the Thiessen scene areas (TSAs) constructed by Cohen et al. (2010) and Kennedy et al. (2010) specifically for use with Landsat WRS-2 frames (Worldwide Reference System, Fig. 1a). The key advantage of TSAs is that they provide non-overlapping Landsat-like frames, which allow for a convenient computation of unbiased estimators (Gallego, 2005). The temporal dimension of sample units is defined by the acquisition dates of the pre- and post-fire images. For example, in Boschetti et al. (2019), the validation period (1 year) was divided into equal temporal size sampling units using the 16 d Landsat 8 acquisition interval, thus allowing for the temporal random selection of the reference images. This temporal partitioning also makes it possible to intensify the sample in strata that comprise the fire season and where burning is more likely to occur (Stehman and Foody, 2019). However, longer period intervals (> 100 d) are used to define sampling units to allow for a long temporal overlap of reference data with the BA product, which helps to disentangle the spatial errors from the temporal errors of the BA product (Roteta et al., 2019; Lizundia-Loiola et al., 2020).
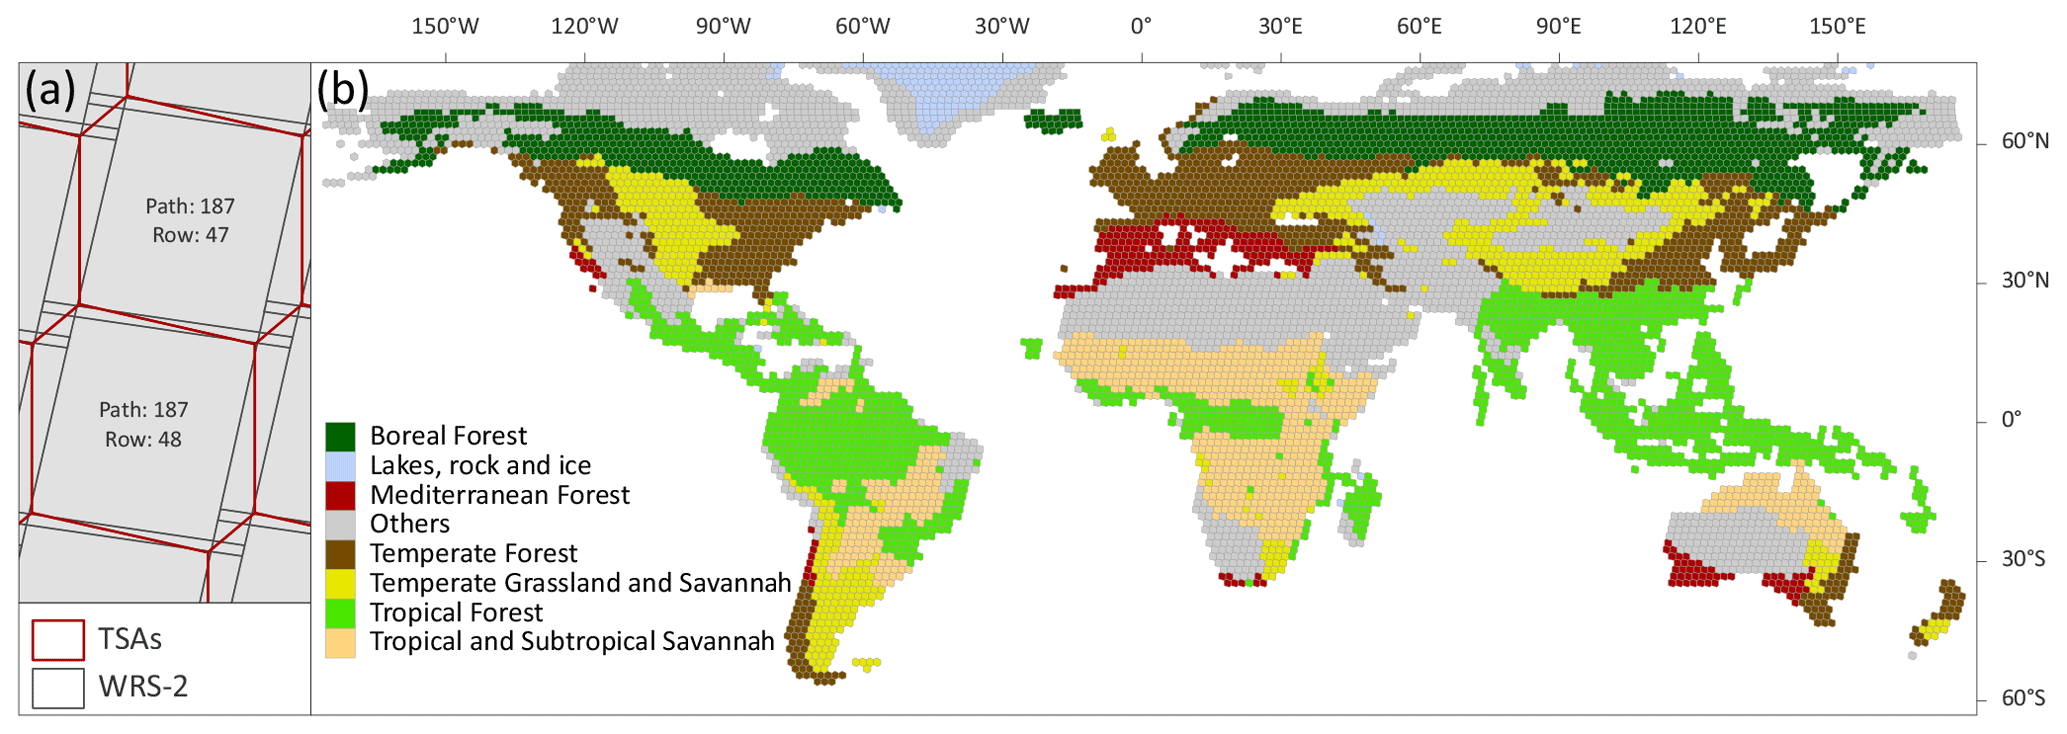
Figure 1(a) Thiessen scene areas (TSAs) based on Landsat Worldwide Reference System-2 (WRS-2) frames. TSAs are used as non-overlapping spatial units in the sampling design. (b) Distribution of major Olson biomes reclassified as in Padilla et al. (2014).
In any case, sample units are then stratified to properly represent the variety of conditions that affect the accuracy of BA products. This stratification is usually based on (a) major Olson biomes (Olson et al., 2001) (Fig. 1b) and (b) the BA extent provided by a global BA product considered to be reliable or active fire detections, assigning each sample unit to high- or low-BA strata based on a threshold that can be specifically adapted to each biome stratum as in Padilla et al. (2017) or simply set as the 20th quantile of the cumulative distribution of active fire counts as in Boschetti et al. (2016, 2019).
One of the advantages of the stratified sampling design adopted for BA map validation previously mentioned was that it allows for rigorous estimates of global BA accuracy. However, another key advantage of stratified random sampling design that should be strongly emphasized is that it makes it possible to increase the sample size of an initial global sample for specific regions or rare land cover classes (Stehman et al., 2012). This is the case of the CONUS Landsat Burned Area (1988–2013) dataset, where reference sites for the CONUS extent were augmented based on the initial sample of the FireCCI global (2008) dataset.
Stratified random sampling design was applied to several datasets included in BARD: FireCCI global (2008), FireCCI global (2003–2014), FireCCI Africa (2016) and CONUS Landsat Burned Area (1988–2013). FireCCI Africa S2 (2016) was also obtained by probability sampling, but, in this case, it was obtained by applying a systematic sampling design rather than stratified random sampling. NOFFi Greece (2016–2018) is the only dataset of BARD that was obtained through convenience sampling rather than probability sampling.
To report BA accuracy from these stratified sample datasets, users should apply the proper estimation formulas detailed in the associated articles (see Table 2) and use the additional information of the stratum of each sampled unit and the stratum sizes of the stratified sampling, provided in the metadata files and tables of Appendix A, respectively.
Table 1Example of the standard attribute table of the reference shapefiles. The date format is yyyy-mm-dd (year month day).

Table 2Datasets included in the Burned Area Reference Database. CCI: Climate Change Initiative, CONUS: contiguous United States, NOFFi: National Observatory of Forest Fires, TM: Thematic Mapper, ETM+: Enhanced TM, OLI: Operational Land Imager, CEOS-LPVS: Committee on Earth Observing Satellites Land Product Validation subgroup, SRS: stratified random sampling, SS: systematic sampling, NPS: non-probability sampling.
2.2 Reference data generation methods
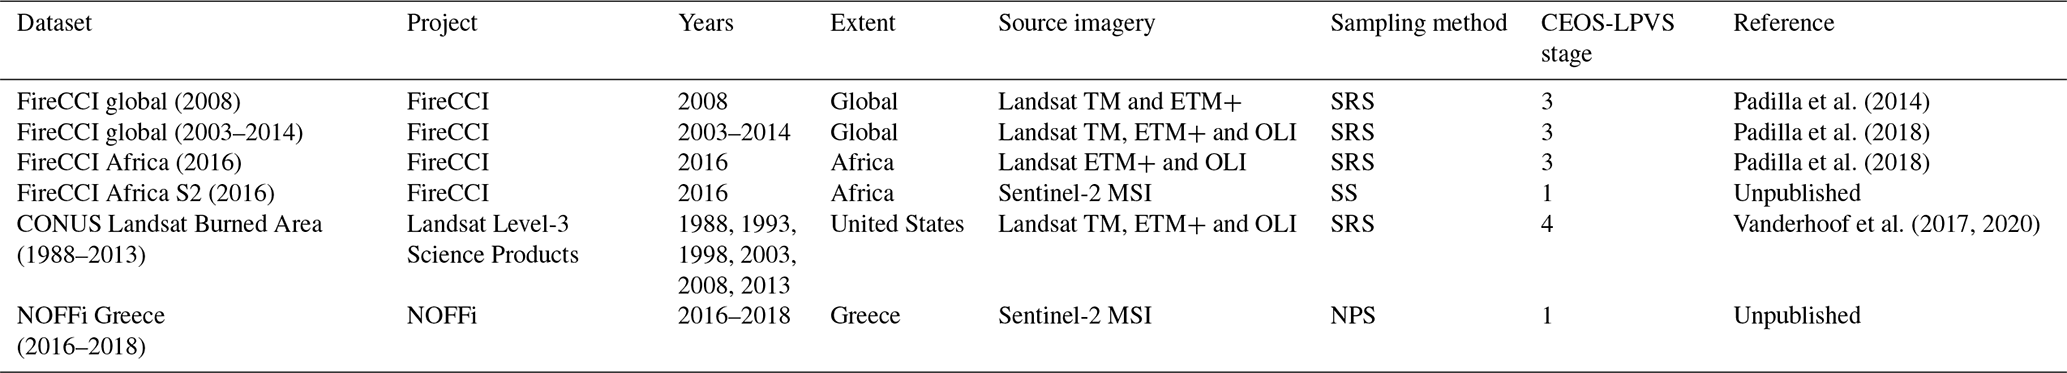
Following the recommendations of the CEOS Working Group on Calibration and Validation, all the burn perimeters of BARD were derived from a multitemporal comparison of medium-resolution satellite imagery (Landsat TM (Thematic Mapper), ETM+ (Enhanced Thematic Mapper plus), OLI or Sentinel-2 MSI). Burned patches included in the files are only those that occurred in between the two satellite images used to generate the reference data (Fig. 2). The procedures implemented to obtain those burned patches are diverse, depending on the dataset, but all include a semi-automatic procedure (e.g. Bastarrika et al., 2011) and then a visual inspection to confirm that the detected perimeters were actually burned areas. In some cases, the semi-automatic classification was enhanced with manually digitized polygons. In several cases, this visual inspection was confirmed by another interpreter to double-check the quality. When parts of the scene could not be observed or interpreted because of clouds or sensor problems (i.e. Scan Line Corrector (SLC)-off problems of ETM+), either in the pre- or post-fire images, they were classified in the no-data category. This was done to make sure that only areas with reliable data were included in the reference files. Regarding the “unburned” category of reference data, different criteria were applied to label seas and inland water bodies in the different datasets. Thus, for the FireCCI global (2008), FireCCI global (2003–2014), FireCCI Africa (2016) and CONUS Landsat Burned Area (1988–2013) datasets, surface waters were classified as unburned, while in FireCCI Africa S2 (2016) and NOFFi Greece (2016–2018), the “no-data” category was applied to label them.
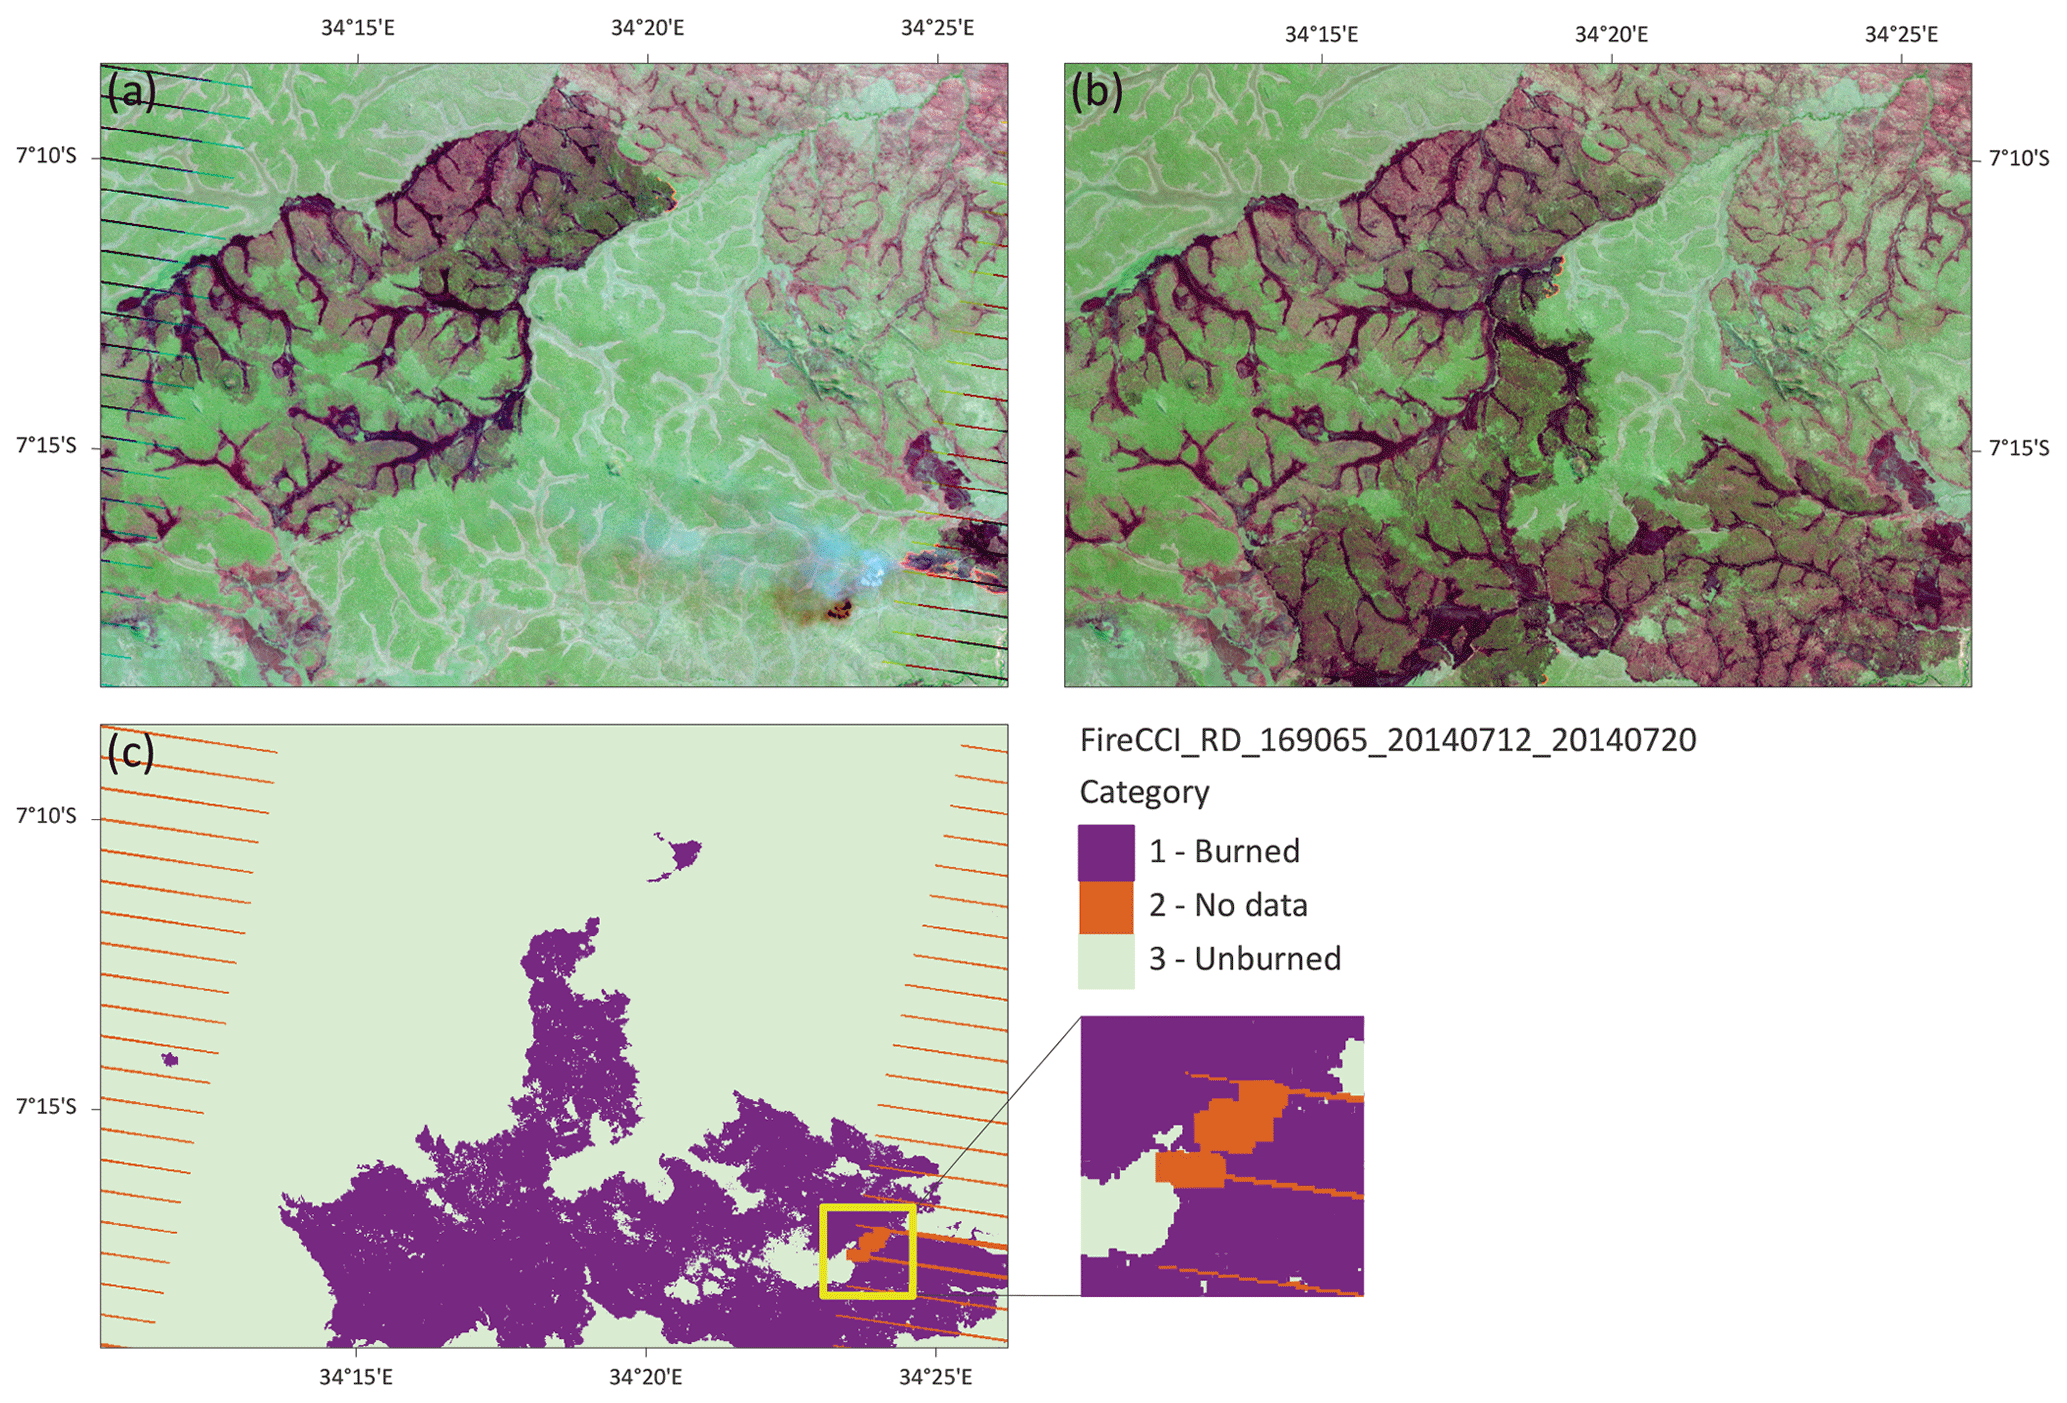
Figure 2Example of Landsat 7 pre-fire (a) RGB (7,4,3) image and Landsat 8 post-fire (b) RGB (7,5,4) image. Both (a, b), were used to derive the “FireCCI_RD_169065_20140712_20140720” BA reference file (c) at WRS-2 Landsat 169-065 (path-row; eastern Africa). Time period between both images is 8 d: from 12 to 20 June 2014. Only the land surface that burns between the two dates is classified as burned, while burned scars in the pre-fire image are assigned to the unburned category. Unobserved pixels on either the pre- or post-fire image due to the presence of clouds, cloud-shadows, SLC gaps or smoke plumes are classified in the no-data category.
It should be noted that reference data are not just high-accuracy BA products generated by well-designed algorithms using medium- or high-resolution imagery. Rather, reference data following international standards should not only provide reliable burned area but also the unburned surface of the interpreted geographic region and the unobserved or unmapped areas within the region, as shown in Fig. 2c.
Like the sampling units from which reference data are derived, reference data can be defined by their spatial and temporal dimension. The spatial dimension is a function of the geographic extent interpreted to obtain the reference data, where the size varies depending on the criteria adopted in each project. For example, reference data from the FireCCI global (2003–2014) dataset were spatially defined by a frame of 30×20 km located at the centre of the Landsat images, whereas the entire Landsat scenes were used in the case of the CONUS Landsat Burned Area (1988–2013) dataset. The spatial extent used in the datasets included in BARD will be specified in Sect. 2.4, where a detailed description of each dataset is provided.
The temporal dimension of the reference data represents the period defined by the acquisition date of the pre- and post-fire images used to generate them. Regarding the temporal length of the reference data, the FireCCI project adopted the terms “short unit” (SU) and “long unit” (LU). The former refers to those reference data derived from a pair of consecutive images separated by 16 d or less (the temporal span between two Landsat acquisitions). The latter is defined by a series of consecutive SUs covering at least 100 d. LUs allow for long temporal overlaps between validation and product data, reducing or minimizing the impact of the product's temporal reporting accuracy in the accuracy estimates (Padilla et al., 2018). The combined use of SUs and LUs is useful for assessment and contextualizing impact (Lizundia-Loiola et al., 2020). An LU BA map consists in the combination of consecutive SU maps (Fig. 3). A pixel classified in the no-data category in any of the SU maps is kept as such in the LU BA map. This is to ensure that any pixel available data is observed frequently (every 16 d or less) and an eventual burn is not missed due to simply a fast recovery of the vegetation. The permanently observed pixels were classified as burned in the LU if they were detected as burned in any SU of the time series covered by the LU. The presence of a no-data categorization (e.g. due to clouds) in a single image may reduce drastically the spatial cover of available data in the resulting LU. Therefore, BA maps are generated for every single SU, but the BA map for an LU is generated by accumulating the consecutive SUs of the same TSA. The length of the LU would depend on the existing cloud-free consecutive SUs. For example, if 8 consecutive SUs, all covering the same temporal length (e.g. 16 d) are cloud free and the 9th image has 90 % of the area cloud covered, the LU would include only the first 8 SU maps, even if SU were generated for the 9th and 10th consecutive images.
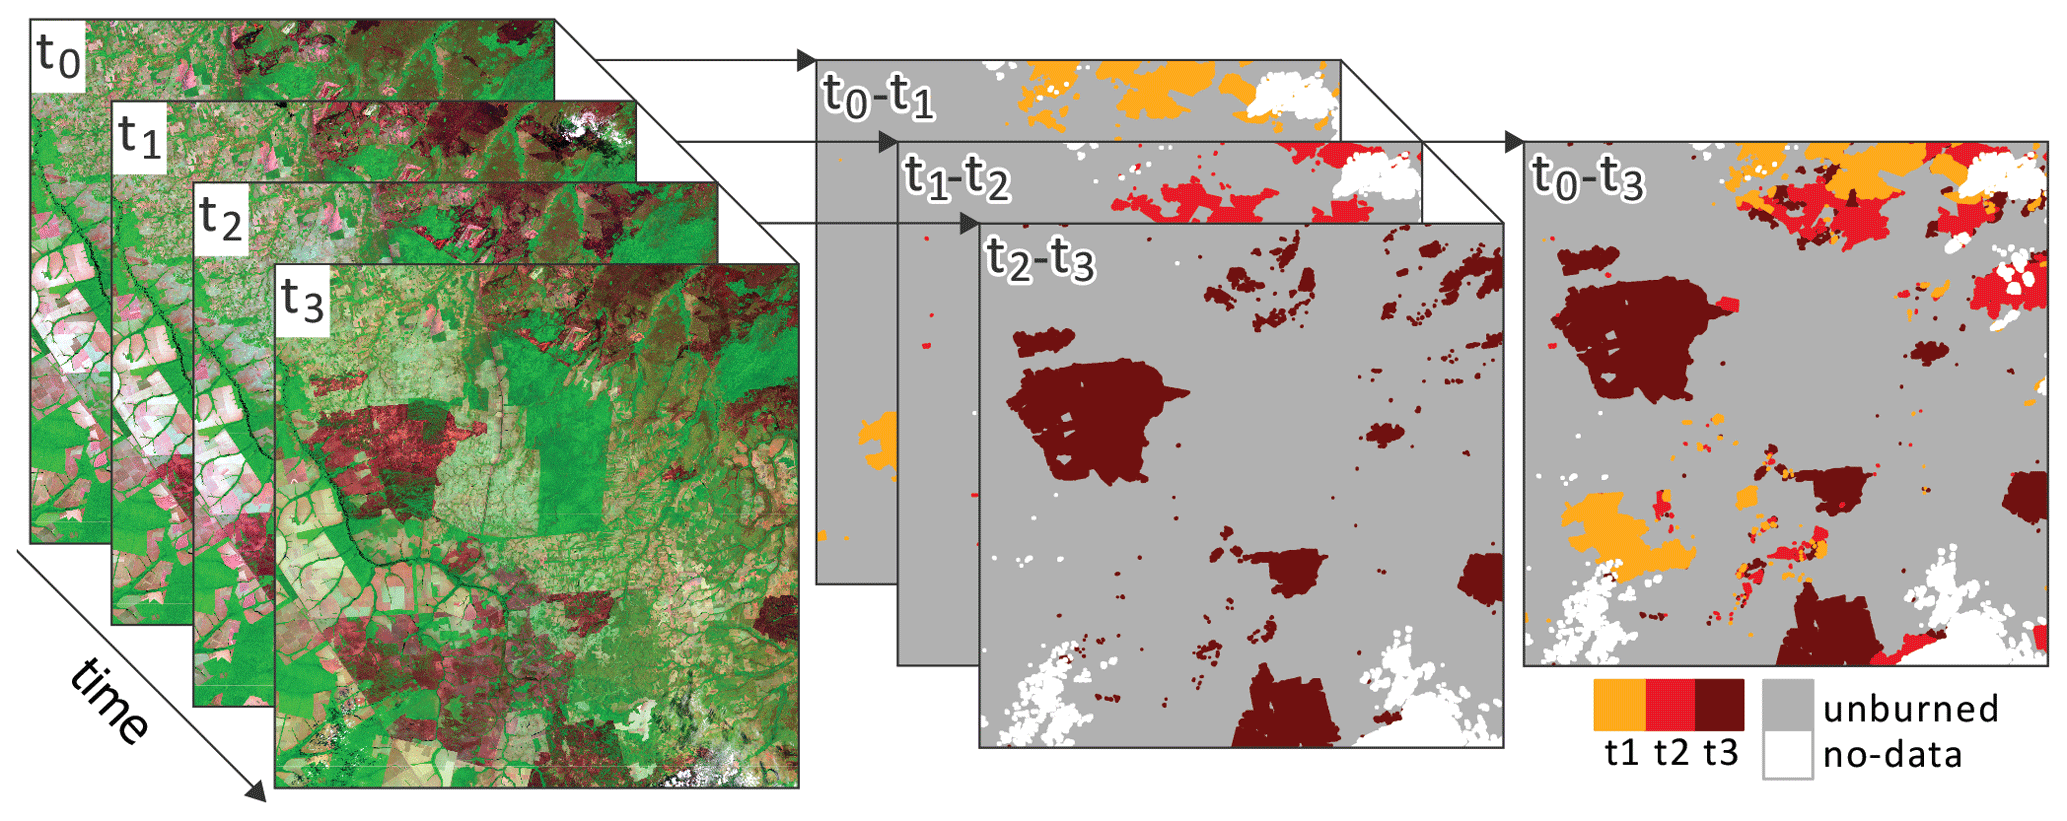
Figure 3Schematic process of long-unit reference data generation. Consecutive image pairs are selected from the multitemporal image series at same location (left: Landsat 8 RGB () images time series) to derive the correspondent short-unit reference data files (e.g. image t0 and t1 to obtain the reference data t0-t1). From the union of the different short units we generate the long-unit reference data (right). The long unit t0-t3 includes all the burned scars that occurred between the first image (t0) and the last image interpreted (t3); burned scars from the first image (t0) are not included or mapped. Unobserved areas in any of the images are categorized in the no-data category in the final long-unit reference data. Colours (orange of t1, red of t2 and brown of t3) represent the dates in which the burned area patches were observed.
As burning is detected on any given single image in between the period covered by two satellite acquisitions, all burned patches are dated based on the second reference image of a multitemporal pair. Therefore, SUs will have the same date for all the burned patches, while LU reference data will have burned patches from different dates, as multiple pairs of images are used to build the LU (Fig. 3).
Among the datasets included in BARD, SUs were used in the FireCCI global (2003–2014) dataset as part of the sampling design, and LUs were used for the FireCCI Africa (2016) dataset. Reference data from the rest of the FireCCI project datasets (FireCCI global (2008) and FireCCI Africa S2 (2016)) and CONUS Landsat Burned Area (1988–2013) dataset were retrieved from a single pair of images with a variable time lapse between pre- and post-fire images. Thus, the temporal length of those reference data was determined by the availability of suitable images and the duration of the burned signal. The NOFFi Greece (2016–2018) reference data were obtained considering a time series of Sentinel-2 images but with variable length and a non-consecutive time series step.
2.3 Data specifications
Each dataset of BARD is organized in three folders with associated files including: (a) “metadata”, which contains a .csv file containing the filename of all the reference files included in the dataset, along with additional information such as the temporal length (days), the total number of images interpreted (n_images), the area (m2) of each mapped category (burned, unburned and unobserved), the land surface and total area of each reference data file (for those datasets where a stratified random sampling design was used, the .csv file also specifies the stratum of each sampled unit and the size (tsa_area) of the corresponding TSA); (b) “regions”, which contains an ESRI (Environmental Systems Research Institute) shapefile (.shp) containing all the sample sites (TSAs or Sentinel-2 tiles) covered by the dataset; and (c) “shapefiles”, containing the validation reference shapefiles ordered by year. They are also released in shapefile (.shp) format.
All datasets are in the UTM/WGS84 projection. The name of the files is defined as follows: “Project_RD_ppprrr_yyyymmdd_yyyymmdd” (e.g. FireCCI_RD_164069_20160514_20160709), where “Project” is the project in which the reference data were generated; “RD” stands for reference data; “ppprrr” refers to the Landsat Worldwide Reference System (WRS) path (ppp) and row (rrr) of the scene (for collections where Sentinel-2 was used instead of Landsat images, ppprrr refers to the Sentinel-2 tile; e.g. FireCCI_RD_T28PET_20160111_20160311); and yyyymmdd represents the dates (year month day), the first of which corresponds to the pre-fire date, which is the date of the first image used for BA detection, and the second of which refers to the post-fire date, which is the date of the last image used for generating the reference fire perimeters.
The following attribute fields are included in the shapefiles (Table 1).
-
Category. Categories are defined as follows.
- –
Burned area (1). This category includes all polygons detected as burned.
- –
No-data (2). This category includes all polygons that could not be interpreted or were not observed by the sensor, due to clouds and/or cloud shadows, topographic shadows, smoke or sensor errors (for instance, those caused by SLC-off problems of ETM+ after 31 May 2003).
- –
Unburned (3). This category includes all polygons observed as not burned within the limits of the area covered by the image.
- –
-
preDate. This attribute field is the acquisition date of the image taken before the occurrence of the fire (in the format of yyyy-mm-dd, i.e. year month day).
-
postDate. This attribute field is the acquisition date of the image taken after the fire (in the format of yyyy-mm-dd, i.e. year month day).
-
preImg and postImg. These attribute fields are the pre- and post-fire Landsat scene identifier (e.g. “LC80260422013124LGN01”). For reference files based on Sentinel-2 images, the datastrip ID (identification) is used instead (e.g. “S2A_OPER_MSI_L1C_TL_SGS__ 20160420T171415_A004324_T28PEB_N02.01”).
-
Path. This attribute field is the Worldwide Reference System-2 (WRS-2) path of the Landsat scene. For reference files based on Sentinel-2, the tile number was used.
-
Row. This attribute field is the row of the Landsat scene. For reference files based on Sentinel-2, the tile number was used.
-
Year. This attribute field is the year of the validation dataset.
-
Area. This attribute field is the area in square metres (m2) calculated on the WGS84/UTM Cartesian plane.
2.4 Reference datasets
2.4.1 FireCCI global (2008)
The FireCCI global 2008 reference dataset was created using a stratified random sampling design (Padilla et al., 2014, 2015; Table A1). Two levels of spatial stratification were used to select the spatial units based on TSAs derived from the Landsat World Reference System 2 (WRS-2). Spatial units were first stratified across seven aggregated Olson biomes (Olson et al., 2001). Each biome was stratified into high- and low-BA extent based on the Global Fire Emissions Database (GFED) Version 3 (Giglio et al., 2009, 2010). A total of 101 images from Landsat 5 TM and 109 for Landsat 7 ETM+ satellite sensors were used to retrieve BA perimeters. The complete scene was used for Landsat 5 TM images, whereas only the centre of Landsat 7 ETM+ scenes were interpreted in order to avoid data SLC gaps. BA perimeters were derived using a semi-automatic algorithm developed by Bastarrika et al. (2011), where high-burn-severity pixels were selected to train core burned area, and adjacent lower-burn-severity pixels were added to the core detected patches using a region-growing algorithm.
The FireCCI global 2008 dataset includes 105 reference data files, derived from a single pair of images, for the year 2008. The temporal length of reference data varies between 8 and 144 d: 79 % of image pairs were separated by 32 d or less; 16 % were separated between 32 and 100 d; and 5 % were separated by more than 100 d, with a maximum time gap between the pre- and post-fire image of 144 d. The total area of reference data is 1.76×10⁶ km2, of which 1.35 % corresponds to the burned, 88.35 % to the unburned and 10.30 % to the unobserved category. The location and temporal length of the reference data is shown in Fig. 4. This reference dataset is compliant with CEOS-LPVS Stage 3.
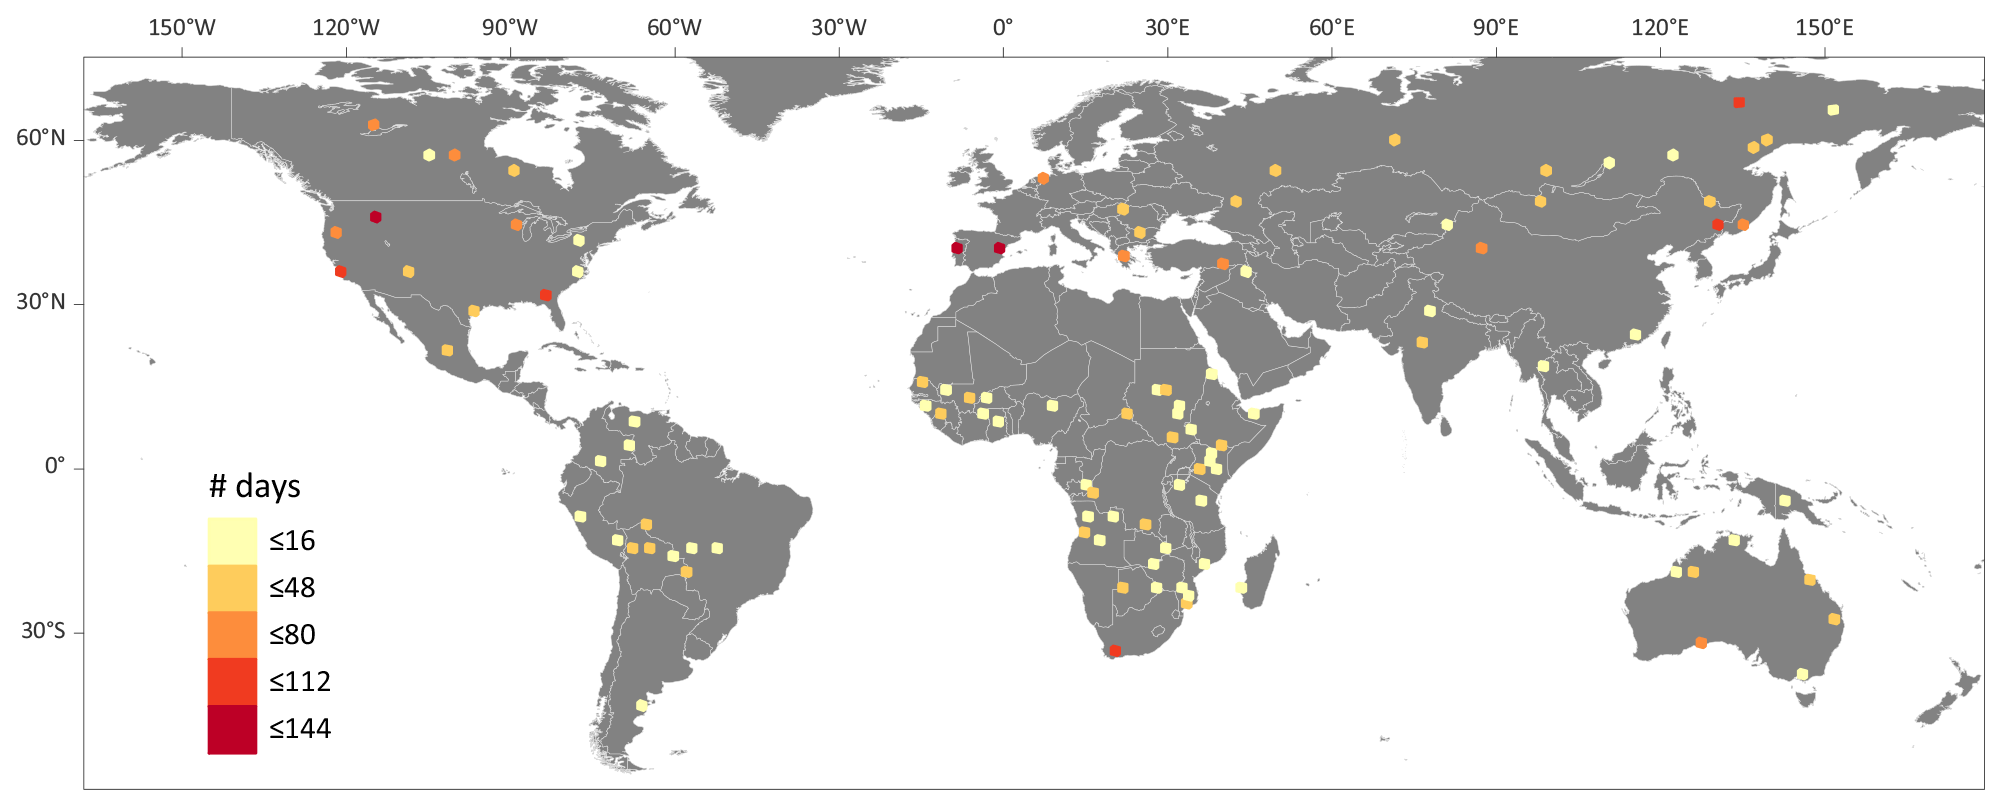
Figure 4Spatial distribution of the reference sites for the FireCCI global (2008) dataset. The legend shows the temporal distance (days) between the pre- and post-fire images used in each validation site for the year 2008.
2.4.2 FireCCI global (2003–2014)
The FireCCI global (2003–2014) dataset covers a period of 12 years, from 2003 to 2014 (Padilla et al., 2018), and was generated in the framework of the FireCCI project with the collaboration of the Copernicus Global Land Service (CGLS). The reference data were derived from consecutive Landsat images separated by 8–16 d for each selected TSA and year. A total of 585 images from Landsat 5 TM, 1564 from Landsat 7 ETM+ and 209 from Landsat 8 OLI satellite sensors were used to retrieve BA perimeters. The sampling units were selected following a stratified random sampling design (Table A2). The total population of sample units were defined spatially by TSAs and temporally by the dates of Landsat images available, filtering out those with a cloud cover greater than 30 %. For each calendar year, the sample units were stratified by Olson biomes (Olson et al., 2001), and BA was based on MCD64A1 (Giglio et al., 2009). The threshold used to assign the high- or low-BA strata was defined separately for each year and biome. Once the strata were defined by year-biome-BA, a set of 100 sampling units were selected for each calendar year, applying a sample allocation according to Eq. (1):
where nh is the sample size to be selected in stratum h, Nh is the stratum size and is the BA mean in stratum h.
Finally, a spatial subset window of 30×20 km located at the centre of the images was applied for interpretation and BA reference data retrieval. The reference perimeters were extracted from a dedicated random-forest algorithm, trained for each sampling site, and output maps were visually inspected by two interpreters (Padilla et al., 2018).
The FireCCI global (2003–2014) dataset includes 1200 reference data files from 722 different TSAs and 12 years, from 2003 to 2014. The temporal length of reference data varies between 8 and 16 d. The total area of reference data is 0.72×10⁶ km2, of which 3.85 % corresponds to the burned, 71.85 % to the unburned and 24.29 % to the unobserved category. The location and total number of reference data in each TSA are shown in Fig. 5. This reference dataset is compliant with CEOS-LPVS Stage 3.
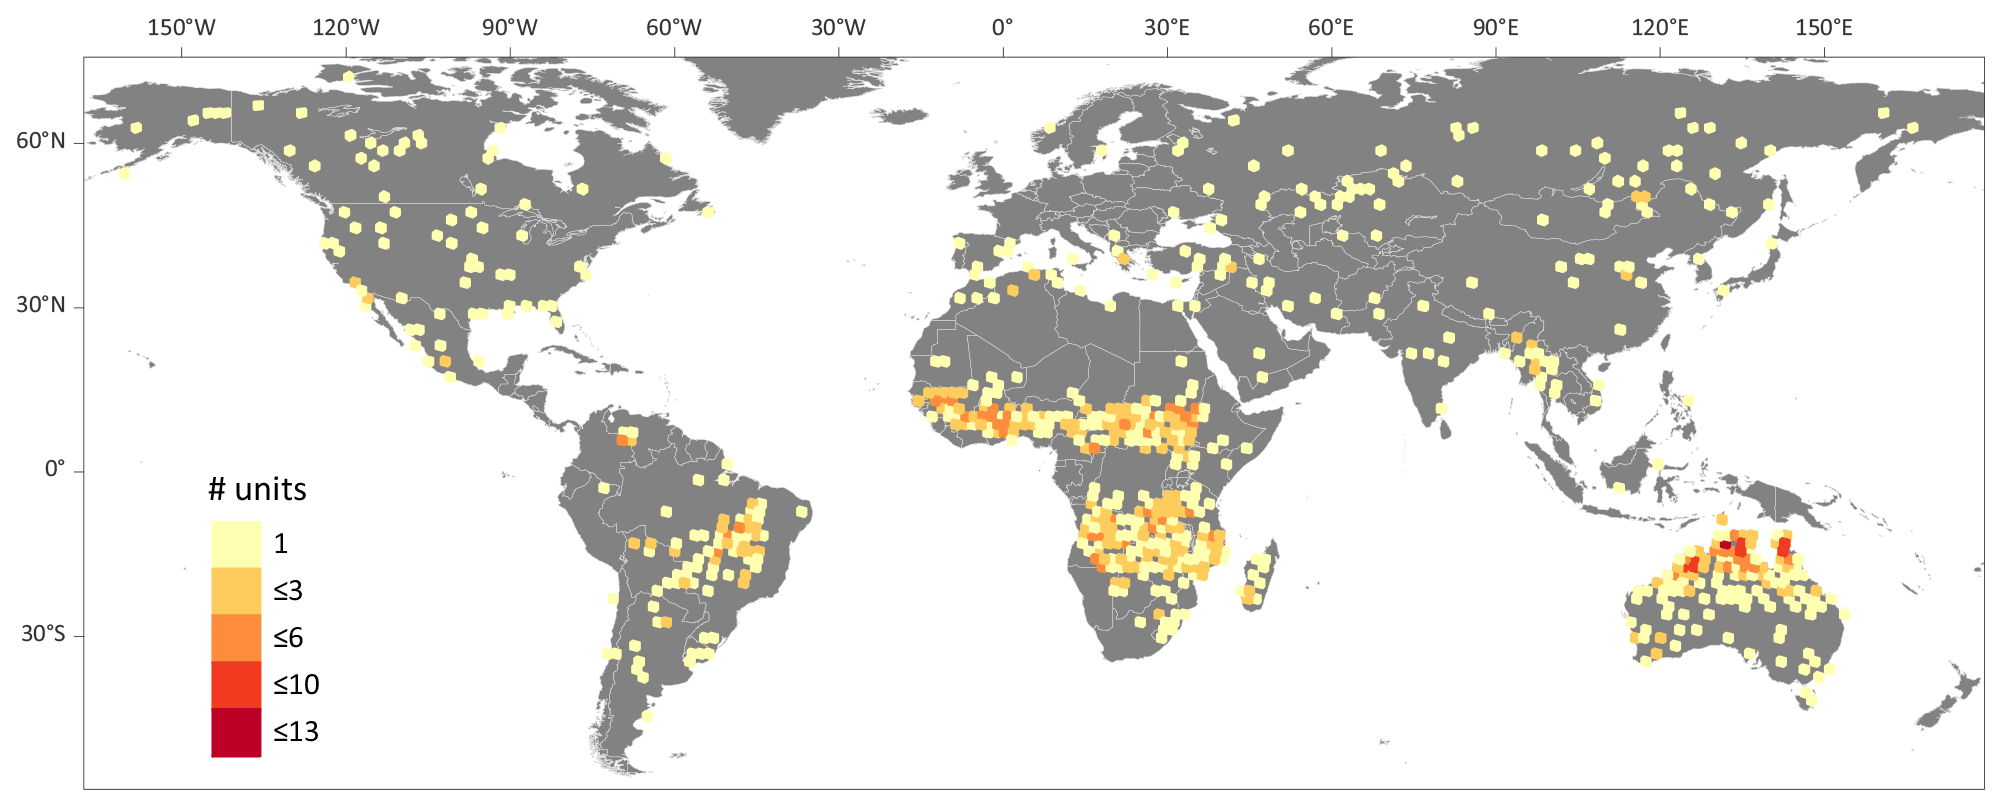
Figure 5Spatial distribution of the validation Thiessen scene areas (TSAs) for the FireCCI global (2003–2014) dataset. The legend shows the total number of reference data files generated for each TSA during the period 2003–2014.
2.4.3 FireCCI Africa (2016)
The FireCCI Africa reference dataset consists of LU BA maps and was generated for the year 2016 from Landsat imagery (Padilla et al., 2018). It was also generated in the framework of the FireCCI project with the collaboration of the CGLS. The sampling was designed with long units, and it was similar to that for the FireCCI global (2003–2014) dataset, as mentioned in the previous section (Table A3). The only difference was the sample size, 50 units instead of 100 units per year. Note that each unit here is much larger, as it consists of multiple image pairs. Two reference perimeter datasets are released: (a) reference data at the SU level, 1052 files with 8–16 d BA maps, and (b) reference data at the LU level, 50 files. The temporal length covered at each LU varies from 24 to 256 d (Fig. 6b): 18 % of the LUs cover a temporal length below 50 d; 34 % cover between 50 and 100 d; and 48 % cover more than 100 d. As mentioned in Sect. 2.2, LUs were defined to be at least 100 d long, although the presence of clouds reduced the actual temporal periods with available data. The total area of LU reference data is 0.023×10⁶ km2, of which 15.72 % corresponds to the burned, 49.61 % to the unburned and 34.67 % to the unobserved category. The location, number of image pairs and temporal length of the LU reference data are shown in Fig. 6. This reference dataset is compliant with CEOS-LPVS Stage 3.
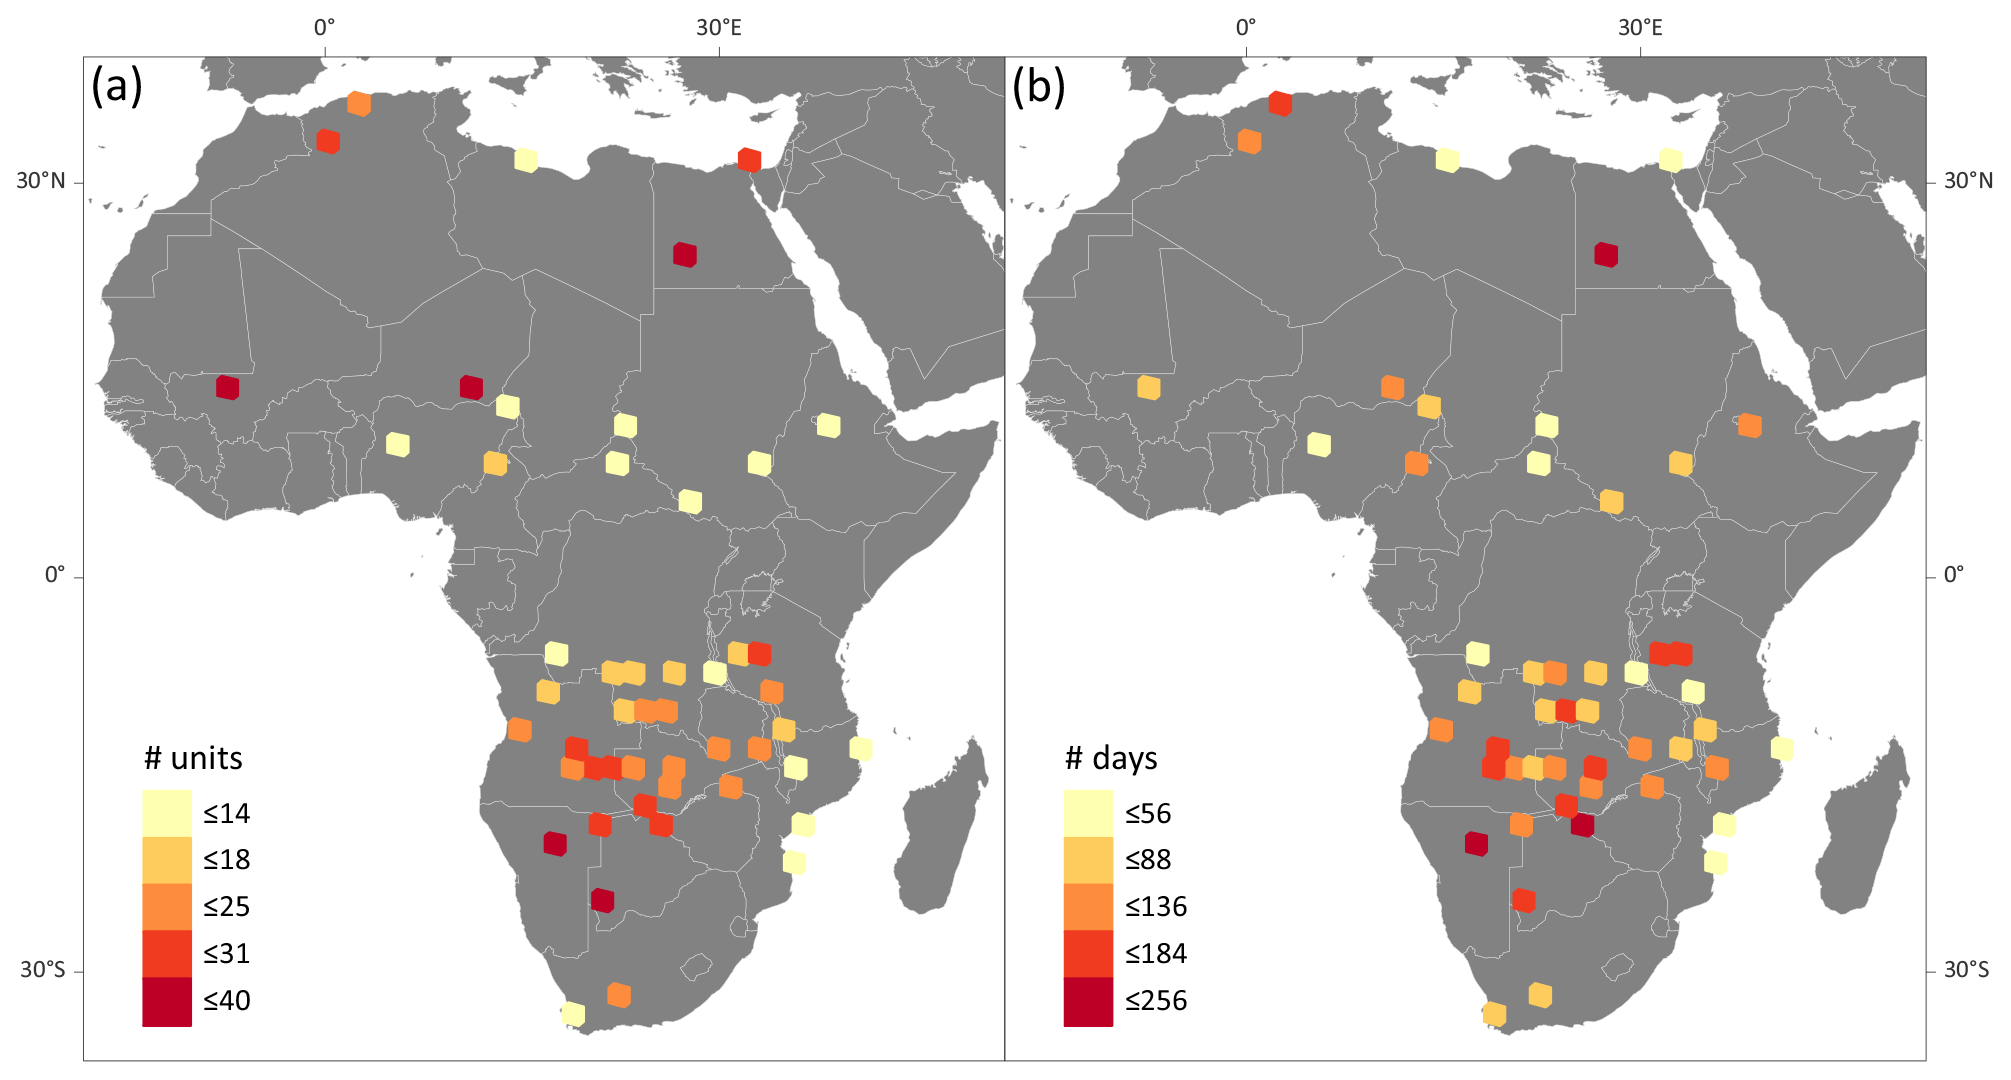
Figure 6Spatial distribution of the reference sites for the FireCCI Africa (2016) dataset: (a) number of short units interpreted in each validation site and (b) temporal length of the long units.
2.4.4 FireCCI Africa S2 (2016)
The FireCCI Africa S2 BA reference dataset was created to perform an initial validation assessment of the Small Fire Database Fire_cci v1.1 product (FireCCISFD11) produced for the year 2016 for the whole of sub-Saharan Africa (Roteta et al., 2019). Reference data were generated from the comparison of two Sentinel-2 MSI images at 20 m resolution per reference site. Systematic sampling was used to select 52 validation sites based on Sentinel-2 tiles (110×110 km) over sub-Saharan Africa. BA was mapped with the BAMS (Burned Area Mapping Software) methodology, which is a semi-automated algorithm (Bastarrika et al., 2014). In short, training polygons for the burned category were defined in each tile, and burned seeds were detected. Then, burned pixels were grown out from these seeds until all pixels for each burned patch were detected. The results were visually analysed to determine the accuracy of the classification, and new training polygons were defined if needed. This was done sequentially until all burned areas were mapped and no commission or omission errors were visually detected. Finally, if there was noise created by unmasked clouds and cloud shadows, it was edited and removed manually.
The temporal length of the reference data varies between 10 and 120 d: 86 % of the pairs of images were separated by less than 50 d, and 14 % were separated by more than 50 d, with a maximum time lapse of 120 d. The total area of reference data is 0.63 × 10⁶ km2, of which 8.87 % corresponds to the burned, 72.42 % to the unburned and 18.71 % to the unobserved category. The location and temporal length of the reference data are shown in Fig. 7. This reference dataset is compliant with CEOS-LPVS Stage 1.
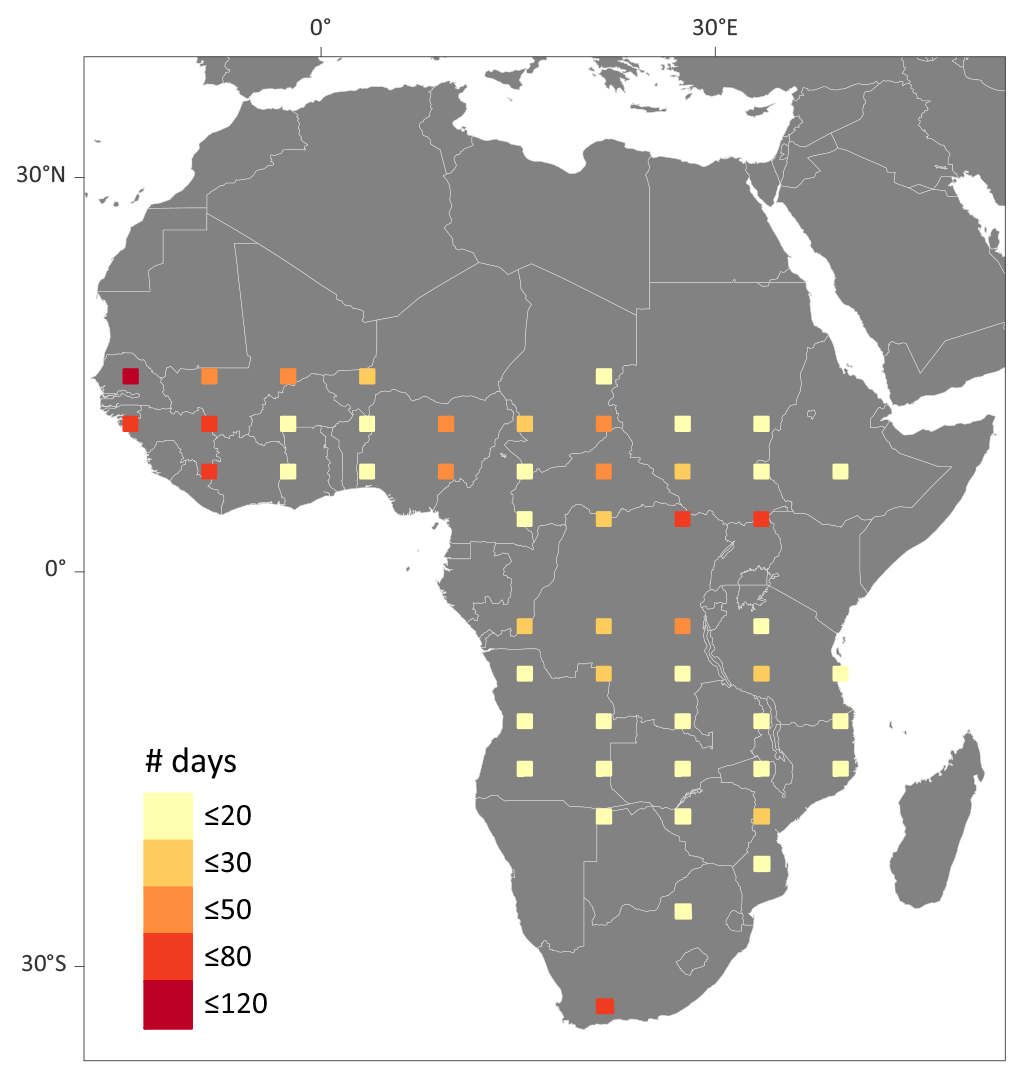
Figure 7Spatial distribution of the reference sites for the FireCCI Africa S2 (2016) dataset. The legend shows the temporal distance (days) between the pre- and post-fire images used in each validation site for the year 2016.
2.4.5 CONUS Landsat Burned Area (1988–2013)
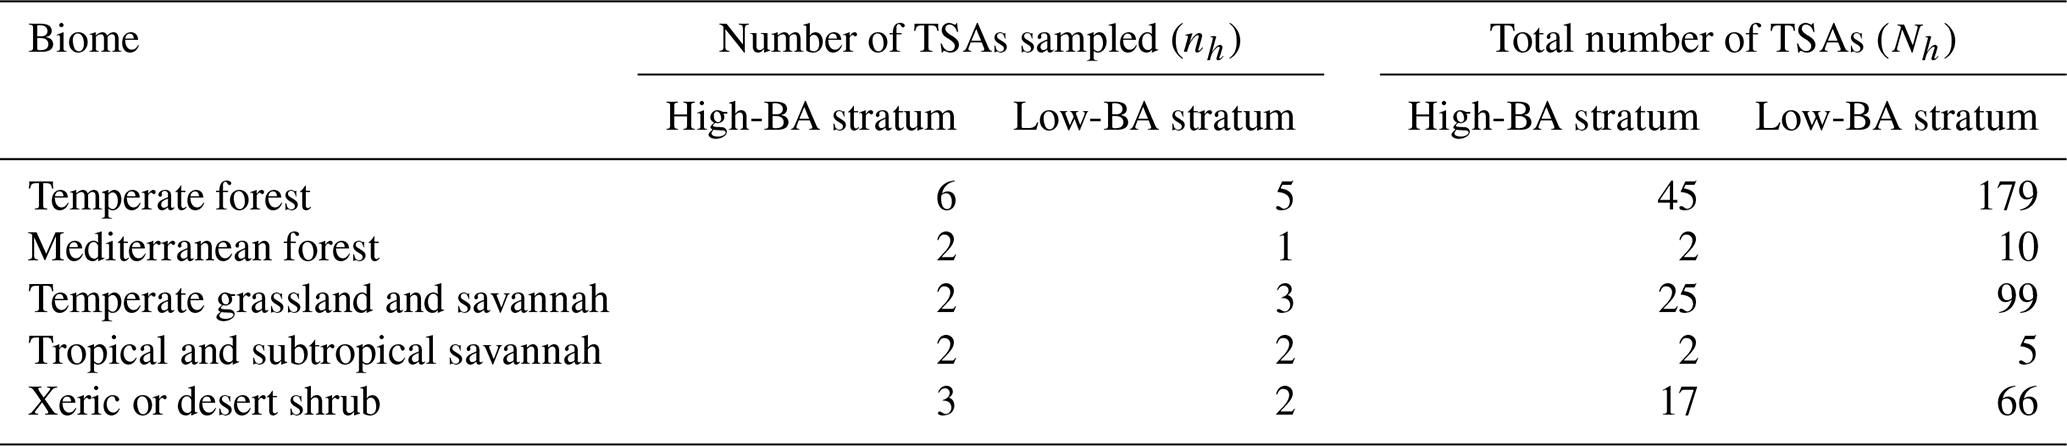
The CONUS Landsat Burned Area (1988–2013) reference dataset (Vanderhoof et al., 2017, 2020) extends across the contiguous United States (CONUS) and was generated to validate the Landsat Burned Area product (Hawbaker et al., 2017, 2020). The sampling design was adapted from the methods used by the ESA CCI FireCCI project. Existing FireCCI validation TSAs (n=9) within CONUS were augmented with an additional 19 TSAs for a total of 28 TSAs. The TSAs were stratified across the major Olson biomes (Olson et al., 2001) including (1) temperate forest, (2) Mediterranean forest, (3) temperate grassland and savannah, (4) tropical and subtropical grasslands and savannah, and (5) xeric or desert shrub. TSAs selected within each biome were meant to represent high and low burned areas as specified by the Global Fire Emissions Database (GFED) Version 3 (Table A4). Systematic sampling was applied to select 6 validation years spaced out in 5-year increments (2013, 2008, 2003, 1998, 1993 and 1988).
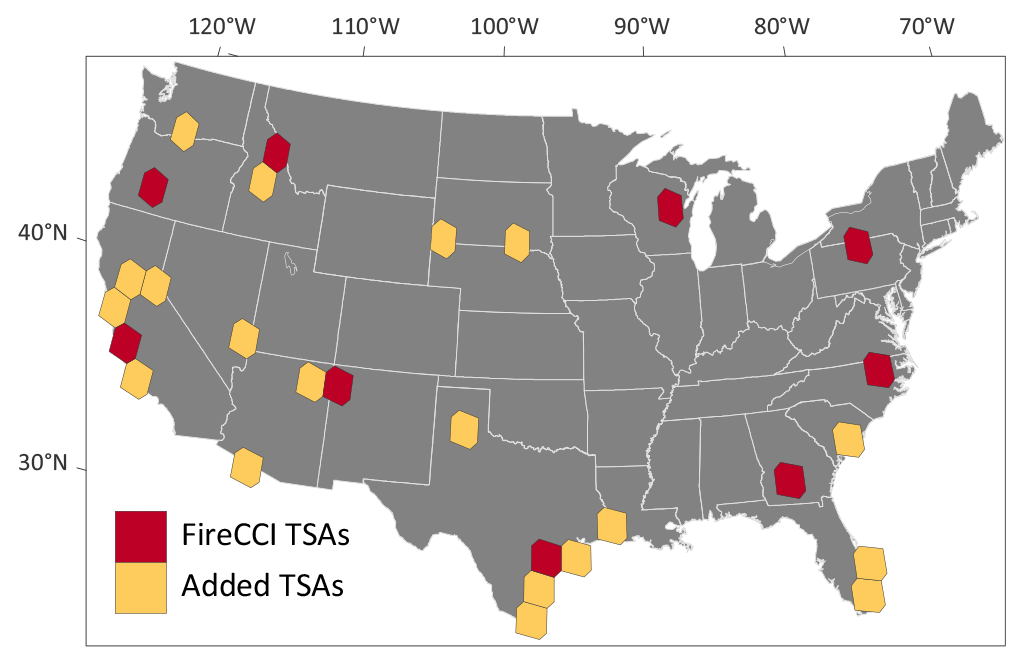
Figure 8Spatial distribution of the validation Thiessen scene areas (TSAs) for the CONUS Landsat Burned Area (1988–2013) dataset. Modified from Vanderhoof et al. (2017). Reference data were generated for each TSA in each of the 6 sample years (1988, 1993, 1998, 2003, 2008 and 2013).
A total of 269 images from Landsat 5 TM, 10 from Landsat 7 ETM+ and 56 from Landsat 8 OLI were used to derive the BA extent. Landsat reference images were limited to those with a geometric root mean square error (RMSE) < 10 m, < 20 % cloud cover and available as a L1T (Level 1T) Surface Reflectance product. The time lapse between images was not limited to 16 d, and only two images (pre- and post-fire) were used to retrieve BA reference data for each validation site and year. The pre- and post-fire image pairs did not specifically represent a probability sample within a year but were designed to target changes incurred over the peak fire season. The peak fire season was determined using the distribution of total burned area by month as derived from the MCD45 burned area product (2001–2015). The FMask (Function of Mask) from the Landsat surface reflectance product was applied to mask clouds, cloud shadows, snow and open water from each image used (Zhu and Woodcock, 2014). For Landsat 7 ETM+ images, SLC-off pixels were masked. The low-, medium- and high-intensity development classes (i.e. urban areas) were masked using the National Land Cover Database (NLCD, https://www.mrlc.gov/national-land-cover-database-nlcd-2016, last access: 3 December 2020) (Homer et al., 2015) to reduce spectral confusion between burned areas and impervious surfaces. Similarly, agricultural burns were not used to train the reference data burn classification; therefore the accuracy of the reference dataset in agricultural areas is unknown. If this is of concern to users, then users can mask the land cover type of “cultivated crops” from the reference data using the NLCD.
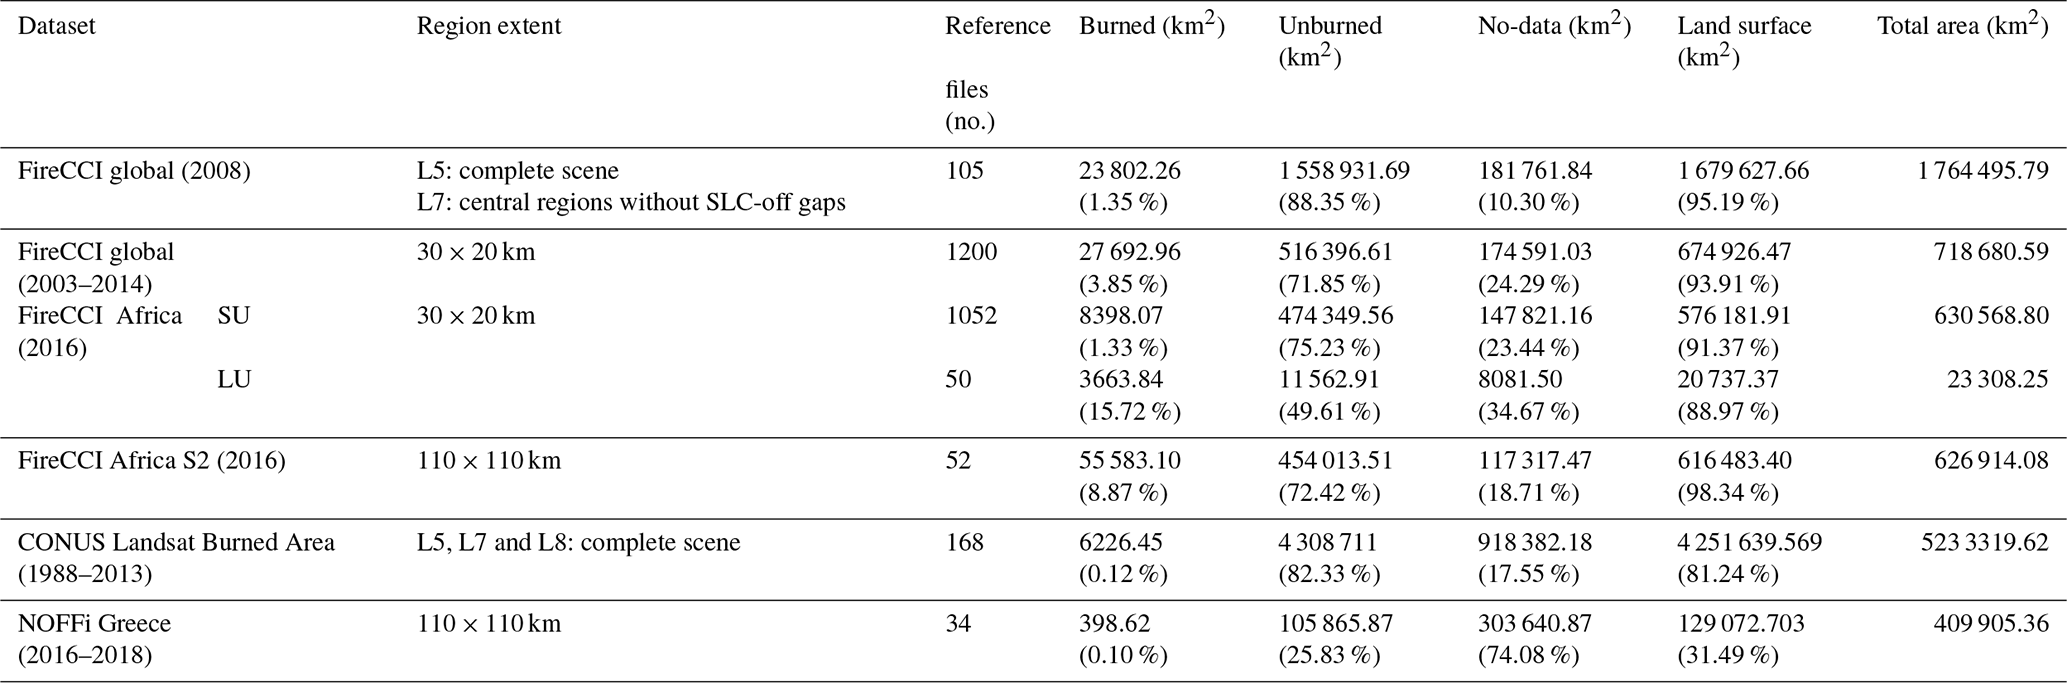
Table 3Summary of the total area (km2) of the three mapped categories (burned, unburned and no-data) and percentage of each category with respect to the total area mapped for each dataset. Additionally, the total land surface and percentage with respect to the total area interpreted is provided. The region extent and the total number of reference files included in each dataset is also indicated.
Burned area maps were generated using BAMS (Bastarrika et al., 2014). The Normalized Burn Ratio (NBR), Mid-infrared Burned Index (MIRBI), Global Environmental Monitoring Index (GEMI) and Normalized Difference Vegetation Index (NDVI) were calculated for the pre- and post-fire images and utilized in a supervised classification. The algorithm was trained on manually selected polygons containing (1) clearly burned pixels and (2) spectrally similar but less distinct burned pixels. The algorithm applied a region-growing function between the two types of training polygons, while cut-off values for each variable were extracted from the training polygons. Each classified burned area was then manually edited. When available, the analysts utilized ancillary datasets (e.g. Monitoring Trends in Burn Severity (MTBS, Eidenshink et al., 2007), MODIS active fire points (MOD14 Collection 5, Giglio et al., 2009), MODIS burned area (MCD45A1 Collection 5, Roy et al., 2008) and aerial imagery) to improve the confidence in their selection of training pixels and manual edits. To maximize the accuracy of the reference dataset, each image pair was classified into burned area extent and visually evaluated and edited independently by three different analysts. A pixel was then classified as burned if it was identified as burned by two of the three analysts. Additional processing details can be found in Vanderhoof et al. (2017).
The CONUS Landsat Burned Area (1988–2013) dataset includes 168 reference data files from 28 Landsat path and rows and 6 years (1988, 1993, 1998, 2003, 2008 and 2013). The temporal length of reference data varies between 16 and 288 d: 37 % of pairs of images were separated by less than 50 d; 35 % were separated between 50 and 100 d; and 28 % were separated by more than 100 d, with a maximum time lapse between the pre- and post-fire image of 288 d. The total area of reference data is 5.23 × 10⁶ km2, of which 0.12 % corresponds to the burned, 82.33 % to the unburned and 17.55 % to the unobserved category. The location of reference sites based on TSAs is shown in Fig. 8. With the publication of Hawbaker et al. (2020), this reference dataset is compliant with CEOS-LPVS Stage 4.
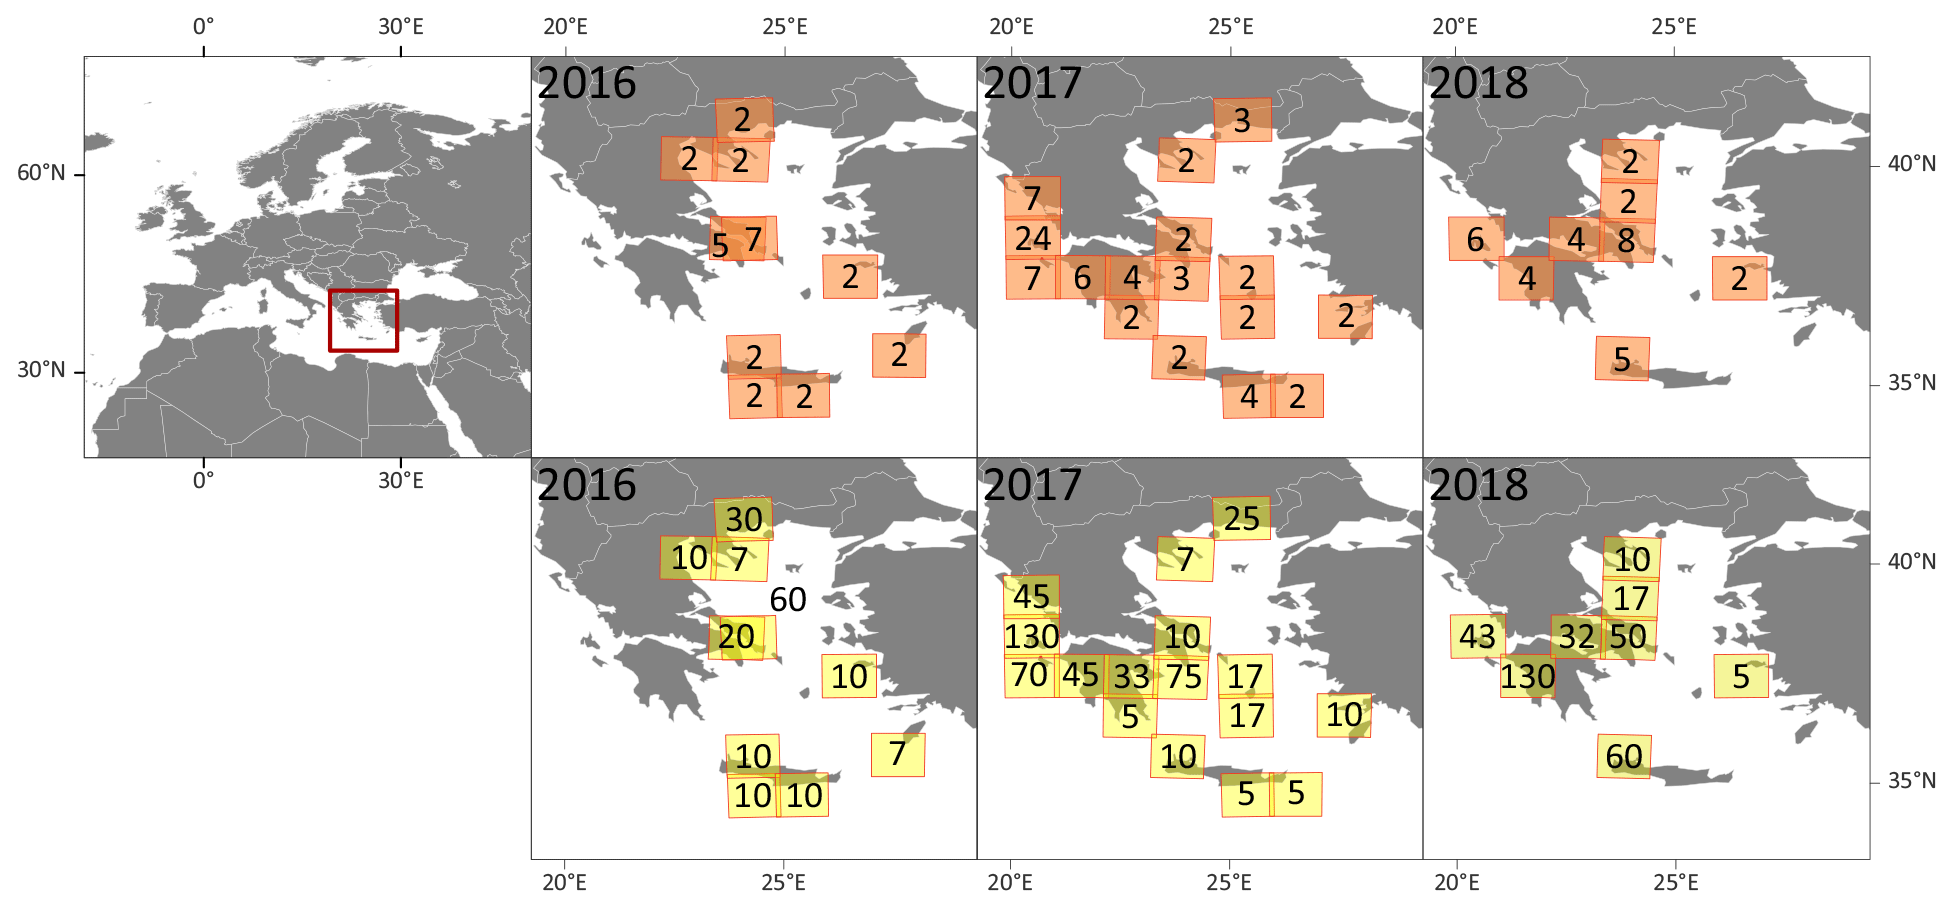
Figure 9Spatial distribution of validation sites for the NOFFi Greece (2016–2018) reference dataset based on Sentinel-2 tiles. The orange figures above show the number of images used in each validation site for each year, whereas the yellow ones below show the temporal length (days) of the reference data files generated in each validation site.
2.4.6 NOFFi Greece (2016–2018)
The reference data were obtained using the perimeters produced by the National Observatory of Forest Fires (NOFFi) (http://epadap.web.auth.gr, last access: 3 December 2020) and, specifically, its Object-based Burned Area Mapping (OBAM) service, implemented by the Laboratory of Forest Management and Remote Sensing (FMRS) of the Aristotle University of Thessaloniki. NOFFi-OBAM is an on-demand service, meaning that it is activated after large wildfire events and under explicit requests by the local forest offices. It relies solely on Sentinel-2 imagery and is employed only for fires within Greece. The NOFFi-OBAM algorithm is designed to map fire perimeters and follows a supervised learning approach using a post-fire Sentinel-2 (Level-1C) image, although a pre-fire image is also used for photo-interpretation purposes. The methodology applied to retrieve the fire perimeters is fully described in Tompoulidou et al. (2016). Non-probability sampling design was applied for this dataset; reference sites were selected by convenience based on images previously processed in the NOFFi-OBAM service.
The NOFFi-OBAM fire perimeters were used as the basis for creating the reference data for the NOFFi Greece reference dataset considering the burned area mapping years 2016, 2017 and 2018. For each Sentinel-2 tile ID (e.g. T34SDH) in which fire perimeters were available, the whole time series of images was visually checked, and the date range for the reference file creation was defined from the first pre-fire image to the last post-fire image. Small fires within the specific time series that were not mapped from the NOFFi-OBAM service were explicitly digitized. Since NOFFi-OBAM only serves Greece, areas outside Greece's official land boundaries (e.g. seas and land areas of neighbouring countries) were masked and classified as unobserved surfaces (category = 2). Some burned scars in overlapping border tiles were mapped by using images from those neighbouring tiles only if the post-fire image used for the mapping was inside the time span of the former tile ID. For example, the file “NOFFi_RD_ T34SGH_ 20160710_20160730.shp” includes polygons with preImg and postImg from T35SCK. This can be identified from the preImg, postImg and tile columns of the file. Clouds and cloud shadows were manually digitized and masked (category = 2), considering the last postImg. Although a non-probability sampling design was applied for this dataset, the NOFFi-OBAM service has been activated for all wildfires greater than 100 ha during the period 2016–2018 and, in many cases, for smaller (or even much smaller) wildfires. Therefore, the dataset contains a representative set of Sentinel-2 tiles that are frequently affected by wildfires in Greece, at least for the given time period.
The NOFFi Greece dataset includes 34 reference data files from 25 different Sentinel-2 tiles. The temporal length of reference data varies between 5 and 132 d. The total area of reference data is 0.41 × 10⁶ km2, of which 0.10 % corresponds to the burned, 25.83 % to the unburned and 74.08 % to the unobserved category. As shown in Fig. 9, most of the surface of the tiles from this dataset corresponds to sea surface that was categorized in the no-data category (Sect. 2.2.); this is the reason the unobserved category is so high compared to the rest of the datasets. The location and temporal length of the reference data as well as the number of images used in each reference site are shown Fig. 9. This reference dataset is compliant with CEOS-LPVS Stage 1.
The BARD database compiled in this effort is freely available on the e-cienciaDatos repository (https://doi.org/10.21950/BBQQU7, Franquesa et al., 2020). All burned area reference data files have been visually checked, reprojected and reformatted to provide a uniform set of attributes and metadata descriptions to maximize the ease with which these reference files can be used to evaluate global burned area products. A summary of the data included in each dataset is described in Tables 2 and 3. Reference shapefiles and metadata files can be downloaded, grouped by the datasets described in this publication: FireCCI global (2008), FireCCI global (2003–2014), FireCCI Africa (2016), FireCCI Africa S2 (2016), CONUS Landsat Burned Area (1988–2013) and NOFFi Greece (2016–2018). Plans are underway to expand the Burned Area Reference Database with new reference files that the FireCCI project produces, and we encourage future contributions from the scientific community.
BARD is the first publicly available database that compiles and standardizes previously generated validation reference data. Reference datasets included in this database have been produced throughout the life of the FireCCI project, since 2010, and other initiatives such as the Landsat Level-3 Science Products and NOFFi projects have joined and contributed to this effort. BARD gathers and compiles a total of 2661 standardized shapefiles representing reference burned area data generated from approximately 4500 Landsat and Sentinel-2 images and 8×10⁶ km2 of interpreted land surface. Reference data were produced following the recommendations of the CEOS Working Group on Calibration and Validation and visually inspected by two or more experienced interpreters to ensure the accuracy of the data. As BARD is a compilation of datasets that were produced in different projects and years in which different methods were applied (e.g. different sampling methods, sensors, years or region extent), it is highly recommended that the user clearly understands the characteristics of the dataset or datasets that best suits their needs. The BA reference database and future updates remedy the lack of an extensive global and regional, multitemporal validation dataset (Humber et al., 2019) and, certainly, can serve as a valuable source for validation of existing products and development of new BA algorithms, particularly those requiring large amounts of training data.
Table A1FireCCI global (2008) stratified sampling data. Distribution of sampled (nh) and total population (Nh) Thiessen scene areas (TSAs) by biome and BA stratum. BA: burned area.
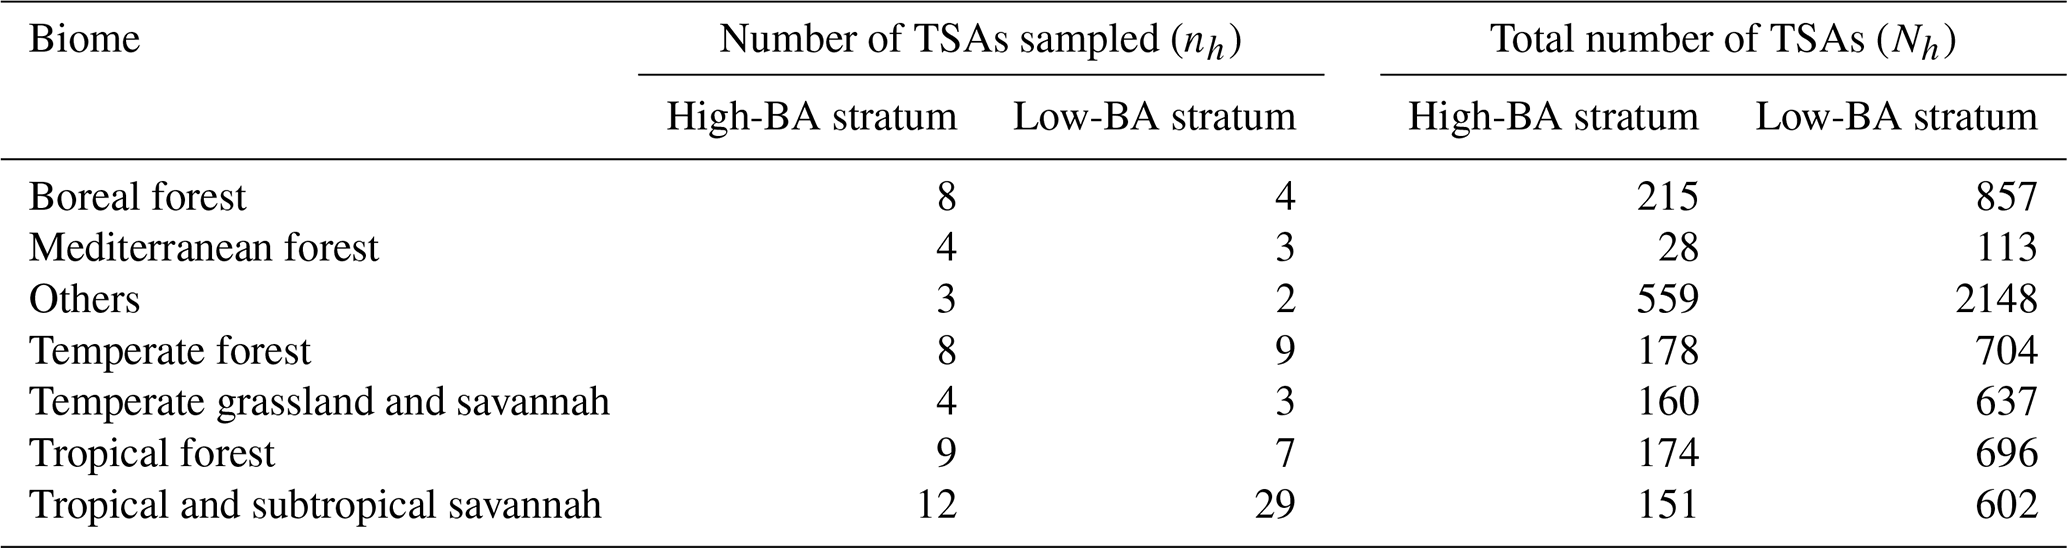
Table A2FireCCI global (2003–2014) stratified sampling data. Distribution of sampled units (nh) and total population (Nh) by year, biome and BA stratum. H: high, L: low, BA: burned area.
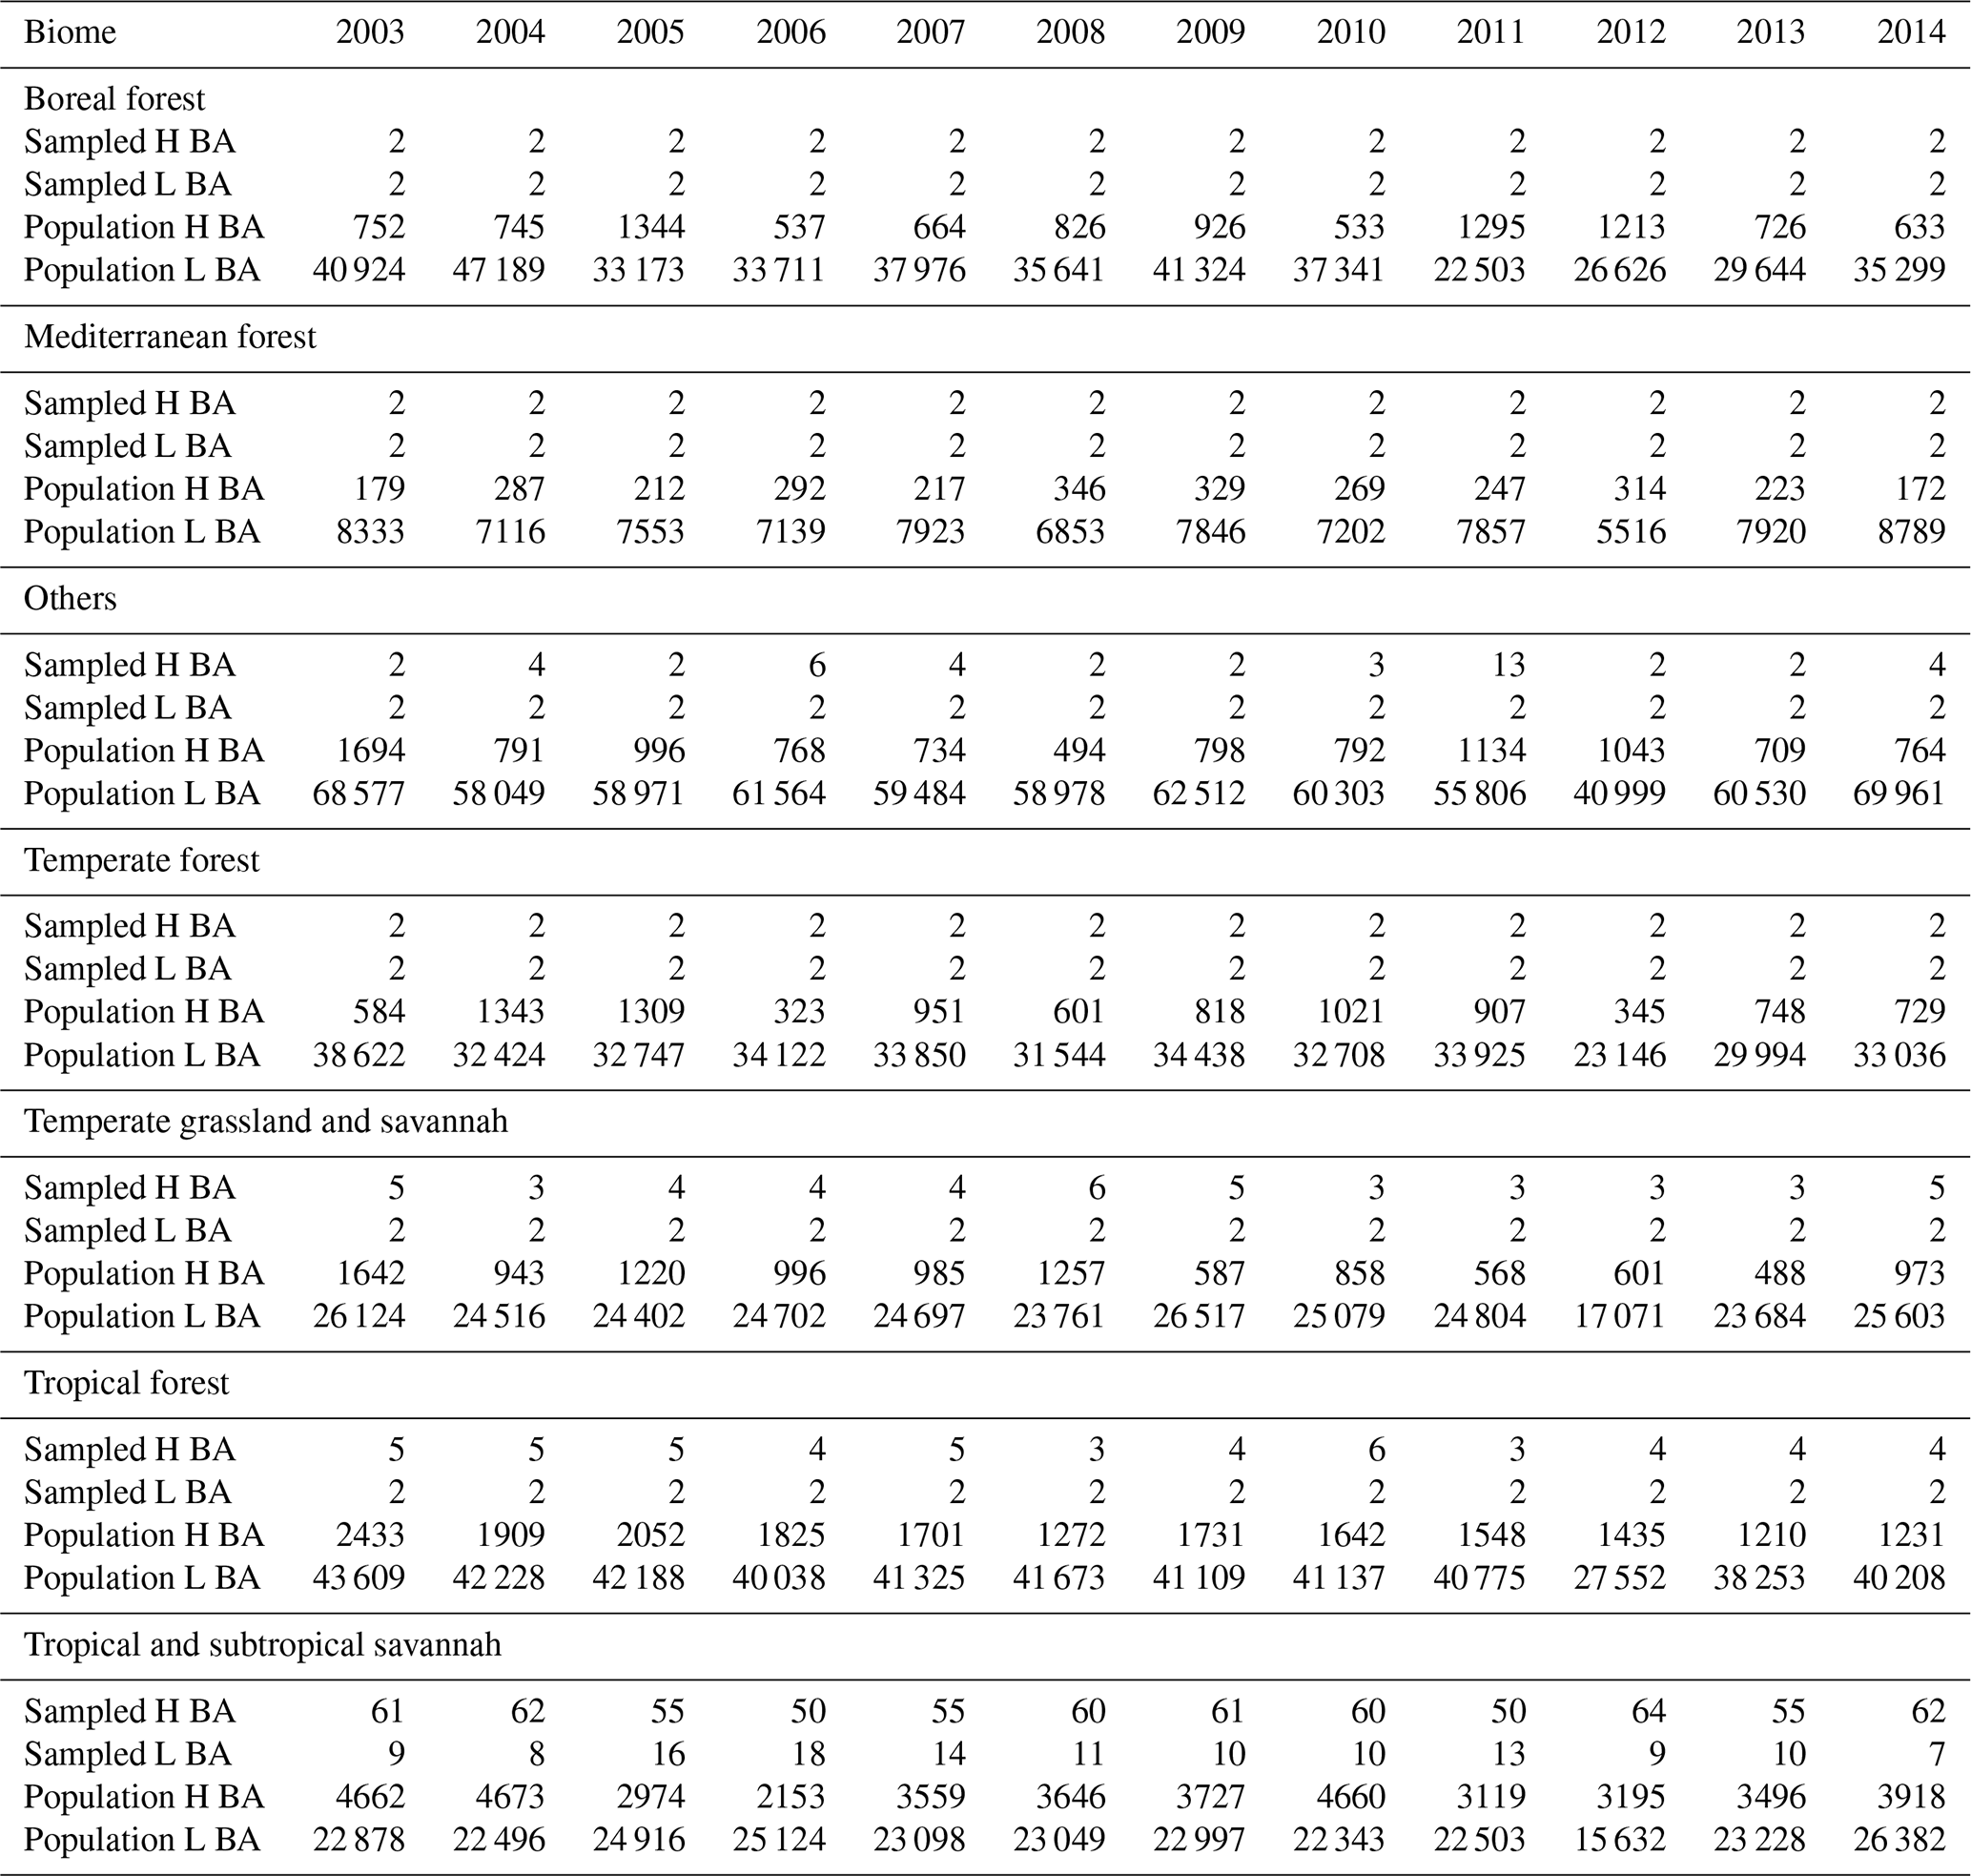
Table A3FireCCI Africa (2016) stratified sampling data. Distribution of sampled long units and total population by biome and stratum. BA: burned area.

Table A4CONUS Landsat Burned Area (1988–2013) stratified sampling data. Distribution of sampled and population Thiessen scene areas (TSAs) by biome and stratum. Each sampled TSA was then sampled for 5 separate years; however, the high- or low-BA stratum was determined from 2008, alone. Total number of TSAs is calculated for the contiguous United States (CONUS). BA: burned area.
MF and EC wrote the first draft of the paper. MF has coordinated the paper production and prepared the figures, standardized the reference files and organized the BARD database, and managed its publication on the e-cienciaDatos repository. MKV provided the CONUS Landsat Burned Area (1988–2013) dataset. DS and IZG provided the NOFFi Greece (2016–2018) dataset. ER provided the FireCCI Africa S2 (2016) dataset, and MP provided the rest of the FireCCI datasets. EC, as the science leader of the FireCCI project, managed the overall execution of the project and suggested the preparation of the present article. All the authors have contributed to the writing and reviewing of the paper and agreed on the final version.
The authors declare that they have no conflict of interest.
We thank Joshua J. Picotte (U.S. Geological Survey Earth Resources Observation and Science (EROS) Center, USA), M. Lucrecia Pettinari (University of Alcalá, Spain), Renata Libonati, Julia A. Rodrigues (Universidade Federal do Rio de Janeiro, Brazil) and Alberto W. Setzer (National Institute for Space Research (INPE), Brazil) for their valuable suggestions in the first version of the paper. Melanie K. Vanderhoof's time was supported by the U.S. Geological Survey Land Resources Mission Area Land Change Science Program. Any use of trade, firm or product names is for descriptive purposes only and does not imply endorsement by the US government.
This research has been supported by the FireCCI project, which is part of the ESA Climate Change Initiative (contract no. 4000126706/19/I-NB), and the Service Contract for the provision of land CDRs and ICDRs of the Copernicus Climate Change Service (contract no. ECMWF/COPERNICUS/2018/C3S_312b_Lot5_VITO/SC1).
This paper was edited by Kirsten Elger and reviewed by three anonymous referees.
Alonso-Canas, I. and Chuvieco, E.: Global burned area mapping from ENVISAT-MERIS and MODIS active fire data, Remote Sens. Environ., 163, 140–152, https://doi.org/10.1016/j.rse.2015.03.011, 2015.
Bastarrika, A., Chuvieco, E., and Martín, M. P.: Mapping burned areas from Landsat TM/ETM+ data with a two-phase algorithm: Balancing omission and commission errors, Remote Sens. Environ., 115, 1003–1012, https://doi.org/10.1016/j.rse.2010.12.005, 2011.
Bastarrika, A., Alvarado, M., Artano, K., Martinez, M., Mesanza-Moraza, A., Leyre, T., Ramo, R., and Chuvieco, E.: BAMS: A Tool for Supervised Burned Area Mapping Using Landsat Data, Remote Sensing, 6, 12360–12380, https://doi.org/10.3390/rs61212360, 2014.
Boschetti, L. and Roy, D. P.: Defining a fire year for reporting and analysis of global interannual fire variability, J. Geophys. Res.-Biogeo., 113, https://doi.org/10.1029/2008JG000686, 2008.
Boschetti, L., Stehman, S. V., and Roy, D. P.: A stratified random sampling design in space and time for regional to global scale burned area product validation, Remote Sens. Environ., 186, 465–478, https://doi.org/10.1016/j.rse.2016.09.016, 2016.
Boschetti, L., Roy, D. P., Giglio, L., Huang, H., Zubkova, M., and Humber, M. L.: Global validation of the collection 6 MODIS burned area product, Remote Sens. Environ., 235, 111490, https://doi.org/10.1016/j.rse.2019.111490, 2019.
CEOS Working Group on Calibration and Validation – Land Product Validation Subgroup, available at: http://lpvs.gsfc.nasa.gov/ (last access: 3 December 2020), 2012.
Chuvieco, E., Opazo, S., Sione, W., Del Valle, H., Anaya, J., Di Bella, C., Cruz, I., Manzo, L., López, G., Mari, N., González-Alonso, F., Morelli, F., Setzer, A., Csiszar, I., Kanpandegi, J. A., Bastarrika, A., and Libonati, R.: Global burned-land estimation in Latin America using MODIS composite data, Ecol. Appl., 18, 64–79, https://doi.org/10.1890/06-2148.1, 2008.
Chuvieco, E., Lizundia-Loiola, J., Pettinari, M. L., Ramo, R., Padilla, M., Tansey, K., Mouillot, F., Laurent, P., Storm, T., Heil, A., and Plummer, S.: Generation and analysis of a new global burned area product based on MODIS 250 m reflectance bands and thermal anomalies, Earth Syst. Sci. Data, 10, 2015–2031, https://doi.org/10.5194/essd-10-2015-2018, 2018.
Chuvieco, E., Mouillot, F., van der Werf, G. R., San Miguel, J., Tanasse, M., Koutsias, N., García, M., Yebra, M., Padilla, M., Gitas, I., Heil, A., Hawbaker, T. J., and Giglio, L.: Historical background and current developments for mapping burned area from satellite Earth observation, Remote Sens. Environ., 225, 45-64, https://doi.org/10.1016/j.rse.2019.02.013, 2019.
Cohen, W. B., Yang, Z., and Kennedy, R.: Detecting trends in forest disturbance and recovery using yearly Landsat time series: 2. TimeSync—Tools for calibration and validation, Remote Sens. Environ., 114, 2911–2924, https://doi.org/10.1016/j.rse.2010.07.010, 2010.
Eidenshink, J. C., Schwind, B., Brewer, K., Zhu, Z.-L., Quayle, B., and Howard, S. M.: A project for monitoring trends in burn severity, Fire Ecology, 3, 3–21, https://doi.org/10.4996/fireecology.0301003, 2007.
Franquesa, M., Vanderhoof, M. K., Stavrakoudis, D., Gitas, I., Roteta, E., Padilla, M., and Chuvieco, E.: BARD: a global and regional validation burned area database, V.4.0, e-cienciaDatos, https://doi.org/10.21950/BBQQU7, 2020.
Gallego, F. J.: Stratified sampling of satellite images with a systematic grid of points, ISPRS J. Photogramm., 59, 369–376, https://doi.org/10.1016/j.isprsjprs.2005.10.001, 2005.
Giglio, L., Loboda, T., Roy, D. P., Quayle, B., and Justice, C. O.: An active-fire based burned area mapping algorithm for the MODIS sensor, Remote Sens. Environ., 113, 408–420, https://doi.org/10.1016/j.rse.2008.10.006, 2009.
Giglio, L., Randerson, J. T., van der Werf, G. R., Kasibhatla, P. S., Collatz, G. J., Morton, D. C., and DeFries, R. S.: Assessing variability and long-term trends in burned area by merging multiple satellite fire products, Biogeosciences, 7, 1171–1186, https://doi.org/10.5194/bg-7-1171-2010, 2010.
Giglio, L., Boschetti, L., Roy, D. P., Humber, M. L., and Justice, C. O.: The Collection 6 MODIS burned area mapping algorithm and product, Remote Sens. Environ., 217, 72–85, https://doi.org/10.1016/j.rse.2018.08.005, 2018.
Grégoire, J. M., Tansey, K., and Silva, J.: The GBA2000 initiative: developing a global burnt area database from SPOT-VEGETATION imagery, Int. J. Remote Sens., 24, 1369–1376, https://doi.org/10.1080/0143116021000044850, 2003.
Hawbaker, T. J., Vanderhoof, M. K., Beal, Y. J., Takacs, J. D., Schmidt, G. L., Falgout, J. T., Williams, B., Fairaux, N. M., Caldwell, M. K., Picotte, J. J., Howard, S. M., Stitt, S., and Dwyer, J. L.: Mapping burned areas using dense time-series of Landsat data, Remote Sens. Environ., 198, 504–522, https://doi.org/10.1016/j.rse.2017.06.027, 2017.
Hawbaker, T. J., Vanderhoof, M. K., Schmidt, G. L., Beal, Y.-J., Picotte, J. J., Takacs, J. D., Falgout, J. T., and Dwyer, J. L.: The Landsat Burned Area algorithm and products for the conterminous United States, Remote Sens. Environ., 244, 1–24, https://doi.org/10.1016/j.rse.2020.111801, 2020.
Homer, C., Dewitz, J., Yang, L., Jin, S., Danielson, P., Xian, G., Coulston, J., Herold, N., Wickham, J., and Megown, K.: Completion of the 2011 National Land Cover Database for the Conterminous United States – Representing a Decade of Land Cover Change Information, Photogramm. Eng. Rem. S., 81, 346–354, 2015.
Humber, M. L., Boschetti, L., Giglio, L., and Justice, C. O.: Spatial and temporal intercomparison of four global burned area products, Int. J. Digit. Earth, 12, 460–484, https://doi.org/10.1080/17538947.2018.1433727, 2019.
Kennedy, R. E., Yang, Z., and Cohen, W. B.: Detecting trends in forest disturbance and recovery using yearly Landsat time series: 1. LandTrendr – Temporal segmentation algorithms, Remote Sens. Environ., 114, 2897–2910, https://doi.org/10.1016/j.rse.2010.07.008, 2010.
Lizundia-Loiola, J., Otón, G., Ramo, R., and Chuvieco, E.: A spatio-temporal active-fire clustering approach for global burned area mapping at 250 m from MODIS data, Remote Sens. Environ., 236, 111493, https://doi.org/10.1016/j.rse.2019.111493, 2020.
Olofsson, P., Foody, G. M., Herold, M., Stehman, S. V., Woodcock, C. E., and Wulder, M. A.: Good practices for estimating area and assessing accuracy of land change, Remote Sens. Environ., 148, 42–57, https://doi.org/10.1016/j.rse.2014.02.015, 2014.
Olson, D. M., Dinerstein, E., Wikramanayake, E. D., Burgess, N. D., Powell, G. V. N., Underwood, E. C., D'Amico, J. A., Itoua, I., Strand, H. E., Morrison, J. C., Loucks, C. J., Allnutt, T. F., Ricketts, T. H., Kura, Y., Lamoreux, J. F., Wettengel, W. W., Hedao, P., and Kassem, K. R.: Terrestrial Ecoregions of the World: A New Map of Life on EarthA new global map of terrestrial ecoregions provides an innovative tool for conserving biodiversity, BioScience, 51, 933–938, https://doi.org/10.1641/0006-3568(2001)051[0933:TEOTWA]2.0.CO;2, 2001.
Padilla, M., Stehman, S. V., and Chuvieco, E.: Validation of the 2008 MODIS-MCD45 global burned area product using stratified random sampling, Remote Sens. Environ., 144, 187–196, https://doi.org/10.1016/j.rse.2014.01.008, 2014.
Padilla, M., Stehman, S. V., Ramo, R., Corti, D., Hantson, S., Oliva, P., Alonso-Canas, I., Bradley, A. V., Tansey, K., Mota, B., Pereira, J. M., and Chuvieco, E.: Comparing the accuracies of remote sensing global burned area products using stratified random sampling and estimation, Remote Sens. Environ., 160, 114–121, https://doi.org/10.1016/j.rse.2015.01.005, 2015.
Padilla, M., Olofsson, P., Stehman, S. V., Tansey, K., and Chuvieco, E.: Stratification and sample allocation for reference burned area data, Remote Sens. Environ., 203, 240–255, https://doi.org/10.1016/j.rse.2017.06.041, 2017.
Padilla, M., Wheeler, J., and Tansey, K.: ESA CCI ECV Fire Disturbance: D4.1.1. Product Validation Report, version 2.1. Tech. Rep., available at: https://climate.esa.int/media/documents/Fire_cci_D4.1.1_PVR_v2.1_jpIZiU7.pdf (last access: 3 December 2020), 2018.
Plummer, S., Arino, O., Simon, M., and Steffen, W.: Establishing A Earth Observation Product Service For The Terrestrial Carbon Community: The Globcarbon Initiative, Mitig. Adapt. Strat. Gl., 11, 97–111, https://doi.org/10.1007/s11027-006-1012-8, 2006.
Roteta, E., Bastarrika, A., Padilla, M., Storm, T., and Chuvieco, E.: Development of a Sentinel-2 burned area algorithm: Generation of a small fire database for sub-Saharan Africa, Remote Sens. Environ., 222, 1–17, https://doi.org/10.1016/j.rse.2018.12.011, 2019.
Roy, D. P. and Boschetti, L.: Southern Africa validation of the MODIS, L3JRC, and GlobCarbon burned-area products, IEEE T. Geosci. Remote, 47, 1032–1044, https://doi.org/10.1109/TGRS.2008.2009000, 2009.
Roy, D. P., Frost, P. G. H., Justice, C. O., Landmann, T., Le Roux, J. L., Gumbo, K., Makungwa, S., Dunham, K., Du Toit, R., Mhwandagara, K., Zacarias, A., Tacheba, B., Dube, O. P., Pereira, J. M. C., Mushove, P., Morisette, J. T., Santhana Vannan, S. K., and Davies, D.: The Southern Africa Fire Network (SAFNet) regional burned-area product-validation protocol, Int. J. Remote Sens., 26, 4265-4-292, https://doi.org/10.1080/01431160500113096, 2005.
Roy, D. P., Boschetti, L., Justice, C. O., and Ju, J.: The collection 5 MODIS burned area product – Global evaluation by comparison with the MODIS active fire product, Remote Sens. Environ., 112, 3690–3707, https://doi.org/10.1016/j.rse.2008.05.013, 2008.
Simon, M., Plummer, S., Fierens, F., Hoelzemann, J. J., and Arino, O.: Burnt area detection at global scale using ATSR-2: The GLOBSCAR products and their qualification, J. Geophys. Res.-Atmos., 109, https://doi.org/10.1029/2003JD003622, 2004.
Stehman, S. V.: Statistical rigor and practical utility in thematic map accuracy assessment, Photogramm. Eng. Rem. S., 67, 727–734, 2001.
Stehman, S. V.: Sampling designs for accuracy assessment of land cover, Int. J. Remote Sens., 30, 5243–5272, https://doi.org/10.1080/01431160903131000, 2009.
Stehman, S. V. and Foody, G. M.: Key issues in rigorous accuracy assessment of land cover products, Remote Sens. Environ., 231, 111199, https://doi.org/10.1016/j.rse.2019.05.018, 2019.
Stehman, S. V., Olofsson, P., Woodcock, C. E., Herold, M., and Friedl, M. A.: A global land-cover validation data set, II: augmenting a stratified sampling design to estimate accuracy by region and land-cover class, Int. J. Remote Sens., 33, 6975–6993, https://doi.org/10.1080/01431161.2012.695092, 2012.
Tansey, K., Grégoire, J. M., Stroppiana, D., Sousa, A., Silva, J., Pereira, J. M., Boschetti, L., Maggi, M., Brivio, P. A., and Fraser, R.: Vegetation burning in the year 2000: Global burned area estimates from SPOT VEGETATION data, J. Geophys. Res.-Atmos., 109, https://doi.org/10.1029/2003JD003598, 2004.
Tansey, K., Grégoire, J. M., Defourny, P., Leigh, R., Pekel, J. F., Bogaert, E., and Bartholomé, E.: A new, global, multi-annual (2000–2007) burnt area product at 1 km resolution, Geophys. Res. Lett., 35, 1–6, https://doi.org/10.1029/2007gl031567, 2008.
Tompoulidou, M., Stefanidou, A., Grigoriadis, D., Dragozi, E., Stavrakoudis, D., and Gitas, I.: The Greek National Observatory of Forest Fires (NOFFi), Fourth International Conference on Remote Sensing and Geoinformation of the Environment, SPIE, https://doi.org/10.1117/12.2240560, 2016.
Vanderhoof, M. K., Fairaux, N., Beal, Y.-J. G., and Hawbaker, T. J.: Validation of the USGS Landsat Burned Area Essential Climate Variable (BAECV) across the conterminous United States, Remote Sens. Environ., 198, 393–406, https://doi.org/10.1016/j.rse.2017.06.025, 2017.
Vanderhoof, M. K., Fairaux, N. M., Beal, Y.-J. G., and Hawbaker, T. J.: Data Release for the validation of the USGS Landsat Burned Area Product across the conterminous U.S. (ver. 2.0, May 2020), U.S. Geological Survey data release, https://doi.org/10.5066/F7T151VX, 2020.
Zhu, Z. and Woodcock, C. E.: Automated cloud, cloud shadow, and snow detection in multitemporal Landsat data: An algorithm designed specifically for monitoring land cover change, Remote Sens. Environ., 152, 217–234, https://doi.org/10.1016/j.rse.2014.06.012, 2014.