A Quantitative Description of the Causes of Color in Corundum
ABSTRACT
The color of a gemstone is inextricably linked to its chemical composition, yet the quantitative relationship between color and chemistry is poorly understood in most cases. Here we use corundum to present a comprehensive quantitative description of the causes of color in a gem material and illustrate its predictive power. Natural corundum has six major chromophores that cause color: Cr3+, h•-Cr3+, Fe3+, h•-Fe3+, Fe2+-Ti4+, and V3+. We use synthetic samples doped with a single chromophore to study their light absorption behavior in isolation. Natural samples are used as well to study single chromophores, and we can subtract out the absorption of additional chromophores that might be present. Combining quantitative visible absorption spectroscopy with chemical analysis by SIMS, we are able to calculate the absorption cross section of each chromophore. The absorption cross section information is used to determine the depth of color that would occur in corundum of a given size (optical path length) containing a specific chromophore of a given concentration.
INTRODUCTION
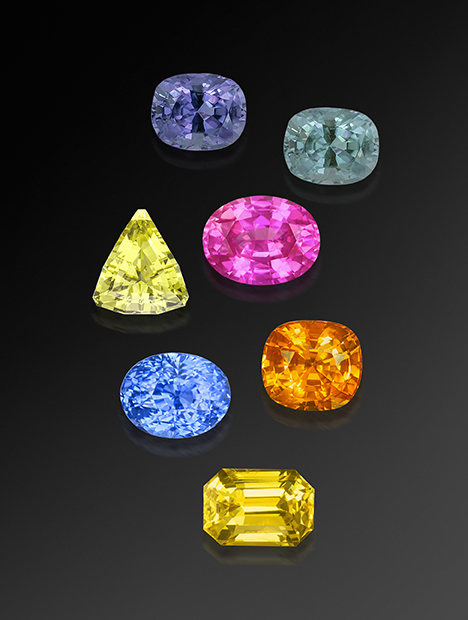
Gemstones are valued for their beauty, rarity, and durability, and what typically captures our attention is their magnificent array of colors. Corundum exhibits an extremely wide range of colors in nature (figure 1). From pigeon’s blood red ruby to cornflower blue and lemon yellow sapphire, nearly every color is represented. The only corundum color not represented in nature is a saturated intense emerald green. However, less intense olive green to teal green stones are often found in basalt-hosted corundum deposits.
Corundum’s broad range of colors is related to its detailed chemistry. Some minerals possess inherent color because the chromophore is one of the basic chemical components of its makeup. Such stones are termed idiochromatic, meaning self-colored. For example, turquoise, whose chemical formula is CuAl6(PO4)4(OH)8•4H2O, is colored by copper, a primary component of its structure.
Other minerals such as corundum are, when very pure, completely colorless. In fact, pure corundum, with the chemical formula Al2O3, is absolutely transparent from the deep ultraviolet region into the infrared. Such minerals are termed allochromatic. Their colors in nature are caused by minor impurities, referred to as trace elements, or other point defects in the crystal lattice that have been incorporated during growth or later equilibration in nature. The causes of color in corundum are many and have been primarily addressed in a non-quantitative way for many years (see, for example, Fritsch and Rossman, 1987, 1988; Häger, 2001; Emmett et al., 2003). Trace elements themselves can be the direct cause of color. Cr3+, for example, creates pink and red coloration in corundum. Trace elements can also interact with each other, creating a new chromophore. The Fe2+-Ti4+ pair is such an example, strongly absorbing in the yellow and red regions of the spectrum and thus creating magnificent blue sapphires.
When beryllium-diffused corundum entered the marketplace, we were surprised by the wide range of colors that were produced, seemingly by a single element (Emmett et al., 2003). Measurements of the beryllium levels showed that the concentrations were generally from a few to a few tens of parts per million atomic (ppma), yet the colors produced were often intense. For comparison, red coloration in corundum requires several hundred to a few thousand ppma of Cr3+, a concentration at least two orders of magnitude greater than Be2+, to produce strong color.
Our studies of the beryllium-diffused stones (Emmett et al., 2003) demonstrated that the Be2+ ion itself was not the cause of color. However, replacing a trivalent aluminum ion with a divalent beryllium ion required the creation of a trapped hole (h•) for charge compensation. A trapped hole is an oxygen ion with a valence of –1 rather than –2. It is this O–1 ion that is the strong absorber of light (Kvapil et al., 1973). In natural stones, this trapped hole associating with either iron or chromium creates intense golden yellow or intense orange colors, respectively.
In natural corundum, beryllium only rarely, if ever, exists in solution in the corundum lattice and thus does not produce these colors. Instead, natural corundum usually contains some amount of magnesium. Magnesium, like beryllium, is divalent (Mg2+, Be2+) when it replaces Al3+ in corundum and thus requires charge compensation. If the stone is acceptor-dominated1 with [Mg + Ni] > [Si + Ti + H] (square brackets denote concentrations in ions/cm3), and formed in conditions of relatively high oxygen fugacity, the charge compensation is by a trapped hole (h•). Since it is the trapped hole in association with iron or chromium and not the beryllium or magnesium that produces color, the colors produced naturally by magnesium or by diffusion of beryllium are very similar (Emmett et al., 2003, 2017b; Kröger, 1984).
1We use the terms “acceptor-dominated” and “donor-dominated” and also refer to chemical reactions among trace elements here without detailed explanations. These matters are discussed in detail in Emmett et al. (2003), with corrections and extensions in Emmett et al. (2017a,b). Rather than repeat these discussions, we refer the reader to these references and the extensive references therein. Furthermore, we will not repeatedly restate these references throughout this text.
Having identified the h•-Fe3+ and the h•-Cr3+ as two additional chromophores in natural corundum, we have six major chromophores that are responsible for the multitude of colors in natural corundum: Fe3+, Cr3+, V3+, Fe2+-Ti4+, h•-Fe3+, and h•-Cr3+. Individually, their colors in corundum are as follows:
Pink, Red: Cr3+
Orange: h•-Cr3+
Yellow: Fe3+, h•-Fe3+
Blue: Fe2+-Ti4+, V3+
Green, Purple: V3+
These chromophores can occur singly in a corundum sample (again, see figure 1), though it is common for natural corundum to contain more than one color-causing agent, as all natural corundum generally contains measureable levels of trace elements Mg, Si, Ti, V, Cr, Fe, and Ga that have been incorporated into the lattice. When multiple chromophores are present, the apparent color of the corundum sample results from the sum of the light absorption by each of the chromophores present (Emmett et al., 2017a).
To determine the visual color of a corundum sample from the chemical analyses, we need to know four additional factors: the absorption spectrum of each of the chromophores, the absorption “strengths” of the chromophores, the thickness and crystallographic orientation of the sample, and the color temperature of the illumination.
All of these factors are well known in gemology with the exception of the absorption “strength.” The term for the absorption “strength” in physics is the absorption cross section (see box A on pp. 6–9; we strongly advise reading box A before proceeding). The absorption cross section quantitatively determines the effectiveness of a single ion or ion pair in a particular host material (such as corundum) in absorbing light of a given wavelength. The larger the absorption cross section, the stronger the chromophore. The unit of the absorption cross section is centimeters squared (cm2), which represents an area. One can conceptually visualize this as the size of the absorbing area that a single chromophore particle presents to the light beam. However, note that it is not the actual physical size of an ion or an ion pair.
|
BOX A: THE ABSORPTION CROSS SECTION |
|
Highly pure allochromatic gem materials are colorless. Color in these gems results from the incorporation of a variety of trace elements and other point defects into the lattice. Unlike idiochromatic gems, whose chromophores are part of the fundamental composition of the mineral, the concentration of trace elements incorporated in allochromatic gems can vary widely. Corundum, an allochromatic gem, displays a very wide range of coloration: Nearly every color with the exception of emerald green is available. In what follows, we identify and quantify the six chromophores that produce this wide range of coloration in natural corundum by incorporating either singly or in combination in the corundum lattice. Three of these chromophores are single transition metals (Fe3+, Cr3+, and V3+), one is a pair of metals (Fe2+-Ti4+), and two are comprised of a lattice defect and a transition metal (h•-Cr3+ and h•-Fe3+). As we demonstrate in this article, the effectiveness of each of these chromophores in producing color varies greatly because of their very different electronic structures. For example, nearly 2000 ppma of Fe3+ in a 1 cm thick sample is needed to produce a saturated yellow, while only 1.5 ppma of the h•-Fe3+ will produce a similar depth of color. In gemology we are familiar with the absorption spectra of the majority of these chromophores as single entities in corundum, but we do not have a simple methodology for characterizing their “strength.” The strength determines the concentration of a chromophore (in ppma) required to produce a given level of color saturation. Knowing the strength of the chromophores and the chemical composition determined by SIMS or LA-ICP-MS analysis, we can correctly identify the sources of color in a sample. In physics the strength of an absorber of light or X-rays or neutrons is often referred to as an absorption cross section. We can use this simple concept to establish relative strengths of our chromophores. This paper presents our determination of the absorption cross sections for each of the six chromophores. To define the terms we will use, consider a transparent material of thickness t, as shown in figure A-1. 
Figure A-1. This simple diagram represents a transparent material of thickness t. Light with intensity I0 strikes its surface at left. Some of the light is absorbed as it travels through the material, so the beam has intensity I as it exits at right. The light transmission T of the sample is represented by the ratio of the exiting beam intensity to the entering beam intensity, I/I0.
If an incident beam of light with intensity I0 strikes a sample that absorbs light, the intensity of the light transmitted through it is I, assuming no reflection from the surfaces. Now the transmission, T, of the sample is: T = I/I0 Or, if expressed as a percentage: T (%) = 100I/Io The decadic absorbance, A, of the sample is then: 10–A = I/I0 or A = –Log10(I/I0). All real samples have a portion of the probe beam reflected from their surfaces. Thus a spectrophotometer does not directly measure the true absorbance, A, but rather A*. To determine the true absorbance A, the measured absorbance A* must first be corrected for the loss from multiple reflections between the two polished surfaces of the sample. This is done by summing (T.S. Hemphill, pers. comm., 2011) all the reflections between the two surfaces and using a three-term Sellmeier equation for corundum to determine the sample’s refractive index as a function of wavelength (Tatian, 1984). The index input data to the Sellmeier equation is a combination of all relatively recent data from the suppliers of high-purity synthetic corundum material for the fabrication of high-purity optical elements. The Sellmeier equation fit to these data was performed for us by John Trenholme using TableCurve 2D software. Correcting for this loss we have the true absorbance, A. This correction is important because it is greatest where the absorption is least, and it is just this region of the absorption spectrum that transmits the most intense light and thus contributes most to the color. This reflection correction has been made for all spectra presented in this paper and for all spectra used in deriving these results. The true absorbance, A, for E⊥c of a synthetic sapphire 6.26 mm thick containing 116 ppma V3+ is shown in figure A-2. Note that the vertical axis is unitless because absorbance is simply a ratio. 
Figure A-2. UV/visible/near-infrared (UV-Vis-NIR) absorption spectrum of synthetic sapphire 6.26 mm thick containing 116 ppma V3+, as measured by a spectrophotometer and corrected for internal reflections. Note that the spectrophotometer measures light absorption in absorbance units, which are dimensionless.
The true absorbance A depends in turn on the thickness of the sample, t, the concentration of the chromophore, c, and its absorption cross section, σ. With the true absorbance, A, we can write: I/I0 = T = 10–A = e–αt = e–σct Where I/I0 and T are here associated only with the actual absorption, and T = transmittance A = decadic true absorbance (dimensionless) t = thickness of the sample in cm α = naperian true absorption coefficient in cm–1 c = chromophore concentration in ions/cm3 σ = true absorption cross section in cm2 e = base of the natural logarithm = 2.71828… The reflection-corrected absorption coefficient is simply α = 2.303A/t (In gemology publications, the uncorrected absorbance A* or an absorption coefficient derived from A* is usually presented.) The absorption coefficient of the V3+-doped sapphire sample above is shown in figure A-3. Because A, a unitless ratio, is divided by the dimension t in cm, the units of absorption coefficient are cm–1. The absorption coefficient is independent of the sample thickness, making it useful for comparing samples. 
Figure A-3. UV-Vis-NIR infrared absorption coefficient spectrum of the V3+-doped synthetic sapphire, produced by dividing the spectrum in figure A-2 by sample thickness (0.626 cm) and multiplying by 2.303. Note that the shape of the curve is the same but the y-axis units are cm–1.
The absorption coefficient is, of course, dependent on the concentration of the chromophore. If we want to compare two different chromophores but the samples have different chromophore concentrations, we can divide the absorption coefficient of each chromophore by its concentration in absorbers/cm3 (note that 1 ppma in corundum is a concentration of 1.178 × 10¹⁷ ions/cm3): σ = α/c The result, σ, is termed the absorption cross section. Figure A-4 shows the absorption cross section for the same vanadium-doped sapphire sample. 
Figure A-4. UV-Vis-NIR cross section spectrum of the V3+-doped synthetic sapphire, produced by dividing the spectrum in figure A-3 by the V3+ concentration of the sample. Note that the shape of the curve is the same but the y-axis units are cm2.
With absorption coefficient units of cm–1 and concentration units of ions/cm3, the units of the cross section are cm2/ion, or just cm2, which is an “area” per absorber. One can conceptualize this as the size of the absorbing area that a single chromophore particle presents to the light beam. In other words, imagine that the light beam is an arrow and the absorption cross section is a target; a larger absorption cross section means the target’s area is larger. However, note that it is not the physical size of an ion or an ion pair. The vertical axis in figure A-4 is labeled “absorption cross section × 1019 cm2.” This means that the actual values plotted are from 0 to 2 times 10–19 cm2. It is important to observe that the spectra in figures A-2, A-3, and A-4 are exactly the same. Only the vertical axis values and units are different. Each chromophore has its own absorption cross section that is unique to that particular absorber. A sample with multiple chromophores of different concentrations is best characterized by an absorption coefficient, as we do with all natural samples. This absorption coefficient is the summation of each chromophore’s cross section multiplied by its concentration. For example, a sample containing three chromophores of three different concentrations has an absorption coefficient of α = σ1c1 + σ2c2 + σ3c3 The magnitude of the absorption cross section of the chromophore, and the portion of the visible spectrum that its absorption spectrum covers, taken together provide a rough indication of chromophore strength. The portion of the visible spectrum is estimated by the full width half maximum (FWHM) of the absorption bands in the visible region, divided by 300 nm (the 400–700 nm approximate visible range). Table A-1 compares these values for the E⊥c absorption of the various chromophores in order of increasing absorption cross section. 
Examining the peak absorption cross sections first, note that the values span a factor of about 500. This is a huge difference. Next, examining the portion of the visible spectrum spanned by each chromophore, note that they are within a factor of two and a half with the exception of Fe3+, which is about one-fifth of the average of the other five. Taking into consideration the very low absorption cross section and the very narrow absorption band, the conclusion is that Fe3+ is a very weak chromophore in corundum. Figure 16 presents a visual method of comparing the strength of the six chromophores. The concept of absorption cross section is very useful in understanding the types of optical transitions involved with the individual chromophores. It is also useful in comparing similar chromophores in different environments. Mattson and Rossman (1988) used this concept in comparing the strength of the Fe2+-Ti4+ absorption bands in different minerals. Their absorption cross section was in units of (moles)–1 cm–1, which is simply a different system of units but the same concept. This paper presents the color calculations for a range of concentrations of each of the six chromophores. The color coordinates were calculated using Thermo Scientific’s GRAMS/AI spectroscopy software. To calculate the color coordinates with Grams/AI, the spectral data is input as the single-pass transmission spectrum, T. T is related to the single-chromophore absorption cross section and concentration as follows: T = 10–A = 10–(ctσ/2.303) where the product, ct, is termed the areal density in units of ions/cm2. Under the color circles in this paper, we present the areal density in ppma-cm. This factor is ppma-cm = ct/(1.178 × 1017 ions/cm3) where 1.178 × 10¹⁷ is the number of ions in 1 cubic centimeter of Al2O3 determined by 1 ppma = 5Aρ/M = 1.178 × 10¹⁷ ions/cm3 where A is Avogadro’s number (6.022 × 10²³ molecules/mole), ρ is the density of corundum (taken as 3.99 grams/cm3), and M is the molecular weight of corundum (101.961 grams/mole). Finally, it should be stated that presenting the definitions and units of A, α, σ and is very important, as there are multiple definitions in use in the scientific literature. |
Knowing the absorption cross sections is absolutely critical to determining the origin of color of a given sample. Before detailed chemical analyses were available, it was often assumed that iron was primarily responsible for yellow color in sapphire. However, we now know that there are yellow sapphires with 3000 ppma Fe and yellow sapphires with 200 ppma Fe with similar depth or intensity of color, so clearly these are not colored by the same chromophore.
The objective of this paper is to present the results of our efforts over more than a decade to determine both the E⊥c (O-ray) and E||c (E-ray) (see box B) absorption cross sections for all six chromophores in corundum and to describe how they were determined. We also illustrate the range of colors these chromophores produce. Finally, the digital files at 1.5 nm resolution and 1 nm wavelength intervals from 200 to 1100 nm for each of these chromophores are available to the reader to download for their own use (see https://www.gia.edu/doc/sp20-corundum-chromophores-absorption-cross-section-data.xlsx).
|
BOX B: CRYSTAL OPTICS OF UNIAXIAL MINERALS |
|
Glass is an optically isotropic material, meaning its physical properties such as absorption coefficient spectrum and refractive index are the same in any measured direction within the glass, regardless of the polarization of the measurement beam. Consequently, light traveling in any direction in an isotropic medium behaves the same way. Many crystals are not optically isotropic—they are anisotropic, which means their optical properties vary with direction in the crystal. Corundum crystals are anisotropic, and they are termed optically uniaxial: The optical properties measured in two of the three spatial directions (x and y) are the same, but properties in the z direction are different. We refer to the unique z direction of a uniaxial crystal as the c-axis, also called the optic axis. The other two directions, x and y, are identical and are termed the a-axes (see figure B-1). 
Figure B-1. Corundum is a uniaxial mineral, meaning it has one unique crystallographic axis out of three. This drawing shows the three axes of a uniaxial crystal. The two a-axes are the same while the c-axis is different. Properties of uniaxial crystals are different when measured along the c-axis rather than perpendicular to it. Optical absorption, and thus color, are different when viewed with light propagating along the c-axis rather than along either a-axis.
Light is a combination of electric and magnetic fields that oscillate perpendicular to the direction of the light propagation as shown in figure B-2. 
Figure B-2. Light is a combination of electric and magnetic components that oscillate perpendicular to each other and to the direction of propagation.
Linear polarized light is light whose electric field, E, oscillates in a single direction perpendicular to the direction of propagation, as shown in figure B-3. By convention the direction of E is the polarization direction. 
Figure B-3. A light ray’s electric field direction, which is also called the polarization direction, is perpendicular to its propagation direction. In this diagram, the light ray is propagating toward the right side of the page and its electric field is oscillating up and down in the plane of the page.
A light beam from a thermal source (such as the sun or a heated filament light bulb) comprises light rays whose electrical fields oscillate in all directions perpendicular to the direction of propagation (figure B-4). Such a light beam is termed unpolarized and is necessarily perpendicular to the propagation direction. 
Figure B-4. Unpolarized light is composed of rays whose electrical fields oscillate in all directions perpendicular to the propagation direction (left and center). Polarized light has an electric field E that is constrained to oscillate in a single direction (right).
For optical measurements of uniaxial crystals, there are two unique geometries for a light beam passing through a crystal that yield two different absorption spectra. This property is termed dichroism. It is this dichroism that accounts for the different colors we see looking through crystals in different directions. The first of these geometries is termed the ordinary ray; its polarization direction, E, is perpendicular to the c-axis. This is often designated by E⊥c. Thus a beam of light traveling along the c-axis, polarized in any direction or unpolarized, is E⊥c. A linearly polarized light beam traveling at any direction through the crystal is also an ordinary ray as long as the polarization direction E is perpendicular to the c-axis (E⊥c). It is called ordinary because this holds true for any propagation direction through the crystal. The second unique geometry is where the polarization direction E of the light beam traveling through the crystal is parallel to the c-axis. Visualizing this geometry, it is clearly a much greater restriction in that the light beam must be both linearly polarized and propagating perpendicular to the c-axis. Thus it is termed the extraordinary ray and designated E||c. For any other combinations of propagation and polarization directions, what is measured is some combination of these unique spectra or indices of refraction. When we view a corundum crystal down the c-axis, the color we see is determined by the E⊥c absorption spectrum (figure B-5, top row). This is because all polarization directions of that light beam are E⊥c. 
Figure B-5. Shown at left are the ruby crystal from figure B-1 and two crystallographically oriented ruby wafers with polished parallel surfaces corresponding to the shaded crystal faces. One wafer has the c-axis perpendicular to its surfaces (top), and one contains the c-axis in the plane of the wafer (bottom). A beam of unpolarized light contains rays that are polarized in all directions perpendicular to the direction of propagation. Unpolarized incident light striking the left side of the top wafer passes through unaltered except for absorption by the E⊥c absorption spectrum shown at the right. Thus only E⊥c color is observed, and the dichroscope also shows only E⊥c color (both top and bottom dichroscope views regardless of dichroscope rotation). Unpolarized light striking the bottom wafer is split into two beams polarized at 90º to one another. One beam is polarized parallel to the c-axis (E||c) and one is polarized perpendicular to the c-axis (E⊥c). The different absorptions of these two orthogonal beams are shown to the right. The observed color is equal proportions of E⊥c and E||c. When the wafer is viewed with a dichroscope that is rotated to maximum color difference, the E⊥c and E||c colors are resolved individually (bottom dichroscope view).
When we view a corundum crystal along any a-axis, the situation is more complex. The light incident on the crystal is unpolarized. When entering the crystal, it is split into two colinear beams—one E⊥c and one E||c. Each of these sees the corresponding absorption spectrum, and thus when the beam emerges we see a color that is the average of the colors produced by the two absorption spectra, E⊥c and E||c (figure B-5, bottom row). A calcite dichroscope is simply an instrument that splits a beam into two rays whose polarization directions are at 90° to each other. If we observe through a dichroscope a beam of light that has propagated along an a-axis of the crystal and rotate the dichroscope so that the color difference between the two sides is at a maximum, we have found the orientation where its two polarization directions match the two directions of the crystal. We are observing both a pure E⊥c color and pure E||c color (figure B-5 bottom, dichroscope view). If we view the crystal in this orientation without the dichroscope, we see a single color that is equal proportions of E⊥c and E||c color, which we call E⊥c + E||c (figure B-2 bottom, observed color). If instead we view the crystal with the dichroscope along the c-axis, we observe the same color on each side, and the color stays the same as we rotate the dichroscope. In this case we are observing pure E⊥c color (figure B-2 top, dichroscope view). In this paper we present absorption cross section spectra for E⊥c and E||c, and color circles for E⊥c, E||c, and E⊥c + E||c. Crystal optics is a venerable field of study, and there are many different designations in use for E⊥c and E||c. We have chosen to use these two designations for simplicity, because they say exactly what they are and we don’t have to remember what they mean. The same designation issues arise with the two indices of refraction. In table B-1 we have listed the more commonly used designations for both rays and indices of refraction. 
|
Determining the absorption cross sections relies upon accurate determination of the chromophore concentrations in the samples. These determinations were made possible by secondary ion mass spectrometry (SIMS) analysis at the California Institute of Technology (Caltech). SIMS was calibrated with single-element ion implants in sapphire standards, eliminating any matrix effects. The calibration of SIMS, a major effort in itself, is described in detail in Stone-Sundberg et al. (2017).
The chromophore concentrations in this paper have largely been determined by SIMS analyses from synthetic corundum crystals grown doped only with a single chromophore. This is true of Cr3+, V3+, h•-Fe3+, and h•-Cr3+. The Fe3+ chromophore and Fe2+-Ti4+ chromophore data were determined using both natural and single-doped synthetic crystals grown by the Czochralski method (figure 2). Unlike many other minerals, corundum contains only a single small cation site. Additionally, the energy required to force a cation into an interstitial site is very high (Matsunaga et al., 2004). These facts, together with the fact that the crystal must be rigorously electrically neutral, very strongly constrain what trace elements and what valence states of these trace elements can exist in corundum. For example, iron in corundum by itself will be Fe3+ because the crystal must be electrically neutral. That is, the valence of Fe must equal the valence of Al3+. Unless there is a tetravalent donor such as Si4+ or Ti4+ or an H+ interstitial (El-Aiat and Kröger, 1982; Norby, 1989; Beran and Rossman, 2006; Li and Robertson, 2014) to charge compensate it, Fe2+ will not exist. If there is such a donor, the Fe2+-Si4+ and Fe2+-Ti4+ pairs will form. Thus the concentration of Fe2+ is limited by the concentrations of H+, Si4+, and Ti4+. This is why we thoroughly analyze even the singly doped synthetic crystals.

If a very high-purity synthetic crystal doped only with Fe3+ is processed at high temperature in a highly reducing atmosphere, oxygen vacancies with a charge of +2 with regard to the lattice may form and thus charge compensate two Fe2+ ions. It is for this reason that we process at high temperature in a pure oxygen atmosphere many of the synthetic crystals we have grown. This eliminates any oxygen vacancies, assuring a valence of +3. Additional possibilities for alternate valences of other ions, or interferences from different pair absorption spectra, have been addressed using the variety of synthetic crystals indicated in Appendix 1 at https://www.gia.edu/doc/sp20-corundum-chromophores-appendix1.xlsx.
Such considerations, plus the processing of synthetic crystals in a high-temperature oxygen atmosphere and thorough analyses for other trace elements, assure that the chromophore concentrations equal the SIMS-determined concentrations.
In the following sections, we will first describe the Cr3+ chromophore and how its cross section was determined. Much of this same detail will apply for the other five chromophores and thus will not be repeated. We present the origin of the samples (again, see figure 2), their crystallographic orientation, the absorption cross sections determined for both E⊥c and E||c, color circle arrays for different areal densities of the chromophore, viewing directions, and illumination sources. Detailed information on these samples can be found in Appendix 1.
THE Cr3+ CHROMOPHORE
Cr3+ is the trace element primarily responsible for coloring ruby red and sapphire pink (McClure, 1962) and in doing so creates some of the most beautiful gems in the world. This coloration results from Cr3+ ions replacing some of the Al3+ ions in the corundum lattice.
High-purity synthetic sapphire doped with Cr3+ has been available since the invention of the laser in 1960. The very first laser employed synthetic ruby as the active element (Maiman et al., 1961). Interest in ruby lasers for many applications drove the development of large, exceedingly high-optical-quality and high-purity synthetic ruby crystals. Our samples were from excess material salvaged from several different laser-quality single-crystal ingots (boules) grown by St. Gobain Crystals and Detectors in Washougal, Washington.
Wafer samples cut from these boules were crystallographically oriented to an accuracy of approximately 1.5° using an optical instrument (Thomas et al., 2014) with the c-axis in the plane of the wafer. The absorption spectra were measured with a resolution of 1.5 nm using a Hitachi Model 2910 spectrophotometer modified by Tim Thomas at GIA to enable rotation of the polarization plane of the probe beam, thus allowing the separate recording of both E⊥c and E||c spectra. The spectra were corrected for the multiple reflections between the two polished surfaces of the wafer by summing all the reflections (see box A). Wafers from four different boules were fabricated and measured, and the one with the lowest absorption at approximately 226 nm was chosen as the most pure. 226 nm is between the two highest-energy absorption bands of Cr3+ yet below the first Cr3+ charge transfer band. However, at this wavelength the charge transfer bands of Fe, Ti, and other metals are very strong (Tippins, 1970), and thus minimal absorption at this wavelength is a good relative indicator of crystal purity.
Quantitative data on this sample with the minimum 226 nm absorption (and all of the other samples characterized in this study) were obtained using a Cameca IMS 7f-GEO SIMS instrument. SIMS is a highly precise analytical technique that can detect all elemental masses to the sub-ppma level. To achieve accuracy, however, relative sensitivity factors (RSF) need to be developed to correctly convert the secondary ion signal for each trace element in the matrix of interest into concentration. This is best done by creating ion implant standards. For each trace element we wish to quantify, a chosen isotope of this trace element is implanted in a high-purity wafer of the intended matrix. Our developed RSF values were based upon multiple measurements validating the “dose” of each of these ion implants, and upon multiple SIMS depth profiles of these same implants (Stone-Sundberg et al., 2017). The calculated RSF values account for all of the identified and quantifiable sources of uncertainty; for the final SIMS-generated concentration values for all of the subsequently measured samples, we report a total uncertainty that is equal to the square root of the sum of the squares of the error associated with each source. In total, there are four separately quantified sources of error: the ion implant standard dose measurement, determination of the peak depths for the ion implants, differences between the multiple depth profiles for each ion implant, and the set of measurements of the trace element of interest in the sample. For the Cr3+ chromophore, the concentration and total combined error is 134 ppma ± 7.6%. The determined detection limit for Cr3+ in corundum to the 95% confidence level using our conditions was 0.002 ppma (2 parts per billion atomic, ppba).

The absorption cross sections thus determined over the 200–1100 nm range are shown in figure 3. The data range includes the visible region of the electromagnetic spectrum, which extends from 400 nm (violet) to 700 nm (red). The vertical axis is labeled “absorption cross section × 1019 cm2.” This means that the actual values plotted are from 0 to 4 × 10–19 cm2; we will use the same labeling convention for subsequent cross section spectra presented in this article. Figure 3 shows the absolute absorption cross section spectra for both the E⊥c (ordinary) and E||c (extraordinary) rays for Cr3+ in the high-purity synthetic ruby. These two spectra fully characterize, at 1.5 nm resolution, the absorption characteristics of Cr3+ in corundum over the range from 200 to 1100 nm. Whether in a high-purity synthetic crystal containing only Cr3+, a natural ruby containing Cr3+ and iron, or a purple sapphire containing Fe2+-Ti4+ pairs and Cr3+, the absorption cross section of Cr3+ is the same. The broad bands near 560 nm are termed the U bands, while the two near 400 nm are designated the Y bands. At a wavelength of 694 nm, there is a weak, narrow absorption feature. This is known as the R-line. In actuality, the R-line is two weak lines, R1 and R2, which are separated by 1.4 nm. Since our instrumental resolution is 1.5 nm, these two lines appear as a single weak feature. The weak lines near 660 nm most clearly observable in the E⊥c spectrum are called the S-lines, while the weak lines in both spectra near 470 nm are referred to as the B-lines (Powell, 1998). Shown along with the spectra is an image of a faceted sapphire we selected as representative of a stone that is very close to being colored by only the Cr3+ chromophore. In the following sections, we show a representative faceted stone alongside the spectra for each chromophore, selected as representative of the color that would be produced by that chromophore in isolation.
Note that the E⊥c peak cross section of 1.62 × 10⁻¹⁹ cm2 ± 7.6% we determined for the 560 nm U band represents a moderately strong absorber, and thus Cr3+ is a moderately strong chromophore. It is the magnitude of this cross section in the visible region of the spectrum, and to a lesser extent the width and position of the bands, that determines the “strength” of the chromophore (see box A). The position and width of the absorption bands determine the color. Approximately speaking, the larger the cross section and the wider the bands in the visible region, the more color produced.
It is interesting to note that apparently the first determination of Cr3+ cross section was published in 1961 in the seminal paper reporting the achievement of the first laser—the ruby laser (Maiman et al., 1961). His value of the peak cross section for the E⊥c U band was approximately 1.8 × 10⁻¹⁹ cm2. The small difference between his value and ours probably reflects the improved analytical instrumentation for determining Cr3+ concentration available to us today. Subsequently, the absorption and emission spectrum of ruby has been extensively studied by many researchers; see, for example, Powell (1966, 1998) and Henderson and Bartram (2000).
While the absorption cross section provides the definitive characterization of a chromophore, it is not easy to guess the color from simply examining the spectra. It is, however, straightforward to calculate the color from these spectra. The color coordinates (Berns, 2000) are usually calculated from the sample’s transmission spectrum and the characteristics of the light source. Calculation of the color coordinates for a given color temperature was performed via Thermo Scientific’s GRAMS/AI spectroscopy software, a general-purpose spectra manipulation code that includes color coordinate calculations. There are many color coordinate systems, and we chose the CIE 1976 L*a*b* system for its approximately uniform color space. We used color temperatures of 6500 K (D65 illuminant) and 2856 K (A illuminant) in order to maximize the color temperature difference and the color difference, thereby maximizing the visual effects of different light sources for the reader. Having determined the color coordinates for a particular sample thickness and chromophore concentration, a color circle is then created by specifying the color coordinates to the drawing program. We have used Photoshop, EasyDraw, and other graphics programs to produce the color circles. Visualizing the color from the absorption spectrum of the sample has broad application in gemology. We first used this technique to determine the amount of diffused beryllium that would cause a visible reduction in the depth of color of a dark blue sapphire.

Figure 4 (left) shows an array of color circles corresponding to a range of Cr3+ areal densities. Presented are the E⊥c color, the E||c color, and a color representing equal proportions of E⊥c and E||c (we will call this E⊥c + E||c), as viewed with illuminant D65 (daylight equivalent). The E⊥c colors are seen looking through a stone along the c-axis. The E⊥c + E||c colors are what is seen looking through a stone perpendicular to the c-axis. With a properly aligned dichroscope viewing in this same direction, we see the pure E⊥c and E||c colors separated (see box B for a basic introduction to uniaxial crystal optics). L*a*b* color coordinates for these color circles and all subsequent color circles presented in this article are available in Appendix 2 at https://www.gia.edu/doc/sp20-corundum-chromophores-appendix2.xlsx.
Along the horizontal axis of the color circle array is the areal density of the Cr3+ in units of ppma-cm. Areal density is the product of the chromophore concentration in ions per cm3, times the path length through the stone in cm. The concentration of chromophore ions is 1.178 × 10¹⁷ ions/cm3 times the concentration in ppma (see box A). For a 1 cm thick sample, the numbers under the color circles are the Cr3+ concentration in ppma. For a 2 cm thick sample showing the same color, the concentration is one half the numerical ppma-cm value. For a 1/2 cm thick stone, the concentration is twice the ppma-cm value. Thus the numbers under the color circles can be viewed as presenting a stone of fixed concentration of increasing thickness, or of fixed thickness with increasing Cr3+ concentration, or any combination of the two.
The color we perceive also changes with the type of light source. Figure 4 (right) shows the three sets of color circles—E⊥c, E||c, and E⊥c + E||c—but also for each of two illuminants—D65 (daylight) and A (tungsten bulb). We have chosen these two light sources to maximize the observable color difference. Thus we can see a substantial change in the perceived color with a change in light source. While this color change is significant, ruby is not described as a color-change gem. A color-change gem is usually thought of as one where the hue changes significantly (more than one adjacent hue position), such as blue to red or green to red.
THE V3+ CHROMOPHORE
Vanadium (V3+) commonly occurs in trace element analyses of natural corundum, particularly ruby. Generally, the vanadium concentration is not high enough (<20 ppma) to have a significant impact on the color. However, recently published analyses of corundum from the Mogok Stone Tract in Myanmar (Harlow and Bender, 2013; Zaw et al., 2015) have shown concentrations as high as 2000 ppma and reported sapphire colors of “slate” (grayish blue to gray-blue) to purple as well as color-change in some cases. For concentrations at or considerably less than this extreme, vanadium will indeed impact the color of ruby and sapphire. V3+ spectra in corundum have been studied for decades (Pryce and Runciman, 1958; McClure, 1962; MacFarlane, 1964).
Several decades ago, the former Union Carbide Corporation crystal growth facility in Washougal, Washington, grew a large vanadium-doped sapphire crystal by the Czochralski technique for research purposes. A slice of this unique crystal was provided for our research. SIMS analysis showed a vanadium concentration of 116 ppma with a total combined uncertainty of ± 8.9%. The detection limit determined for V3+ in corundum at the 95% confidence level was 0.016 ppma. Wafers were fabricated from this boule with the c-axis in the plane of the wafer so that both E⊥c and E||c absorption spectra could be recorded. Since vanadium can exist in multiple valences, the wafers were heated at 1750°C in oxygen for 10 hours to assure that all of the vanadium was in the 3+ valence state, as previously discussed. Previous multiple heat treatment experiments on this material had shown these conditions were effective.

Figure 5 shows the absorption cross section for both the E⊥c and E||c for V3+ in sapphire. It is interesting to note that the V3+ spectra in the visible range show two absorption bands with similar positions and widths to those of Cr3+. However, their relative magnitudes are very different, leading to very different colors. Vanadium is a weak chromophore in corundum since its absorption band, centered at 580 nm, is much weaker than that of Cr3+ at 560 nm. We determined that vanadium’s E⊥c peak cross section for the 580 nm band is 1.0 × 10⁻¹⁹ cm2 ± 8.9%.

Figure 6 (left) shows the three sets of color circles for E⊥c, E||c, and E⊥c + E||c under D65 illumination for V3+. There is a significant hue difference between the E⊥c color, which is a grayish blue, and the E||c color, which is distinctly green at the lower concentrations. Nearly the same amount of color difference also exists between the E⊥c color and the E⊥c + E||c color. The color of a faceted stone can therefore be quite different depending on the orientation of the cut. While the hue differences between the E⊥c color and E||c color for Cr3+ illustrated in the previous section are certainly noticeable, the hue difference for V3+ illustrated in this section is very substantial.
Figure 6 (right) presents the E⊥c, E||c, and E⊥c + E||c data for illuminants A and D65. While all three orientations show a noticeable hue difference for the two illuminants, the E||c color and E⊥c + E||c color show a very strong hue difference, which would certainly qualify as a color-change gem when properly cut. The hue difference in these orientations is produced because the D65 light source is richer in blue to green wavelengths than the A light source. Consequently, the stone transmits more green light under D65 illumination, giving the stone a greener hue. The A light source is richer in orange to red wavelengths, so the stone transmits proportionally more of these wavelengths, giving the stone a purplish color. Given the hue differences, it would be interesting to cut some faceted stones from this synthetic crystal, and to search for unusually colored natural high-V pieces from Myanmar.
Fe3+: MULTIPLE CHROMOPHORES
Iron is nearly ubiquitous in gem corundum, present over a very wide range of concentrations from less than a few ppma to nearly 5000 ppma. While this makes it difficult to characterize, the fact that Fe3+ can exist as single ions replacing aluminum, Fe3+ ion pairs, and perhaps larger Fe3+ clusters pose yet greater problems. Because the Fe3+ spectrum is composed of all of these species whose individual concentrations depend in a nonlinear way upon the total iron concentration in the sample, the spectrum’s dependence on concentration can be quite complex (Ferguson and Fielding, 1971 and 1972; Krebs and Maisch, 1971). In addition to these problems, the Fe3+ chromophore is the weakest chromophore in natural corundum. Its peak absorption cross section at 450 nm in the visible region does not exceed 2.5 × 10⁻²⁰ cm2 ± 8.0%, and it is quite narrow. Thus a variety of samples with a wide range of total Fe3+ concentrations is required to characterize the spectra.
Directly growing synthetic sapphire at its melt temperature (~2050°C) doped with iron is limited by the fact that iron and its oxides all have very high vapor pressures at this temperature and thus vaporize from the melt. This imposes a practical limit of a few hundred ppma of iron for crystals grown this way. Flux growth at temperatures of 900–1300°C would seem to be an attractive alternative, and it has been tried (Ferguson and Fielding, 1972), yet the spectroscopy applied still employed only natural crystals. Another problem is that the fraction of pairs and larger clusters would certainly be dependent on the thermal history of the crystal, which would not necessarily mimic nature. For these reasons we too are constrained to using natural crystals for part of our characterization.

Figure 7 shows the absorption cross section spectra of a natural corundum sample with a very high iron concentration determined with SIMS of 4730 ppma, with a total combined uncertainty of 8.0%, the highest concentration among our samples. The detection limit to the 95% confidence level for Fe was 0.003 ppma. The highest concentration was chosen as the cross sections will most easily be measured. At such a high iron concentration, one can easily observe and compare the weak broad features of both the E⊥c and E||c absorptions. This sample is from the Subera deposit in Queensland, Australia. Yellow sapphires of similar iron concentrations are found in the Garba Tula deposit in Kenya, the Chanthaburi area of Thailand, and other alkali basalt-hosted deposits, but they are not common. Usually such sapphires also include a few ppma of Fe2+-Ti4+ pairs, which shifts the yellow to a greenish yellow, or they contain a few tenths of a ppma of h•-Fe3+ pairs, which adds some golden yellow coloration.
The spectra of Fe3+ containing corundum is quite complex. In figure 7, the narrow peaks at 377 and 450 nm are attributed to Fe3+-Fe3+ pairs, as is the weak but broad band at 540 nm. The narrow peak at 388 nm is attributed to single Fe3+ ions. The weak but broad bands at 700, 1050, and 1085 nm are only really quantifiable at high Fe3+ concentrations. The lack of temperature dependence in the absorption coefficient of these bands implies that they arise from single Fe3+ ions (Ferguson and Fielding, 1972). There is also a broad band at 330 nm that is identified as an Fe3+-Fe3+ pair band, but it is not visible in this spectrum. It can be seen in two of the spectra presented in figure 8. The relatively narrow spectral features at 377, 388, and 450 nm are observable in the spectra of most corundum samples with a Fe concentration of 150 ppma or higher. This is because the absorbance, absorption coefficient, and absorption cross section of different species are additive, and thus a weak narrow feature can be easily seen on top of a much stronger wide band.

The ratio of the peaks of the 388 nm band to the 377 nm band changes dramatically with concentration. This is because the 388 peak is primarily a single Fe3+ ion, while the 377 nm peak is a pair of Fe3+ ions. Our earlier studies of about 40 different natural samples with widely varying Fe3+ concentrations indicate that the peak absorption coefficient at 450 nm, which is a pair of ions, increases very approximately with C1.5, where C is the total Fe3+ concentration. This implies that the absorption cross section of the 450 nm band increases approximately with the square root of C. If there was not a concentration dependence of this cross section, there would be a single curve for E⊥c in figure 8, just as we see for Cr3+ and V3+. This dependence of the cross section on concentration is currently under study by the authors with over 100 natural samples analyzed by laser ablation–inductively coupled plasma–mass spectrometry (LA-ICP-MS).
Because the absorption cross section is not independent of the iron concentration, our usual presentation of color circles as a function of the areal density, ppma-cm, is not a valid characterization. Thus we present some E⊥c color circles at a few fixed concentrations and as a function of the path length through the sample. Figure 9 (left) compares the E⊥c color circles for D65 illumination. Figure 9 (right) also shows the same color circles but under illuminant A. Fe3+ exists in natural gem corundum over a much wider concentration range than any other chromophore. At a few thousand ppma, Fe does indeed cause strongly colored yellow sapphire. However, it is such a weak chromophore that only at these higher concentrations does it contribute much color to a gem. Presenting a more detailed discussion of the color contributed by iron will require a much better physical model of iron in the corundum crystal, as the pair or larger cluster concentrations will also be dependent on the thermal histories of the samples. We encourage our colleagues to study this matter.

THE Fe2+-Ti4+ CHROMOPHORE
Fe2+-Ti4+ pairs are the primary chromophore of blue sapphire (Townsend, 1968; Mattson and Rossman, 1988; Moon and Phillips, 1994). The defect chemistry that creates this pair is interesting. Titanium in corundum is a donor, and iron in corundum can be an acceptor. They electrostatically attract each other and locate on adjacent Al3+ sites in the crystal, creating a donor-acceptor pair. Neither Fe2+ nor Ti4+ alone has absorption features in the visible region. Ti4+ is a closed-shell electron configuration, and Fe2+ is expected to absorb only in the near infrared, but that absorption has not yet been observed. Yet when these two ions are located on neighboring aluminum sites, strong absorption bands arise across the visible and near infrared region of the spectrum. For E⊥c the band peaks at 580 nm, while for E||c the peak is at 700 nm. While the theory of the energy levels of a single transition metal ion in a crystal is quite well developed, the theory for ion pairs or clusters in a crystal is not.
The most commonly proposed explanation for the absorption spectra of blue sapphires is that of intervalence charge transfer (IVCT) between the two cations as follows:

where hν is Planck’s constant, h, times the optical frequency, ν. This a common way to indicate that a photon has been absorbed to enable the chemical reaction.
It would seem straightforward to determine the absorption cross sections of this transition by just analyzing a fairly uniform piece of natural blue sapphire and measuring the Fe and Ti concentrations to determine the concentration of Fe2+-Ti4+ pairs. However, as discussed elsewhere (Emmett et al., 2017b), it is difficult to accurately determine the amount of titanium available, [Ti]available, to pair with Fe2+ creating the blue color. Since the Si donor state lies above the Ti donor state in the corundum band gap, it will preferentially pair with acceptors such as Mg and Ni. Thus the Ti available to pair with Fe can be expressed as:
[Ti]available = [Ti] + [Si – Mg – Ni] for [Si – Mg – Ni] < 0
[Ti]available = [Ti] for [Si – Mg – Ni] ≥ 0
Note that the square brackets around ions denote atomic concentrations. The standard deviation (SD) of [Ti]available is the square root of the sum of the squares of SDs of Ti, Mg, Ni, and Si. Thus the standard deviation of [Ti]available can be very large, often exceeding the value itself, making accurate estimates of [Ti]available difficult.
It would also seem straightforward to just grow a synthetic crystal doped only with Fe and Ti, measure the concentrations, and calculate the Fe2+-Ti4+ pair concentration. Such crystals were grown by Milan Kokta at the Union Carbide Corporation crystal growth factory in the 1980s for synthetic gem material. However, two problems arose with the use of synthetic crystals. First, at the Czochralski growth temperature of sapphire (~2050°C), the Fe2+-Ti4+ pairs are largely dissociated. They only partially re-form as the stone cools over a day or two from growth temperature. Thus there are fewer pairs than the concentrations of [Fe] and [Ti] would imply, and we could not determine what fraction of the possible pairs were indeed present.
In nature the growth temperature is much lower, so there is less dissociation, and the cooldown is presumably extremely slow, so the pairs should more fully form. If so, the concentration of pairs should be determined by the ion concentrations.
To re-form the pairs, we heated the synthetic crystals in air for a few thousand hours. The temperature of 750°C was chosen to be low enough that many of the pairs would re-form, yet high enough that the diffusion coefficients of the ions were still large enough that clustering would take place at some finite rate. The absorption coefficients were remeasured at intervals of 50 and 100 hours to track the increase. This process was carried on until no further increase with time was noted, and thus equilibrium was reached. For our samples with the highest Ti concentration, equilibrium was reached in 1500 hours, with the absorption coefficient at 580 nm being 2–2.5 times higher than before heat treatment. It is likely that some additional pairs would form if the temperature were lowered further and the time greatly increased. Just what percentage we have achieved of the low-temperature equilibrium pair concentration is difficult to estimate.
Another problem with the growth of synthetic crystals doped with Fe2+-Ti4+ is determining what fraction of iron in the crystal is actually in solution rather than present as microscopic iron particles. Under the oxygen partial pressure of Czochralski growth from an iridium crucible, all the iron present may not be trivalent and thus soluble in the melt. We have observed microscopic iron crystals in some synthetic Fe-Ti doped crystals. Presently we have no reliable way to determine what portion of the iron in the crystal is actually in solution as Fe3+. The synthetic crystals did, however, give us very high-quality E⊥c and E||c spectra without the interference from high concentrations of iron and other trace elements (Si, Cr, V, and Ni).
To achieve reasonably good approximation of the cross sections of the Fe2+-Ti4+ pair, we have chosen a combination of both synthetic crystals and natural crystals. After examining a wide variety of natural crystals, we have chosen Yogo sapphires for their rather extreme optical and chemical uniformity, which far exceeds all other natural crystals we have studied, and for the fact that there is no 880 nm absorption band in this material. Since the synthetic crystals have no interference to the shape of the spectrum from other chromophores, they have been used to accurately determine the shape of the Fe2+-Ti4+ pair absorption spectra.
We have carefully measured the trace element composition of 14 Yogo sapphires by SIMS at Caltech. The SIMS technique gives the smallest SDs of our current measurement techniques, and only SIMS can quantify Si. These analyses provided accurate determinations of Fe, Ti, Mg, Si, Ni, Cr, and V. The detection limits for Cr, V, and Fe were previously given, and the determined detection limits for Ti, Mg, Si, and Ni were 0.039, 0.001, 0.552, and 0.030 ppma, respectively. The higher detection limit for Si is partially due to its larger RSF value, but mainly due to the difficulty of removing all traces of Si from the chamber and mass spectrometer. Because [Si – Mg – Ni] is always negative for Yogo sapphires due to their high Mg concentrations (~100 ppma), the [Ti]available as noted above was calculated as
[Ti]available = [Ti] + [Si] – [Mg] – [Ni]
The absorption spectra of the 14 Yogo samples were measured and the contributions from Cr3+ and V3+ subtracted from each using the absorption cross sections of Cr3+ and V3+ previously determined. The shape of the remaining Fe2+-Ti4+ absorption band closely matched the shape determined from the synthetic crystals. The resulting absorption cross sections are shown in figure 10. The band shapes are from the synthetic crystals, and the band peak values are determined from the averages of the 14 Yogo crystals studied. The peak E⊥c absorption cross section at 580 nm thus determined is 1.94 × 10⁻¹⁸ cm2 ± 25%.

These spectra have been terminated at 330 nm in the UV. This was necessary because the first O → Fe3+ charge transfer band (Tippins, 1970) peaks at 259 nm. We have determined the peak cross section for this transition as 1.66 × 10⁻¹⁷ cm2, which is extremely large. The sloping band edge on the long-wavelength side of this band mixes with the short-wavelength side of the Fe2+-Ti4+ pair and rapidly exceeds the dynamic range of the spectrophotometer. Thus we terminated the Fe2+-Ti4+ spectra before the charge transfer absorption became significant.
In the course of our study of the Fe2+-Ti4+ band in many natural sapphires from many locations, we have found some whose Fe2+-Ti4+ cross sections appear much larger (by factors of two or three) than those determined here using synthetic and Yogo sapphires. Nearly all of these non-Yogo samples contain very high iron content and substantial OH, as revealed by FTIR measurements. We do not know if this is a correct determination and thus represents an enhanced Fe2+-Ti4+ cross section due to the presence of iron pairs or clusters with the Ti4+, or whether it results from the fact that our chemical analyses only measure a very thin layer on the stone’s surface rather than the bulk composition. Many of these samples demonstrating anomalous Fe2+-Ti4+ cross sections are strongly color zoned, meaning that the concentration of Fe2+-Ti4+ pairs along the optical path can vary substantially, something our surface-level measurements would not be able to capture. Additional research on this topic is definitely needed.
It is interesting to note that in the synthetic and Yogo crystals, the peak of the E⊥c cross section at 580 nm of 1.94 × 10⁻¹⁸ cm2 ± 25% is about 12 times larger than that of Cr3+ at 560 nm. The large cross section and the width of the band in the visible region make the Fe2+-Ti4+ pair a strong chromophore. Less than one-tenth the amount of it relative to Cr3+ is needed to produce strong coloration.

Figure 11 presents the color circles calculated from the cross section determinations. As in the discussion of the Cr3+ chromophore, we have used the areal density in ppma-cm to present the data. Figure 11 (left) shows the three sets of color circles for E⊥c, E||c, and E⊥c + E||c under illuminant D65. As we saw with the Cr3+ chromophore, the E⊥c and E||c colors are quite distinct. This is because the E⊥c absorption spectrum is more effective at blocking the blue-green and green portions of the spectrum than the E||c spectrum, thus transmitting a purer blue color.
Figure 11 (right) compares the color observed under illuminants A and D65. While the color differences shown between illuminants D65 (daylight) and A (tungsten lamp) are not dramatic, the color circles for the D65 illuminant exhibit a brighter blue resulting from the greater portion of blue light in the D65 spectrum.
CHROMOPHORES INVOLVING TRAPPED HOLES
When the concentration of magnesium and nickel exceeds the sum of the concentrations of silicon, titanium, and hydrogen, the corundum sample is acceptor dominated. If this occurs in a relatively oxidizing natural environment, or if the stone is heat treated in air or oxygen, the excess acceptors will be charge compensated by trapped holes.
h• = [acceptors] – [donors] = [Mg + Ni] – [Si + Ti + H]
If the sample also contains iron but not chromium, the h•-Fe3+ pair can form, producing a strong yellow coloration. If instead the sample contains only chromium, the h•-Cr3+ pair can form, producing a strong orange coloration. If the sample contains both Fe3+ and Cr3+, the hole will preferentially pair with the Cr3+. The association of the hole with Fe3+ or Cr3+ is unusual, as both are isoelectronic with Al3+ in the corundum lattice. However, isoelectronic dopants that trap electrons, holes, or excitons are well known in wide gap semiconductors (Pajot and Clerjaud, 2013). Isoelectronic traps in wide-band-gap oxides have received some study as exciton traps that can greatly increase the fluorescence from UV excitation (Shtepliuk et al., 2011; Zorenko et al., 2011).
To study the chromophores composed of trapped holes paired with either Fe3+ or Cr3+, two crystals were grown by the Czochralski technique at St. Gobain Crystals and Detectors; one was doped only with iron and magnesium, while the other was doped only with chromium and magnesium. As grown, the crystal containing iron and magnesium had a bright orangy yellow color, and the crystal containing chromium and magnesium had a bright orange color. The concentrations with total combined uncertainty for the h•-Fe3+ crystal were Fe = 180 ± 7.7% and Mg = 2.13 ± 9.2%. If quantifiable concentrations of Si and Ti were present in this crystal, the total available Mg and its associated total combined error would have to be adjusted to account for these ions. However, both Si and Ti were below the quantification limits, eliminating the need to account for these trace elements. For the h•-Cr3+ crystal, the Cr concentration with total combined uncertainty was 12.6 ± 7.7%, and the Mg concentration with total combined uncertainty was 0.813 ± 9.8% Similarly, the crystal purity was high enough that we did not need to account for Ti and Si that would scavenge available Mg. Following growth, the crystals were annealed in oxygen at 1750°C for 10 hours to assure that all magnesium was charge compensated by holes. Previous experiments under a variety of conditions indicated that this annealing condition maximizes the hole concentration. The resulting crystals were a deeper yellow, almost golden color (iron and magnesium), and a deeper orange color (chromium and magnesium).
The cross sections presented for these two chromophores are determined from the absorption spectra recorded on these double-doped samples. Since the h•-Fe3+ sample also contains the Fe3+ chromophore by itself, that spectrum was subtracted before calculating the h•-Fe3+ cross section. Since the Fe3+ chromophore is so weak, it only modifies the color produced by the h•-Fe3+ chromophore at high Fe3+ concentrations. Similarly, since the h•-Cr3+ sample also contains the Cr3+ chromophore by itself, that spectrum was subtracted before calculating the h•-Cr3+ cross section. However, Cr3+ is a moderately strong chromophore, and thus any gemstone containing the h•-Cr3+ chromophore will also exhibit a pink to red component from Cr3+ alone. It is these two chromophores together that create the magnificent pinkish orange padparadscha sapphire.

The spectrum in figure 12 shows the absorption cross sections for E⊥c and E||c of a sample cut from the crystal containing iron and magnesium. Note the extremely large cross section of the h•-Fe3+ chromophore, 1.3 × 10⁻¹⁷ cm2 ± 12.0%, which is about 6.8 times that measured for the Fe2+-Ti4+ pair or about 80 times larger than that of Cr3+. It is thus a very strong chromophore in corundum. The h•-Fe3+ and the h•-Cr3+ are the strongest chromophores in the visible region of the spectrum for corundum. As discussed in the section on the Fe2+-Ti4+ pair chromophore, the spectrum of the h•-Fe3+ chromophore has been terminated at 330 nm to avoid interference by the O → Fe3+ charge transfer band. This is not necessary for the h•-Cr3+ spectra, as the first O → Cr3+ band is well below 200 nm (Tippins, 1970).

Figure 13 presents the color circles for the h•-Fe3+ pairs. The E⊥c and E||c spectra are quite similar. Thus the E⊥c, E||c, and E⊥c + E||c color circles under D65 illumination shown in figure 13 (left) are also similar, unlike some of the other chromophores we have studied. What is interesting to note here is the extremely small amount of h•-Fe3+ pairs required to create a strong color. Only a few ppma are necessary in a 1 cm thick sample to produce strong coloration, whereas nearly 3000 ppma of Fe3+ alone would be required to produce similar coloration (see figure 9). Examining the color circles in figure 13 (right) for the two different illuminants, D65 and A, we see that the color differences for the two illuminants are greater than the E⊥c and E||c color differences.
The h•-Fe3+ chromophore is the primary cause of color for yellow sapphires from Sri Lanka and other sources where the iron content is not extremely high. It also occasionally occurs in some high-iron sapphires from Thailand, where stones with the combination of the two chromophores are referred to as “Mekong Whisky” color sapphires.

Figure 14 shows the E⊥c and E||c absorption cross sections of the h•-Cr3+ pair system. Again, note the extremely large cross sections (1.3 × 10⁻¹⁷ cm2 ± 12.5%), which are similar in magnitude to those of the h•-Fe3+ pair. These two systems are by far the strongest chromophores in corundum.

Figure 15 illustrates the color circles for h•-Cr3+ pairs. At left are shown the color circles for E⊥c, E||c, and E⊥c + E||c under D65 illumination. From the color circles we can see that this chromophore exhibits little dichroism, as the E⊥c and E||c circles are very similar in appearance. This results from the fact that strong absorption is present below 560 nm for both E⊥c and E||c. Figure 15 (right) shows the color circles for both D65 and A illuminants. There is little chromatic difference resulting from the two illuminants. The color circles for illuminant A, which contains proportionally more yellow and red light, may be slightly brighter than their D65 counterparts.
The cross sections and color circles presented for the h•-Cr3+ chromophore are for the chromophore itself and do not include a contribution from the Cr3+. Since Cr3+ is a moderately strong chromophore, very little is required to shift these hues toward a more pure orange. Concentrations of only 20–40 ppma Cr3+ are sufficient to cause a noticeable color shift.
COMPARING THE CHROMOPHORES
Looking closely at the absorption cross section spectra for the various chromophores, one can observe a wide range of values in the visible region of the spectrum of a factor of about 500. However, the variability of the “strength” of the chromophore is even greater because the width (full width half maximum, FWHM) of the cross section features in the visible range varies from ~25 nm for Fe3+ to ~250 nm for the Fe2+-Ti4+ pair (see box A). Figure 16 shows the approximate concentrations of the six chromophores required to create roughly similar levels of color saturation for E⊥c in samples 1 cm thick. Concentrations for the chromophores were selected by visually comparing color circles and forming a consensus opinion among the authors about which circles appeared to have similar saturation levels. Comparing the chromophore concentrations in ppma under each circle emphasizes the rather extreme range in “strength,” which is greater than a factor of 1000.

The belief that yellow sapphires were colored only by iron with or without some undefined “color center” (Schmetzer et al., 1983; Nassau, 1991) was engendered by the fact that the existence of, strength, and absorption spectrum of the h•-Fe3+ chromophore was unknown. Additionally, the analytical techniques available before SIMS and SIMS-calibrated LA-ICP-MS with matrix-matched standards were incapable of measurements down to the ppma level. Another key to our current understanding of chromophores in corundum was the capability of growing synthetic sapphire containing only one of the chromophores we wished to study. This allowed us to confirm what we observed in natural samples.
Determining the absorption cross sections is a powerful technique in the study of color in allochromatic minerals, as their magnitudes provide information on the types of absorbing species present. Applying it to other minerals might yield some new insights. Our current trace element analytical capability, at the ppma level or below, provides the critical capability to support such research.
Ms. Dubinsky is president and head gemologist and jewelry designer at Emily Emmett, Inc. in New York City. Dr. Emmett is director of Crystal Chemistry in Brush Prairie, Washington, and a consultant to GIA. Dr. Stone-Sundberg is a technical advisor on GIA education operations and a technical editor of Gems & Gemology located in Portland, Oregon.
The authors would like express our appreciation to Tom Moses and Ken Scarratt for their long-term support that made this work possible. We would like to acknowledge our many discussions with George Rossman, which helped resolve key technical issues. We greatly appreciate the opportunity to present some of this work in Dick Hughes’ book Ruby & Sapphire: A Gemologist’s Guide as well as his support of this publication. He and Wimon Manorotkul also provided many of the photos of faceted gems. Milan Kokta from the former Union Carbide crystal growth division and Zachary Coles’ team at Scientific Materials Corporation grew many specially doped synthetic sapphire crystals for this work which were key to elucidating our understanding of the individual chromophores. We are very grateful to Yunbin Guan for performing the SIMS measurements and for many discussions on the data. John Trenholme graciously performed a fit to the Sellmeier equation using refractive index data for corundum, which allowed us to correct our cross section spectra for multiple reflection losses from the polished sample surfaces. We would like to thank John S. Harris for supplying the photograph of the visible spectrum that appears at the top of all cross section spectra presented in this article. We would also like to thank Dan Dell for his assistance in producing the composite illustrations using the visible spectrum and cross section spectra, and in preparing final drafts of figures B-1 and B-2.
Beran A., Rossman G.R. (2006) OH in naturally occurring corundum. European Journal of Mineralogy, Vol. 18, No. 4, pp. 441–447, http://dx.doi.org/10.1127/0935-1221/2006/0018-0441
Berns R.S. (2000) Billmeyer and Saltzman’s Principles of Color Technology. John Wiley & Sons, Inc., New York, 272 pp.
El-Aiat M.M., Kröger F.A. (1982) Hydrogen donors in 〈-Al2O3. Journal of Applied Physics, Vol. 53, No. 5, pp. 3658–3667, http://dx.doi.org/10.1063/1.331150
Emmett J.L., Scarratt K., McClure S.F., Moses T., Douthit T.R., Hughes R., Novak S., Shigley J.E., Wang W., Bordelon O., Kane R. (2003) Beryllium diffusion of ruby and sapphire. G&G, Vol. 39, No. 2, pp. 84–135, http://dx.doi.org/10.5741/GEMS.39.2.84
Emmett J.L., Dubinsky E.V., Hughes R.W., Scarratt K. (2017a) Color, spectra & luminescence. In R.W. Hughes, Ed., Ruby & Sapphire: A Gemologist’s Guide. Bangkok, pp. 107–163.
Emmett J.L., Stone-Sundberg J., Guan Y., Sun Z. (2017b) The role of silicon in the color of gem corundum. G&G, Vol. 53, No. 1, pp. 42–47, http://dx.doi.org/10.5741/GEMS.53.1.42
Ferguson J., Fielding P.E. (1971) The origins of the colours of yellow, green and blue sapphires. Chemical Physics Letters, Vol. 10, No. 3, pp. 262–265, http://dx.doi.org/10.1016/0009-2614(71)80282-8
——— (1972) The origins of the colours of natural yellow, blue, and green sapphires. Australian Journal of Chemistry, Vol. 25, No. 7, pp. 1371–1385, http://dx.doi.org/10.1071/CH9721371
Fritsch E., Rossman G.R. (1987) An update on color in gems. Part 1: Introduction and colors caused by dispersed metal ions. G&G, Vol. 23, No. 3, pp. 126–139, http://dx.doi.org/10.5741/GEMS.23.3.126
——— (1988) An update on color in gems. Part 2: Colors involving multiple atoms and color centers. G&G, Vol. 24, No. 1, pp. 3–15, http://dx.doi.org/10.5741/GEMS.24.1.3
Häger T. (2001) High temperature treatment of natural corundum. International Workshop on Material Characterization by Solid State Spectroscopy: The Minerals of Vietnam, pp. 4–10.
Harlow G.E., Bender W. (2013) A study of ruby (corundum) compositions from the Mogok Belt, Myanmar: Searching for chemical fingerprints. American Mineralogist, Vol. 98, No. 7, pp. 1120–1132, http://dx.doi.org/10.2138/am.2013.4388
Henderson B., Bartram R.H. (2000) Crystal-Field Engineering of Solid-State Laser Materials. Cambridge University Press, Cambridge, UK.
Krebs J.J., Maisch W.G. (1971) Exchange effects in the optical-absorption spectrum of Fe3+ in Al2O3. Physical Review B, Vol. 4, No. 3, pp. 757–769, http://dx.doi.org/10.1103/PhysRevB.4.757
Kröger F.A. (1984) Electrical properties of 〈-Al2O3. In W.D. Kingery, Ed., Advances in Ceramics: Structure and Properties of MgO and Al2O3 Ceramics. American Ceramic Society, Columbus, Ohio, pp. 1–15.
Kvapil J., Perner B., Súlovský J., Kvapil J. (1973) Colour centre formation in corundum doped with divalent ions. Kristall und Technik, Vol. 8, No. 1-3, pp. 247–251, http://dx.doi.org/10.1002/crat.19730080125
Li H., Robertson J. (2014) Behaviour of hydrogen in wide band gap oxides. Journal of Applied Physics, Vol. 115, No. 20, p. 203708, http://dx.doi.org/10.1063/1.4878415
MacFarlane R.M. (1964) Optical and magnetic properties of trivalent vanadium complexes. Journal of Chemical Physics, Vol. 40, No. 2, pp. 373–377, http://dx.doi.org/10.1063/1.4755936
Maiman T.H., Hoskins R.H., D’Haenens I.J., Asawa C.K., Evtuhov V. (1961) Stimulated optical emission in fluorescent solids: Spectroscopy and stimulated emission in ruby. Physical Review, Vol. 123, No. 4, pp. 1151–1157, http://dx.doi.org/10.1103/PhysRev.123.1151
Matsunaga K., Nakamura A., Yamamoto T., Ikuhara Y. (2004) Theoretical study of defect structures in pure and titanium-doped alumina. Solid State Ionics, Vol. 172, No. 1-4, pp. 155–158, http://dx.doi.org/10.1016/j.ssi.2004.01.044
Mattson S.M., Rossman G.R. (1988) Fe2+-Ti4+ charge transfer in stoichiometric Fe2+,Ti4+-minerals. Physics and Chemistry of Minerals, Vol. 16, No. 1, pp. 78–82, http://dx.doi.org/10.1007/BF00201333
McClure D.S. (1962) Optical spectra of transition-metal ions in corundum. Journal of Chemical Physics, Vol. 36, No. 10, pp. 2757–2779, http://dx.doi.org/10.1063/1.1732364
Moon A.R., Phillips M.R. (1994) Defect clustering and color in Fe,Ti: 〈-Al2O3. Journal of the American Ceramic Society, Vol. 77, No. 2, pp. 356–357, http://dx.doi.org/10.1111/j.1151-2916.1994.tb07003.x
Nassau K. (1991) The seven types of yellow sapphire and the proposed Ponahlo test. Zeitschrift der Deutschen Gemmologischen Gesellschaft, Vol. 40, No. 4, pp. 247–251.
Norby T. (1989) Hydrogen defects in inorganic solids. In Ø. Johannesen and A.G. Andersen, Eds., Defect Chemistry of Solids. Elsevier Science Publishers B.V., Amsterdam, pp. 101–142, http://dx.doi.org/10.1016/B978-0-444-88534-0.50011-4
Pajot B., Clerjaud B. (2013) Optical Absorption of Impurities and Defects in Semiconducting Crystals: Electronic Absorption of Deep Centres and Vibrational Spectra. Springer-Verlag Berlin Heidelberg, 512 pp.
Powell R.C. (1966) The Interaction of Chromium Ions in Ruby Crystals. Physical Sciences Research Papers No. 299. Air Force Cambridge Research Labs, Hanscom, Massachusetts.
——— (1998) Physics of Solid-State Laser Materials. Springer-Verlag, New York, 423 pp.
Pryce M.H.L., Runciman W.A. (1958) The absorption spectrum of vanadium corundum. Discussions of the Faraday Society, Vol. 26, pp. 34–42, http://dx.doi.org/10.1039/df9582600034
Schmetzer K., Bosshart G., Hänni H.A. (1983) Naturally-coloured and treated yellow and orange-brown sapphires. Journal of Gemmology, Vol. 18, No. 7, pp. 607–622.
Shtepliuk I., Lashkarev G., Khyzhun O., Kowalski B., Reszka A., Khomyak V., Lazorenko V., Timofeeva I. (2011) Enhancement of the ultraviolet luminescence intensity from Cd-doped ZnO films caused by exciton binding. Acta Physica Polonica A, Vol. 120, No. 5, pp. 914–917, http://dx.doi.org/10.12693/APhysPolA.120.914
Stone-Sundberg J., Thomas T., Sun Z., Guan Y., Cole Z., Equall R., Emmett J.L. (2017) Accurate reporting of key trace elements in ruby and sapphire using matrix-matched standards. G&G, Vol. 53, No. 4, pp. 438–451, http://dx.doi.org/10.5741/GEMS.53.4.438
Tatian B. (1984) Fitting refractive-index data with the Sellmeier dispersion formula. Applied Optics, Vol. 23, No. 24, pp. 4477–4485, http://dx.doi.org/10.1364/AO.23.004477
Thomas T., Rossman G.R., Sandstrom M. (2014) Device and method of optically orienting biaxial crystals for sample preparation. Review of Scientific Instruments, Vol. 85, No. 9, p. 093105, http://dx.doi.org/10.1063/1.4894555
Tippins H.H. (1970) Charge-transfer spectra of transition-metal ions in corundum. Physical Review B, Vol. 1, No. 1, pp. 126–135, http://dx.doi.org/10.1103/PhysRevB.1.126
Townsend M.G. (1968) Visible charge transfer band in blue sapphire. Solid State Communications, Vol. 6, No. 2, pp. 81–83, http://dx.doi.org/10.1016/0038-1098(68)90005-7
Zaw K., Sutherland L., Yui T-F., Meffre S., Thu K. (2015) Vanadium-rich ruby and sapphire within Mogok Gemfield, Myanmar: Implications for gem color and genesis. Mineralium Deposita, Vol. 50, No. 1, pp. 25–39, http://dx.doi.org/10.1007/s00126-014-0545-0
Zorenko Y., Zorenko T., Voznyak T. (2011) Luminescence centers in Y3Al5O12:La single crystals. Journal of Physics: Conference Series, Vol. 289, No. 1, p. 012028, http://dx.doi.org/10.1088/1742-6596/289/1/012028
You Might Also Like

Find a Retailer
learn more
Shop the Campus Store
Learn More
Subscribe to Knowledge Rocks Emails
Learn More